FORMULATION AND EVALUATION OF FAST DISSOLVING SUBLINGUAL LISINOPRIL TABLETS
19
Page IAJPS, 2014, Volume1, Issue (3), 182-195 Narasimhulu et al ISSN 2349-7750 ISSN 2349-7750 INDO AMERICAN JOURNAL OF INDO AMERICAN JOURNAL OF PHARMACEUTICAL SCIENCES PHARMACEUTICAL SCIENCES Available online at: http://www.iajps.com Research Article FORMULATION AND EVALUATION OF FAST DISSOLVING SUBLINGUAL LISINOPRIL TABLETS Narasimhulu.Kurra*,Chandrasekhara Rao Baru, Dr. Vanitha Prakash.K Department of Pharmaceutics, SSJ College of Pharmacy, V N Pally, Near Gandipet, RR Dist, Telangana-500075 ABSTRACT: The present study was carried out to develop the Lisinopril sublingual tablets Lisinopril were available in 5 & 10 mg. In the present study 10 mg strength were prepared and evaluated for all the physical parameters evaluation and in-vitro drug dissolution studies. In the innovator preparation, Sodium Bicarbonate and Sodium Carbonate were used and the restriction was laid to the use of both the buffers. So, the generic version was prepared by using single buffer sodium carbonate. Sublingual Tablets of this drug is very essential to overcome the lack of compliance associated with higher dose of conventional oral swallowing tablets and also to protect the drug degradation from hepatic metabolism which can result in undesired pharmacological action. In vitro dissolution was carried out by using USP Apparatus Type-II at 75 rpm, using 6.8 pH phosphate buffer as dissolution medium recommended by office of generic drugs (OGD). The effect of diluents and superdisintegrants on the disintegration time and content uniformity was clearly studied in this research. Special emphasis was laid on the pH of the tablet as restriction was laid in using both the buffer systems. These sublingual tablets are used for treatment of insomnia. Sublingual tablets are developed because of their ease of administration and particularly insomniac patients will find great use of these sublingual tablets. KEY WORDS: Lisinopril,Sublingual,Insomnia Corresponding Author ww
-
Upload
nagajunauniversity -
Category
Documents
-
view
2 -
download
0
Transcript of FORMULATION AND EVALUATION OF FAST DISSOLVING SUBLINGUAL LISINOPRIL TABLETS

Page
IAJPS, 2014, Volume1, Issue (3), 182-195 Narasimhulu et al ISSN 2349-7750
ISSN 2349-7750
INDO AMERICAN JOURNAL OF INDO AMERICAN JOURNAL OF
PHARMACEUTICAL SCIENCESPHARMACEUTICAL SCIENCES
Available online at: http://www.iajps.com Research Article
FORMULATION AND EVALUATION OF FAST DISSOLVINGSUBLINGUAL LISINOPRIL TABLETS
Narasimhulu.Kurra*,Chandrasekhara Rao Baru, Dr.Vanitha Prakash.K
Department of Pharmaceutics, SSJ College of Pharmacy, V NPally, Near Gandipet, RR Dist, Telangana-500075
ABSTRACT:The present study was carried out to develop the Lisinopril sublingual tablets Lisinopril were availablein 5 & 10 mg. In the present study 10 mg strength were prepared and evaluated for all the physicalparameters evaluation and in-vitro drug dissolution studies. In the innovator preparation, SodiumBicarbonate and Sodium Carbonate were used and the restriction was laid to the use of both thebuffers. So, the generic version was prepared by using single buffer sodium carbonate. SublingualTablets of this drug is very essential to overcome the lack of compliance associated with higher doseof conventional oral swallowing tablets and also to protect the drug degradation from hepaticmetabolism which can result in undesired pharmacological action. In vitro dissolution was carriedout by using USP Apparatus Type-II at 75 rpm, using 6.8 pH phosphate buffer as dissolution mediumrecommended by office of generic drugs (OGD). The effect of diluents and superdisintegrants on thedisintegration time and content uniformity was clearly studied in this research. Special emphasis waslaid on the pH of the tablet as restriction was laid in using both the buffer systems. These sublingual tablets are used for treatment of insomnia. Sublingual tablets are developedbecause of their ease of administration and particularly insomniac patients will find great use ofthese sublingual tablets.
KEY WORDS: Lisinopril,Sublingual,Insomnia
Corresponding Author
ww
Page
IAJPS, 2014, Volume1, Issue (3), 182-195 Narasimhulu et al ISSN 2349-7750
Chandrasekhara Rao [email protected]
INTRODUCTIONSublingual route (SR), faster thanother routes except parenteralroute, ensures that substance willdegrade only by salivary enzymesbefore entering bloodstream,whereas orally administered drugsmust survive through harshenvironment of gastrointestinaltract (GIT). Lisinopril (1-[N2-{(S)-1-carboxy-3-phenylpropyl}-L-lysil]-L-proline dihydrate), anangiotensin-converting enzyme(ACE) inhibitor, is used intreatment of hypertension, whichis caused by obesity, stress,decreased physical activity,increased salt intake anddecreased calcium & potassiumintake[1]. Lisinopril is very lessbio available (25-30%) [2,3], dueto incompletely absorption fromGIT and first pass metabolism. SRoffers fast disintegration oftablet, faster onset of action andrapid absorption by sublingualmucosa blood vessels [4,5]. Amongdifferent techniques (freezedrying technology[6,7], spraydrying method, sublimationtechnology[8] and directcompression method [9] used for
formulating sublingual tablets(STs), direct compression methoddoes not require water or heatduring formulation and is an idealmethod. Excipients (superdisintegrants) and spray driedform of excipients promote rapiddisintegration and dissolution oftablet, giving faster onset ofaction. This study presentsformulation and evaluation of STsof lisinopril for treatment ofhypertensionEXPERIMENTAL SECTION
MaterialsLisinopril was obtained as a giftsample from Ranbaxy Pvt Ltd,Gurgaon, India. Pharmaburst®500,Ac-Di-Sol (Croscarmellose Sodium),Pearlitol (Mannitol) grades,Avicel pH101, L-HPC,DCP (Dicalciumphosphate) anhydrous, Na starchglycolate (SSG), Magnesium (Mg)stearate and talcum powder wereobtained from Central drug house(CDH), New Delhi, India, andAspartame was obtained fromHimedia. All other chemicals usedwere of analytical grade, procuredfrom standard sources.MethodsStrategy I The first strategy was to developa formulation based on innovatorcomposition. Pharmaburst is usedas diluent in innovator
ww
Page
IAJPS, 2014, Volume1, Issue (3), 182-195 Narasimhulu et al ISSN 2349-7750
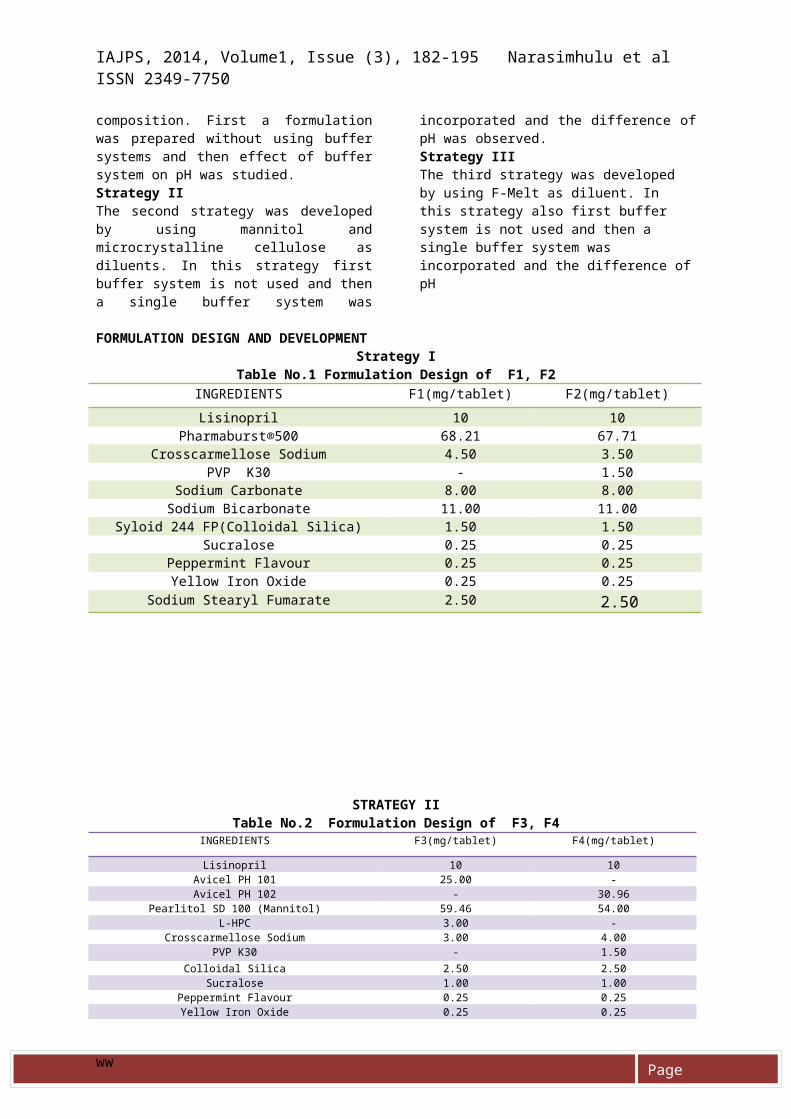
composition. First a formulationwas prepared without using buffersystems and then effect of buffersystem on pH was studied.Strategy IIThe second strategy was developedby using mannitol andmicrocrystalline cellulose asdiluents. In this strategy firstbuffer system is not used and thena single buffer system was
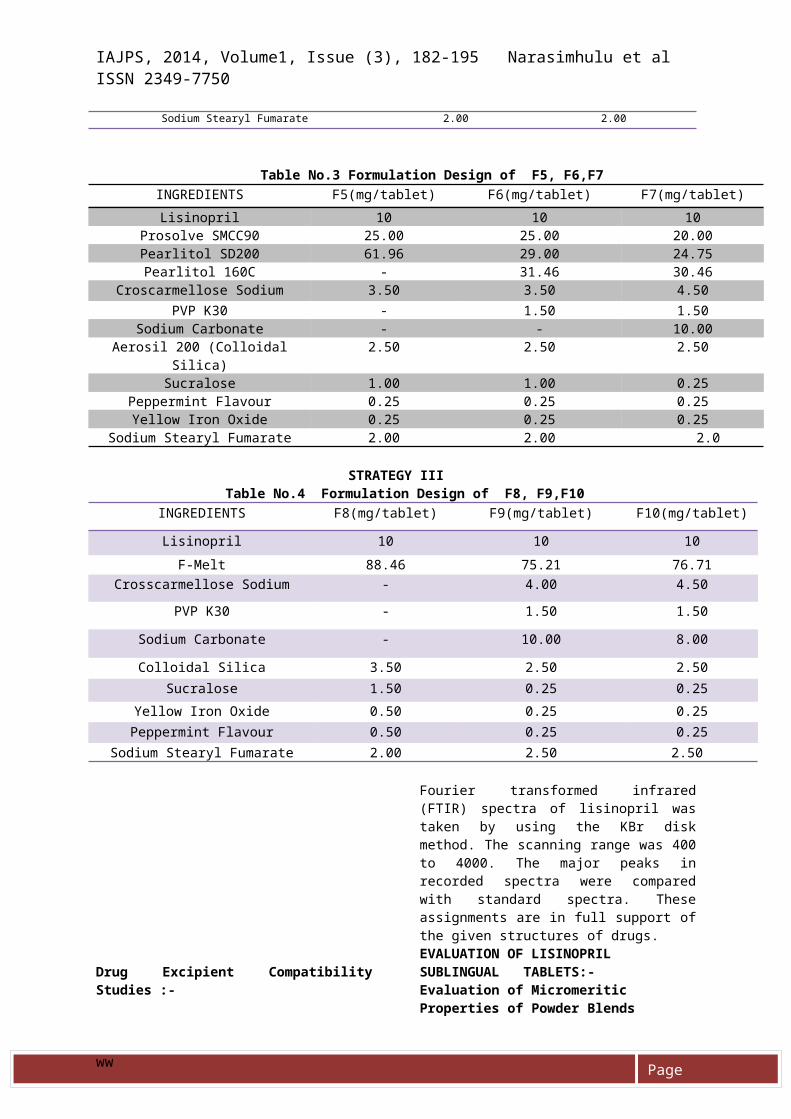
incorporated and the difference ofpH was observed.Strategy IIIThe third strategy was developed by using F-Melt as diluent. In this strategy also first buffer system is not used and then a single buffer system was incorporated and the difference ofpH
FORMULATION DESIGN AND DEVELOPMENTStrategy I
Table No.1 Formulation Design of F1, F2INGREDIENTS F1(mg/tablet) F2(mg/tablet)Lisinopril 10 10
Pharmaburst®500 68.21 67.71Crosscarmellose Sodium 4.50 3.50
PVP K30 - 1.50Sodium Carbonate 8.00 8.00Sodium Bicarbonate 11.00 11.00
Syloid 244 FP(Colloidal Silica) 1.50 1.50Sucralose 0.25 0.25
Peppermint Flavour 0.25 0.25Yellow Iron Oxide 0.25 0.25
Sodium Stearyl Fumarate 2.50 2.50
STRATEGY IITable No.2 Formulation Design of F3, F4
INGREDIENTS F3(mg/tablet) F4(mg/tablet)
Lisinopril 10 10Avicel PH 101 25.00 -Avicel PH 102 - 30.96
Pearlitol SD 100 (Mannitol) 59.46 54.00L-HPC 3.00 -
Crosscarmellose Sodium 3.00 4.00PVP K30 - 1.50
Colloidal Silica 2.50 2.50Sucralose 1.00 1.00
Peppermint Flavour 0.25 0.25Yellow Iron Oxide 0.25 0.25
ww
Page
IAJPS, 2014, Volume1, Issue (3), 182-195 Narasimhulu et al ISSN 2349-7750
Sodium Stearyl Fumarate 2.00 2.00
Table No.3 Formulation Design of F5, F6,F7INGREDIENTS F5(mg/tablet) F6(mg/tablet) F7(mg/tablet)Lisinopril 10 10 10
Prosolve SMCC90 25.00 25.00 20.00Pearlitol SD200 61.96 29.00 24.75Pearlitol 160C - 31.46 30.46
Croscarmellose Sodium 3.50 3.50 4.50PVP K30 - 1.50 1.50
Sodium Carbonate - - 10.00Aerosil 200 (Colloidal
Silica)2.50 2.50 2.50
Sucralose 1.00 1.00 0.25Peppermint Flavour 0.25 0.25 0.25Yellow Iron Oxide 0.25 0.25 0.25
Sodium Stearyl Fumarate 2.00 2.00 2.0
STRATEGY IIITable No.4 Formulation Design of F8, F9,F10
INGREDIENTS F8(mg/tablet) F9(mg/tablet) F10(mg/tablet)
Lisinopril 10 10 10F-Melt 88.46 75.21 76.71
Crosscarmellose Sodium - 4.00 4.50PVP K30 - 1.50 1.50
Sodium Carbonate - 10.00 8.00
Colloidal Silica 3.50 2.50 2.50Sucralose 1.50 0.25 0.25
Yellow Iron Oxide 0.50 0.25 0.25Peppermint Flavour 0.50 0.25 0.25
Sodium Stearyl Fumarate 2.00 2.50 2.50
Drug Excipient CompatibilityStudies :-
Fourier transformed infrared(FTIR) spectra of lisinopril wastaken by using the KBr diskmethod. The scanning range was 400to 4000. The major peaks inrecorded spectra were comparedwith standard spectra. Theseassignments are in full support ofthe given structures of drugs.EVALUATION OF LISINOPRIL SUBLINGUAL TABLETS:-Evaluation of Micromeritic Properties of Powder Blends
ww
Page
IAJPS, 2014, Volume1, Issue (3), 182-195 Narasimhulu et al ISSN 2349-7750
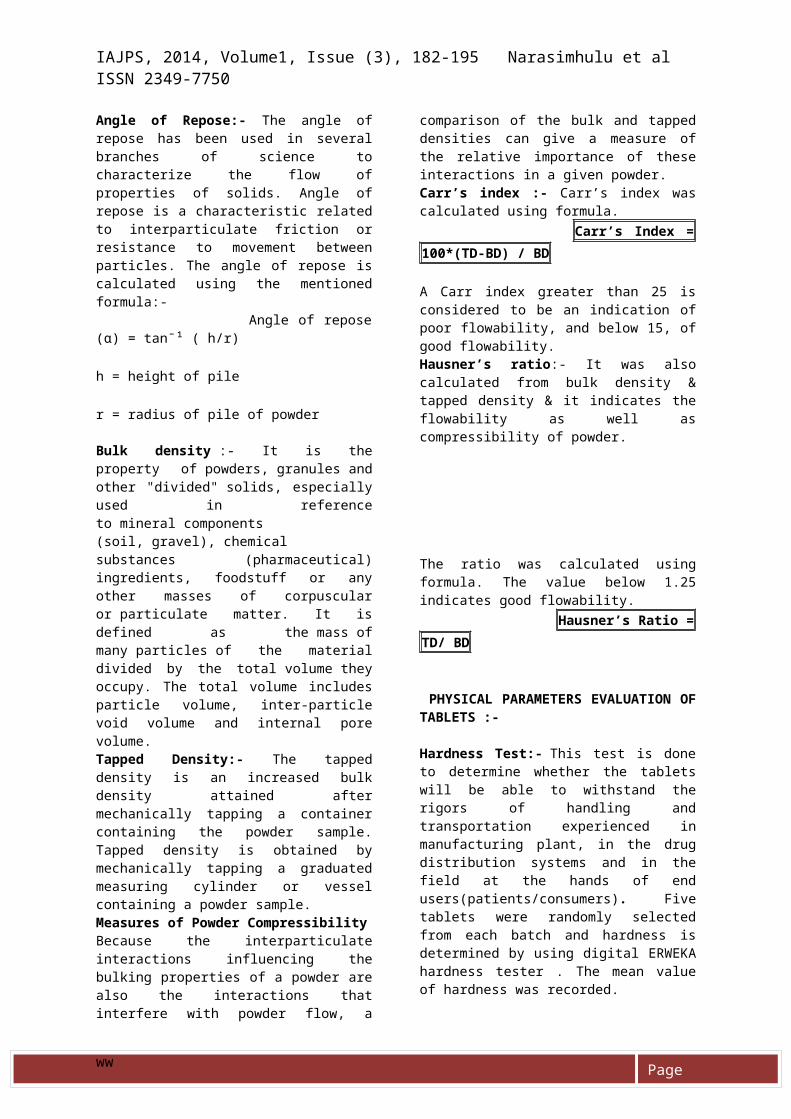
Angle of Repose:- The angle ofrepose has been used in severalbranches of science tocharacterize the flow ofproperties of solids. Angle ofrepose is a characteristic relatedto interparticulate friction orresistance to movement betweenparticles. The angle of repose iscalculated using the mentionedformula:- Angle of repose(α) = tanˉ¹ ( h/r) h = height of pile r = radius of pile of powder
Bulk density :- It is theproperty of powders, granules andother "divided" solids, especiallyused in referenceto mineral components(soil, gravel), chemicalsubstances (pharmaceutical)ingredients, foodstuff or anyother masses of corpuscularor particulate matter. It isdefined as the mass ofmany particles of the materialdivided by the total volume theyoccupy. The total volume includesparticle volume, inter-particlevoid volume and internal porevolume.Tapped Density:- The tappeddensity is an increased bulkdensity attained aftermechanically tapping a containercontaining the powder sample.Tapped density is obtained bymechanically tapping a graduatedmeasuring cylinder or vesselcontaining a powder sample. Measures of Powder CompressibilityBecause the interparticulateinteractions influencing thebulking properties of a powder arealso the interactions thatinterfere with powder flow, a
comparison of the bulk and tappeddensities can give a measure ofthe relative importance of theseinteractions in a given powder. Carr’s index :- Carr’s index wascalculated using formula. Carr’s Index =100*(TD-BD) / BD
A Carr index greater than 25 isconsidered to be an indication ofpoor flowability, and below 15, ofgood flowability.Hausner’s ratio:- It was alsocalculated from bulk density &tapped density & it indicates theflowability as well ascompressibility of powder.
The ratio was calculated usingformula. The value below 1.25indicates good flowability. Hausner’s Ratio =TD/ BD
PHYSICAL PARAMETERS EVALUATION OFTABLETS :-
Hardness Test:- This test is doneto determine whether the tabletswill be able to withstand therigors of handling andtransportation experienced inmanufacturing plant, in the drugdistribution systems and in thefield at the hands of endusers(patients/consumers). Fivetablets were randomly selectedfrom each batch and hardness isdetermined by using digital ERWEKAhardness tester . The mean valueof hardness was recorded.
ww
Page
IAJPS, 2014, Volume1, Issue (3), 182-195 Narasimhulu et al ISSN 2349-7750
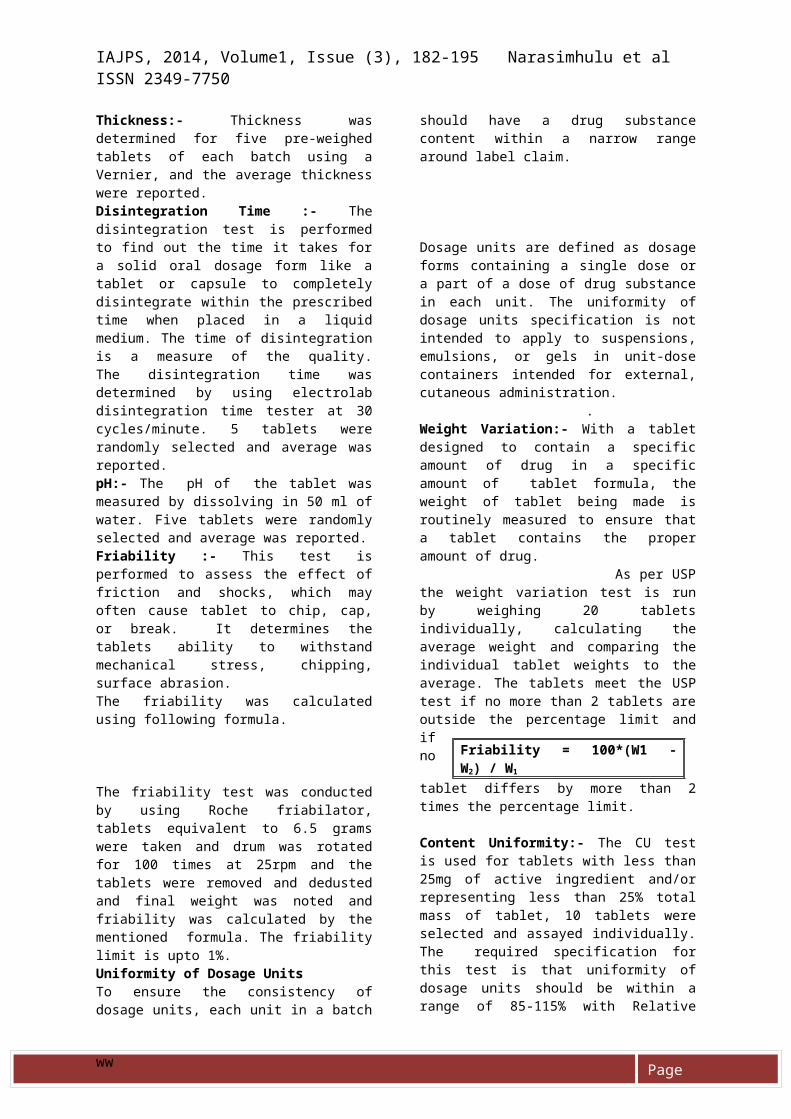
Thickness:- Thickness wasdetermined for five pre-weighedtablets of each batch using aVernier, and the average thicknesswere reported.Disintegration Time :- Thedisintegration test is performedto find out the time it takes fora solid oral dosage form like atablet or capsule to completelydisintegrate within the prescribedtime when placed in a liquidmedium. The time of disintegrationis a measure of the quality.The disintegration time wasdetermined by using electrolabdisintegration time tester at 30cycles/minute. 5 tablets wererandomly selected and average wasreported.pH:- The pH of the tablet wasmeasured by dissolving in 50 ml ofwater. Five tablets were randomlyselected and average was reported.Friability :- This test isperformed to assess the effect offriction and shocks, which mayoften cause tablet to chip, cap,or break. It determines thetablets ability to withstandmechanical stress, chipping,surface abrasion.The friability was calculatedusing following formula.
The friability test was conductedby using Roche friabilator,tablets equivalent to 6.5 gramswere taken and drum was rotatedfor 100 times at 25rpm and thetablets were removed and dedustedand final weight was noted andfriability was calculated by thementioned formula. The friabilitylimit is upto 1%.Uniformity of Dosage UnitsTo ensure the consistency ofdosage units, each unit in a batch
should have a drug substancecontent within a narrow rangearound label claim.
Dosage units are defined as dosageforms containing a single dose ora part of a dose of drug substancein each unit. The uniformity ofdosage units specification is notintended to apply to suspensions,emulsions, or gels in unit-dosecontainers intended for external,cutaneous administration. .Weight Variation:- With a tabletdesigned to contain a specificamount of drug in a specificamount of tablet formula, theweight of tablet being made isroutinely measured to ensure thata tablet contains the properamount of drug. As per USPthe weight variation test is runby weighing 20 tabletsindividually, calculating theaverage weight and comparing theindividual tablet weights to theaverage. The tablets meet the USPtest if no more than 2 tablets areoutside the percentage limit andifno
tablet differs by more than 2times the percentage limit.
Content Uniformity:- The CU testis used for tablets with less than25mg of active ingredient and/orrepresenting less than 25% totalmass of tablet, 10 tablets wereselected and assayed individually.The required specification forthis test is that uniformity ofdosage units should be within arange of 85-115% with Relative
ww
Friability = 100*(W1 -W2) / W1
Page
IAJPS, 2014, Volume1, Issue (3), 182-195 Narasimhulu et al ISSN 2349-7750
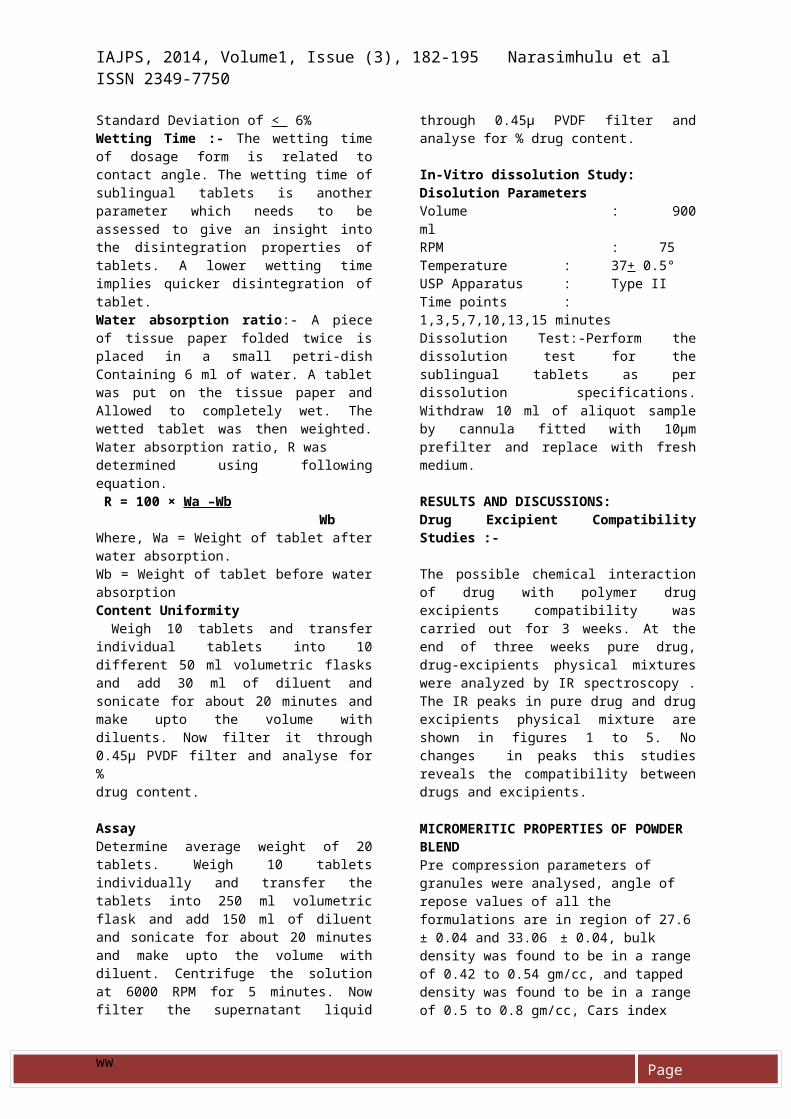
Standard Deviation of < 6%Wetting Time :- The wetting timeof dosage form is related tocontact angle. The wetting time ofsublingual tablets is anotherparameter which needs to beassessed to give an insight intothe disintegration properties oftablets. A lower wetting timeimplies quicker disintegration oftablet.Water absorption ratio:- A pieceof tissue paper folded twice isplaced in a small petri-dishContaining 6 ml of water. A tabletwas put on the tissue paper andAllowed to completely wet. Thewetted tablet was then weighted.Water absorption ratio, R was determined using followingequation. R = 100 × Wa –Wb WbWhere, Wa = Weight of tablet afterwater absorption.Wb = Weight of tablet before waterabsorptionContent Uniformity Weigh 10 tablets and transferindividual tablets into 10different 50 ml volumetric flasksand add 30 ml of diluent andsonicate for about 20 minutes andmake upto the volume withdiluents. Now filter it through0.45µ PVDF filter and analyse for% drug content.
Assay Determine average weight of 20tablets. Weigh 10 tabletsindividually and transfer thetablets into 250 ml volumetricflask and add 150 ml of diluentand sonicate for about 20 minutesand make upto the volume withdiluent. Centrifuge the solutionat 6000 RPM for 5 minutes. Nowfilter the supernatant liquid
through 0.45µ PVDF filter andanalyse for % drug content.
In-Vitro dissolution Study: Disolution Parameters Volume : 900mlRPM : 75Temperature : 37+ 0.5°USP Apparatus : Type IITime points :1,3,5,7,10,13,15 minutesDissolution Test:-Perform thedissolution test for thesublingual tablets as perdissolution specifications.Withdraw 10 ml of aliquot sampleby cannula fitted with 10µmprefilter and replace with freshmedium.
RESULTS AND DISCUSSIONS:Drug Excipient CompatibilityStudies :-
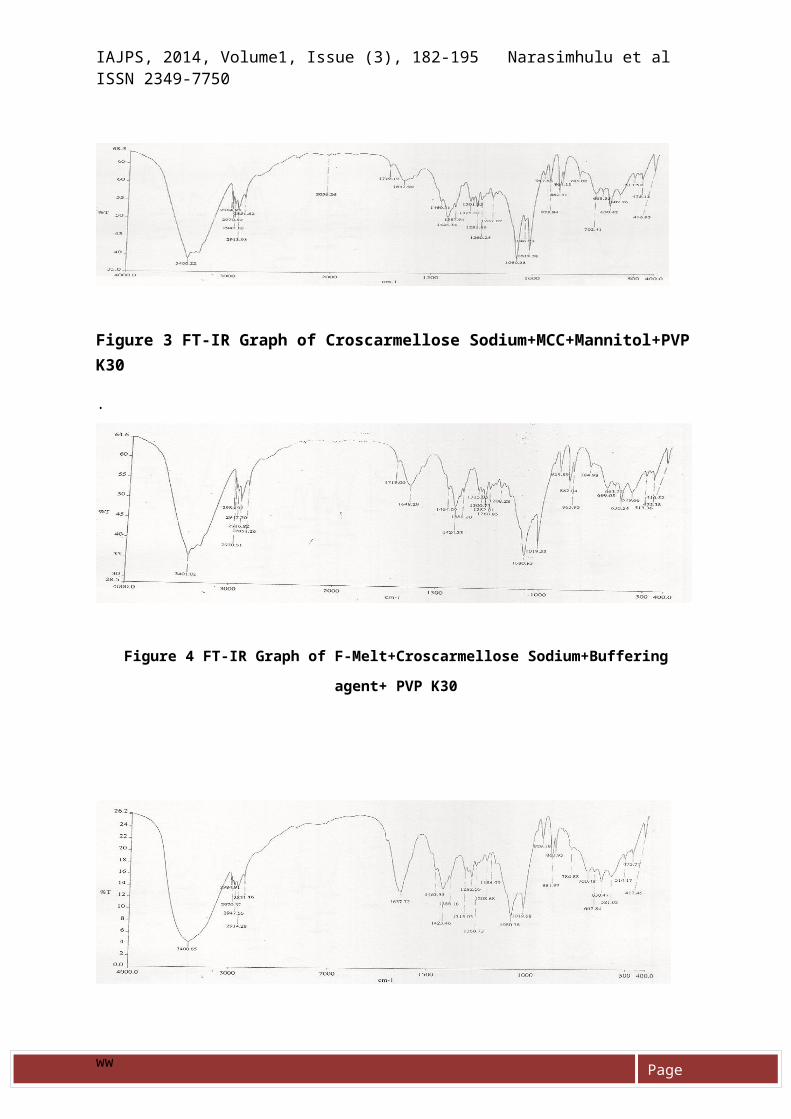
The possible chemical interactionof drug with polymer drugexcipients compatibility wascarried out for 3 weeks. At theend of three weeks pure drug,drug-excipients physical mixtureswere analyzed by IR spectroscopy .The IR peaks in pure drug and drugexcipients physical mixture areshown in figures 1 to 5. Nochanges in peaks this studiesreveals the compatibility betweendrugs and excipients.
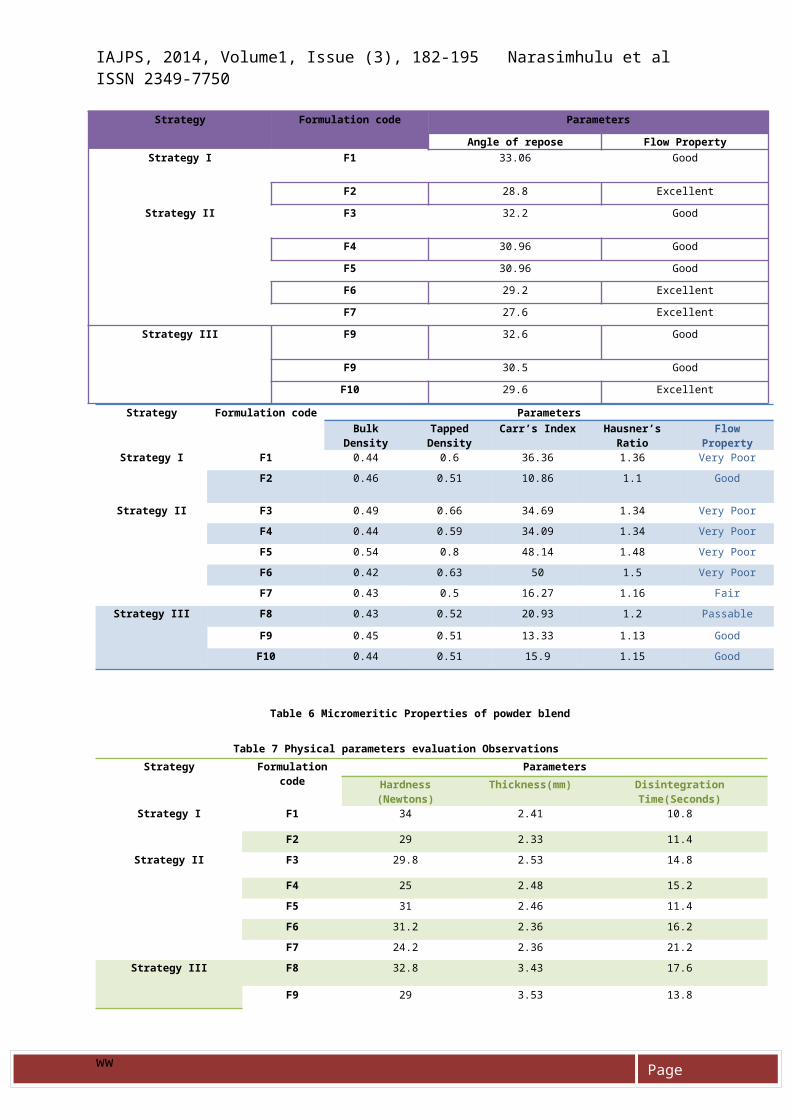
MICROMERITIC PROPERTIES OF POWDER BLENDPre compression parameters of granules were analysed, angle of repose values of all the formulations are in region of 27.6± 0.04 and 33.06 ± 0.04, bulk density was found to be in a rangeof 0.42 to 0.54 gm/cc, and tapped density was found to be in a rangeof 0.5 to 0.8 gm/cc, Cars index
ww

Page
IAJPS, 2014, Volume1, Issue (3), 182-195 Narasimhulu et al ISSN 2349-7750
was found to be 10.86 to 50 , Hausner Ratio from1.1 to 1.5 % andThus all the formulations were found to suitable for compression as tablets given in table 5 & 6 respectively.
PHYSICAL PARAMETERSThe lisinopril sublingual tabletformulations were subject tovarious post-compressiveevaluation tests, such ashardness, thickness,disintegration time, friability,pH, wetting time water absorptionratio, weight variation,contentuniformity, assay and Invitro drugdissolution release comparisons asfollowed for all the formulationswere shown in Tables 7 to 15.IN-VITRO DISSOLUTION STUDY:Strategy I:-The first strategy wasto develop a formulation based oninnovator composition. The directcompression technique formulation(F2) resulted in segregation andfinally led to poor contentuniformity, assay on lower side,poor flowability as carr’s indexwas 36.36, so the wet granulationis preferred.The wet granulation techniqueformulation (F2) ultimately led toformulation that has met all therequirements needed for asublingual formulation. ThePhysical parameters were found tobe within the limits and in-vitrodrug release, assay values arealso within the limits. Finallybetter content uniformity wasachieved with the wet granulationtechnique. Now this formulation(F2) is taken as reference trialfor developing the generic versionavoiding all the patent issues.The Dissolution Studies are alsosatisfactory for the innovatortrials.
Strategy II:-The second strategywas developed by using thecombination of MicrocrystallineCellulose & Mannitol. In thisstrategy, the formulation F3 wasdeveloped by direct compression byusing Avicel pH 101 & PearlitolSD100 along withsuperdisintegrants combination ofcroscarmellose sodium and lowsubstituted hydroxypropylcellulose. Even the formulationhas content uniformity the assaywas found on the lower side, poorflowability and higherdisintegration time. So, the nextplan was to shift for wetgranulation formulation (F4).The wet granulation formulation(F4) resulted in good contentuniformity, assay values are inlimits, but has poor flowabilityand also slightly higherdisintegration time that is not adesired character for developingthe generic version of innovatorformulation as innovatorformulation has disintegrationtime of less than 12 seconds. The next formulation was developedby direct compression, this timeby eliminating low substitutedhydroxyl propyl cellulose and thediluents used are the combinationsof Pearlitol SD200 and ProsolveSMCC 90 (Silcified MCC). Thisformulation (F5) resulted in poorflowability, assay was found to beon lower side and also poorcontent uniformity.The above formulation design waschanged to wet granulation and newformulation (F6) was developed. Inthis formulation, the diluentscombinations are pearlitol 160Cand pearlitol SD200 along withsilicified MCC (Prosolve SMCC90).This formulation although hasgood content uniformity and assayvalue within the limit, but has
ww

Page
IAJPS, 2014, Volume1, Issue (3), 182-195 Narasimhulu et al ISSN 2349-7750
poor flowability and also slightlyhigher disintegration time.A new formulation(F7) was designedby incorporating Sodiumbicarbonate (as single buffersystem) to the above formulationand evaluated for all theparameters. The flowability wasimproved but the disintegrationtime was increased which is not adesired character for developingthe generic version for theinnovator drug. All theformulations have satisfactorydrug release within 30 minutes ofdissolution studies.Strategy III :-The next strategywas developed by using F-melt asdiluent to improve the flowabilityand maintaining the contentuniformity. The F8 formulation was developedby direct compression andevaluated for the physicalparameters and it was found thatthe flow property was improved butthe content uniformity was notgood, so wet granulation waspreferred and new formulation wasdesigned. The F9 formulation was made by wetgranulation technique andevaluated for physical parametersand the flow property was improvedalong with content uniformity, buthas slightly higher disintegrationtime, so the next formulation wasdesigned in such a way thatdisintegration time has to beimproved by increasing thesuperdisintegrtant concentrationand final reproducible batch was
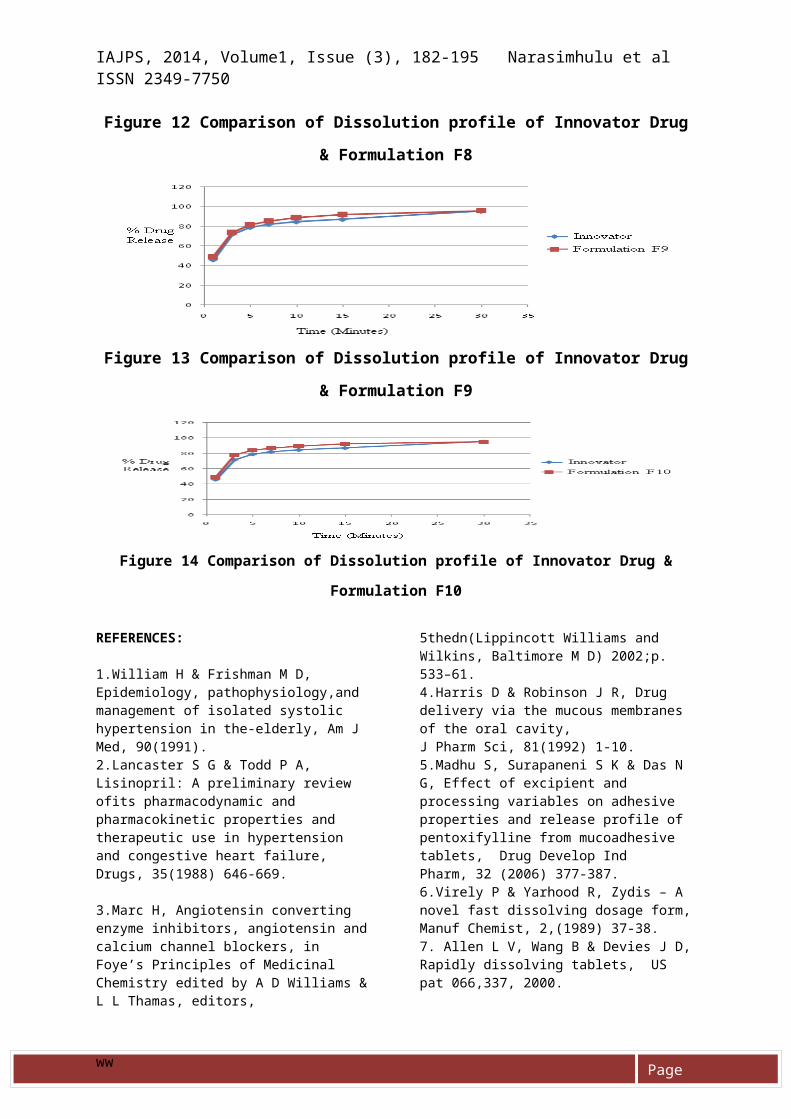
taken and evaluated for all thephysical parameters, assay andcontent uniformity.The final reproducible batch (F10)was found to have good flowproperties, content uniformity andassay was found to be withinlimits. The dissolution studiesalso correlated with that of theinnovator drug shown in table 16and figures 6-16.
CONCLUSION: The innovator sublingual
tablets of 10mg strength wassuccessfully prepared by usingsingle buffer system containingSodium Carbonate. The finaloptimized formulation F10 wasevaluated for all physicalparameters and in-vitro drugrelease. The optimized formula F10is the best competitive genericversion for the Innovatorformulation. All the physicalevaluation parameters and in-vitrodrug release patterns are found tocompete with that of the innovatorpreparation and also fasterdisintegration time was achievedwith the optimized formula thatcompetes with the innovatorformulation.
Table 5 Micromeritic Properties of powder blend
ww
Page
IAJPS, 2014, Volume1, Issue (3), 182-195 Narasimhulu et al ISSN 2349-7750
Strategy Formulation code Parameters
Angle of repose Flow PropertyStrategy I F1 33.06 Good
F2 28.8 Excellent
Strategy II F3 32.2 Good
F4 30.96 Good
F5 30.96 Good
F6 29.2 Excellent
F7 27.6 Excellent
Strategy III F9 32.6 Good
F9 30.5 Good
F10 29.6 Excellent
Strategy Formulation code ParametersBulk
DensityTappedDensity
Carr’s Index Hausner’sRatio
FlowProperty
Strategy I F1 0.44 0.6 36.36 1.36 Very PoorF2 0.46 0.51 10.86 1.1 Good
Strategy II F3 0.49 0.66 34.69 1.34 Very PoorF4 0.44 0.59 34.09 1.34 Very PoorF5 0.54 0.8 48.14 1.48 Very PoorF6 0.42 0.63 50 1.5 Very PoorF7 0.43 0.5 16.27 1.16 Fair
Strategy III F8 0.43 0.52 20.93 1.2 Passable
F9 0.45 0.51 13.33 1.13 GoodF10 0.44 0.51 15.9 1.15 Good
Table 6 Micromeritic Properties of powder blend
Table 7 Physical parameters evaluation ObservationsStrategy Formulation
codeParameters
Hardness(Newtons)
Thickness(mm) DisintegrationTime(Seconds)
Strategy I F1 34 2.41 10.8
F2 29 2.33 11.4Strategy II F3 29.8 2.53 14.8
F4 25 2.48 15.2F5 31 2.46 11.4F6 31.2 2.36 16.2F7 24.2 2.36 21.2
Strategy III F8 32.8 3.43 17.6
F9 29 3.53 13.8
ww

Page
IAJPS, 2014, Volume1, Issue (3), 182-195 Narasimhulu et al ISSN 2349-7750
F10 24.6 2.42 12.3
Table 8 Physical parameters evaluation Observations
Strategy Formulation code ParametersFriability(%) pH Wetting Time
(seconds)Strategy I F1 0.11 6.70 11.6
F2 0.09 10.38 50.8
Strategy II F3 0.21 6.77 35.8F4 0.13 6.63 46F5 0.25 6.58 20.2F6 0.19 6.78 37.4F7 0.29 10.68 35.4
Strategy III F8 0.1 6.02 34.2
F9 0.17 10.34 54.2F10 0.1 10.31 51.6
Table 9 Water Absorption Ratio ObservationsStrategy Formulation
codeParameters
Initialweight(mg)
Final weight(mg) Water absorptionratio
Strategy I F1 101.91 178.28 74.93
F2 102.74 162.06 57.7Strategy II F3 101.50 181.23 78.55
F4 101.65 175.45 72.60F5 102.50 167.34 82.77F6 101.81 199.96 96.40F7 101.34 189.34 86.83
Strategy III F9 101.56 182.06 79.26
F9 102.80 137.34 33.59F10 102.13 165.83 62.37
Table 10 Weight variation Observations
Strategy Formulationcode
AverageWeight of20 Tablets
Minimum
Weight(mg)
%Difference
to theaverage
Maximum
Weight(mg)
% Differenceto theaverage
Strategy I F1 100.73 98.89 -1.82 102.12 +1.37
F2 100.76 98.37 -2.37 102.56 +1.78Strategy II F3 100.75 98.27 -2.46 102.76 +2.76
F4 100.80 98.23 -2.54 102.66 +1.84
ww

Page
IAJPS, 2014, Volume1, Issue (3), 182-195 Narasimhulu et al ISSN 2349-7750
F5 100.99 98.21 -2.75 102.86 +1.85F6 100.94 98.31 -2.6 102.96 +2.0F7 101.03 98.29 -2.71 102.89 +1.84
Strategy III F8 100.97 98.19 -2.7 102.99 +2.00
F9 100.97 98.59 -2.35 102.96 +2.96F10 101.09 98.22 -2.83 102.93 +1.82
Strategy ITable 11 Content Uniformity of Formulation Trials F1 & F2
Sr.No. F1 F2mg/tablet % drug content mg/tablet % drug content
1 9.60 87.4 9.55 101.42 9.7 87.7 9.23 92.33 8.98 85.1 9.57 102.04 9.08 88.0 9.64 104.05 8.88 82.3 9.19 91.16 9.06 87.4 9.40 97.17 8.94 84.0 9.24 92.68 9.96 84.6 9.36 96.09 9.07 87.7 9.58 102.310 8.99 85.4 9.23 92.3
Minimum 8.88 82.3 9.19 91.1Maximum 9.08 88.0 9.64 104.0AVERAGE 9.00 86.0 9.39 98.5%RSD - 2.27 - 5.09
Strategy II :-
Table 12 Content Uniformity of Formulation Trials F3 & F4Sr. No. F3 F4
mg/tablet % drug content mg/tablet % drug content1 9.06 87.4 9.64 104.02 9.47 99.1 9.47 99.13 8.98 85.1 9.63 103.74 9.58 102.2 9.47 99.15 9.28 93.7 9.42 97.76 9.36 96.0 9.57 102.07 8.94 84.0 9.62 103.48 8.96 84.6 9.55 101.49 9.37 96.2 9.57 102.010 8.99 85.4 9.62 103.4
Minimum 8.94 84.0 9.42 97.7Maximum 9.58 102.2 9.64 104.0AVERAGE 9.19 91.3 9.55 101.58%RSD - 7.07 - 2.19
Table 13 Content Uniformity of Formulation Trials F5 to F7
Sr.No. F5 F6 F7mg/tablet % drug mg/tablet % drug mg/tablet % drug
ww

Page
IAJPS, 2014, Volume1, Issue (3), 182-195 Narasimhulu et al ISSN 2349-7750
content content content1 8.62 74.9 9.66 104.6 9.70 105.72 8.94 84 9.66 104.6 9.55 101.43 9.17 90.6 9.51 100.3 9.64 104.04 9.01 86 9.47 99.1 9.57 102.05 8.80 80 9.53 100.9 9.61 103.16 8.46 70.3 9.50 100 9.75 107.17 9.03 86.6 9.34 95.4 9.61 103.18 8.62 74.9 9.39 96.9 9.56 101.79 8.54 72.6 9.53 100.9 9.55 101.410 8.64 75.4 9.47 99.1 9.56 101.7
Minimum 8.46 70.3 9.34 95.4 9.55 101.4Maximum 9.17 90.6 9.66 104.6 9.75 107.1AVERAGE 8.78 79.5 9.506 100.18 9.61 103.1%RSD - 8.66 - 2.90 - 1.89
Strategy III :-
Table 14 Content Uniformity of Formulation Trials F8 to F10
Sr.No. F8 F9 F10mg/tablet % drug
contentmg/tablet % drug
contentmg/tablet % drug
content1 9.34 95.4 9.43 98.0 9.33 95.12 9.45 98.6 9.25 92.9 9.39 96.93 9.31 94.6 9.34 95.4 9.31 94.64 9.30 94.3 9.48 99.4 9.34 95.45 9.25 92.9 8.76 78.9 9.33 95.16 9.29 94.0 9.45 98.6 9.37 96.37 9.35 95.7 9.49 99.7 9.38 96.68 9.24 92.6 9.47 99.1 9.35 95.79 9.27 93.4 9.40 97.1 9.35 95.710 9.30 94.3 9.35 95.7 9.24 92.6
Minimum 9.24 92.6 8.76 78.9 9.24 92.6Maximum 9.45 98.6 9.49 99.7 9.39 96.9AVERAGE 9.31 94.58 9.34 98.5 9.33 95.4%RSD - 1.82 - 6.49 - 1.27
Table 15 Assay Results
STRATEGY FORMULATION CODE ASSAY (%)Strategy I F1 86.3
F2 98.6StrategyII F3 94.3
F4 90.9F5 76.6F6 98.3F7 103
Strategy III F8 86.9F9 97.7F10 100.1
Table 16 Dissolution Results
ww

Page
IAJPS, 2014, Volume1, Issue (3), 182-195 Narasimhulu et al ISSN 2349-7750
Strategy Formulationcode
% Drug Release With Time(Minutes)1 3 5 7 10 15 30
Strategy I F1 57.4 66.8 71.7 74.2 77.5 80 82.9F2 45.7 71.6 78.8 81.9 84.5 87 95.4
Strategy II F3 51.1 66.3 81.1 85.2 88.7 90.4 94.3F4 26.7 51.6 67.5 74.3 81.9 86.7 92.3F5 59.9 69.4 73.6 75.1 77.3 79.4 81.9F6 64.7 87.8 91.4 92.8 94 95.3 96.9F7 51.6 60.4 70.3 77.6 84.2 89.8 93.1
Strategy III F8 81.2 86 86.6 89.6 91.3 92.7 95.3
F9 49.2 73.6 81.4 85.4 88.8 91.8 95.6F10 49.3 77.7 84.1 86.8 89.4 92.5 94.9
Figure 1 FT-IR Graph of API
Figure 2 FT-IR Graph of L-HPC+Croscarmellos
Sodium+MCC+Mannitol
ww
Page
IAJPS, 2014, Volume1, Issue (3), 182-195 Narasimhulu et al ISSN 2349-7750
Figure 3 FT-IR Graph of Croscarmellose Sodium+MCC+Mannitol+PVPK30
.
Figure 4 FT-IR Graph of F-Melt+Croscarmellose Sodium+Buffering
agent+ PVP K30
ww

Page
IAJPS, 2014, Volume1, Issue (3), 182-195 Narasimhulu et al ISSN 2349-7750
Figure 5 FT-IR Graph of API+ F-Melt+Croscarmellose Sodium+Buffering
agent
+PVP K30
Figure 6 Disolution Profile of Innovator Drug
Figure 7 Comparion of Dissolution Profile of Formulation F3
with Innovator
Figure 8 Comparion of Dissolution Profile of Formulation F4
with Innovator
ww

Page
IAJPS, 2014, Volume1, Issue (3), 182-195 Narasimhulu et al ISSN 2349-7750
Figure 9 Comparion of Dissolution Profile of Formulation F5
with Innovator
Figure 10 Comparion of Dissolution Profile of Formulation F6
with Innovator
Figure 11 Comparison of Dissolution profile of Innovator Drug
& Formulation F7
ww
Page
IAJPS, 2014, Volume1, Issue (3), 182-195 Narasimhulu et al ISSN 2349-7750
Figure 12 Comparison of Dissolution profile of Innovator Drug
& Formulation F8
Figure 13 Comparison of Dissolution profile of Innovator Drug
& Formulation F9
Figure 14 Comparison of Dissolution profile of Innovator Drug &
Formulation F10
REFERENCES:
1.William H & Frishman M D, Epidemiology, pathophysiology,and management of isolated systolic hypertension in the-elderly, Am J Med, 90(1991).2.Lancaster S G & Todd P A, Lisinopril: A preliminary review ofits pharmacodynamic and pharmacokinetic properties and therapeutic use in hypertension and congestive heart failure,Drugs, 35(1988) 646-669.
3.Marc H, Angiotensin converting enzyme inhibitors, angiotensin andcalcium channel blockers, in Foye’s Principles of Medicinal Chemistry edited by A D Williams &L L Thamas, editors,
5thedn(Lippincott Williams and Wilkins, Baltimore M D) 2002;p. 533–61.4.Harris D & Robinson J R, Drug delivery via the mucous membranes of the oral cavity, J Pharm Sci, 81(1992) 1-10.5.Madhu S, Surapaneni S K & Das N G, Effect of excipient and processing variables on adhesive properties and release profile of pentoxifylline from mucoadhesive tablets, Drug Develop IndPharm, 32 (2006) 377-387.6.Virely P & Yarhood R, Zydis – A novel fast dissolving dosage form,Manuf Chemist, 2,(1989) 37-38.7. Allen L V, Wang B & Devies J D,Rapidly dissolving tablets, US pat 066,337, 2000.
ww
Page
IAJPS, 2014, Volume1, Issue (3), 182-195 Narasimhulu et al ISSN 2349-7750
8. Koizumi I K, New method of preparing highly porous rapidly saliva soluble tablets by sublimation technique, Int J Pharm,152 (1997) 127-131.9. Sheeba F R, Formulation and evaluation of nifedipine sublingual tablets, Asian J Pharmac Clin Res, 2 (2009) 44-48.
ww