FORMULATION AND EVALUATION OF CONTROLLED RELEASE TABLETS OF PIOGLITAZONE
13
IAJPS, 2014, Volume1, Issue (4), 196-208 Rambabu et al ISSN 2349-7750 [Type the company address] Page 196 ISSN 2349-7750 INDO AMERICAN JOURNAL OF PHARMACEUTICAL SCIENCES Available online at: http://www.iajps.com Research Article FORMULATION AND EVALUATION OF CONTROLLED RELEASE TABLETS OF PIOGLITAZONE G. Ram Babu*, M. Prasad Rao, M. Rama Kotaiah , K. Ratna Rajeev MAM College of Pharmacy, Kesanapally, Narasaraopeta, Guntur (Dt), University: Acharya Nagarjuna University, Guntur, A.P. ABSTRACT Pioglitazone Controlled release tablets were prepared by using polymers like Hydroxy propyl methyl cellulose, Psyllium, Guar-gum, Xanthum gum and Carbopol. From this study it can be concluded that Pioglitazone C.R tablets prepared by Hydroxy propyl methyl cellulose K15M ( i.e. H3) showed good release rate than the tablets prepared by using other polymers. Pre compression and Carr’s index of the pure drug indicated that the drug had good flow property, even the formulations were found to be within the range. Post compression studies, for tablets like thickness, diameter, hardness, friability, drug content uniformity was done. The dissolution studies were carried out for 24 hours. As per the result of dissolution study of formulation H3, P3, G3 and X3 showed reasonable release 99.87%, 97.85%, 92.48% and 93.51% respectively at the end of 24hrs. Formula H3 showed good drug release profile 99.87% at the 24 hrs, showed excellent matrix integrity during the period of study, when compare to other formulations. The formulation H3 was considered optimum because it showed negligible drug release in acidic medium and drug release in the phosphate buffer (pH 7.4) was found to be almost complete. The stability studies of the selected formulation showed that the product was stable through-out the study period . Corresponding author: G. Ram Babu [email protected]
-
Upload
nagajunauniversity -
Category
Documents
-
view
3 -
download
0
Transcript of FORMULATION AND EVALUATION OF CONTROLLED RELEASE TABLETS OF PIOGLITAZONE
IAJPS, 2014, Volume1, Issue (4), 196-208 Rambabu et al ISSN 2349-7750
[ T y p e t h e c o m p a n y a d d r e s s ]
Page 196
ISSN 2349-7750
IINNDDOO AAMMEERRIICCAANN JJOOUURRNNAALL OOFF
PPHHAARRMMAACCEEUUTTIICCAALL SSCCIIEENNCCEESS
Available online at: http://www.iajps.com Research Article
FORMULATION AND EVALUATION OF CONTROLLED
RELEASE TABLETS OF PIOGLITAZONE
G. Ram Babu*, M. Prasad Rao, M. Rama Kotaiah , K. Ratna Rajeev
MAM College of Pharmacy, Kesanapally, Narasaraopeta, Guntur (Dt), University: Acharya
Nagarjuna University, Guntur, A.P.
ABSTRACT
Pioglitazone Controlled release tablets were prepared by using polymers like Hydroxy propyl methyl cellulose,
Psyllium, Guar-gum, Xanthum gum and Carbopol. From this study it can be concluded that Pioglitazone C.R
tablets prepared by Hydroxy propyl methyl cellulose K15M ( i.e. H3) showed good release rate than the tablets
prepared by using other polymers. Pre compression and Carr’s index of the pure drug indicated that the drug had
good flow property, even the formulations were found to be within the range. Post compression studies, for
tablets like thickness, diameter, hardness, friability, drug content uniformity was done. The dissolution studies
were carried out for 24 hours. As per the result of dissolution study of formulation H3, P3, G3 and X3 showed
reasonable release 99.87%, 97.85%, 92.48% and 93.51% respectively at the end of 24hrs. Formula H3 showed
good drug release profile 99.87% at the 24 hrs, showed excellent matrix integrity during the period of study,
when compare to other formulations. The formulation H3 was considered optimum because it showed negligible
drug release in acidic medium and drug release in the phosphate buffer (pH 7.4) was found to be almost
complete. The stability studies of the selected formulation showed that the product was stable through-out the
study period .
Corresponding author: G. Ram Babu
IAJPS, 2014, Volume1, Issue (4), 196-208 Rambabu et al ISSN 2349-7750
[ T y p e t h e c o m p a n y a d d r e s s ]
Page 197
INTRODUCTION:
For many decades treatment of an acute disease or
a chronic illness has been mostly accomplished by
delivery of drugs to the patients using various
pharmaceutical dosage forms, including tablets,
capsules, pills, suppositories, creams, ointments,
liquids, aerosols and injectable as drug carriers.
Even today these conventional drug delivery
systems are the primary pharmaceutical products
commonly seen in the prescription and over the
counter drug market place[1]. This type of drug
delivery system is known to provide a prompt
release of drug. Therefore to achieve as well as to
maintain the drug concentration within the
therapeutically effective range needed for
treatment, it is often necessary to take this type of
drug delivery system several times a day. This
results in a significant fluctuation in drug levels.
Recently, several technical advancements have
been made. They have resulted in the development
of new techniques for drug delivery[2]. These
techniques are capable of controlling the rate of
drug delivery, sustaining the duration of therapeutic
activity and / or targeting the delivery of drug to a
tissue[3]. Although these advancements have led to
the development of several novel drug delivery
systems that could revolutionize the method of
medication and provide a number of therapeutic
benefits, they also create some confusion in the
terminology between “Controlled release” and
“Sustained release.” Unfortunately these terms
have been often used interchangeably in the
scientific literature and technical presentations over
the years[4,5].
It has been constantly used to describe a
pharmaceutical dosage form formulation to retard
the release of a therapeutic agent such that it
appearance in the systemic circulation is delayed
and /or Prolonged and its plasma profile is
sustained in duration[6].
Pioglitazone is a thiazolidinedione antidiabetic
agent that depends on the presence of insulin for its
mechanism of action. It decreases insulin resistance
in the periphery and in the liver resulting in
increased insulin-dependent glucose disposal and
decreased hepatic glucose output.
The present research project relates to a CR oral
formulation of anti-diabetic drugs like Pioglitazone,
the present research comprising Pioglitazone
formulated by using polymers like guar gums,
Xanthum gums, Psyllium and hydroxypropyl
methylcellulose are used for controlling the drug
release[7]. And the polymers are mixed in a
predetermined ratio.
MATERIALS AND METHODS:
Materials:
Pioglitazone hydrochloride drug was obtained as a
gift sample from Lee Pharma,Hyderabad,India.
Polymers HPMC K15M from Strides acrolab,
Bangalore. Psyllium from Vindhya pharma,
Hyderabad. Guar-gum and Xanthum-gum from
Himedia laboratory, Mumbai. Magnesium stearate
from Ranchem,Hyderabad. All the chemicals were
of analytical grade.
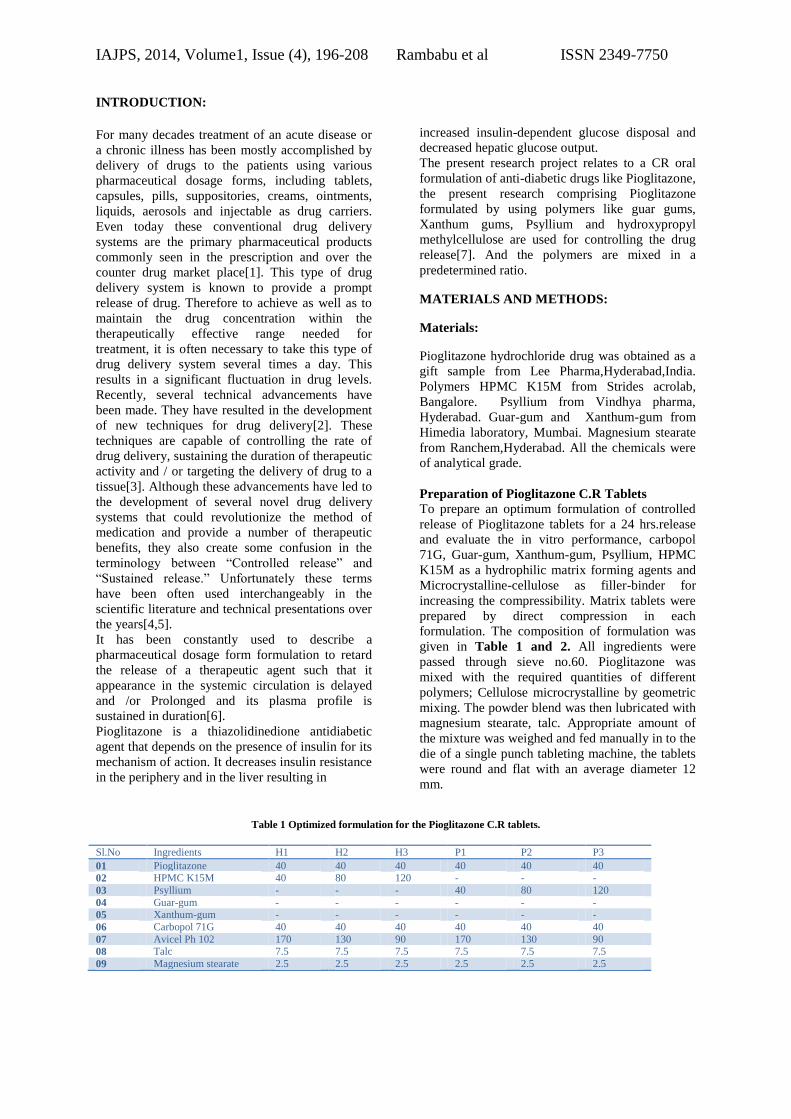
Preparation of Pioglitazone C.R Tablets
To prepare an optimum formulation of controlled
release of Pioglitazone tablets for a 24 hrs.release
and evaluate the in vitro performance, carbopol
71G, Guar-gum, Xanthum-gum, Psyllium, HPMC
K15M as a hydrophilic matrix forming agents and
Microcrystalline-cellulose as filler-binder for
increasing the compressibility. Matrix tablets were
prepared by direct compression in each
formulation. The composition of formulation was
given in Table 1 and 2. All ingredients were
passed through sieve no.60. Pioglitazone was
mixed with the required quantities of different
polymers; Cellulose microcrystalline by geometric
mixing. The powder blend was then lubricated with
magnesium stearate, talc. Appropriate amount of
the mixture was weighed and fed manually in to the
die of a single punch tableting machine, the tablets
were round and flat with an average diameter 12
mm.
Table 1 Optimized formulation for the Pioglitazone C.R tablets.
Sl.No Ingredients H1 H2 H3 P1 P2 P3
01 Pioglitazone 40 40 40 40 40 40
02 HPMC K15M 40 80 120 - - -
03 Psyllium - - - 40 80 120
04 Guar-gum - - - - - -
05 Xanthum-gum - - - - - -
06 Carbopol 71G 40 40 40 40 40 40
07 Avicel Ph 102 170 130 90 170 130 90
08 Talc 7.5 7.5 7.5 7.5 7.5 7.5
09 Magnesium stearate 2.5 2.5 2.5 2.5 2.5 2.5
IAJPS, 2014, Volume1, Issue (4), 196-208 Rambabu et al ISSN 2349-7750
[ T y p e t h e c o m p a n y a d d r e s s ]
Page 198
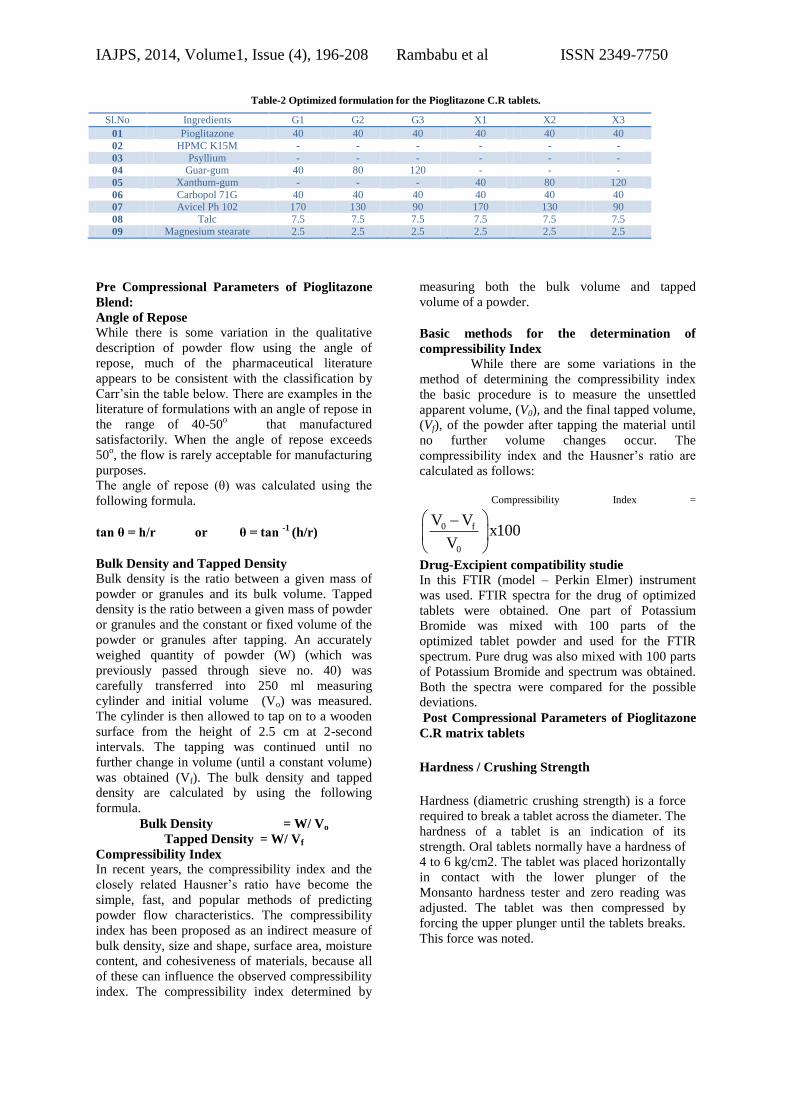
Table-2 Optimized formulation for the Pioglitazone C.R tablets.
Sl.No Ingredients G1 G2 G3 X1 X2 X3
01 Pioglitazone 40 40 40 40 40 40
02 HPMC K15M - - - - - -
03 Psyllium - - - - - -
04 Guar-gum 40 80 120 - - -
05 Xanthum-gum - - - 40 80 120
06 Carbopol 71G 40 40 40 40 40 40
07 Avicel Ph 102 170 130 90 170 130 90
08 Talc 7.5 7.5 7.5 7.5 7.5 7.5
09 Magnesium stearate 2.5 2.5 2.5 2.5 2.5 2.5
Pre Compressional Parameters of Pioglitazone
Blend:
Angle of Repose
While there is some variation in the qualitative
description of powder flow using the angle of
repose, much of the pharmaceutical literature
appears to be consistent with the classification by
Carr’sin the table below. There are examples in the
literature of formulations with an angle of repose in
the range of 40-50o that manufactured
satisfactorily. When the angle of repose exceeds
50o, the flow is rarely acceptable for manufacturing
purposes.
The angle of repose (θ) was calculated using the
following formula.
tan θ = h/r or θ = tan -1
(h/r)
Bulk Density and Tapped Density
Bulk density is the ratio between a given mass of
powder or granules and its bulk volume. Tapped
density is the ratio between a given mass of powder
or granules and the constant or fixed volume of the
powder or granules after tapping. An accurately
weighed quantity of powder (W) (which was
previously passed through sieve no. 40) was
carefully transferred into 250 ml measuring
cylinder and initial volume (Vo) was measured.
The cylinder is then allowed to tap on to a wooden
surface from the height of 2.5 cm at 2-second
intervals. The tapping was continued until no
further change in volume (until a constant volume)
was obtained (Vf). The bulk density and tapped
density are calculated by using the following
formula.
Bulk Density = W/ Vo
Tapped Density = W/ Vf
Compressibility Index
In recent years, the compressibility index and the
closely related Hausner’s ratio have become the
simple, fast, and popular methods of predicting
powder flow characteristics. The compressibility
index has been proposed as an indirect measure of
bulk density, size and shape, surface area, moisture
content, and cohesiveness of materials, because all
of these can influence the observed compressibility
index. The compressibility index determined by
measuring both the bulk volume and tapped
volume of a powder.
Basic methods for the determination of
compressibility Index
While there are some variations in the
method of determining the compressibility index
the basic procedure is to measure the unsettled
apparent volume, (V0), and the final tapped volume,
(Vf), of the powder after tapping the material until
no further volume changes occur. The
compressibility index and the Hausner’s ratio are
calculated as follows:
Compressibility Index =
0 f
0
V Vx100
V
Drug-Excipient compatibility studie
In this FTIR (model – Perkin Elmer) instrument
was used. FTIR spectra for the drug of optimized
tablets were obtained. One part of Potassium
Bromide was mixed with 100 parts of the
optimized tablet powder and used for the FTIR
spectrum. Pure drug was also mixed with 100 parts
of Potassium Bromide and spectrum was obtained.
Both the spectra were compared for the possible
deviations.
Post Compressional Parameters of Pioglitazone
C.R matrix tablets
Hardness / Crushing Strength
Hardness (diametric crushing strength) is a force
required to break a tablet across the diameter. The
hardness of a tablet is an indication of its
strength. Oral tablets normally have a hardness of
4 to 6 kg/cm2. The tablet was placed horizontally
in contact with the lower plunger of the
Monsanto hardness tester and zero reading was
adjusted. The tablet was then compressed by
forcing the upper plunger until the tablets breaks.
This force was noted.
IAJPS, 2014, Volume1, Issue (4), 196-208 Rambabu et al ISSN 2349-7750
[ T y p e t h e c o m p a n y a d d r e s s ]
Page 199
Friability test
Friability is the loss of weight of tablet in the
container/package, due to removal of fine
particles from the surface. This in-process quality
control test is performed to ensure the ability of
tablets to withstand the shocks during processing,
handling, transportation, and shipment. The
percent friability was determined using the
following formula.
Friability =
1 2
1
W Wx100
W
Where,
W1 = weight of ten tablets before
test
W2 = weight of ten tablets after
test
Uniformity of weight or Weight variation test Twenty tablets of each formulation were selected at
random and weighed individually. The weight of
individual tablets was noted. Average weight was
calculated from the total weight of all tablets. The
individual weights were compared with the average
weight. Not more than two of the tablets must
differ from the average weight by not more than the
percentages stated in table below.
Estimation of drug content
Five tablets were taken and crushed in motor and
powdered.10mg of blend was weighed and
transferred in 10mlvoumetric flask .The blend was
dissolved in Distilled water. The solution was
filtered, suitable diluted and the drug content was
analyzed by UV is spectrophotometrically at λmax
278 nm. Each sample was analyzed in triplicate.
Generally, the drug content in any formulation
should fall within the limit of 92 – 102%.
Dissolution rate studies
In vitrodrug release
In vitro drug release of the samples was carried out
using USP – type II dissolution apparatus (paddle
type). The dissolution medium, 900 ml 0.1N HCl
up to 2hrs and after 2hrs medium was replaced with
PH 7.4 buffer was placed into the dissolution flask
maintaining the temperature of 37 + 0.5oC and rpm
of 100. One Pioglitazone tablet was placed in each
paddle of dissolution apparatus. The apparatus was
allowed to run for 12 hours. Samples measuring 5
ml were withdrawn at the time intervals 0.5, 1, 1.5,
2hour for the first 2hrs and at every 1hr intervals up
to 12 hours using 5 ml pipette. The fresh
dissolution medium (37oC) was replaced every time
with the same quantity (5ml) of dissolution
medium. Collected samples were suitably diluted
with medium (if required) and analyzed
spectrophotometrically at λmax 274nm using
medium as blank. The percentage drug release was
calculated. All the dissolutions were done triplicate.
Kinetics and Mechanism of drug release: First order constant: First order rate constant
obtained by plotting log %Dissolved versus Time,
the plot will be straight line and slope of the line
(m) will be –K / 2.303.
The slope of the line and the
corresponding value of k can be calculated which is
indicative of the release rate profile.
In Q-InQo = Kt
Where Q is the amount of drug release at time t. Qo
is quantity of drug present initially in the dosage
form, and K is the first order release constant.
Higuchi constant: To investigate the mechanism
of drug release the in vitro data were plotted as
cumulative drug release versus square root of time
as described by Higuchi, when the linearity was
observed in the graph that indicates the diffusion
controlled release.
Q = KHt1/2
Where Q is amount of drug release at time t, KH is
Higuchi square root of time release rate constant.
Korsemeyer ─ Peppas constant: To under stand
the mechanism of drug release and to compare the
differences among release profile of these matrix
formulations, the percent drug release versus time
profiles were fitted into the equation proposed by
Peppas.
Mt / Mœ = Ktn
Where Mt is drug release at time t, Mœ is the total
amount of drug in the dosage form, Mt /
Mœ is the fraction of drug release up to time t, K is
the kinetic constant and n is the release exponent
indicative of the release mechanism. Where n =
0.45 indicates Fickian diffusion, when between
0.45 - 0.89 indicates anomalous Non Fickian
transport and 0.89 indicates Case- II transport, n=1
for zero-order release.

IAJPS, 2014, Volume1, Issue (4), 196-208 Rambabu et al ISSN 2349-7750
[ T y p e t h e c o m p a n y a d d r e s s ]
Page 200
RESULTS AND DISCUSSION
FT-IR Studies:
The Infrared spectra of pioglitazone hydrochloride
solid admixtures of drug and excipients were
recorded between 500 to 3500cm-1
on FTIR. From
the FTIR studies at 1693.6 and 1742.79 are the
characteristics peaks of Pioglitazone
Hydrochloride. No significant change occurred in
the characteristics peaks of pioglitazone
hydrochloride in all the solid admixtures. The
spectrum shown in (Figures 1 & 2)
Fig.1 FTIR Graph of Pioglitazone with different polymers
Fig. 2 FTIR Graph of Pioglitazoneand Formulation H3.
IAJPS, 2014, Volume1, Issue (4), 196-208 Rambabu et al ISSN 2349-7750
[ T y p e t h e c o m p a n y a d d r e s s ]
Page 201
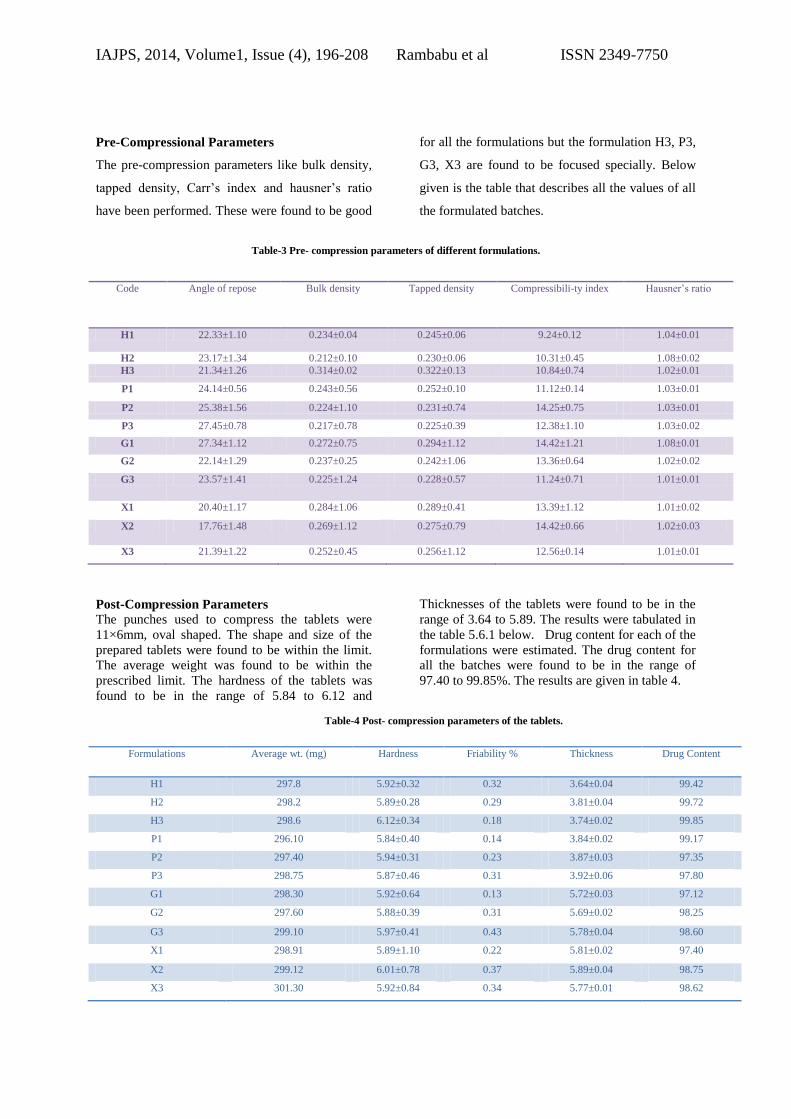
Pre-Compressional Parameters
The pre-compression parameters like bulk density,
tapped density, Carr’s index and hausner’s ratio
have been performed. These were found to be good
for all the formulations but the formulation H3, P3,
G3, X3 are found to be focused specially. Below
given is the table that describes all the values of all
the formulated batches.
Table-3 Pre- compression parameters of different formulations.
Code Angle of repose Bulk density Tapped density Compressibili-ty index Hausner’s ratio
H1 22.33±1.10 0.234±0.04 0.245±0.06 9.24±0.12 1.04±0.01
H2 23.17±1.34 0.212±0.10 0.230±0.06 10.31±0.45 1.08±0.02
H3 21.34±1.26 0.314±0.02 0.322±0.13 10.84±0.74 1.02±0.01
P1 24.14±0.56 0.243±0.56 0.252±0.10 11.12±0.14 1.03±0.01
P2 25.38±1.56 0.224±1.10 0.231±0.74 14.25±0.75 1.03±0.01
P3 27.45±0.78 0.217±0.78 0.225±0.39 12.38±1.10 1.03±0.02
G1 27.34±1.12 0.272±0.75 0.294±1.12 14.42±1.21 1.08±0.01
G2 22.14±1.29 0.237±0.25 0.242±1.06 13.36±0.64 1.02±0.02
G3 23.57±1.41 0.225±1.24 0.228±0.57 11.24±0.71 1.01±0.01
X1 20.40±1.17 0.284±1.06 0.289±0.41 13.39±1.12 1.01±0.02
X2 17.76±1.48 0.269±1.12 0.275±0.79 14.42±0.66 1.02±0.03
X3 21.39±1.22 0.252±0.45 0.256±1.12 12.56±0.14 1.01±0.01
Post-Compression Parameters
The punches used to compress the tablets were
11×6mm, oval shaped. The shape and size of the
prepared tablets were found to be within the limit.
The average weight was found to be within the
prescribed limit. The hardness of the tablets was
found to be in the range of 5.84 to 6.12 and
Thicknesses of the tablets were found to be in the
range of 3.64 to 5.89. The results were tabulated in
the table 5.6.1 below. Drug content for each of the
formulations were estimated. The drug content for
all the batches were found to be in the range of
97.40 to 99.85%. The results are given in table 4.
Table-4 Post- compression parameters of the tablets.
Formulations Average wt. (mg) Hardness Friability % Thickness Drug Content
H1 297.8 5.92±0.32 0.32 3.64±0.04 99.42
H2 298.2 5.89±0.28 0.29 3.81±0.04 99.72
H3 298.6 6.12±0.34 0.18 3.74±0.02 99.85
P1 296.10 5.84±0.40 0.14 3.84±0.02 99.17
P2 297.40 5.94±0.31 0.23 3.87±0.03 97.35
P3 298.75 5.87±0.46 0.31 3.92±0.06 97.80
G1 298.30 5.92±0.64 0.13 5.72±0.03 97.12
G2 297.60 5.88±0.39 0.31 5.69±0.02 98.25
G3 299.10 5.97±0.41 0.43 5.78±0.04 98.60
X1 298.91 5.89±1.10 0.22 5.81±0.02 97.40
X2 299.12 6.01±0.78 0.37 5.89±0.04 98.75
X3 301.30 5.92±0.84 0.34 5.77±0.01 98.62

IAJPS, 2014, Volume1, Issue (4), 196-208 Rambabu et al ISSN 2349-7750
[ T y p e t h e c o m p a n y a d d r e s s ]
Page 202
In-Vitro Dissolution Studies
All the 12 formulation of prepared tablets of
Pioglitazone were subjected to in vitro release
studies, these studies were carried out using
dissolution medium, (pH 1.2 and Phosphate buffer
pH 7.4).by using USP-2 (paddle type) dissolution
apparatus. The results were evaluated for 24 hours.
As per the results of dissolution study formulations
H-1, H-2, H-3, P1, P2, P3, G1, G2, G3, X1, X2 and
X3 showed 84.21%, 93.53%, 99.87%, 64.21%,
75.27%, 97.85%, 77.48%, 83.27%, 92.48%,
80.57%, 89.91% and 93.51% release respectively
over a period of 24 hours.
Among all the formulation, H3, P3, G3 and X3,
showed 99.87%, 97.85%, 92.48 and 93.51%,
release respectively at the end of 24 hours. The
formulation H3 its release at the end of 24th hr is
99.87% also all other parameters like hardness,
thickness, friability, and drug content and weight
variation for this formulations were within the
range. So, a formulation H3 was selected as the
optimized formulation.
The data of all the formulated tablets is shown
in the tables below and graphs are drawn
respectively.
Table 5 Cumulative percent drug release of H1 to H3 formulations.
Table 6 Cumulative percent drug release of P1 to P3 formulations.
Sl.No Time (hrs). P1 P2 P3
01 0 0 0 0
02 01 11.24 6.21 7.45
03 02 14.41 10.52 12.54
04 03 17.59 14.71 17.24
05 04 21.34 18.52 22.32
06 05 24.53 22.01 27.15
07 06 27.36 26.32 32.06
08 07 30.54 30.54 37.41
09 08 33.82 34.12 42.34
10 09 36.32 38.26 47.59
11 10 39.74 42.58 52.16
12 11 42.38 46.37 57.37
13 12 45.21 52.14 65.28
14 16 50.24 60.22 76.42
15 20 58.47 68.45 89.24
16 24 64.21 75.27 97.85
Sl.No Time (hrs). H1 H2 H3
01 0 0 0 0
02 01 6.54 7.05 9.21
03 02 11.27 12.57 14.35
04 03 16.47 17.24 19.64
05 04 20.43 22.56 24.27
06 05 24.57 27.54 29.53
07 06 28.74 32.43 33.15
08 07 32.47 37.26 38.54
09 08 36.62 42.2 43.57
10 09 40.05 47.58 48.11
11 10 44.27 52.64 53.23
12 11 48.69 57.54 58.73
13 12 60.27 65.29 63.51
14 16 69.58 78.13 76.52
15 20 78.56 87.28 89.27
16 24 84.21 93.53 99.87
IAJPS, 2014, Volume1, Issue (4), 196-208 Rambabu et al ISSN 2349-7750
[ T y p e t h e c o m p a n y a d d r e s s ]
Page 203
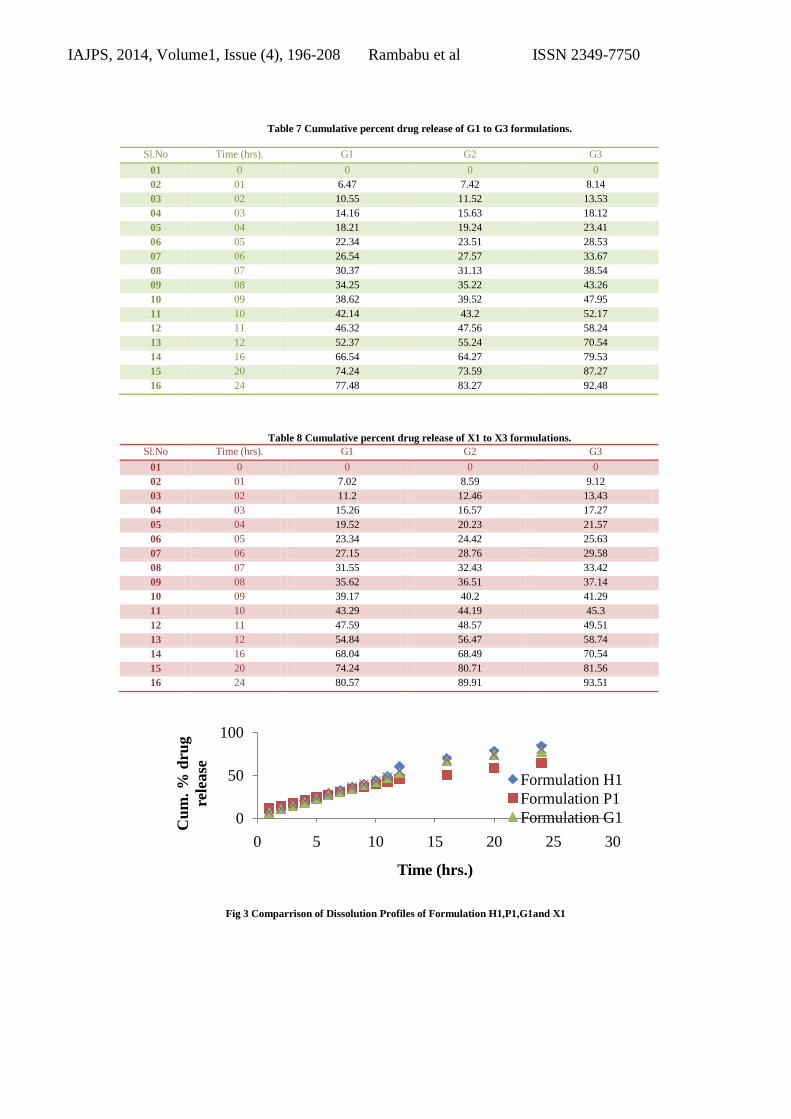
Table 7 Cumulative percent drug release of G1 to G3 formulations.
Sl.No Time (hrs). G1 G2 G3
01 0 0 0 0
02 01 6.47 7.42 8.14
03 02 10.55 11.52 13.53
04 03 14.16 15.63 18.12
05 04 18.21 19.24 23.41
06 05 22.34 23.51 28.53
07 06 26.54 27.57 33.67
08 07 30.37 31.13 38.54
09 08 34.25 35.22 43.26
10 09 38.62 39.52 47.95
11 10 42.14 43.2 52.17
12 11 46.32 47.56 58.24
13 12 52.37 55.24 70.54
14 16 66.54 64.27 79.53
15 20 74.24 73.59 87.27
16 24 77.48 83.27 92.48
Table 8 Cumulative percent drug release of X1 to X3 formulations.
Sl.No Time (hrs). G1 G2 G3
01 0 0 0 0
02 01 7.02 8.59 9.12
03 02 11.2 12.46 13.43
04 03 15.26 16.57 17.27
05 04 19.52 20.23 21.57
06 05 23.34 24.42 25.63
07 06 27.15 28.76 29.58
08 07 31.55 32.43 33.42
09 08 35.62 36.51 37.14
10 09 39.17 40.2 41.29
11 10 43.29 44.19 45.3
12 11 47.59 48.57 49.51
13 12 54.84 56.47 58.74
14 16 68.04 68.49 70.54
15 20 74.24 80.71 81.56
16 24 80.57 89.91 93.51
Fig 3 Comparrison of Dissolution Profiles of Formulation H1,P1,G1and X1
0
50
100
0 5 10 15 20 25 30
Cu
m. %
dru
g
rele
ase
Time (hrs.)
Formulation H1
Formulation P1
Formulation G1
IAJPS, 2014, Volume1, Issue (4), 196-208 Rambabu et al ISSN 2349-7750
[ T y p e t h e c o m p a n y a d d r e s s ]
Page 204
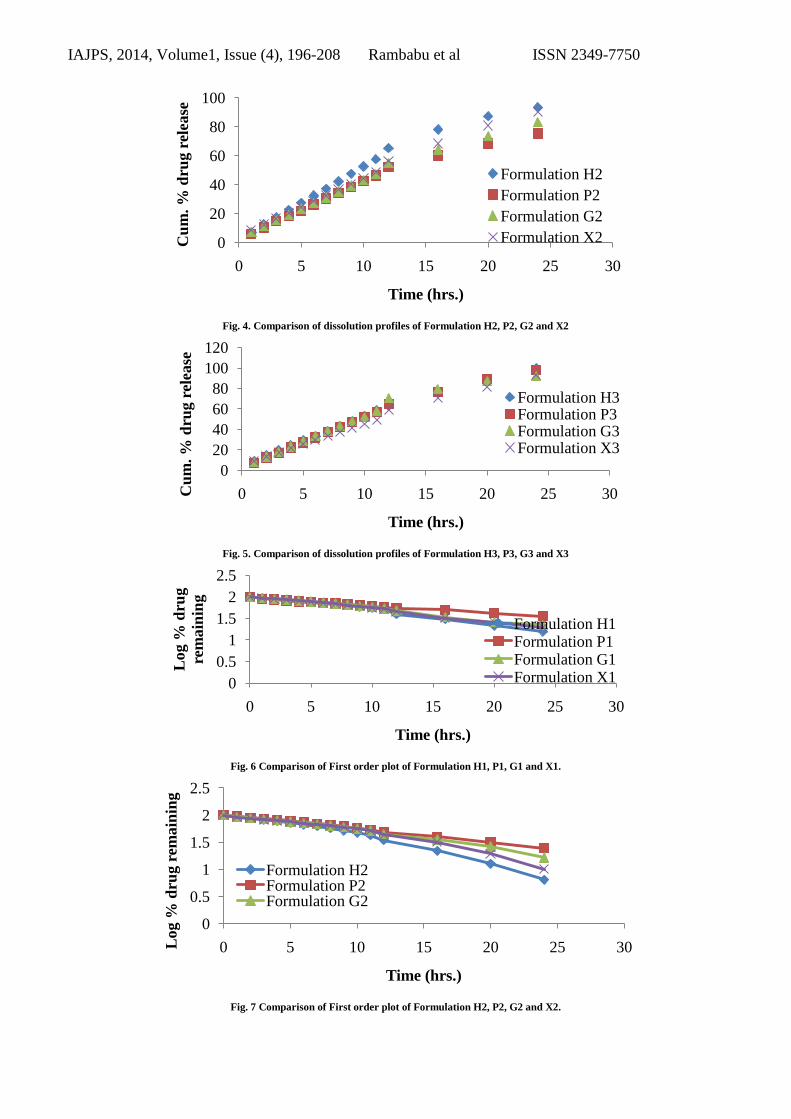
Fig. 4. Comparison of dissolution profiles of Formulation H2, P2, G2 and X2
Fig. 5. Comparison of dissolution profiles of Formulation H3, P3, G3 and X3
Fig. 6 Comparison of First order plot of Formulation H1, P1, G1 and X1.
Fig. 7 Comparison of First order plot of Formulation H2, P2, G2 and X2.
0
20
40
60
80
100
0 5 10 15 20 25 30
Cu
m. %
dru
g r
elea
se
Time (hrs.)
Formulation H2
Formulation P2
Formulation G2
Formulation X2
0
20
40
60
80
100
120
0 5 10 15 20 25 30Cu
m. %
dru
g r
elea
se
Time (hrs.)
Formulation H3Formulation P3Formulation G3Formulation X3
0
0.5
1
1.5
2
2.5
0 5 10 15 20 25 30
Log %
dru
g
rem
ain
ing
Time (hrs.)
Formulation H1Formulation P1Formulation G1Formulation X1
0
0.5
1
1.5
2
2.5
0 5 10 15 20 25 30Log %
dru
g r
emain
ing
Time (hrs.)
Formulation H2Formulation P2Formulation G2
IAJPS, 2014, Volume1, Issue (4), 196-208 Rambabu et al ISSN 2349-7750
[ T y p e t h e c o m p a n y a d d r e s s ]
Page 205
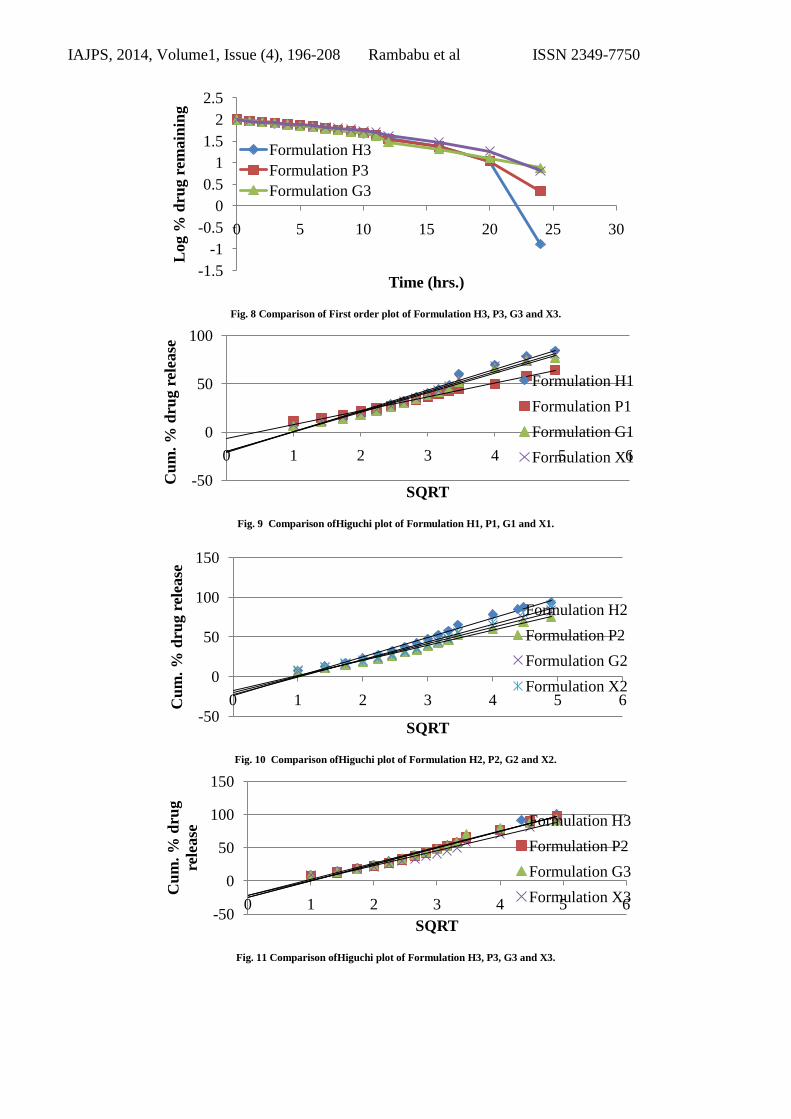
Fig. 8 Comparison of First order plot of Formulation H3, P3, G3 and X3.
Fig. 9 Comparison ofHiguchi plot of Formulation H1, P1, G1 and X1.
Fig. 10 Comparison ofHiguchi plot of Formulation H2, P2, G2 and X2.
Fig. 11 Comparison ofHiguchi plot of Formulation H3, P3, G3 and X3.
-1.5
-1
-0.5
0
0.5
1
1.5
2
2.5
0 5 10 15 20 25 30
Log %
dru
g r
emain
ing
Time (hrs.)
Formulation H3
Formulation P3
Formulation G3
-50
0
50
100
0 1 2 3 4 5 6
Cu
m. %
dru
g r
elea
se
SQRT
Formulation H1
Formulation P1
Formulation G1
Formulation X1
-50
0
50
100
150
0 1 2 3 4 5 6Cu
m. %
dru
g r
elea
se
SQRT
Formulation H2
Formulation P2
Formulation G2
Formulation X2
-50
0
50
100
150
0 1 2 3 4 5 6
Cu
m. %
dru
g
rele
ase
SQRT
Formulation H3
Formulation P2
Formulation G3
Formulation X3
IAJPS, 2014, Volume1, Issue (4), 196-208 Rambabu et al ISSN 2349-7750
[ T y p e t h e c o m p a n y a d d r e s s ]
Page 206
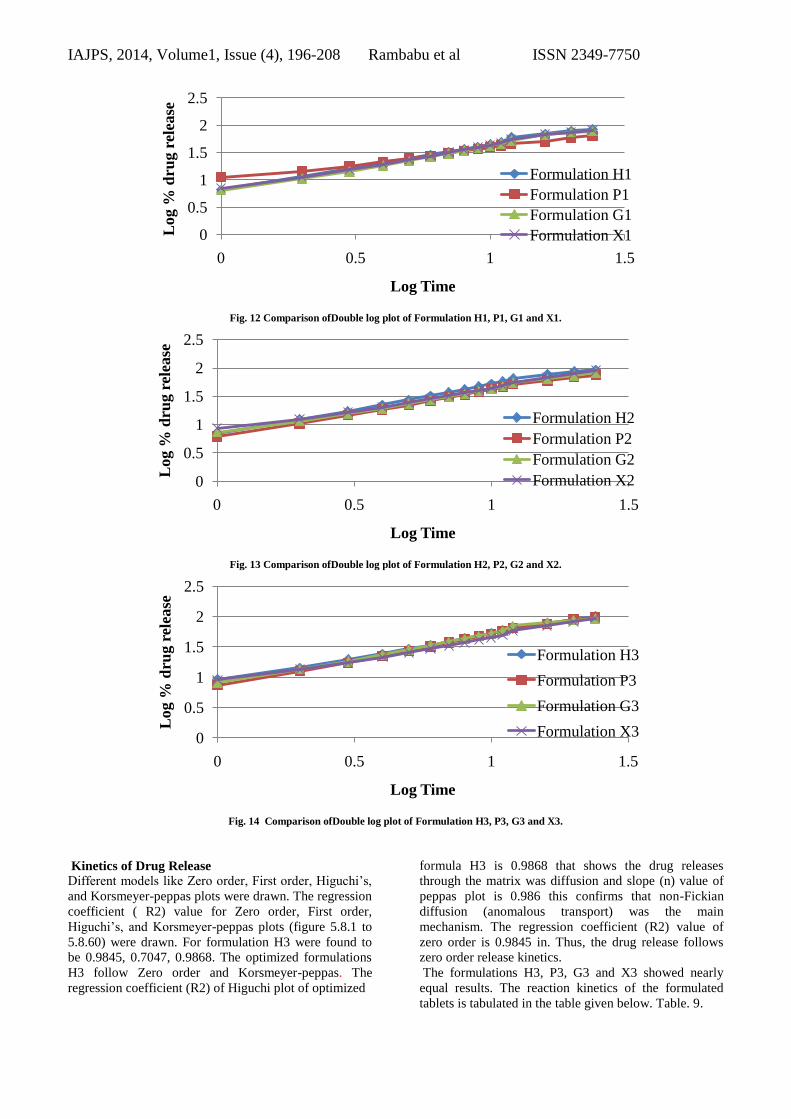
Fig. 12 Comparison ofDouble log plot of Formulation H1, P1, G1 and X1.
Fig. 13 Comparison ofDouble log plot of Formulation H2, P2, G2 and X2.
Fig. 14 Comparison ofDouble log plot of Formulation H3, P3, G3 and X3.
Kinetics of Drug Release
Different models like Zero order, First order, Higuchi’s,
and Korsmeyer-peppas plots were drawn. The regression
coefficient ( R2) value for Zero order, First order,
Higuchi’s, and Korsmeyer-peppas plots (figure 5.8.1 to
5.8.60) were drawn. For formulation H3 were found to
be 0.9845, 0.7047, 0.9868. The optimized formulations
H3 follow Zero order and Korsmeyer-peppas. The
regression coefficient (R2) of Higuchi plot of optimized
formula H3 is 0.9868 that shows the drug releases
through the matrix was diffusion and slope (n) value of
peppas plot is 0.986 this confirms that non-Fickian
diffusion (anomalous transport) was the main
mechanism. The regression coefficient (R2) value of
zero order is 0.9845 in. Thus, the drug release follows
zero order release kinetics.
The formulations H3, P3, G3 and X3 showed nearly
equal results. The reaction kinetics of the formulated
tablets is tabulated in the table given below. Table. 9.
0
0.5
1
1.5
2
2.5
0 0.5 1 1.5
Lo
g %
dru
g r
elea
se
Log Time
Formulation H1
Formulation P1
Formulation G1
Formulation X1
0
0.5
1
1.5
2
2.5
0 0.5 1 1.5
Log %
dru
g r
elea
se
Log Time
Formulation H2
Formulation P2
Formulation G2
Formulation X2
0
0.5
1
1.5
2
2.5
0 0.5 1 1.5
Log %
dru
g r
elea
se
Log Time
Formulation H3
Formulation P3
Formulation G3
Formulation X3
IAJPS, 2014, Volume1, Issue (4), 196-208 Rambabu et al ISSN 2349-7750
[ T y p e t h e c o m p a n y a d d r e s s ]
Page 207
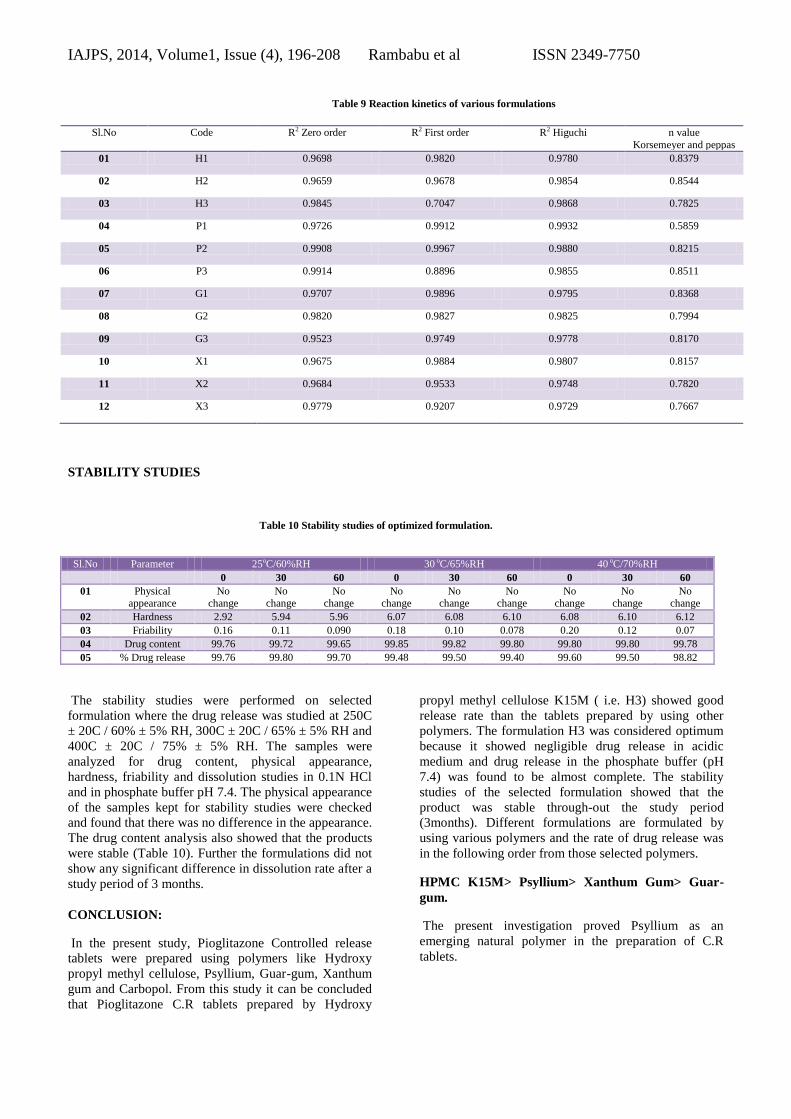
Table 9 Reaction kinetics of various formulations
Sl.No Code R2 Zero order R2 First order R2 Higuchi n value
Korsemeyer and peppas
01 H1 0.9698 0.9820 0.9780 0.8379
02 H2 0.9659 0.9678 0.9854 0.8544
03 H3 0.9845 0.7047 0.9868 0.7825
04 P1 0.9726 0.9912 0.9932 0.5859
05 P2 0.9908 0.9967 0.9880 0.8215
06 P3 0.9914 0.8896 0.9855 0.8511
07 G1 0.9707 0.9896 0.9795 0.8368
08 G2 0.9820 0.9827 0.9825 0.7994
09 G3 0.9523 0.9749 0.9778 0.8170
10 X1 0.9675 0.9884 0.9807 0.8157
11 X2 0.9684 0.9533 0.9748 0.7820
12 X3 0.9779 0.9207 0.9729 0.7667
STABILITY STUDIES
Table 10 Stability studies of optimized formulation.
The stability studies were performed on selected
formulation where the drug release was studied at 250C
± 20C / 60% ± 5% RH, 300C ± 20C / 65% ± 5% RH and
400C ± 20C / 75% ± 5% RH. The samples were
analyzed for drug content, physical appearance,
hardness, friability and dissolution studies in 0.1N HCl
and in phosphate buffer pH 7.4. The physical appearance
of the samples kept for stability studies were checked
and found that there was no difference in the appearance.
The drug content analysis also showed that the products
were stable (Table 10). Further the formulations did not
show any significant difference in dissolution rate after a
study period of 3 months.
CONCLUSION:
In the present study, Pioglitazone Controlled release
tablets were prepared using polymers like Hydroxy
propyl methyl cellulose, Psyllium, Guar-gum, Xanthum
gum and Carbopol. From this study it can be concluded
that Pioglitazone C.R tablets prepared by Hydroxy
propyl methyl cellulose K15M ( i.e. H3) showed good
release rate than the tablets prepared by using other
polymers. The formulation H3 was considered optimum
because it showed negligible drug release in acidic
medium and drug release in the phosphate buffer (pH
7.4) was found to be almost complete. The stability
studies of the selected formulation showed that the
product was stable through-out the study period
(3months). Different formulations are formulated by
using various polymers and the rate of drug release was
in the following order from those selected polymers.
HPMC K15M> Psyllium> Xanthum Gum> Guar-
gum.
The present investigation proved Psyllium as an
emerging natural polymer in the preparation of C.R
tablets.
Sl.No Parameter 25oC/60%RH 30 oC/65%RH 40 oC/70%RH
0 30 60 0 30 60 0 30 60
01 Physical appearance
No change
No change
No change
No change
No change
No change
No change
No change
No change
02 Hardness 2.92 5.94 5.96 6.07 6.08 6.10 6.08 6.10 6.12
03 Friability 0.16 0.11 0.090 0.18 0.10 0.078 0.20 0.12 0.07
04 Drug content 99.76 99.72 99.65 99.85 99.82 99.80 99.80 99.80 99.78
05 % Drug release 99.76 99.80 99.70 99.48 99.50 99.40 99.60 99.50 98.82
IAJPS, 2014, Volume1, Issue (4), 196-208 Rambabu et al ISSN 2349-7750
[ T y p e t h e c o m p a n y a d d r e s s ]
Page 208
REFERENCES:
1. Vyas SP, khar RK. “Controlled Drug Delivery.
Concepts and Advances,” ed- 2002: 155-195.
2. Sallsa T. Veiga F, Pina ME. oral controlled –
release dosage forms Cellulose ether polymers
in hydrophilic – matrices. Drug Dev Ind Pharm.
1997; 23: 929 – 938.
3. Ritchel WA. Biopharmaceutic and
pharmacokinetic apectsin the design of
controlled release per-oral drug delivery
system. Drug Dev Ind Pharm 1989; 15: 1073-
103.
4. Alderman DA. A review of cellulose ethers in
hydrophilic matrices for oral controlled –
5. release dosage forms. Int. S. Pharm. Tech,.
Prod. Manuf. 1984;5: 1-9.
6. Gohel MC, Patel TP, BarigyaSH. Studies in
preparation and evaluation of pH independent
sustained – release matrix tablets of Verapamil
Hcl using directly compressible Eudragits.
Pharam Dev Technol, 2003; 8: 323 – 333.
Pubmed Dol : 10. 1081 / PDT – 120024686.
7. Gwen MJ, Joseph RR. In: Banker GS and
Rhodes, CT,Modern pharmaceutics. 3rd ed. Vol
72. New York: Marcel Dekker Inc., 1996; pp.
575.
8. Siepmann J, N.A.Peppas. Modeling of drug
release from delivery systems based on
hydroxylpropylmethylcellulose (HPMC), adv.
Drug deliv. Rev 48, 2001, 139-157.