Network Function Virtualization over Cloud-Cloud Computing ...
Upload
khangminh22Category
view
2download
0
Cloud Eye
User Guide
Issue 25
Date 2018-07-30
HUAWEI TECHNOLOGIES CO., LTD.

Copyright © Huawei Technologies Co., Ltd. 2018. All rights reserved.No part of this document may be reproduced or transmitted in any form or by any means without prior writtenconsent of Huawei Technologies Co., Ltd. Trademarks and Permissions
and other Huawei trademarks are trademarks of Huawei Technologies Co., Ltd.All other trademarks and trade names mentioned in this document are the property of their respectiveholders. NoticeThe purchased products, services and features are stipulated by the contract made between Huawei and thecustomer. All or part of the products, services and features described in this document may not be within thepurchase scope or the usage scope. Unless otherwise specified in the contract, all statements, information,and recommendations in this document are provided "AS IS" without warranties, guarantees orrepresentations of any kind, either express or implied.
The information in this document is subject to change without notice. Every effort has been made in thepreparation of this document to ensure accuracy of the contents, but all statements, information, andrecommendations in this document do not constitute a warranty of any kind, express or implied.
Huawei Technologies Co., Ltd.Address: Huawei Industrial Base
Bantian, LonggangShenzhen 518129People's Republic of China
Website: http://www.huawei.com
Email: [email protected]
Issue 25 (2018-07-30) Huawei Proprietary and ConfidentialCopyright © Huawei Technologies Co., Ltd.
i
Contents
1 Product Introduction.....................................................................................................................11.1 What Is Cloud Eye?........................................................................................................................................................11.2 Advantages..................................................................................................................................................................... 21.3 Application Scenarios.....................................................................................................................................................31.4 Service Pricing................................................................................................................................................................31.5 Related Services............................................................................................................................................................. 41.6 Basic Concepts............................................................................................................................................................... 51.7 User Quota Restrictions..................................................................................................................................................6
2 Getting Started............................................................................................................................... 72.1 Monitoring Overview..................................................................................................................................................... 72.2 Server Monitoring...........................................................................................................................................................82.3 Using Website Monitoring..............................................................................................................................................92.4 Resource Groups...........................................................................................................................................................102.5 Basic Monitoring.......................................................................................................................................................... 112.5.1 Querying ECS Basic Metrics.....................................................................................................................................112.5.2 Querying Metrics of Other Cloud Services............................................................................................................... 13
3 Moitoring Panels......................................................................................................................... 163.1 Creating Panels............................................................................................................................................................. 163.2 Adding Graphs..............................................................................................................................................................163.3 Viewing Graphs............................................................................................................................................................ 173.4 Configuring Graphs...................................................................................................................................................... 183.5 Delete Graph.................................................................................................................................................................193.6 Deleting Panels............................................................................................................................................................. 19
4 Resource Groups..........................................................................................................................204.1 Creating Resource Groups............................................................................................................................................204.2 Viewing Resource Groups............................................................................................................................................ 214.2.1 Resource Group List..................................................................................................................................................214.2.2 Resource Overview....................................................................................................................................................224.2.3 Unhealthy Resources................................................................................................................................................. 234.2.4 Alarm Rules...............................................................................................................................................................234.2.5 Alarm History............................................................................................................................................................ 234.3 Managing Resource Groups......................................................................................................................................... 24
Cloud EyeUser Guide Contents
Issue 25 (2018-07-30) Huawei Proprietary and ConfidentialCopyright © Huawei Technologies Co., Ltd.
ii

4.3.1 Modifying Resource Groups..................................................................................................................................... 244.3.2 Deleting Resource Groups.........................................................................................................................................24
5 Server Monitoring....................................................................................................................... 265.1 Agent Features Across Versions................................................................................................................................... 265.2 Installing and Configuring the Agent........................................................................................................................... 275.2.1 Using Cloud-Init to Automatically Install and Configure the Agent (Linux)........................................................... 285.2.2 Installing and Configuring the Agent (Linux)...........................................................................................................305.2.2.1 Adding a DNS Server Address...............................................................................................................................305.2.2.2 Installing the Agent................................................................................................................................................ 335.2.2.3 Manually Configuring the Agent............................................................................................................................355.2.3 Installing and Configuring the Agent (Windows)..................................................................................................... 375.3 Installing Agents in Batches on ECSs Running Linux OSs......................................................................................... 385.4 Managing the Agent..................................................................................................................................................... 415.4.1 Managing the Agent (Linux)..................................................................................................................................... 415.4.2 Managing the Agent (Windows)................................................................................................................................425.5 Installing the GPU and RAID Metric Collection Plug-in.............................................................................................425.6 Viewing Graphs............................................................................................................................................................ 445.7 Creating Alarm Rules................................................................................................................................................... 465.8 Process Monitoring.......................................................................................................................................................48
6 Custom Monitoring.....................................................................................................................52
7 Website Monitoring.................................................................................................................... 537.1 Creating Monitors.........................................................................................................................................................547.2 Creating Alarm Rules................................................................................................................................................... 577.3 Viewing Website Monitoring........................................................................................................................................607.4 Managing Website Monitoring..................................................................................................................................... 607.4.1 Modifying Monitors.................................................................................................................................................. 617.4.2 Disabling Monitors.................................................................................................................................................... 617.4.3 Enabling Monitors..................................................................................................................................................... 617.4.4 Deleting Monitors......................................................................................................................................................61
8 Log Monitoring............................................................................................................................ 628.1 Specifying a Custom Metric Filter............................................................................................................................... 628.2 Viewing Graphs............................................................................................................................................................ 63
9 Event Monitoring.........................................................................................................................649.1 Viewing Graphs............................................................................................................................................................ 649.2 Creating Alarm Rules................................................................................................................................................... 65
10 Viewing Alarm History............................................................................................................ 6810.1 Configuring Data Storage...........................................................................................................................................6810.2 Viewing Raw Data......................................................................................................................................................69
11 Using the Alarm Function........................................................................................................7211.1 Creating Alarm Notification Topics........................................................................................................................... 72
Cloud EyeUser Guide Contents
Issue 25 (2018-07-30) Huawei Proprietary and ConfidentialCopyright © Huawei Technologies Co., Ltd.
iii

11.1.1 Creating Topics........................................................................................................................................................ 7211.1.2 Adding Subscriptions...............................................................................................................................................7411.2 Creating Alarm Rules................................................................................................................................................. 7411.2.1 Using Alarm Templates to Create Alarm Rules...................................................................................................... 7511.2.2 Creating a Custom Alarm Rule for a Specific Metric............................................................................................. 7711.3 Example: Creating an Alarm Rule to Monitor ECS CPU Usage............................................................................... 8011.4 Viewing the Alarm History.........................................................................................................................................81
12 Alarm Rule Management.........................................................................................................8312.1 Modifying Alarm Rules..............................................................................................................................................8312.2 Disabling Alarm Rules............................................................................................................................................... 8512.3 Enabling Alarm Rules................................................................................................................................................ 8512.4 Deleting Alarm Rules................................................................................................................................................. 86
13 Alarm Templates....................................................................................................................... 8713.1 Viewing Alarm Templates.......................................................................................................................................... 8713.2 Creating Custom Templates........................................................................................................................................8713.3 Modifying Custom Templates.................................................................................................................................... 9013.4 Deleting Custom Templates........................................................................................................................................90
14 Auditing Operation Records on Cloud Eye......................................................................... 9114.1 Key Cloud Eye Operations......................................................................................................................................... 9114.2 Viewing Cloud Eye Logs............................................................................................................................................92
15 Services Supported by Cloud Eye.......................................................................................... 9415.1 Computing.................................................................................................................................................................. 9415.1.1 ECS Metrics.............................................................................................................................................................9415.1.2 BMS Metrics............................................................................................................................................................9615.1.2.1 Metrics Under Basic Monitoring..........................................................................................................................9615.1.2.2 OS Monitoring Metrics.........................................................................................................................................9815.1.3 AS Metrics............................................................................................................................................................. 11015.2 Storage...................................................................................................................................................................... 11115.2.1 EVS Metrics...........................................................................................................................................................11215.2.2 OBS Metrics.......................................................................................................................................................... 11215.2.3 SFS Metrics............................................................................................................................................................11315.3 Network.................................................................................................................................................................... 11315.3.1 VPC Metrics.......................................................................................................................................................... 11415.3.2 ELB Metrics...........................................................................................................................................................11415.3.3 NAT Gateway Metrics........................................................................................................................................... 11615.4 Security..................................................................................................................................................................... 11615.4.1 WAF Metrics..........................................................................................................................................................11615.5 Application................................................................................................................................................................11715.5.1 DMS Metrics..........................................................................................................................................................11715.5.2 FunctionGraph Metrics.......................................................................................................................................... 11915.5.3 API Gateway Metrics.............................................................................................................................................119
Cloud EyeUser Guide Contents
Issue 25 (2018-07-30) Huawei Proprietary and ConfidentialCopyright © Huawei Technologies Co., Ltd.
iv

15.6 Database....................................................................................................................................................................12015.6.1 RDS Metrics.......................................................................................................................................................... 12015.6.2 DDS Metrics.......................................................................................................................................................... 12715.6.3 DCS Metrics.......................................................................................................................................................... 13615.6.4 DDM Metrics.........................................................................................................................................................14415.7 Migration.................................................................................................................................................................. 14415.7.1 CDM Metrics.........................................................................................................................................................14415.8 Enterprise Intelligence..............................................................................................................................................14515.8.1 DWS Metrics......................................................................................................................................................... 14515.8.2 MLS Metrics..........................................................................................................................................................14615.8.3 CloudTable Service Metrics.................................................................................................................................. 14715.8.4 AIS Metrics............................................................................................................................................................14915.8.5 Prediction Service Metrics.....................................................................................................................................15315.8.6 Elasticsearch Metrics.............................................................................................................................................15415.9 Enterprise Applications............................................................................................................................................ 15415.9.1 Workspace Metrics................................................................................................................................................ 154
16 Operations Supported by Event Monitoring..................................................................... 156
17 FAQs...........................................................................................................................................16117.1 Concepts................................................................................................................................................................... 16117.1.1 What Is Cloud Eye?...............................................................................................................................................16117.1.2 What Alarm Status Does Cloud Eye Support?......................................................................................................16117.1.3 What Is Rollup?..................................................................................................................................................... 16117.1.4 How Long Is the Metric Data Retained?............................................................................................................... 16217.1.5 How Many Rollup Methods Does Cloud Eye Support?........................................................................................16217.1.6 What Is Server Monitoring?.................................................................................................................................. 16317.1.7 What OSs Does the Agent Support?......................................................................................................................16317.1.8 What ECS Metrics Can Be Monitored by OS Monitoring?.................................................................................. 16417.1.9 How Do I Upgrade the Agent?.............................................................................................................................. 17617.1.10 Why Is the Metric Collection Point Lost During Certain Period of Time?.........................................................17717.2 Usages.......................................................................................................................................................................17717.2.1 What Is an Alarm Notification? How Many Types of Alarm Notifications Exist? How Can I Configure Them?.......................................................................................................................................................................................... 17717.2.2 Why Are the Network Traffic Metrics in Cloud Eye Different from Those Detected in ECS?............................17817.2.3 What Are the Effects on ECS Metrics If vmtools Is Not Installed on ECSs?....................................................... 17817.2.4 How Can I Export Monitoring Data?.................................................................................................................... 17817.2.5 Under What Circumstances Will an Alarm Rule Trigger "Insufficient data"?......................................................17917.2.6 How do I Handle the Garbled CSV File If I Open It with Excel?.........................................................................17917.2.7 Why I Cannot See the Monitoring Data on the Cloud Eye Console After Purchasing Cloud Service Resources?.......................................................................................................................................................................................... 17917.2.8 How Can I Ensure the Newly Purchased ECS Has the OS Monitoring Function?...............................................18017.2.9 Why the Cloud Eye Console Does Not Display the OS Monitoring Data or the Data Display Is Lagged AfterAgent Is Installed and Configured on ECS?.....................................................................................................................181
Cloud EyeUser Guide Contents
Issue 25 (2018-07-30) Huawei Proprietary and ConfidentialCopyright © Huawei Technologies Co., Ltd.
v

17.2.10 What Should I Do if Plug-in Status Is Faulty?.................................................................................................... 18217.2.11 Restoring the Plug-in Configuration....................................................................................................................18217.2.11.1 Servers Without Agency Configured................................................................................................................18217.2.11.2 Current Agency Permission Being Abnormal.................................................................................................. 18417.2.11.3 Current Agency Being Expired.........................................................................................................................18517.2.12 Permission Being Abnormal................................................................................................................................18517.2.13 Agencies Cannot Be Created...............................................................................................................................18517.2.14 Agencies Being Used...........................................................................................................................................18617.2.15 What Should I do If the Service Port Is Used by the Agent?.............................................................................. 186
A Change History......................................................................................................................... 187
Cloud EyeUser Guide Contents
Issue 25 (2018-07-30) Huawei Proprietary and ConfidentialCopyright © Huawei Technologies Co., Ltd.
vi
1 Product Introduction
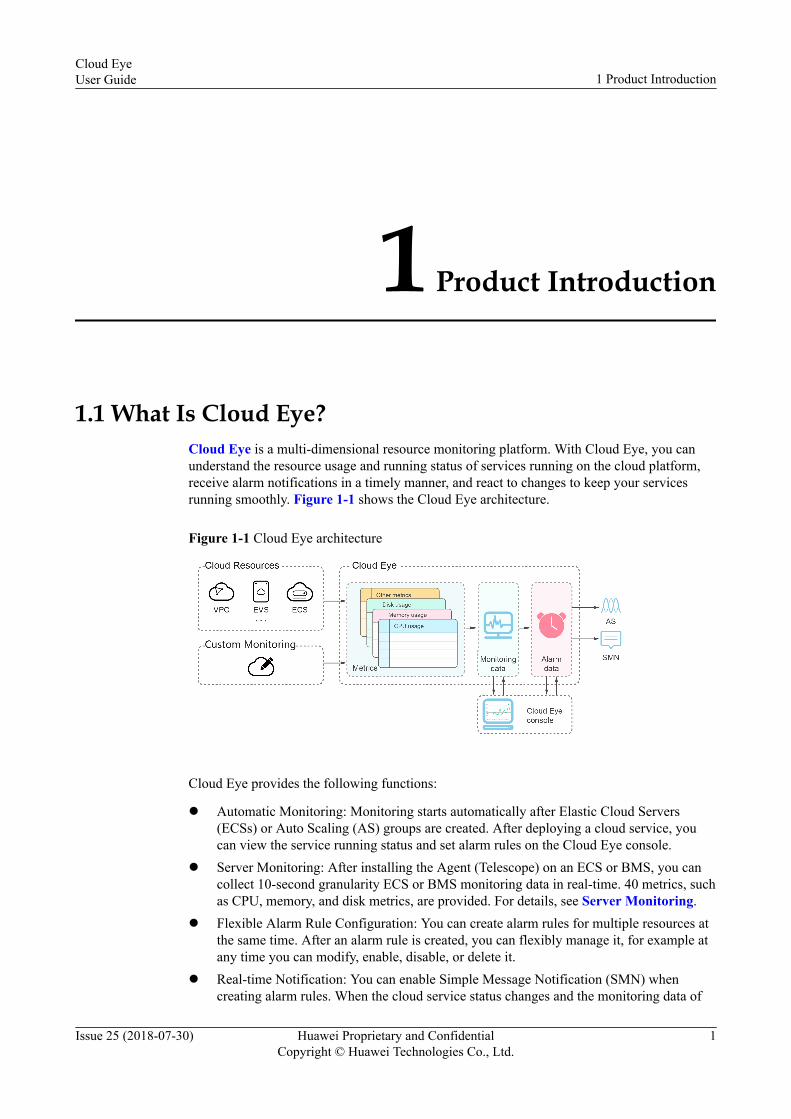
1.1 What Is Cloud Eye?Cloud Eye is a multi-dimensional resource monitoring platform. With Cloud Eye, you canunderstand the resource usage and running status of services running on the cloud platform,receive alarm notifications in a timely manner, and react to changes to keep your servicesrunning smoothly. Figure 1-1 shows the Cloud Eye architecture.
Figure 1-1 Cloud Eye architecture
Cloud Eye provides the following functions:
l Automatic Monitoring: Monitoring starts automatically after Elastic Cloud Servers(ECSs) or Auto Scaling (AS) groups are created. After deploying a cloud service, youcan view the service running status and set alarm rules on the Cloud Eye console.
l Server Monitoring: After installing the Agent (Telescope) on an ECS or BMS, you cancollect 10-second granularity ECS or BMS monitoring data in real-time. 40 metrics, suchas CPU, memory, and disk metrics, are provided. For details, see Server Monitoring.
l Flexible Alarm Rule Configuration: You can create alarm rules for multiple resources atthe same time. After an alarm rule is created, you can flexibly manage it, for example atany time you can modify, enable, disable, or delete it.
l Real-time Notification: You can enable Simple Message Notification (SMN) whencreating alarm rules. When the cloud service status changes and the monitoring data of
Cloud EyeUser Guide 1 Product Introduction
Issue 25 (2018-07-30) Huawei Proprietary and ConfidentialCopyright © Huawei Technologies Co., Ltd.
1

the metric reaches the threshold specified in an alarm rule, Cloud Eye notifies you bytext messages, emails, or by sending messages to server addresses. In this way, you canmonitor the cloud resource status and changes in real time.
l Monitoring Panel: The panel enables you to view cross-service and cross-dimensionmonitoring data. It displays key metrics centrally, providing an overview of the serviceoperating status and allowing monitoring details to be checked when troubleshooting.
l OBS Dump: Raw monitoring data of metrics is kept for only two days on Cloud Eye. Ifyou need permanent data storage, enable Object Storage Service (OBS), and rawmonitoring data will be saved to OBS synchronously and permanently.
l Resource Groups: This function enables management of resources based on services,including management of ECSs, EVS disks, elastic IP addresses, bandwidth, anddatabases. Resources of different types, alarm rules, and alarm history are managedbased on service, helping to improve O&M efficiency.
l Website Monitoring: It simulates real user access to websites and continuously monitorswebsite status, such as availability and connectivity.
l Log Monitoring: It enables you to monitor log content in real time. You can use bothCloud Eye and Log Tank Service (LTS) to collect log content monitoring statistics, setalarm rules for logs, and perform other log-related operations.
1.2 Advantages
Automatic ProvisioningAfter registration on the cloud platform has been completed, Cloud Eye is enabledautomatically. You can view the service running status and set alarm rules on the Cloud Eyeconsole after deploying a cloud service.
Real-time and Reliable MonitoringRaw monitoring data is reported to Cloud Eye in real time to realize real-time monitoring forcloud services.
Alarms are generated and triggered in real time to provide you with real-time notifications.
Visualized MonitoringCloud Eye monitoring panels provide you with rich monitoring graphs, in which dataautomatic refresh and multi-metric comparison are supported, meeting your requirements formonitoring data virtualization.
Various Notification TypesYou can enable the SMN service when creating alarm rules. When the metric data reaches thethreshold specified in an alarm rule, Cloud Eye notifies you by sending emails and textmessages, so that the cloud resource status can be monitored in a timely manner. Cloud Eyecan also send HTTP/HTTPS requests to server addresses, helping you build smart programsto handle alarms.
Alarm Rule Creation in BatchesAlarm templates allow you to quickly create alarm rules for multiple cloud services.
Cloud EyeUser Guide 1 Product Introduction
Issue 25 (2018-07-30) Huawei Proprietary and ConfidentialCopyright © Huawei Technologies Co., Ltd.
2

1.3 Application Scenarios
Web Services
Cloud Eye monitors many metrics, including metrics for CPU, disk I/O, and network traffic,to ensure the reliability of your services.
Applications
You can use APIs to report custom metrics to Cloud Eye.
Optimized O&M
Leveraging flexible alarm rules and notification types of Cloud Eye, you can receive CloudEye notifications for resource changes, and integrate these notification messages to the O&Msystem to resolve the application availability issue and intelligently respond to resourcechanges.
1.4 Service PricingCloud Eye basic functions, such as viewing monitoring panels, creating alarm rules, andadding monitoring items, are free of charge. Cloud Eye may interconnect with other cloudservices to provide you with value-added services such as monitoring data file dump andalarm notification. These value-added services may incur extra fees, which are settled byservices that provide such functions.
Generally, the value-added service fee is low. Therefore, you are advised to use them asrequired.
The following are some value-added services:
l Dumping monitoring data files: Object Storage Service (OBS) is required. The dumpedmonitoring data files are saved permanently.
l Sending an alarm notification: Simple Message Notification (SMN) is required. Whenthe status change of the cloud service triggers the threshold set in the alarm rule, CloudEye sends an email, short message, HTTP, or HTTPS request to notify users.
Value-added services are charged as follows:
l Object Storage Service (OBS)OBS is charged in the pay per use mode or by month/year. You can select a chargingmode based on your actual needs. OBS is charged in the pay per use mode (based on thehourly rate of storage capacity) by default. You can also purchase a monthly/yearlysubscription package to obtain more preferences.Since Cloud Eye frequently accesses the OBS bucket that dumps event files, the OBSbucket of the standard storage type must be selected. For price details, see Product PriceDetails.
l Simple Message Notification (SMN)The SMN service is charged based on text messages, emails, HTTP, and HTTPS. Fordetails about the price, see Product Price Details.
Cloud EyeUser Guide 1 Product Introduction
Issue 25 (2018-07-30) Huawei Proprietary and ConfidentialCopyright © Huawei Technologies Co., Ltd.
3

1.5 Related ServicesOnce you start to use Cloud Eye, the system automatically identifies cloud services enabledon the current cloud platform, captures their key metrics, and reports monitoring data of thesemetrics to Cloud Eye.
At present, Cloud Eye supports automatic monitoring of the following metrics:
Computing
l ECS Metricsl BMS Metrics
NOTE
The Agent is required.
l AS Metrics
Storage
l EVS Metricsl OBS Metricsl SFS Metrics
Network
l VPC Metricsl ELB Metricsl NAT Gateway Metrics
Security
WAF Metrics
Application
l DMS Metricsl FunctionGraph Metricsl API Gateway Metrics
Database
l RDS Metricsl DDS Metricsl DCS Metricsl DDM Metrics
Migration
CDM Metrics
EI Enterprise Intelligence
Cloud EyeUser Guide 1 Product Introduction
Issue 25 (2018-07-30) Huawei Proprietary and ConfidentialCopyright © Huawei Technologies Co., Ltd.
4

l DWS Metricsl MLS Metricsl CloudTable Service Metricsl AIS Metricsl Prediction Service Metricsl Elasticsearch Metrics
Enterprise Application
l Workspace Metrics
1.6 Basic ConceptsThe following concepts are central to your understanding and use of Cloud Eye:
l Metricsl Rollupl Monitoring Panelsl Topicsl Alarm Rulesl Alarm Templates
Metrics
Metrics are the core concept in Cloud Eye. A metric refers to a quantized value of a resourcedimension on the cloud platform, such as the ECS CPU usage and memory usage. A metric isa time-dependent variable that generates a series of monitoring data over time. It helps youunderstand the metric changes over a specified period of time.
Rollup
Rollup is the process in which Cloud Eye calculates the average, maximum, minimum, sum,or variance value based on sample raw data reported by each cloud service in specific periods.The calculation period is called rollup period. Currently, Cloud Eye supports five rollupperiods: 5 minutes, 20 minutes, 1 hour, 4 hours, and 24 hours.
Monitoring Panels
Monitoring panels allow you to view monitoring data of custom metrics of different servicesand dimensions. It displays metrics of key services in a centralized way, so that you can get anoverview of the service running status and check monitoring details when troubleshooting.
Topics
Topics are specified event for message publishing or notification subscription in SMN. Topicsprovide you with one-to-many publish subscription and message notification functions. Youcan send messages to different types of endpoints with only one message request. With SMN,Cloud Eye uses various methods to notify you of cloud service resource changes, helping youtrack running status of cloud services in a timely manner.
Cloud EyeUser Guide 1 Product Introduction
Issue 25 (2018-07-30) Huawei Proprietary and ConfidentialCopyright © Huawei Technologies Co., Ltd.
5

Alarm RulesIn an alarm rule, you can set the threshold for a cloud service metric. When the status (such asAlarm, OK, Insufficient data, and Disabled) of the alarm rule changes, Cloud Eye notifiesyou by sending emails, text messages, or by sending HTTP/HTTPS requests, avoiding serviceloss due to resource problems.
Alarm TemplatesAn alarm template contains one or more alarm rules for a specific service. It can help youquickly create alarm rules for multiple cloud services. This also improves the workingefficiency of the O&M personnel.
1.7 User Quota RestrictionsThe following are user quota restrictions on Cloud Eye.
Table 1-1 User quotas
Quota Type Default Limit
Number of alarm rules that can be created 1000
Number of custom alarm templates that can be created 50
Number of alarm rules that can be added to an alarmtemplate
20
Number of monitoring panels that can be created 10
Number of monitoring items that can be created on amonitoring panel
24
Time that the alarm history can be kept 30 days
Number of topics that can be selected 5
Number of resource groups that can be created 10
Number of monitors that can be created 20
Cloud EyeUser Guide 1 Product Introduction
Issue 25 (2018-07-30) Huawei Proprietary and ConfidentialCopyright © Huawei Technologies Co., Ltd.
6

2 Getting Started
2.1 Monitoring OverviewThe Monitoring Overview page provides the following modules, helping you track theresource usage and alarms in real time.
Resource Overview
Displays the total number of monitored cloud service resources and alarms generated for theseresources in the current account.
Alarm Statistics
Displays the alarm trend for the last seven days and the number of alarms of each severity.
After you click an alarm severity, the Alarm Rules page is displayed, showing all alarm rulesof the corresponding severity.
Server Monitoring
Displays the CPU usage distribution chart of all monitored ECSs and a list of the top 5 ECSs,ranked by their CPU usage over the last 5 minutes.
Clicking on an ECS takes you to the corresponding Basic Monitoring page.
NOTE
To view ECS monitoring data, you need to purchase ECSs. For details, see section Purchasing andLogging In to a Windows ECS and Purchasing and Logging In to a Linux ECS.
Network Monitoring
Displays information about the network speed of the current VPC, displaying the upstreamand downstream bandwidth for the last 5 minutes.
NOTE
To view network monitoring data, you need to apply for a VPC and bind an EIP or bandwidth. Fordetails, see section Creating a VPC.
Cloud EyeUser Guide 2 Getting Started
Issue 25 (2018-07-30) Huawei Proprietary and ConfidentialCopyright © Huawei Technologies Co., Ltd.
7
Storage MonitoringDisplays information about disk usage for the last five minutes by displaying the disk readand write rates in addition to the disk read and write requests.
NOTE
To view storage monitoring data, you need to purchase an EVS disk. For details, see section Purchasingan EVS Disk.
Website MonitoringDisplays website status data, such as availability and connectivity.
Based on data from the last 1 hour, a list of the five slowest websites, ranked by responsetime, is displayed. This helps you better understand the overall website performance andhandle exceptions promptly.
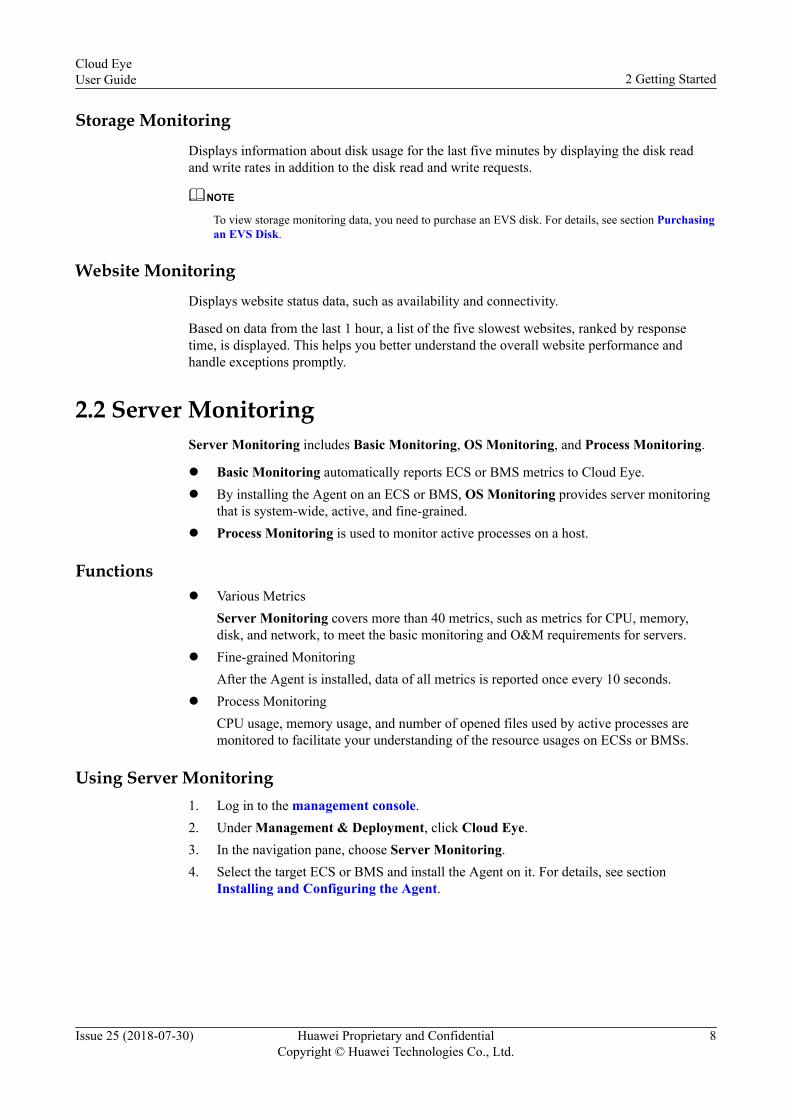
2.2 Server MonitoringServer Monitoring includes Basic Monitoring, OS Monitoring, and Process Monitoring.
l Basic Monitoring automatically reports ECS or BMS metrics to Cloud Eye.l By installing the Agent on an ECS or BMS, OS Monitoring provides server monitoring
that is system-wide, active, and fine-grained.l Process Monitoring is used to monitor active processes on a host.
Functionsl Various Metrics
Server Monitoring covers more than 40 metrics, such as metrics for CPU, memory,disk, and network, to meet the basic monitoring and O&M requirements for servers.
l Fine-grained MonitoringAfter the Agent is installed, data of all metrics is reported once every 10 seconds.
l Process MonitoringCPU usage, memory usage, and number of opened files used by active processes aremonitored to facilitate your understanding of the resource usages on ECSs or BMSs.
Using Server Monitoring1. Log in to the management console.2. Under Management & Deployment, click Cloud Eye.3. In the navigation pane, choose Server Monitoring.4. Select the target ECS or BMS and install the Agent on it. For details, see section
Installing and Configuring the Agent.
Cloud EyeUser Guide 2 Getting Started
Issue 25 (2018-07-30) Huawei Proprietary and ConfidentialCopyright © Huawei Technologies Co., Ltd.
8
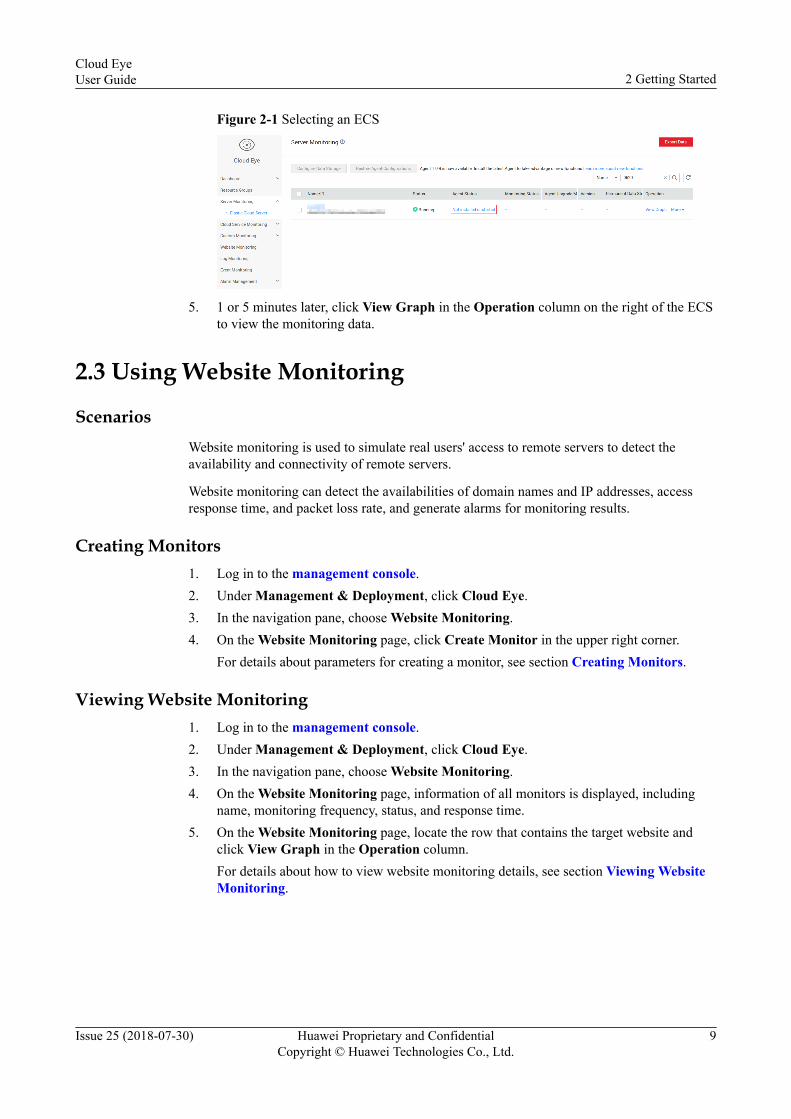
Figure 2-1 Selecting an ECS
5. 1 or 5 minutes later, click View Graph in the Operation column on the right of the ECSto view the monitoring data.
2.3 Using Website Monitoring
ScenariosWebsite monitoring is used to simulate real users' access to remote servers to detect theavailability and connectivity of remote servers.
Website monitoring can detect the availabilities of domain names and IP addresses, accessresponse time, and packet loss rate, and generate alarms for monitoring results.
Creating Monitors1. Log in to the management console.2. Under Management & Deployment, click Cloud Eye.3. In the navigation pane, choose Website Monitoring.4. On the Website Monitoring page, click Create Monitor in the upper right corner.
For details about parameters for creating a monitor, see section Creating Monitors.
Viewing Website Monitoring1. Log in to the management console.2. Under Management & Deployment, click Cloud Eye.3. In the navigation pane, choose Website Monitoring.4. On the Website Monitoring page, information of all monitors is displayed, including
name, monitoring frequency, status, and response time.5. On the Website Monitoring page, locate the row that contains the target website and
click View Graph in the Operation column.For details about how to view website monitoring details, see section Viewing WebsiteMonitoring.
Cloud EyeUser Guide 2 Getting Started
Issue 25 (2018-07-30) Huawei Proprietary and ConfidentialCopyright © Huawei Technologies Co., Ltd.
9

Figure 2-2 View Graph
Figure 2-3 Website Monitoring
2.4 Resource Groups
Scenariosl Managing Resources from the Business Perspective
Resource groups are used to classify resources of cloud accounts by business and querymonitoring and alarm information from the business perspective.
l Routine Inspection and Quick Fault LocatingWith Resource Groups, you can see resource overview, list of unhealthy resources,alarm rules, and alarm history. This feature helps you view cloud resource usage andquickly locate fault resources and causes after receiving notifications.
Functionsl Cross-product resource groups enable you to manage your cloud resources from the
business perspective.l The list of unhealthy resources enables you to quickly locate faults.l The alarm history list helps you track the overall business running status.
Using Resource Groups1. Log in to the management console.2. Under Management & Deployment, click Cloud Eye.
Cloud EyeUser Guide 2 Getting Started
Issue 25 (2018-07-30) Huawei Proprietary and ConfidentialCopyright © Huawei Technologies Co., Ltd.
10

3. In the navigation pane, choose Resource Groups.4. In the upper right corner, click Create Resource Group and enter the group name as
prompted.5. Select the target cloud service resources.6. Click Create.
For details about how to create and manage resource groups, see section ResourceGroups.
2.5 Basic MonitoringCloud Eye monitors metrics of services running on the cloud, helping users fully understandthe resource usages on the cloud platform and to deal with possible problems to avoid servicelosses.
ECSs are the basis of cloud service running. Therefore, tiny changes of ECSs performancemay cause service flapping or even shutdowns. Therefore, Cloud Eye provides ECSs withbasic monitoring and OS monitoring of two different monitoring granularities. For detailsabout the differences between the two types of monitoring, see Table 2-1.
NOTE
Currently, Server Monitoring is available only in CN North-Beijing1 (cn-north-1), CN South-Guangzhou (cn-south-1), and CN East-Shanghai2 (cn-east-2). For other regions, this function will beavailable soon.
Table 2-1 Differences between ECS basic monitoring and OS monitoring
MonitoringType
Monitoring Interval
Metric ApplicationScenarios
Prerequisite
Basicmonitoring
5 minutes Ten metrics such asCPU usage, memoryusage, disk usage,and disk read rate
Routinemonitoring
Automaticmonitoring
OS monitoring 10 seconds 40 metrics such asCPU usage, memoryusage, and diskusage
Service peaks You need toinstall theAgent first.
For other cloud services, Cloud Eye provides detailed and comprehensive metrics based onthe attribute of each cloud service. For example, Cloud Eye monitors upstream bandwidth,downstream bandwidth, upstream traffic, and downstream traffic for VPC.
2.5.1 Querying ECS Basic MetricsCloud Eye automatically associates with and monitors ECSs you purchased. Currently, CloudEye supports ECS basic monitoring and OS monitoring.
l Basic Monitoring is enabled upon the ECS purchase.l OS Monitoring provides system-wide, active, and fine-grained monitoring for ECSs. It
requires an open source plug-in to be installed on the ECSs that will be monitored.
Cloud EyeUser Guide 2 Getting Started
Issue 25 (2018-07-30) Huawei Proprietary and ConfidentialCopyright © Huawei Technologies Co., Ltd.
11

This section describes how to view ECS basic metrics on Cloud Eye.
Using ECS Basic Monitoring1. Log in to the management console.
2. Under Management & Deployment, click Cloud Eye.
3. In the navigation pane on the left, choose Server Monitoring. Locate the target ECS andclick View Monitoring Graph in the Operation column.
4. Click Basic Monitoring.
On the displayed Basic Monitoring page, you can view ECS graphs based on rawmonitoring data collected in the 1h, 3h, or 12h. In the upper right corner of the graph,the maximum and minimum values of the metric in the corresponding time periods aredynamically displayed.
Figure 2-4 Basic Monitoring
NOTE
By default, a maximum of nine graphs can be displayed on one page. If the number of metrics of aservice resource is more than nine, you can click Load more to view more graphs.
Metric units can be changed between byte or byte/s and GB or GB/s on graphs. When you arechanging the unit, if the maximum value of a metric is smaller than 10^ (-5), both the maximumvalue and the minimum value of this metric are 0. In addition, all data displayed on the graph is 0.
5. On the Basic Monitoring page, click Configure Metric.
On the displayed Configure Metric window, select at least one metric. Drag and dropthe selected metrics at desired locations to sort them. This helps you customize metricsto be viewed.
6. If you want to view metric details, click in the upper right corner of the graph.
In the upper left corner, you can see six default monitoring periods: 1h, 3h, 12h, 1d, 7d,and 30d. You can also view the alarm history for any period during the last six monthsby customizing the monitoring period.
In the upper left of the graph, you can click Settings to configure the rollup method.
Cloud EyeUser Guide 2 Getting Started
Issue 25 (2018-07-30) Huawei Proprietary and ConfidentialCopyright © Huawei Technologies Co., Ltd.
12

NOTE
l If 1h, 3h, 12h, or 1d is selected, raw monitoring data is displayed by default.
l If 7d, or 30d is selected, aggregated monitoring data is displayed by default.
Figure 2-5 CPU Usage
2.5.2 Querying Metrics of Other Cloud ServicesCloud Eye provides multiple built-in metrics based on the attribute of each service. After youenabled one cloud service on the cloud platform, the system automatically associates itsmetrics based on the service type. Monitoring of these metrics helps you accurately grasp theservice running status.
This section describes how to view monitoring data of a cloud service resource.
Querying Metrics of Other Cloud Services1. Log in to the management console.2. Under Management & Deployment, click Cloud Eye.3. In the navigation pane on the left, choose Cloud Service Monitoring. Locate the target
resource and click View Monitoring Graph in the Operation column.On the displayed page, you can view ECS graphs based on raw monitoring data collectedin the 1h, 3h, or 12h. In the upper right corner of the graph, the maximum and minimumvalues of the metric in the corresponding time periods are dynamically displayed.
Cloud EyeUser Guide 2 Getting Started
Issue 25 (2018-07-30) Huawei Proprietary and ConfidentialCopyright © Huawei Technologies Co., Ltd.
13

Figure 2-6 Viewing graphs
NOTE
By default, a maximum of nine graphs can be displayed on one page. If the number of metrics of aservice resource is more than nine, you can click Load more to view more graphs.
Metric units can be changed between byte or byte/s and GB or GB/s on graphs. When you arechanging the unit, if the maximum value of a metric is smaller than 10^ (-5), both the maximumvalue and the minimum value of this metric are 0. In addition, all data displayed on the graph is 0.
4. On the Basic Monitoring page, click Configure Metric.On the displayed Configure Metric window, select at least one metric. Drag and dropthe selected metrics at desired locations to sort them. This helps you customize metricsto be viewed.
NOTE
AIS and API Gateway do not support the display of custom metrics.
5. If you want to view metric details, click in the upper right corner of the graph.In the upper left corner, you can see six default monitoring periods: 1h, 3h, 12h, 1d, 7d,and 30d. You can also view the alarm history for any period during the last six monthsby customizing the monitoring period.In the upper left of the graph, you can click Settings to configure the rollup method.
NOTE
l If 1h, 3h, 12h, or 1d is selected, raw monitoring data is displayed by default.
l If 7d or 30d is selected, aggregated monitoring data is displayed by default.
Cloud EyeUser Guide 2 Getting Started
Issue 25 (2018-07-30) Huawei Proprietary and ConfidentialCopyright © Huawei Technologies Co., Ltd.
14

Figure 2-7 Outbound Bandwidth
Cloud EyeUser Guide 2 Getting Started
Issue 25 (2018-07-30) Huawei Proprietary and ConfidentialCopyright © Huawei Technologies Co., Ltd.
15

3 Moitoring Panels
Panels, severing as custom monitoring platforms, allow you to view core metrics and comparethe performance data of different services.
3.1 Creating PanelsYou must create a panel before adding graphs. At present, Cloud Eye supports the creation of10 panels.
Creating Panels1. Log in to the management console.2. Under Management & Deployment, click Cloud Eye.3. In the navigation pane on the left, choose Dashboard > Monitoring Panel and click
Create Panel.The Create Panel page is displayed.
4. Configure Name.Name indicates the panel name, which cannot exceed 128 characters. Only letters, digits,hyphens (-), and underscores (_) are allowed.
3.2 Adding GraphsAfter a panel is created, you can add graphs to the panel to monitor cloud services. Currently,each panel supports a maximum of 24 graphs.
You can add a maximum of 20 metrics to one graph. Monitoring comparison betweendifferent services, dimensions, and metrics is supported.
Procedure1. Log in to the management console.2. Under Management & Deployment, click Cloud Eye.
3. Choose Dashboard > Monitoring Panel, switch to the desired panel, and click orAdd Graph.
Cloud EyeUser Guide 3 Moitoring Panels
Issue 25 (2018-07-30) Huawei Proprietary and ConfidentialCopyright © Huawei Technologies Co., Ltd.
16

The Add Graph window is displayed.
Figure 3-1 Add Graph
4. Set parameters based on Table 3-1.
NOTE
When adding graphs, you must specify Resource Type, Dimension, Monitored Object, andMetric one by one from left to right.
Table 3-1 Parameters
Parameter Description Example Value
Title Specifies the title of the customizedmetric you followed. Only letters,digits, underscores (_), and hyphens(-).
The value is specifiedby the user.
Resource Type Specifies the service to be monitored. Elastic Cloud Server
Dimension Specifies the metric dimension. ECS
Monitored Object Specifies the object to be monitored.You can select multiple monitoringobjects at a time.
N/A
Metric Specifies the metric name. CPU Usage
5. Click OK.
On the panel, you can view the trends of the new graph. If you click , you can viewdetailed metric data comparison.
3.3 Viewing GraphsOn the graph you have added, you can view trends from last 3 hours. The system providesyou both default and customizable time ranges to view trends from last month. This sectiondescribes how to view trends from a longer time range.
Cloud EyeUser Guide 3 Moitoring Panels
Issue 25 (2018-07-30) Huawei Proprietary and ConfidentialCopyright © Huawei Technologies Co., Ltd.
17

Procedure1. Log in to the management console.2. Under Management & Deployment, click Cloud Eye.3. Choose Dashboard > Monitoring Panels. On the page displayed, you can view all
graphs on the current monitoring panel.
NOTE
You can sort graphs by dragging them based on service requirements.
4. In the upper right corner of the graph, click to view monitoring details on an enlargedgraph. You can select from the provided time durations or customize a time range toview the metric trend in a specific monitoring interval.If you select 1h, the system displays raw data from the last hour by default; if you selectany of other provided time durations, the system displays rollup data.
Figure 3-2 Viewing graphs
NOTE
Custom time ranges can cover up to one week.
In the lower part of the graph, metrics with brief descriptions are displayed in a list by default.You can click a metric to hide its trend; clicking the metric again displays its trend.
NOTE
Trends on the graph are automatically refreshed every 60 seconds. You need to enable the automaticrefresh function on the Monitoring Panel page.
3.4 Configuring GraphsThis section describes how to add, modify, and delete metrics on graphs.
Procedure1. Log in to the management console.
2. Click in the upper left to select a region and a project.
Cloud EyeUser Guide 3 Moitoring Panels
Issue 25 (2018-07-30) Huawei Proprietary and ConfidentialCopyright © Huawei Technologies Co., Ltd.
18
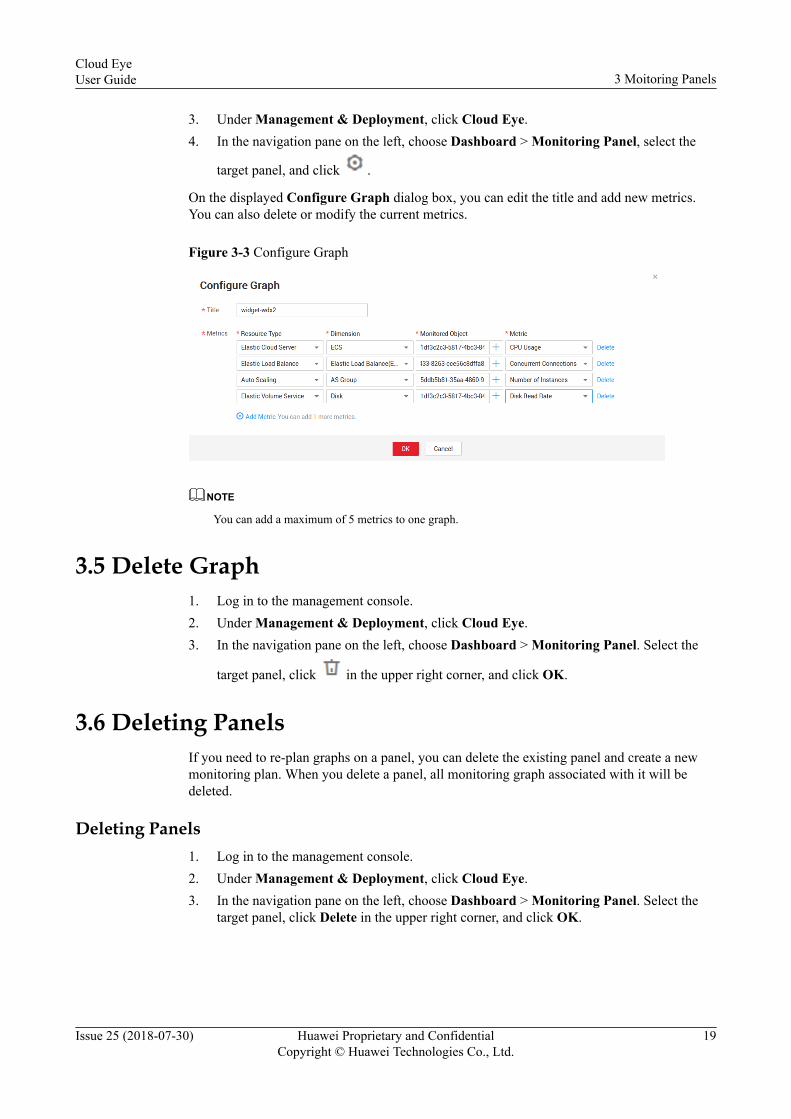
3. Under Management & Deployment, click Cloud Eye.4. In the navigation pane on the left, choose Dashboard > Monitoring Panel, select the
target panel, and click .
On the displayed Configure Graph dialog box, you can edit the title and add new metrics.You can also delete or modify the current metrics.
Figure 3-3 Configure Graph
NOTE
You can add a maximum of 5 metrics to one graph.
3.5 Delete Graph1. Log in to the management console.2. Under Management & Deployment, click Cloud Eye.3. In the navigation pane on the left, choose Dashboard > Monitoring Panel. Select the
target panel, click in the upper right corner, and click OK.
3.6 Deleting PanelsIf you need to re-plan graphs on a panel, you can delete the existing panel and create a newmonitoring plan. When you delete a panel, all monitoring graph associated with it will bedeleted.
Deleting Panels1. Log in to the management console.2. Under Management & Deployment, click Cloud Eye.3. In the navigation pane on the left, choose Dashboard > Monitoring Panel. Select the
target panel, click Delete in the upper right corner, and click OK.
Cloud EyeUser Guide 3 Moitoring Panels
Issue 25 (2018-07-30) Huawei Proprietary and ConfidentialCopyright © Huawei Technologies Co., Ltd.
19

4 Resource Groups
Resource groups enable service-based resource management, including management of ECSs,EVS disks, elastic IP addresses, bandwidths, and databases. Resources of different types,alarm rules, and alarm history are managed based on service, which helps to improve O&Mefficiency.
4.1 Creating Resource Groups
Scenarios
Users who use multiple cloud products can use the resource group function to add allresources, such as ECSs, BMSs, EVS disks, elastic IP addresses, bandwidths, and databasesfor one business to the same resource group. Then, you can manage resources and alarm rulesbased on group to greatly reduce O&M complexity and increase O&M efficiency.
Restrictionsl Each user can create a maximum of 10 resource groups.l A resource group can contain a maximum of 200 resources.l The resource group has the following restrictions on different types of resources:
– ECS: 200– BMS: 100– EVS disk: 200– VPC: 50 each for Elastic IP addresses and bandwidth– RDS: 50 for each type of database
Procedure1. Log in to the management console.
2. Click in the upper left to select a region and a project.3. Under Management & Deployment, click Cloud Eye.4. In the navigation pane on the left, choose Resource Groups.
Cloud EyeUser Guide 4 Resource Groups
Issue 25 (2018-07-30) Huawei Proprietary and ConfidentialCopyright © Huawei Technologies Co., Ltd.
20

5. In the upper right corner, click Create Resource Group.
Figure 4-1 Create Resource Group
6. Specify a name for the group.7. Select the target cloud service resources.
Figure 4-2 Selecting cloud service resources
NOTE
For ECS or BMS, search by name or ID is supported. Other cloud services can be searched onlyby ID.
8. Click Create.
4.2 Viewing Resource Groups
4.2.1 Resource Group ListThe resource group list displays all resource groups you have on Cloud Eye as well as theresources contained in and health status of each group.
Procedure1. Log in to the management console.
Cloud EyeUser Guide 4 Resource Groups
Issue 25 (2018-07-30) Huawei Proprietary and ConfidentialCopyright © Huawei Technologies Co., Ltd.
21
2. Click in the upper left to select a region and a project.3. Under Management & Deployment, click Cloud Eye.4. In the navigation pane on the left, choose Resource Groups.
On the Resource Groups page, you can view all the resource groups that have beencreated.
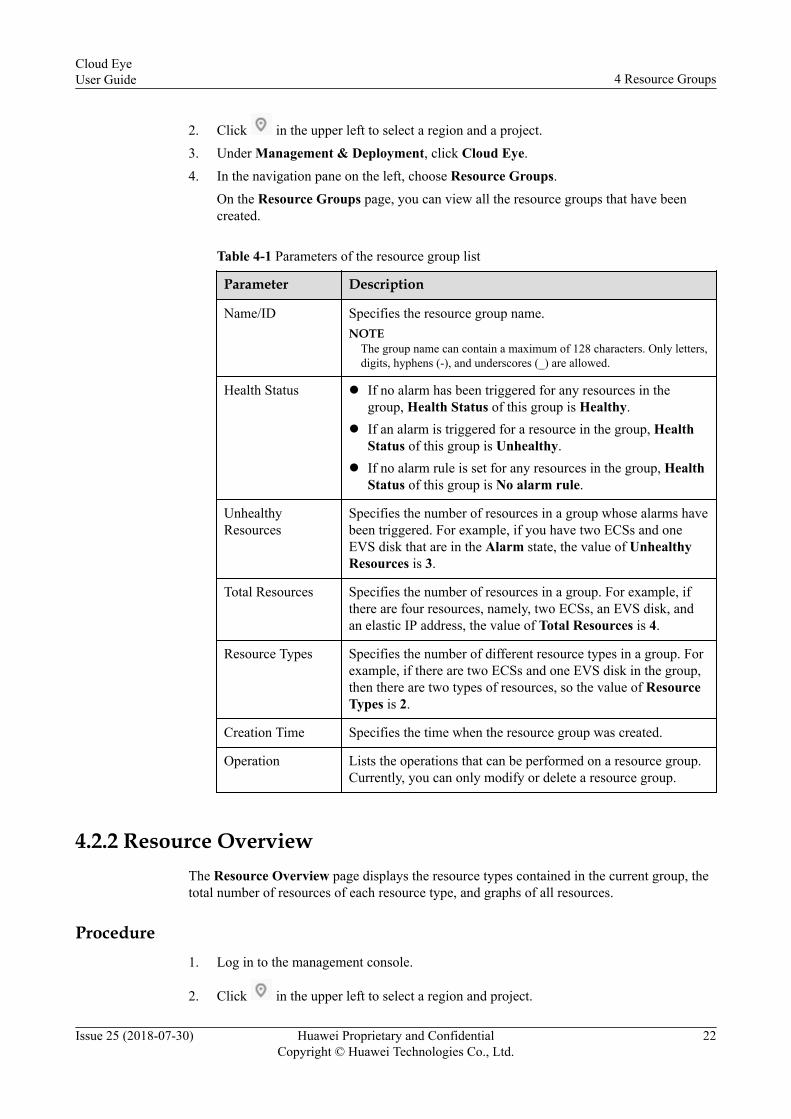
Table 4-1 Parameters of the resource group list
Parameter Description
Name/ID Specifies the resource group name.NOTE
The group name can contain a maximum of 128 characters. Only letters,digits, hyphens (-), and underscores (_) are allowed.
Health Status l If no alarm has been triggered for any resources in thegroup, Health Status of this group is Healthy.
l If an alarm is triggered for a resource in the group, HealthStatus of this group is Unhealthy.
l If no alarm rule is set for any resources in the group, HealthStatus of this group is No alarm rule.
UnhealthyResources
Specifies the number of resources in a group whose alarms havebeen triggered. For example, if you have two ECSs and oneEVS disk that are in the Alarm state, the value of UnhealthyResources is 3.
Total Resources Specifies the number of resources in a group. For example, ifthere are four resources, namely, two ECSs, an EVS disk, andan elastic IP address, the value of Total Resources is 4.
Resource Types Specifies the number of different resource types in a group. Forexample, if there are two ECSs and one EVS disk in the group,then there are two types of resources, so the value of ResourceTypes is 2.
Creation Time Specifies the time when the resource group was created.
Operation Lists the operations that can be performed on a resource group.Currently, you can only modify or delete a resource group.
4.2.2 Resource OverviewThe Resource Overview page displays the resource types contained in the current group, thetotal number of resources of each resource type, and graphs of all resources.
Procedure1. Log in to the management console.
2. Click in the upper left to select a region and project.
Cloud EyeUser Guide 4 Resource Groups
Issue 25 (2018-07-30) Huawei Proprietary and ConfidentialCopyright © Huawei Technologies Co., Ltd.
22
3. Under Management & Deployment, click Cloud Eye.4. In the navigation pane on the left, choose Resource Groups.5. Click a group name in the resource group list to go to the Resource Overview page.
4.2.3 Unhealthy ResourcesUnhealthy Resources includes all resources in the Alarm state in a group. This featureenables you to quickly view all unhealthy resources and promptly handle faults.
Procedure1. Log in to the management console.
2. Click in the upper left to select a region and a project.3. Under Management & Deployment, click Cloud Eye.4. In the navigation pane on the left, choose Resource Groups.5. Click a group name in the resource group list to go to the Resource Overview page.6. In the navigation pane on the left, click Unhealthy Resources to view all resources in
the resource group whose alarms have been triggered.
4.2.4 Alarm RulesAlarm Rules displays all alarm rules in the resource group. You can enable, disable, modify,or delete specified alarm rules in the alarm rule list.
Procedure1. Log in to the management console.
2. Click in the upper left to select a region and project.3. Under Management & Deployment, click Cloud Eye.4. In the navigation pane on the left, choose Resource Groups.5. Click a group name in the resource group list to go to the corresponding Resource
Overview page.6. In the navigation pane on the left, click Alarm Rules to view all alarm rules for the
resource group.
4.2.5 Alarm HistoryAlarm History displays the alarm history of all alarm rules in a resource group.
Procedure1. Log in to the management console.
2. Click in the upper left to select a region and project.3. Under Management & Deployment, click Cloud Eye.4. In the navigation pane on the left, choose Resource Groups.5. Click a group name in the resource group list to go to the Resource Overview page.
Cloud EyeUser Guide 4 Resource Groups
Issue 25 (2018-07-30) Huawei Proprietary and ConfidentialCopyright © Huawei Technologies Co., Ltd.
23

6. In the navigation pane on the left, click Alarm History to view the alarm history for allresources in the resource group.
4.3 Managing Resource GroupsIf your cloud service requirements change as your business develops, you may need to modifythe resources in a resource group.
This section describes how to modify or delete resource groups.
4.3.1 Modifying Resource Groups
Procedure1. Log in to the management console.
2. Click in the upper left to select a region and a project.3. Under Management & Deployment, click Cloud Eye.4. In the navigation pane on the left, choose Resource Groups.5. Locate the row containing the target resource group and click Modify in the Operation
column.
Figure 4-3 Modifying a resource group
6. Follow the prompts to modify the group.7. Click Modify.
4.3.2 Deleting Resource Groups
Procedure1. Log in to the management console.
2. Click in the upper left to select a region and a project.3. Under Management & Deployment, click Cloud Eye.4. In the navigation pane on the left, choose Resource Groups.5. Locate the row containing the target resource group and click Delete in the Operation
column.
Figure 4-4 Deleting a resource group
Cloud EyeUser Guide 4 Resource Groups
Issue 25 (2018-07-30) Huawei Proprietary and ConfidentialCopyright © Huawei Technologies Co., Ltd.
24

6. Click OK.
Cloud EyeUser Guide 4 Resource Groups
Issue 25 (2018-07-30) Huawei Proprietary and ConfidentialCopyright © Huawei Technologies Co., Ltd.
25

5 Server Monitoring
Server Monitoring includes Basic Monitoring and OS Monitoring. Basic Monitoringmonitors those metrics automatically reported by ECSs. By installing the Agent on an ECS orBMS, OS Monitoring provides server monitoring that is system-wide, active, and fine-grained. In this document, "fine-grained" indicates that data is collected at 10-secondintervals.
NOTE
l Both Windows and Linux OSs are supported. For details, see What System Does the AgentSupport?
l Only CN North-Beijing1 (cn-north-1), CN South-Guangzhou (cn-south-1), and CN East-Shanghai2(cn-east-2) are supported now.
l For the ECS specifications, you are recommended to use the 2-core and 2-GB ECS or ECS withhigher specifications.
l The Agent will occupy system ports. For details, see descriptions of ClientPort and PortNum insection 5.2.2.3 Manually Configuring the Agent. If the Agent port is in conflict with a service port,check What Should I do If the Service Port Is Used by the Agent?
Application Scenarios
Whether you are using ECSs or BMSs, you can use server monitoring to track various OSmetrics. You can also use this function to monitor server resource usage and query monitoringdata when faults occur.
Monitoring Capabilities
Server monitoring provides more than 40 metrics, such as metrics for CPU, memory, disk,and network, to meet the basic monitoring and O&M requirements of servers.
5.1 Agent Features Across VersionsMetrics or functions supported by different versions of Agents provided by Cloud Eye aredifferent.
Version 1.0.11l The Agent can be installed to a specified directory.
Cloud EyeUser Guide 5 Server Monitoring
Issue 25 (2018-07-30) Huawei Proprietary and ConfidentialCopyright © Huawei Technologies Co., Ltd.
26

l Ports can be specified for the Agent.l OS Monitoring can monitor the read and write status of files systems. For details, see
What Metrics Can Be Monitored by OS Monitoring?
Version 1.0.8BMS OS Monitoring metrics are added.
Version 1.0.7The Agent supports CTS to collect OS logs.
Version 1.0.6l The Agent support the Windows OS. For details, see What OS Does the Agent
Support?l The function of restoring configurations of plug-ins in batches is added.l Metrics for Process Monitoring are added.
Version 1.0.5l The ECS Monitoring page is replaced by the Server Monitoring page.l Fine-grained monitoring for BMS is added.l OS Monitoring can monitor CPU load metrics. For details, see What Metrics Can Be
Monitored by OS Monitoring?
Version 1.0.4OS Monitoring can monitor GPU and disk metrics. For details, see What Metrics Can BeMonitored by OS Monitoring?
NOTE
To view GPU metrics, you need to install the plug-in for collecting GPU metrics. For details, see section5.5 Installing the GPU and RAID Metric Collection Plug-in.
Version 1.0.3OS Monitoring can monitor CPU load metrics. For details, see What Metrics Can BeMonitored by OS Monitoring?
Version 1.0.2l OS Monitoring can monitor NIC metrics. For details, see What Metrics Can Be
Monitored by OS Monitoring?l The process monitoring function is added. For details, see section 3.6 Process
Monitoring.
5.2 Installing and Configuring the AgentYou need to use Cloud-Init to install and configure the Agent for the newly purchased serversand manually install the Agent for the existing servers.
Cloud EyeUser Guide 5 Server Monitoring
Issue 25 (2018-07-30) Huawei Proprietary and ConfidentialCopyright © Huawei Technologies Co., Ltd.
27

l For details about the automatic installation of the Agent, see section 5.2.1 Using Cloud-Init to Automatically Install and Configure the Agent (Linux).
l For servers running the Linux OS, see section 5.2.2 Installing and Configuring theAgent (Linux).
l For servers running the Windows OS, see section 5.2.3 Installing and Configuring theAgent (Windows).
5.2.1 Using Cloud-Init to Automatically Install and Configure theAgent (Linux)
ScenariosThis section describes how to use Cloud-Init to install the Agent on an ECS.
NOTE
Currently, the Agent cannot be automatically installed on BMSs.
Prerequisitesl The DNS address of the VPC subnet has been changed and the security group has been
configured. The DNS server address has been added for the purchased ECS. For details,see section 5.2.2.1 Adding a DNS Server Address.
l You have downloaded cloudinit_conf_template.txt from http://obs.myhwclouds.com/telescope/agent/.
Procedure1. Log in to the management console.2. Under Computing, click Elastic Cloud Server.3. In the upper corner of the displayed page, click Buy ECS.4. On the displayed page, configure ECS parameters.
– Image: See What System Does the Agent Support?– VPC: Select a VPC that has already been configured with a DNS.
Cloud EyeUser Guide 5 Server Monitoring
Issue 25 (2018-07-30) Huawei Proprietary and ConfidentialCopyright © Huawei Technologies Co., Ltd.
28

Figure 5-1 Parameters
5. Login Mode: Select Key pair.6. Expand Advanced Settings. In the User Data Injection area, enter the configured
cloud-config information. The purpose is to use Cloud-Init to fully automate the Agentinstallation and configuration after the ECS is created.For values of the ProjectId, AccessKey, SecretKey, and RegionId parameters, seeTable 5-3. For details about the Agent download address, see Table 5-2.#cloud-configwrite_files: - path: /home/linux/userInfo.txt content: | { "ProjectId": "xxxxxxxxxxxxxxxxxxxxxxxxxxxxxxxx", "AccessKey": "XXXXXXXXXXXXXXXXXXXX", "SecretKey": "XXXXXXXXXXXXXXXXXXXXXXXXXXXXXXXXXXXXXXXX", "RegionId": "cn-north-1" }
runcmd: - cd /usr/local/ && wget http://obs.myhwclouds.com/telescope/agent/telescope_linux_amd64.tar.gz && tar -zxvf telescope_linux_amd64.tar.gz - chmod 755 /usr/local/telescope_linux_amd64/install.sh && /usr/local/telescope_linux_amd64/install.sh - mv /home/linux/userInfo.txt /usr/local/telescope/bin/conf.json - cd /usr/local/ && wget http://169.254.169.254/openstack/latest/meta_data.json - cat meta_data.json | python -c 'import json,sys;uuid=json.load(sys.stdin)["uuid"];print (uuid)' > instanceId - if [ ! -s instanceId ]; then cat meta_data.json | python3 -c 'import json,sys;uuid=json.load(sys.stdin)["uuid"];print (uuid)' > instanceId;fi - sed -i "2i \ \"InstanceId\":\"$(cat instanceId)\"," /usr/local/telescope/bin/conf.json - rm /usr/local/meta_data.json /usr/local/instanceId
Cloud EyeUser Guide 5 Server Monitoring
Issue 25 (2018-07-30) Huawei Proprietary and ConfidentialCopyright © Huawei Technologies Co., Ltd.
29

Figure 5-2 User Data Injection
7. Click Buy Now.8. After the ECS is created, wait for ten minutes, during which you may need to perform
some initialization configuration. On the Cloud Eye console, choose Server Monitoringin the navigation pane on the left. You should see that the ECS Plug-in Status isRunning. Enable the Monitoring Status switch, and the Agent begins to collect fine-grained monitoring data.
9. 3 or 5 minutes later, check the fine-grained monitoring data.
5.2.2 Installing and Configuring the Agent (Linux)
5.2.2.1 Adding a DNS Server Address
ScenariosThis section describes how to add a DNS server address to an ECS or BMS.
NOTE
DNS resolution and security group configuration are intended for the primary NIC.
Procedure1. Log in to the ECS or BMS as user root.2. Add the DNS server address to the resolv.conf file.
a. Run the vi /etc/resolv.conf command to open the file.b. Add the DNS server address, for example, nameserver 100.125.1.250 to the file
and save the setting.
Figure 5-3 Adding the DNS server address
Cloud EyeUser Guide 5 Server Monitoring
Issue 25 (2018-07-30) Huawei Proprietary and ConfidentialCopyright © Huawei Technologies Co., Ltd.
30

NOTE
The value of nameserver varies depending on the region.
CN North-Beijing1: 100.125.1.250 and 100.125.21.250
CN East-Shanghai2: 100.125.17.29 and 100.125.135.29
CN South-Guangzhou: 100.125.1.250 and 100.125.136.29
3. On the management console, modify the DNS server address used by the subnet of theECS.
a. Click in the upper left to select a region and a project.b. Under Service List, choose Computing > Elastic Cloud Server.
On the ECS console, click the name of the target ECS to view its details.c. Click vpc-ces next to VPC to go to the VPC console.
Figure 5-4 VPC
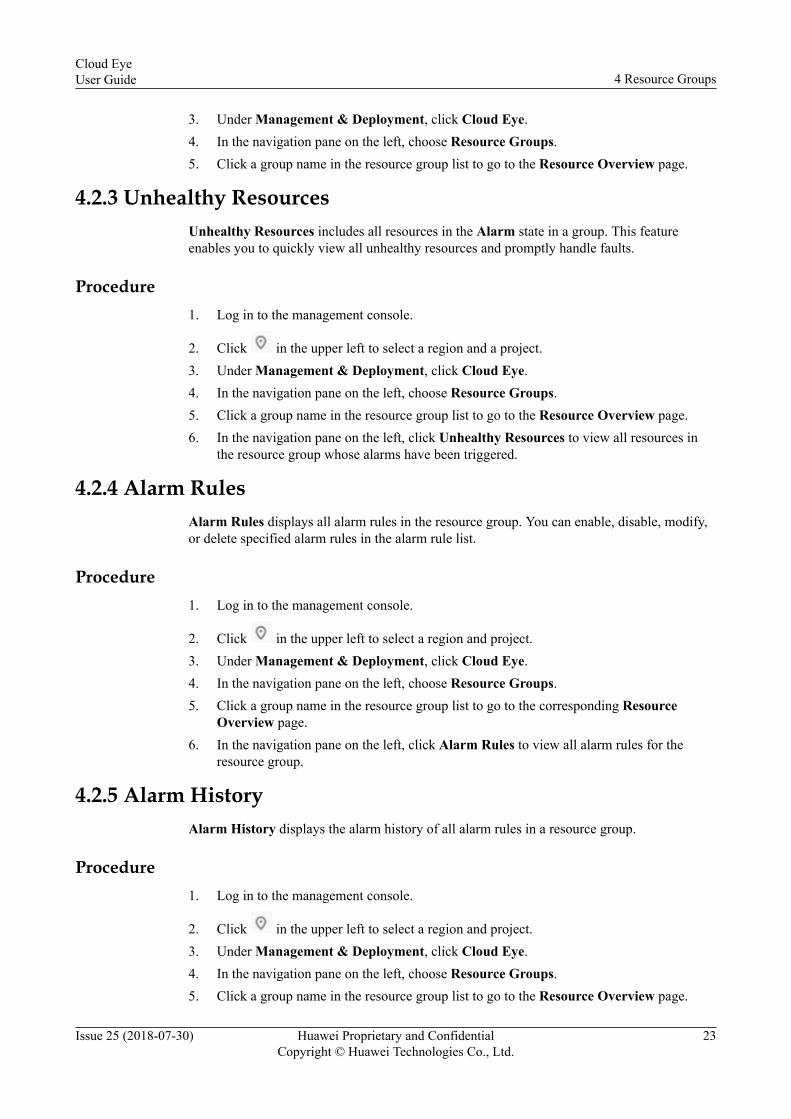
d. In the VPC list, click vpc-ces.e. In the Subnets list, locate the row that contains subnet-3e3b and click Modify in
the Operation column.On the displayed Modify Subnet dialog box, change the value of DNS ServerAddress 1 to 100.125.1.250.
NOTE
subnet-3e3b is the ECS subnet.
The IP address of the DNS server must be the same as the value of nameserver in step 2.
Cloud EyeUser Guide 5 Server Monitoring
Issue 25 (2018-07-30) Huawei Proprietary and ConfidentialCopyright © Huawei Technologies Co., Ltd.
31
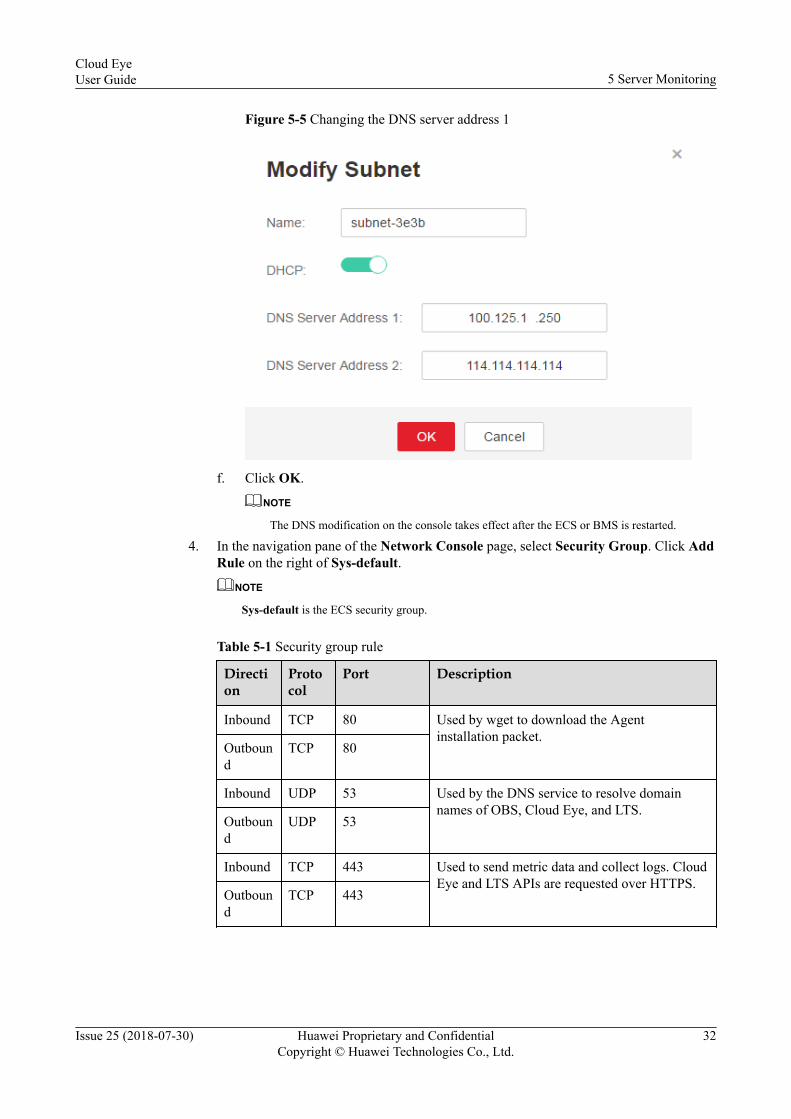
Figure 5-5 Changing the DNS server address 1
f. Click OK.
NOTE
The DNS modification on the console takes effect after the ECS or BMS is restarted.
4. In the navigation pane of the Network Console page, select Security Group. Click AddRule on the right of Sys-default.
NOTE
Sys-default is the ECS security group.
Table 5-1 Security group rule
Direction
Protocol
Port Description
Inbound TCP 80 Used by wget to download the Agentinstallation packet.
Outbound
TCP 80
Inbound UDP 53 Used by the DNS service to resolve domainnames of OBS, Cloud Eye, and LTS.
Outbound
UDP 53
Inbound TCP 443 Used to send metric data and collect logs. CloudEye and LTS APIs are requested over HTTPS.
Outbound
TCP 443
Cloud EyeUser Guide 5 Server Monitoring
Issue 25 (2018-07-30) Huawei Proprietary and ConfidentialCopyright © Huawei Technologies Co., Ltd.
32

5.2.2.2 Installing the Agent
ScenariosThis section describes how to manually install the Agent on an ECS or BMS.
Prerequisitesl You have modified the DNS server address on a subnet and configured a security group.
For details, see section 5.2.2.1 Adding a DNS Server Address.l Ensure that the installation directories in Procedure have the read and write permissions,
and that the Telescope process is not stopped by other software after the installation.
Procedure1. Log in to the ECS or BMS as user root.2. Select and switch to the download path of the Agent installation package. Take /usr/local
as an example and run the following command:cd /usr/local
3. Take the Linux 64-bit installation package as an example and run the followingcommand to download the Agent:wget http://obs.myhwclouds.com/telescope/agent/telescope_linux_amd64.tar.gz
Table 5-2 Installation package path
Name Format
How to Obtain
Linux 64-bitinstallation package
tar.gz Download pathsCN North-Beijing1: http://obs.myhwclouds.com/telescope/agent/telescope_linux_amd64.tar.gzCN South-Guangzhou: http://telescope-cn-south-1.obs.myhwclouds.com/agent/telescope_linux_amd64.tar.gzCN East-Shanghai2: http://telescope-cn-east-2.obs.myhwclouds.com/agent/telescope_linux_amd64.tar.gz
4. Run the following command to decompress the installation package:
tar -zxvf telescope_linux_amd64.tar.gzThe decompression is successful if the system displays the following information.
Cloud EyeUser Guide 5 Server Monitoring
Issue 25 (2018-07-30) Huawei Proprietary and ConfidentialCopyright © Huawei Technologies Co., Ltd.
33

Figure 5-6 Successful decompression
5. Run the following command to go to directory where the installation package isdecompressed:cd telescope_linux_amd64
6. Run the following command to install the Agent:chmod 755 install.sh; ./install.shThe installation is successful if the system displays the following information.
Figure 5-7 Successful installation
NOTE
l The default installation path of the Agent is /usr/local/telescope. After the ./install.shcommand is executed successfully, the Agent is automatically installed in this path. To specifythe installation path, run the following command: chmod 755 install.sh; ./install.sh XXX
l If no command output is displayed after the installation, you need to manually start the Agent.For details, see Starting the Agent.
l On ECSs running CentOS, OpenSUSE, Ubuntu, Debian, or Euler OSs, the Agent can be set torun automatically at startup. For ECSs running other OSs, after successfully installing theAgent, you need to manually start the Agent. For details, see Starting the Agent.
l After the Agent is configured, its status is still displayed as Uninstalled because themonitoring data is not reported. Wait 3 to 5 minutes and refresh the page.
7. After the installation is complete, go to the Server Monitoring page. Locate the targetECSs and click Restore Agent Configurations. On the displayed page, click One-ClickRestore to complete the configuration.If you need to manually configure the Agent, see section 5.2.2.3 Manually Configuringthe Agent.
Cloud EyeUser Guide 5 Server Monitoring
Issue 25 (2018-07-30) Huawei Proprietary and ConfidentialCopyright © Huawei Technologies Co., Ltd.
34

Figure 5-8 Restore Agent Configurations
NOTE
Restore Agent Configurations is applicable to Agent 1.0.5 or later. If the Agent version is earlierthan 1.0.5, upgrade the Agent first and then restore the Agent configurations or manuallyconfigure the Agents based on section 5.2.2.3 Manually Configuring the Agent.
Restore Agent Configurations does not support BMSs.
5.2.2.3 Manually Configuring the Agent
Scenarios
After successfully installing the Agent, you need to modify related configuration files toreport monitoring data and heartbeat data.
Prerequisites
The Agent has been installed.
Procedure1. Log in to an ECS as user root.
2. Run the following command to go to the bin directory of the Agent installation package:
cd /usr/local/telescope/bin
3. Modify the configuration file conf.json.
a. Run the following command to open conf.json:
vi conf.json
b. Modify the parameters in the file. For details, see Table 5-3.{ "InstanceId":"xxxxxxxx-xxxx-xxxx-xxxx-xxxxxxxxxxxx", "ProjectId": "b5b92ee0xxxxxxxxxxxxxxxxcab92396", "AccessKey": "QZ0XGJXFxxxxxxxxT65R", "SecretKey": "lEv2aXAGwxxxxxxxxxxxxxxxxxxxxF8t0Bf18Tn2", "RegionId": "cn-north-1", "ClientPort": 5000, "PortNum": 200}
Cloud EyeUser Guide 5 Server Monitoring
Issue 25 (2018-07-30) Huawei Proprietary and ConfidentialCopyright © Huawei Technologies Co., Ltd.
35

Table 5-3 Public parameters
Parameter Description
InstanceId Specifies the ECS ID. You can log in to the management consoleand view the ECS ID in the ECS list.NOTE
l You do not need to configure InstanceId. Retain "InstanceId":"". Ifyou choose to configure InstanceId, see the following instructions:
l The ECS ID must be unique in all sites, that is, in the same region,InstanceId used by the Agent cannot be the same. Otherwise, errorsmay occur.
l The InstanceId value must be consistent with the actual ECS ID.Otherwise, you cannot see the OS Monitoring data on Cloud Eye.
ProjectId Specifies the project ID. You do not need to configure ProjectId.Retain "ProjectId": "". If you do wish to configure it, a projectID can be obtained by performing the following steps:1. Log in to the Cloud Eye console, click the username in the
upper right corner, and select My Credential.2. Under Project List, view the ECS project ID in the
corresponding region.
AccessKey/SecretKey
Specifies the Access Keys, which can be obtained by performingthe following operations:Log in to the Cloud Eye console, click the username in the upperright corner, select My Credential, and click Access Keys.l If you have obtained the access key, obtain the AccessKey
value and the SecretKey value in the credentials.csv file savedwhen you create Access Keys.
l If Access Keys is not available, you can click Add Access Keyto create one. Save the credentials.csv file and obtain theAccessKey value and the SecretKey value in it.NOTICE
l For the security purpose, you are advised to use an IAM usernamewith the CES Administrator and LTS Administrator permissions.For details, see section Creating and Authorizing a User Groupand section Creating an IAM User and Adding It to a UserGroup.
l The configured access key must be within the Access Keys list onthe My Credential page. Otherwise its authentication will fail andyou cannot view OS Monitoring data on Cloud Eye.
RegionId Specifies the region ID. For example, if the ECS is in the CNNorth-Beijing1 region, the value of RegionId is cn-north-1. Forregion IDs of other regions, log in at https://developer.huaweicloud.com/endpoint.html.
ClientPort Start port number used by the AgentNOTE
The default value is 0, indicating that the Agent will randomly use any port.Ports 1 to 1023 are reserved. You are advised not to specify a port in thisrange for the Agent.
Cloud EyeUser Guide 5 Server Monitoring
Issue 25 (2018-07-30) Huawei Proprietary and ConfidentialCopyright © Huawei Technologies Co., Ltd.
36

Parameter Description
PortNum Number of ports configured for the AgentNOTE
The default value is 200. If the value of ClientPort is 5000, the port rangewill be 5000 to 5199.
4. Modify configuration file conf_ces.json for the Cloud Eye metric collection module.
a. Run the following command to open public configuration file conf_ces.json:vi conf_ces.json
b. Modify the parameter in the file. For details, see Table 5-4.{ "Endpoint": "https://ces.cn-north-1.myhuaweicloud.com"}
Table 5-4 Parameter setting of the metric collection module
Parameter Description
Endpoint Specifies the Cloud Eye endpoint URL in the region of theECS. For example, if the ECS is in the CN North-Beijing1region, the URL is ces.cn-north-1.myhuaweicloud.com. Forthe endpoint values of other regions, log in at https://developer.huaweicloud.com/endpoint.html.
NOTE
After the Agent is configured, its status is still displayed as Uninstalled because themonitoring data is not reported. Wait 3 to 5 minutes and refresh the page.
5.2.3 Installing and Configuring the Agent (Windows)
Prerequisitesl You have added the DNS address and configured the security group. For details, see step
3.l Ensure that the installation directories in Procedure have the read and write permissions,
and that the Telescope process is not stopped by other software after the installation.l You have obtained the Agent installation package (Windows).
CN North-Beijing1: http://obs.myhwclouds.com/telescope/agent/telescope_windows_amd64.zipCN South-Guangzhou1: http://telescope-cn-south-1.obs.myhwclouds.com/agent/telescope_windows_amd64.zipCN East-Shanghai2: http://telescope-cn-east-2.obs.myhwclouds.com/agent/telescope_windows_amd64.zip
Procedure1. Use VNC to log in to the ECS running the Windows OS.
Cloud EyeUser Guide 5 Server Monitoring
Issue 25 (2018-07-30) Huawei Proprietary and ConfidentialCopyright © Huawei Technologies Co., Ltd.
37

2. Use WinSCP to upload the Agent installation package telescope_windows_amd64.zipto the ECS.
3. Create a directory for storing the installation package(for example, D:\Agent) anddecompress telescope_windows_amd64.zip to this directory.
4. Double-click the install.bat script to install and start the Agent.If "Install service success." is displayed, the Agent is successfully installed and started.
Figure 5-9 Installing the Agent
NOTE
After the Agent is configured, its status is still displayed as Uninstalled because the monitoringdata is not reported. Wait 3 to 5 minutes and refresh the page.
5. After the installation is complete, go to the Server Monitoring page. Locate the targetECSs and click Restore Agent Configurations. On the displayed page, click One-ClickRestore to complete the configuration.
Figure 5-10 Restore Agent Configurations
If you need to manually configure the Agent, open the conf.json file under directorytelescope_windows_amd64\bin and set Agent parameters. For details, see Table 5-3.Double-click install.bat to run the script.{ "InstanceId":"", "ProjectId": "", "AccessKey": "", "SecretKey": "", "RegionId": "cn-north-1"}
5.3 Installing Agents in Batches on ECSs Running LinuxOSs
ScenariosThis section describes how to install Agents in batches on a large number of ECSs runningLinux OSs.
Cloud EyeUser Guide 5 Server Monitoring
Issue 25 (2018-07-30) Huawei Proprietary and ConfidentialCopyright © Huawei Technologies Co., Ltd.
38
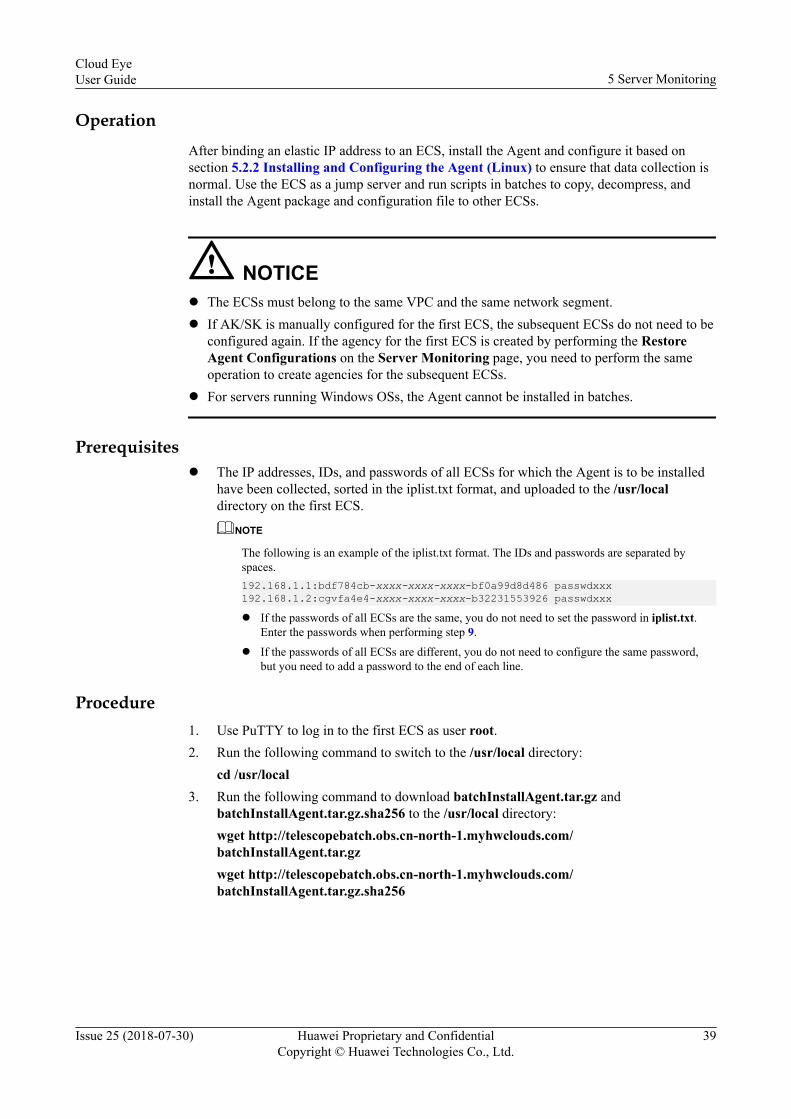
OperationAfter binding an elastic IP address to an ECS, install the Agent and configure it based onsection 5.2.2 Installing and Configuring the Agent (Linux) to ensure that data collection isnormal. Use the ECS as a jump server and run scripts in batches to copy, decompress, andinstall the Agent package and configuration file to other ECSs.
NOTICEl The ECSs must belong to the same VPC and the same network segment.l If AK/SK is manually configured for the first ECS, the subsequent ECSs do not need to be
configured again. If the agency for the first ECS is created by performing the RestoreAgent Configurations on the Server Monitoring page, you need to perform the sameoperation to create agencies for the subsequent ECSs.
l For servers running Windows OSs, the Agent cannot be installed in batches.
Prerequisitesl The IP addresses, IDs, and passwords of all ECSs for which the Agent is to be installed
have been collected, sorted in the iplist.txt format, and uploaded to the /usr/localdirectory on the first ECS.
NOTE
The following is an example of the iplist.txt format. The IDs and passwords are separated byspaces.192.168.1.1:bdf784cb-xxxx-xxxx-xxxx-bf0a99d8d486 passwdxxx192.168.1.2:cgvfa4e4-xxxx-xxxx-xxxx-b32231553926 passwdxxxl If the passwords of all ECSs are the same, you do not need to set the password in iplist.txt.
Enter the passwords when performing step 9.
l If the passwords of all ECSs are different, you do not need to configure the same password,but you need to add a password to the end of each line.
Procedure1. Use PuTTY to log in to the first ECS as user root.2. Run the following command to switch to the /usr/local directory:
cd /usr/local3. Run the following command to download batchInstallAgent.tar.gz and
batchInstallAgent.tar.gz.sha256 to the /usr/local directory:wget http://telescopebatch.obs.cn-north-1.myhwclouds.com/batchInstallAgent.tar.gzwget http://telescopebatch.obs.cn-north-1.myhwclouds.com/batchInstallAgent.tar.gz.sha256
Cloud EyeUser Guide 5 Server Monitoring
Issue 25 (2018-07-30) Huawei Proprietary and ConfidentialCopyright © Huawei Technologies Co., Ltd.
39

Table 5-5 Downloaded address of scripts
File Name Download Address
batchInstallAgent.tar.gz
http://telescopebatch.obs.cn-north-1.myhwclouds.com/batchInstallAgent.tar.gz
batchInstallAgent.tar.gz.sha256
http://telescopebatch.obs.cn-north-1.myhwclouds.com/batchInstallAgent.tar.gz.sha256
4. Run the following command to check the integrity of batchInstallAgent.tar.gz. If OK is
displayed, the file is integral.sha256sum -c <(grep batchInstallAgent.tar.gz batchInstallAgent.tar.gz.sha256)
5. Run the following command to decompress the script package:tar -zxvf batchInstallAgent.tar.gz
6. Run the following command to gran execution permissions to batchInstall.sh:chmod 700 batchInstall.sh
7. Run the following command to gran execution permissions to installPyPackage.sh:chmod 700 installPyPackage.sh
8. (Optional) Run the following command to install the Python module:./installPyPackage.sh
NOTE
(Skip this step if Pexpect has been installed.)
9. Run the following command to execute the script:./batchInstall.sh $password
NOTICEl If all passwords of ECS are inconsistent, run the ./batchInstall.sh command.l Ensure that the ECSs are properly started during script execution.
10. After the installation is complete, log in to the Cloud Eye console. In the navigation paneon the left, click Server Monitoring to view the list of ECSs that have installed theAgent.
NOTE
After the Agent is configured, its status is still displayed as Uninstalled because the monitoringdata is not reported. Wait 3 to 5 minutes and refresh the page.
11. (Optional) If Pexpect is not required after the installation, run the following commandsto delete Pexpect and Ptyprocess from the Python installation directory:cd /usr/lib/python2.7/site-packagesrm pexpect-3.2-py2.7.egg-info -frm ptyprocess-0.5.2-py2.7.egg-info -frm pexpect -rfrm ptyprocess -rf
Cloud EyeUser Guide 5 Server Monitoring
Issue 25 (2018-07-30) Huawei Proprietary and ConfidentialCopyright © Huawei Technologies Co., Ltd.
40
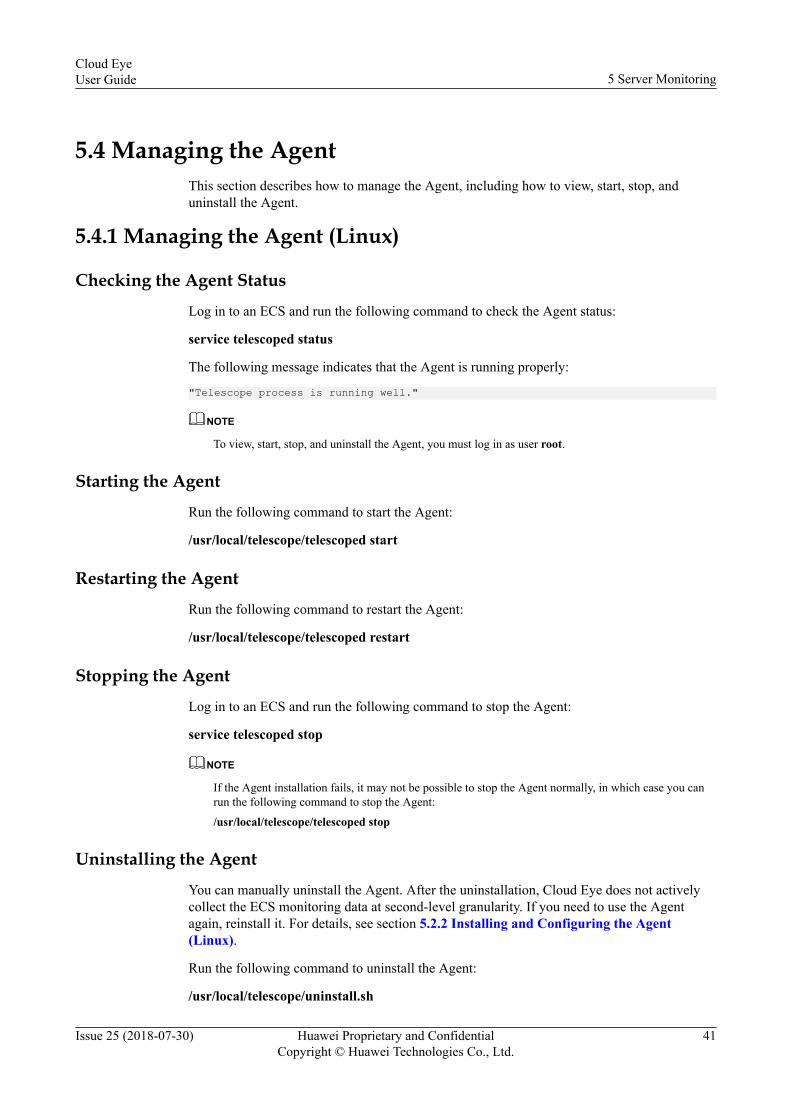
5.4 Managing the AgentThis section describes how to manage the Agent, including how to view, start, stop, anduninstall the Agent.
5.4.1 Managing the Agent (Linux)
Checking the Agent Status
Log in to an ECS and run the following command to check the Agent status:
service telescoped status
The following message indicates that the Agent is running properly:
"Telescope process is running well."
NOTE
To view, start, stop, and uninstall the Agent, you must log in as user root.
Starting the Agent
Run the following command to start the Agent:
/usr/local/telescope/telescoped start
Restarting the Agent
Run the following command to restart the Agent:
/usr/local/telescope/telescoped restart
Stopping the Agent
Log in to an ECS and run the following command to stop the Agent:
service telescoped stop
NOTE
If the Agent installation fails, it may not be possible to stop the Agent normally, in which case you canrun the following command to stop the Agent:
/usr/local/telescope/telescoped stop
Uninstalling the Agent
You can manually uninstall the Agent. After the uninstallation, Cloud Eye does not activelycollect the ECS monitoring data at second-level granularity. If you need to use the Agentagain, reinstall it. For details, see section 5.2.2 Installing and Configuring the Agent(Linux).
Run the following command to uninstall the Agent:
/usr/local/telescope/uninstall.sh
Cloud EyeUser Guide 5 Server Monitoring
Issue 25 (2018-07-30) Huawei Proprietary and ConfidentialCopyright © Huawei Technologies Co., Ltd.
41

5.4.2 Managing the Agent (Windows)
Checking the Agent Status
In the task manager, check the status of the process named telsescope.
Starting the Agent
In the directory where the Agent installation package is stored, double-click the start.batscript to start the Agent.
Stopping the Agent
In the directory where the Agent installation package is stored, double-click theshutdown.bat script to stop the Agent.
Uninstalling the Agent
In the directory where the Agent installation package is stored, double-click the uninstall.batscript to uninstall the Agent.
5.5 Installing the GPU and RAID Metric Collection Plug-in
Scenarios
This section describes how to install the plug-in to collect GPU and BMS RAID metrics.
NOTE
l ECSs support GPU metrics while BMSs not.
l BMS supports RAID metrics while ECS not.
l If the Agent is upgraded to 1.0.5 or later, the corresponding plug-in must use the latest version.Otherwise, the metric collection will fail.
Prerequisitesl You have installed the Agent.l GPU metric collection requires ECSs to support GPU.
Procedure1. Log in to an ECS as user root.
NOTE
l To monitor the BMS software RAID metrics, log in to a BMS.
l The examples in the following procedure are based on the GPU plug-in installation. Theinstallation for the software RAID plug-in is similar.
2. To go to the Agent installation path /usr/local/telescope, run the following command:cd /usr/local/telescope
Cloud EyeUser Guide 5 Server Monitoring
Issue 25 (2018-07-30) Huawei Proprietary and ConfidentialCopyright © Huawei Technologies Co., Ltd.
42

3. To create the plugins folder, run the following command:mkdir plugins
4. To enter the plugins folder, run the following command:cd plugins
5. To download the script of the metric collection plug-in, run the following command:wget http://obs.myhwclouds.com/telescope/gpu_collector
Table 5-6 Obtaining the plug-in installation package
Name How to Obtain
Linux 64-bit GPUplug-in installationpackage
CN North-Beijing1: http://obs.myhwclouds.com/telescope/gpu_collectorCN South-Guangzhou: http://telescope-cn-south-1.obs.myhwclouds.com/gpu_collectorCN East-Shanghai2: http://telescope-cn-east-2.obs.myhwclouds.com/gpu_collector
Linux 64-bit RAIDplug-in installationpackage
CN North-Beijing1: http://obs.myhwclouds.com/telescope/raid_monitor.shCN South-Guangzhou: http://telescope-cn-south-1.obs.myhwclouds.com/raid_monitor.shCN East-Shanghai2: http://telescope-cn-east-2.obs.myhwclouds.com/raid_monitor.sh
6. To add script execution permissions, run the following command:
chmod 755 gpu_collector7. Run the following command to create the conf.json file, add the configuration content,
and configure the plug-in path and metric collection period crontime, which is measuredin seconds:vi conf.json{ "plugins": [ { "path": "/usr/local/telescope/plugins/gpu_collector", "crontime": 10 } ] }
NOTE
l The parameters gpu_collector and raid_monitor.sh indicate the GPU and RAID plug-inconfiguration, respectively.
l The metric collection period must be an integer greater than or equal to 10. If a collectionperiod of less than 10s is entered, the default value 10 is used. If the collection period is not aninteger, GPU metric collection will not be executed properly.
l Do not change the plug-in path without permission. Otherwise, the GPU metric collection isabnormal.
8. Open the conf_ces.json file in the /usr/local/telescope/bin directory. Add"EnablePlugin": true to the file to enable the metric collection function of the plug-in.{ "Endpoint": "https://ces.cn-north-1.myhuaweicloud.com",
Cloud EyeUser Guide 5 Server Monitoring
Issue 25 (2018-07-30) Huawei Proprietary and ConfidentialCopyright © Huawei Technologies Co., Ltd.
43

"EnablePlugin": true}
9. To restart the Agent, run the following command:/usr/local/telescope/telescoped restart
5.6 Viewing Graphs
ScenariosThis section describes how to view Server Monitoring metrics, including fine-grainedmetrics collected by the Agent and metrics provided by ECSs.
For details about metrics collected by the Agent, see OS monitoring metrics. For detailsabout metrics provided by ECSs, see ECS metrics.
PrerequisitesYou have installed the Agent. For details, see section 5.2.2 Installing and Configuring theAgent (Linux) and 5.2.3 Installing and Configuring the Agent (Windows).
Procedure1. Log in to the management console.2. Under Management & Deployment, click Cloud Eye.3. On the Server Monitoring page, locate the Monitoring Status column and enable the
OS Monitoring function.4. Locate the row containing the target cloud service resource and click View Graph to go
the OS Monitoring page.To view the ECS metrics, click Basic Monitoring.
5. In the upper part of the OS Monitoring page, different metric types, such as CPU, CPULoad, Memory, Disk, Disk I/O, NIC, and GPU are displayed.You can view metric graphs based on raw monitoring data from the last 1 hour, last 3hours, or last 12 hours. Cloud Eye provides an Auto Refresh function. If you enable thisfunction, there are three automatic refresh periods to choose from: 10 seconds, 30seconds, and 1 minute.
Cloud EyeUser Guide 5 Server Monitoring
Issue 25 (2018-07-30) Huawei Proprietary and ConfidentialCopyright © Huawei Technologies Co., Ltd.
44

Figure 5-11 OS Monitoring
Figure 5-12 Basic Monitoring
6. In the upper right corner of the graph, click to enlarge the graph for viewingdetailed data.In the upper left corner, you can see six default monitoring periods: 1h, 3h, 12h, 1d, 7d,and 30d. You can also view the alarm history for any period during the last six monthsby customizing the monitoring period.In the upper left of the graph, you can click Settings to configure the rollup method.
Cloud EyeUser Guide 5 Server Monitoring
Issue 25 (2018-07-30) Huawei Proprietary and ConfidentialCopyright © Huawei Technologies Co., Ltd.
45

Figure 5-13 AGT. Memory Usage
NOTE
l If 1h, 3h, 12h, or 1d is selected, raw monitoring data is displayed by default.
l If 7d or 30d is selected, aggregated monitoring data is displayed by default.
l The GPU metric data in the 1h, 3h, 12h, and 1d is the raw monitoring data collected in thecollection period set in section 6.4.
5.7 Creating Alarm Rules
ScenariosThis section describes how to create alarm rule based on fine-grained monitoring of ECSs andBMSs.
Procedure1. Log in to the management console.
2. Click in the upper left to select a region and a project.3. Under Management & Deployment, click Cloud Eye.4. In the navigation pane on the left, choose Server Monitoring.5. Locate the target ECS. In the Operation column, click More, and select Create Alarm
Rule.6. On the Create Alarm Rule page, follow the prompts to set the parameters.
a. You do not need to set the monitored object because it is the current ECS.b. In the Select Metric step, select Manually create and configure parameters based
on Table 5-7.
Cloud EyeUser Guide 5 Server Monitoring
Issue 25 (2018-07-30) Huawei Proprietary and ConfidentialCopyright © Huawei Technologies Co., Ltd.
46
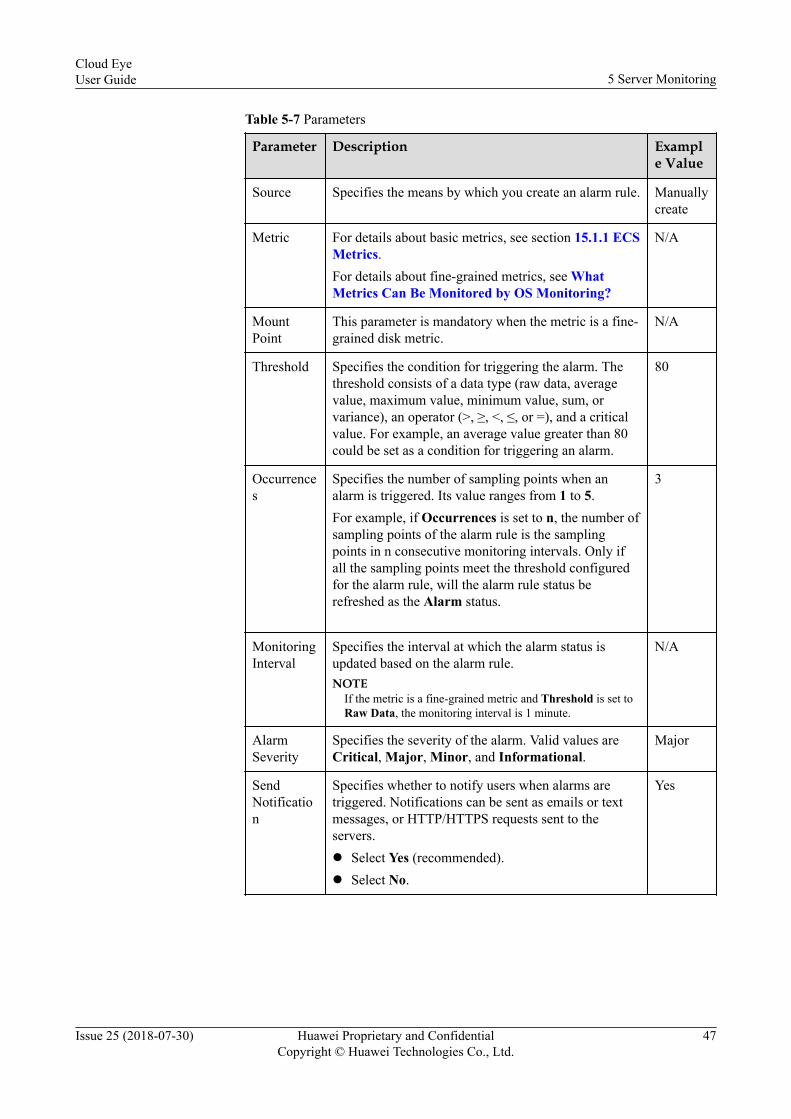
Table 5-7 Parameters
Parameter Description Example Value
Source Specifies the means by which you create an alarm rule. Manuallycreate
Metric For details about basic metrics, see section 15.1.1 ECSMetrics.For details about fine-grained metrics, see WhatMetrics Can Be Monitored by OS Monitoring?
N/A
MountPoint
This parameter is mandatory when the metric is a fine-grained disk metric.
N/A
Threshold Specifies the condition for triggering the alarm. Thethreshold consists of a data type (raw data, averagevalue, maximum value, minimum value, sum, orvariance), an operator (>, ≥, <, ≤, or =), and a criticalvalue. For example, an average value greater than 80could be set as a condition for triggering an alarm.
80
Occurrences
Specifies the number of sampling points when an alarm is triggered. Its value ranges from 1 to 5.For example, if Occurrences is set to n, the number of sampling points of the alarm rule is the sampling points in n consecutive monitoring intervals. Only if all the sampling points meet the threshold configured for the alarm rule, will the alarm rule status be refreshed as the Alarm status.
3
MonitoringInterval
Specifies the interval at which the alarm status isupdated based on the alarm rule.NOTE
If the metric is a fine-grained metric and Threshold is set toRaw Data, the monitoring interval is 1 minute.
N/A
AlarmSeverity
Specifies the severity of the alarm. Valid values areCritical, Major, Minor, and Informational.
Major
SendNotification
Specifies whether to notify users when alarms aretriggered. Notifications can be sent as emails or textmessages, or HTTP/HTTPS requests sent to theservers.l Select Yes (recommended).l Select No.
Yes
Cloud EyeUser Guide 5 Server Monitoring
Issue 25 (2018-07-30) Huawei Proprietary and ConfidentialCopyright © Huawei Technologies Co., Ltd.
47
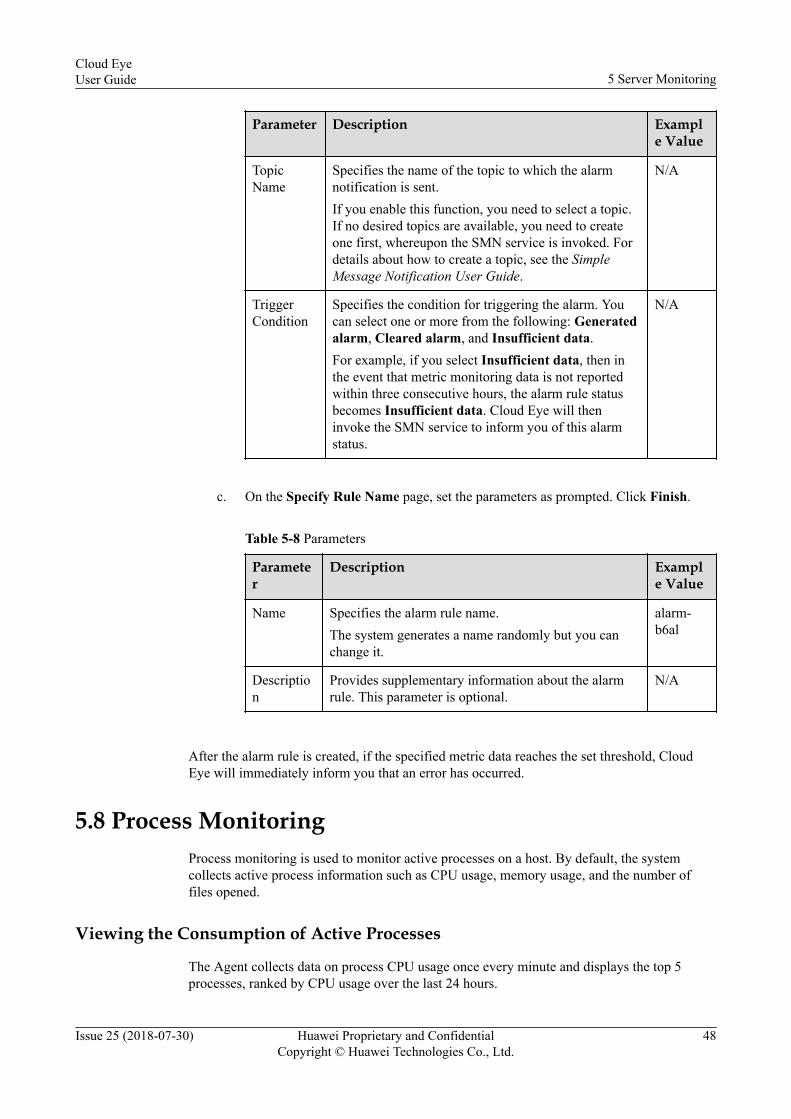
Parameter Description Example Value
TopicName
Specifies the name of the topic to which the alarmnotification is sent.If you enable this function, you need to select a topic.If no desired topics are available, you need to createone first, whereupon the SMN service is invoked. Fordetails about how to create a topic, see the SimpleMessage Notification User Guide.
N/A
TriggerCondition
Specifies the condition for triggering the alarm. Youcan select one or more from the following: Generatedalarm, Cleared alarm, and Insufficient data.For example, if you select Insufficient data, then inthe event that metric monitoring data is not reportedwithin three consecutive hours, the alarm rule statusbecomes Insufficient data. Cloud Eye will theninvoke the SMN service to inform you of this alarmstatus.
N/A
c. On the Specify Rule Name page, set the parameters as prompted. Click Finish.
Table 5-8 Parameters
Parameter
Description Example Value
Name Specifies the alarm rule name.The system generates a name randomly but you canchange it.
alarm-b6al
Description
Provides supplementary information about the alarmrule. This parameter is optional.
N/A
After the alarm rule is created, if the specified metric data reaches the set threshold, CloudEye will immediately inform you that an error has occurred.
5.8 Process MonitoringProcess monitoring is used to monitor active processes on a host. By default, the systemcollects active process information such as CPU usage, memory usage, and the number offiles opened.
Viewing the Consumption of Active Processes
The Agent collects data on process CPU usage once every minute and displays the top 5processes, ranked by CPU usage over the last 24 hours.
Cloud EyeUser Guide 5 Server Monitoring
Issue 25 (2018-07-30) Huawei Proprietary and ConfidentialCopyright © Huawei Technologies Co., Ltd.
48
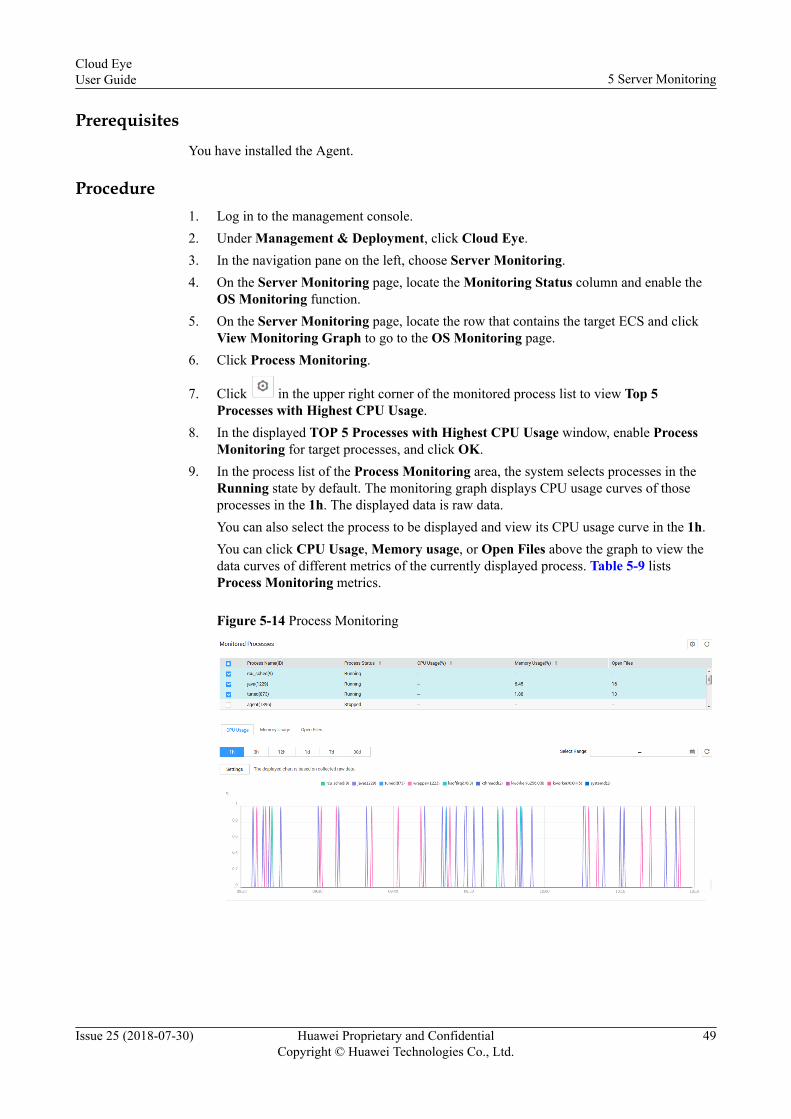
PrerequisitesYou have installed the Agent.
Procedure1. Log in to the management console.2. Under Management & Deployment, click Cloud Eye.3. In the navigation pane on the left, choose Server Monitoring.4. On the Server Monitoring page, locate the Monitoring Status column and enable the
OS Monitoring function.5. On the Server Monitoring page, locate the row that contains the target ECS and click
View Monitoring Graph to go to the OS Monitoring page.6. Click Process Monitoring.
7. Click in the upper right corner of the monitored process list to view Top 5Processes with Highest CPU Usage.
8. In the displayed TOP 5 Processes with Highest CPU Usage window, enable ProcessMonitoring for target processes, and click OK.
9. In the process list of the Process Monitoring area, the system selects processes in theRunning state by default. The monitoring graph displays CPU usage curves of thoseprocesses in the 1h. The displayed data is raw data.You can also select the process to be displayed and view its CPU usage curve in the 1h.You can click CPU Usage, Memory usage, or Open Files above the graph to view thedata curves of different metrics of the currently displayed process. Table 5-9 listsProcess Monitoring metrics.
Figure 5-14 Process Monitoring
Cloud EyeUser Guide 5 Server Monitoring
Issue 25 (2018-07-30) Huawei Proprietary and ConfidentialCopyright © Huawei Technologies Co., Ltd.
49

Table 5-9 Process Monitoring metrics
Metric
Description ValueRange
Collection Mode(Linux)
Collection Mode(Windows)
CPUUsage
Indicates the CPUconsumption of aprocess. pHashIdis the hashID ofthe process nameand process ID.
0–100%
Monitored object: ECSor BMSNOTE
Check the metric valuechanges in file /proc/pid/stat.
Monitored object:ECS or BMSNOTE
Invoke Windows APIGetProcessTimes toobtain the CPU usageof the process.
MemoryUsage
Indicates thememory consumedby a process.pHashId is thehashID of theprocess name andprocess ID.
0–100%
Monitored object: ECSor BMSMemory Usage =RSS*PAGESIZE/MemTotalNOTE
Memory Usage =RSS*PAGESIZE/MemTotalRSS: Obtain its value bychecking the secondcolumn of file /proc/pid/statm.
PAGESIZE: Obtain itsvalue by running thegetconf PAGESIZEcommand.
MemTotal: Obtain itsvalue by checking file /proc/meminfo.
Monitored object:ECS or BMSNOTE
Invoke Windows APIprocGlobalMemoryS-tatusEx to obtain thetotal memory size.InvokeGetProcessMemor-yInfo and to obtainthe used memory size.Use the used memorysize to divide the totalmemory size to getthe memory usage.
OpenFiles
Indicates thenumber of filesopened by aprocess. pHashIdis the hashID ofthe process nameand process ID.
≥ 0 Monitored object: ECSor BMSNOTE
You can run the ls -l /proc/pid/fd command toview the number.
Not supported
RunningProcesses
Indicates thenumber ofprocesses that arerunning.
≥ 0 Monitored object: ECSor BMSNOTE
You can obtain the statusof each process bychecking the value ofStatus in the /proc/pid/status file, and thencollect the total numberof processes in eachstatus.
IdleProcesses
Indicates thenumber ofprocesses that areidle.
≥ 0
Cloud EyeUser Guide 5 Server Monitoring
Issue 25 (2018-07-30) Huawei Proprietary and ConfidentialCopyright © Huawei Technologies Co., Ltd.
50

Metric
Description ValueRange
Collection Mode(Linux)
Collection Mode(Windows)
ZombieProcesses
Indicates thenumber of zombieprocesses.
≥ 0
BlockedProcesses
Indicates thenumber ofprocesses that areblocked.
≥ 0
SleepingProcesses
Indicates thenumber ofprocesses that aresleeping.
≥ 0
TotalProcesses
Indicates the totalnumber ofprocesses.
≥ 0 Monitored object:ECS or BMSNOTE
Obtain the totalnumber of processesby using the third-party libraryPsapi.dll.
10. In the upper right corner of the graph, click to enlarge the graph for viewingdetailed data.In the upper left corner, you can see six default monitoring periods: 1h, 3h, 12h, 1d, 7d,and 30d. You can also view the alarm history for any period during the last six monthsby customizing the monitoring period.In the upper left of the graph, you can click Settings to configure the rollup method.
NOTE
l In the query time range, the top 5 processes are not fixed. The top 5 processes for a specifictime period are displayed in the process list. The time in the list indicates the time when theprocess was created.
l Monitoring data of CPU Usage, Memory Usage, and Open Files of a process is collectedonly when the process monitoring function is enabled for the process.
l For details about CPU Usage and Memory Usage of the current process, run command Linuxtop.
For details about Open Files of the current process, run command Linux ls /proc/pid/fd |wc -l.
l If the system time on the client browser end is different from that of the monitored ECS, thegraph may have no metric data. If this occurs, synchronize the local time with the ECS time.
Cloud EyeUser Guide 5 Server Monitoring
Issue 25 (2018-07-30) Huawei Proprietary and ConfidentialCopyright © Huawei Technologies Co., Ltd.
51

6 Custom Monitoring
The Custom Monitoring page displays all custom metrics published by users. You can usesimple API requests to publish collected monitoring data of those metrics to Cloud Eye forprocessing and display.
Viewing Custom Monitoring1. Log in to the management console.
2. Under Management & Deployment, click Cloud Eye.
3. In the navigation pane on the left, choose Custom Monitoring.
4. On the Custom Monitoring page, you can view the data published by the current userthrough API requests, including custom services and metrics.
NOTE
l Only after you add monitoring data through APIs, will the Custom Monitoring page bedisplayed on the Cloud Eye console.
l For details about how to add monitoring data, see Adding Monitoring Data (RESTful APIs),Adding Monitoring Data (Java SDK), and Adding Monitoring Data (Python SDK).
5. Locate the row that contains the target resource and click View Monitoring Graph inthe Operation column.
On the displayed page, you can view ECS graphs based on raw monitoring data collectedin the 1h, 3h, or 12h. In the upper right corner of the graph, the maximum and minimumvalues of the metric in the corresponding time periods are dynamically displayed.
Creating Alarm Rules1. Log in to the management console.
2. Under Management & Deployment, click Cloud Eye.
3. In the navigation pane on the left, choose Custom Monitoring.
4. On the Custom Monitoring page, locate the target resource and click Create AlarmRule in the Operation column.
5. On the Create Alarm Rule page, follow the prompts to set the parameters. For details,see Table 11-6 and Table 11-7.
6. Click Create.
Cloud EyeUser Guide 6 Custom Monitoring
Issue 25 (2018-07-30) Huawei Proprietary and ConfidentialCopyright © Huawei Technologies Co., Ltd.
52

7 Website Monitoring
Application Scenarios
Website monitoring is used to simulate real users' access to remote servers to detect theavailability and connectivity of remote servers.
Currently, three checkpoints: CN North-Beijing1, CN East-Shanghai2, and CN South-Guangzhou3 support real-time website monitoring. More checkpoints will be available soon.
NOTE
Currently, the website monitoring is free of charge.
Advantagesl You can create, modify, disable, enable, and delete monitors.
l Simple configuration is added, saving the resources and energy to configure complexopen source products.
l Website exceptions are timely notified, eliminating the worry that the website exceptionsoccur but no one knows.
Metric
Table 7-1 Website monitoring metrics
Metric Description
Response Time Indicates the time a website takes to respond to a user request,which is measured in millisecond
Availability Availability data is collected hourly. The availability metric isavailable an hour after the creation of a monitor.Availability = (Normal status responses per hour + Slow statusresponses per hour)/Total monitoring queries per hour x 100%
Packet Loss Ratio Indicates the ratio of the number of lost packets to the totalnumber of packets transmitted.
HTTP response code Indicates the response status reported by the server.
Cloud EyeUser Guide 7 Website Monitoring
Issue 25 (2018-07-30) Huawei Proprietary and ConfidentialCopyright © Huawei Technologies Co., Ltd.
53

Metric Description
Available MonitoringLocations
Indicates the number of available monitoring locations.
Available MonitoringLocation Percentage
Indicates the percentage of monitoring locations that areavailable.
NOTE
l Response Time, Availability, Available Monitoring Locations, and Available MonitoringLocation Percentage are applicable to the HTTP, Transmission Control Protocol (TCP), User dataprotocol (UDP), and PING. Packet Loss Rate applies only to PING. HTTP response code appliesonly to HTTP.
l The Internet service availability of standard network protocols such as Post Office Protocol-Version3 (POP3), Simple Mail Transfer Protocol (SMTP), Domain Name System (DNS), and File TransferProtocol (FTP) will be supported later.
Protocol Supported
Table 7-2 Protocol description
Protocol Description
HTTP HTTP detection is performed on the specified URL or IPaddress.Advanced settings support GET, POST, or HEAD requestmode, cookie, and header information.
Packet Internet Groper(PING)
PING detection is performed on the specified URL.
Transmission ControlProtocol (TCP)
TCP server detection is performed on a specified port.In advanced settings, TCP request content can be configuredand its response content can be matched.
User datagram protocol(UDP)
UDP server detection is performed on a specified port.In advanced settings, UDP request content can be configuredand its response content can be matched.
7.1 Creating Monitors
Scenarios
This section describes how to create monitors.
NOTE
A maximum of 20 monitors can be created using an account.
Cloud EyeUser Guide 7 Website Monitoring
Issue 25 (2018-07-30) Huawei Proprietary and ConfidentialCopyright © Huawei Technologies Co., Ltd.
54

Procedure1. Log in to the management console.
2. Under Management & Deployment, click Cloud Eye.
3. On the Website Monitoring page, click Create Monitor in the upper right corner.
4. In the displayed Create Monitor dialog box, set parameters as prompted.
Figure 7-1 Create Monitor
Table 7-3 Parameters
Parameter Description Example Value
MonitorName
Specifies the website monitoring name. stationMonitor-tuq0
MonitorType
Currently, the following protocols can bemonitored: HTTP, PING, TCP, and UDP.More monitor types are being deployed.
HTTP
URL Specifies the address to be monitored. www.example.com
MonitoringFrequency
Specifies the interval for the websitemonitoring detection engine to detect once.NOTE
Monitoring Frequency can be set to 1 minute,5 minutes, or 20 minutes.
5 minutes
CheckpointLocation
Currently, website monitoring supportsthree checkpoint locations: CN North-Beijng1, CN East-Shanghai2, and CNSouth-Guangzhou3.
CN North-Beijng1
Cloud EyeUser Guide 7 Website Monitoring
Issue 25 (2018-07-30) Huawei Proprietary and ConfidentialCopyright © Huawei Technologies Co., Ltd.
55

Parameter Description Example Value
RequestMethod
This parameter is available when MonitorType is set to HTTP.Standard HTTP request methods includeGET, POST, and HEAD. The POSTmethod can be used to submit content.
GET
PortNumber
This parameter is available when MonitorType is set to TCP or UDP.
8080
AdvancedSettings
Different monitor types have differentadvanced settings.l If Monitor Type is HTTP, see Table
7-4.l If Monitor Type is TCP, see Table 7-5.l If Monitor Type is UDP, see Table
7-6.
N/A
Table 7-4 HTTP advanced parameters
Parameter Description Example Value
PostMessageContent
This parameter is mandatory when theRequest Method is POST.
N/A
Cookie Specifies the cookie required by the targetwebsite. Multiple pieces of informationare separated by line breaks.
key1=value1
HTTPRequestHeader
Specifies the HTTP header required bythe target website. Multiple pieces ofinformation are separated by line breaks.
key1=value1
ResponseContent toBe Matched
Specifies the expected HTTP responsecontent.
N/A
Table 7-5 TCP advanced parameters
Parameter Description Example Value
RequestContentFormat
The value can be in hexadecimal or textformat.
Hexadecimal
TCPRequestContent
Specifies the preset TCP request content. 0xcf
Cloud EyeUser Guide 7 Website Monitoring
Issue 25 (2018-07-30) Huawei Proprietary and ConfidentialCopyright © Huawei Technologies Co., Ltd.
56

Parameter Description Example Value
MatchedResponseContentFormat
The value can be in hexadecimal or textformat.
Hexadecimal
MatchedResponseContent
Specifies the expected TCP responsecontent.
N/A
Table 7-6 UDP advanced parameters
Parameter Description Example Value
RequestContentFormat
The value can be in hexadecimal or textformat.
Hexadecimal
UDPRequestContent
Specifies the preset UDP request content. 0xcf
MatchedResponseContentFormat
The value can be in hexadecimal or textformat.
Hexadecimal
MatchedResponseContent
Specifies the expected UDP responsecontent.
N/A
5. Click OK.
7.2 Creating Alarm Rules
ScenariosThis section describes how to create alarm rules for created websites.
PrerequisitesA monitor has been created.
Procedure1. Log in to the management console.2. Under Management & Deployment, click Cloud Eye.3. On the Website Monitoring page, locate the row that contains the target website. In the
Operation column, click Create Alarm Rule.
Cloud EyeUser Guide 7 Website Monitoring
Issue 25 (2018-07-30) Huawei Proprietary and ConfidentialCopyright © Huawei Technologies Co., Ltd.
57

4. On the Create Alarm Rule page, set parameters as prompted.
Table 7-7 Selecting the object to be monitored
Parameter Description Example Value
ResourceType
Retain the default value. N/A
MonitoredObject
Retain the default value. N/A
5. Click Next. In step Select Metric, set parameters as prompted.
Figure 7-2 Create Alarm Rule
Table 7-8 Parameters
Parameter Description Example Value
Metric Set the collection granularity based on themonitoring frequency set when creating amonitor.NOTE
l Availability data is collected hourly. Theavailability metric is available an hour afterthe creation of a monitor.
l If the site type is HTTP, the HTTPresponse code can be selected as themetric.
Response Time
Cloud EyeUser Guide 7 Website Monitoring
Issue 25 (2018-07-30) Huawei Proprietary and ConfidentialCopyright © Huawei Technologies Co., Ltd.
58

Parameter Description Example Value
Threshold Specifies the condition for triggering thealarm. It consists of a data type, anoperator (>, >=, <, <=, =), and a criticalvalue. For example, Raw data >100 cloudbe set as a condition for triggering analarm.
100
Occurrences Specifies the number of sampling pointswhen an alarm is triggered. Its valueranges from 1 to 5.If Occurrences is set to n, the number ofsampling points of the alarm rule is thesampling points in n consecutive samplingperiods. Only if all the sampling pointsmeet the threshold configured for thealarm rule, will the alarm rule status berefreshed as the Alarm status.
3
AlarmSeverity
Specifies the severity of the alarm. Validvalues are Critical, Major, Minor, andInformational.
Major
SendNotification
Specifies whether to notify users whenalarms are triggered. Notifications can besent as emails or text messages, or HTTP/HTTPS requests sent to the servers.l Select Yes (recommended).l Select No.
Yes
Topic Name Specifies the name of the topic to whichthe alarm notification is sent.If you enable this function, you need toselect a topic. If no desired topics areavailable, you need to create one first,whereupon the SMN service is invoked.For details about how to create a topic, seethe Simple Message Notification UserGuide.
N/A
TriggerCondition
Specifies the condition for triggering thealarm. You can select one or more fromthe following: Generated alarm, Clearedalarm, and Insufficient data.
N/A
6. Click Next. In step Specify Rule Name, set parameters as prompted.
Cloud EyeUser Guide 7 Website Monitoring
Issue 25 (2018-07-30) Huawei Proprietary and ConfidentialCopyright © Huawei Technologies Co., Ltd.
59

Table 7-9 Alarm rule name and description
Parameter Description Example Value
Name Specifies the alarm rule name. The systemgenerates a name randomly but you canchange it.
alarm-b6al
Description Provides supplementary information aboutthe alarm rule. This parameter is optional.
N/A
7. Click Finish.
7.3 Viewing Website Monitoring
Procedure1. Log in to the management console.
2. Under Management & Deployment, click Cloud Eye.
3. On the Website Monitoring page, information of all websites is displayed, Including thename, URL, type, monitoring frequency, available monitoring location percentage, andaverage response time.
4. On the Website Monitoring page, locate the row that contains the target website andclick View Monitoring Graph in the Operation column.
You can select a time range to check monitoring statistics graphs during the last 3, 12, or24 hours.
Figure 7-3 Response Time
NOTE
l If the metric is an availability metric, the average value in an hour is displayed in themonitoring graph.
l If the rollup period is longer than 1 hour, availability metrics are displayed by rollup period.
7.4 Managing Website Monitoring
Cloud EyeUser Guide 7 Website Monitoring
Issue 25 (2018-07-30) Huawei Proprietary and ConfidentialCopyright © Huawei Technologies Co., Ltd.
60
7.4.1 Modifying Monitors
ScenariosThis section describes how to modify monitors when services change or the configured alarmrule for the website monitoring do not meet your service requirements.
Procedure1. Log in to the management console.2. Under Management & Deployment, click Cloud Eye.3. On the Website Monitoring page, locate the row that contains the target monitor name.
In the Operation column, click Modify Monitor under More.4. On the Modify Monitor page, set parameters as prompted.
NOTE
Values of Monitor Type and URL cannot be changed. Data may be lost after the change becauseadvanced settings of different monitor types are different.
7.4.2 Disabling MonitorsOn the Website Monitoring page, locate the row that contains the target monitor name. In theOperation column, click Disable under More. In the displayed Disable dialog box, clickOK.
7.4.3 Enabling MonitorsOn the Website Monitoring page, locate the row that contains the target monitor name. In theOperation column, click Enable under More. In the displayed Enable dialog box, click OK.
7.4.4 Deleting MonitorsOn the Website Monitoring page, locate the row that contains the target monitor name. In theOperation column, click Delete under More. In the displayed Delete Monitor dialog box,click OK.
Cloud EyeUser Guide 7 Website Monitoring
Issue 25 (2018-07-30) Huawei Proprietary and ConfidentialCopyright © Huawei Technologies Co., Ltd.
61

8 Log Monitoring
The log monitoring function enables you to monitor log content in real time. You can use bothCloud Eye and Log Tank Service (LTS) to collect log content monitoring statistics, set alarmrules for logs, and perform other log-related operations.
8.1 Specifying a Custom Metric FilterLTS extracts your specified keywords from logs, so that you can use Cloud Eye to monitorkey metrics in logs and trigger alarms.
Prerequisitesl LTS has been used, a filter has been created in LTS, and the log monitoring data can be
viewed.l A log group and a log topic have been created. For details, see the Log Tank Service User
Guide.
Procedure1. Log in to the management console and choose Management & Deployment > Log
Tank Service.2. In the navigation pane on the left, choose Log Management.3. On the Log Management page, click the name of the log group to which the log to be
monitored belongs.4. Click Configure in the log theme line. On the page displayed, set the parameters listed
in Table 8-1.
Table 8-1 Custom metric filter parameters
Parameter Description ExampleValue
Filter Name Specifies the name of the filter you set. N/A
Cloud EyeUser Guide 8 Log Monitoring
Issue 25 (2018-07-30) Huawei Proprietary and ConfidentialCopyright © Huawei Technologies Co., Ltd.
62

Parameter Description ExampleValue
FilterKeyword
Specifies the specified keywords extracted from thelog.NOTE
l Only filtering by a single keyword is supported.
l Filtering is case-sensitive and only logs meeting acertain condition can be filtered, such as Error orWarning.
Error
Example Log You are advised to paste a complete log to match thefilter keywords.
N/A
Metric Name You are advised to specify the metric name for eachfilter keyword.
Error_metric
5. Click OK.
8.2 Viewing Graphs
Procedure1. Log in to the management console.2. Under Management & Deployment, click Cloud Eye.3. In the navigation pane on the left, choose Log Monitoring.4. Locate the row that contains the target log group and click View Monitoring Graph in
the Operation column.
Figure 8-1 Viewing graphs
5. On the displayed page, you can view ECS graphs based on raw monitoring data collectedin the 1h, 3h, or 12h. In the upper right corner of the graph, the maximum and minimumvalues of the metric in the corresponding time periods are dynamically displayed.
Cloud EyeUser Guide 8 Log Monitoring
Issue 25 (2018-07-30) Huawei Proprietary and ConfidentialCopyright © Huawei Technologies Co., Ltd.
63

9 Event Monitoring
Event monitoring provides reporting, query, and alarm functions for event data. It allows youto collect and report various important service events and cloud resource operational events toCloud Eye and receive alarms when exceptions occur.
Events are key operations of cloud service resources that are stored and monitored by CloudEye. You can view events to see operations performed by specific users on specific resources.
Event monitoring is enabled by default and allows you to view monitoring details of systemevents and custom events. For operations supported by event monitoring, see section 16Operations Supported by Event Monitoring.
Event monitoring provides an API for reporting custom events, which helps you collect andreport abnormal events or important change events generated by services to Cloud Eye. Fordetails about how to report custom events, see Reporting Events.
9.1 Viewing Graphs
ScenariosThis section describes how to view the event monitoring data.
Procedure1. Log in to the management console.2. Under Management & Deployment, click Cloud Eye.3. In the navigation pane on the left, click Event Monitoring, and all system events of the
last 24 hours are displayed by default.You can also click 1h, 3h, 12h, 7d, or 30d to view events in different periods.
Cloud EyeUser Guide 9 Event Monitoring
Issue 25 (2018-07-30) Huawei Proprietary and ConfidentialCopyright © Huawei Technologies Co., Ltd.
64

Figure 9-1 Event Monitoring
4. Click View Event in the Operation column to view the content of a specific event.
Figure 9-2 View Event
9.2 Creating Alarm Rules
Scenarios
This section describes how to create alarm rules for event monitoring.
Procedure1. Log in to the management console.2. Under Management & Deployment, click Cloud Eye.3. In the navigation pane on the left, click Event Monitoring. Select an event and click
Create Alarm Rule in the Operation column.
Cloud EyeUser Guide 9 Event Monitoring
Issue 25 (2018-07-30) Huawei Proprietary and ConfidentialCopyright © Huawei Technologies Co., Ltd.
65

4. Follow the prompts to configure the parameters.
Figure 9-3 Create Alarm Rule
Table 9-1 Parameters
Parameter Description Example Value
Source Specifies the means by which you createan alarm rule.
Manually create
EventSource
Specifies the service for which the event isgenerated.
ECS
Event Name Specifies the operations on the operatingsystem resources performed by users, suchas login and logout.For operations supported by eventmonitoring, see section 16 OperationsSupported by Event Monitoring.
deleteServer
MonitoringScope
Specifies the resource range for eventmonitoring.
All resources
MonitoredObject
Specifies the object to be monitored. Thisparameter is mandatory if you setMonitoring Scope to Specifiedresources.
N/A
TriggerMode
You can select immediate trigger oraccumulative trigger based on the severityof the operation.
Immediate Trigger
Cloud EyeUser Guide 9 Event Monitoring
Issue 25 (2018-07-30) Huawei Proprietary and ConfidentialCopyright © Huawei Technologies Co., Ltd.
66

Parameter Description Example Value
Threshold Specifies the number of times that theoperation is performed within amonitoring interval.
5
MonitoringInterval
Specifies the interval at which the alarmstatus is updated based on the alarm rule.
5 minutes
AlarmSeverity
Specifies the severity of the alarm. Validvalues are Critical, Major, Minor, andInformational.
Major
SendNotification
Specifies whether to notify users whenalarms are triggered. Notifications can besent as emails or text messages, or HTTP/HTTPS requests sent to the servers.l Select Yes (recommended).l Select No.
Yes
Topic Name Specifies the name of the topic to whichthe alarm notification is sent.If you enable this function, you need toselect a topic. If no desired topics areavailable, you need to create one first,whereupon the SMN service is invoked.For details about how to create a topic, seethe Simple Message Notification UserGuide.
N/A
TriggerCondition
If you select Send Notification,Generated alarm is mandatory forTrigger Condition.
Generated alarm
5. On the Specify Rule Name page, set the parameters as prompted. Click Finish.
Table 9-2 Alarm rule name and description
Parameter Description Example Value
Name Specifies the alarm rule name. The systemgenerates a name randomly but you canchange it.
alarm-b6al
Description Provides supplementary information aboutthe alarm rule. This parameter is optional.
N/A
Cloud EyeUser Guide 9 Event Monitoring
Issue 25 (2018-07-30) Huawei Proprietary and ConfidentialCopyright © Huawei Technologies Co., Ltd.
67
10 Viewing Alarm History
10.1 Configuring Data Storage
Scenarios
On Cloud Eye, the raw data retention period for each metric is two days. Raw data with aretention period of more than two days will not be saved. After enabling Object StorageService (OBS), you can save raw data for a longer period of time by synchronizing them toOBS.
This section describes how to configure data storage.
NOTE
Currently, configuring data storage applies only to North China 1 (cn-north-1). This feature will beavailable in other regions soon.
Prerequisitesl A cloud service is enabled.l OBS has been enabled.
Procedure1. Log in to the management console.2. Under Management & Deployment, click Cloud Eye.3. In the navigation pane on the left, choose Cloud Service Monitoring. Locate the target
resource and click Configure Data Storage in the Operation column.Alternatively, in the navigation pane on the left, choose Server Monitoring. Locate thetarget resource and choose Operation > Configure Data Storage.
4. (Optional) Configure data storage in batches.On the Cloud Service Monitoring page, select the target cloud service resources andclick Configure Data Storage.Alternatively, on the Server Monitoring page, select the target ECSs and clickConfigure Data Storage.
Cloud EyeUser Guide 10 Viewing Alarm History
Issue 25 (2018-07-30) Huawei Proprietary and ConfidentialCopyright © Huawei Technologies Co., Ltd.
68

5. In the displayed Configure Data Storage window, set parameters based on Table 10-1:
Table 10-1 Parameters for Configure Data Storage
Parameter Description Example Value
TransferTrace toOBS
Specifies whether to transfer trace toOBS. Its value can be Configure orNot required.
Configure
Create OBSBucket
If an OBS bucket exists, you do notneed to create another buckets.
Yes
OBS Bucketfor StoringTraces
If there is no OBS bucket, enter thename of the OBS bucket to becreated.If there are OBS buckets, select one.
ecs-0615
File Prefix The metric data file prefix enablesyou to distinguish Cloud Eye datafiles from other files in the OBSbucket.
ecs-0615
NOTE
l OBS will grant read and write permissions to Cloud Eye for the selected bucket. Exercisecaution when modifying the bucket policy to prevent data transfer failures.
l For security purposes, set Storage Class to Standard and Bucket Policy to Private.
l If the configured dump policy is disabled for more than 7 days, it will be cleared by default. Ifyou need to use the dump policy, reconfigure it.
l If the user account is frozen for more than two hours, the function of transferring data to OBSis disabled. If you want to use this function, unfreeze the account and enable the functionagain.
6. Click OK.
10.2 Viewing Raw Data
Scenarios
This section describes how to view the monitoring data saved in the OBS bucket bydownloading metric data files.
Prerequisitesl You have successfully configured data storage on Cloud Eye. For details, see section
10.1 Configuring Data Storage.l You have installed Java and configured environment variables.l You have downloaded the format conversion tool metric-transfer-merge.jar from the
download address https://metric-json-trans-csv.obs.myhwclouds.com/metric-transfer-merge.jar.
Cloud EyeUser Guide 10 Viewing Alarm History
Issue 25 (2018-07-30) Huawei Proprietary and ConfidentialCopyright © Huawei Technologies Co., Ltd.
69

Procedure1. Log in to the management console.2. Under Management & Deployment, click Cloud Eye.3. In the navigation pane on the left, choose Cloud Service Monitoring. Locate the target
resource and select the specified OBS bucket in the Permanent Data Storage column.Alternatively, in the navigation pane on the left, choose Server Monitoring. Locate thetarget ECS, and select the specified OBS bucket in the Permanent Data Storagecolumn.
4. Select the metric data file you want to view in the OBS bucket. Based on the storage pathof the metric data file, select OBS bucket name > CloudEye > Region > Year > Month >Day > Service type directory > Resource type directory. Click Download in theOperation column to download the file to the default path. To download the metric datafile to a customized path, click Download As.The metric data file is named in the following format:Metric data file prefix_CloudEye_Region_Time when the log was uploaded to the OBS:year-month-dayThour-minute-secondZ_Randomly generated character.json.gzFor example: FilePrefix_CloudEye_region_2016-05-30T16-20-56Z_21d36ced8c8af71e.json
NOTE
l The OBS bucket name and trace file prefix are user-defined, and other parameters areautomatically generated.
l Original metric data files are segment files of time granularity. The files include all metric dataof a resource under the time segment. The metric data is stored in the JSON format.
l To facilitate your operations, Cloud Eye provides the format conversion and contentcombination tool. Using this tool, you can combine the files of several time slices in a specificresource into a time-staged file in the chronological order in the .csv format. In addition, youcan use the tool to generate an independent time splice file for every metric of the resource inthe .csv format.
5. Access the cmd tool in the Windows system. Go to the folder where metric-transfer-merge.jar is located, run the java-jar metric-transfer-merge.jar j2c inputDirectoryoutputDirectory mergFileName command.In the Linux system, run the java-jar metric-transfer-merge.jar inputDirectoryoutputDirectory mergFileName command in the shell command line.
NOTE
l j2c is the command to convert JSON into CSV.
l inputDirectory is the directory to store the downloaded JSON files.
l outputDirectory is the directory to store the generated files.
l mergFileName is the name of the specified combined file for users. This parameter can beignored because the tool will name the combined file as mergeResult.csv by default.
After running the java command, you can view the converted files in theoutputDirectory directory. Each file corresponds to the data of one metric at all timepoints. mergeResult.csv is a large file generated by combining the data of all metrics.Figure 10-1 shows the content of the converted file.
Cloud EyeUser Guide 10 Viewing Alarm History
Issue 25 (2018-07-30) Huawei Proprietary and ConfidentialCopyright © Huawei Technologies Co., Ltd.
70

Figure 10-1 Metric data
Cloud EyeUser Guide 10 Viewing Alarm History
Issue 25 (2018-07-30) Huawei Proprietary and ConfidentialCopyright © Huawei Technologies Co., Ltd.
71

11 Using the Alarm Function
The alarm function is based on collected metrics. You can set alarm rules for key metrics ofcloud services. When the metric monitoring data triggers the conditions set in the alarm rule,Cloud Eye sends emails, text messages, or HTTP/HTTPS requests to you. In this way, you areimmediately informed of cloud service exceptions and can quickly handle the faults to avoidservice losses caused by resource problems.
Cloud Eye uses the SMN service to notify users. This requires you to create a topic and addrelevant subscribers for this topic on the SMN console first. Then when you create alarmrules, you can enable the Send Notification function and select the created topic. When anerror occurs, Cloud Eye can broadcast alarm information to those subscribers in real time.
11.1 Creating Alarm Notification TopicsThanks to the SMN real-time notification feature, Cloud Eye is able to notify you of resourcechanges by email, text messages, or by sending HTTP/HTTPS requests.
Therefore, before creating an alarm rule, you must create a topic on SMN first and addrelevant subscribers for this topic.
NOTE
If you have already created the topic you want to use with the new alarm rule, skip this section.
11.1.1 Creating Topics
Scenarios
A topic is a specific type of event in which messages are published and to which end userssubscribe for notifications. It serves as a message sending channel, where publishers andsubscribers can interact with each other.
In this section, you can create a topic that belongs to you.
Creating a Topic1. Log in to the management console.
2. Click in the upper left to select a region and a project.
Cloud EyeUser Guide 11 Using the Alarm Function
Issue 25 (2018-07-30) Huawei Proprietary and ConfidentialCopyright © Huawei Technologies Co., Ltd.
72

3. In the Application category, click Simple Message Notification.
The SMN console is displayed.
4. In the navigation pane, choose Topic Management > Topic.
The Topic page is displayed.
5. Click Create Topic.
The Create Topic box is displayed.
Figure 11-1 Create Topic
6. Enter a topic name and display name (topic description).
Table 11-1 Parameters required for creating a topic
Parameter Description
Topic Name Specifies the topic name, which:l Contains only upper or lower case letters, digits, hyphens (-),
and underscores (_) and must start with a letter or a number.l Must contain 1 to 256 characters.l Must be unique and cannot be modified once the topic is
created.
Display Name Specifies the message sender name, which must be less than 192bytes.NOTE
After you specify a display name, the sender in email messages will bepresented as Display name<[email protected]>. Otherwise, thesender will be [email protected].
7. Click OK.
The topic you created is displayed in the topic list.
After a topic is created, the system generates a topic URN, which uniquely identifies thetopic and cannot be changed. The topic you created is displayed in the topic list.
8. Click a topic name to view the topic details and the total number of topic subscriptions.
Cloud EyeUser Guide 11 Using the Alarm Function
Issue 25 (2018-07-30) Huawei Proprietary and ConfidentialCopyright © Huawei Technologies Co., Ltd.
73

11.1.2 Adding SubscriptionsA topic is a channel used by SMN to send broadcasts. Therefore, after the topic is created,you need to add related subscriptions. In this way, when the metric triggers an alarm, CloudEye is able to send the alarm information to subscriptions of this topic.
Adding Subscriptions1. Log in to the management console.2. In the Application category, click Simple Message Notification.
The SMN console is displayed.3. In the navigation pane, choose Topic Management > Topic.
The Topic page is displayed.4. Locate the topic to which you want to add subscriptions, click More under Operation,
and select Add Subscription.The Add Subscription box is displayed.
Figure 11-2 Add Subscription
5. Specify the subscription protocol and endpoints.6. Click OK.
The subscriptions you added are displayed in the subscription list.
11.2 Creating Alarm RulesYou can flexibly create alarm rules on the Cloud Eye console. You can create an alarm rulefor a specific metric or use the alarm template to create alarm rules in batch for multiple cloudservice resources.
Based on years of development and maintenance experience, Cloud Eye provides you withalarm templates tailored to the attributes of each service by default. In addition, Cloud Eyeprovides you with the function of adding custom templates. You can modify the defaultrecommended metrics, or add metrics as needed to create custom templates.
Cloud EyeUser Guide 11 Using the Alarm Function
Issue 25 (2018-07-30) Huawei Proprietary and ConfidentialCopyright © Huawei Technologies Co., Ltd.
74

11.2.1 Using Alarm Templates to Create Alarm RulesCloud Eye enables you to use alarm templates to create alarm rules, making it easy andconvenient to add or modify alarm rules for resources or cloud services, especially for a largenumber of resources and cloud services.
This section describes how to use the default alarm template to create an alarm rule for acloud service resource.
Creating Alarm Rules1. Log in to the management console.
2. Under Management & Deployment, click Cloud Eye.
3. Choose Alarm Management > Alarm Rules and click Create Alarm Rule.
4. On the Create Alarm Rule page, follow the prompts to set the parameters.
a. Select an object and configure parameters listed in Table 11-2. Click Next.
Figure 11-3 Create Alarm Rule
NOTE
If the monitored object is an ECS or BMS, search by name or ID is supported. Other cloudservices can be searched only by ID.
Table 11-2 Parameters
Parameter Description Example Value
Dimension Specifies the metric dimension of thealarm rule.
ECS
MonitoredObject
Specifies the resource for which the alarmrule is set. You can specify one or moreresources.
N/A
b. In the Select Metric step, select Import from template and configure parametersbased on Table 11-3.
Cloud EyeUser Guide 11 Using the Alarm Function
Issue 25 (2018-07-30) Huawei Proprietary and ConfidentialCopyright © Huawei Technologies Co., Ltd.
75

Figure 11-4 Import from Template
Table 11-3 Parameters
Parameter
Description ExampleValue
Source Specifies the means by which you create an alarmrule.
Import fromTemplate
Template Specifies the template to be imported. N/A
SendNotification
Specifies whether to notify users when alarms aretriggered. Notifications can be sent as emails ortext messages, or HTTP/HTTPS requests sent tothe servers.l Select Yes (recommended).l Select No.
Yes
TopicName
Specifies the name of the topic to which thealarm notification is sent.If you enable this function, you need to select atopic. If no desired topics are available, you needto create one first, whereupon the SMN service isinvoked. For details about how to create a topic,see the Simple Message Notification User Guide.
N/A
TriggerCondition
Specifies the condition for triggering the alarm.You can select one or more from the following:Generated alarm, Cleared alarm, andInsufficient data.
N/A
c. On the Specify Rule Name page, set the parameters as prompted. Click Finish.
Cloud EyeUser Guide 11 Using the Alarm Function
Issue 25 (2018-07-30) Huawei Proprietary and ConfidentialCopyright © Huawei Technologies Co., Ltd.
76

Table 11-4 Parameters
Parameter
Description ExampleValue
Name Specifies the alarm rule name. The systemgenerates a name randomly but you can change it.
alarm-b6al
Description
Provides supplementary information about thealarm rule. This parameter is optional.
N/A
After the alarm rule is created, if the specified metric data reaches the set threshold, CloudEye will immediately inform you that an error has occurred.
11.2.2 Creating a Custom Alarm Rule for a Specific MetricCloud Eye enables you to create alarm rules for a specific metric of a single or multiple cloudservices, making it convenient for you uniformly monitor a specific metric of such a service.
Adding Custom Alarm Rules1. Log in to the management console.2. Under Management & Deployment, click Cloud Eye.3. Choose Alarm Management > Alarm Rules and click Create Alarm Rule.4. On the Create Alarm Rule page, follow the prompts to set the parameters.
a. Select an object and configure parameters listed in Table 11-5. Click Next.
Figure 11-5 Create Alarm Rule
Table 11-5 Parameters
Parameter
Description Example Value
ResourceType
Specifies the name of the service for whichthe alarm rule is configured.
Elastic CloudServer
Cloud EyeUser Guide 11 Using the Alarm Function
Issue 25 (2018-07-30) Huawei Proprietary and ConfidentialCopyright © Huawei Technologies Co., Ltd.
77

Parameter
Description Example Value
Dimension Specifies the metric dimension of the alarmrule.
ECS
MonitoredObject
Specifies the resource for which the alarmrule is set. You can specify one or moreresources.
N/A
b. In the Select Metric step, select Manually create and configure parameters basedon Table 11-6.
Figure 11-6 Manually create
Table 11-6 Parameters
Parameter
Description Example Value
Source Specifies the means by which you create analarm rule.
Manually create
Metric For example:l CPU Usage
Indicates the CPU usage (%) of themonitored object.
l Memory UsageIndicates the percentage of memorycurrently in use. The unit is percent.
CPU Usage
Cloud EyeUser Guide 11 Using the Alarm Function
Issue 25 (2018-07-30) Huawei Proprietary and ConfidentialCopyright © Huawei Technologies Co., Ltd.
78

Parameter
Description Example Value
Threshold Specifies the condition for triggering the alarm.The threshold consists of a data type (raw data,average value, maximum value, minimumvalue, sum, or variance), an operator (>, ≥, <,≤, or =), and a critical value. For example, anaverage value greater than 80 could be set as acondition for triggering an alarm.
80
Occurrences
Specifies the number of sampling points when an alarm is triggered. Its value ranges from 1 to 5.For example, if Occurrences is set to n, the number of sampling points of the alarm rule is the sampling points in n consecutive monitoring intervals. Only if all the sampling points meet the threshold configured for the alarm rule, will the alarm rule status be refreshed as the Alarm status.
3
MonitoringInterval
Specifies the interval at which the alarm statusis updated based on the alarm rule.
5 minutes
AlarmSeverity
Specifies the severity of the alarm. Validvalues are Critical, Major, Minor, andInformational.
Major
SendNotification
Specifies whether to notify users when alarmsare triggered. Notifications can be sent asemails or text messages, or HTTP/HTTPSrequests sent to the servers.l Select Yes (recommended).l Select No.
Yes
TopicName
Specifies the name of the topic to which thealarm notification is sent.If you enable this function, you need to select atopic. If no desired topics are available, youneed to create one first, whereupon the SMNservice is invoked. For details about how tocreate a topic, see the Simple MessageNotification User Guide.
N/A
Cloud EyeUser Guide 11 Using the Alarm Function
Issue 25 (2018-07-30) Huawei Proprietary and ConfidentialCopyright © Huawei Technologies Co., Ltd.
79

Parameter
Description Example Value
TriggerCondition
Specifies the condition for triggering the alarm.You can select one or more from the following:Generated alarm, Cleared alarm, andInsufficient data.For example, if you select Insufficient data,then in the event that metric monitoring data isnot reported within three consecutive hours,the alarm rule status becomes Insufficientdata. Cloud Eye will then invoke the SMNservice to inform you of this alarm status.
N/A
c. On the Specify Rule Name page, set the parameters as prompted. Click Finish.
Table 11-7 Parameters
Parameter
Description Example Value
Name Specifies the alarm rule name. The systemgenerates a name randomly but you can changeit.
alarm-b6al
Description
Provides supplementary information about thealarm rule. This parameter is optional.
N/A
11.3 Example: Creating an Alarm Rule to Monitor ECSCPU Usage
This section describes how to create an alarm rule to monitor ECS CPU usage, in whichThreshold is set to > 80%.
Procedure1. Log in to the management console.
2. Click in the upper left to select a region and a project.3. Under Management & Deployment, click Cloud Eye.4. In the navigation pane on the left, choose Server Monitoring.
The list of ECSs on the public cloud platform is displayed.5. Locate the target ECS. In the Operation column, click More, and select Create Alarm
Rule.The Create Alarm Rule dialog box is displayed.
6. Configure the following parameters one by one:
a. Source: Select Manually create.
Cloud EyeUser Guide 11 Using the Alarm Function
Issue 25 (2018-07-30) Huawei Proprietary and ConfidentialCopyright © Huawei Technologies Co., Ltd.
80

b. Metric: Select CPU Usage from the drop-down list.c. Threshold: Select Raw data, ≥, and 80% successively.d. Occurrences: Select 3 from the drop-down list.e. Monitoring Interval: Set it to 5 minutes.f. Alarm Severity: Set it to Major.g. Send Notification: Select to enable this function.h. Topic Name: Select the topic created in section 11.1 Creating Alarm Notification
Topics.i. Trigger Condition: Select Generated alarm, Cleared alarm, and Insufficient
data.
Click Next.7. Specify Name and Description of the alarm rule. Click Finish.
11.4 Viewing the Alarm HistoryThe alarm history displays the status changes of all alarm rules in the last 30 days. You cantrace and view alarm records in a unified and convenient manner.
Procedure1. Log in to the management console.2. Under Management & Deployment, click Cloud Eye.3. Choose Alarm Management > Alarm History.
On the Alarm History page, you can view the status changes of all alarm rules from thelast 30 days.
NOTE
In the upper right corner of the Alarm History area is a calendar, in which you can view the alarmhistory of any desired time range within 30 days.
In the top right of the calendar, you can click All severities, All statuses, or All Resource Typesand choose from the drop-down menu to view different alarms in different statuses.
4. Click the target alarm rule to go to the Alarm Rules page. In the lower part of theAlarm History area, you can view the history of the selected alarm rule from the last 30days.
Cloud EyeUser Guide 11 Using the Alarm Function
Issue 25 (2018-07-30) Huawei Proprietary and ConfidentialCopyright © Huawei Technologies Co., Ltd.
81

Figure 11-7 Alarm History
NOTE
l In normal cases, alarms need to be triggered by calculation. Therefore, the alarm generationtime may be a few seconds later than the latest data triggering time.
l If monitoring data has been obtained, you have created or modified an alarm, and an alarm istriggered, the alarm generation time is dependent on the time when the alarm is triggered bythe alarm rule creation or modification.
Cloud EyeUser Guide 11 Using the Alarm Function
Issue 25 (2018-07-30) Huawei Proprietary and ConfidentialCopyright © Huawei Technologies Co., Ltd.
82

12 Alarm Rule Management
This section provides various procedures for adjusting alarm rules.
12.1 Modifying Alarm Rules
Procedure1. Log in to the management console.2. Under Management & Deployment, click Cloud Eye.3. Choose Alarm Management > Alarm Rules and click Create Alarm Rule.4. You can choose either of the following two methods to access the page for modifying
alarm rules:– On the Alarm Rules page, locate the row containing the target alarm rule and click
Modify.– On the Alarm Rules page, click the name of the target alarm rule. On the displayed
page, click Modify in the upper right corner.5. In the Modify Alarm Rule dialog box, modify parameters of the alarm rule, as listed in
Table 12-1.
Cloud EyeUser Guide 12 Alarm Rule Management
Issue 25 (2018-07-30) Huawei Proprietary and ConfidentialCopyright © Huawei Technologies Co., Ltd.
83

Figure 12-1 Modify Alarm Rule
Table 12-1 Parameters
Parameter Description ExampleValue
Name Specifies the alarm rule name. The systemgenerates a name randomly but you can changeit.
alarm-b6al
Description Provides supplementary information about thealarm rule. This parameter is optional.
N/A
Resource Type Specifies the name of the service for which thealarm rule is configured.
Elastic CloudServer
Dimension Specifies the metric dimension of the alarmrule.
ECS
Monitored Object Specifies the resource for which the alarm ruleis set. You can specify one or more resources.
N/A
Monitored Instance ID Specifies the resource ID. N/A
Metric For example:l CPU Usage
Indicates the CPU usage (%) of themonitored object.
l Memory UsageIndicates the percentage of memorycurrently in use. The unit is percent.
CPU Usage
Cloud EyeUser Guide 12 Alarm Rule Management
Issue 25 (2018-07-30) Huawei Proprietary and ConfidentialCopyright © Huawei Technologies Co., Ltd.
84

Parameter Description ExampleValue
Threshold Specifies the condition for triggering the alarm.The threshold consists of a data type (raw data,average value, maximum value, minimumvalue, sum, or variance), an operator (>, ≥, <, ≤,or =), and a critical value. For example, anaverage value greater than 80 could be set as acondition for triggering an alarm.
80
Occurrences Specifies the number of sampling points when an alarm is triggered. For example, if Occurrences is set to n, the number of sampling points of the alarm rule is the sampling points in n consecutive monitoring intervals. Only if all the sampling points meet the threshold configured for the alarm rule, will the alarm rule status be refreshed as the Alarm status.
3
Monitoring Interval Specifies the interval at which the alarm statusis updated based on the alarm rule.
5 minutes
Alarm Severity Specifies the severity of the alarm. Valid valuesare Critical, Major, Minor, andInformational.
Major
Send Notification Specifies whether to notify users by sendingemails or text messages, or by sending HTTP/HTTPS requests to the servers.
N/A
6. Click OK.
12.2 Disabling Alarm RulesOn the Alarm Rules page, locate the row that contains the target alarm rule, click Disable inthe Operation column, and click OK on the displayed Disable Alarm Rule dialog box.
If you want to delete multiple alarm rules, on the Alarm Rules page, select multiple alarmrules, click Disable under Add Alarm Rule, and click OK on the displayed Disable AlarmRule dialog box.
12.3 Enabling Alarm RulesOn the Alarm Rules page, locate the row that contains the target alarm rule, click Enable inthe Operation column, and click OK on the displayed Enable Alarm Rule dialog box.
If you want to enable multiple alarm rules, on the Alarm Rules page, select multiple alarmrules, click Enable under Add Alarm Rule, and click OK on the displayed Enable AlarmRule dialog box.
Cloud EyeUser Guide 12 Alarm Rule Management
Issue 25 (2018-07-30) Huawei Proprietary and ConfidentialCopyright © Huawei Technologies Co., Ltd.
85

12.4 Deleting Alarm RulesOn the Alarm Rules page, locate the row that contains the target alarm rule, click Delete inthe Operation column, and click OK on the displayed Delete Alarm Rule dialog box.
If you want to delete multiple alarm rules, on the Alarm Rules page, select multiple alarmrules, click Disable under Add Alarm Rule, and click OK on the displayed Delete AlarmRule dialog box.
Cloud EyeUser Guide 12 Alarm Rule Management
Issue 25 (2018-07-30) Huawei Proprietary and ConfidentialCopyright © Huawei Technologies Co., Ltd.
86

13 Alarm Templates
An alarm template is a group of alarm rules based on services. It helps you quickly createalarm rules for multiple resources of a cloud service in batch. Cloud Eye recommends alarmtemplates based on the attribute of each cloud service. Cloud Eye also allows you to choosemetrics and create custom templates as needed.
13.1 Viewing Alarm TemplatesIf this is not your first time logging in to Cloud Eye, perform the following steps to go to theAlarm Templates page:
1. Log in to the management console.2. Under Management & Deployment, click Cloud Eye.3. Choose Alarm Management > Alarm Templates.
On the Alarm Templates page, you can view, modify, or delete created templates. You canalso create custom templates.
13.2 Creating Custom Templates1. On the Alarm Templates page, click Create Custom Template.2. In the Select Template step, configure parameters based on Table 13-1.
Cloud EyeUser Guide 13 Alarm Templates
Issue 25 (2018-07-30) Huawei Proprietary and ConfidentialCopyright © Huawei Technologies Co., Ltd.
87

Figure 13-1 Create Custom Template
Table 13-1 Parameters
Parameter Description Example Value
Resource Type Specifies the name of the service forwhich the alarm rule is configured.
Elastic Cloud Server
Dimension Specifies the metric dimension of thealarm rule.
ECS
Import fromTemplate
l Yes– Select an existing template.
l No
N/A
3. Click Next. In the Add Alarm Rule step, configure parameters based on Table 13-2.
Figure 13-2 Add Alarm Rule
Cloud EyeUser Guide 13 Alarm Templates
Issue 25 (2018-07-30) Huawei Proprietary and ConfidentialCopyright © Huawei Technologies Co., Ltd.
88

Table 13-2 Parameters
Parameter Description ExampleValue
Metric For example:l CPU Usage
Indicates the CPU usage (%) of the monitoredobject.
l Memory UsageIndicates the percentage of memory currentlyin use. The unit is percent.
N/A
Rollup Valid values are Raw data, Avg., Max., Min.,Sum, and Variance.
N/A
Threshold Specifies the operator, which can be >, ≥, <, ≤, or=.
N/A
AlarmThreshold
Specifies the critical value that will trigger thealarm rule.
80
MonitoringInterval
Specifies the interval at which the alarm status isupdated based on the alarm rule.
5 minutes
Occurrences Specifies the number of sampling points when an alarm is triggered. For example, if Occurrences is set to n, the number of sampling points of the alarm rule is the sampling points in n consecutive monitoring intervals. Only if all the sampling points meet the threshold configured for the alarm rule, will the alarm rule status be refreshed as the Alarm status.
N/A
AlarmSeverity
Specifies the severity of the alarm. Valid valuesare Critical, Major, Minor, and Informational.
Major
Operation When the number of the custom metrics is two ormore than two, you can delete custom metrics.
N/A
4. Click Next. In the Specify Details step, configure parameters based on Table 13-3.
Table 13-3 Parameters
Parameter Description ExampleValue
Name Specifies the alarm rule name. The systemgenerates a name randomly but you can changeit.
alarmTemplate-ku0x
Description Provides supplementary information about thealarm template. This parameter is optional.
N/A
Cloud EyeUser Guide 13 Alarm Templates
Issue 25 (2018-07-30) Huawei Proprietary and ConfidentialCopyright © Huawei Technologies Co., Ltd.
89
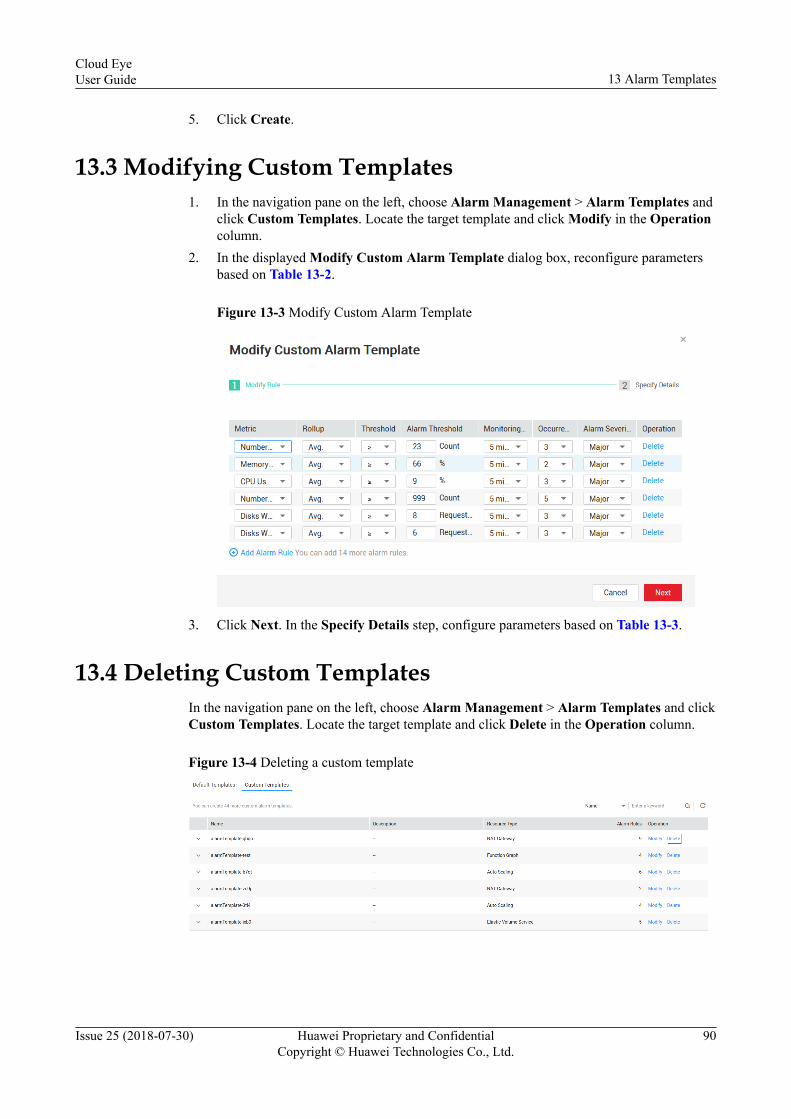
5. Click Create.
13.3 Modifying Custom Templates1. In the navigation pane on the left, choose Alarm Management > Alarm Templates and
click Custom Templates. Locate the target template and click Modify in the Operationcolumn.
2. In the displayed Modify Custom Alarm Template dialog box, reconfigure parametersbased on Table 13-2.
Figure 13-3 Modify Custom Alarm Template
3. Click Next. In the Specify Details step, configure parameters based on Table 13-3.
13.4 Deleting Custom TemplatesIn the navigation pane on the left, choose Alarm Management > Alarm Templates and clickCustom Templates. Locate the target template and click Delete in the Operation column.
Figure 13-4 Deleting a custom template
Cloud EyeUser Guide 13 Alarm Templates
Issue 25 (2018-07-30) Huawei Proprietary and ConfidentialCopyright © Huawei Technologies Co., Ltd.
90
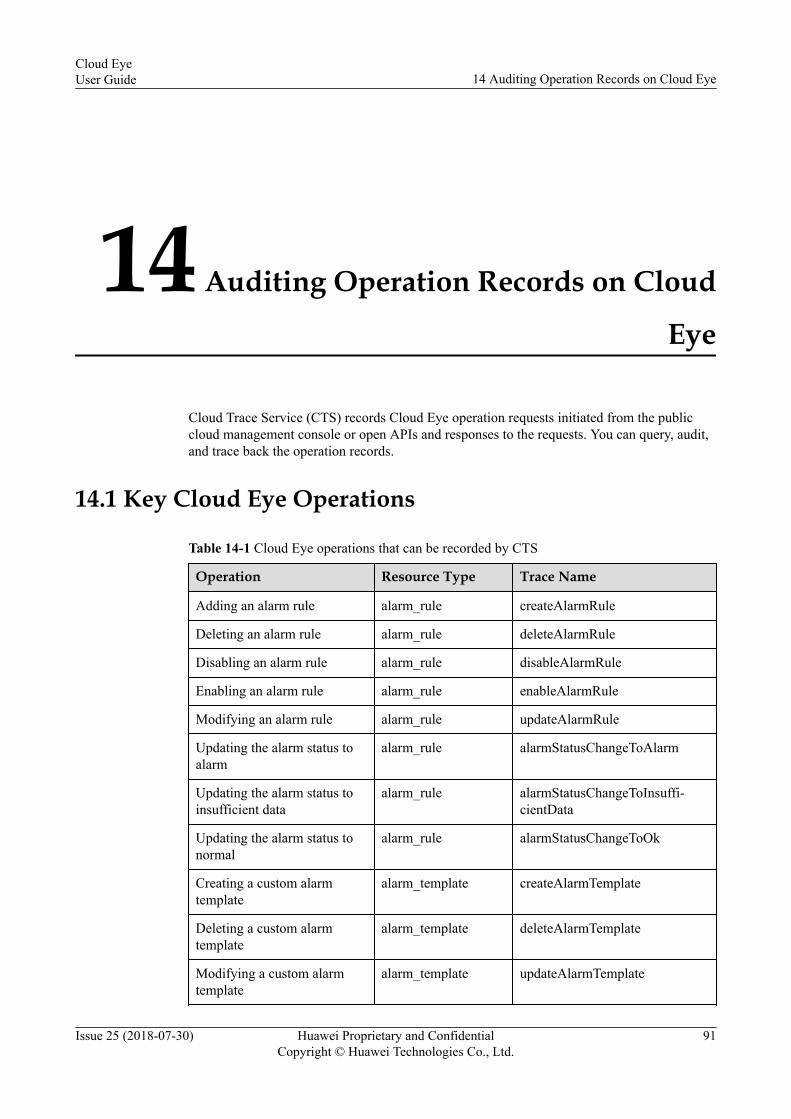
14 Auditing Operation Records on Cloud
Eye
Cloud Trace Service (CTS) records Cloud Eye operation requests initiated from the publiccloud management console or open APIs and responses to the requests. You can query, audit,and trace back the operation records.
14.1 Key Cloud Eye Operations
Table 14-1 Cloud Eye operations that can be recorded by CTS
Operation Resource Type Trace Name
Adding an alarm rule alarm_rule createAlarmRule
Deleting an alarm rule alarm_rule deleteAlarmRule
Disabling an alarm rule alarm_rule disableAlarmRule
Enabling an alarm rule alarm_rule enableAlarmRule
Modifying an alarm rule alarm_rule updateAlarmRule
Updating the alarm status toalarm
alarm_rule alarmStatusChangeToAlarm
Updating the alarm status toinsufficient data
alarm_rule alarmStatusChangeToInsuffi-cientData
Updating the alarm status tonormal
alarm_rule alarmStatusChangeToOk
Creating a custom alarmtemplate
alarm_template createAlarmTemplate
Deleting a custom alarmtemplate
alarm_template deleteAlarmTemplate
Modifying a custom alarmtemplate
alarm_template updateAlarmTemplate
Cloud EyeUser Guide 14 Auditing Operation Records on Cloud Eye
Issue 25 (2018-07-30) Huawei Proprietary and ConfidentialCopyright © Huawei Technologies Co., Ltd.
91

Operation Resource Type Trace Name
Creating a monitoring panel dashboard createDashboard
Deleting a monitoring panel dashboard deleteDashboard
Modifying a monitoring panel dashboard updateDashboard
Adding monitoring data metric addMetricData
Exporting monitoring data metric downloadMetricsReport
Configuring OBS transfer obs_transfer createObsTransfer
Modifying OBS transfer obs_transfer updateObsTransfer
Adding remote monitoringrules
remote_check createRemoteMonitoringRules
Deleting remote monitoringrules
remote_check deleteRemoteMonitoringRules
Modifying remote monitoringrules
remote_check updateRemoteMonitoringRule
14.2 Viewing Cloud Eye Logs
ScenariosAfter CTS is enabled, CTS starts recording operations on cloud resources. The CTSmanagement console stores the operation records of the last 7 days.
This section describes how to query the last seven days of operation records on the CTSconsole.
Procedure1. Log in to the management console.
2. Click in the upper left corner and select a region and project.3. Click Service List and choose Management & Deployment > Cloud Trace Service.4. In the left navigation pane, choose Trace List.5. Click Filter and specify filters as needed.
You can query traces using a combination of the following dimensions:– Trace Source, Resource Type, and Search By
Select a filter from the drop-down list.When you select Trace name for Search By, you also need to select a trace name.When you select Resource ID for Search By, you also need to select or enter aresource ID.When you select Resource name for Search By, you also need to select or enter aresource name.
Cloud EyeUser Guide 14 Auditing Operation Records on Cloud Eye
Issue 25 (2018-07-30) Huawei Proprietary and ConfidentialCopyright © Huawei Technologies Co., Ltd.
92

– Operator: Select an operator.– Trace Status: Select one of All trace statuses, normal, warning, and incident.– Time Range: Select a start and end date and time within the last seven days.
6. Click on the left of a trace to expand its details.
Figure 14-1 Expanding trace details
7. Click View Trace in the Operation column. On the displayed View Trace dialog box,view details of the trace.
Figure 14-2 View Trace
Cloud EyeUser Guide 14 Auditing Operation Records on Cloud Eye
Issue 25 (2018-07-30) Huawei Proprietary and ConfidentialCopyright © Huawei Technologies Co., Ltd.
93

15 Services Supported by Cloud Eye
15.1 Computing
15.1.1 ECS Metrics
Table 15-1 ECS metrics
Metric Windows ECS Linux ECS
CPU Usage √ √
Memory Usage √ ×
Disk Usage √ ×
Disks Read Rate √ √
Disks Write Rate √ √
Disks Read Requests √ √
Disks Write Requests √ √
Inband Incoming Rate √ ×
Inband Outcoming Rate √ ×
Outband Incoming Rate √ √
Outband Outcoming Rate √ √
Table 15-2 describes these ECS metrics.
Cloud EyeUser Guide 15 Services Supported by Cloud Eye
Issue 25 (2018-07-30) Huawei Proprietary and ConfidentialCopyright © Huawei Technologies Co., Ltd.
94

Table 15-2 ECS monitoring metrics
Metric Description Formula Remarks
CPU Usage Indicates the CPU usage (%)of an ECS.
CPU usage of an ECS/Number of CPU coresin the ECS
N/A
Memory Usage Indicates the memory usage(%) of an ECS.
Used memory of anECS/Total memory ofthe ECS
This metric isunavailable ifthe image hasno vmtoolsinstalled.
Disk Usage Indicates the disk usage (%)of an ECS.
Used capacity of anECS disk/Totalcapacity of the ECSdisk
This metric isunavailable ifthe image hasno vmtoolsinstalled.
Disks ReadRate
Indicates the number ofbytes read from an ECS persecond.
Total number of bytesread from an ECSdisk/Monitoringperiod
byte_out =(rd_bytes -last_rd_bytes) /Time difference
Disks WriteRate
Indicates the number ofbytes written to an ECS persecond.
Total number of byteswritten to an ECSdisk/Monitoringperiod
N/A
Disks ReadRequests
Indicates the number of readrequests sent to an ECS persecond.
Total number of readrequests sent to anECS disk/Monitoringperiod
req_out =(rd_req -last_rd_req)/Time difference
Disks WriteRequests
Indicates the number ofwrite requests sent to anECS per second.
Total number of writerequests sent to anECS disk/Monitoringperiod
req_in =(wr_req -last_wr_req)/Time difference
InbandIncoming Rate
Indicates the number ofincoming bytes on an ECSper second.
Total number ofinband incoming byteson an ECS/Monitoringperiod
N/A
InbandOutgoing Rate
Indicates the number ofoutgoing bytes on an ECSper second.
Total number ofinband outgoing byteson an ECS/Monitoringperiod
N/A
OutbandIncoming Rate
Indicates the number ofincoming bytes on an ECSper second at thevirtualization layer.
Total number ofoutband incomingbytes on an ECS/Monitoring period
This metric isunavailable ifSR-IOV isenabled.
Cloud EyeUser Guide 15 Services Supported by Cloud Eye
Issue 25 (2018-07-30) Huawei Proprietary and ConfidentialCopyright © Huawei Technologies Co., Ltd.
95

Metric Description Formula Remarks
OutbandOutgoing Rate
Indicates the number ofoutgoing bytes on an ECSper second at thevirtualization layer.
Total number ofoutband outgoingbytes on an ECS/Monitoring period
This metric isunavailable ifSR-IOV isenabled.
15.1.2 BMS Metrics
15.1.2.1 Metrics Under Basic Monitoring
Table 15-3 OS Monitoring metrics
Metric Description ValueRange
MonitoredObject
Overall CPUHealth Status
Overall CPU health status of themonitored objectThe possible values are:1 (ok)2 (minor)3 (major)4 (critical)5 (absence)6 (unknown)
1,2,3,4,5,6 BMS
Overall PowerHealth Status
Overall power health status of themonitored objectThe possible values are:1 (ok)2 (minor)3 (major)4 (critical)5 (absence)6 (unknown)
1,2,3,4,5,6 BMS
Cloud EyeUser Guide 15 Services Supported by Cloud Eye
Issue 25 (2018-07-30) Huawei Proprietary and ConfidentialCopyright © Huawei Technologies Co., Ltd.
96
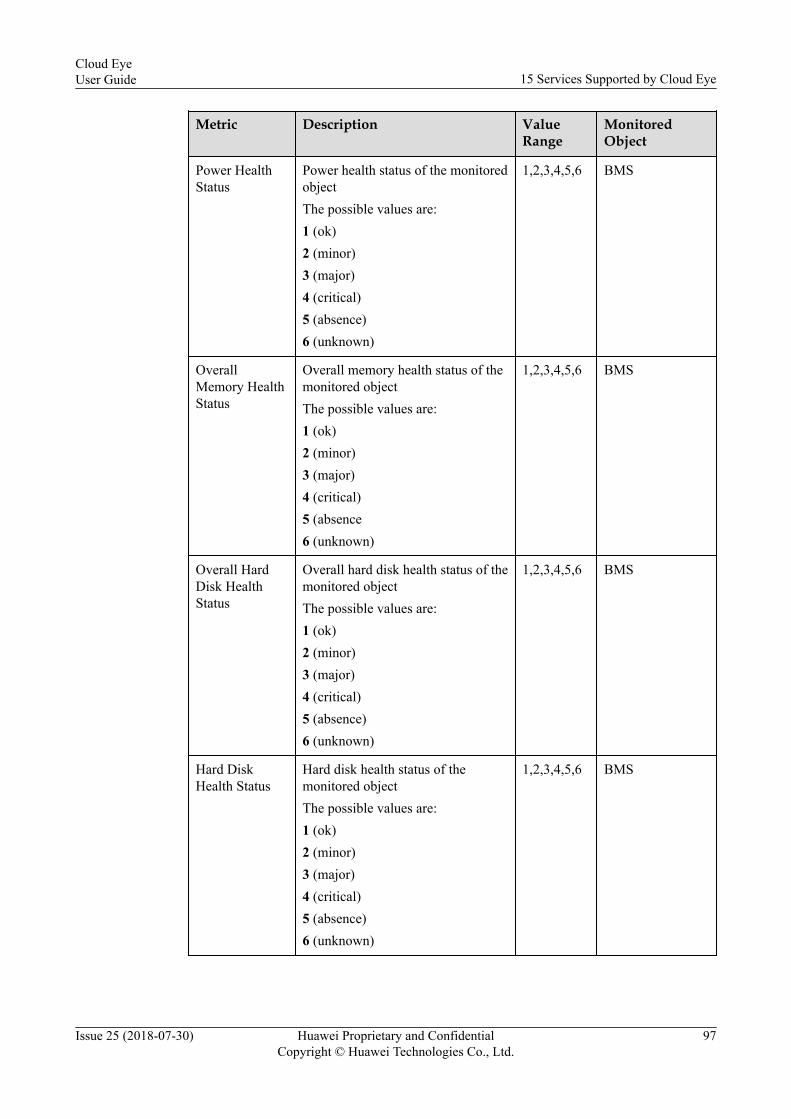
Metric Description ValueRange
MonitoredObject
Power HealthStatus
Power health status of the monitoredobjectThe possible values are:1 (ok)2 (minor)3 (major)4 (critical)5 (absence)6 (unknown)
1,2,3,4,5,6 BMS
OverallMemory HealthStatus
Overall memory health status of themonitored objectThe possible values are:1 (ok)2 (minor)3 (major)4 (critical)5 (absence6 (unknown)
1,2,3,4,5,6 BMS
Overall HardDisk HealthStatus
Overall hard disk health status of themonitored objectThe possible values are:1 (ok)2 (minor)3 (major)4 (critical)5 (absence)6 (unknown)
1,2,3,4,5,6 BMS
Hard DiskHealth Status
Hard disk health status of themonitored objectThe possible values are:1 (ok)2 (minor)3 (major)4 (critical)5 (absence)6 (unknown)
1,2,3,4,5,6 BMS
Cloud EyeUser Guide 15 Services Supported by Cloud Eye
Issue 25 (2018-07-30) Huawei Proprietary and ConfidentialCopyright © Huawei Technologies Co., Ltd.
97

Metric Description ValueRange
MonitoredObject
RAIDControllerHealth Status
RAID controller health status of themonitored objectThe possible values are:1 (ok)2 (warning)3 (critical)4 (null)
1,2,3,4 BMS
EthernetInterfaces LinkStatus
Ethernet interface link status of themonitored objectThe possible values are:1 (LinkUp)2 (NoLink)3 (LinkDown)
1,2,3 BMS
15.1.2.2 OS Monitoring MetricsSupported BMS OS Monitoring metrics include CPU metrics listed in Table 15-4, CPU loadmetrics listed in Table 15-5, memory metrics listed in Table 15-6, disk metrics listed in Table15-7, disk I/O metrics listed in Table 15-8, file system metrics listed in Table 15-9, NICmetrics listed in Table 15-10, and software RAID metrics listed in Table 15-11.
NOTE
l To monitor BMS, the Agent is required.
l To monitor software RAID metrics, Agent 1.0.5 or later is required.
l Currently, BMSs running the Windows OS cannot be monitored.
Table 15-4 CPU metrics
Metric Description ValueRange
MonitoredObject
Collection Mode
Idle CPU Usage Percentage oftime that CPUis idleUnit: Percent
0–100% BMS Check file /proc/statin 10-second intervals.Run the top commandto check the %Cpu(s)id value.
Cloud EyeUser Guide 15 Services Supported by Cloud Eye
Issue 25 (2018-07-30) Huawei Proprietary and ConfidentialCopyright © Huawei Technologies Co., Ltd.
98

Metric Description ValueRange
MonitoredObject
Collection Mode
Other ProcessCPU Usage
Percentage oftime that theCPU is used byother processesUnit: Percent
0–100% BMS The formulas are asfollows:Other Process CPUUsage = 1- Idle CPUUsage - Kernel SpaceCPU Usage - UserSpace CPU Usage
Kernel SpaceCPU Usage
Percentage oftime that theCPU is used bykernel spaceUnit: Percent
0–100% BMS Check file /proc/statin 10-second intervals.Run the top commandto check the %Cpu(s)sy value.
User SpaceCPU Usage
Percentage oftime that theCPU is used byuser spaceUnit: Percent
0–100% BMS Check file /proc/statin 10-second intervals.Run the top commandto check the %Cpu(s)us value.
Nice ProcessCPU Usage
Percentage oftime that theCPU is in usermode with low-priorityprocesses whichcan easily beinterrupted byhigher-priorityprocessesUnit: Percent
0–100% BMS Check file /proc/statin 10-second intervals.Run the top commandto check the %Cpu(s)ni value.
iowait ProcessCPU Usage
Percentage oftime that theCPU is waitingfor I/Ooperations tocompleteUnit: Percent
0–100% BMS Check file /proc/statin 10-second intervals.Run the top commandto check the %Cpu(s)wa value.
CPU InterruptTime
Percentage oftime that theCPU isservicinginterruptsUnit: Percent
0–100% BMS Check file /proc/statin 10-second intervals.Run the top commandto check the %Cpu(s)hi value.
Cloud EyeUser Guide 15 Services Supported by Cloud Eye
Issue 25 (2018-07-30) Huawei Proprietary and ConfidentialCopyright © Huawei Technologies Co., Ltd.
99

Metric Description ValueRange
MonitoredObject
Collection Mode
CPU SoftwareInterrupt Time
Percentage oftime that theCPU isservicingsoftwareinterruptsUnit: Percent
0–100% BMS Check file /proc/statin 10-second intervals.Run the top commandto check the %Cpu(s)si value.
Table 15-5 CPU load metrics
Metric Description ValueRange
Monitored Object
Collection Mode
1-Minute LoadAverage
CPU loadaveraged fromthe last 1minuteUnit: task/CPU
≥ 0 BMS Obtain its value byusing the load1/ valueto divide the number oflogical CPUs.Run the top commandto check the load1value in the /proc/loadavg file.
5-Minute LoadAverage
CPU loadaveraged fromthe last 5minutesUnit: task/CPU
≥ 0 BMS Obtain its value byusing the load5/ valueto divide the number oflogical CPUs.Run the top commandto check the load5value in the /proc/loadavg file.
15-Minute LoadAverage
CPU loadaveraged fromthe last 15minutesUnit: task/CPU
≥ 0 BMS Obtain its value byusing the load15/ valueto divide the number oflogical CPUs.Run the top commandto check the load15value in the /proc/loadavg file.
Cloud EyeUser Guide 15 Services Supported by Cloud Eye
Issue 25 (2018-07-30) Huawei Proprietary and ConfidentialCopyright © Huawei Technologies Co., Ltd.
100

Table 15-6 Memory metrics
Metric Description ValueRange
Monitored Object
Collection Mode
AvailableMemory
Amount ofmemory that isavailable andcan be giveninstantly toprocessesUnit: GB
≥ 0 GB BMS Obtain theMemAvailable valueby checking file /proc/meminfo. If it is notdisplayed in the file,MemAvailable =MemFree + Buffers+Cached
MemoryUsage
Percentage ofmemorycurrently in useUnit: Percent.
0–100% BMS Check file /proc/meminfo. MemoryUsage = (MemTotal-MemAvailable)/MemTotal
Idle Memory The amount ofmemory that isnot being usedUnit: GB
≥ 0 GB BMS Obtain its value bychecking file /proc/meminfo.
Buffer The amount ofmemory that isbeing used forbuffersUnit: GB
≥ 0 GB BMS Obtain its value bychecking file /proc/meminfo.Run the top commandto check the KiBMem:buffers value.
Cache The amount ofmemory that isbeing used forfile cachesUnit: GB
≥ 0 GB BMS Obtain its value bychecking file /proc/meminfo.Run the top commandto check the KiBSwap:cached Memvalue.
Cloud EyeUser Guide 15 Services Supported by Cloud Eye
Issue 25 (2018-07-30) Huawei Proprietary and ConfidentialCopyright © Huawei Technologies Co., Ltd.
101

Table 15-7 Disk metrics
Metric Description ValueRange
MonitoredObject
Collection Mode
Available DiskSpace
Sace that is notused on thedisksUnit: GB
≥ 0 GB BMS Run the df -hcommand to check thedata in the Availcolumn.The path of the mountpoint prefix cannotexceed 64 characters. Itmust start with a letter,and contain only digits,lowercase letters,uppercase letters,hyphens (-), dots (.),and swung dashes (~).
Disk StorageCapacity
Total space onthe disks,including usedand freeUnit: GB
≥ 0 GB BMS Run the df -hcommand to check thedata in the Sizecolumn.The path of the mountpoint prefix cannotexceed 64 characters. Itmust start with a letter,and contain only digits,lowercase letters,uppercase letters,hyphens (-), dots (.),and swung dashes (~).
Used DiskSpace
Used space onthe disksUnit: GB
≥ 0 GB BMS Run the df -hcommand to check thedata in the Usedcolumn.The path of the mountpoint prefix cannotexceed 64 characters. Itmust start with a letter,and contain only digits,lowercase letters,uppercase letters,hyphens (-), dots (.),and swung dashes (~).
Cloud EyeUser Guide 15 Services Supported by Cloud Eye
Issue 25 (2018-07-30) Huawei Proprietary and ConfidentialCopyright © Huawei Technologies Co., Ltd.
102

Metric Description ValueRange
MonitoredObject
Collection Mode
Disk Usage Percentage oftotal disk spacethat is usedUnit: PercentIt is calculatedas follows: DiskUsage = UsedDisk Space/Disk StorageCapacity
0–100% BMS Used/SizeThe path of the mountpoint prefix cannotexceed 64 characters. Itmust start with a letter,and contain only digits,lowercase letters,uppercase letters,hyphens (-), dots (.),and swung dashes (~).
Table 15-8 Disk I/O metrics
Metric Description ValueRange
MonitoredObject
Collection Mode
Disks ReadRate
Number of bytesread from themonitored diskper secondUnit: Byte/s
≥ 0 bytes/s BMS The disks read rate iscalculated bycalculating the datachanges in the sixthcolumn of thecorresponding devicein file /proc/diskstatsin 10-second intervals.The path of the mountpoint prefix cannotexceed 64 characters. Itmust start with a letter,and contain only digits,lowercase letters,uppercase letters,hyphens (-), dots (.),and swung dashes (~).
Cloud EyeUser Guide 15 Services Supported by Cloud Eye
Issue 25 (2018-07-30) Huawei Proprietary and ConfidentialCopyright © Huawei Technologies Co., Ltd.
103

Metric Description ValueRange
MonitoredObject
Collection Mode
Disks ReadRequests
Number of readrequests sent tothe monitoreddisk per secondUnit: Request/s
≥ 0requests/s
BMS The disks read requestsare calculated bycalculating the datachanges in the fourthcolumn of thecorresponding devicein file /proc/diskstatsin 10-second intervals.The path of the mountpoint prefix cannotexceed 64 characters. Itmust start with a letter,and contain only digits,lowercase letters,uppercase letters,hyphens (-), dots (.),and swung dashes (~).
Disks WriteRate
Number of byteswritten to themonitored diskper secondUnit: Byte/s
≥ 0 bytes/s BMS The disks write rate iscalculated bycalculating the datachanges in the tenthcolumn of thecorresponding devicein file /proc/diskstatsin 10-second intervals.The path of the mountpoint prefix cannotexceed 64 characters. Itmust start with a letter,and contain only digits,lowercase letters,uppercase letters,hyphens (-), dots (.),and swung dashes (~).
Cloud EyeUser Guide 15 Services Supported by Cloud Eye
Issue 25 (2018-07-30) Huawei Proprietary and ConfidentialCopyright © Huawei Technologies Co., Ltd.
104

Metric Description ValueRange
MonitoredObject
Collection Mode
Disks WriteRequests
Number of writerequests sent tothe monitoreddisk per secondUnit: Request/s
≥ 0requests/s
BMS The disks writerequests are calculatedby calculating the datachanges in the eighthcolumn of thecorresponding devicein file /proc/diskstatsin 10-second intervals.The path of the mountpoint prefix cannotexceed 64 characters. Itmust start with a letter,and contain only digits,lowercase letters,uppercase letters,hyphens (-), dots (.),and swung dashes (~).
Average ReadRequest Time
Average amountof time that readrequests havewaited on thedisksUnit: ms/count
≥ 0 BMS The average readrequest time iscalculated bycalculating the datachanges in the seventhcolumn of thecorresponding devicein file /proc/diskstatsin 10-second intervals.The path of the mountpoint prefix cannotexceed 64 characters. Itmust start with a letter,and contain only digits,lowercase letters,uppercase letters,hyphens (-), dots (.),and swung dashes (~).
Cloud EyeUser Guide 15 Services Supported by Cloud Eye
Issue 25 (2018-07-30) Huawei Proprietary and ConfidentialCopyright © Huawei Technologies Co., Ltd.
105

Metric Description ValueRange
MonitoredObject
Collection Mode
Average WriteRequest Time
Average amountof time thatwrite requestshave waited onthe disksUnit: ms/count
≥ 0 BMS The average writerequest time iscalculated bycalculating the datachanges in the eleventhcolumn of thecorresponding devicein file /proc/diskstatsin 10-second intervals.The path of the mountpoint prefix cannotexceed 64 characters. Itmust start with a letter,and contain only digits,lowercase letters,uppercase letters,hyphens (-), dots (.),and swung dashes (~).
Disk I/OUsage
Percentage ofthe time that thedisk has had I/Orequests queuedto the total diskoperation timeUnit: Percent
≥ 0 BMS The disk I/O usage iscalculated bycalculating the datachanges in thethirteenth column ofthe correspondingdevice in file /proc/diskstats in 10-secondintervals.The path of the mountpoint prefix cannotexceed 64 characters. Itmust start with a letter,and contain only digits,lowercase letters,uppercase letters,hyphens (-), dots (.),and swung dashes (~).
File SystemRead/WriteStatus
Indicates theread and writestatus of themounted filesystem of themonitoredobject. Possiblevalues are 0(read and write)and 1 (readonly).
0,1 Monitoredobject: ECS
Check file systeminformation in thefourth column in file /proc/mounts.
Cloud EyeUser Guide 15 Services Supported by Cloud Eye
Issue 25 (2018-07-30) Huawei Proprietary and ConfidentialCopyright © Huawei Technologies Co., Ltd.
106

Table 15-9 File system metrics
Metric Description ValueRange
Monitored Object
Collection Mode
Disk inodeTotal
Total number ofindex nodes onthe disk
≥ 0 BMS Run the df -i commandto check the data in theInodes column.The path of the mountpoint prefix cannotexceed 64 characters. Itmust start with a letter,and contain only digits,lowercase letters,uppercase letters,hyphens (-), dots (.),and swung dashes (~).
Total inodeUsed
Number of usedindex nodes onthe disk
≥ 0 BMS Run the df -i commandto check the data in theIUsed column.The path of the mountpoint prefix cannotexceed 64 characters. Itmust start with a letter,and contain only digits,lowercase letters,uppercase letters,hyphens (-), dots (.),and swung dashes (~).
Percentage ofTotal inodeUsed
Percentage ofused index nodesto the total indexnodes on the diskUnit: Percent
0-100% BMS Run the df -i commandto check the data in theIUse% column.The path of the mountpoint prefix cannotexceed 64 characters. Itmust start with a letter,and contain only digits,lowercase letters,uppercase letters,hyphens (-), dots (.),and swung dashes (~).
Cloud EyeUser Guide 15 Services Supported by Cloud Eye
Issue 25 (2018-07-30) Huawei Proprietary and ConfidentialCopyright © Huawei Technologies Co., Ltd.
107

Table 15-10 NIC metrics
Metric Description ValueRange
MonitoredObject
Collection Mode
InboundBandwidth
Bits sent persecond of themonitored objectNICUnit: bit/s
≥ 0 bits/s BMS Check the metric valuechanges in file /proc/net/dev in a 10sinterval.
OutboundBandwidth
Bits received persecond of themonitored objectNICUnit: bit/s
≥ 0 bits/s BMS
NIC PacketReceive Rate
Number ofpackets receivedby this networkinterface persecondUnit: Count/s
≥ 0 counts/s BMS
NIC PacketSend Rate
Number ofpackets sent bythis networkinterface persecondUnit: Count/s
≥ 0 counts/s BMS
Receive ErrorRate
Percentage ofreceive errorsdetected by thisnetwork interfaceper secondUnit: Percent
0-100% BMS
TransmitError Rate
Percentage oftransmit errorsdetected by thisnetwork interfaceper secondUnit: Percent
0-100% BMS
ReceivedPacket DropRate
Percentage ofpackets receivedby this networkinterface whichwere dropped persecondUnit: Percent
0-100% BMS
Cloud EyeUser Guide 15 Services Supported by Cloud Eye
Issue 25 (2018-07-30) Huawei Proprietary and ConfidentialCopyright © Huawei Technologies Co., Ltd.
108

Metric Description ValueRange
MonitoredObject
Collection Mode
TransmittedPacket DropRate
Percentage ofpacketstransmitted bythis networkinterface whichwere dropped persecondUnit: Percent
0-100% BMS
Table 15-11 Software RAID metrics
Metric Description Value Range MonitoredObject
Collection Mode
Status Status of thesoftware RAIDdevices of themonitored objectIf the RAID isabnormal, the valueis 0.
0 or 1NOTE
If the RAID isnormal, the valueis 1. If the RAIDis abnormal, thevalue is 0.
BMS Run the plug-inscript /usr/local/telescope/plugins/raid-monitor.sh in10-second intervals.Obtain its value bycalculating the datachanges in the /proc/mdstat file and runthe mdadm -D/dev/md0 (RAIDname) command.NOTE
In the precedingcommand, 10sindicates the metriccollection periodconfigured in the RAIDplug-in.
ActiveDisks
Number of activedisks of thesoftware RAID ofthe monitoredobjectThe parametervalue is -1 if theRAID is abnormal.
≥ 0 or -1NOTE
If the RAID isnormal, the valueis 0. If the RAIDis abnormal, thevalue is -1.
BMS
WorkingDisks
Number of workingdisks of thesoftware RAID ofthe monitoredobjectThe parametervalue is -1 if theRAID is abnormal.
≥ 0 or -1NOTE
If the RAID isnormal, the valueis 0. If the RAIDis abnormal, thevalue is -1.
BMS
Cloud EyeUser Guide 15 Services Supported by Cloud Eye
Issue 25 (2018-07-30) Huawei Proprietary and ConfidentialCopyright © Huawei Technologies Co., Ltd.
109

Metric Description Value Range MonitoredObject
Collection Mode
FailedDisks
Number of faileddisks of thesoftware RAID ofthe monitoredobjectThe parametervalue is -1 if theRAID is abnormal.
≥ 0 or -1NOTE
If the RAID isnormal, the valueis 0. If the RAIDis abnormal, thevalue is -1.
BMS
Spare Disks Number of sparedisks of thesoftware RAID ofthe monitoredobjectThe parametervalue is -1 if theRAID is abnormal.
≥ 0 or -1NOTE
If the RAID isnormal, the valueis 0. If the RAIDis abnormal, thevalue is -1.
BMS
15.1.3 AS Metrics
Table 15-12 AS metrics
Metric Description Formula Description
CPU Usage Indicates the CPU usage(%) of an AS group.
CPU usage of all instancesin an AS group/Number ofvCPUs of all instances inthe AS group
N/A
Memory Usage Indicates the memoryusage (%) of an ASgroup.
Used memory of allinstances in an AS group/Total memory of allinstances in the AS group
This metric isunavailable ifthe in-serviceimage has noVM toolsinstalled.
Number ofInstances
Specifies the number ofavailable instances in anAS group.
Total number of functionalinstances in an AS group
N/A
InbandIncoming Rate
Indicates the number ofincoming bytes on theinstances in an ASgroup per second.
(Total number of inbandincoming bytes on allinstances in an AS group/Total number of instancesin the AS group)/Monitoring period
N/A
Cloud EyeUser Guide 15 Services Supported by Cloud Eye
Issue 25 (2018-07-30) Huawei Proprietary and ConfidentialCopyright © Huawei Technologies Co., Ltd.
110

Metric Description Formula Description
InbandOutcoming Rate
Indicates the number ofoutgoing bytes on theinstances in an ASgroup per second.
(Total number of inbandoutgoing bytes on allinstances in an AS group/Total number of instancesin the AS group)/Monitoring period
N/A
Disks ReadRate
Indicates the number ofbytes read from allinstances in an ASgroup per second.
(Total number of bytes readfrom all instances in an ASgroup/Total number ofinstances in the AS group)/Monitoring period
N/A
Disks WriteRate
Indicates the number ofbytes written to allinstances in an ASgroup per second.
(Total number of byteswritten to all instances inan AS group/Total numberof instances in the ASgroup)/Monitoring period
N/A
Disks ReadRequests
Indicates the number ofread requests sent to allinstances in an ASgroup per second.
(Total number of readrequests sent to allinstances in an AS group/Total number of instancesin the AS group)/Monitoring period
N/A
Disks WriteRequests
Indicates the number ofwrite requests sent to allinstances in an ASgroup per second.
(Total number of writerequests sent to allinstances in an AS group/Total number of instancesin the AS group)/Monitoring period
N/A
NOTE
For details about whether your OS supports the Memory Usage, Inband Outgoing Rate, and InbandIncoming Rate metrics, see the Elastic Cloud Server User Guide.
15.2 Storage
Cloud EyeUser Guide 15 Services Supported by Cloud Eye
Issue 25 (2018-07-30) Huawei Proprietary and ConfidentialCopyright © Huawei Technologies Co., Ltd.
111

15.2.1 EVS Metrics
Table 15-13 EVS metrics
Metric Definition MonitoredObject
Formula
Disk ReadRate
Number of bytes read fromthe monitored disk persecondUnit: Byte/s
EVS disk Total number of bytes readfrom an EVS disk attachedto the server/Monitoringperiod
Disk WriteRate
Number of bytes written tothe monitored disk persecondUnit: Byte/s
EVS disk Total number of byteswritten to an EVS diskattached to the server/Monitoring period
Disk ReadRequests
Number of read requestssent to the monitored diskper secondUnit: Request/s
EVS disk Total number of requestsfor reading data from anEVS disk attached to theserver/Monitoring period
Disk WriteRequests
Number of write requestssent to the monitored diskper secondUnit: Request/s
EVS disk Total number of requestsfor writing data into anEVS disk attached to theserver/Monitoring period
15.2.2 OBS Metrics
Table 15-14 OBS Metrics
Metric Description ValueRange
Monitored Object
BytesDownloaded
Response bytes of all download requestsmade to all buckets in a region, includingbytes in HTTP bodiesUnit: Byte
≥ 0 bytes OBS
BytesUploaded
Bytes in the message bodies of all uploadrequests made to all buckets in a region,including bytes in HTTP bodiesUnit: Byte
≥ 0 bytes OBS
GET Requests Number of GET, HEAD, or OPTIONSrequests made to all buckets and objects inthe buckets of a regionUnit: Count
≥ 0 counts OBS
Cloud EyeUser Guide 15 Services Supported by Cloud Eye
Issue 25 (2018-07-30) Huawei Proprietary and ConfidentialCopyright © Huawei Technologies Co., Ltd.
112
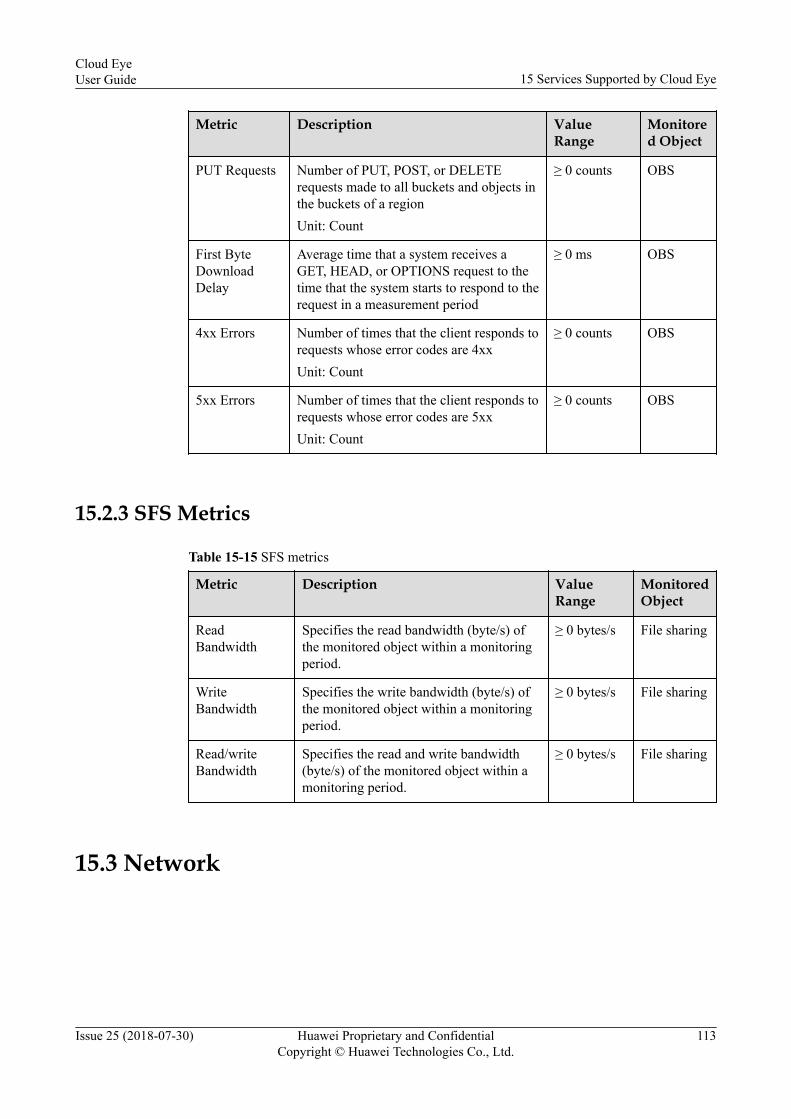
Metric Description ValueRange
Monitored Object
PUT Requests Number of PUT, POST, or DELETErequests made to all buckets and objects inthe buckets of a regionUnit: Count
≥ 0 counts OBS
First ByteDownloadDelay
Average time that a system receives aGET, HEAD, or OPTIONS request to thetime that the system starts to respond to therequest in a measurement period
≥ 0 ms OBS
4xx Errors Number of times that the client responds torequests whose error codes are 4xxUnit: Count
≥ 0 counts OBS
5xx Errors Number of times that the client responds torequests whose error codes are 5xxUnit: Count
≥ 0 counts OBS
15.2.3 SFS Metrics
Table 15-15 SFS metrics
Metric Description ValueRange
MonitoredObject
ReadBandwidth
Specifies the read bandwidth (byte/s) ofthe monitored object within a monitoringperiod.
≥ 0 bytes/s File sharing
WriteBandwidth
Specifies the write bandwidth (byte/s) ofthe monitored object within a monitoringperiod.
≥ 0 bytes/s File sharing
Read/writeBandwidth
Specifies the read and write bandwidth(byte/s) of the monitored object within amonitoring period.
≥ 0 bytes/s File sharing
15.3 Network
Cloud EyeUser Guide 15 Services Supported by Cloud Eye
Issue 25 (2018-07-30) Huawei Proprietary and ConfidentialCopyright © Huawei Technologies Co., Ltd.
113

15.3.1 VPC Metrics
Table 15-16 VPC metrics
Metric Description Value Range MonitoredObject
OutboundBandwidth(Deprecated)
Network rate of outbound traffic(The original metric name isUpstream Bandwidth.)
≥ 0 bytes/s Bandwidth orEIP
InboundBandwidth(Deprecated)
Network rate of inbound traffic(The original metric name isDownstream Bandwidth.)
≥ 0 bytes/s Bandwidth orEIP
OutboundBandwidth
Network rate of outbound traffic(The original metric name isUpstream Bandwidth.)
≥ 0 bits/s Bandwidth orEIP
InboundBandwidth
Network rate of inbound traffic(The original metric name isDownstream Bandwidth.)
≥ 0 bits/s Bandwidth orEIP
UpstreamBandwidthUsage
Usage of network rate ofoutbound trafficUnit: Percent.
1-100% Bandwidth orEIP
OutboundTraffic
Network traffic going out of thecloud platform(The original metric name isUpstream Traffic.)
≥ 0 bytes Bandwidth orEIP
InboundTraffic
Network traffic going into thecloud platform(The original metric name isDownstream Traffic.)
≥ 0 bytes Bandwidth orEIP
15.3.2 ELB Metrics
Table 15-17 Load balancer metrics
Metric Description
ConcurrentConnections
Total number of concurrent connections processed by the load balancer
ActiveConnections
Total number of active connections processed by the load balancer
Cloud EyeUser Guide 15 Services Supported by Cloud Eye
Issue 25 (2018-07-30) Huawei Proprietary and ConfidentialCopyright © Huawei Technologies Co., Ltd.
114

Metric Description
InactiveConnections
Total number of inactive connections processed by the load balancer
NewConnections
Total number of new connections processed by the load balancer
IncomingPackets
Number of incoming packets received by the load balancer per secondUnit: Packet/s
OutgoingPackets
Number of outgoing packets send from the load balancer per secondUnit: Packet/s
Inbound Rate Number of incoming bytes received by the load balancer per secondUnit: Byte/s
Outbound Rate Number of outgoing bytes sent from the load balancer per secondUnit: Byte/s
AbnormalHosts
Number of backend servers considered unhealthy
Normal Hosts Number of backend servers considered healthy
Table 15-18 Enhanced load balancer listener metrics
Metric Description
ConcurrentConnections
Total number of concurrent connections processed by the listener
ActiveConnections
Total number of active connections processed by the listener
InactiveConnections
Total number of inactive connections processed by the listener
NewConnections
Total number of new connections processed by the listener
IncomingPackets
Number of incoming packets received by the listener per secondUnit: Packet/s
OutgoingPackets
Number of outgoing packets send from the listener per secondUnit: Packet/s
Inbound Rate Number of incoming bytes received by the listener per secondUnit: Byte/s
Outbound Rate Number of outgoing bytes send from the listener per secondUnit: Byte/s
Cloud EyeUser Guide 15 Services Supported by Cloud Eye
Issue 25 (2018-07-30) Huawei Proprietary and ConfidentialCopyright © Huawei Technologies Co., Ltd.
115

15.3.3 NAT Gateway Metrics
Table 15-19 NAT Gateway Metrics
Metric Description ValueRange
MonitoredObject
SNATConnections
Number of SNAT connections initiatedby the current user
≥ 0 count Active node ofNAT gateway
15.4 Security
15.4.1 WAF Metrics
Table 15-20 WAF metrics
Metric Description Value Range Monitored Object
SQL InjectionAlarms
Collects the numberof SQL injectionalarms of amonitored object.
≥ 0 counts ECS
cross site script(XSS) VulnerabilityAlarms
Collects the numberof XSS vulnerabilityalarms of amonitored object.
≥ 0 counts ECS
Webshell UploadAlarms
Collects the numberof webshell uploadalarms of amonitored object.
≥ 0 counts ECS
Link Theft Alarms Collects the numberof link theft alarmsof a monitoredobject.
≥ 0 counts ECS
IP Address BlacklistAlarms
Collects the numberof IP addressblacklist alarms of amonitored object.
≥ 0 counts ECS
IP Address WhitelistAlarms
Collects the numberof IP addresswhitelist alarms of amonitored object.
≥ 0 counts ECS
Cloud EyeUser Guide 15 Services Supported by Cloud Eye
Issue 25 (2018-07-30) Huawei Proprietary and ConfidentialCopyright © Huawei Technologies Co., Ltd.
116

15.5 Application
15.5.1 DMS Metrics
Table 15-21 DMS metrics
Metric Description ValueRange
MonitoredObject
QueuedMessages
Specifies the current number ofmessages in a queue.Messages older than 72 hours will bedeleted from a queue and deletedmessages are not counted into themetric. Dead letter messages Dead lettermessages are specific to consumergroups and stored in dead letter queues.Therefore, generation and expiry of deadletter messages do not affect the metric.
≥ 0 DMS queue
Message Size(byte)
Specifies the total size of messages sentto a queue during the past minute.This metric gives you an overview ofmessage load flowing into a queue.
≥ 0 DMS queue
Request Count Specifies the total number of requestssent to a queue during the past minute.
≥ 0 DMS queue
AccumulatedMessages
Specifies the current number ofmessages that are not retrieved by aconsumer group.Dead letter messages older than 72hours will be deleted from a queue.Once deleted, dead letter messages canno longer be retrieved by a consumergroup and therefore they are not countedinto the metric.Dead letter messages are flagged asretrieved messages and therefore notcounted into the metric.
≥ 0 DMS consumergroup
Cloud EyeUser Guide 15 Services Supported by Cloud Eye
Issue 25 (2018-07-30) Huawei Proprietary and ConfidentialCopyright © Huawei Technologies Co., Ltd.
117

Metric Description ValueRange
MonitoredObject
ConsumedMessages
Specifies the accumulated number ofmessages retrieved by a consumer groupsince the consumer group is created.Dead letter messages are counted intothe metric because dead letter messagesare flagged as retrieved messages.The count of skipped messages isaccumulated since a consumer group iscreated.
≥ 0 DMS consumergroup
SkippedMessages
Specifies the accumulated number ofmessages that are deleted and neverretrieved.The count of skipped messages isaccumulated since a consumer group iscreated.Messages older than 72 hours will bedeleted from a queue. Deleted messagescan no longer be retrieved by aconsumer group.The count of skipped messages includesthe messages filtered out by messagelabels during message retrieval. Forexample, if only message 1 and message10 match the preset label, then only thetwo messages are retrieved this time andthe next retrieval starts from message11. This means that messages 2–9 areskipped.After the retrieval start position is reset,messages ahead of the retrieval startposition will be flagged as retrievedmessages and the number of skippedmessages will be reset to zero.
≥ 0 DMS consumergroup
AvailableDead LetterMessages
Specifies the current number of deadletter messages that are not retrieved bya consumer group.Dead letter messages older than 72hours will be deleted from a queue.Once deleted, dead letter messages canno longer be retrieved by a consumergroup and therefore they are not countedinto the metric.
≥ 0 DMS consumergroup
Cloud EyeUser Guide 15 Services Supported by Cloud Eye
Issue 25 (2018-07-30) Huawei Proprietary and ConfidentialCopyright © Huawei Technologies Co., Ltd.
118
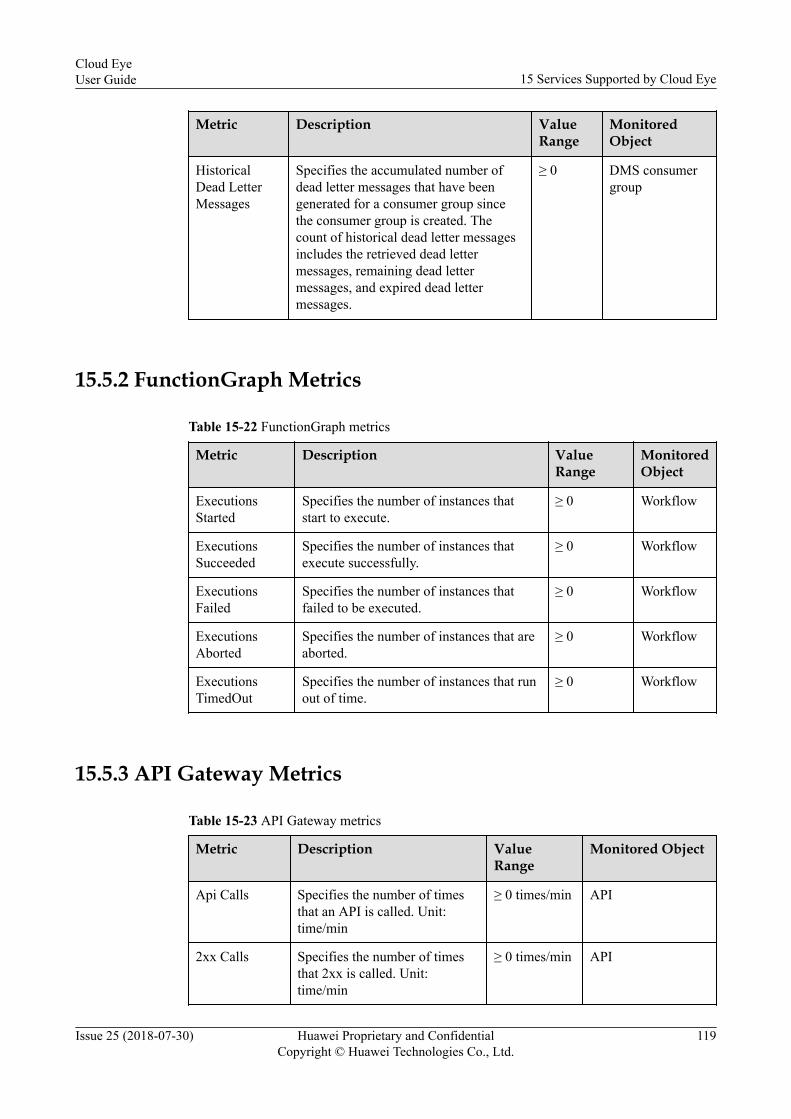
Metric Description ValueRange
MonitoredObject
HistoricalDead LetterMessages
Specifies the accumulated number ofdead letter messages that have beengenerated for a consumer group sincethe consumer group is created. Thecount of historical dead letter messagesincludes the retrieved dead lettermessages, remaining dead lettermessages, and expired dead lettermessages.
≥ 0 DMS consumergroup
15.5.2 FunctionGraph Metrics
Table 15-22 FunctionGraph metrics
Metric Description ValueRange
MonitoredObject
ExecutionsStarted
Specifies the number of instances thatstart to execute.
≥ 0 Workflow
ExecutionsSucceeded
Specifies the number of instances thatexecute successfully.
≥ 0 Workflow
ExecutionsFailed
Specifies the number of instances thatfailed to be executed.
≥ 0 Workflow
ExecutionsAborted
Specifies the number of instances that areaborted.
≥ 0 Workflow
ExecutionsTimedOut
Specifies the number of instances that runout of time.
≥ 0 Workflow
15.5.3 API Gateway Metrics
Table 15-23 API Gateway metrics
Metric Description ValueRange
Monitored Object
Api Calls Specifies the number of timesthat an API is called. Unit:time/min
≥ 0 times/min API
2xx Calls Specifies the number of timesthat 2xx is called. Unit:time/min
≥ 0 times/min API
Cloud EyeUser Guide 15 Services Supported by Cloud Eye
Issue 25 (2018-07-30) Huawei Proprietary and ConfidentialCopyright © Huawei Technologies Co., Ltd.
119

Metric Description ValueRange
Monitored Object
4xx Errors Specifies the number of timesthat an API returns 4xx errors.Unit: time/min
≥ 0 times/min API
5xx Errors Specifies the number of timesthat an API returns 5xx errors.Unit: time/min
≥ 0 times/min API
Average DelayMilliseconds
Specifies the average responsedelay time of an API. Unit:millisecond
≥ 0 ms API
Max DelayMilliseconds
Specifies the maximumresponse delay time of an API.Unit: millisecond
≥ 0 ms API
OutputThroughput
Specifies the output throughputreturned by an API. Unit: byte
≥ 0 bytes API
InputThroughput
Specifies the input throughputrequested by an API. Unit: byte
≥ 0 bytes API
Total Numberof Errors
Specifies the total number oferrors of an API. Unit: time/min
≥ 0 times/min API
15.6 Database
15.6.1 RDS Metrics
Table 15-24 RDS metrics
Metric Description Value Range MonitoredObject
CPU Usage(deprecated)
Indicates the CPU usage of themonitored object. The unit is ratio.
0-1 ECS
CPU Usage Indicates the CPU usage of themonitored object. The unit ispercent.
0-100% Elastic CloudServer
MemoryUsage(deprecated)
Indicates the memory usage of themonitored object. The unit is ratio.
0-1 ECS
MemoryUsage
Indicates the memory usage of themonitored object. The unit ispercent.
0-100% Elastic CloudServer
Cloud EyeUser Guide 15 Services Supported by Cloud Eye
Issue 25 (2018-07-30) Huawei Proprietary and ConfidentialCopyright © Huawei Technologies Co., Ltd.
120

Metric Description Value Range MonitoredObject
IOPS Indicates the number of I/Ooperations per second on themonitored object. The unit is count.
≥ 0 counts/s ECS
Network InputThroughput
Indicates all network adapterincoming traffic in bytes per second.The unit is byte/s.
≥ 0 bytes/s ECSMonitoredinstance type:MySQL,PostgreSQL,and MicrosoftSQL Serverinstances
NetworkOutputThroughput
Indicates all network adapteroutgoing traffic in bytes per second.The unit is byte/s.
≥ 0 bytes/s ECSMonitoredinstance type:MySQL,PostgreSQL,and MicrosoftSQL Serverinstances
TotalConnections
Indicates the total number ofconnection attempts to the MySQLserver. The unit is count.
≥ 0 counts Database
Current ActiveConnections
Indicates the number of currentactive connections. The unit iscount.
≥ 0 counts Database
QPS Indicates the number of SQLstatement queries (including thestorage process) per second.
≥ 0 queries/s Database
TPS Indicates the number of transactionexecutions (including transactionsubmitting and rollback) per second.
≥ 0transactions/s
Database
Buffer PoolUsage
Indicates the ratio of dirty data fromall data in the InnoDB buffer. Theunit is percent.
0-1 Database
Buffer PoolHit Rate
Indicates the ratio of read hits toread requests(Innodb_buffer_pool_readsindicates the number of times thatdisks are read). The unit is percent.
0-1 Database
Buffer PoolDirty BlockRate
Indicates the ratio of dirty pagesfrom all pages in the buffer pool.The unit is percent.
0-1 Database
Cloud EyeUser Guide 15 Services Supported by Cloud Eye
Issue 25 (2018-07-30) Huawei Proprietary and ConfidentialCopyright © Huawei Technologies Co., Ltd.
121

Metric Description Value Range MonitoredObject
InnoDB ReadThroughput
Indicates the average number of readbytes per second for the InnoDBbuffer.
≥ 0 bytes/s Database
InnoDB WriteThroughput
Indicates the number of write bytesper second for the InnoDB buffer.
≥ 0 bytes/s Database
InnoDB FileReadFrequency
Indicates the average number oftimes that InnoDB reads files persecond.
≥ 0 counts/s Database
InnoDB FileWriteFrequency
Indicates the average number oftimes that InnoDB writes files persecond.
≥ 0 counts/s Database
InnoDB LogWrite RequestFrequency
Indicates the average number of logwrite requests per second.
≥ 0 counts/s Database
InnoDB LogPhysical WriteFrequency
Indicates the average number ofphysical writes for log files persecond.
≥ 0 counts/s Database
InnoDB Logfsync() WriteFrequency
Indicates the average number offsync write requests on log files persecond.
≥ 0 counts/s Database
TemporaryTables Qty
Indicates the number of temporarytables automatically created on harddisks when MySQL statements areexecuted.
≥ 0 tables Database
Key BufferUsage
Indicates the MyISAM key bufferusage. The unit is percent.
0-1 Database
Key BufferWrite Hit Rate
Indicates the key buffer write hitusage of MyISAM. The unit ispercent.
0-1 Database
Key BufferRead Hit Rate
Indicates the key buffer read hitusage of MyISAM. The unit ispercent.
0-1 Database
MyISAM DiskWrite Speed
Indicates the average number oftimes that indexes are written intodisks per second.
≥ 0 counts/s Database
MyISAM DiskRead Speed
Indicates the average number oftimes that indexes are read fromdisks per second.
≥ 0 counts/s Database
Cloud EyeUser Guide 15 Services Supported by Cloud Eye
Issue 25 (2018-07-30) Huawei Proprietary and ConfidentialCopyright © Huawei Technologies Co., Ltd.
122

Metric Description Value Range MonitoredObject
MyISAMBuffer PoolWrite Speed
Indicates the average number ofrequests to write indexes into cacheper second.
≥ 0 counts/s Database
MyISAMBuffer PoolRead Speed
Indicates the average number ofrequests to read indexes from cacheper second.
≥ 0 counts/s Database
Delete ExecuteSpeed
Indicates the average number ofDelete executions per second.
≥ 0 queries/s Database
Insert ExecuteSpeed
Indicates the average number ofInsert executions per second.
≥ 0 queries/s Database
Insert_SelectExecute Speed
Indicates the average number ofInsert_Select executions per second.
≥ 0 queries/s Database
ReplaceExecute Speed
Indicates the average number ofReplace executions per second.
≥ 0 queries/s Database
Replace_Selection ExecuteSpeed
Indicates the average number ofReplace_Selection executions persecond.
≥ 0 queries/s Database
Select ExecuteSpeed
Indicates the average number ofSelect executions per second.
≥ 0 queries/s Database
UpdateExecute Speed
Indicates the average number ofUpdate executions per second.
≥ 0 queries/s Database
Row DeleteSpeed
Indicates the average number ofrows that are deleted from theInnoDB table per second.
≥ 0 rows/s Database
Row InsertSpeed
Indicates the average number ofrows that are inserted to the InnoDBtable per second.
≥ 0 rows/s Database
Row ReadSpeed
Indicates the average number ofrows that are read from the InnoDBtable per second.
≥ 0 rows/s Database
Row UpdateSpeed
Indicates the number of updatedrows in the InnoDB table persecond.
≥ 0 rows/s Database
DiskUtilization(deprecated)
Indicates the CPU usage of themonitored object. The unit is ratio.
0-1 ECS
DiskUtilization
Indicates the disk utilization of themonitored object. The unit ispercent.
0-100% Elastic CloudServer
Cloud EyeUser Guide 15 Services Supported by Cloud Eye
Issue 25 (2018-07-30) Huawei Proprietary and ConfidentialCopyright © Huawei Technologies Co., Ltd.
123

Metric Description Value Range MonitoredObject
TransactionLogs Usage
Indicates the disk capacity used bytransaction logs.
≥ 0 MB Database
ReplicationSlot Usage
Indicates the disk capacity used byreplication slot files.
≥ 0 MB Database
DatabaseConnections
Indicates the number of databaseconnections in use.
≥ 0 counts Database
MaximumUsedTransactionIDs
Indicates the maximum transactionID that has been used.
≥ 0 counts Database
TransactionLogsGenerations
Indicates the size of transaction logsgenerated per second.
≥ 0 MB/s Database
OldestReplicationSlot Lag
Indicates the lagging size of themost lagging replica in terms ofWAL data received.
≥ 0 MB Database
ReplicationLag
Indicates the replication lag delay. ≥ 0 ms Database
Total DiskSize
Indicates the total disk size of themonitored object.
100–2000 GB ECS
Disk Usage Indicates the disk usage of themonitored object.
0–2000 GB ECS
Disk ReadThroughput
Indicates the number of bytes readfrom the disk per second.
≥ 0 bytes/s ECS
Disk ReadThroughput
Indicates the number of bytes writeto the disk per second.
≥ 0 bytes/s ECS
Average Timeper Disk Read
Indicates the average time per diskread operation.
> 0s ECS
Average Timeper Disk Write
Indicates the average time per diskwrite operation.
> 0s ECS
Average DiskQueue Length
Indicates the number of processes tobe written to the monitored object.
≥ 0 ECS
Number ofDatabaseConnectionsIn Use
Indicates the number of databaseconnections in use.
≥0 counts Database
Cloud EyeUser Guide 15 Services Supported by Cloud Eye
Issue 25 (2018-07-30) Huawei Proprietary and ConfidentialCopyright © Huawei Technologies Co., Ltd.
124

Metric Description Value Range MonitoredObject
Number ofTransactionsper Second
Indicates the number of transactionsinitiated by the database per second.The unit is count/s.
≥ 0 counts/s DatabaseMonitoredinstance type:Microsoft SQLServer instance
Number ofBatches perSecond
Indicates the number of Transact-SQL command batches received persecond. The unit is count/s.
≥ 0 counts/s DatabaseMonitoredinstance type:Microsoft SQLServer instance
Number ofLogins perSecond
Indicates the total number of loginsstarted per second. The unit iscount/s.
≥ 0 counts/s DatabaseMonitoredinstance type:Microsoft SQLServer instance
Number ofLogouts perSecond
Indicates the total number of logoutsstarted per second. The unit iscount/s.
≥ 0 counts/s DatabaseMonitoredinstance type:Microsoft SQLServer instance
Cache HitRatio
Indicates the percentage of pagesfound in the buffer cache withouthaving to read from disks.
≥ 0 DatabaseMonitoredinstance type:Microsoft SQLServer instance
Number ofSQLCompilationsper Second
Indicates the number of SQLcompilations per second. The unit iscount/s.
≥ 0 counts/s DatabaseMonitoredinstance type:Microsoft SQLServer instance
Number ofSQL Re-Compilationsper Second
Indicates the number of statementrecompiles per second. The unit iscount/s.
≥ 0 counts/s DatabaseMonitoredinstance type:Microsoft SQLServer instance
Number ofFull Scans perSecond
Indicates the number of unrestrictedfull scans per second. The unit iscount/s.
≥0 Counts/Second
DatabaseMonitoredinstance type:Microsoft SQLServer instance
Cloud EyeUser Guide 15 Services Supported by Cloud Eye
Issue 25 (2018-07-30) Huawei Proprietary and ConfidentialCopyright © Huawei Technologies Co., Ltd.
125

Metric Description Value Range MonitoredObject
Number ofErrors perSecond
Indicates the number of errors persecond. The unit is count/s.
≥0 Counts/Second
DatabaseMonitoredinstance type:Microsoft SQLServer instance
Number ofLatch Waitsper Second
Indicates the number of latchrequests that could not be grantedimmediately. The unit is count/s.
≥ 0 counts/s DatabaseMonitoredinstance type:Microsoft SQLServer instance
Number ofLock Waitsper Second
Indicates the number of lockrequests per second that required thecaller to wait. The unit is count/s.
≥0 Counts/Second
DatabaseMonitoredinstance type:Microsoft SQLServer instance
Number ofLock Requestsper Second
Indicates the number of new locksand lock conversions per secondrequested from the lock manager.The unit is count/s.
≥0 Counts/Second
DatabaseMonitoredinstance type:Microsoft SQLServer instance
Lock Timeoutsper Second
Indicates the number of lockrequests per second that timed out.The unit is count/s.
≥0 Counts/Second
DatabaseMonitoredinstance type:Microsoft SQLServer instance
Average LockWait Time
Indicates the average amount of waittime (ms) for each lock request thatresulted in a wait.
Millisecond DatabaseMonitoredinstance type:Microsoft SQLServer instance
Number ofDeadlocks perSecond
Indicates the number of lockrequests per second that resulted in adeadlock. The unit is count/s.
≥0 Counts/Second
DatabaseMonitoredinstance type:Microsoft SQLServer instance
Number ofCheckpointPages perSecond
Indicates the number of pagesflushed to disks per second by acheckpoint or other operations thatrequire all dirty pages to be flushed.The unit is count/s.
≥0 Counts/Second
DatabaseMonitoredinstance type:Microsoft SQLServer instance
Cloud EyeUser Guide 15 Services Supported by Cloud Eye
Issue 25 (2018-07-30) Huawei Proprietary and ConfidentialCopyright © Huawei Technologies Co., Ltd.
126

Metric Description Value Range MonitoredObject
Number ofSlow Queries
Indicates the number of currentlyrunning slow queries. The unit iscount.
Counts DatabaseMonitoredinstance type:Microsoft SQLServer instance
15.6.2 DDS Metrics
Table 15-25 DDS Metrics
Metric Description ValueRange
Remarks
CommandOperations perSecond
Average number of the commandstatement execution times onMongoDB instances per second
≥ 0commands/s
Monitored object:databaseMonitored instancetype: MongoDBinstances
DeleteOperations perSecond
Average number of the deletestatement execution times onMongoDB instances per second
≥ 0executions/s
Monitored object:databaseMonitored instancetype: MongoDBinstances
InsertOperations perSecond
Average number of the insertstatement execution times onMongoDB instances per second
≥ 0executions/s
Monitored object:databaseMonitored instancetype: MongoDBinstances
QueryOperations perSecond
Average number of the querystatement execution times onMongoDB instances per second
≥ 0executions/s
Monitored object:databaseMonitored instancetype: MongoDBinstances
UpdateOperations perSecond
Average number of the updatestatement execution times onMongoDB instances per second
≥ 0executions/s
Monitored object:databaseMonitored instancetype: MongoDBinstances
Cloud EyeUser Guide 15 Services Supported by Cloud Eye
Issue 25 (2018-07-30) Huawei Proprietary and ConfidentialCopyright © Huawei Technologies Co., Ltd.
127

Metric Description ValueRange
Remarks
GetmoreOperations perSecond
Average number of the getmorestatement execution times onMongoDB instances per second
≥ 0executions/s
Monitored object:databaseMonitored instancetype: MongoDBinstances
Number ofChunks ofShard 1
Number of chunks in shard 1 0–64 counts Monitored object:databaseMonitored instancetype: MongoDBinstances
Number ofChunks ofShard 2
Number of chunks in shard 2 0–64 counts Monitored object:databaseMonitored instancetype: MongoDBinstances
Number ofChunks ofShard 3
Number of chunks in shard 3 0–64 counts Monitored object:databaseMonitored instancetype: MongoDBinstances
Number ofChunks ofShard 4
Number of chunks in shard 4 0–64 counts Monitored object:databaseMonitored instancetype: MongoDBinstances
Number ofChunks ofShard 5
Number of chunks in shard 5 0–64 counts Monitored object:databaseMonitored instancetype: MongoDBinstances
Number ofChunks ofShard 6
Number of chunks in shard 6 0–64 counts Monitored object:databaseMonitored instancetype: MongoDBinstances
Number ofChunks ofShard 7
Number of chunks in shard 7 0–64 counts Monitored object:databaseMonitored instancetype: MongoDBinstances
Cloud EyeUser Guide 15 Services Supported by Cloud Eye
Issue 25 (2018-07-30) Huawei Proprietary and ConfidentialCopyright © Huawei Technologies Co., Ltd.
128

Metric Description ValueRange
Remarks
Number ofChunks ofShard 8
Number of chunks in shard 8 0–64 counts Monitored object:databaseMonitored instancetype: MongoDBinstances
Number ofChunks ofShard 9
Number of chunks in shard 9 0–64 counts Monitored object:databaseMonitored instancetype: MongoDBinstances
Number ofChunks ofShard 10
Number of chunks in shard 10 0–64 counts Monitored object:databaseMonitored instancetype: MongoDBinstances
Number ofChunks ofShard 11
Number of chunks in shard 11 0–64 counts Monitored object:databaseMonitored instancetype: MongoDBinstances
Number ofChunks ofShard 12
Number of chunks in shard 12 0–64 counts Monitored object:databaseMonitored instancetype: MongoDBinstances
Current DBInstanceActiveConnections
Total number of connectionsattempting to connect toMongoDB instances
0–200counts
Monitored object:databaseMonitored instancetype: MongoDBinstances
ChunkMigrationFailures inLast 24 hrs
Number of chunk migrationfailures for the last 24 hours
≥ 0 counts Monitored object:databaseMonitored instancetype: MongoDBinstances
Current ActiveConnections
Total number of connectionsattempting to connect toMongoDB instances
0–200counts
Monitored object:databaseMonitored instancetype: mongos,primary, andsecondary nodes ofMongoDB instances
Cloud EyeUser Guide 15 Services Supported by Cloud Eye
Issue 25 (2018-07-30) Huawei Proprietary and ConfidentialCopyright © Huawei Technologies Co., Ltd.
129

Metric Description ValueRange
Remarks
ResidentMemory
Size of resident memoryUnit: MB
≥ 0 MB Monitored object:databaseMonitored instancetype: mongos,primary, andsecondary nodes ofMongoDB instances
VirtualMemory
Size of virtual memoryUnit: MB
≥ 0 MB Monitored object:databaseMonitored instancetype: mongos,primary, andsecondary nodes ofMongoDB instances
RegularAsserts perSecond
Number of regular asserts persecond
≥ 0asserts/s
Monitored object:databaseMonitored instancetype: mongos,primary, andsecondary nodes ofMongoDB instances
WarningAsserts perSecond
Number of warning asserts persecond
≥ 0 asserts/s Monitored object:databaseMonitored instancetype: mongos,primary, andsecondary nodes ofMongoDB instances
MessageAsserts perSecond
Number of message asserts persecond
≥ 0 asserts/s Monitored object:databaseMonitored instancetype: mongos,primary, andsecondary nodes ofMongoDB instances
User Assertsper Second
Number of user asserts persecond
≥ 0 asserts/s Monitored object:databaseMonitored instancetype: mongos,primary, andsecondary nodes ofMongoDB instances
Cloud EyeUser Guide 15 Services Supported by Cloud Eye
Issue 25 (2018-07-30) Huawei Proprietary and ConfidentialCopyright © Huawei Technologies Co., Ltd.
130

Metric Description ValueRange
Remarks
CPU Usage CPU usage of the monitoredobjectUnit: Percent
0–100% Monitored object:ECSMonitored instancetype: mongos,primary, andsecondary nodes ofMongoDB instances
MemoryUsage
Memory usage of the monitoredobjectUnit: Percent
0–100% Monitored object:databaseMonitored instancetype: mongos,primary, andsecondary nodes ofMongoDB instances
NetworkOutputThroughput
Outgoing traffic in bytes persecond
≥ 0 bytes/s Monitored object:databaseMonitored instancetype: mongos,primary, andsecondary nodes ofMongoDB instances
Network InputThroughput
Incoming traffic in bytes persecond
≥ 0 bytes/s Monitored object:databaseMonitored instancetype: mongos,primary, andsecondary nodes ofMongoDB instances
Number ofOperationsQueuedWaiting for theLock
Number of operations queuedwaiting for the lock
≥ 0 counts Monitored object:databaseMonitored instancetype: mongos,primary, andsecondary nodes ofMongoDB instances
Number ofOperationsQueuedWaiting for theRead Lock
Number of operations queuedwaiting for the read lock
≥ 0 counts Monitored object:databaseMonitored instancetype: mongos,primary, andsecondary nodes ofMongoDB instances
Cloud EyeUser Guide 15 Services Supported by Cloud Eye
Issue 25 (2018-07-30) Huawei Proprietary and ConfidentialCopyright © Huawei Technologies Co., Ltd.
131

Metric Description ValueRange
Remarks
Number ofOperationsQueuedWaiting for theWrite Lock
Number of operations queuedwaiting for the write lock
≥ 0 counts Monitored object:databaseMonitored instancetype: mongos,primary, andsecondary nodes ofMongoDB instances
Number ofPage Faults
Number of page faults on themonitored nodes
≥ 0 counts Monitored object:databaseMonitored instancetype: mongos,primary, andsecondary nodes ofMongoDB instances
Number ofSlow Queries
Number of slow queries on themonitored nodes
≥ 0 counts Monitored object:databaseMonitored instancetype: mongos,primary, andsecondary nodes ofMongoDB instances
Number ofCurrentMaintainedCursors
Number of maintained cursorson the monitored nodes
≥ 0 counts Monitored object:databaseMonitored instancetype: mongos,primary, andsecondary nodes ofMongoDB instances
Number ofTimed OutCursors
Number of timed out cursors onthe monitored nodes
≥ 0 counts Monitored object:databaseMonitored instancetype: mongos,primary, andsecondary nodes ofMongoDB instances
Bytes in CacheWhen UsingWiredTiger
Size of data in cache in MBwhen WiredTiger is usedUnit: MB
≥ 0 MB Monitored object:databaseMonitored instancetype: mongos,primary, andsecondary nodes ofMongoDB instances
Cloud EyeUser Guide 15 Services Supported by Cloud Eye
Issue 25 (2018-07-30) Huawei Proprietary and ConfidentialCopyright © Huawei Technologies Co., Ltd.
132

Metric Description ValueRange
Remarks
Tracked DirtyBytes in CacheWhen UsingWiredTiger
Size of dirty data in cache in MBwhen WiredTiger is usedUnit: MB
≥ 0 MB Monitored object:databaseMonitored instancetype: mongos,primary, andsecondary nodes ofMongoDB instances
Bytes WrittenintoWiredTigerCache perSecond
Bytes written into WiredTigercache per second
≥ 0 bytes/s Monitored object:databaseMonitored instancetype: mongos,primary, andsecondary nodes ofMongoDB instances
Bytes Writteninto DisksfromWiredTigerCache perSecond
Bytes written into disks fromWiredTiger cache per second
≥ 0 bytes/s Monitored object:databaseMonitored instancetype: mongos,primary, andsecondary nodes ofMongoDB instances
OplogAvailable Timeon PrimaryNode
Oplog available time in hours onthe monitored primary node
≥ 0 hours Monitored object:databaseMonitored instancetype: primary nodesof MongoDBinstances
OplogGenerationSpeed onPrimary Node
Speed in MB/hour at whichOplog is generated on themonitored primary node
≥ 0 MB/hour Monitored object:databaseMonitored instancetype: primary nodesof MongoDBinstances
DiskUtilization
Disk usage of the monitoredobject
0–100% Monitored object:databaseMonitored instancetype: primary andsecondary nodes ofMongoDB instances
Cloud EyeUser Guide 15 Services Supported by Cloud Eye
Issue 25 (2018-07-30) Huawei Proprietary and ConfidentialCopyright © Huawei Technologies Co., Ltd.
133

Metric Description ValueRange
Remarks
IOPS Average number of I/O requestsprocessed by the system persecond
≥ 0 counts/s Monitored object:databaseMonitored instancetype: primary andsecondary nodes ofMongoDB instances
Disk ReadThroughput
Average number of read bytesper second for disks
≥ 0 bytes/s Monitored object:databaseMonitored instancetype: primary andsecondary nodes ofMongoDB instances
Disk ReadThroughput
Average number of write bytesper second for disks
≥ 0 bytes/s Monitored object:databaseMonitored instancetype: primary andsecondary nodes ofMongoDB instances
Average Timeper Disk Read
Average time per disk readoperation during a specifiedperiod
≥ 0 seconds Monitored object:databaseMonitored instancetype: primary andsecondary nodes ofMongoDB instances
Average Timeper Disk Write
Average time per disk writeoperation during a specifiedperiod
≥ 0 seconds Monitored object:databaseMonitored instancetype: primary andsecondary nodes ofMongoDB instances
Average DiskQueue Length
Number of processes waiting tobe written to the monitoredobject
≥ 0 counts Monitored object:databaseMonitored instancetype: primary andsecondary nodes ofMongoDB instances
Total Disk Size Total disk size of the monitoredobjectUnit: GB
0–1000 GB Monitored object:databaseMonitored instancetype: primary andsecondary nodes ofMongoDB instances
Cloud EyeUser Guide 15 Services Supported by Cloud Eye
Issue 25 (2018-07-30) Huawei Proprietary and ConfidentialCopyright © Huawei Technologies Co., Ltd.
134
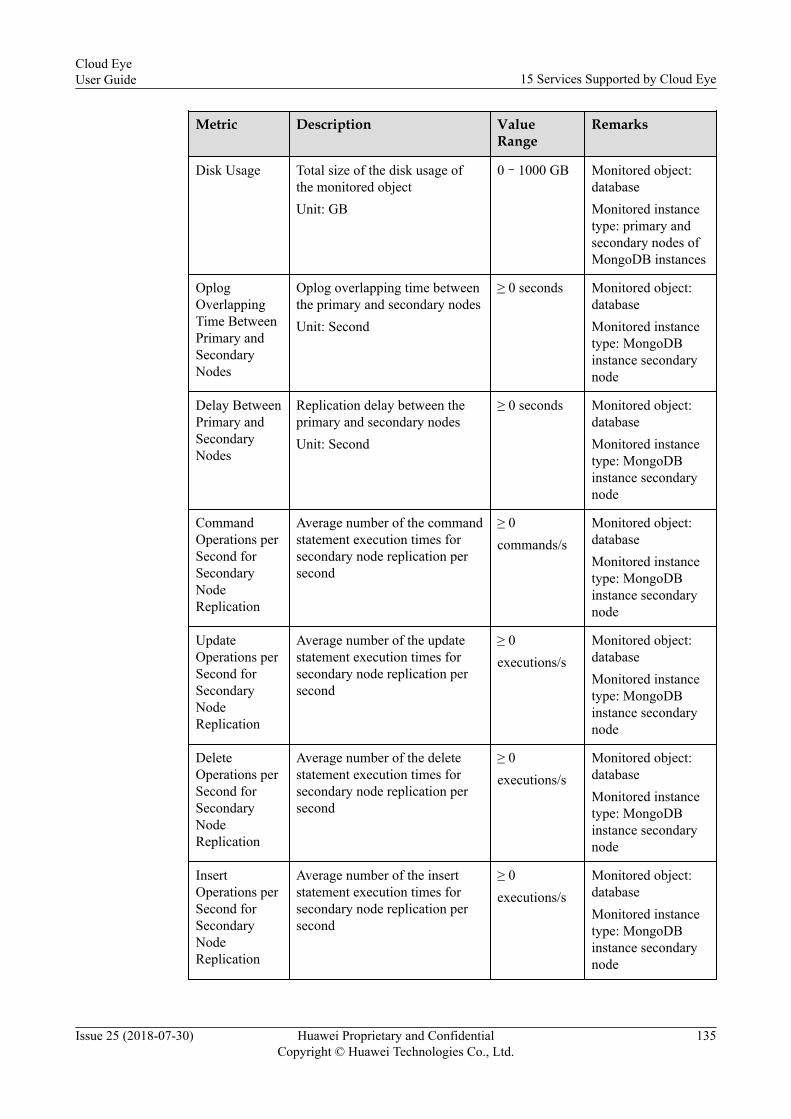
Metric Description ValueRange
Remarks
Disk Usage Total size of the disk usage ofthe monitored objectUnit: GB
0–1000 GB Monitored object:databaseMonitored instancetype: primary andsecondary nodes ofMongoDB instances
OplogOverlappingTime BetweenPrimary andSecondaryNodes
Oplog overlapping time betweenthe primary and secondary nodesUnit: Second
≥ 0 seconds Monitored object:databaseMonitored instancetype: MongoDBinstance secondarynode
Delay BetweenPrimary andSecondaryNodes
Replication delay between theprimary and secondary nodesUnit: Second
≥ 0 seconds Monitored object:databaseMonitored instancetype: MongoDBinstance secondarynode
CommandOperations perSecond forSecondaryNodeReplication
Average number of the commandstatement execution times forsecondary node replication persecond
≥ 0commands/s
Monitored object:databaseMonitored instancetype: MongoDBinstance secondarynode
UpdateOperations perSecond forSecondaryNodeReplication
Average number of the updatestatement execution times forsecondary node replication persecond
≥ 0executions/s
Monitored object:databaseMonitored instancetype: MongoDBinstance secondarynode
DeleteOperations perSecond forSecondaryNodeReplication
Average number of the deletestatement execution times forsecondary node replication persecond
≥ 0executions/s
Monitored object:databaseMonitored instancetype: MongoDBinstance secondarynode
InsertOperations perSecond forSecondaryNodeReplication
Average number of the insertstatement execution times forsecondary node replication persecond
≥ 0executions/s
Monitored object:databaseMonitored instancetype: MongoDBinstance secondarynode
Cloud EyeUser Guide 15 Services Supported by Cloud Eye
Issue 25 (2018-07-30) Huawei Proprietary and ConfidentialCopyright © Huawei Technologies Co., Ltd.
135

15.6.3 DCS Metrics
Table 15-26 DCS metrics
Metric Description Value Range Monitored Object
CPU Usage Indicates the CPUusage of themonitored object.The unit is percent.
0-1 ECS
Memory Usage Indicates thememory usage of themonitored object.The unit is percent.
0-1 ECS
Network InputThroughput
Indicates theinbound throughputper second (byte/s)on the port.
≥ 0 bytes/s ECS
Network OutputThroughput
Indicates theoutbound throughputper second (byte/s)on the port.
≥ 0 bytes/s ECS
Connected Clients Indicates the numberof connected clients,excluding slavenodes.
≥ 0 DCS
Client LongestOutput List
Indicates the longestoutput list among allthe connections to aclient.
≥ 0 DCS
Client Biggest InputBuf
Indicates themaximum input datalength (bytes)among all theconnections to aclient.
≥ 0 bytes/s DCS
Blocked Clients Indicates the numberof clients that aresuspended by blockoperations, such asBLPOP, BRPOP,and BRPOPLPUSHoperations.
≥ 0 DCS
Used Memory Indicates thememory (bytes) thatRedis has used.
≥ 0 bytes/s DCS
Cloud EyeUser Guide 15 Services Supported by Cloud Eye
Issue 25 (2018-07-30) Huawei Proprietary and ConfidentialCopyright © Huawei Technologies Co., Ltd.
136

Metric Description Value Range Monitored Object
Used Memory RSS Indicates the RSSmemory (bytes) thatRedis has used. Thatis, the memory thatactually resides inthe memory. Itincludes all stackand heap memorybut not swapped-outmemory.
≥ 0 bytes/s DCS
Used Memory Peak Indicates the peakvalue of the memoryusage (bytes) sincethe Redis serverstarts.
≥ 0 bytes/s DCS
Used Memory Lua Indicates thememory (bytes) thatthe Lua engine hasused.
≥ 0 bytes/s DCS
MemoryFragmentation Ratio
Indicates the currentmemoryfragmentation ratio.Its value is the sameas that ofused_memory_rssand used_memory.If the used memorypeak value is muchgreater than the usedmemory, thereference value ofthis parameterdecreases.
≥ 0 DCS
Total ConnectionsReceived
Indicates the totalnumber ofconnections that theRedis server hasreceived since itstarted.
≥ 0 DCS
Total CommandsProcessed
Indicates the totalnumber ofcommands that theRedis server hasprocessed since itstarted.
≥ 0 DCS
Cloud EyeUser Guide 15 Services Supported by Cloud Eye
Issue 25 (2018-07-30) Huawei Proprietary and ConfidentialCopyright © Huawei Technologies Co., Ltd.
137

Metric Description Value Range Monitored Object
Instantaneous OpsPer Second
Indicates the numberof commandsprocessed persecond (ops/s).
≥ 0 DCS
Total Net InputBytes
Indicates the totalnumber of bytes thatthe Redis server hasreceived since itstarted.
≥ 0 bytes/s DCS
Total Net OutputBytes
Indicates the totalnumber of bytes thatthe Redis server hassent since it started.
≥ 0 bytes/s DCS
Instantaneous InputKbps
Indicates theinstantaneous inputtraffic (kbit/s).
≥ 0 kbits/s DCS
InstantaneousOutput Kbps
Indicates theinstantaneous outputtraffic (kbit/s).
≥ 0 kbits/s DCS
RejectedConnections
Indicates the numberof connections thathave exceededmaxclients and beenrejected by the Redisserver since itstarted.
≥ 0 DCS
Sync Full Indicates the totalnumber of fullsynchronizationssince the Redisserver started.
≥ 0 DCS
Sync Partial OK Indicates the totalnumber ofincrementalsynchronizationssince the Redisserver started.
≥ 0 DCS
Sync Partial Err Indicates the totalnumber of failedincrementalsynchronizationssince the Redisserver started.
≥ 0 DCS
Cloud EyeUser Guide 15 Services Supported by Cloud Eye
Issue 25 (2018-07-30) Huawei Proprietary and ConfidentialCopyright © Huawei Technologies Co., Ltd.
138

Metric Description Value Range Monitored Object
Expired Keys Indicates the totalnumber of keys thathave expired sincethe Redis serverstarted.
≥ 0 DCS
Evicted Keys Indicates the numberof keys that havebeen evicted due toinsufficient memorysince the Redisserver started.
≥ 0 DCS
Keyspace Hits Indicates the totalnumber of query hitsin the masterdictionary since theRedis server started.
≥ 0 DCS
Keyspace Misses Indicates the totalnumber of querymisses in the masterdictionary since theRedis server started.
≥ 0 DCS
PubSub Channels Indicates the numberof Pub/Subchannels.
≥ 0 DCS
PubSub Patterns Indicates the numberof Pub/Sub patterns.
≥ 0 DCS
Aof Current Size Indicates the AOFfile size (bytes).
≥ 0 DCS
Latest Fork usec Indicates the latestfork time (ms).
≥ 0 ms DCS
Percentage ofKeyspace Hits
Indicates theKeyspace hit ratio(%).
0-1 DCS
Used MemoryDataset
Indicates the numberof bytes allocated byRedis to data sets.
≥ 0 bytes DCS
Percentage of UsedMemory Dataset
Indicates thepercentage of bytesused by data sets tototal bytes allocatedby Redis.
0-1 DCS
Keys Indicates the numberof keys in Redis.
≥ 0 DCS
Cloud EyeUser Guide 15 Services Supported by Cloud Eye
Issue 25 (2018-07-30) Huawei Proprietary and ConfidentialCopyright © Huawei Technologies Co., Ltd.
139

Metric Description Value Range Monitored Object
Keys With anExpiration
Indicates the numberof keys with anexpiration in Redis.
≥ 0 DCS
Table 15-27 Metrics supported by the Memcached instances
Metric Description ValueRange
MonitoredObject
CPU Usage Measures the CPU usage (%) ofthe monitored object.
0–100% ECS
Memory Usage Measures the memory usage (%)of the monitored object.
0–100% ECS
Network InputThroughput
Measures the inboundthroughput per second (byte/s)on the port.
≥ 0 bytes/s ECS
Network OutputThroughput
Measures the outboundthroughput per second (byte/s)on the port.
≥ 0 bytes/s ECS
Connected Clients Measures the number ofconnected clients, excludingslave nodes.It includes the connected clientsused by the monitoring instanceof the DCS backgroundmanagement service.
≥ 0 Memcachedcache
Used Memory Measures the used memory(bytes).
≥ 0 bytes Memcachedcache
Used Memory RSS Measures the used RSS memory(bytes). That is, the memory thatactually resides in the memory.It includes all stack and heapmemory but not swapped-outmemory.
≥ 0 bytes Memcachedcache
Used Memory Peak Measures the peak value of thememory usage (bytes) since theserver starts.
≥ 0 bytes Memcachedcache
MemoryFragmentation Ratio
Measures the current memoryfragmentation ratio. Its value isthe same as that ofused_memory_rss andused_memory.
0–100% Memcachedcache
Cloud EyeUser Guide 15 Services Supported by Cloud Eye
Issue 25 (2018-07-30) Huawei Proprietary and ConfidentialCopyright © Huawei Technologies Co., Ltd.
140
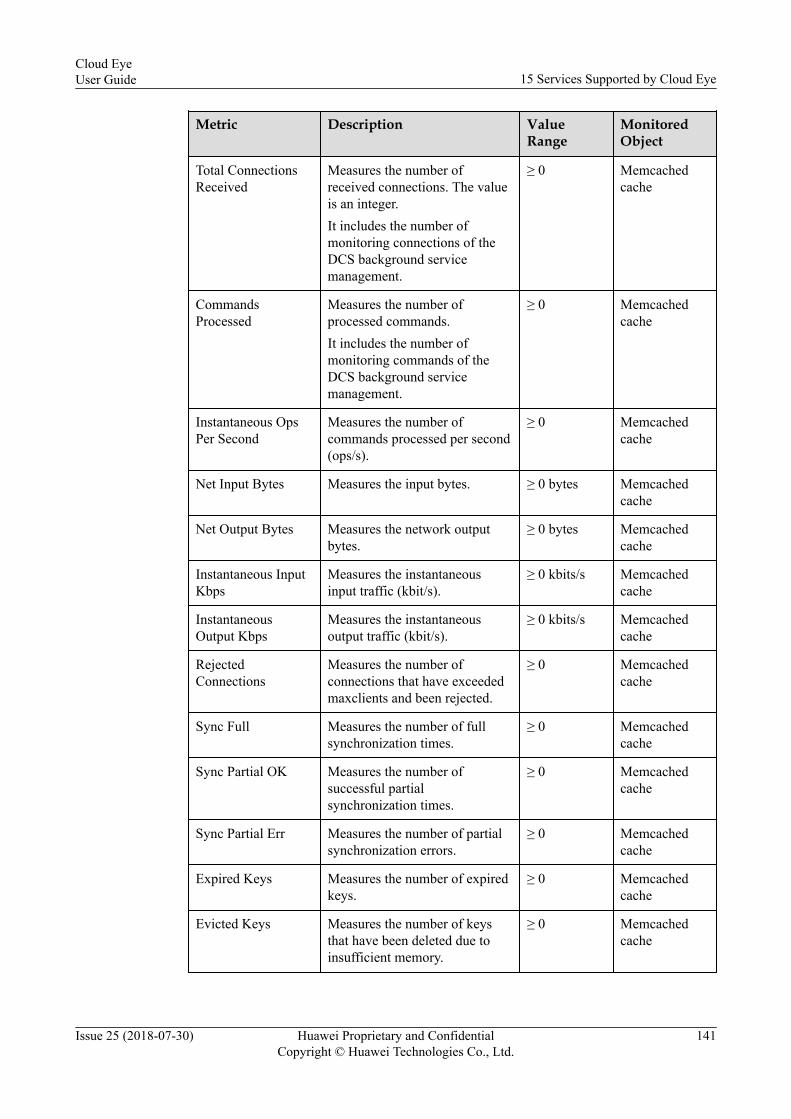
Metric Description ValueRange
MonitoredObject
Total ConnectionsReceived
Measures the number ofreceived connections. The valueis an integer.It includes the number ofmonitoring connections of theDCS background servicemanagement.
≥ 0 Memcachedcache
CommandsProcessed
Measures the number ofprocessed commands.It includes the number ofmonitoring commands of theDCS background servicemanagement.
≥ 0 Memcachedcache
Instantaneous OpsPer Second
Measures the number ofcommands processed per second(ops/s).
≥ 0 Memcachedcache
Net Input Bytes Measures the input bytes. ≥ 0 bytes Memcachedcache
Net Output Bytes Measures the network outputbytes.
≥ 0 bytes Memcachedcache
Instantaneous InputKbps
Measures the instantaneousinput traffic (kbit/s).
≥ 0 kbits/s Memcachedcache
InstantaneousOutput Kbps
Measures the instantaneousoutput traffic (kbit/s).
≥ 0 kbits/s Memcachedcache
RejectedConnections
Measures the number ofconnections that have exceededmaxclients and been rejected.
≥ 0 Memcachedcache
Sync Full Measures the number of fullsynchronization times.
≥ 0 Memcachedcache
Sync Partial OK Measures the number ofsuccessful partialsynchronization times.
≥ 0 Memcachedcache
Sync Partial Err Measures the number of partialsynchronization errors.
≥ 0 Memcachedcache
Expired Keys Measures the number of expiredkeys.
≥ 0 Memcachedcache
Evicted Keys Measures the number of keysthat have been deleted due toinsufficient memory.
≥ 0 Memcachedcache
Cloud EyeUser Guide 15 Services Supported by Cloud Eye
Issue 25 (2018-07-30) Huawei Proprietary and ConfidentialCopyright © Huawei Technologies Co., Ltd.
141

Metric Description ValueRange
MonitoredObject
Aof Current Size Measures the AOF file size. ≥ 0 Memcachedcache
Number of RetrievalRequests
Measures the number of dataretrieval requests received by theservice.
≥ 0 Memcachedcache
Number of StorageRequests
Measures the number of datastorage requests received by theservice.
≥ 0 Memcachedcache
Number of FlushRequests
Measures the number of dataflush requests received by theservice.
≥ 0 Memcachedcache
Number of TouchRequests
Measures the number of datatouch requests received by theservice.
≥ 0 Memcachedcache
Number of RetrievalHits
Measures the times of successfuldata retrieval.
≥ 0 Memcachedcache
Number of RetrievalMisses
Measures the number of timesthat the data fails to be retrievedbecause keys do not exist.
≥ 0 Memcachedcache
Number of DeleteHits
Measures the times of successfuldata deletion.
≥ 0 Memcachedcache
Number of DeleteMisses
Measures the number of timesthat the data fails to be deletedbecause keys do not exist.
≥ 0 Memcachedcache
Number ofIncrement Hits
Measures the times ofincremental hits.
≥ 0 Memcachedcache
Number ofIncrement Misses
Measures the times ofincremental misses because keysdo not exist.
≥ 0 Memcachedcache
Number ofDecrement Hits
Measures the times ofdecremental hits.
≥ 0 Memcachedcache
Number ofDecrement Misses
Measures the times ofdecremental misses becausekeys do not exist.
≥ 0 Memcachedcache
Number of CASHits
Measures the times of successfulCAS operations.
≥ 0 Memcachedcache
Number of CASMisses
Measures the times of failedCAS operations because keys donot exist.
≥ 0 Memcachedcache
Cloud EyeUser Guide 15 Services Supported by Cloud Eye
Issue 25 (2018-07-30) Huawei Proprietary and ConfidentialCopyright © Huawei Technologies Co., Ltd.
142
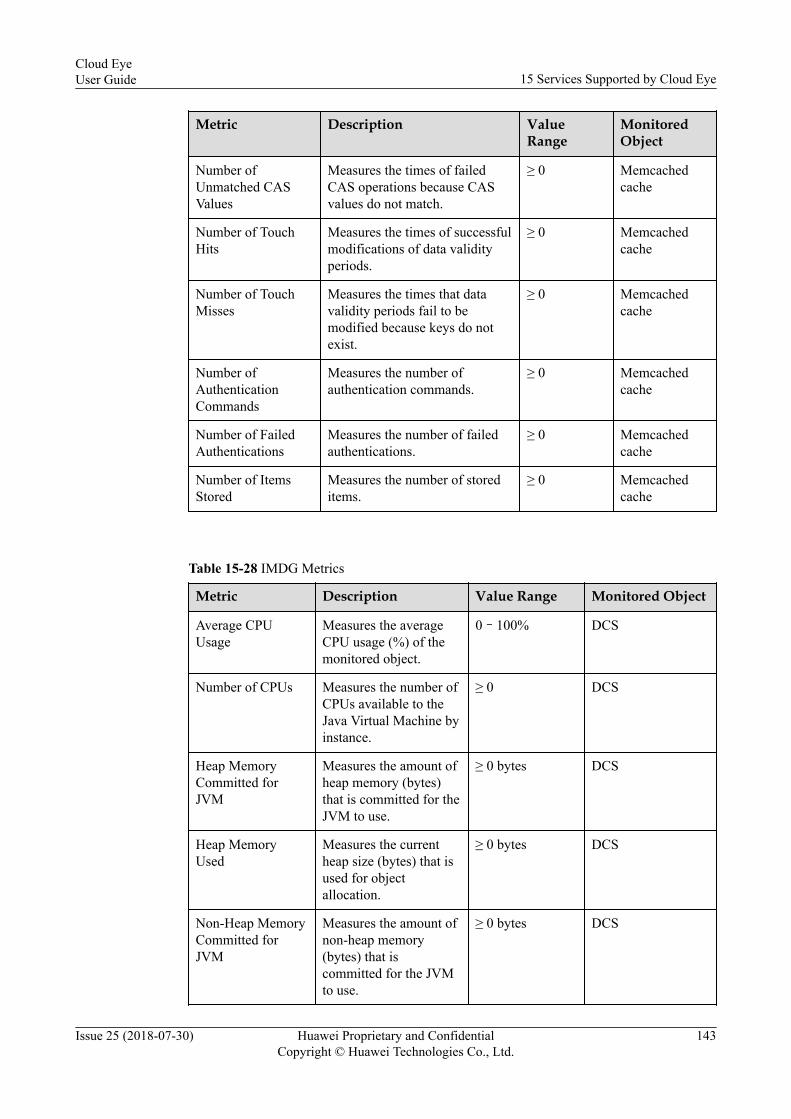
Metric Description ValueRange
MonitoredObject
Number ofUnmatched CASValues
Measures the times of failedCAS operations because CASvalues do not match.
≥ 0 Memcachedcache
Number of TouchHits
Measures the times of successfulmodifications of data validityperiods.
≥ 0 Memcachedcache
Number of TouchMisses
Measures the times that datavalidity periods fail to bemodified because keys do notexist.
≥ 0 Memcachedcache
Number ofAuthenticationCommands
Measures the number ofauthentication commands.
≥ 0 Memcachedcache
Number of FailedAuthentications
Measures the number of failedauthentications.
≥ 0 Memcachedcache
Number of ItemsStored
Measures the number of storeditems.
≥ 0 Memcachedcache
Table 15-28 IMDG Metrics
Metric Description Value Range Monitored Object
Average CPUUsage
Measures the averageCPU usage (%) of themonitored object.
0–100% DCS
Number of CPUs Measures the number ofCPUs available to theJava Virtual Machine byinstance.
≥ 0 DCS
Heap MemoryCommitted forJVM
Measures the amount ofheap memory (bytes)that is committed for theJVM to use.
≥ 0 bytes DCS
Heap MemoryUsed
Measures the currentheap size (bytes) that isused for objectallocation.
≥ 0 bytes DCS
Non-Heap MemoryCommitted forJVM
Measures the amount ofnon-heap memory(bytes) that iscommitted for the JVMto use.
≥ 0 bytes DCS
Cloud EyeUser Guide 15 Services Supported by Cloud Eye
Issue 25 (2018-07-30) Huawei Proprietary and ConfidentialCopyright © Huawei Technologies Co., Ltd.
143

Metric Description Value Range Monitored Object
Non-Heap MemoryUsed
Measures the currentnon-heap memory size(bytes) that is used byJVM.
≥ 0 bytes DCS
Total Number ofCluster Nodes
Measure the totalnumber of nodes.
≥ 0 DCS
15.6.4 DDM Metrics
Table 15-29 DDM metrics
Metric Description ValueRange
Monitored Object
CPU Usage Specifies the CPU usage of the monitoredobject. The unit is percent.
0-1 ECS
Memory Usage Specifies the memory usage of themonitored object. The unit is percent.
0-1 ECS
Network InputThroughput
Specifies the input throughput per secondof the monitored object.
≥ 0 bytes/s ECS
NetworkOutputThroughput
Specifies the output throughput per secondof the monitored object.
≥ 0 bytes/s ECS
15.7 Migration
15.7.1 CDM Metrics
Table 15-30 CDM Metrics
Metric Description ValueRange
MonitoredObject
Bytes In Number of incoming bytes persecond on the monitored objectUnit: Byte/s
≥ 0 bytes/s Nodes in the CDMcluster
Bytes Out Number of outgoing bytes persecond on the monitored objectUnit: Byte/s
≥ 0 bytes/s Nodes in the CDMcluster
Cloud EyeUser Guide 15 Services Supported by Cloud Eye
Issue 25 (2018-07-30) Huawei Proprietary and ConfidentialCopyright © Huawei Technologies Co., Ltd.
144

Metric Description ValueRange
MonitoredObject
CPU Usage CPU usage of the monitored objectUnit: Percent
0–100% Nodes in the CDMcluster
Memory Usage Percentage of memory currently inuseUnit: Percent
0–100% Nodes in the CDMcluster
15.8 Enterprise Intelligence
15.8.1 DWS Metrics
Table 15-31 DWS metrics
Metric Description ValueRange
Object
SharedMemory HitRatio
Indicates the percentage of data volumeobtained from memory. The unit is percent.
0–100% Datawarehouse clusters
In-memorySort Ratio
Indicates the percentage of data volume thatis sorted in memory. The unit is percent.
0–100%
File Reads Indicates the total number of database filereads.
> 0
File Writes Indicates the total number of database filewrites.
> 0
File Reads perSecond
Indicates the number of database file readsper second.
≥ 0
File Writes perSecond
Indicates the number of database file writesper second.
≥ 0
Data Volume Indicates the total data volume of thedatabase. The unit is MB.
0–36000MB
Active SQLCount
Indicates the number of active SQLs in thedatabase.
≥ 0
Session Count Indicates the number of sessions that accessthe database.
≥ 0
CPU Usage Indicates the CPU usages of each node in thecluster. The unit is percent.
0–100% Nodes inthecluster
MemoryUsage
Indicates the memory usages of each node inthe cluster. The unit is percent.
0–100%
Cloud EyeUser Guide 15 Services Supported by Cloud Eye
Issue 25 (2018-07-30) Huawei Proprietary and ConfidentialCopyright © Huawei Technologies Co., Ltd.
145

Metric Description ValueRange
Object
IOPS Indicates the number of I/O requestsprocessed by each node in the cluster persecond.
≥ 0
Network InputThroughput
Indicates the data input to each node in thecluster per second over the network.
≥ 0 bytes/s
NetworkOutputThroughput
Indicates the data sent to the network persecond from each node in the cluster.
≥ 0 bytes/s
Disk Usage Indicates disk usages of each node in thecluster. The unit is percent.
0–100%
Total DiskSize
Indicates the total disk space of each clusternode. The unit is GB.
100–2000GB
Disk Usage Indicates the used disk space of each node inthe cluster. The unit is GB.
0–3600GB
Disk ReadThroughput
Indicates the data volume read by each diskin the cluster per second, expressed in byte/s.
≥ 0 bytes/s
Disk WriteThroughput
Indicates data volume written to each diskper second, expressed in byte/s.
≥ 0 bytes/s
Average Timeper Disk Read
Indicates the average time used each timewhen a disk reads data, expressed in second.
> 0s
Average Timeper Disk Write
Indicates the average time used each timewhen data is written to a disk, expressed insecond.
> 0s
Average DiskQueue Length
Indicates the average I/O queue length of adisk.
≥ 0
15.8.2 MLS Metrics
Table 15-32 MLS metrics
Metric Description ValueRange
MonitoredObject
CPU Usage Indicates the CPU usage of themonitored object. The unit is percent.
0-1 MLS instances
Disk Usage Indicates the disk usage of themonitored object. The unit is percent.
0-1 MLS instances
MemoryUsage
Specifies the memory usage of themonitored object. The unit is percent.
0-1 MLS instances
Cloud EyeUser Guide 15 Services Supported by Cloud Eye
Issue 25 (2018-07-30) Huawei Proprietary and ConfidentialCopyright © Huawei Technologies Co., Ltd.
146

15.8.3 CloudTable Service Metrics
Table 15-33 CloudTable Service metrics
Metric Description ValueRange
MonitoredObject
CPU Number Indicates the number of CPUs ofthe monitored object.
> 0 CloudTableinstance
CPU Usage Indicates the CPU usage of themonitored object. The unit ispercent.
0-1 CloudTableinstance
Memory Size Indicates the total memory size ofthe monitored object. The unit isbyte.
> 0 bytes CloudTableinstance
Memory Usage Indicates the memory usage of themonitored object. The unit ispercent.
0-1 CloudTableinstance
Disks WriteRate
Indicates the number of byteswritten to the monitored object persecond (byte/s).
≥ 0 bytes/s CloudTableinstance
Disks ReadRate
Indicates the number of bytes readfrom the monitored object persecond (byte/s).
≥ 0 bytes/s CloudTableinstance
Used StorageSize
Indicates the used storage size(bytes) of the cluster in whichmonitored object is located.
≥ 0 bytes CloudTableinstance
Used StorageRate
Indicates the rate of used storageof the cluster to the total storagesize. The unit is percent.
0-1 CloudTableinstance
NormalRegionServers
Indicates the number of normalRegionServers in the cluster wherethe monitored object is running.
≥ 0 CloudTableinstance
FaultyRegionServers
Indicates the number of faultyRegionServers in the cluster wherethe monitored object is running.
≥ 0 CloudTableinstance
RIT CountOver Threshold
Indicates the number of regions inthe Region In Transaction (RIT)state and reach the threshold in thecluster where the monitored objectis running.
≥ 0 CloudTableinstance
Cloud EyeUser Guide 15 Services Supported by Cloud Eye
Issue 25 (2018-07-30) Huawei Proprietary and ConfidentialCopyright © Huawei Technologies Co., Ltd.
147

Metric Description ValueRange
MonitoredObject
RIT Count Indicates the number of regions inthe Region In Transaction (RIT)state in the cluster where themonitored object is running.
≥ 0 CloudTableinstance
Requests PerSecond
Indicates the number ofRegionServer requests per secondof the monitored object. The unit isrequest/second.
≥ 0requests/s
CloudTableinstance
Regions Indicates the number of regions ofa RegionServer.
≥ 0 CloudTableinstance
Write Requests Indicates the number of writerequests of a RegionServer.
≥ 0 CloudTableinstance
Read Requests Indicates the number of readrequests of a RegionServer.
≥ 0 CloudTableinstance
Hit CacheBlock CachingRatio
Indicates the hit cache blockcaching ratio of the monitoredobject. The unit is percent.
0-1 CloudTableinstance
Hit CacheBlock Ratio
Indicates the hit cache block ratioof the monitored object. The unit ispercent.
0-1 CloudTableinstance
Get Delay(Avg)
Indicates the average Getoperation delay (ms) of theRegionServer per unit time of themonitored object.
≥ 0 ms CloudTableinstance
Put Delay(Avg)
Indicates the average Put operationdelay (ms) of the RegionServer perunit time of the monitored object.
≥ 0 ms CloudTableinstance
Delete Delay(Avg)
Indicates the average Deleteoperation delay (ms) of theRegionServer per unit time of themonitored object.
≥ 0 ms CloudTableinstance
Get Operations Indicates the number of Getoperations of the monitored object.
≥ 0 CloudTableinstance
Put Operations Indicates the number of Putoperations of the monitored object.
≥ 0 CloudTableinstance
DeleteOperations
Indicates the number of Deleteoperations of the monitored object.
≥ 0 CloudTableinstance
RPC QueueCall Time(Max)
Indicates the maximum call time(ms) of the RPC queue of themonitored object.
≥ 0 ms CloudTableinstance
Cloud EyeUser Guide 15 Services Supported by Cloud Eye
Issue 25 (2018-07-30) Huawei Proprietary and ConfidentialCopyright © Huawei Technologies Co., Ltd.
148

Metric Description ValueRange
MonitoredObject
RPC QueueCall Time(Mean)
Indicates the average call time(ms) of the RPC queue of themonitored object.
≥ 0 ms CloudTableinstance
Average Flushoperationsduration
Indicates the average Flushoperation time (ms) of themonitored object.
≥ 0 ms CloudTableinstance
CompactionQueue Size
Indicates the Compaction queuesize in a RegionServer of themonitored object.
≥ 0 CloudTableinstance
Flush QueueSize
Indicates the Flush queue size in aRegionServer of the monitoredobject.
≥ 0 CloudTableinstance
CompactionCount
Indicates the Compaction countsof the monitored object.
≥ 0 CloudTableinstance
Flush OperationCount
Indicates the Flush operationcounts of the monitored object.
≥ 0 CloudTableinstance
DiscardedCache Blocks
Indicates the discarded cacheblocks of the monitored object.
≥ 0 CloudTableinstance
Sync WALTime (Max)
Indicates the maximum time (ms)of Hlog Sync of the monitoredobject.
≥ 0 ms CloudTableinstance
Sync WALTime (Mean)
Indicates the average time (ms) ofHlog Sync of the monitored object.
≥ 0 ms CloudTableinstance
15.8.4 AIS Metrics
Table 15-34 AIS metrics
Metric Description Value Range Monitored Object
Successful CallsForm RecognitionTimes
Counts the times that EnglishCustoms Form OCR issuccessfully invoked. The unit istimes.
≥ 0 times/minute
API
Failed Calls FormRecognition Times
Counts the times that EnglishCustoms Form OCR fails to beinvoked. The unit is times.
≥ 0 times/minute
API
Cloud EyeUser Guide 15 Services Supported by Cloud Eye
Issue 25 (2018-07-30) Huawei Proprietary and ConfidentialCopyright © Huawei Technologies Co., Ltd.
149

Metric Description Value Range Monitored Object
Successful Calls ofBin Packing
Counts the times that Bin Packingis successfully invoked. The unit istimes.
≥ 0 times/minute
API
Failed Calls of BinPacking
Counts the times that Bin Packingfails to be invoked. The unit istimes.
≥ 0 times/minute
API
Successful Calls ofPath Program
Counts the times that PathProgram is successfully invoked.The unit is times.
≥ 0 times/minute
API
Failed Calls of PathProgram
Counts the times that PathProgram fails to be invoked. Theunit is times.
≥ 0 times/minute
API
Successful Calls ofTime Anomaly
Counts the times that TimeAnomaly is successfully invoked.The unit is times.
≥ 0 times/minute
API
Failed Calls of TimeAnomaly
Counts the times that TimeAnomaly fails to be invoked. Theunit is times.
≥ 0 times/minute
API
Successful Calls ofDark Enhance
Counts the times that DarkEnhance is successfully invoked.The unit is times.
≥ 0 times/minute
API
Failed Calls of DarkEnhance
Counts the times that DarkEnhance fails to be invoked. Theunit is times.
≥ 0 times/minute
API
Successful Calls ofImage Defog
Counts the times that Defog issuccessfully invoked. The unit istimes.
≥ 0 times/minute
API
Failed Calls ofImage Defog
Counts the times that Defog failsto be invoked. The unit is times.
≥ 0 times/minute
API
Successful Calls ofSuper Resolution
Counts the times that SuperResolution is successfully invoked.The unit is times.
≥ 0 times/minute
API
Failed Calls ofSuper Resolution
Counts the times that SuperResolution fails to be invoked. Theunit is times.
≥ 0 times/minute
API
Successful Calls ofImage Tagging
Counts the times that ImageRecognition is successfullyinvoked. The unit is times.
≥ 0 times/minute
API
Cloud EyeUser Guide 15 Services Supported by Cloud Eye
Issue 25 (2018-07-30) Huawei Proprietary and ConfidentialCopyright © Huawei Technologies Co., Ltd.
150

Metric Description Value Range Monitored Object
Failed Calls ofImages Tagging
Counts the times that ImageRecognition fails to be invoked.The unit is times.
≥ 0 times/minute
API
Successful Calls ofImage Moderation
Counts the times that ImageModeration is successfullyinvoked. The unit is times.
≥ 0 times/minute
API
Failed Calls ofImage Moderation
Counts the times that ImageModeration fails to be invoked.The unit is times.
≥ 0 times/minute
API
Successful CalledForm RecognitionTimes
Counts the successful called ofcustom form recognition times ofusers. The unit is times.
≥ 0 times/minute
API
Failed Called ofCustom FormRecognition Times
Counts the failed called of customform recognition times of users.The unit is times.
≥ 0 times/minute
API
Successful Calls ofVat InvoiceRecognition
Counts the times that VAT InvoiceOCR is successfully invoked. Theunit is times.
≥ 0 times/minute
API
Failed Calls of VatInvoice Recognition
Counts the times that VAT InvoiceOCR fails to be invoked. The unitis times.
≥ 0 times/minute
API
Successful Calls ofId Card Recognition
Counts the times that Id Card issuccessfully invoked. The unit istimes.
≥ 0 times/minute
API
Failed Calls of IdCard Recognition
Counts the times that Id Card failsto be invoked. The unit is times.
≥ 0 times/minute
API
Successful Calls ofImage RecaptureDetect
Counts the times that RecaptureDetect is successfully invoked.The unit is times.
≥ 0 times/minute
API
Failed Calls ofImage RecaptureDetect
Counts the times that RecaptureDetect fails to be invoked. The unitis times.
≥ 0 times/minute
API
Successful Calls ofDispatch Planning
Counts the times that DispatchPlanning is successfully invoked.The unit is times.
≥ 0 times/minute
API
Failed Calls ofDispatch Planning
Counts the times that DispatchPlanning fails to be invoked. Theunit is times.
≥ 0 times/minute
API
Cloud EyeUser Guide 15 Services Supported by Cloud Eye
Issue 25 (2018-07-30) Huawei Proprietary and ConfidentialCopyright © Huawei Technologies Co., Ltd.
151

Metric Description Value Range Monitored Object
Successful Calls ofPickup Planning
Counts the times that PickupPlanning is successfully invoked.The unit is times.
≥ 0 times/minute
API
Failed Calls ofPickup Planning
Counts the times that PickupPlanning fails to be invoked. Theunit is times.
≥ 0 times/minute
API
Successful Calls ofVehicle Recognition
Counts the times that VehicleLicense OCR is successfullyinvoked. The unit is times.
≥ 0 times/minute
API
Failed Calls ofVehicle Recognition
Counts the times that VehicleLicense OCR fails to be invoked.The unit is times.
≥ 0 times/minute
API
Successful Calls ofDriver LicenseRecognition
Counts the times that DrivingLicense OCR is successfullyinvoked. The unit is times.
≥ 0 times/minute
API
Failed Calls ofDriver LicenseRecognition
Counts the times that DrivingLicense OCR fails to be invoked.The unit is times.
≥ 0 times/minute
API
Successful Calls ofHandwritingRecognition
Counts the times that HandwritingLetters & Digits OCR issuccessfully invoked. The unit istimes.
≥ 0 times/minute
API
Failed Calls ofHandwritingRecognition
Counts the times that HandwritingLetters & Digits OCR fails to beinvoked. The unit is times.
≥ 0 times/minute
API
Successful Calls ofGeneral TableRecognition
Counts the times that GeneralTable OCR is successfullyinvoked. The unit is times.
≥ 0 times/minute
API
Failed Calls ofGeneral TableRecognition
Counts the times that GeneralTable OCR fails to be invoked.The unit is times.
≥ 0 times/minute
API
Successful Calls ofSentenceRecognition
Counts the times that sentencerecognition is successfullyinvoked. The unit is times.
≥ 0 times/minute
API
Failed Calls ofSentenceRecognition
Counts the times that sentencerecognition fails to be invoked.The unit is times.
≥ 0 times/minute
API
Successful Calls ofBank CardRecognition
Specifies the times that bank cardrecognition is successfullyinvoked. The unit is times.
≥ 0 times/minute
API
Cloud EyeUser Guide 15 Services Supported by Cloud Eye
Issue 25 (2018-07-30) Huawei Proprietary and ConfidentialCopyright © Huawei Technologies Co., Ltd.
152
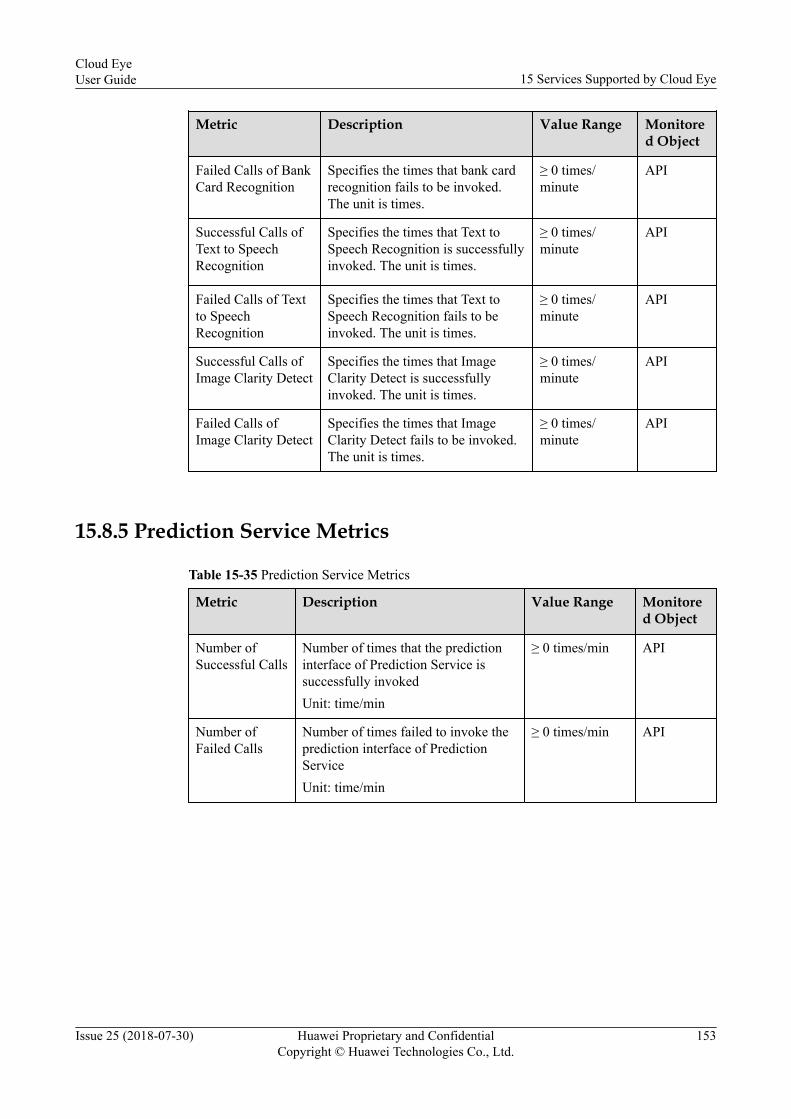
Metric Description Value Range Monitored Object
Failed Calls of BankCard Recognition
Specifies the times that bank cardrecognition fails to be invoked.The unit is times.
≥ 0 times/minute
API
Successful Calls ofText to SpeechRecognition
Specifies the times that Text toSpeech Recognition is successfullyinvoked. The unit is times.
≥ 0 times/minute
API
Failed Calls of Textto SpeechRecognition
Specifies the times that Text toSpeech Recognition fails to beinvoked. The unit is times.
≥ 0 times/minute
API
Successful Calls ofImage Clarity Detect
Specifies the times that ImageClarity Detect is successfullyinvoked. The unit is times.
≥ 0 times/minute
API
Failed Calls ofImage Clarity Detect
Specifies the times that ImageClarity Detect fails to be invoked.The unit is times.
≥ 0 times/minute
API
15.8.5 Prediction Service Metrics
Table 15-35 Prediction Service Metrics
Metric Description Value Range Monitored Object
Number ofSuccessful Calls
Number of times that the predictioninterface of Prediction Service issuccessfully invokedUnit: time/min
≥ 0 times/min API
Number ofFailed Calls
Number of times failed to invoke theprediction interface of PredictionServiceUnit: time/min
≥ 0 times/min API
Cloud EyeUser Guide 15 Services Supported by Cloud Eye
Issue 25 (2018-07-30) Huawei Proprietary and ConfidentialCopyright © Huawei Technologies Co., Ltd.
153

15.8.6 Elasticsearch Metrics
Table 15-36 Elasticsearch Metrics
Metric Description ValueRange
Monitored Object
Cluster Status Status of the monitored object 0, 1, 20 indicatesnormal. 1indicatesthat thereplica shardis lost. 2indicatesthat theprimaryshard is lost.
Elasticsearch Service
Disk Usage Percentage of total disk space that is used Unit:Percent
0–100% Elasticsearch Service
15.9 Enterprise Applications
15.9.1 Workspace Metrics
Table 15-37 Workspace metrics
Metric Description Value Range Monitored Object
CPU Usage Indicates the CPU usage of themonitored object. The unit ispercent.
0-1 IaaS
Memory Usage Indicates the memory usage ofthe monitored object. The unitis percent.
0-1 IaaS
Disk Usage Indicates the disk usage of themonitored object. The unit ispercent.
0-1 IaaS
IOPS Indicates the number of I/Ooperations per second on themonitored object. It ismeasured in count.
≥ 0 counts IaaS
Cloud EyeUser Guide 15 Services Supported by Cloud Eye
Issue 25 (2018-07-30) Huawei Proprietary and ConfidentialCopyright © Huawei Technologies Co., Ltd.
154

Metric Description Value Range Monitored Object
Network InputThroughput
Indicates the number ofincoming bytes per second onthe monitored object. The unitis byte/s.
≥ 0 bytes/s IaaS
NetworkOutputThroughput
Indicates the number ofoutgoing bytes per second onthe monitored object. The unitis byte/s.
≥ 0 bytes/s IaaS
Cloud EyeUser Guide 15 Services Supported by Cloud Eye
Issue 25 (2018-07-30) Huawei Proprietary and ConfidentialCopyright © Huawei Technologies Co., Ltd.
155

16 Operations Supported by Event
Monitoring
Table 16-1 ECS
EventSource
Operation Name Event Name Event Severity
ECS Deleting an ECS deleteServer Major
Restarting an ECS rebootServer Minor
Stopping an ECS stopServer Minor
Deleting a NIC deleteNic Major
Modifying ECSspecifications
resizeServer Minor
Deleting a securitygroup rule
deleteSgRule Major
Starting automaticrecovery
startAutoRecovery
Major
Ending automaticrecovery
endAutoRecovery Major
NOTE
Once a physical host accommodating ECSs breaks down, the ECSs automatically migrate to a functionalphysical host. The ECSs will restart during the migration.
Table 16-2 VPC
EventSource
Operation Name Event Name Event Severity
VPC Deleting a VPC deleteVpc Major
Cloud EyeUser Guide 16 Operations Supported by Event Monitoring
Issue 25 (2018-07-30) Huawei Proprietary and ConfidentialCopyright © Huawei Technologies Co., Ltd.
156

EventSource
Operation Name Event Name Event Severity
Modifying a VPC modifyVpc Minor
Deleting a subnet deleteSubnet Minor
Modifying a subnet modifySubnet Minor
Releasing an EIP deleteEip Minor
Modify thebandwidth
modifyBandwidth Minor
Deleting a VPN deleteVpn Major
Modifying a VPN modifyVpn Minor
Table 16-3 EVS disks
EventSource
Operation Name Event Name Event Severity
EVS Updating a volume updateVolume Minor
Expanding volumecapacity
extendVolume Minor
Deleting a volume deleteVolume Major
Table 16-4 RDS
EventSource
Operation Name Event Name Event Severity
RDS Resetting thedatabaseadministratorpassword
resetPassword Major
Performing a clusteroperation
instanceAction Major
Deleting an instancefrom a cluster
deleteInstance Minor
Modifying a backuppolicy
setBackupPolicy Minor
Modifying aparameter group
updateParameterGroup
Minor
Cloud EyeUser Guide 16 Operations Supported by Event Monitoring
Issue 25 (2018-07-30) Huawei Proprietary and ConfidentialCopyright © Huawei Technologies Co., Ltd.
157

EventSource
Operation Name Event Name Event Severity
Deleting a parametergroup
deleteParameterGroup
Minor
Resetting aparameter group
resetParameterGroup
Minor
Modifying adatabase port
changeInstancePort
Major
Table 16-5 IAM
EventSource
Operation Name Event Name Event Severity
IAM User login login Minor
User logout logout Minor
Resetting the loginpassword
changePassword Major
Creating a user createUser Minor
Deleting a user deleteUser Major
Modifying a user updateUser Minor
Creating a usergroup
createUserGroup Minor
Deleting a usergroup
deleteUserGroup Major
Modifying a usergroup
updateUserGroup
Minor
Creating an identityprovider (IDP)
createIdentityProvider
Minor
Deleting an IDP deleteIdentityProvider
Major
Modifying an IDP updateIdentityProvider
Minor
Updating metadata updateMetadata Minor
Updating the loginpolicy
updateSecurityPolicies
Major
Creating an AK/SK addCredential Major
Deleting an AK/SK deleteCredential Major
Cloud EyeUser Guide 16 Operations Supported by Event Monitoring
Issue 25 (2018-07-30) Huawei Proprietary and ConfidentialCopyright © Huawei Technologies Co., Ltd.
158

EventSource
Operation Name Event Name Event Severity
Creating a project createProject Minor
Updating a project updateProject Minor
Freezing a project suspendProject Major
Table 16-6 KMS
EventSource
Operation Name Event Name Event Severity
KMS Disabling a key disableKey Major
Scheduling thedeletion of a key
scheduleKeyDeletion
Minor
Grant retiring retireGrant Major
Grant revoking revokeGrant Major
Table 16-7 OBS
EventSource
Operation Name Event Name Event Severity
OBS Deleting a bucket deleteBucket Major
Deleting the bucketpolicy configuration
deleteBucketPolicy
Major
Deleting bucketdata
deleteBucketdata Major
Setting the bucketACL
setBucketAcl Minor
Setting the bucketpolicy
setBucketPolicy Minor
Table 16-8 Cloud Eye
EventSource
Operation Name Event Name Event Severity
CES Agent heartbeatdata interruption
agentHeartbeatIn-terrupted
Major
Cloud EyeUser Guide 16 Operations Supported by Event Monitoring
Issue 25 (2018-07-30) Huawei Proprietary and ConfidentialCopyright © Huawei Technologies Co., Ltd.
159

Table 16-9 EIP
EventSource
Operation Name Event Name Event Severity
EIP EIP bandwidth outof range
EIPBandwidthOverflow
Major
Cloud EyeUser Guide 16 Operations Supported by Event Monitoring
Issue 25 (2018-07-30) Huawei Proprietary and ConfidentialCopyright © Huawei Technologies Co., Ltd.
160

17 FAQs
17.1 Concepts
17.1.1 What Is Cloud Eye?Cloud Eye is a multi-dimensional monitoring platform. With Cloud Eye, you can understandthe resource usage and running status of services running on the cloud platform, receive alarmnotifications in a timely manner, and react to changes to keep your services running smoothly.
17.1.2 What Alarm Status Does Cloud Eye Support?Cloud Eye supports three alarm status: Alarm, OK, and Insufficient data.
l If an alarm rule is disabled, its alarm status is considered as invalid, and Disabled isdisplayed.
l Insufficient data indicates that no data has been generated within the latest monitoringperiod. Usually, it is caused by the deletion or abnormal status of service instances.
17.1.3 What Is Rollup?Rollup is the process in which Cloud Eye calculates sample raw data collected in differentperiods by using different rollup methods, including Avg., Max., Min., Sum, and Variance.The calculation period is called a rollup period.
Rollup is a smooth calculation process. The longer the rollup interval, the more smoothlyprocessing will be implemented, and the more accurate these generated data will reflect thereal situation. However, the shorter the rollup interval is, the more effective alarm reportingwill be.
The rollup period can be 5 minutes, 20 minutes, 1 hour, 4 hours, or 1 day.
The methods Cloud Eye uses to process collected data vary depending on data type:
l If the data is an integer, the data will be rounded.l If the data is a decimal fraction, two decimal places will be retained. Any further decimal
places will be rounded.
Cloud EyeUser Guide 17 FAQs
Issue 25 (2018-07-30) Huawei Proprietary and ConfidentialCopyright © Huawei Technologies Co., Ltd.
161
For example, the instance quantity in AS is an integer. If the rollup period is 5 minutes, thevalues of collected metric data are 1 and 4, while the average value is 2 instead of 2.5.
You can choose the Cloud Eye mode based on the characteristics of the rollup to meet yourservice requirements.
17.1.4 How Long Is the Metric Data Retained?Metric data includes original and rollup metric data.
l Original metric data is sampled raw data and are retained for two days.
l Rollup metric data is data aggregated based on raw metric data. Retention durations forrollup metric data depend on the rollup period.
– Metric data whose rollup period is 5 minutes are retained for 10 days.
– Metric data whose rollup period is 20 minutes are retained for 20 days.
– Metric data whose rollup period is 1 hour are retained for 155 days.
– Metric data whose rollup period is 4 hours are retained for 300 days.
– Metric data whose rollup period is 1 day are retained for 5 years.
If a resource instance is stopped, closed, or deleted, an original metric will be deleted onehour after its original data is not reported. After the metric data report resumes, the historicaldata of that metric is available.
17.1.5 How Many Rollup Methods Does Cloud Eye Support?Cloud Eye supports the following rollup methods:
l Average
If Avg. is selected for Statistic, Cloud Eye calculates the average value of metric datawithin a rollup period.
l Maximum
If Max. is selected for Statistic, Cloud Eye calculates the maximum value of metric datawithin a rollup period.
l Minimum
If Min. is selected for Statistic, Cloud Eye calculates the minimum value of metric datawithin a rollup period.
l Sum
If Sum is selected for Statistic, Cloud Eye calculates the sum of metric data within arollup period.
l Variance
If Variance is selected for Statistic, Cloud Eye calculates the variance value of metricdata within a rollup period.
NOTE
Rollup uses a rollup method to aggregate raw data generated within a specific period. Take the 5-minute period as an example. If it is 10:35 now, the raw data generated between 10:30 and 10:35will be aggregated to 10:30.
Cloud EyeUser Guide 17 FAQs
Issue 25 (2018-07-30) Huawei Proprietary and ConfidentialCopyright © Huawei Technologies Co., Ltd.
162

17.1.6 What Is Server Monitoring?By installing an open-source plug-in on an ECS or BMS, Cloud Eye provides you withsystem-wide, active, and fine-grained monitoring. Currently, only Linux 64-bit OSs andWindows OSs are supported.
Server Monitoring supports Huawei ECSs as well as that of other private clouds or hybridclouds. This function addresses the basic O&M problem of monitoring resources on the cloudand off the cloud in a centralized way.
17.1.7 What OSs Does the Agent Support?The following table lists OSs compatible with Telescope. OSs not included in the table arebeing tested.
NOTICEUsing OSs or versions that have not been verified may adversely affect your services.Exercise caution when using them.
Table 17-1 and Table 17-2 list the available OSs.
Table 17-1 System version (ECS)
Available OS(64 bit)
Version
CentOS 6.3, 6.5, 6.8, 6.9, 7.1, 7.2, 7.3, 7.4
OpenSUSE 13.2, 42.2
Debian 7.5.0, 8.2.0, 8.8.0, 9.0.0
Ubuntu 14.04 server, 16.04 server
EulerOS 2.2
SUSE Enterprise11 SP4, Enterprise12 SP1, Enterprise12 SP2
Fedora 24, 25
Oracle Linux 6.9, 7.4
CoreOS 10.10.5NOTE
Cloud-Init cannot be automatically installed. The manual installation directory is /.To query the Agent status, run the following command: systemctl telescopedstatus.
Other Gentoo Linux 13.0, Gentoo Linux 17.0NOTE
To query the Agent status, run the following command: rc-service telescopedstatus.
Cloud EyeUser Guide 17 FAQs
Issue 25 (2018-07-30) Huawei Proprietary and ConfidentialCopyright © Huawei Technologies Co., Ltd.
163

Available OS(64 bit)
Version
Windows Windows Server 2008 R2 Standard, Windows Server 2008 R2 StandardEnglishWindows Server 2008 R2 Enterprise, Windows Server 2008 R2Enterprise EnglishWindows Server 2012 R2 Standard, Windows Server 2012 R2 StandardEnglishWindows Server 2012 R2 Datacenter, Windows Server 2012 R2Datacenter EnglishWindows Server 2016 R2 Standard, Windows Server 2016 R2 StandardEnglishWindows Server 2016 R2 Datacenter, Windows Server 2016 R2Datacenter English
Table 17-2 System version (BMS)
Available OS (64 bit) Version
SUSE Enterprise11 SP4, Enterprise12 SP1
CentOS 6.9, 7.2, and 7.3
EulerOS 2.2
NOTE
The GPU plug-in supports only the EulerOS 2.2, Ubuntu 14.04 server, and CentOS 7.3.
17.1.8 What ECS Metrics Can Be Monitored by OS Monitoring?Currently, CPU, CPU load, memory, disk, disk I/O, file system, NIC, and GPU metrics can bemonitored.
Cloud EyeUser Guide 17 FAQs
Issue 25 (2018-07-30) Huawei Proprietary and ConfidentialCopyright © Huawei Technologies Co., Ltd.
164

Table 17-3 CPU metrics
Metric Description ValueRange
Collection Mode(Linux)
Collection Mode(Windows)
AGT.CPUUsage inIdle State
Indicates thepercentage oftime that theCPU is idle.The unit ispercent.
0-100%
Monitored object:cloud serverNOTE
Check file /proc/stat ina 10s interval.
Run the top commandto check the %Cpu(s)id value.
Monitored object: cloudserverNOTE
The value is obtained byinvoking WindowsAPIGetSystemTimes.
AGT.OtherProcessCPUUsage
Indicates thepercentage oftime that theCPU is used byother processes.The unit ispercent.
0-100%
Monitored object:cloud serverNOTE
It is calculated asfollows: AGT. OtherProcess CPU Usage =1- CPU Idle - KernelSpace CPU Usage -User Space CPUUsage
Monitored object: cloudserverNOTE
It is calculated as follows:AGT. Other Process CPUUsage = 1- CPU Idle -Kernel Space CPU Usage -User Space CPU Usage
AGT.KernelSpaceCPUUsage
Indicates thepercentage oftime that theCPU is used bykernel space.The unit ispercent.
0-100%
Monitored object:cloud serverNOTE
Check file /proc/stat in10-second intervals.
Run the top commandto check the %Cpu(s)sy value.
Monitored object: cloudserverNOTE
The value is obtained byinvoking WindowsAPIGetSystemTimes.
AGT.UserSpaceCPUUsage
Indicates thepercentage oftime that theCPU is used byuser space. Theunit is percent.
0-100%
Monitored object:cloud serverNOTE
Check file /proc/stat in10-second intervals.
Run the top commandto check the %Cpu(s)us value.
Monitored object: cloudserverNOTE
The value is obtained byinvoking WindowsAPIGetSystemTimes.
AGT.NiceProcessCPUUsage
Indicates thepercentage oftime that theCPU is in usermode with low-priorityprocesses whichcan easily beinterrupted byhigher-priorityprocesses.
0-100%
Monitored object:cloud serverNOTE
Check file /proc/stat in10-second intervals.
Run the top commandto check the %Cpu(s)ni value.
Not supported
Cloud EyeUser Guide 17 FAQs
Issue 25 (2018-07-30) Huawei Proprietary and ConfidentialCopyright © Huawei Technologies Co., Ltd.
165

Metric Description ValueRange
Collection Mode(Linux)
Collection Mode(Windows)
AGT.iowaitProcessCPUUsage
Indicates thepercentage oftime that theCPU is waitingfor I/Ooperations tocomplete. Theunit is percent.
0-100%
Monitored object:cloud serverNOTE
Check file /proc/stat in10-second intervals.
Run the top commandto check the %Cpu(s)wa value.
AGT.CPUInterruptRatio
Indicates thepercentage oftime that theCPU isservicinginterrupts. Theunit is percent.
0-100%
Monitored object:cloud serverNOTE
Check file /proc/stat in10-second intervals.
Run the top commandto check the %Cpu(s)hi value.
AGT.CPUSoft-interruptRatio
Indicates thepercentage oftime that theCPU isservicingsoftwareinterrupts. Theunit is percent.
0-100%
Monitored object:cloud serverNOTE
Check file /proc/stat in10-second intervals.
Run the top commandto check the %Cpu(s)si value.
Table 17-4 CPU load metrics
Metric Description ValueRange
MonitoredObject
Collection Mode(Linux)
AGT. 1-MinuteLoadAverage
Indicates the averageCPU load of themonitored object in thelast 1 minute.
≥ 0 Cloudserver
Obtain its value by usingthe load1/ value to dividethe number of logicalCPUs.Run the top command tocheck the load1 value inthe /proc/loadavg file.
Cloud EyeUser Guide 17 FAQs
Issue 25 (2018-07-30) Huawei Proprietary and ConfidentialCopyright © Huawei Technologies Co., Ltd.
166

Metric Description ValueRange
MonitoredObject
Collection Mode(Linux)
AGT. 5-MinuteLoadAverage
Indicates the averageCPU load of themonitored object in thelast 5 minutes.
≥ 0 Cloudserver
Obtain its value by usingthe load5/ value to dividethe number of logicalCPUs.Run the top command tocheck the load5 value inthe /proc/loadavg file.
AGT. 15-MinuteLoadAverage
Indicates the averageCPU load of themonitored object in thelast 15 minutes.
≥ 0 Cloudserver
Obtain its value by usingthe load15/ value todivide the number oflogical CPUs.Run the top command tocheck the load15 value inthe /proc/loadavg file.
NOTE
The Windows OS does not support the CPU load metrics.
Table 17-5 Memory metrics
Metric Description ValueRange
Collection Mode(Linux)
Collection Mode(Windows)
AGT.AvailableMemory
Indicates theamount ofmemory that isavailable and canbe given instantlyto processes. Theunit is GB.
≥ 0GB
Monitored object: cloudserverNOTE
Check file /proc/meminfo. Ifthe MemAvailable value isnot displayed in the file,obtain its value by adding thevalues of MemFree, Buffers,and Cached.
Monitored object:cloud serverNOTE
It is calculated byavailable memoryminuses used memory.The value is obtainedby invokingWindowsAPIGlobalMemoryStatu-sEx.
AGT.MemoryUsage
Indicates thepercentage ofmemory currentlyin use. The unit ispercent.
0-100%
Monitored object: cloudserverNOTE
Check file /proc/meminfo.AGT. Memory Usage =(MemTotal-MemAvailable)/MemTotal
Monitored object:cloud serverNOTE
The calculationformula is as follows:(Used memory size/Total memorysize*100%)
Cloud EyeUser Guide 17 FAQs
Issue 25 (2018-07-30) Huawei Proprietary and ConfidentialCopyright © Huawei Technologies Co., Ltd.
167

Metric Description ValueRange
Collection Mode(Linux)
Collection Mode(Windows)
AGT.IdleMemory
Indicates theamount ofmemory that isnot being used.The unit is GB.
≥ 0GB
Monitored object: cloudserverNOTE
Obtain its value by checkingfile /proc/meminfo.
Not supported
AGT.Buffer
Indicates thememory that isbeing used forbuffers. The unitis GB.
≥ 0GB
Monitored object: cloudserverNOTE
Obtain its value by checkingfile /proc/meminfo.
Run the top command tocheck the KiB Mem:buffersvalue.
AGT.Cache
Indicates thememory that isbeing used for filecaches. The unitis GB.
≥ 0GB
Monitored object: cloudserverNOTE
Obtain its value by checkingfile /proc/meminfo.
Run the top command tocheck the KiB Swap:cachedMem value.
Table 17-6 Disk metrics
Metric Description ValueRange
Collection Mode(Linux)
Collection Mode(Windows)
AGT.AvailableDisk Space
Indicates the spacethat is not used onthe disks. The unitis GB.
≥ 0GB
Monitored object:cloud serverNOTE
Run the df -h commandto check the data in theAvail column.
The path of the mountpoint prefix cannotexceed 64 characters. Itmust start with a letter,and contain only digits,lowercase letters,uppercase letters,hyphens (-), dots (.),and swung dashes (~).
Monitored object:cloud server
Cloud EyeUser Guide 17 FAQs
Issue 25 (2018-07-30) Huawei Proprietary and ConfidentialCopyright © Huawei Technologies Co., Ltd.
168
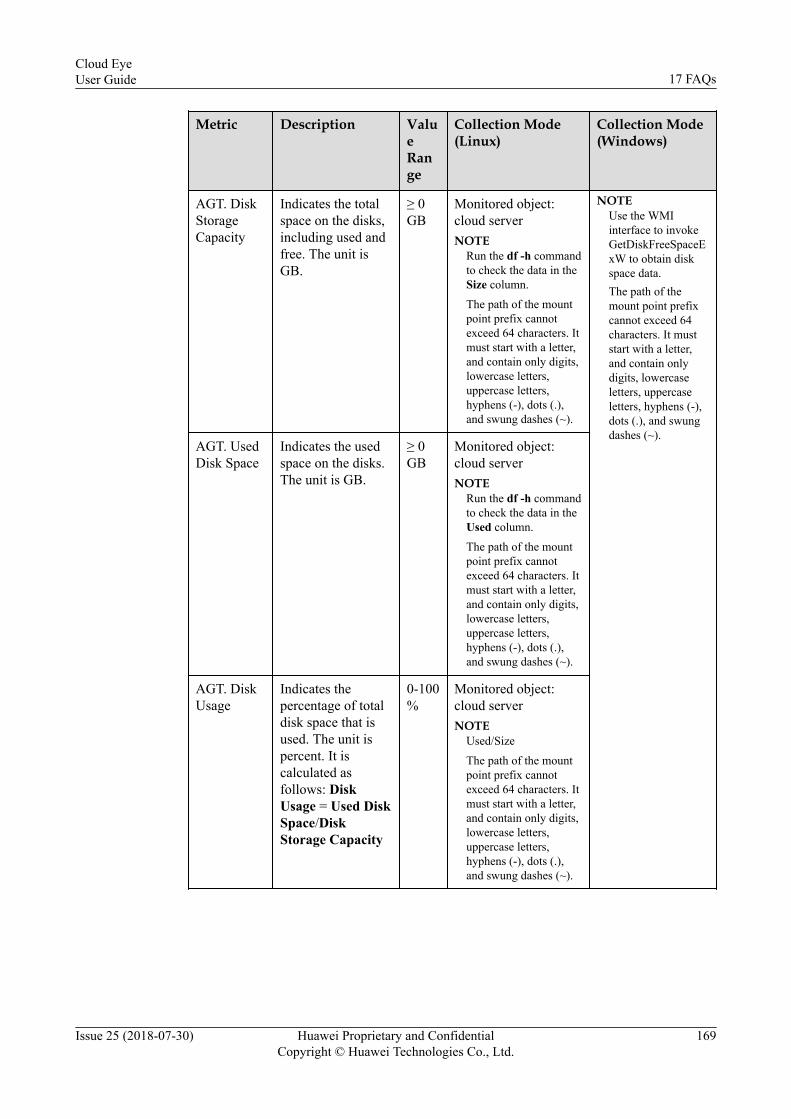
Metric Description ValueRange
Collection Mode(Linux)
Collection Mode(Windows)
AGT. DiskStorageCapacity
NOTEUse the WMIinterface to invokeGetDiskFreeSpaceExW to obtain diskspace data.The path of themount point prefixcannot exceed 64characters. It muststart with a letter,and contain onlydigits, lowercaseletters, uppercaseletters, hyphens (-),dots (.), and swungdashes (~).
Indicates the totalspace on the disks,including used andfree. The unit isGB.
≥ 0GB
Monitored object:cloud serverNOTE
Run the df -h commandto check the data in theSize column.
The path of the mountpoint prefix cannotexceed 64 characters. Itmust start with a letter,and contain only digits,lowercase letters,uppercase letters,hyphens (-), dots (.),and swung dashes (~).
AGT. UsedDisk Space
Indicates the usedspace on the disks.The unit is GB.
≥ 0GB
Monitored object:cloud serverNOTE
Run the df -h commandto check the data in theUsed column.
The path of the mountpoint prefix cannotexceed 64 characters. Itmust start with a letter,and contain only digits,lowercase letters,uppercase letters,hyphens (-), dots (.),and swung dashes (~).
AGT. DiskUsage
Indicates thepercentage of totaldisk space that isused. The unit ispercent. It iscalculated asfollows: DiskUsage = Used DiskSpace/DiskStorage Capacity
0-100%
Monitored object:cloud serverNOTE
Used/Size
The path of the mountpoint prefix cannotexceed 64 characters. Itmust start with a letter,and contain only digits,lowercase letters,uppercase letters,hyphens (-), dots (.),and swung dashes (~).
Cloud EyeUser Guide 17 FAQs
Issue 25 (2018-07-30) Huawei Proprietary and ConfidentialCopyright © Huawei Technologies Co., Ltd.
169

Table 17-7 Disk I/O metrics
Metric Description ValueRange
Collection Mode(Linux)
Collection Mode(Windows)
AGT.DisksReadRate
Indicates the numberof bytes read fromthe monitored diskper second (byte/s).
≥ 0bytes/s
Monitored object: cloudserverNOTE
The disk read rate iscalculated by calculating thedata changes in the sixthcolumn of thecorresponding device infile /proc/diskstats in 10-second intervals.
The path of the mount pointprefix cannot exceed 64characters. It must start witha letter, and contain onlydigits, lowercase letters,uppercase letters, hyphens(-), dots (.), and swungdashes (~).
Monitored object:cloud serverNOTE
UseWin32_PerfFormattedData_PerfDisk_LogicalDisk object inthe WMI to obtaindisk I/O data.
The path of themount point prefixcannot exceed 64characters. It muststart with a letter,and contain onlydigits, lowercaseletters, uppercaseletters, hyphens (-),dots (.), and swungdashes (~).AGT.
DisksReadRequests
Indicates the numberof read requests sentto the monitoreddisk per second(request/s).
≥ 0requests/s
Monitored object: cloudserverNOTE
The disk read requests arecalculated by calculating thedata changes in the fourthcolumn of thecorresponding device infile /proc/diskstats in 10-second intervals.
The path of the mount pointprefix cannot exceed 64characters. It must start witha letter, and contain onlydigits, lowercase letters,uppercase letters, hyphens(-), dots (.), and swungdashes (~).
Cloud EyeUser Guide 17 FAQs
Issue 25 (2018-07-30) Huawei Proprietary and ConfidentialCopyright © Huawei Technologies Co., Ltd.
170
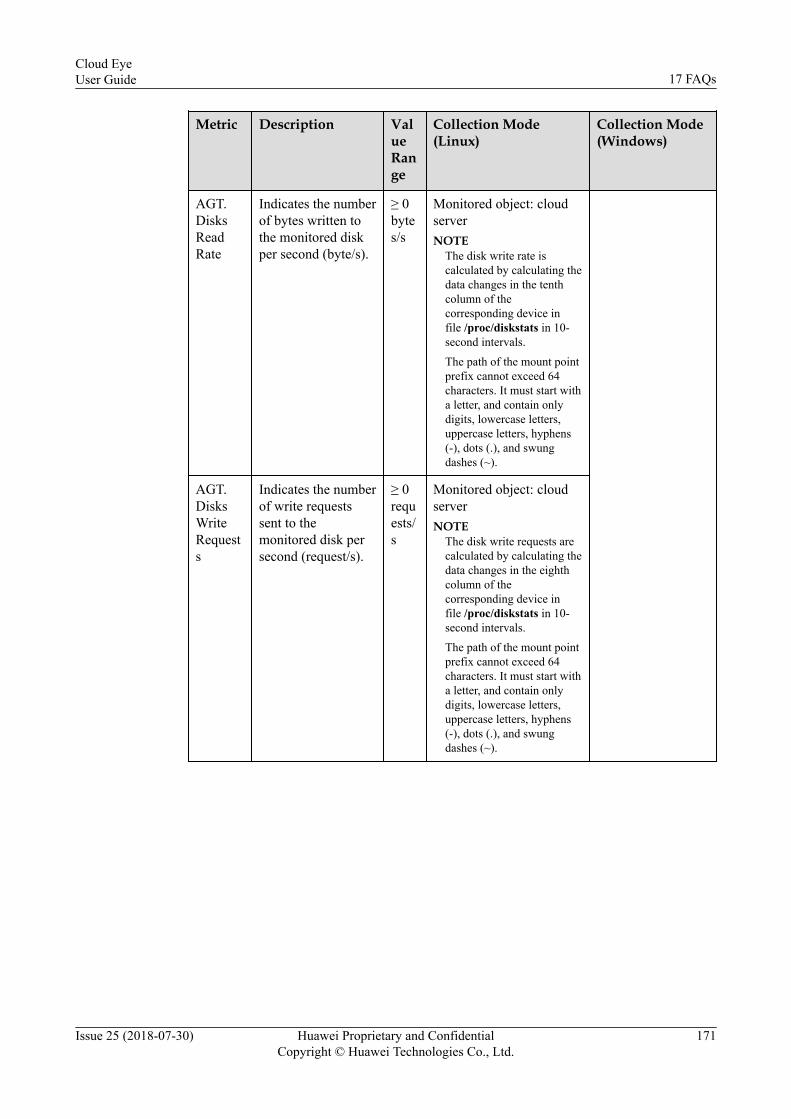
Metric Description ValueRange
Collection Mode(Linux)
Collection Mode(Windows)
AGT.DisksReadRate
Indicates the numberof bytes written tothe monitored diskper second (byte/s).
≥ 0bytes/s
Monitored object: cloudserverNOTE
The disk write rate iscalculated by calculating thedata changes in the tenthcolumn of thecorresponding device infile /proc/diskstats in 10-second intervals.
The path of the mount pointprefix cannot exceed 64characters. It must start witha letter, and contain onlydigits, lowercase letters,uppercase letters, hyphens(-), dots (.), and swungdashes (~).
AGT.DisksWriteRequests
Indicates the numberof write requestssent to themonitored disk persecond (request/s).
≥ 0requests/s
Monitored object: cloudserverNOTE
The disk write requests arecalculated by calculating thedata changes in the eighthcolumn of thecorresponding device infile /proc/diskstats in 10-second intervals.
The path of the mount pointprefix cannot exceed 64characters. It must start witha letter, and contain onlydigits, lowercase letters,uppercase letters, hyphens(-), dots (.), and swungdashes (~).
Cloud EyeUser Guide 17 FAQs
Issue 25 (2018-07-30) Huawei Proprietary and ConfidentialCopyright © Huawei Technologies Co., Ltd.
171

Metric Description ValueRange
Collection Mode(Linux)
Collection Mode(Windows)
AGT.AverageReadRequestTime
Indicates theaverage amount oftime that readrequests have waitedon the disks. Theunit is ms/count.
≥ 0 Monitored object: cloudserverNOTE
The average read requesttime is calculated bycalculating the data changesin the seventh column of thecorresponding device infile /proc/diskstats in 10-second intervals.
The path of the mount pointprefix cannot exceed 64characters. It must start witha letter, and contain onlydigits, lowercase letters,uppercase letters, hyphens(-), dots (.), and swungdashes (~).
AGT.AverageWriteRequestTime
Indicates theaverage amount oftime that writerequests have waitedon the disks. Theunit is ms/count.
≥ 0 Monitored object: cloudserverNOTE
The average write requesttime is calculated bycalculating the data changesin the eleventh column ofthe corresponding device infile /proc/diskstats in 10-second intervals.
The path of the mount pointprefix cannot exceed 64characters. It must start witha letter, and contain onlydigits, lowercase letters,uppercase letters, hyphens(-), dots (.), and swungdashes (~).
Cloud EyeUser Guide 17 FAQs
Issue 25 (2018-07-30) Huawei Proprietary and ConfidentialCopyright © Huawei Technologies Co., Ltd.
172

Metric Description ValueRange
Collection Mode(Linux)
Collection Mode(Windows)
AGT.Disk I/OUsage
Indicates thepercentage of thetime that the diskhas had I/O requestsqueued to the totaldisk operation time.The unit is percent.
≥ 0 Monitored object: cloudserverNOTE
The disk I/O usage iscalculated by calculating thedata changes in thethirteenth column of thecorresponding device infile /proc/diskstats in 10-second intervals.
The path of the mount pointprefix cannot exceed 64characters. It must start witha letter, and contain onlydigits, lowercase letters,uppercase letters, hyphens(-), dots (.), and swungdashes (~).
AGT.FileSystemRead/WriteStatus
Indicates the readand write status ofthe mounted filesystem of themonitored object.Possible values are 0(read and write) and1 (read only).
0,1 Monitored object: ECSNOTE
Check file systeminformation in the fourthcolumn in file /proc/mounts.
Not supported
Table 17-8 File system metrics
Metric Description ValueRange
Collection Mode(Linux)
Collection Mode(Windows)
AGT.DiskinodeTotal
Indicates the totalnumber of indexnodes on the disk.
≥ 0 Monitored object:cloud serverNOTE
Run the df -i commandto check the data in theInodes column.
The path of the mountpoint prefix cannotexceed 64 characters. Itmust start with a letter,and contain only digits,lowercase letters,uppercase letters,hyphens (-), dots (.), andswung dashes (~).
Not supported
Cloud EyeUser Guide 17 FAQs
Issue 25 (2018-07-30) Huawei Proprietary and ConfidentialCopyright © Huawei Technologies Co., Ltd.
173

Metric Description ValueRange
Collection Mode(Linux)
Collection Mode(Windows)
AGT.TotalinodeUsed
Indicates thenumber of usedindex nodes on thedisk.
≥ 0 Monitored object:cloud serverNOTE
Run the df -i commandto check the data in theIUsed column.
The path of the mountpoint prefix cannotexceed 64 characters. Itmust start with a letter,and contain only digits,lowercase letters,uppercase letters,hyphens (-), dots (.), andswung dashes (~).
AGT.Percentage ofTotalinodeUsed
Indicates the ratioof used indexnodes to the totalindex nodes on thedisk. The unit ispercent.
0-100% Monitored object:cloud serverNOTE
Run the df -i commandto check the data in theIUse% column.
The path of the mountpoint prefix cannotexceed 64 characters. Itmust start with a letter,and contain only digits,lowercase letters,uppercase letters,hyphens (-), dots (.), andswung dashes (~).
Table 17-9 NIC metrics
Metric Description ValueRange
Collection Mode Collection Mode
ACT.OutboundBandwidth
Indicates the bits sentper second of themonitored objectNIC. The unit is bit/s.
≥ 0bits/s
Monitored object:cloud serverNOTE
Check the metricvalue changes in file /proc/net/dev in 10-second intervals.
Monitored object:cloud serverNOTE
Use the MibIfRowobject in the WMI toobtain networkmetric data.AGT.
InboundBandwidth
Indicates the bitsreceived per secondof the monitoredobject NIC. The unitis bit/s.
≥ 0bits/s
Cloud EyeUser Guide 17 FAQs
Issue 25 (2018-07-30) Huawei Proprietary and ConfidentialCopyright © Huawei Technologies Co., Ltd.
174
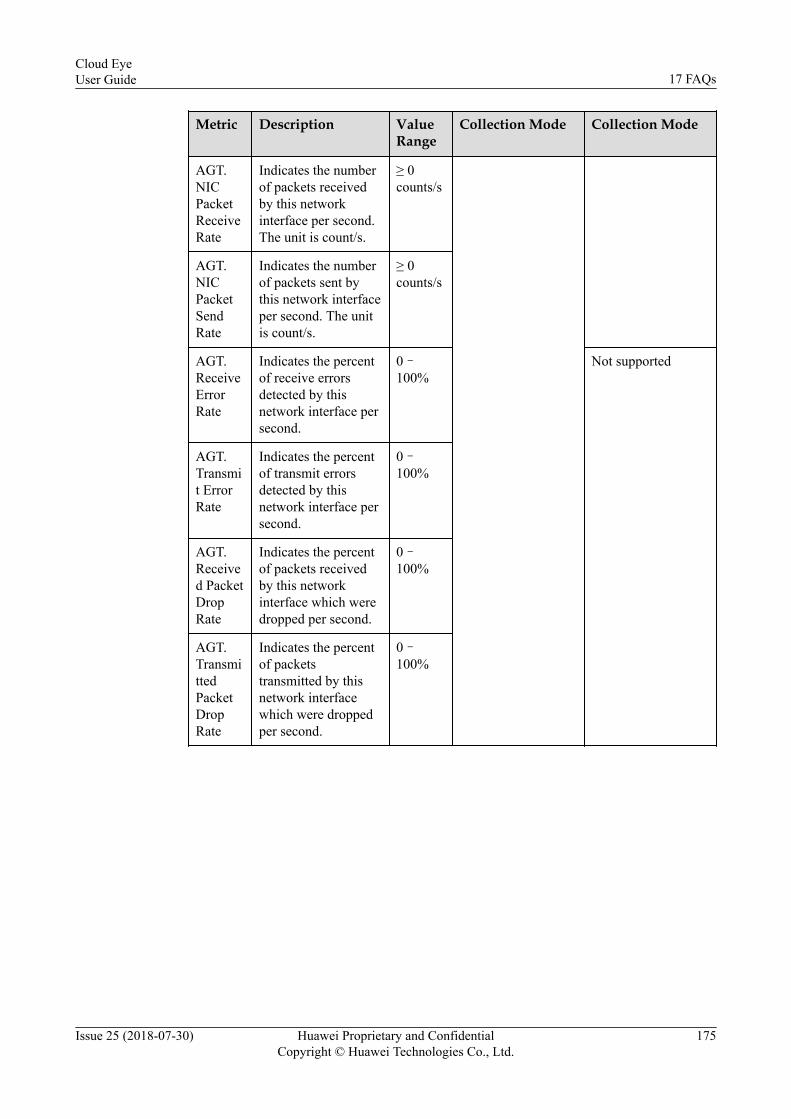
Metric Description ValueRange
Collection Mode Collection Mode
AGT.NICPacketReceiveRate
Indicates the numberof packets receivedby this networkinterface per second.The unit is count/s.
≥ 0counts/s
AGT.NICPacketSendRate
Indicates the numberof packets sent bythis network interfaceper second. The unitis count/s.
≥ 0counts/s
AGT.ReceiveErrorRate
Indicates the percentof receive errorsdetected by thisnetwork interface persecond.
0–100%
Not supported
AGT.Transmit ErrorRate
Indicates the percentof transmit errorsdetected by thisnetwork interface persecond.
0–100%
AGT.Received PacketDropRate
Indicates the percentof packets receivedby this networkinterface which weredropped per second.
0–100%
AGT.TransmittedPacketDropRate
Indicates the percentof packetstransmitted by thisnetwork interfacewhich were droppedper second.
0–100%
Cloud EyeUser Guide 17 FAQs
Issue 25 (2018-07-30) Huawei Proprietary and ConfidentialCopyright © Huawei Technologies Co., Ltd.
175

Table 17-10 GPU Metrics
Metric Description ValueRange
MonitoredObject
CollectionMode (Linux)
Performance Status
Indicates the GPUperformance status of themonitored object. Thismetric has no unit.
P0-P15,P32P0 indicatesthemaximumperformance status.P15indicatestheminimumperformance status.P32indicatestheunknownstatus.
ECSNOTE
ECSs thatsupportGPU
Run the nvidia-smi command tocheck the data inthe Perf column.
MemoryUsage
Indicates the percentage ofmemory currently in use.The unit is percent.
0–100% Run the nvidia-smi command tocheck the data inthe Memory-Usage column.
GPUUsage
Indicates the percentage oftime that GPU is used. Theunit is percent.
0–100% Run the nvidia-smi command tocheck the data inthe GPU-Utilcolumn.
NOTE
l The Windows OS does not support the GPU metrics.
17.1.9 How Do I Upgrade the Agent?Agents of different versions provided by Cloud Eye have different metrics or functions. Youcan manually or automatically upgrade the Agent. The differences between the two modes areas follows:l Manual upgrade: In manual mode, you need to uninstall the Agent and reinstall it.
Linux OS: Log in to the ECS as user root and run the /usr/local/telescope/uninstall.shcommand to uninstall the Agent. Install the new Agent based on Installing the Agent.Windows OS: In the directory where the Agent installation package of the earlier versionis stored, double-click the uninstall.bat script to uninstall the Agent. In the directorywhere the Agent installation package of the new version is stored, double-clickinstall.bat to install and start the Agent.
Cloud EyeUser Guide 17 FAQs
Issue 25 (2018-07-30) Huawei Proprietary and ConfidentialCopyright © Huawei Technologies Co., Ltd.
176

l Automatic upgrade: Complex steps involved in the manual upgrade are saved. After theAgent is updated, the automatic upgrade is automatically performed to enable you toexperience the new functions in the first time.
17.1.10 Why Is the Metric Collection Point Lost During CertainPeriod of Time?
Figure 17-1 shows that no monitoring data is available during certain period of time.
Figure 17-1 Viewing graphs
This phenomenon is not a function or design defect. The Agent collects metrics based on theserver time. When the server time changes (time change caused by time synchronization), theillusion of metric collection point loss is displayed, actually, the metric collection point is notlost.
17.2 Usages
17.2.1 What Is an Alarm Notification? How Many Types of AlarmNotifications Exist? How Can I Configure Them?
Alarm notifications are actions that the system takes when the alarm status of an alarm rule ischanged.
You can configure alarm notifications when creating or modifying an alarm rule. You can alsodisable alarm notifications.
Cloud Eye supports the following alarm notification types:
l Sends emails or text messages to users, or sends HTTP/HTTPS requests to servers.
l Triggers automatic capacity expansion and reduction by working with AS.
Cloud EyeUser Guide 17 FAQs
Issue 25 (2018-07-30) Huawei Proprietary and ConfidentialCopyright © Huawei Technologies Co., Ltd.
177

17.2.2 Why Are the Network Traffic Metrics in Cloud EyeDifferent from Those Detected in ECS?
The sample data collection interval in Cloud Eye is different from that used by the metricmonitoring tool in the ECS.
Cloud Eye collects ECS and EVS data at four-minute intervals. The data collection intervalfor ECS second generation is 5 minutes. However, the metric monitoring tool in the ECScollects data at one-second intervals.
As the data collection cycle gets longer, the distortion of short time data increases. Therefore,Cloud Eye is suitable for monitoring long-term websites and applications running on ECSs.
Furthermore, you can configure alarm thresholds to generate alarms in the event of resourceexceptions or insufficiency, improving resource reliability.
17.2.3 What Are the Effects on ECS Metrics If vmtools Is NotInstalled on ECSs?
If vmtools is not installed on ECSs, Cloud Eye can still monitor the outband incoming rateand outband outgoing rate. However, it cannot monitor memory usage, disk usage, inbandincoming rate, or inband outgoing rate, which reduces data accuracy of the CPU usage.
For details about ECS metrics supported by Cloud Eye, see ECS monitoring metrics.
17.2.4 How Can I Export Monitoring Data?On the Cloud Eye console, click Cloud Service Monitoring and click Export MonitoringData. On the Export Monitoring Data page, select a time range, a service, a monitoredinstance, and a metric, and click Export.
l The first row in the exported monitoring report displays the user name, region name,service name, instance name, instance ID, metric name, monitoring data, time, andtimestamp. This report enables users to view historical monitoring data.
l If you need to convert the time in Unix timestamp to the time of the target time zone,perform the following steps:
a. Use Excel to open a .csv file.
b. Use the following formula to convert the time:
Target time = (Unix timestamp/1000 + (Target time zone) x 3600)/86400 + 70 x 365+ 19
c. Set cell format to Date.
For example, the Unix timestamp is 1475918112000 and the target time is Beijingtime. Beijing is located in the UTC+8 time zone. Therefore, the target time iscalculated as follows:
Target time = (1475918112000/1000 + (+8) x 3600)/86400 + 70 x 365 + 19
Set the cell format to date and select a presentation format such as 2016/3/14 13:30.Then, the final time is obtained and presented as 2016/10/8 17:15.
Cloud EyeUser Guide 17 FAQs
Issue 25 (2018-07-30) Huawei Proprietary and ConfidentialCopyright © Huawei Technologies Co., Ltd.
178

17.2.5 Under What Circumstances Will an Alarm Rule Trigger"Insufficient data"?
When the monitoring data of a metric is not reported to Cloud Eye for three consecutivehours, the alarm rule status changes to Insufficient data. In this case, if you click Insufficientdata for Trigger condition when creating the alarm rule, the system will send an email to youin a timely manner, so that you can locate problems promptly. The system can also sendHTTP or HTTPS requests to the server.
In special cases, if the period for reporting monitoring data is greater than three hours and forthree consecutive periods the monitoring data is not reported, the alarm rule status changes toInsufficient data.
17.2.6 How do I Handle the Garbled CSV File If I Open It withExcel?
You can export the Cloud Eye monitoring data as a CSV file, but when you open this file withExcel, there may be garbled Chinese characters. This is because the exported CSV file isencoded in UTF-8 while Excel is opened in the ANSI format. To solve this problem, useeither of the following solutions:
l Use a text editor such as NotePad or use WPS to open the exported CSV file.l When you open the CSV file, set Excel as follows:
1. Open Excel.2. Choose Data > From Text.3. Select the exported CSV file.
Text Import Wizard is displayed.4. Select Separator and click Next.5. Deselect Tab, select Comma, click Next, and click Finish.6. In the Import data dialog box, click OK.
17.2.7 Why I Cannot See the Monitoring Data on the Cloud EyeConsole After Purchasing Cloud Service Resources?
We are working to interconnect Cloud Eye with more cloud services. Before theinterconnection is completed, you cannot view the resource monitoring data of the cloudservices that have not been interconnected with Cloud Eye. Therefore, if you want to checkthe resource monitoring data of the cloud services you purchased, you need to first checkwhether the cloud services have been interconnected with Cloud Eye.
If the services have been interconnected with Cloud Eye, wait for a period of time, becausethe frequencies of each service to collect and report data to Cloud Eye are different. You canview the resource monitoring graph after Cloud Eye collects the first piece of monitoring data.
Cloud EyeUser Guide 17 FAQs
Issue 25 (2018-07-30) Huawei Proprietary and ConfidentialCopyright © Huawei Technologies Co., Ltd.
179

17.2.8 How Can I Ensure the Newly Purchased ECS Has the OSMonitoring Function?
Scenarios
This section describes how to enable the newly purchased ECS coming with the OSMonitoring function.
Prerequisites
The ECS with the Agent installed is available.
Procedure1. Log in to the ECS console. On the instance list, locate the row containing the ECS with
the Agent installed, choose More > Stop in the Operation column.
Figure 17-2 Stopping the target ECS
2. Choose More > Make Image.
Figure 17-3 Making an image
3. Set the private image name to Image_with_agent and click Apply Now.
Cloud EyeUser Guide 17 FAQs
Issue 25 (2018-07-30) Huawei Proprietary and ConfidentialCopyright © Huawei Technologies Co., Ltd.
180

Figure 17-4 Apply Now
4. Purchase a new ECS and select the newly created private image Image_with_agent.
Figure 17-5 Selecting Image_with_agent for Name
5. After the new ECS is created, log in to the ECS. Change InstanceId in the Agentconfiguration file /usr/local/telescope/bin/conf.json to the ECS name to complete thereplication process.
Figure 17-6 Modifying the Agent configuration file
17.2.9 Why the Cloud Eye Console Does Not Display the OSMonitoring Data or the Data Display Is Lagged After Agent IsInstalled and Configured on ECS?
After installing the Agent successfully, you need to choose Server Monitoring, enable theECS Monitoring Status, wait for 2 minutes. Then the OS Monitoring data will be displayedon the Cloud Eye console.
Cloud EyeUser Guide 17 FAQs
Issue 25 (2018-07-30) Huawei Proprietary and ConfidentialCopyright © Huawei Technologies Co., Ltd.
181

If Plug-in Status is Running and Monitoring Status is enabled, but no OS Monitoring datais displayed on the Cloud Eye Console after you have waited for 5 minutes, you need to checkwhether the ECS time and the console client time are consistent.
When the Agent reports data, it takes the ECS or BMS local time. When the console deliversrequests, it takes the browser time of the user client. If the two times are inconsistent, no OSMonitoring data is displayed on the Cloud Eye console.
NOTE
Run the following command to change the BMS time to be the same as that of the monitoring server:timedatectl set-timezone 'Asia/Shanghai'
17.2.10 What Should I Do if Plug-in Status Is Faulty?OS Monitoring sends a heartbeat message to Cloud Eye every 1 minute. If Cloud Eye cannotreceive a heartbeat for 3 minutes, Plug-in Status is displayed as Faulty.
Possible causes are:
1. The Agent is incorrectly configured. For details, see section Configuring the Agent inthe Cloud Eye User Guide.
2. You may find the cause in log /usr/local/telescope/log/common.log.
17.2.11 Restoring the Plug-in ConfigurationAfter the Agent is installed, you can configure AK/SK, RegionID, and ProjectId in one-clickmode. This saves manual configuration and improves configuration efficiency.
Alternatively, on the Server Monitoring page, select the target ECS and click Restore AgentConfigurations.
NOTE
One-click restoration is applicable to Agent 1.0.5 or later. If the Agent version is earlier than 1.0.5,upgrade the Agent first and then perform the one-click restoration or manually configure the Agent.
One-click restoration does not support BMSs.
17.2.11.1 Servers Without Agency Configured
Scenarios
This section describes how to enable Telescope to automatically obtain the AK and SK to helpyou collect logs by creating an agency. This frees you from exposing the AK or SK in theconfiguration file.
Procedure1. Log in to the management console.
2. Click in the upper left to select a region and a project.3. Under Management & Deployment, click Identity and Access Management.4. Choose Agency > Create Agency.5. Configure the parameters required for creating an agency.
Cloud EyeUser Guide 17 FAQs
Issue 25 (2018-07-30) Huawei Proprietary and ConfidentialCopyright © Huawei Technologies Co., Ltd.
182

Table 17-11 Creating an agency
Name Description Example Value
AgencyName
Specifies the name of the agency. Telescope_agency_001
AgencyType
Select Cloud service. N/A
CloudService
Select ECS. N/A
ValidityPeriod
Select Permanent. N/A
Description Specifies the detailed information about theagency. This parameter is optional.
N/A
6. In the Permissions area, click Modify in the row where the current region is located.
The Policy page is displayed.7. In the Available Policies area on the left, enter CES. In the search result, select CES and
CES Administrator.
NOTE
In the Available Policies area on the left, enter LTS. In the search result, select LTS and LTSAdministrator.
Figure 17-7 Selecting policies
8. Click OK in the lower part of the page.
If no agency is configured for the host, perform the following operations toconfigure the agency:
1. Log in to the management console.2. Under Computing, click Elastic Cloud Server.
NOTE
If you purchase a BMS, click Bare Metal Server under Computing.
3. Click the name of the target ECS on which the Agent is installed.
Cloud EyeUser Guide 17 FAQs
Issue 25 (2018-07-30) Huawei Proprietary and ConfidentialCopyright © Huawei Technologies Co., Ltd.
183

4. For Agency Name, select the agency name created in 17.2.11.1 Servers WithoutAgency Configured and click the green icon to confirm your selection.
Figure 17-8 Selecting an agency name (ECS)
Figure 17-9 Selecting an agency name (BMS)
17.2.11.2 Current Agency Permission Being AbnormalIf the current agency permission is abnormal, perform the following operations:
1. Log in to the management console.
2. Click in the upper left to select a region and a project.3. Under Management & Deployment, click Identity and Access Management.4. Click the name of the target agency and check whether the agency policy is CES
Administrator.
Cloud EyeUser Guide 17 FAQs
Issue 25 (2018-07-30) Huawei Proprietary and ConfidentialCopyright © Huawei Technologies Co., Ltd.
184

Figure 17-10 Viewing the agency permission
17.2.11.3 Current Agency Being Expired
If the current agency expires, the entrusted time has expired and cannot be used. You canchange the entrusted time to permanent based on step 5.
17.2.12 Permission Being AbnormalA user in a user group must have the Security Administrator permission. If no, a messageindicating the permission is abnormal is displayed. Contact the administrator to change thepermission.
Figure 17-11 Checking the permission
17.2.13 Agencies Cannot Be CreatedIf the agency quota is full during plug-in configuration restoration, you cannot create anagency. You can delete invalid agencies or expand the agency quota to restore the plug-inconfiguration again.
Cloud EyeUser Guide 17 FAQs
Issue 25 (2018-07-30) Huawei Proprietary and ConfidentialCopyright © Huawei Technologies Co., Ltd.
185

17.2.14 Agencies Being UsedWhen the plug-in configuration is restored, an agency whose name isCESAgentAutoConfigAgency is automatically created. If you have created such an agencyand ECS BMS is not selected for Agency Type, the agency may be used by other cloudservices.
You can delete the agency and restore the plug-in configuration again, or manually configurethe agency based on section 17.2.11.1 Servers Without Agency Configured.
17.2.15 What Should I do If the Service Port Is Used by the Agent?Cloud Eye Agent uses HTTP requests to report data every 10 seconds. Dynamic ports arerandomly occupied during the reporting. The port range is obtained from the system file: /proc/sys/net/ipv4/ip_local_port_range. If the service port used conflicts with the port usedby the Agent, you can modify /proc/sys/net/ipv4/ip_local_port_range and restart the Agentto solve the problem.
Procedure1. Log in an ECS or BMS as user root.2. Run the following command to open the sysctl.conf file:
vim /etc/sysctl.conf3. (Permanent modification) Run the following command to add new port configurations to
the sysctl.conf file:net.ipv4.ip_local_port_range=49152 65536
4. Run the following command to make the change take effect:sysctl -p /etc/sysctl.conf
NOTE
l For permanent change, the change still takes effect after the ECS or BMS is restarted.
l For temporary change (the change expires after the ECS or BMS is restarted), run command #echo 49152 65536 > /proc/sys/net/ipv4/ip_local_port_range.
5. Run the following command to restart the Agent:/usr/local/telescope/telescoped restart
NOTE
/usr/local/telescope indicates the installation path of the Agent.
Cloud EyeUser Guide 17 FAQs
Issue 25 (2018-07-30) Huawei Proprietary and ConfidentialCopyright © Huawei Technologies Co., Ltd.
186

A Change History
Released On Description
2018-07-30 This issue is the twenty-fifth official release, which incorporates thefollowing changes:l Added ECS automatic recovery for Event Monitoring.l Resource groups support BMSs.l The Agent can be installed to a specified directory.l Added descriptions about specifying ports for the Agent.
2018-06-30 This issue is the twenty-fourth official release, which incorporates thefollowing changes:l Added the function of configuring data storage in bathes.l Added the function of restoring configurations of plug-ins in batches
for servers.l Added Elasticsearch metrics.l Added Relational Database Service (RDS) metrics.l Added Virtual Private Cloud (VPC) traffic metrics.
2018-05-30 This issue is the twenty-third official release, which incorporates thefollowing changes:l OS Monitoring supports process metrics.l OS Monitoring supports the Windows OSs.l Added the auto refresh button to the monitoring panels.
2018-04-30 This issue is the twenty-second official release, which incorporates thefollowing changes:l Interconnected with NAT Gateway.l Optimized the strings for alarm rule creation.l Added the Event Monitoring function.l Changed the ECS Monitoring page.
Cloud EyeUser Guide A Change History
Issue 25 (2018-07-30) Huawei Proprietary and ConfidentialCopyright © Huawei Technologies Co., Ltd.
187

Released On Description
2018-03-30 This issue is the twenty-first official release, which incorporates thefollowing changes:l Added Distributed Cache Service (DCS) metrics.l Interconnected with UPredict.l Interconnected with ElasticSearch.l OS Monitoring supports GPU metrics.l Added the Resource Groups function.l Added the Log Monitoring function.
2018-02-28 This issue is the twentieth official release, which incorporates thefollowing changes:l Added Artificial Intelligence Service (AIS) metrics.l Interconnected with Cloud Data Migration (CDM).l Added the Availability feature to the Website Monitoring function.l OS Monitoring supports load metrics.
2018-01-30 This issue is the nineteenth official release, which incorporates thefollowing changes:l Added the Custom Monitoring function.l Added Artificial Intelligence Service (AIS) metrics.l Added the Website Monitoring function.
2018-01-26 This issue is the eighteenth official release, which incorporates thefollowing changes:l Added the Process Monitoring function.l OS Monitoring supports NIC metrics.l Added the metric sorting function.l Interconnected with Object Storage Service (OBS).
2017-12-30 This issue is the seventeenth official release, which incorporates thefollowing changes:l Interconnected with API Gateway.l Interconnected with Document Database Service (DDS).l Interconnected with CloudTable.l Added Distributed Cache Service (DCS) metrics.l Added Artificial Intelligence Service (AIS) metrics.
Cloud EyeUser Guide A Change History
Issue 25 (2018-07-30) Huawei Proprietary and ConfidentialCopyright © Huawei Technologies Co., Ltd.
188

Released On Description
2017-11-30 This issue is the sixteenth official release, which incorporates thefollowing changes:l Interconnected with Distributed Database Middleware (DDM).l Added Artificial Intelligence Service (AIS) metrics.l Added Auto Scaling (AS) metrics.l Added the content of using Cloud-Init to automatically install and
configure the Agent.l Added the function of Metric Data Transfer to OBS.
2017-10-30 This issue is the fifteenth official release, which incorporates thefollowing changes:l The Advanced Monitoring function is added.l Optimized the descriptions of Distributed Message Service (DMS)
metrics.l When you create a topic, the page jumps from the Cloud Eye console
to the SMN console.
2017-09-30 This issue is the fourteenth official release, which incorporates thefollowing changes:l Added the Custom Alarm Templates function.l Add Monitoring Overview.l Added FunctionGraph metrics.l Added Scalable File Service (SFS) metrics.
2017-08-30 This issue is the thirteenth official release, which incorporates thefollowing changes:l Added the alarm template.l Updated the process of adding alarm rules.
2017-07-30 This issue is the twelfth official release, which incorporates thefollowing changes:l Added Artificial Intelligence Service (AIS) metrics.l Added section Under What Circumstances Will an Alarm Rule
Trigger "Insufficient data"?
2017-06-30 This issue is the eleventh official release, which incorporates thefollowing change:Optimized the Instance Monitoring page and supported tiled display ofmultiple metrics.
2017-05-26 This issue is the tenth official release, which incorporates the followingchanges:l Added Distributed Message Service (DMS) metrics.l Added Metric Quantity description.l Added Sum as a rollup method.
Cloud EyeUser Guide A Change History
Issue 25 (2018-07-30) Huawei Proprietary and ConfidentialCopyright © Huawei Technologies Co., Ltd.
189

Released On Description
2017-04-28 This issue is the ninth official release, which incorporates the followingchanges:l Added Machine Learning Service (MLS) metrics.l Added WEB Tamper Protection (WTP) metrics.l Added Data Warehouse Service (DWS) metrics.l Added Virtual Private Cloud (VPC) traffic metric.
2017-03-30 This issue is the eighth official release, which incorporates the followingchanges:l Added Workspace metrics.l Added Relational Database Service (RDS) metrics.l Added an Elastic Cloud Server (ECS) metric that can recover ECSs.
2017-02-27 This issue is the seventh official release, which incorporates thefollowing changes:l Added the operation of creating a monitoring panel.l Added the Cloud Eye data rollup mechanism.
2017-01-19 This issue is the sixth official release, which incorporates the followingchange:Added the rollup methods supported by Cloud Eye.
2016-12-30 This issue is the fifth official release, which incorporates the followingchange:Added the metric customization function.
2016-11-24 This issue is the fourth official release, which incorporates the followingchange:Added the alarm history viewing function.
2016-10-19 This issue is the third official release, which incorporates the followingchange:Deleted Resource Template Service (RTS) metrics.
2016-07-15 This issue is the second official release, which incorporates the followingchange:Added Relational Database Service (RDS) metrics.
2016-03-14 This issue is the first official release.
Cloud EyeUser Guide A Change History
Issue 25 (2018-07-30) Huawei Proprietary and ConfidentialCopyright © Huawei Technologies Co., Ltd.
190
Copyright © 2022 FDOKUMEN