NATURE AND DYNAMICS OF ADJUSTMENT OF ...
59
NATURE AND DYNAMICS OF ADJUSTMENT OF COMMERCIAL BANKS’ RETAIL RATES TO MONETARY POLICY CHANGES IN KENYA. Steve Anyona Makambi 1 , Dr. Nelson H.W. Wawire 2 , Dr. Jacob O. Omolo 3 ABSTRACT Monetary authority’s legitimacy is based on the underlying assumption that policy actions are transmitted to market interest rates instantaneously, symmetrically and in a linear fashion. However, empirical evidence suggest that commercial banks’ pricing behavior, collusion and structure of financial system have an important bearing to transmission of policy-induced changes to the wider economy. Using monthly time series data from June 1993 to February 2012, this study investigated these assumptions by exploring nonlinear adjustment of commercial banks’ retail rates to monetary policy changes. Error correction model were re-parameterized to capture nonlinear aspects that may influence interest rate transmission via commercial banks in Kenya. The results revealed that adjustment towards long run equilibrium interest rates is sluggish, speed of adjustment of commercial bank retail rates to monetary policy changes ranges from 5 per cent per month to 15 per cent per month. Secondly, nonlinearity was established as speed of adjustments asymmetrical across monetary policy regimes and/or continuously time varying. The findings revealed that lending rates are rigid downwards as they adjusted faster during expansionary monetary policy regime compared to contractionary monetary policy regime. Third, there was evidence to suggest that nonlinearity adjustment simultaneously time varying and regime switching. Keywords: Nonlinear-Adjustment, Regime-Switching, Asymmetry, Time-Variation. 1 Main Author: School of Economics, Kenyatta University 2 Dean, School of Economics, Kenyatta University 3 Senior Lecturer, School of Economics, Kenyatta University
-
Upload
khangminh22 -
Category
Documents
-
view
0 -
download
0
Transcript of NATURE AND DYNAMICS OF ADJUSTMENT OF ...

NATURE AND DYNAMICS OF ADJUSTMENT OF COMMERCIAL BANKS’ RETAIL
RATES TO MONETARY POLICY CHANGES IN KENYA.
Steve Anyona Makambi1, Dr. Nelson H.W. Wawire2, Dr. Jacob O. Omolo3
ABSTRACT Monetary authority’s legitimacy is based on the underlying assumption that policy actions are transmitted to market interest rates instantaneously, symmetrically and in a linear fashion. However, empirical evidence suggest that commercial banks’ pricing behavior, collusion and structure of financial system have an important bearing to transmission of policy-induced changes to the wider economy. Using monthly time series data from June 1993 to February 2012, this study investigated these assumptions by exploring nonlinear adjustment of commercial banks’ retail rates to monetary policy changes. Error correction model were re-parameterized to capture nonlinear aspects that may influence interest rate transmission via commercial banks in Kenya. The results revealed that adjustment towards long run equilibrium interest rates is sluggish, speed of adjustment of commercial bank retail rates to monetary policy changes ranges from 5 per cent per month to 15 per cent per month. Secondly, nonlinearity was established as speed of adjustments asymmetrical across monetary policy regimes and/or continuously time varying. The findings revealed that lending rates are rigid downwards as they adjusted faster during expansionary monetary policy regime compared to contractionary monetary policy regime. Third, there was evidence to suggest that nonlinearity adjustment simultaneously time varying and regime switching.
Keywords: Nonlinear-Adjustment, Regime-Switching, Asymmetry, Time-Variation.
1 Main Author: School of Economics, Kenyatta University 2 Dean, School of Economics, Kenyatta University 3 Senior Lecturer, School of Economics, Kenyatta University

CHAPTER ONE
INTRODUCTION
1.1. Background
As Kenya lays foundation for realization of Vision 2030 goals, macroeconomic stability has been
identified as an important enabler of sustainable economic growth. According to Kenya Vision
2030, Central Bank of Kenya’s monetary policy stance should aim at maintaining inflation rate at
or below 5 per cent to promote credit expansion (Republic of Kenya, 2007). Central Bank of
Kenya is mandated to pursue monetary policy actions that are consistent with creation of a stable
financial environment and ensuring sustainable growth (Central Bank of Kenya, 2011).
The effectiveness of monetary policy action is pegged on the ability of monetary authority to
control broad money (M3) in line with set objectives. There is general consensus that monetary
policy action has an effect on prices, aggregate spending, investment and output (Bernanke and
Gertler, 1995). However, in recent times, economists differ on how monetary policy is transmitted
to the real sector economy. The conventional interest rate channel holds that monetary policy
decisions are transmitted to short term interest rates and thereafter affect the prices and demand for
non-bank assets and investment. Changes in demand for non-bank assets and investment
consequently affect demand for bank credit which compels commercial bank to adjust bank retail
rates in line with demand for bank credit (Bondt, 2005; Mishkin, 2010).
Studies conducted in United States, Euro zone and Africa have shown that the conventional
interest rate channel is incomplete and fails to adequately explain lack of potency of monetary
policy transmission (Bernanke, 1995; Loayza and Schmidt, 2002; Ogun and Akinlo, 2010). First,
interest rate channel assumes perfect financial market conditions and secondly, interest rate

2
channel assumes that commercial banks are passive agents and as such do not influence the level
of money supply and economic activity (Bernanke and Gertler, 1995). Bank lending channel has
gained significant interest as a complementary approach that explains monetary policy
transmission (Palley, 2001). Banking lending channel purports that commercial banks plays an
active role in money supply determination and may explain dynamics of monetary policy
transmission under imperfect market conditions ( Ogun and Akinlo, 2010; Palley, 2001).
Commercial banks are the most dominant players making Kenya a bank dependent economy. As
of 2009, commercial banks owned 80 per cent of financial sectors’ assets (Kamau, 2010).
Alternative sources of debt such as direct credit from security and money market are inaccessible
because Kenya’s security and money market lack sufficient products and services suitable for
majority of medium, small and micro businesses. The importance of commercial banks in
monetary policy transmission is also reinforced by financial innovation and financial deepening
initiatives that led to robust growth of commercial banks in the financial market (Ngugi, 2001;
Central Bank of Kenya, 2010a).
Modern reforms and financial sector dynamics have influenced monetary policy. Central Bank of
Kenya (2010a) confirms that expansion of financial sector; financial deregulations and market
conditions influence monetary policy transmission. For example, in a liberalized financial market
dominated with few but large banks and a bank dependent economy, commercial banks may react
to monetary policy tightening by absorbing modest increase in official policy rates. This makes
bank retail rates unresponsive to monetary policy action and leaves the level of money supply in
the economy virtually unchanged (Ngugi, 2001; Ogun and Akinlo, 2010).
Given the dominance of commercial banks in Kenya, transmission of monetary policy decisions
from policy-induced changes to commercial bank retail rates is a crucial link in the monetary

3
policy transmission process (Central Bank of Kenya, 2011). Based on the bank lending approach
and the dominance of commercial banks in financial sector, commercial bank’s behaviour is
important to policymakers.
1.2. Monetary Policy Transmission Framework in Kenya
From independence to 1990, the government pursued a controlling monetary policy strategy where
market interest rates were fixed by the monetary authority. Central Bank of Kenya mainly pursued
low interest rate policy with a view of boosting investment in the country. During this era,
monetary policy transmission was to a large extent determined by policy and regulations set by the
monetary authority (Kinyua, 2001; Ngugi, 2001). Controlling monetary policy strategy was
counterproductive and ineffective to the extent that statutory controls translated to high cost of
borrowing, inaccessibility of financial services by majority of Kenyans and interference with
market operations (Ngugi, 2001; Kamau, 2010). In this regard, monetary policy transmission was
ineffective as financial market was dominated by a few commercial banks and security market
growth stagnated.
From 1991, the Kenya government focused on implementation of structural reforms meant to drive
the economy towards equitable and sustainable growth. Comprehensive economic reform
introduced in 1990’s led to fundamental changes in the institutional and operational framework of
monetary policy in Kenya (Republic of Kenya, 1986; Kinyua, 2001). Interest rates were liberalized
in July 1991 and CBK became an autonomous institution mandated to formulate and implement
monetary policy (Ngugi, 2001).
Under the framework introduced in the economic reforms of 1990’s, CBK estimates demand for
money in line with inflation and output targets and sets the money supply path to conform to its
primary objectives (Ngugi, 2001; Central Bank of Kenya, 2011). Given economic conditions and

4
monetary policy targets, Central Bank through the monetary policy committee effect monetary
policy decisions by manipulating Central Bank Rate and the reserve requirements which are in turn
transmitted to short-term interest rates. In Kenya, the most applicable short term interest rates
targeted by Central bank are Treasury bill rate, repo rate and interbank rate (Misati, et al., 2011;
Central Bank of Kenya, 2011).
Decontrolling of interest rates led to changes in monetary policy transmission framework in
Kenya. The use of market-based or indirect monetary policy strategy aims at managing liquidity
through manipulation of Commercial bank’s credit creation ability. Central Bank influence
commercial bank credit through its influence on short term interest rates and reserve requirements.
This gives monetary authority ability to stimulate investment, prices, and output growth in line
with set objectives (Central Bank of Kenya, 2011).
Figure 1.1 shows annual inflation rate from 1980 to 2010 using February 2009 as the base rate.
Inflation was generally above 10 per cent ranging from 12 per cent to 22 per cent in the pre-
decontrolling period of 1980 and 1990. Inflation rate increased in early 1990’s due to political
factors more specifically the 1992 elections (Ngugi, 2001; Kinyua, 2001). After enactment of
economic reforms, tight monetary policy pursued from mid 1990’s to 2002 reduced inflationary
pressure and as at 1995 inflation reduced to 1.6 per cent. From 1995 to 2010 annual inflation has
generally been maintained below 10 per cent with exception of 2004 and 2008 where inflation
registered double digits.

5
Figure 1.1: Annual inflation rate from 1980 to 2010. Source of data: Statistical Abstracts (Various issues). Republic of Kenya.
In reference to figure 1.1, performance of monetary policy during controlled interest rates era was
less effective compared to post decontrolling era. This is due to the fact that inflation level was
relatively lower in the period between 1995 and 2010 as compared to between 1980 and 1995.
Despite the success of controlling inflation in post decontrolling era, monetary policy transmission
is still weak in addressing foreseen and unforeseen market conditions that fuel macroeconomic
instability. Episode of high inflationary pressure in 2004 were attributed to high energy prices,
loose monetary policy conditions and poor harvest (Republic of Kenya, 2009). In 2008, high
inflationary pressure was to a large extent caused by the impact of 2007/2008 post election
violence (Republic of Kenya, 2009). Central Bank of Kenya (2010a:2) reiterates that “The current
monetary policy framework has been faced with various challenges including the impact of
financial innovations which has weakened the link between reserve money and broad money
supply, M3.” As portrayed in Figure 1.1, high volatility of inflation rate is still a major problem
and corroborates the assertion that monetary policy transmission is weak.
0
5
10
15
20
25
30
35
40
45
50
1980 1985 1990 1995 2000 2005 2010
Annual Inf. rate

6
1.3. Role of Commercial Banks in Monetary Policy Transmission Process
Weak monetary policy transmission stems from a disconnection between monetary policy action
on one hand and commercial banks behaviour on the other. Statistics show that at the end of 2009,
commercial banks deposit constituted 97 per cent of broad money (M3) yet monetary policies
specifically tailored to target commercial banks retail rates do not have the desired effect in the
real sector economy (Central Bank of Kenya, 2010a,b; Buigut, 2010). Central Bank of Kenya
(2011), confirms that policy signals have been transmitted to short term interest rates at a fair
speed but adjustment of commercial banks retail rates to policy induced changes in short term
interest rates is not as potent. Figure 1.2 shows the trend of short term interest rates (which include
interbank rate and T-Bill rate) and commercial bank lending rates for one year period starting June
2010 to February 2012.
From figure 1.2, short term interest rates increased at a high rate from less than 3 per cent in March
2011 to more than 20 per cent in nine months owing to bold monetary tightening action taken by
CBK. Despite a 20 per cent increase in short term interest rates, commercial banks average lending
rate increased by approximately 5 percentage points by March 2012. This proves that short term
interest rates are fairly responsive to monetary policy action. However, commercial banks lending
rate remained relatively unchanged within the same period. (Central Bank of Kenya, 2010).

7
Figure 1.2: Market interest rates from June 2010 to February 2012 Source of data: Central Bank of Kenya. Under perfect market conditions, transmission of policy-induced changes of short term interest to
commercial bank lending rates is immediate, one for one and symmetrical. However, as captured
in figure 1.2, adjustment of commercial banks retail rates is incomplete and occurs with a lag thus
interfering with smooth transmission of monetary policy action in Kenya. Njuguna (2011)
articulates that in Kenya, structural factors such as large segmented financial market with narrowly
defined instruments, dominance of few players and lack of interbank interaction across segments,
reliance of social network as opposed to price among majority of small banks are among the major
challenges that weaken monetary policy transmission.
Central Bank of Kenya (2011: 15) articulates that “commercial banks have cited various structural
factors which have slowed down the transmission of monetary policy signals to the lending rates.”
In modern economies, structural factors and market dynamics may cause nonlinearities in
adjustment of bank retail rates. Bondt et al. (2005) and Hoffman and Mizen (2004) explains that
the impact of monetary policy changes to commercial banks profitability condition is often
complex and often cause asymmetrical adjustment during different monetary policy regimes.
0
5
10
15
20
25
30
35
Jun
-10
Jul-
10
Au
g-1
0
Sep
-10
Oct
-10
No
v-1
0
Dec
-10
Jan
-11
Feb
-11
Mar
-11
Ap
r-1
1
May
-11
Jun
-11
Jul-
11
Au
g-1
1
Sep
-11
Oct
-11
No
v-1
1
Dec
-11
Jan
-12
Feb
-12
Per
cen
tage
91 T bill rate Interbank rate Lending rates

8
Moreover, magnitude of monetary policy action, imperfect financial market conditions, prevailing
economic conditions are among factors that may cause continuously time varying adjustment of
commercial banks retail rates to monetary policy changes (Fuertes et al., 2006).
1.4. Statement of the Problem
Kenya Vision 2030 recognizes macroeconomic stability as one of the enablers that would facilitate
attainment of middle income status by the year 2030. Monetary policy plays and would continue to
play a fundamental role in achievement of macroeconomic stability. However, this can only be
guaranteed if the conduct, operations and strategies adopted by monetary authority steer the
economy towards targets enshrined in Vision 2030 (Republic of Kenya, 2007). Economic reforms
introduced early 1990 led to adoption of market based monetary policy strategy and generally
improved monetary policy transmission. However, weak monetary policy transmission mechanism
is still a pertinent problem in Kenya (Central Bank of Kenya, 2010; Buigut, 2010)
Conventional theories and practice assume that Central Banks have complete control over the level
of money supply in the economy. However, in modern times, empirical evidence shows that
commercial banks’ behaviour plays a key role in money supply process (Bernanke and Gertler,
1995; Palley 2001, Misati et al., 2011). Central Bank of Kenya (2011), reports that transmission of
monetary policy decisions to short term interest rates has generally been fast and effective.
However, adjustment of commercial bank retail rates to policy induced changes of short term
interest rates has been sluggish and incomplete and therefore interferes with smooth transmission
of monetary policy decisions.
In Kenya, commercial banks control a significant proportion of money stock, at the end of 2009,
commercial bank deposits accounted for 97 per cent of broad money (M3) (Central bank of Kenya,
2010a,b). Despite the dominance and key role played by commercial bank in monetary policy

9
transmission process, there is lack of clarity on commercial bank behaviour and adjustment to
monetary policy changes in Kenya. So far, few studies if any, have explored asymmetries and
dynamics of adjustment of bank retail rates to monetary policy changes in Kenya. Empirical
investigations exploring speed of adjustment dynamics and nonlinear aspects of monetary policy
transmission are critical to understanding the effectiveness and conduct of monetary policy. In
light of the problem stated, the study attempted to answer the following questions:
1.5. Research Questions
(i). How does speed of adjustment of bank retail rates to changes in monetary policy vary with
time?
(ii). How does the speed of adjustment change in the event monetary policy switches regimes?
(iii). How does the speed of adjustment simultaneously vary with time and with monetary policy
regime?
(iv). What is the speed of adjustment of bank retail rates to changes in monetary policy?
(v). What are the appropriate policy implications?
1.6. Objectives of the Study
The general objective of this study was to investigate the nature and dynamics of speed of
adjustment of bank retail rates to monetary policy in Kenya. The specific objectives are as follows:
(i). Evaluate how speed of adjustment of bank retail rates to changes in monetary policy varies
with time
(ii). Analyze how speed of adjustment changes in the event of a switch in monetary policy
regime
(iii). Examine how speed of adjustment simultaneously vary with time and monetary policy
regime

10
(iv). Investigate the speed of adjustment of bank lending rates to changes in monetary policy
(v). Suggest appropriate policy implications
1.7. Significance of the Study
The uniqueness of this study was the depth of investigation exploring non-linear aspects of speed
of adjustment. The significance of this study was twofold: Firstly, identification and estimation of
the true nature of speed of adjustment informs policymakers how long it takes for monetary policy
action to take effect in the real economy. This would be instrumental in formulation of monetary
policy strategies particularly choice of monetary policy instruments and timing of monetary policy
action. Secondly, introducing nonlinear aspects of speed of adjustment such as dynamics of speed
of adjustment and possible asymmetry in speed of adjustment would guide future empirical
investigation. The study would also add to knowledge on the area.
1.8. Scope and Organization of the Study.
The policy environment that defined the scope and essence of this study was restricted to post-
decontrolling interest rate era that commenced from June 1993. It was from this period onwards
that commercial banks’ pricing behavior is important in understanding monetary policy
transmission in Kenya. Monthly time series data from June 1993 to February 2012 was used in the
study. The study has five chapters: Chapter one introduced the study and discussed the challenges
of monetary policy transmission, the problem statement and objectives of the study. Chapter two
reviewed theoretical and empirical literature pertaining to commercial banks role in monetary
policy transmission in Kenya and around the world. Chapter three focused on methodology and
estimation techniques. Chapter four presented the empirical results and interpretation. Lastly,
chapter five presented conclusions and policy implications of the study
11
CHAPTER TWO
LITERATURE REVIEW
2.1. Introduction
This chapter was divided into three main sections. The first section dealt with theoretical literature.
The second section reviewed empirical literature, it focused on factors affecting efficacy of
monetary process transmission. In addition, literature reviewed encompassed empirical evidence
exploring presence on non linear asymmetries in adjustment of bank retail rates to monetary policy
changes. The last section provided the overview of literature
2.2. Theoretical Literature
Monetary policy transmission theories have become a key pillar in modern monetary policy
(Mishkin, 2010). This study limits its focus on competing theories that explain monetary policy
transmission process.
2.2.1. Neo-Classical Theory of Interest Rate Determination
Classical theorists such as Alfred Marshal and Professor Pigou argued that real interest rates are
determined by demand and supply of savings and investment. According to neoclassical theorists,
equilibrium interest rates are determined by the intersection of savings and investment function
(Mishkin, 2011). According to classical view, money supply is exogenous and only acts as a veil.
Neo-Classical perspective as developed by Marshal and Professor Pigou plays a foundational role
in long run interest rate determination. Recent studies have shown that increase and decrease of
commercial bank credit has a significant impact on savings and investment and affects private
sector investment, level of output and economic growth (Bondt et al., 2005).

12
However, neoclassical view plays a very limited role in explaining monetary policy transmission
as it does not explain how interest rates are transmitted to real economic variables. Moreover, this
theory is dismissed on the following grounds. Firstly, the theory combines real factors like savings
and investment with monetary factors like money supply making it unrealistic. Secondly, classical
view fails to explain short run interest rates dynamics. In this respect, classical theory plays a little
role in determination of monetary policy transmission of short term interest rate (Mishkin, 2010;
Palley, 2001).
2.2.2. Keynesian Liquidity Preference Theory.
John Maynard Keynes in his book “The General Theory of employment, Interest and Money,”
dismissed the classical assumption of exogeneity of money supply and held that savings and
investments are real factors and endogenously determined by the level of output. Keynes claimed
that there is a distinct difference between demand and supply of money on one hand and demand
and supply of savings on the other (Palley, 2001). According to Keynes, money balances can either
be held as cash balances or invested in interest bearing bonds. Keynes define rate of interest rates
as the reward of parting with liquidity for a specified period of time. Demand for cash money
balances is determined by transactionary motives or money held to bridge the gap between receipt
of payments and expenditure. Secondly, precautionary motives refers to money balances held for
uncertainty and unforeseen contingencies and lastly, for speculative motive which encompass
money held to take advantages for changes in interest rate in the bonds market (Mishkin, 2010).
Keynes held that money supply maybe endogenously driven by rate of interest but it can also be
fixed by monetary authority in the short run. Short term interest rate is arrived when demand for
money equals supply for money. Essentially, increase in expected prices increases inflation and
consequently reduces of real interest rates. Reduction in real interest rates increases the incentive

13
to increase investment spending thereby increasing aggregate demand which in turn increases
production, lowers unemployment and ultimately increases output (Mishkin, 2010).Liquidity
preference theory has played an important role in development of monetary policy transmission.
Keynes liquidity theory forms the basis of interest rate channel of monetary policy transmission
and introduced the structural grounds which explain transmission of monetary policy through
various channels present in an economy (Palley, 2001; Mishkin, 2010).
However, liquidity preference is criticized based on the following grounds. Firstly, like the
classical theory, liquidity preference is indeterminate since it assumes that the level of income is
known. Secondly, liquidity preference theory assumes that interest rates are a purely monetary
phenomena yet empirical evidence shows real factors like savings and investment affect interest
rate. Lastly, Keynes’ liquidity preference theory does not adequately explain the role of
commercial banks in monetary policy transmission under imperfect market conditions and is
therefore considered incomplete (Pollin, 1991; Mishkin, 2010).
2.2.3. Money Multiplier Approach
Neo-Keynesian theory improved on Keynesian view using an IS-LM framework but adopted the
classical assumption of exogeneity of monetary base (Palley, 2001). Contrary to classical
economists, the LM curve is positively sloped, neo-Keynesian view therefore acknowledge the
impact of real factors such as savings and investment in influencing interest rates. Neo-Keynesian
view holds that endogeneity stems from money multiplier and not the monetary base (Pollin,
1991).
Neo-Keynesians maintain that money supply is exogenous but the money multiplier is endogenous
conditional on banks and non-bank portfolio management. According money multiplier theory,
demand for assets vary with level of interest rate and income, in this regard, changes in interest
14
rate compels the households to revise their asset portfolio which in turn changes in money
multiplier. Higher interest rate compels economic agents to reduce currency in circulation thus
reducing currency to deposit ratio causing both money multiplier and money supply to increase
(Palley, 2001; Mishkin, 2010).
Neo-Keynesian money multiplier approach plays an important role especially in economies
pursuing monetary targeting strategy. However, its practicality has been questioned to the extent
that it assumes that money supply is strictly exogenous, secondly, the effectiveness of money
multiplier approach depends on Central Banks’ ability to control monetary base and accurately
predict the money multiplier (Pollin, 2001; Palley, 2001).
2.2.4. Post Keynesian Structuralist Theory
Endogeneity of money supply forms the cornerstone of post Keynesian analysis, post Keynesian
theorists hold that money supply is endogenous and give emphasis on bank lending activity
(Pollin, 1991). According to Palley (2001) bank credit leads to creation of deposits and ultimately
increases money supply, under post-Keynesian view money supply process starts with bank credit.
This argument is in direct conflict with neo-Keynesian money multiplier approach, which argues
that money supply process starts with changes in policy-controlled monetary base.
Post Keynesian structuralist approach stipulates that commercial banks respond to changes in the
market by ensuring that the position taken maximizes banks profits. In this regard, Commercial
banks react to monetary policy changes by revising their portfolio of assets and liabilities (Palley,
2001). To this end, the interaction between commercial banks and Central Bank depends on the
liquidity position of commercial banks and it may not be necessary for commercial banks to
approach Central Bank to provide liquidity every time monetary policy changes (Pollin, 1991).

15
Post Keynesian structuralist approach introduces a new aspect in monetary policy analysis.
Essentially, structuralists’ claim that money supply is endogenously driven by bank credit. Central
bank has control over money supply only to the extent that monetary policy changes affects
commercial banks cost structures thus compel commercial banks to adjust their asset and liability
positions. This leads to change in banks ability to extend loans to their customers and ultimately
changes money supply. This theory advocates for evaluation of microeconomic behaviour in the
banking sector (Palley, 2001).
Credit channel is an appraisal of post Keynesian structuralist approach and New Keynesian view
as proposed by Bernanke and Gertler (1995) among others. This view has been accepted as an
important approach that explains monetary policy transmission in presence of information
asymmetry and market imperfections. Credit channel focuses on bank behaviour, it is composed of
two channels namely bank lending channel and balance sheet channel.
Bank lending channel is based on the view that bank credit is a major source of funds when there
are no close substitutes to bank loan. According to bank lending view, expansionary policy
pursued by Central Bank leads to increase in bank reserves and subsequently banks ability to
create credit. Increase in issuance of loan increases investment in the real economy and ultimately
enhances output growth. Bank lending channel transmit monetary policy by adjusting credit supply
to the economy (Pollin, 1991; Loayza and Heddel-Schmidt, 2002).
Balance sheet channel reflects the presence of asymmetric information problems in credit markets
(Loayza and Heddel-Schmidt, 2002). Contractionary monetary policy directly affects firm’s
balance sheet by decreasing the net worth of firms. Lower net worth compels banks to revise their
portfolio towards less risky assets thus decreasing loanable funds and ultimately decreases
investment spending in the economy. Consequently, lower net worth increases reserves and the

16
ability to create credit. This encourages banks to relax their term lending structure thus increasing
supply of loans and ultimate boosts consumption and investment spending (Mishkin, 2010).
2.2.5. Key features of Post Keynesian Structuralist Approach.
First, neo-Keynesian money multiplier approach is limited by its assumption of money supply
exogeneity and accurate predictability of money multiplier. Post Keynesian view circumvents this
limitation of predicting money multiplier by adopting profit maximizing behaviour approach.
Secondly, Palley (2001) holds that micro-founded post Keynesian model capture information on
asset and liability management of commercial banks through the behaviour of profit maximizing
bank. Given that monetary policy rates translates to cost of provision of liquidity in commercial
banks, profit maximizing banks would always ensure that the marginal cost of different sources of
funds is equated to the marginal revenue. To this end, nature and structure of the industry,
monetary policy changes, nature of competition and all other factors affecting profitability, risk
and uncertainty and liquidity of commercial banks are reflected in a profit maximizing model.
Third, post Keynesian structuralist approach focuses on bank pricing behaviour and therefore
explains possible asymmetry and time variation in absorption of commercial bank to changes in
money supply by Central Bank. For example, Moore (1998 as quoted in Palley, 2001) observed
that under tight monetary policy regime commercial banks focus on liquidity management and
compels banks to encourage households to revise their savings from bonds to more liquid assets.
Stiglitz and Weiss (1981) as quoted in Fuertes et al. (2006) note that banks are less likely to
increase loan rates because not only does demand decrease but the risk of default for existing loans
increases. On the other hand, in a competitive environment, banks are more likely to respond to
policy rates cuts by decreasing loan rate in order to attract customers. To this end, commercial
banks reaction under expansionary and contractionary monetary policy regimes differs depending

17
on how monetary policy decisions affect liquidity position and profitability conditions in the
banking market.
2.3. Empirical Literature
Ngugi (2001) investigated determinants of interest rates spread in Kenya using a profit maximizing
model to capture features of the market structure, two of the independent variables under
consideration were official policy rate namely T-Bill rate and interbank rate. The paper established
a co integrating relationship between official policy rates and interest rates spread, the result also
signaled existence of asymmetry in adjustment, the study notes that the interest rate spread
“increased because as the T-Bill rate declined, the lending rate did not, indicating the asymmetric
response of the lending rate to the treasury bill rate.” (Ngugi, 2001: 31).
Hofmann and Mizen (2001) focused pass through or response of retail rates of banks and building
societies in UK. The study used both linear and nonlinear error correction models, using the linear
ECM model, the study found out that in UK financial institutions pass through of short term
interest rates to retail rates was incomplete and sluggish. The study established that adjustment of
commercial banks retail rates was nonlinear, adjustment of commercial banks retail rates was
faster during monetary policy tightening regime but there was no sufficient evidence to show that
adjustment of building societies’ mortgage rates was nonlinear.
Fuertes et al. (2006) built upon Hofmann and Mizen (2001) study in the UK, the study used
disaggregated data to estimate responsiveness of UK’s financial system to monetary policy
changes. Fuertes et al. (2006) explored different aspects of nonlinearity in adjustment of banks and
mortgage retail rates to monetary policy rates. Firstly, investigate whether retail rates adjust faster
to monetary policy rate cuts than official policy rates rise (sign or direction asymmetry). Second, to
find out whether monetary policy is continuously time varying dependent on the magnitude of

18
monetary policy change (magnitude asymmetry) and, lastly, to find out whether sign and
magnitude asymmetry occur simultaneously.
This elaborate study showed that for majority of banks deposit rates and almost half of different
bank credit product rates adjusted continuously (time varying) depending on the magnitude of
monetary policy change. Both bank and mortgage retail rates adjusted faster when official policy
rates increased (under contractionary policy regime). Generally, nonlinear models were more
suitable in explaining response of commercial banks and mortgage firms in the U.K. Moreover, the
study also showed that there are significant differences in adjustment of bank retail rates to
monetary policy changes across institution and products (Fuertes et al., 2006).
Ogun and Akinlo (2010) focused on the effectiveness of bank credit channel in monetary policy
transmission in Nigeria and the impact of financial deregulation on monetary policy transmission.
The study used structured vector autoregressive model and the results showed that bank credit
channel was weak and financial deregulation weakened monetary policy transmission. Ogun and
Akinlo (2010) in an attempt to explain the result noted that the weakness of bank lending channel
was attributed to excess liquidity in Nigeria’s economy. Commercial banks responded to
monetary policy changes by revising their assets and liabilities rather than passing through policy
induced short term interest rate changes to retail rates.
Buigut (2010) in an investigation to find out the dominant transmission channel used an impulse
response function to evaluate the impact of monetary policy shock to loan quantity. The study
established that bank lending channel was more dominant that interest rate channel. Buigut (2010)
explains that financial and money markets in Kenya are still at the infancy stage making interest
rates channel and asset price channels ineffective in the monetary transmission process. This
argument is supported Ouma et al. (2010), in an investigation to find out the impact of financial

19
innovation on monetary policy transmission established that financial innovation weakens interest
rate channel, the study concluded that financial innovation weakens interest rate channel but
enhances other channels of monetary policy transmission. Ouma et al. (2010) mentioned that
similar studies conducted in China, India and South Africa are inconclusive since new financial
instruments introduce new challenges that influence monetary policy transmission dynamics.
Interest rates spread is an important determinant that provide insight on bank pricing behaviour.
Wanjau and Ng’etich (2011) used descriptive research to study interest rate spread in Kenya. The
magnitude and dynamics of interest rates spread is an important signal to the extent that it captures
important market information and banking characteristics and by extension explain inefficiency in
monetary policy transmission in Kenya. Wanjau and Ng’etich (2011) explain that in Kenya,
interest rate spread is mainly determined by lending rates, because lending rates are more volatile
relative to deposit rates due to high intermediary costs in lending market. A study conducted by
Ngugi and Njuguna (2000 as quoted by Misati et al., 2011: 171) explained that “credit risk, low
competition from alternative sources of financing, weak legal system in contract enforcement,
fiscal policy, availability of deposits and profitability as the main determinants of spread”
Misati et al. (2011) used an error correction model derived from Monti-Klein profit maximization
approach to measure the size and strength of adjustment of bank retail rates to monetary changes.
The study found out that speed of adjustment was weak as lending rates were sticky both in the
short run and long run. The study stipulates that incomplete pass through of interest rates in the
credit channel is affected by structural challenges in the banking sector. Bank lending rates are
relatively unresponsive to short term interest rates due to volatility of short term interest rates, lack
of effective competition in the Kenyan banking sector, high risk of default as portrayed by high

20
percentage of nonperforming loans, high agency and intermediation costs, and lack of information
in the market among other factors.
Treeck et al. (2011), investigated nonlinear adjustment of bank retail rates to monetary policy in
the US and Germany after moderation of monetary policy in the two countries. The paper focused
on both sign and magnitude asymmetry but tested for both long run and short run asymmetries.
The paper established that monetary policy tightening has a faster and longer effect than
expansionary monetary policy rises in Germany and US. Long run pass through has fallen in the
US after great moderation of their monetary policy. Generally, the study established that
adjustment of retail rates in the short run and the long run is nonlinear. Treeck et al. (2011)
concluded that linear models may at best be partially adequate and may also be misleading.
According to Fuertes et al. (2006), Bondt et al. (2005) and Treeck et al. (2011), adjustment of
commercial banks retail rates to monetary policy changes is complex, multi faceted and
interdependent. The assumption of linear causal relationship between monetary policy rates and
commercial banks interest rates might be misleading. In this respect a linear, symmetric speed of
adjustment measure might be prudent as an overview estimate but is of limited use to
policymakers. Presence of nonlinearities in adjustment of bank retail rates to monetary policy
changes may create challenging issues in conduct and efficacy of monetary policy.
2.4. Overview of Literature
Empirical literature shows that the effectiveness of monetary policy transmission is determined by
Central Banks’ action and commercial banks pricing behaviour. Structural and market conditions
have an important bearing on commercial banks pricing behaviour and as such affect potency of
monetary policy transmission. Empirical literature identified short term interest rate as important
proxies to monetary policy actions as Central banks can readily influence their direction and

21
magnitude. Moreover, commercial banks react to changes in short term interest rate by adjusting
bank retail rates
However, empirical literature substantiate post Keynesian view and show that adjustment of bank
retail rates to monetary policy is complex, nonlinear and multifaceted. Furthermore, empirical
studies have shown that different forms of nonlinear adjustment exist and are unique to financial
conditions prevailing in an economy. Therefore, there is need to extend investigations to
accommodate asymmetry and other forms of nonlinear adjustment of commercial banks’ retail
rates to monetary policy decision. This might explain the nature and dynamics of commercial
banks’ retail rates response function under prevailing market conditions and possibly fill the gap
between commercial banks behaviour and conduct of monetary policy in Kenya.
22
CHAPTER THREE
METHODOLOGY
3.1. Introduction
This chapter presented the methodology used in the study. The chapter was organized as follows:
The succeeding section described the research design. The third section presented theoretical
framework adopted in the study. The fourth section presented empirical model specification. The
last two sections highlighted data type and sources and procedure used for data analysis
respectively.
3.2. Research design
This study sought to investigate nature and dynamics of adjustment of commercial banks retail
rates to monetary policy action. Time series research design under non-experimental research
design was adopted in the study. Changes in commercial banks’ lending rates and deposit rates
were used to capture dynamics of adjustment of commercial banks retail rates and changes in short
term interest rates namely; treasury bills rate, interbank rate and repo rate were used as proxies for
monetary policy action. Regression analysis was used to capture causal relationship between
variables and measure speed of adjustment.
3.3. Theoretical Framework.
The methodology adopted was anchored on post-Keynesian structuralists’ view. Post Keynesian
structuralist theory stresses on Commercial banks active role in money supply process in the
economy. According to Palley (2001), post Keynesian structuralist approach constructs
endogeneity of money supply in terms of bank lending channel. This theory stipulates that money
supply is endogenously determined by demand for commercial banks’ credit. Therefore, this

23
theory puts emphasis on evaluation microeconomic behaviour of profit seeking commercial banks
and their reaction to changes in credit market conditions.
It was in the spirit of post Keynesian schema that Palley, (2001), Fuertes et al. (2006) and Misati et
al. (2011) propose the use of a Monti-Klein profit maximization model. Under the Monti-Klein
framework, Commercial banks’ objective is to maximize profits conditional on bank’s balance
sheet (Misati et al., 2011). Banks Balance sheet is given by the following equation.
�������(�) + ����(�) = �������(�) + ����������(�)……….……...…….….……….....(3.1)
From Equation 3.1, it follows that total deposit is given by:
� = � + � − � ……………..……………………………………………...…………….…….. (3.2)
Assuming commercial banks provide loans at a rate of iL and pay a deposit rate of iD. Then net
interest income is given as interest earned on loan less interest expense paid to deposit holders:
����������������� = ��� − ��(� + � − �)………………………...…………...……………(3.3)
In a standard Monti-Klein model, demand for bank loans has a downward sloping function for
bank loan and demand for deposits is an upward sloping function. Clearing is conducted through
Central bank, commercial banks whose balance falls below the required reserves pay a liquidity
penalty iP equivalent to the official policy rate multiplied the difference between settlement
balance and required reserves (Misati et al., 2011). Therefore, total penalty is given as:
���(� − �) ………………………………..….……………………...………………............... (3.4)
Commercial banks also incur costs of managing loans.������������ = �� …..…...…..…. (3.5)
The profit maximization function �(�, �)is derived from combining equation 3.3, 3.4 and 3.5:
�(�, �) = ��� − ��(� + � − �) − ���(� − �) − ��………………….……………..….……...(3.6)
24
Profit maximizing commercial banks equate their marginal revenue to marginal cost. Therefore,
first order conditions with respect to L and R yields:
��(�,�)
��= �� − �� − � = 0 Therefore: �� − �� = �….…………………….….…………....... (3.7)
��(�,�)
��= −�� + ��� = 0 Therefore:�� = ���….……...………….……………...………. (3.8)
Substituting equation 3.8 into equation 3.7, it follows that�� − ��� = � which implies that:
�� = � + ���................................................................................................................................. (3.9)
Equation 3.9 formed the basis of the empirical investigation, it gives a linear relationship between
monetary policy rate and bank retail rates. Let �� = ��� representbank retail rates at time t and
�� = ����represent monetary policy rate at time t. Then equation 3.9 can be presented as:
��� = �� + ������ ………………….………………………………………..………......... (3. 10)
3.4. Empirical Model and Estimation Procedure
Given the scope and objectives of this research, four empirical error correction models were
derived. The first model was the conventional linear error correction model which assumes that the
speed of adjustment coefficient is constant (time invariant and symmetrical). The second model
was the error correction model with continuously time varying speed of adjustment conditional on
monetary policy change. The third model was the derivation of ECM model with asymmetrical
speed of adjustment coefficient. The last ECM model combined both time variation and
asymmetry simultaneously (Greene, 2003; Fuertes et al., 2006).
Equation 3.10 presents the long run relationship between bank lending rates and official policy
rates. Monetary policy theories generally confirm that there exists a stable relationship between
bank lending rates and short term interest rates (Mishkin, 2010). Moreover, Ngugi, (2001) and
Misati, et al. (2011) used error correction models when modeling commercial banks retail rates
and short term interest rates.
25
The study adopted an ECM remodeled from Autoregressive Distribution Lag Model (ARDL).
Greene (2003) recommends adoption of ARDL (P,Q) and use of Akaike Information Criteria
(AIC) to choose the appropriate number of lags that absorb serial correlation and thereafter
correctly specify the consequent error correction model. Therefore, ARDL (P,Q) in period t-i is
given as:
����� = �� + ∑ ������������ + ∑ �������
���� + ���� …....................................................... (3.11)
Where ���� ∽ ���(0, ��) Error term
3.4.1. Linear Error Correction Model
Interest rate pass through model is given by the error correction model. From equation 3.11, the
long run relationship is estimates as follows:
������ = �� + ��������� ………………………………………….………….…..…………. (3.12)
Where �� =��
�����⋯��� and �� =
���⋯���
�����⋯���
The error correction term can be estimated by subtracting equation 3.13 from 3.11 as follows:
���� = ����� − ������ = ����� − ���� + ���������� …………………………………....... (3.13)
The error correction model was derived from the first difference of dependent variable regressed
on the error correction term (����) and the first difference of past values of the dependent variable
and independent variables as shown below:
Δ��� = ����� + ∑ ��Δ������������ + ∑ ��Δ�����
������ + �� …………………………..….… (3.14)
Where�� ∽ ���(0, ��) stochastic term
∆��� Represent change in monthly average bank retail rates
���� Disequilibrium gap of the previous month
� Coefficient of speed of adjustment (long terms pass through)
26
∆������Monthly change in official policy rate in period t-i
∆�����Monthly change in commercial banks’ retail rate in period t-i
�� Coefficient of change in official policy rate in period t-i
�� Coefficient of change in bank retail rates rate in period t-i
The error correction model (equation 3.14) captures long run properties of the model, long run
interest rate pass through is measured by the coefficient γ (Greene, 2003).If γ =1 there is complete
pass through and perfect conditions exists. The main assumption of the linear error correction
model means that all coefficients are linear in parameter. Therefore, speed of adjustment
coefficient γ is constant, time variant and symmetrical in monetary policy regime switching
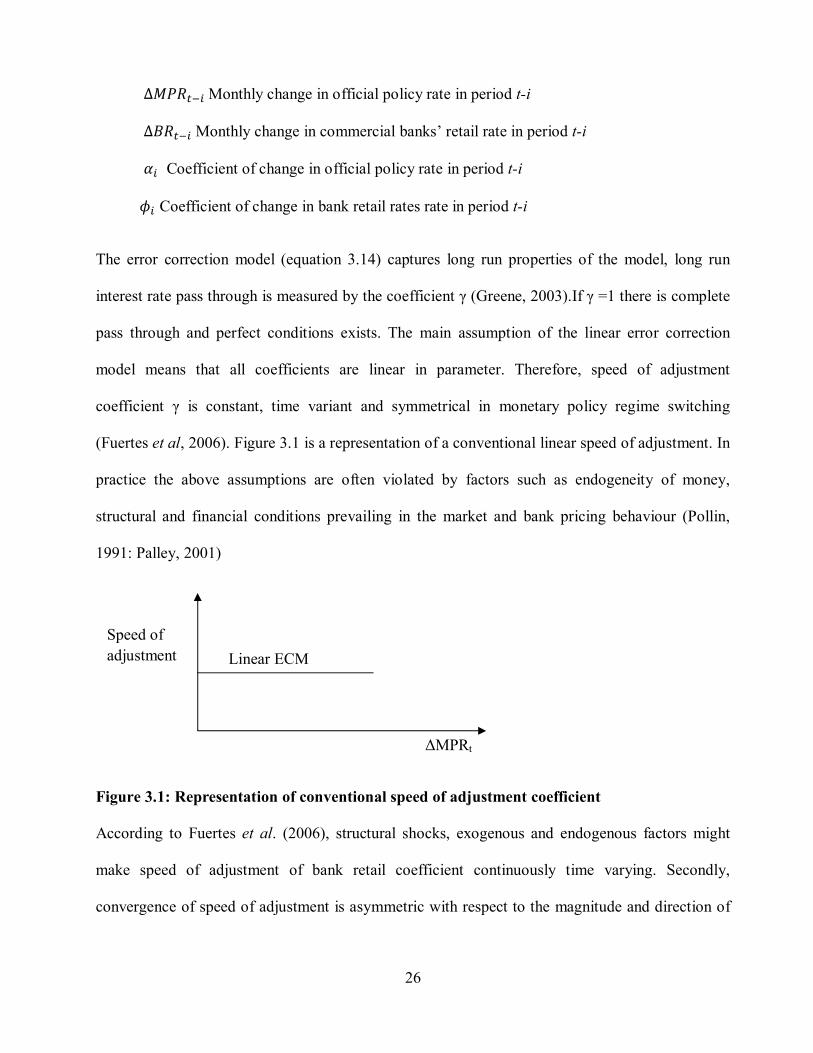
(Fuertes et al, 2006). Figure 3.1 is a representation of a conventional linear speed of adjustment. In
practice the above assumptions are often violated by factors such as endogeneity of money,
structural and financial conditions prevailing in the market and bank pricing behaviour (Pollin,
1991: Palley, 2001)
Figure 3.1: Representation of conventional speed of adjustment coefficient
According to Fuertes et al. (2006), structural shocks, exogenous and endogenous factors might
make speed of adjustment of bank retail coefficient continuously time varying. Secondly,
convergence of speed of adjustment is asymmetric with respect to the magnitude and direction of
ΔMPRt
Linear ECM
Speed of
adjustment

27
monetary policy. Therefore, it is important to relax linearity assumptions to evaluate the true
nature of speed of adjustment (Fuertes et al., 2006).
3.4.2. Time varying Error Correction Model
Assuming a continuously time varying speed of adjustment coefficient �� is given as:
�� = � + ��� …………………………………………………………………………...…… (3.15)
Where �, � :-are constant terms, and Xt :-is a conditioning factor that can either be endogenous or
exogenous to the model. If � = 0, then collapses to �� = � meaning that speed of adjustment is
constant under all circumstances and the conventional linear ECM applies. If not, then speed of
adjustment is time varying conditional on Xt (Fuertes et al., 2006). From theoretical review, it is
plausible that speed of adjustment is endogenously driven by magnitude of monetary policy rate
changes (Fuertes et al., 2006). That is, it is plausible that large changes in official policy rates
induce faster changes in speed of adjustment towards long run interest rates (Magnitude
asymmetry)
Therefore, assuming time varying speed of adjustment is conditional on change in monetary policy
rate, and then �� = ∆������ .Figure 3.2 shows a graphical representation of time varying speed
of adjustment conditional on changes in policy rates (Fuertes et al., 2006).
Figure 3.2: Time varying speed of adjustment coefficient
∆���t
�� = � + �∆����
Time varying adjustment
coefficient
Speed of
adjustment

28
The ECM with time varying speed of adjustment conditional on monetary policy change is:
Δ��� = ����� + �∆���������� + ∑ ��Δ������������ + ∑ ��Δ�����
������ + μ� ……………..(3.16)
3.4.3. Regime Switching Error Correction Model
This study modified the linear ECM in order to test whether direction (signage) of monetary policy
affect speed of adjustment. For example, do banks take longer to adjust retail rates upwards than
downwards? (Palley, 2001).Figure 3.3 shows a typical representation of regime switching
adjustment coefficient. Switching of regime by monetary policy authority translates to change
from a state (a) to a different state (b). Let �� = ��and �� = ��. It follows that ∆��� is the
switching variable such that policy rates rise or cuts instigates change from an arbitrary state (a) to
state (b). If � = 0 is the threshold parameter, the regime switching formulation is given as:
�� = �
����∆������ > 0
����∆������ ≤ 0 ……………………………………...………………………...….. (3.17)
Figure 3.3: Regime switching speed of adjustment coefficient
Let SΔMP be a slope dummy such that ����� = 1��Δ������ > 0
0,��ℎ������………...……….………. (3.18)
ΔMPR
Regime switching adjustment
coefficient
Speed of
adjustment

29
From 3.16, if SΔMP =1 represent contractionary monetary policy regime then it follows that (1-
SΔMP) =1 is a dummy variable representing expansionary policy regime. From equation 3.18, SΔMP
and (1- SΔMP) are sign indicators (Fuertes et al., 2006). The switching variable ΔMPRt-1 is set at
threshold parameter 0. Therefore, ECM with regime switching speed of adjustment is given as:
Δ��� = ���������� + ������(1 − ����) + ∑ ��Δ������������ + ∑ ��Δ�����
������ + �.....(3.19)
From model 3.19 �� < ��means that bank retail rates are more responsive to official policy rates
rises than policy cuts ceteris paribus. The converse is also true.
3.4.4. Time Varying and Regime Switching Model
Combining derivations in equations 3.16 and 3.19 enables testing for presence of both time
variation and asymmetry in speed of adjustment simultaneously as presented below:
��,� = �
� + ��∆������
� + ��∆������
………………………..……………………….…..……..……….… (3.20)
From the formulation in 3.20, the time varying and regime switching ECM is given as:
Δ��� = ����� + ��∆�������������� + ������∆������(1 − ����) + ∑ ��Δ������������ +
∑ ��Δ����������� + μ� …………………………………………………………………..………(3.21)
The model presented in equation 3.21 incorporates both regime switching and time varying speed
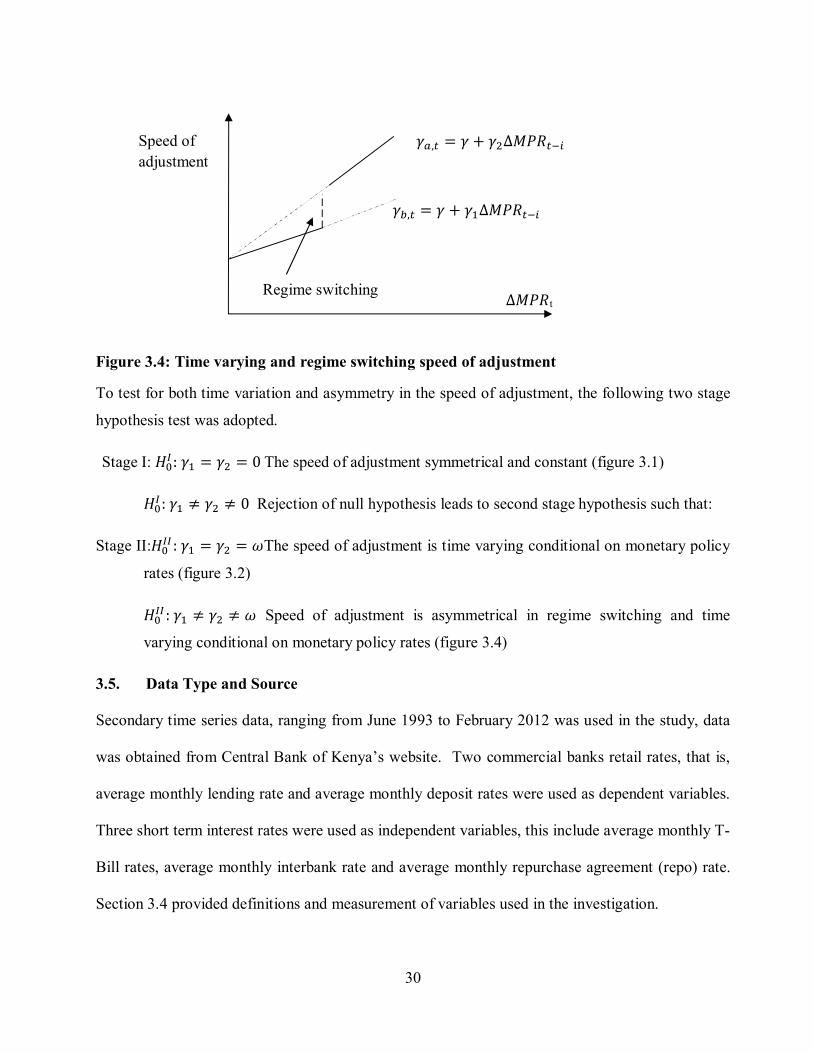
of adjustment conditional on policy rate changes ∆������ as shown in figure 3.4:
30
Figure 3.4: Time varying and regime switching speed of adjustment
To test for both time variation and asymmetry in the speed of adjustment, the following two stage
hypothesis test was adopted.
Stage I: ��� :�� = �� = 0The speed of adjustment symmetrical and constant (figure 3.1)
��� :�� ≠ �� ≠ 0 Rejection of null hypothesis leads to second stage hypothesis such that:
Stage II:���� :�� = �� = �The speed of adjustment is time varying conditional on monetary policy
rates (figure 3.2)
���� :�� ≠ �� ≠ � Speed of adjustment is asymmetrical in regime switching and time
varying conditional on monetary policy rates (figure 3.4)
3.5. Data Type and Source
Secondary time series data, ranging from June 1993 to February 2012 was used in the study, data
was obtained from Central Bank of Kenya’s website. Two commercial banks retail rates, that is,
average monthly lending rate and average monthly deposit rates were used as dependent variables.
Three short term interest rates were used as independent variables, this include average monthly T-
Bill rates, average monthly interbank rate and average monthly repurchase agreement (repo) rate.
Section 3.4 provided definitions and measurement of variables used in the investigation.
Regime switching
��,� = � + ��∆������
��,� = � + ��∆������ Speed of
adjustment
∆���t

31
3.6. Definition and Measurement of Variables
Table 3.1: Definition and measurement of variables Type Variable Measure Description Dependent variables
Lending rate Percentage Average monthly lending rates of commercial bank in Kenya.
Deposit rate Percentage Average monthly deposit rates of commercial bank in Kenya.
Independent variables
T bill rate Percentage Represent the average monthly rate of Treasury bill rate.
REPO Percentage Represent the average monthly rate of government securities by CBK auctioned in the market
Interbank rate Percentage This is the rate of Interbank transaction fixed by Monetary policy committee.
SΔMP Intercept dummy
Dummy variable representing period when CBK pursued contractionary monetary policy regime. The dummy variable would assume the values: 1 represent contractionary monetary policy regime And 0 represent expansionary MP regime (defined in equation 3.16).
(1- SΔMP) Intercept dummy
Dummy representing period when CBK pursued expansionary monetary policy regime. The dummy variable would assume the values: 1 represent expansionary monetary policy regime And 0 represent contractionary MP regime. (Defined in equation 3.16).
���� Residuals Disequilibrium error term. Defined in eqn. 3.13
����× ∆������
Interactive term
Interactive term between error correction term and first difference of ΔMPR. Measures whether speed of adjustment coefficient is endogenously driven by monetary policy changes (time varying speed of adjustment)
SΔMP × ����× ∆������
Interactive term
Interactive term between error correction term and first difference of ΔMPR when the monetary authority effect policy rate increases. It is used to capture the rate time varying adjustment speed under monetary policy contraction regime
(1 − SΔMP)× ����× ∆������
Interactive term
Interactive term between error correction term and first difference of ΔMPR when the monetary authority effect policy rate decreases. It is used to capture the size time varying adjustment speed under monetary policy expansion regime

32
3.7. Data Analysis
Firstly, before estimation of the main models, six error correction terms calculated from ARDL
models were used as independent variables in respective error correction models. Lastly, five
independent variables including two dummy variables and three interactive variables were
formulated to measure nonlinearity and asymmetry in speed of adjustment (see section 3.4).
Inferences were based on OLS or Newey-West methods of estimation, as appropriate. ARDL
models were run and error correction terms estimated from the long run equations as specified in
models (3.11) through (3.13). Alternative ECM regression models were estimated, dependent
variables namely average lending rates and average deposit rates were regressed against respective
error correction terms, respective dummies and interactive terms, lagged values dependent
variables and each of the three independent variable (that is, REPO rate, T-Bill’s rate and interbank
rate). To this end, a total of twenty four ECM models were estimated: These include four types of
ECMs that is (3.14), (3.16), (3.19) and (3.21) each having six equations from the set of dependent
and independent variables.
The first objective evaluated whether speed of adjustment simultaneously varies with time. Six
time varying error correction model specified in model 3.16 were estimated and student’s t-test
was used to establish statistical significance of time varying coefficients. Significance of individual
coefficients was tested using two-tailed tests since they can assume negative or positive values.
The second objective analyzed adjustment asymmetry in the event monetary policy switches
regimes. The error correction model specified in model 3.19 was used to address this objective. Six
regime switching models were estimated. Null hypothesis tested formulated supposed that speed of
adjustment under contractionary monetary policy regime was equal to speed of adjustment during
expansionary monetary regime (��:�� = ��). Non rejection of the null hypothesis means that
33
linear ECM holds while rejection of the null means that speed of adjustment is asymmetrical when
monetary policy regime switches or simply put speed of adjustment is regime switching. Wald test
was used to analyze the null hypothesis specified above.
The third objective, sought to find out whether speed of adjustment was simultaneously time-
varying and asymmetrical in regime switching. Model specified by equation 3.21 was used in the
investigation. Six time varying and regime switching models were estimated. A two stage
hypotheses test formulated in section 3.2.4 was tested using Wald test.
Lastly, the fourth objective investigated the speed of adjustment of bank retail rates to monetary
policy changes. The most parsimonious model among the four types of error correction models
that is (3.14), (3.16), (3.19) and (3.21) were used in each alternative combination of dependent and
independent regression models. Selection of the parsimonious model was based on adjusted R2
and F Statistic. Student’s t-test was used to test the significance of the long term speed of
adjustment coefficient.
The following procedure was used in the econometric analysis. First, each variable was subjected
to unit root test using Augmented Dickey Fuller (ADF) to determine the order the order of
integration. If the variables were found to be integrated of order one then co integration test was
performed using two step Engle-Granger procedure. If the variables were stationary, then a single
equation ECM approach was used in the investigation. AIC and Swartz criteria were used to
choose the appropriate number of lags.
Thirdly, a series of diagnostic tests were conducted, Durbin Watson and Breusch-Godfrey LM test
was used to test for presence of autocorrelation. For Durbin-Watson statistic, an estimate of 2.00
means that residuals are not autocorrelated. For the Breusch-Godfrey LM test, the null hypothesis

34
of no serial correlation (autocorrelation) was assumed and tested at 5 per cent level of significance.
ARCH LM test was used to test for heteroskedasticity in the stochastic term. The null hypothesis
held that the residuals are homoskedastic at 5 per cent level of significance.
According to Greene (2002), presence of heteroskedasticity and serial correlation only affect the
standard errors and not the coefficients. Therefore, in all regression equations where
heteroskedasticity and/or serial correlation was established, Newey-West estimator was used to
correct possible bias of the standard errors. Adjusted R2 and F statistics were utilized to evaluate
parsimony, stability and reliability of each model (Wooldridge, 2003).

35
CHAPTER FOUR
EMPIRICAL FINDINGS
4.1. Introduction
This chapter presents empirical results including descriptive statistics, error correction regression
models, relevant econometric tests and key findings from the investigations.
4.2. Descriptive Statistics
This section presented descriptive statistics for commercial banks’ retail rates, short term interest
rates and estimated error correction terms. Firstly, average monthly time series data from June
1993 to February 2012 was used and the total number of observations for each the time series 225.
However, time series on repo rate used in the investigation ranged from September 1996 to
February 2012 as repo rate was introduced in September 1996 by Central bank of Kenya. Repo
rate time series also suffered from attrition and had only 148 data points. Missing values were
excluded in the investigation.
Figure 4.1a through 4.2b shows the time series trend of key variables used in the study. Table A.3
in the appendix presents results for error correction term and the underlying ARDL models used in
formulation of error correction terms. Figure 4.1a and 4.1b shows the time series trend of bank
retail rates and short term interest rates respectively. From figure 4.1a, with exception of repo rate,
short term interest rates reduced from 80 per cent in early 1990’s to less than 20 per cent 1995 to
2012. However, there were slight increases of above 20 per cent witnessed from 1995 to 1998 and
from mid 2011 to February 2012.

36
Figure 4.1a: Time series trend for short term interest rates
Source: Central Bank of Kenya
From 4.1a and 4.1b, both short term interest rates and commercial banks’ retail rates generally assume
a downward trend. Figure 4.1b shows that both lending and deposit rate have gradually reduced over
the period of this investigation. Deposit rate (and lending rates) reduced from more than 20 per cent
(and 30 per cent) in 1993 to less than 10 per cent (and 20 per cent) from year 2000 to 2010.
Figure 4.1b: Time series trend for commercial banks’ retail rates. Source: Central Bank of Kenya
020
4060
80
1995m1 2000m1 2005m1 2010m1Time
Repo Interbank
91-Day Tbill
010
2030
1995m1 2000m1 2005m1 2010m1Time
Lending Deposit

37
Given CBK’s main goal is to reduce inflation and maintain low market interest rates, high
correlation and downward trend of short term interest rates signals high responsiveness to
monetary policy decisions (Central Bank of Kenya, 2011). Therefore, these results support the
usage of short term rates as proxies of monetary policy action. The results also show that there
exists a consistent wide gap between lending rates and deposit rates proving the existence of wide
interest rate spread.
Co-movement between commercial banks’ retail rates and short term interest rates can readily be
observed from the figures 4.1a and 4.1b. These points towards existence of long term relationship
between short term interest rates and changes in commercial banks’ retail rates. Secondly, from
figure 4.1b the general decreasing trend of interest rates shows improvement of competition in
commercial banking sector. However, a wide interest rate spread is an indication of inefficiency in
the banking sector (Ngugi, 2001).
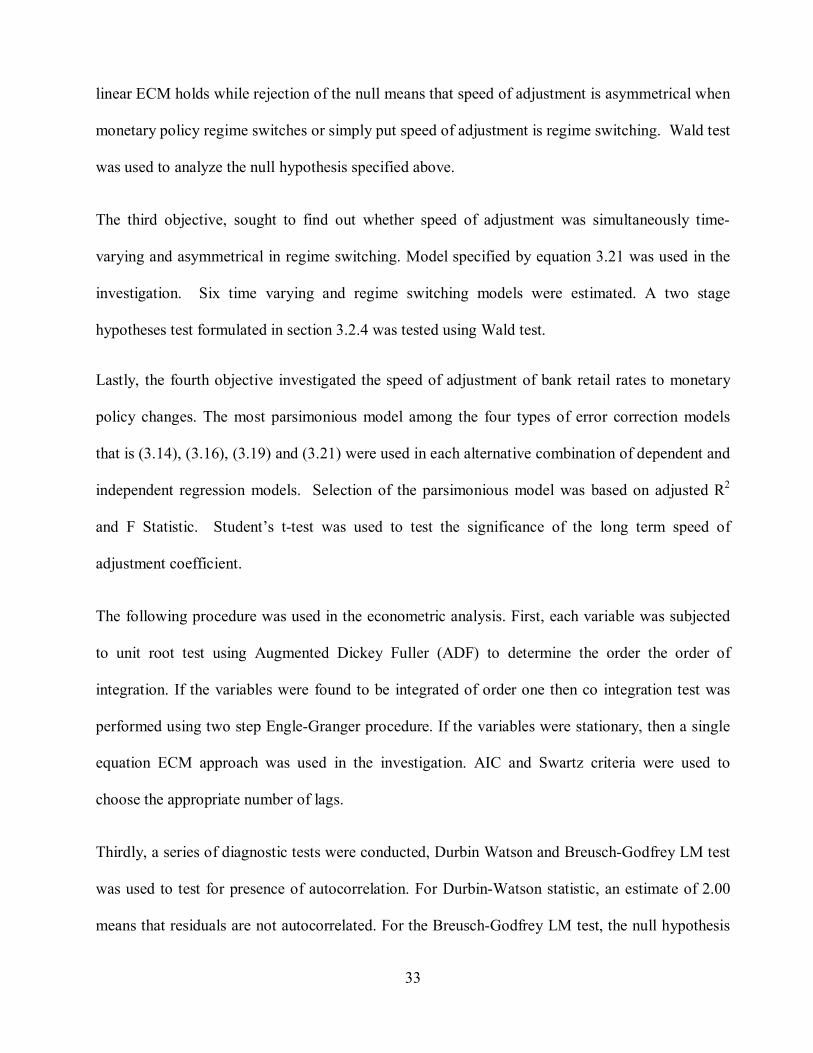
Figure 4.2a show the trend of three error correction terms extracted from alternative ARDL
regressions equations with deposit rate as the dependent variables. From figure 4.2a, the error
correction terms- given the three short term interest rates used in the study - have almost identical
distribution. Error correction before 1995 was approximately -30, however, the error correction
adjusted towards zero mean. It can also be observed that volatility was relatively higher in the
period 1995 to 2000 compared to the period 2000 to 2010. Lastly, there appears to be a significant
deviation from the mean towards the end of 2011 and early 2012.
38
Figure 4.2a: Trend showing error correction term (dependent variable:-Deposit rate) Source: Central Bank of Kenya
Figure 4.2b show the trend of three error correction terms extracted from alternative ARDL
regressions equations with lending rate as the dependent variables. From figure 4.2b, the
distribution and time series trend is almost identical to the trend presented in figure 4.2a. From
figure 4.2a and 4.2b, the trend for all the error correction terms has been consistent around zero
with exception of the period beginning 1993 to 1995 that is, the left hand tail. The left tail
substantially deviated from the long run equilibrium path and was not corrected until 1995. One
plausible explanation is the economic shocks of 1992 post-election that led to unprecedented
increase in short term interest rates and thereby causing shocks and disequilibria in financial sector
(Ngugi, 2001; Wanjau and Ng’etich, 2011). Deviation from the zero mean or long run path can
also be observed on the right hand tail from the period 2011 to 2012. This is attributed to bold
action taken by Central Bank from March 2011 in a bid to correct excess liquidity witnessed in the
second half of 2011 to January 2012 in the Kenyan economy.
-30
-20
-10
010
1995m1 2000m1 2005m1 2010m1Time
Error correction term: ADL- Deposit rate vs. interbankError correction term: ADL- Deposit rate vs. repo rateError correction term: ADL- Deposit rate vs. T-bill rate

39
4.2b: Trend showing error correction term (dependent variable:-Lending rate) Source: Central Bank of Kenya
4.3. Stationarity Test Results
Stationarity test was conducted to determine the order of integration of the variables. Table A.1 in
the appendix shows unit root tests results for commercial banks’ retail rates, monetary policy rates
and error correction terms. The results show that all the variables including error correction terms
are integrated of order zero I(0).
The dependent variables were found to be stationary at level after three lags. Lending rate was
stationary at level with a drift with ADF statistics of -1.875 which is less than the critical value
(-1.652) at 5 per cent level of significance. Deposit rate was stationary at level with ADF statistic
of -3.869 which was less than the critical value (-3.469) at 1 per cent level of significance.
The ADF statistics show that all error correction terms were stationary at 1 per cent level of
significance except models which were stationary at level at 5 per cent level of significance. With
the exception of error correction term for lending rate versus repo rate and error correction term for
-60
-40
-20
020
1995m1 2000m1 2005m1 2010m1Time
Error correction term: ADL- Lending rate vs. InterbankError correction term: ADL-lending rate vs. repo rateError correction term: ADL-lending rate vs. T-bill rate

40
deposit rate versus repo rate ARDL models, all error correction terms were stationary at level with
no drift or constant and with zero lag at 1 per cent level of significance. All independent time
series variables were stationary at level with no drift, constant or trend.
All the variables were stationary at level. According to Keele and Boef (2004), recent theories
have shown that error correction model that captures both short term and long term effect is not
unique to co-integration data. From figure 4.2a and 4.2b (section 4.3), error correction terms are
stationary around the zero mean, these trend shows that the error correction terms’ stochastic
properties are consistent with the error correction term from the co-integration systems. In this
regard, since both short term and long term relationship exist, single ECM can be estimated despite
the data being stationary (Wooldridge, 2003; Keele and Boef, 2004).
4.4. Regression Results and Interpretation
This section presents empirical findings and interpretation of the regression results. A total of
twenty four error correction models were estimated. Diagnostic test results and comprehensive
error correction model results were presented in tables A.6 through A.11 in the appendix. This
section was organized as follows; a brief discussion of diagnostic test results was presented to
highlight differences across linear and nonlinear error correction models. Thereafter, empirical
findings are presented in subsequent subsections based on each of the study objectives.
Firstly, diagnostic results show that the estimated models can be relied upon for analysis.
Heteroskedasticity and serial correlation was present across both linear and nonlinear error
correction models, however, comparison across linear ECM and the three nonlinear ECMs in all
the six set of equations show that heteroskedastic effect and serial correlation were less
pronounced in nonlinear error correction models compared to linear error correction model. With
respect to serial correlation, Durbin Watson statistics was closer to 2.00 in nonlinear models

41
relative to linear models. In addition, comparison of heteroskedasticity tests across linear and
nonlinear ECM leads to the same conclusion. For example, in table A.6 the ARCH LM statistic for
the linear ECM model was 10.272 with a probability value of 0.001 and the null hypothesis is
rejected at 1 per cent level of significance. However, in the time varying and regime switching
model, ARCH LM statistic was 4.546 with a probability value of 0.033 which means that
homoskedasticity was established at 10 per cent level of significance.
Secondly, table A.5 in the appendix shows summary of adjusted R2 for linear and nonlinear error
correction models. Adjusted R2 ranged from 0.30 to 0.56. Considering that the dependent variable
is at first difference, adjusted R2 ranging of 0.30 to 0.60 is satisfactory (Greene, 2003 & Keele and
Boef, 2004). Adjusted R2 results generally show that nonlinear ECMs are superior to linear ECMs.
For example, adjusted R2 for time-varying and regime switching error correction model for lending
rate vs. repo rate was 56 per cent while that of its linear ECM counterpart was 44 per cent.
Generally, the results show that regime switching models and time varying and regime switching
models are superior predictors compared to linear ECM models.
4.4.1. Time Varying Speed of Adjustment.
The first objective of the study sought to investigate whether speed of adjustment is continuously
time varying conditional on the magnitude of monetary policy rates. That is, is speed of adjustment
dynamic depending on the magnitude of monetary policy rates? To test this objective, the
significance of time varying coefficients (�) modeled in equation 3.16 was tested using students-t
test. Two-tailed test was used because the time varying coefficients can assume negative values,
positive values or zero. Table 4.1 shows the speed of adjustment coefficients (γ) and time varying
coefficients (�) of all six equations, and their respective probability values.

42
Table 4.1: Result for time varying ECMs
� P >|t-stat| � P >|t-stat|
Lending Rate
Interbank rate -0.066 0.000*** 0.001 0.148
T-Bill rate -0.086 0.000*** 0.001 0.042*
Repo rate -0.029 0.074 -0.004 0.103
Deposit Rate
Interbank rate -0.076 0.001*** 0.000 0.971
T-Bill rate -0.127 0.000*** 0.001 0.07
Repo rate -0.078 0.01** 0.002 0.482
*Significant at 10% level of significance **Significant at 5% level of significance ***Significant at 1% level of significance
From the results presented in table 4.1, time varying coefficients in all six equations was found to
be insignificant at 5 per cent level of significance. These results suggest that magnitude asymmetry
does not adequately explain adjustment of bank retail rates to monetary policy changes. The results
are substantiated by diagnostic test results which show that adjusted R2 of time varying ECMs are
smaller relative to other nonlinear ECMs (see table A.5 in the appendix). Therefore, the results
show that assuming sign symmetry, speed of adjustment is not time varying conditional on the
magnitude of monetary policy rate changes.
Given that time varying coefficient are statistically insignificant, time varying ECM models are
weak and generally fail to adequately explain the nature and dynamics of adjustment of
commercial banks’ retail rates to short term interest rate. These results imply that assuming
proportional adjustment across monetary policy regime, adjustment process is not dynamic
conditional on the magnitude change in monetary policy. Therefore, time varying model is not
informative compared to other nonlinear error correction n models. These results echo the
argument by Treeck et al. (2011) who noted that some forms of error correction models are of little

43
use to policy makers. In this regard, like the linear error correction model (model 3.14), time
varying error correction model (model 3.16) is of little use in prediction relative to other forms of
ECM models discussed in this study
4.4.2. Regime Switching Speed of Adjustment.
The second objective of the study sought to investigate whether speed of adjustment of
commercial banks’ retail rates differs with monetary policy regime. That is, do banks respond
faster to monetary policy rate cuts than monetary policy rates rise? In other words, does sign
asymmetry exists in the adjustment process? To measure this objective, equation 3.19 was used
and null hypothesis formulated. The null hypothesis postulated that adjustment of bank retail rates
was symmetrical That is, Speed of adjustment under monetary policy cuts and speed of adjustment
under monetary policy rise are equal. ��:�� = �� . Null hypothesis was tested using Wald test
and inferences drawn at 10 per cent level of significance and above. Table 4.2 presents a summary
of adjustment coefficients for all six regime switching ECM equations, their respective probability
values and Wald test results.
Table 4.2: Result for regime switching ECMs
γ1 (ΔMPR>0) P >|t-stat| γ2 (ΔMPR<0) P >|t-stat|
H0: γ1 = γ2
Wald-stat Prob>F
Lending Rate Interbank rate -0.020 0.044* -0.053 0.000*** 2.91 0.089*
T-Bill rate -0.016 0.048* -0.077 0.000*** 10.97 0.001***
Repo rate -0.063 0.000*** -0.058 0.001*** 0.050 0.832
Deposit Rate Interbank rate -0.045 0.001*** -0.094 0.000*** 5.43 0.021**
T-Bill rate -0.127 0.000*** -0.066 0.000*** 10.75 0.001***
Repo rate -0.069 0.016** -0.122 0.000*** 2.44 0.121
*Significant at 0.1 level of significance
**Significant at 0.05 level of significance ***Significant at 0.01 level of significance

44
From table 4.2, γ1 represents speed of adjustment coefficient when monetary authority pursues
contractionary monetary policy action (that is, increase in monetary policy rates or ΔMPR>0). γ2
represents speed of adjustment coefficient when monetary authority pursue expansionary monetary
policy action (that is, decrease in monetary policy rates or ΔMPR<0). The last two columns present
hypotheses testing results.
Individual significance test (t-statistic) shows that during contractionary monetary policy regime
(γ1) all adjustment coefficients for lending rate and deposit rate given increase in interbank rate
and T-Bill rate were statistically significant at 10 per cent and 1 per cent significance level
respectively. Adjustment of lending rates and deposit rate given increase in Repo rate was
significant at 1 per cent and 5 per cent level of significance respectively. During expansionary
monetary policy regime (γ2), speed of adjustment coefficients were significant at 1 per cent level
of significance for all the six equations. All the speed of adjustment had a negative sign which
shows that commercial banks retail rates adjust towards long run equilibrium rates.
Secondly, with regards to the second objective, there is evidence to support regime switching
adjustment of commercial banks’ retail rates to monetary policy changes (Sign asymmetry). From
the Wald statistics, the null hypothesis was rejected at 10 per cent level of significance for lending
rate and interbank equation with Wald statistics and the corresponding p-value of 2.91 and 0.089
respectively. The null hypothesis was rejected at 5 per cent significance level for deposit rate and
interbank equation with Wald statistic and corresponding p-value of 5.43 and 0.021 respectively.
The Wald statistic and corresponding p-value for lending rate and T-Bill rate equation were 10.97
and 0.001 respectively. In addition, the Wald statistics and corresponding p-value for deposit rate
and T-Bill equations were 10.75 and 0.001 respectively. Therefore, the null hypotheses for both
equations were rejected at 1 per cent level of significance.

45
This means that speed of adjustment of commercial banks’ retail rates to changes in interbank rate
and T-Bill rates was asymmetrical during contractionary and expansionary monetary policy
regimes. In all equations with repo rate as independent variable, the null hypothesis was not
rejected at 10 per cent significant level. This means that the speed of adjustment of bank retail
rates to changes in repo rate under the two regimes is equal or symmetrical. Therefore, linear
model was sufficient in explaining adjustment of bank retail rates to changes in repo rate.
Presence of sign asymmetry is a clear indicator that the conventional interest rate channel is weak
and may not explain monetary transmission process. From a methodological viewpoint, these
results are consistent with Treeck et al (2011) and Fuertes et al (2006) which agreed that linear
ECM might not be suitable for analyzing and/or predicting how monetary policy is transmitted via
commercial bank to the mainstream economy. These results further support post structuralist and
New Keynesian viewpoints which give emphasis to understanding commercial bank pricing and
financial environment as key determinants of effective monetary policy transmission.
Thirdly, there is sufficient evidence to show presence of both downward and upward rigidity. In
relation to lending rates, the results show that adjustment of average monthly lending rate towards
equilibrium given increase in interbank rate and T-Bill rate is very slow at approximately 2 per
cent per month for both equations during contractionary monetary policy regime (γ1). However,
during expansionary monetary policy regime (γ2), adjustment of average monthly lending rate
towards equilibrium given decrease interbank rate and T-Bill rate is 5.3 per cent per month and 7.7
per cent per month respectively. These results show that lending rates are rigid upward as they
respond faster to monetary policy cuts compared to monetary policy rise ( γ1 < γ2).
In relation to deposit rates, during contractionary monetary policy regime (γ1), adjustment of
average monthly deposit rate given increase in interbank rate and T-Bill rate is approximately 4.5
46
per cent per month and 12.7 per cent per month respectively. During expansionary monetary
policy regime (γ2), adjustment of deposit rate towards equilibrium given decrease interbank rate
and T-Bill rate is 9.4 per cent per month and 6.6 per cent per month respectively. These results
show that adjustment of deposit rate to interbank rate is rigid upwards that is (γ1 < γ2) but
adjustment of deposit rate to T-Bill rate is rigid downwards (that is, γ1 > γ2).
In this regard, existence of regime switching adjustment and more so upward rigidity of lending
rates and downward rigidity of deposit rate is supported by both theory and empirical evidence.
Commercial bank pricing behaviour theory as presented by Stiglitz and Weiss Model (1981), as
quoted in Fuertes et al. (2006), argued that in a competitive commercial banking environment,
loans are sticky upwards due to risk of default (inherent in high lending rates) and decrease in
demand for credit. On the other hand, in growing financial economies, competitive pressure are
forcing commercial banks to increase deposit rates upwards to attract customers and source
loanable funds. Moreover, Fuertes et al. 2006) and Treeck et al. (2011) also found existence of
asymmetric adjustment and both downward and upward rigidity of bank retail rates to changes in
monetary policy.
These results contradict the results obtained by Ngugi (2001) who found out that lending rates
increases with T-Bill rates but were sticky when T-Bill rates decreased, implying downward
rigidity of lending rates. However, while this study’s results are contrary that of Ngugi (2001),
Stiglitz and Weiss (1981) argument offers a plausible explanation. Kenya’s financial sector has
grown to become more competitive. To this end, the competitive dynamics of Kenya’s commercial
banking pricing and by extension adjustment of commercial banks’ retail rates to monetary policy
changes may have changed from 2001 to date.

47
4.4.3. Time Varying and Regime Switching Model.
The third objective sought to establish whether magnitude and sign asymmetry occur
simultaneously. That is, given regime switching adjustment, is the speed of adjustment
continuously time varying conditional on magnitude of monetary policy changes? Time varying
and regime switching ECM model was used in the investigation. The Wald tests were based on
second stage null hypothesis as defined in 3.2.4. The first stage hypothesis is presumed to have
been tested by the Wald test in regime switching model in section 4.6.2. Table 4.3 shows summary
of results for constant speed of adjustment coefficients, time varying and regime switching speed
of adjustment coefficients, their respective p-values and Wald tests results.
Table 4.3: Result showing time varying and regime switching ECMs
� P >|t-stat| γ1 (ΔMPR>0) P>|t-stat| γ2 (ΔMPR<0) P>|t-stat|
H0: γ1 = γ2=ώ
Wald-stat Prob>F
Lending Rate Interbank rate -0.06 0.001*** 0.001 00.0004*** 0.0002 0.685 2.23 0.137
T-Bill rate -0.085 0.000*** 0.0002 0.487 0.001 0.000*** 7.94 0.001***
Repo rate -0.018 0.23 -0.010 0.012*** -0.006 0.011** n/a n/a
Deposit Rate Interbank rate -0.067 0.000*** -0.001 0.303 0.001 0.045* 4.32 0.0388**
T-Bill rate -0.149 0.000*** 0.002 0.000*** 0.001 0.689 25.45 0.000***
Repo rate -0.072 0.010** -0.006 0.059 -0.001 0.731 n/a n/a
*Significant at 10% level of significance
**Significant at 5% level of significance ***Significant at 1% level of significance
The coefficient � in table 4.3 represents the constant speed of adjustment coefficient. γ1 represent
the time varying speed of adjustment coefficient when monetary authority pursues contractionary
monetary policy action. γ2 represent time varying speed of adjustment coefficient when monetary
authority pursue expansionary monetary policy action.

48
In reference to the third study objective, there was evidence that speed of adjustment to monetary
policy changes was simultaneously time varying and regime switching. The results show that the
Wald Statistic and corresponding p-value for lending rate and T-Bill rate equation was 7.94 and
0.001 respectively. The Wald Statistic and corresponding p-value for deposit rate and T-Bill rate
equation was 25.45 and 0.000 respectively. Therefore, for the two aforementioned models, the null
hypotheses were rejected at 1 per cent level of significance, which means that speed of adjustment
of lending rates and deposit rates to changes in T-Bill rates are simultaneously time-varying and
regime switching.
The Wald Statistic and corresponding p-value for deposit rate and interbank rate equation was 4.33
and 0.039 respectively. Therefore, the null hypothesis was rejected at 5 per cent level of
significance, which means that the speed of adjustment of deposit rate to changes in interbank rate
is time-varying and regime switching. The null hypotheses for adjustment of lending rate to
changes in interbank and changes in repo rate equations and adjustment deposit rate to changes in
repo rate equation could not be rejected at 5 per cent significance level. Time varying adjustment
was less pronounced in all models ranging from 0.1 per cent to 0.2 per cent per month.
Secondly, the time varying and regime switching results show that the speed of adjustment of
lending rates towards equilibrium ranges from 2 per cent to 8.5 per cent per month and is lower
than speed of adjustment of deposit rate towards equilibrium which ranged between 7 per cent and
15 per cent per month. Moreover, difference in magnitude of time varying coefficient during
expansionary and contractionary monetary policy regime in the time varying and regime switching
model substantiate the claim that there exists both upward rigidity and downward rigidity in
adjustment of bank retail rates and corroborates the results obtained from the regime switching
model results presented in table 4.2

49
Existence of magnitude asymmetry and sign asymmetry is proof of inefficiencies in commercial
banking sector. These results are consistence with Stiglitz and Weiss (1981, 1983) as noted in
Fuertes et al. (2006) and Treeck et al. (2011). The aforementioned empirical studies showed that
commercial banks are reluctant to raise lending rates because it not only reduces demand for credit
but also increases moral hazard and risk of default. This translates to reduction in the quality of
loan portfolios held by commercial banks. Ultimately, increased risk of default and decrease in
credit demand inhibit revenue generation ability especially in economies where information
asymmetry is wide spread.
Lastly, results presented in table 4.1 show that time varying coefficients were statistically
insignificant at 5 per cent level. However, as shown in table 4.3, after factoring in regime
switching and time varying components simultaneously, time varying adjustment can readily be
observed. For example, according to the results in section 4.6.1, time varying coefficient of lending
rate given changes in T-Bill rate - assuming proportional change during both contractionary and
expansionary monetary policy regimes- was statistically insignificant at 5 per cent level. After
introducing time varying and regime switching error correction components simultaneously,
results presented in table 4.3 show that time varying coefficient of lending rate given changes in T-
Bill rate during monetary policy rise is insignificant. However, during monetary policy cuts, time
varying coefficient is approximately 0.1 per cent and significant at 1 per cent level.
While these findings appeared to be counter intuitive –in reference to time varying model
presented in table 4.1- they signal that asymmetry in speed of adjustment under the two regimes
process has an offsetting effect on time varying coefficient. These results therefore substantiate the
claim by Treeck et al. (2011) that linear models can to some extent, be misguiding. There is need
50
to explore nonlinear aspects of commercial banks adjustment mechanism in order to understand
how commercial banks pricing behaviour respond to Central Banks’ monetary policy action
4.4.4. The Strength of Adjustment
The fourth objective sought to investigate the strength and/or speed of adjustment of commercial
banks’ retail rates to monetary policy changes. To address this objective, the size and direction
(signage) of statistically significant adjustment coefficients were interpreted. The most
parsimonious models were selected by comparing diagnostics across linear and nonlinear ECM
models for each set of dependent and independent variables.
The results in table 4.1 through 4.3, the probability values from the students’ t-statistics show that,
with exception of speed of adjustment coefficient of lending rate to changes in repo rate, all the
other constant adjustment coefficients are statistically significant at 5 per cent level of significance.
All speed of adjustment coefficients that were significant had the right signage (negative sign)
showing that commercial banks’ retail rates adjust towards equilibrium path. According to
Wooldridge (2003) and Greene (2002), negative signage of adjustment coefficient indicates a
movement towards equilibrium.
Adjusted R2 results presented in table A.5 and general diagnostics presented in table A.6 through
A.11 in the appendix show that with the exception of adjustment coefficients of average monthly
retail rates (both lending and deposit rate) to changes in repo rate and adjustment coefficient of
average monthly lending rate to interbank rate, the most parsimonious models that explain bank
retail rates adjustment to monetary policy changes is time varying and regime switching ECM
presented in subsection 4.6.3.

51
Statistical inferences obtained from the results presented in table 4.3 show that, speed of
adjustment (�) of lending rate to changes in T-Bill rates and interbank rate is approximately 8.5
per cent per month and 6 per cent per month respectively. On the other hand, speed of adjustment
(�) of deposit rate to changes in T-Bill rates and interbank rate is approximately 15 per cent per
month and 7 per cent per month respectively. In addition, speed of adjustment is regimes switching
and time varying at a speed ranging from 0.1 to 0.2 per cent per month. In all the four models, the
constant speed of adjustment coefficient was significant at 1 per cent level. For both commercial
bank lending and deposit rate, repo rate was the least effective targeted instruments as shown by
the size of speed of adjustment and the goodness of fit of ECM models with repo rate as the
independent variables
Theoretically, effective monetary transmission is achieved when speed of adjustment is
proportional across regimes and equal or close to one (Wooldridge, 2003; Greene, 2002). The
findings of this study show that speed of adjustment is sluggish, time varying, regime switching
and range from 5 per cent to 15 per cent per month. These results are consistent with those of
Misati et al. (2011) who found that short run speed of adjustment of bank retail rates generally
ranged from 6 per cent per period to approximately 10 per cent per month and takes approximately
11 months to 24 months for monetary policy changes to fully take effect. Studies by Kamau
(2010), Njuguna (2011) and Wanjau and Ng’etich (2011) concluded that wide interest rate spread,
segmentation in commercial banking industry, inefficiency in both money and security market
inhibit monetary policy transmission in Kenya.

52
CHAPTER FIVE
SUMMARY, CONCLUSION AND POLICY IMPLICATIONS.
5.1. Summary
This study investigated the nature and dynamics of adjustment of Commercial banks’ retail rates to
changes in monetary policy. The study covered the period June 1993 to February 2012 and used
secondary data sourced from Central Bank of Kenya. Linear and nonlinear error correction models
were used in the investigation. The data consisted of commercial banks’ retail rates and short term
interest rates. Interactive terms and dummy variable formulated to capture time varying and regime
switching adjustment process.
The results show that adjustment of bank retail rates was sluggish and incomplete. For the
alternative regressions estimated, the constant speed of adjustment ranged from 5 per cent per
month to 15 per cent per month. This means that it would take approximately 11 months to 22
months for monetary policy action to fully take effect. Adjustment of commercial banks’ retail
rates was regime switching and time varying (dynamic) conditional on the magnitude of change in
monetary policy rates. However, time varying adjustment was less pronounced with the coefficient
ranging from 0.1 per cent to 0.2 per cent. The results show that lending rates were rigid upwards
as they adjusted faster to decreases in monetary policy rates relative to increase in monetary policy
rate. In contrast, deposit rates are rigid downwards as they adjusted faster to increase in monetary
policy rates compared to decreases in monetary policy rates.
5.2. Conclusion
The efficacy of monetary policy depends on the speed and degree of monetary policy transmission
to the real sector economy. The results show that transmission of monetary policy via commercial
banks is sluggish and incomplete. This signals inefficiency in Kenya’s financial market sector and

53
poses serious challenges to monetary policy transmission and conduct of monetary policy in
general. Presence of nonlinear adjustment as exhibited by presence of sign and magnitude
asymmetry show that interest rate channel is weak. To this end, commercial banks’ pricing
behaviour plays an active role in determination of money supply process. In addition, Kenya’s
financial market environment and imperfect market conditions have a significant impact on the
character and dynamics of monetary policy transmission.
Adjustment of commercial banks’ retail rates need not be linear, immediate or symmetrical. As
long as monetary policy authority understand the nonlinear aspects, lag structure and dynamics of
the adjustment process, efficiency in transmission of monetary policy is still tenable. In light of the
findings of this study, the following policy implications were drawn:
5.3. Policy Implications
First, Central Bank of Kenya should simulate and adopt progressive, forward-looking models that
factor in nonlinear aspects such as sign asymmetry and magnitude asymmetry in the adjustment
process. This is because adjustment of Commercial Banks’ retail rates to monetary policy changes
is nonlinear. To this end, understanding dynamics and nonlinear aspects of adjustment process
would facilitate effective decision making particularly with regards to the timing, size and choice
of monetary policy instruments.
Second, the government through the Ministry of Finance and Central Bank of Kenya should adopt
policies that facilitate financial reforms, spur innovation of financial product and enhance financial
market development. Sluggish and incomplete adjustment of commercial banks’ retail rates is an
indication of imperfect competition and an underdeveloped financial market. To this end, financial
sector development will play a critical role in improving speed of adjustment and facilitating
effective transmission of monetary policy in the long run.

54
Third, the Central Bank in conjunction with Capital Market Authority (CMA) should formulate
policies that will spur development of security market. This will make security market an
accessible and affordable source of credit for majority of small and micro businesses that depend
on commercial banks’ credit. This is because sluggishness, incompleteness and rigidity in the
adjustment process are facilitated by dominance and monopolistic competition of Kenya’s
commercial banking sector. Growth of security market will create a competitive financial market
environment and inhibit monopolistic tendencies such as collusive bank pricing, market
segmentation and ultimately enhance commercial banks’ responsiveness to monetary policy
decisions in the long run.
Fourth, while Central bank has in recent years spearheaded the introduction of information sharing
initiative in Kenya, much more needs to be done with regards to sensitization and educating
lenders and borrowers. This is because the results established that adjustment of lending rates are
rigid upwards which signals and explains the consistent wide interest rate spread as captured by
figure 4.1b. Presence of downward and upward rigidity signals problem of information asymmetry
in the credit market and ultimately interfere with smooth and effective adjustment process. To this
end, effective use of credit information reduces information asymmetry between lenders and
borrowers and ultimately contributes towards effective monetary policy transmission.
5.4. Areas for Further Research
This study was restricted to adjustment of commercial banks’ retail rates. However, Non bank
financial institution plays a critical role in monetary policy transmission process in Kenya.
Therefore, a possible area for future research is to expand the scope to adjustment of non bank
financial intermediaries, mortgage institutions and investment firms. This would enable a holistic

55
and in-depth understanding of the dynamics of market interest rate adjustment to monetary policy
changes.
In addition, there are numerous approaches and methodologies that can be used to explore
nonlinear adjustment of market interest rates. To this end, a possible area for future research is to
explore progressive models that can explain curvature and other nonlinear aspects and as such
facilitate understanding of the dynamics in the adjustment of market interest rates to monetary
policy changes.

56
REFERENCES.
Bernanke, B. and Gertler, M. 1995. Inside the black box: The credit channel of monetary policy
transmission. Journal of Economic Perspective 9(4), pp. 27 – 48.
Bondt G., Mojon, B and Valla, N. 2005. Term Structure and the Sluggishness of retail bank
Interest Rates in Euro area Countries. European Central Bank: Working paper No. 518
Buigut, S. 2010. Is there a bank lending channel of monetary policy in Kenya? International
Journal of Finance and Economics, EuroJournals Publishing. 2010 (45)
Central Bank of Kenya. 2010a.’27th Monetary Policy Statement.’
http://www.centralbank.go.ke/downloads/monetary/MPCpercent20Statements/27thper
cent20MPSpercent20-per cent20December per cent202010percent20(revised).pdf. [Viewed
on 1st August 2011]
Central Bank of Kenya, 2010,b. “Banking supervision: Annual report 2010.”
http://www.centralbank.go.ke/downloads/bsd/annualreports/bsd2010.pdf. [Viewed 1st
December 2011
Central Bank of Kenya. 2011. ‘28th Monetary policy Statement.’
http://www.centralbank.go.ke/downloads/monetary/MPC per cent20Statements/28th per
cent20MPS per cent20- per cent20December per cent202010 per cent20(revised).pdf
[Viewed on 1st August 2011]
Hoffman, B. and P. Mizen 2004. ‘Interest rate pass-through and monetary transmission: Evidence
from individual financial institutions’ retail rates’. Econometrica 71, pp. 99-123.
Fuertes, A. Heffernan, S. and Kalotchou, E. 2006. Bank Retail Rate Response to the Policy Rate:
Time-variation, Regime-switching and Curvature. London: City University Press
Greene W. 2003.Econometrics Analysis 5th Ed. Prentice hall Pub. New Jersey: Upper saddle River.
Kamau, A. 2010.’ Efficiency and Productivity of Kenyan Banking Sector.” University of Nairobi
P.H.D. Thesis. (unpublished).
Keele L. & Boef, S. (2004). ‘Not Just for Cointegration: Error Correction Model with Stationary
Data’. Department of Political science and international relations, Oxford University.
http://www.nuffield.ox.ac.uk/politics/papers/2005/keele%20deboef%20ecm%20041213.pd
f. [Viewed on 1st May 2012]
Kinyua, J. 2001. Monetary Policy Evolution in Kenya. Central Bank of Kenya.
http://www.scribd.com/doc/24064767/Monetary-Policy-in-Kenya-Evolution-and-Current-
Framework-2000 [Viewed on 1st August 2011]

57
Loayza N. and Heddel-Schmidt 2002. ‘Monetary policy function and transmission mechanism:
An overview.’ Central Bank of Chile. From http://www.bcentral.cl/estudios/banca-
central/pdf/v4/001_020Gallego.pdf. [Viewed on 1st December 2011]
Misati, R. Nyamongo, E. and Kamau, A. 2011.’ Interest rates pass through In Kenya.
International’ Journal of Development and Finance.10 (2), pp. 170-182
Mishkin S.F. 2010.’ Chapter 26: Transmission mechanism of monetary policy: The Evidence.’
http://w3.cyu.edu.tw/pwyeh/file2/3/tb26.pdf. [Viewed on 1st August 2011]
Ngugi, R. 2001.’ An empirical analysis of interest rates spread in Kenya’. African Economic
research Consortium. http://www.africaportal.org/dspace/articles/empirical-analysis-
interest-rate-spread-kenya. [Viewed on 1st November 2011]
Njuguna, N. 2011. Strengthening regulatory frameworks in the finance industry: A key enabler for
private sector development. African Banking Finance Conference.
http://www.bis.org/review/r110315b.pdf?frames=0. [Viewed on 17th December 2011]
Ogun T. and Akinlo, A. 2010.’The effectiveness of bank lending channel of monetary policy
transmission in Nigeria’. African Economic and Business 8 (2), pp. 15-29
Ouma, S., Misati, R., Njoroge, L., Kamau, A. 2010..Financial innovation and monetary policy
transmission in Kenya. International Research Journal of Finance and Economics. 50 -
2010. EuroJournals Publishing, Inc.
Palley, T. 2001.’ Endogenous Money: What is it and why does it matter. Public Policy
Department”.http://www.thomaspalley.com/docs/articles/macro_theory/endogenous_mone
y.pdf. [Viewed on 1st April 2012]
Pollin, R 1991. Two theories of Money supply endogeneity: some empirical evidence. Journal of
Post Keynesian Economics, 13(3), pp. 366 – 395.
Republic of Kenya 1986. Sessional Paper No.1 of 1986 on Economic Management for
renewed Growth. Nairobi: Government Printers.
Republic of Kenya. 2007. The Kenya Vision 2030. Nairobi: Government printers.
Republic of Kenya, Statistical Abstract (various issues), Nairobi: Government Printers.
Republic of Kenya, 2009.Economic Survey. Nairobi: Government Printers.
Rotich, H.,Kathanje, M. and Maana, I. 2007. Monetary policy reactions function for Kenya. 13th
Annual Econometrics Society Conference.
http://www.africametrics.org/documents/conference08/day2/session6/rotich_katanje_maan
a.pdf. [Viewed on 5th December 2011]

58
Treeck, T., Shin, Y. and Greenwood-Nimmo, M. (2011).The Great Moderation and the decoupling
of monetary policy from long-term rates in the U.S. and Germany.Macroeconomic Policy
Institute, Germany. From http://www.boeckler.de/pdf/p_imk_wp_15_2010.pdf. [Viewed
on 1st April 2012]
Wanjau, K. and Ng’etich, J.C. (2011).The Effects of Interest Rate Spread on the Level of Non-
Performing Assets: A Case of Commercial Banks in Kenya. International Journal of
Business and Public management, (1)1. 34-56
Wooldridge J.M. 2003. Introductory Econometrics: A Modern Approach, 2nd Ed. Cambridge,
Massachusetts: MIT Press.