Dynamics of coronary adjustment to a change in heart rate in the anaesthetized goat
18
Journal of Physiology (1989), 408, pp. 295-312 295 W'ith 6 text-figures Printed in Great Britain DYNAMICS OF CORONARY ADJUSTMENT TO A CHANGE IN HEART RATE IN THE ANAESTHETIZED GOAT BY JENNY DANKELMAN*, JOS A. E. SPAAN*t, HENK G. STASSEN* AND ISABELLE VERGROESENt From the tDepartment of Medical Physics, Faculty of Medicine, University of Amsterdam and the *Faculty of Mechanical Engineering, Delft University of Technology, Delft, The Netherlands (Received 26 January 1988) SUMMARY 1. We have previously shown that steady-state coronary flow during auto- regulation and metabolic rate changes is predicted by a mathematically expressed theory which assigns control of coronary vascular resistance to tissue Po2. Our present purpose was to test the applicability of this theory to the non-steady state as exemplified by a sudden step change in heart rate. 2. The theory predicted that the response time of change of resistance in these circumstances would be slower with constant-flow perfusion of the coronary bed than with constant-pressure perfusion, and that with constant-pressure perfusion only, the rate of adaption of resistance would be dependent on the level of pressure used. 3. These predictions were tested in open-chest goats with cannulation of the left main coronary artery and perfusion with alternately constant pressure or constant flow. Sudden step changes in heart rate were induced by pacing to induce rapid transients in myocardial metabolic rate. 4. The half-time of subsequent change in perfusion pressure-flow ratio, which in the dynamical state is not equal to resistance, was 15-7 +04 s (mean+ S.E.M.), which was statistically shorter than for constant flow (22-2 +0-5 s, P < 0-001). 5. The half-time of subsequent change in perfusion pressure-flow ratio with constant-pressure perfusion was 14-4 + 0-6 s at low pressure and 17-0 + 0-6 s at high pressure (P < 0-001). 6. The results differed from those predicted by the theory, in that the changes described above were preceded by a rapid (5 s) step change in pressure-flow ratio, up with an increase in heart rate and down with a decrease in heart rate. We postulated that this was a mechanical effect due to greater compression of the coronary microvasculature with more frequent contractions. 7. To test this hypothesis, we measured changes in coronary blood volume by integrating the difference between arterial inflow and venous outflow. These Experiments were performed at the Department of Physiology and Physiological Physics, Faculty of Medicine, University of Leiden, where J. A. E. Spaan and I. Vergroesen were employed until 1 December 1986. ) by guest on July 10, 2011 jp.physoc.org Downloaded from J Physiol (
-
Upload
independent -
Category
Documents
-
view
3 -
download
0
Transcript of Dynamics of coronary adjustment to a change in heart rate in the anaesthetized goat

Journal of Physiology (1989), 408, pp. 295-312 295W'ith 6 text-figuresPrinted in Great Britain
DYNAMICS OF CORONARY ADJUSTMENT TO A CHANGE INHEART RATE IN THE ANAESTHETIZED GOAT
BY JENNY DANKELMAN*, JOS A. E. SPAAN*t, HENK G. STASSEN*AND ISABELLE VERGROESENt
From the tDepartment of Medical Physics, Faculty of Medicine, Universityof Amsterdam and the *Faculty of Mechanical Engineering, Delft University
of Technology, Delft, The Netherlands
(Received 26 January 1988)
SUMMARY
1. We have previously shown that steady-state coronary flow during auto-regulation and metabolic rate changes is predicted by a mathematically expressedtheory which assigns control of coronary vascular resistance to tissue Po2. Ourpresent purpose was to test the applicability of this theory to the non-steady stateas exemplified by a sudden step change in heart rate.
2. The theory predicted that the response time of change of resistance in thesecircumstances would be slower with constant-flow perfusion of the coronary bed thanwith constant-pressure perfusion, and that with constant-pressure perfusion only,the rate of adaption of resistance would be dependent on the level of pressureused.
3. These predictions were tested in open-chest goats with cannulation of the leftmain coronary artery and perfusion with alternately constant pressure or constantflow. Sudden step changes in heart rate were induced by pacing to induce rapidtransients in myocardial metabolic rate.
4. The half-time of subsequent change in perfusion pressure-flow ratio, which inthe dynamical state is not equal to resistance, was 15-7 +04 s (mean+S.E.M.), whichwas statistically shorter than for constant flow (22-2 +0-5 s, P < 0-001).
5. The half-time of subsequent change in perfusion pressure-flow ratio withconstant-pressure perfusion was 14-4 + 0-6 s at low pressure and 17-0+ 0-6 s at highpressure (P < 0-001).
6. The results differed from those predicted by the theory, in that the changesdescribed above were preceded by a rapid (5 s) step change in pressure-flow ratio, upwith an increase in heart rate and down with a decrease in heart rate. We postulatedthat this was a mechanical effect due to greater compression of the coronarymicrovasculature with more frequent contractions.
7. To test this hypothesis, we measured changes in coronary blood volume byintegrating the difference between arterial inflow and venous outflow. These
Experiments were performed at the Department of Physiology and Physiological Physics,Faculty of Medicine, University of Leiden, where J. A. E. Spaan and I. Vergroesen were employeduntil 1 December 1986.
) by guest on July 10, 2011jp.physoc.orgDownloaded from J Physiol (
J. DANKELMAN AND OTHERS
experiments showed a decrease in coronary blood volume with heart rate increaseand vice versa.
8. Abolition of autoregulation and metabolic regulation was achieved withmaximum vasodilatation of the coronary bed with adenosine. A sudden switch inheart rate then produced the initial step change in pressure-flow ratio, but not thesubsequent adaptation over 13-25 s. This confirmed that the former effect isattributable to a passive mechanical mechanism.
INTRODUCTION
The basic mechanism of coronary flow adjustment to myocardial oxygen con-sumption is as yet unrevealed. We have previously shown that on the basis of theassumption that tissue oxygen tension is the controlled variable, the steady-statebehaviour of coronary flow control can be described very well (Drake-Holland,Laird, Noble, Spaan & Vergroesen, 1984; Dole & Nuno, 1986; Vergroesen, Noble,Wieringa & Spaan, 1987 a). The purpose of the present study was to assess if the sameassumption would result in an adequate description of the response of the coronarycirculation to a sudden change in metabolism, as is the case with a sudden change inheart rate. The previous oxygen model was extended to describe the dynamics ofcoronary control. The theoretical analysis resulted in some predictions that weresuitable for experimental verification. These predictions were that coronaryadjustment would be slower with constant-flow perfusion than with constant-pressure perfusion. Moreover, the model showed that with constant-flow perfusionthe rate of the response would be independent of the flow level, but that withconstant-pressure perfusion the rate of response would be pressure dependent. Theexperiments described in this paper were designed to test these predictions.
In order to establish the direct mechanical effect of a change in frequency ofcardiac contraction on coronary resistance the change in coronary resistance wasmeasured also when the coronary bed was vasodilated with adenosine preventing ametabolic response.
Recently, it has been shown that intramyocardial blood volume variations at andduring cardiac arrest are slow and have a characteristic time in the order of 1-5 s(Chilian & Marcus, 1984; Kajiya, 1985a; Kajiya, Tsujioka, Goto, Wada, Tadaoka,Nakai, Hiramatsu, Ogasawara & Mito, 1985b; Vergroesen, Noble & Spaan, 1987b).Similar mechanical effects are to be expected with a change in heart rate and mayinfluence the initial response of the coronary system. Therefore, it was attempted tomeasure the change in intramyocardial blood volume from the integrated differencebetween coronary arterial and corrected venous flows.
MODEL
Oxygen model for dynamics of coronary flow adjustmentIn the model it is assumed that the coronary resistance controls flow and that the
set point is related to the coronary venous Po2 (Laird & Spaan, 1981; Laird, 1983;Dole & Nuno, 1986). The venous PT2is then related to oxygen consumption, arterialPO, the oxygen binding capacity of the blood and blood flow. It has been shown that
296
) by guest on July 10, 2011jp.physoc.orgDownloaded from J Physiol (

CORONARY ADJUSTMENT TO A CHANGE INHEART RATE 297
Control of Tissueresistance MVO2
r -P02
IF2F
vc
1Co3 C
Control of CBF
Constant pressure
Constant flow
20Time (s)
Fig. 1. Dynamic model of control of local coronary resistance. A, schematic rep-resentation of the model for regulation. MVO2 = oxygen consumption by tissue,vc = capillary blood volume, CBF = coronary blood flow, F, = oxygen extractionfrom the blood, F2 represents the adaptation of the arteriolar resistance to a change intissue PO, F3 represents the changc in CBF after a change in resistance. B, modelsimulation of the regulation ot coronary resistance. Upper panel, normalized response ofcoronary resistanice with constant flow at high and low pressures, respectively. Bottompanel, simulation with high and low flows. Constant-pressure perfusion shows a fasterresponse and is dependent on the level of pressure. Constant-flow perfusion shows a slowerresponse with a speed independent of the level of flow.
such a model is able to describe the steady-state local regulation of coronary flow(Drake-Holland et al. 1984; Vergroesen et al. 1987a). This model will now beextended to describe the dynamics of metabolic flow adjustment.The model is schematically drawn in Fig. 1. To describe the dynamics of metabolic
flow adaptation to a change in heart rate two time-limiting processes have to beaccounted for: the dynamic changes of tissue Po2 induced by a change in oxygen
consumption and the dynamic change of arteriolar resistance caused by a change in
A
CBF
B
1c0 4,c.C0. o
0 co_- t0 0=
EO00z
00CD0a G
0 .N*N_ 0
10 .. re
z
) by guest on July 10, 2011jp.physoc.orgDownloaded from J Physiol (
J. DANKELMAN AND OTHERS
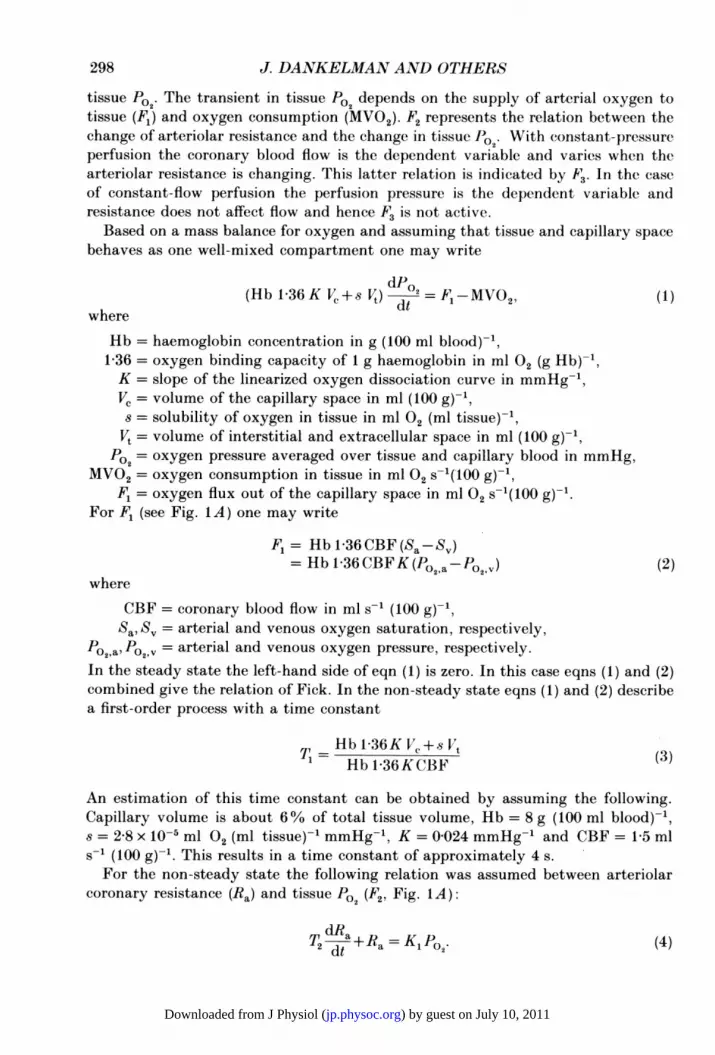
tissue Po2. The transient in tissue Po2 depends on the supply of arterial oxygen totissue (F1) and oxygen consumption (MV02). F2 represents the relation between thechange of arteriolar resistance and the change in tissue P0 2* With constant-pressureperfusion the coronary blood flow is the dependent variable and varies when thearteriolar resistance is changing. This latter relation is indicated by F. In the caseof constant-flow perfusion the perfusion pressure is the dependent variable andresistance does not affect flow and hence F3 is not active.Based on a mass balance for oxygen and assuming that tissue and capillary space
behaves as one well-mixed compartment one may write
dP0(Hb 1i36K Vc+s Vt) dt Fl-MVO2, (1)where
Hb = haemoglobin concentration in g (100 ml blood)-',136 = oxygen binding capacity of 1 g haemoglobin in ml 02 (g Hb)-1,K = slope of the linearized oxygen dissociation curve in mmHg-1,VC = volume of the capillary space in ml (100 g)-',s = solubility of oxygen in tissue in ml 02 (ml tissue)-',Vt = volume of interstitial and extracellular space in ml (100 g)-1,
PO2= oxygen pressure averaged over tissue and capillary blood in mmHg,MVO2 = oxygen consumption in tissue in ml 02 S-'(100 g)-,
F, = oxygen flux out of the capillary space in ml 02 S-'(100 g)-l.For F, (see Fig. 1A) one may write
F, = Hb 1P36 CBF (Sa-Sv)= Hb 1*36CBFK (Po2'a-Po2 v) (2)
where
CBF = coronary blood flow in ml s-1 (100 g)-1,Sa SV = arterial and venous oxygen saturation, respectively,
PO2a P02,v= arterial and venous oxygen pressure, respectively.In the steady state the left-hand side of eqn (1) is zero. In this case eqns (1) and (2)combined give the relation of Fick. In the non-steady state eqns (1) and (2) describea first-order process with a time constant
HHb 136KV±+831 Hb136KCBF (3)
An estimation of this time constant can be obtained by assuming the following.Capillary volume is about 6% of total tissue volume, Hb = 8 g (100 ml blood)-',s = 2-8 x 10⁻⁵ ml 02 (ml tissue)-' mmHg-', K = 0-024 mmHg-1 and CBF = 1-5 mls-1 (100 g)-1. This results in a time constant of approximately 4 s.For the non-steady state the following relation was assumed between arteriolar
coronary resistance (Ra) and tissue Po2 (F2, Fig. 1A):
T2 dta+Ra = K1Po2 -(4)
298
) by guest on July 10, 2011jp.physoc.orgDownloaded from J Physiol (

CORONARYADJUSTMENTTOACHANGEINHEARTRATE 299
In the steady state this equation relates resistance to tissue Po2 as was the case in theoriginal oxygen model. For the non-steady state T2 is the characteristic time constantfor the adaptation of resistance to a change in tissue Po2. The physiological basis mustbe found in the rate of response of smooth muscle tone to a change in stimulus andall other factors as yet undefined. In the present study T2 is chosen as equal to 20 s,in order to describe adequately the rate of change of coronary resistance. Timeconstant T2 will be discussed further in the Discussion. In the case of constant-flowperfusion, the signal for control of resistance is not influenced by flow, as it is withconstant-pressure perfusion. This latter effect is indicated by F3 in Fig. 1A. Thevalues of T, and T2 were the same for all simulations discussed below.
Model predictionsWith the model, the resistance variation following the different simulated inter-
ventions can be calculated. The results are presented as normalized resistancevariations to allow for a comparison of the course of the resistance variationsobtained, e.g. different changes in oxygen consumption variations. The normalizedresponse is defined as:
normalized response = R(t)-R° (5)
whereR(t) = resistance at time t,Ro = resistance before the simulated change in oxygen consumption,RI = resistance after the new steady state has been reached.
Because of its definition the normalized response equals zero at the start of theresponse and equals unity in the new steady state. This allows evaluation of thecourse of the response and its rate independent of magnitude and direction of theoxygen consumption (casu quo heart rate) change.From a steady state (MVO2 = 0.1 ml 02 S-1(100 gf)-) MVO2 in the model was
suddenly changed by 20%. The normalized resistance responses are shown inFig. 1B. The upper panel of Fig. 1B depicts the responses when pressure waskept constant and flow allowed to change. The response is faster with the lowvalue of perfusion pressure. The response with constant-flow perfusion (lowerpanel of Fig. 1 B) is slower and independent of the level of flow.
METHODS
PreparationSeven goats, weighing 18-22-5 kg, were treated for worms using oxfendazol (5 mg kg-',
Synanthic, Syntex) 2 weeks prior to use. The goats were anaesthetized afterbsedation with 20 mgdiazepam (4 ml Valium 10, La Roche) by injection of ketamine hydrochloride (Ketaset 15 mg kg-')into the jugular vein. Through the same needle atropine sulphate (0-1 mg kg-') was subsequentlyadministered. The goats were ventilated with a Harvard respirator using a 2: 1 nitrousoxide-oxygen mixture and anaesthesia was maintained by continuous infusion of ketaminehydrochloride (24 mg kg-' h-'). Piritramide (Dipidolor, Jansen) was given intravenously as ananalgesic, 3-2 mg before the left thoracotomy and 3-2 mg 4 hours later.A left thoracotomy was performed and the 3rd and 4th ribs were removed. The pericardium was
opened and a cradle formed. The left main stem of the left coronary artery was dissected and aligature was placed around it. Another ligature was placed around the great cardiac vein, close to
) by guest on July 10, 2011jp.physoc.orgDownloaded from J Physiol (

J. DANKELMAN AND OTHERS
the junction at which the left hemiazygos vein drains into the coronary sinus. The His bundle wasdestroyed by local injection of formaldehyde (Steiner & Kovalik, 1968) and the right ventricle waspaced. A Herd-Barger catheter was inserted into the left anterior descending vein.A stainless-steel Gregg cannula was inserted into the aorta via a purse string after administration
of 750 i.u. heparin kg-' intravenously. Blood from the cannulated left carotid artery was circulatedthrough the perfusion system (Spaan, Breuls & Laird, 1981 a) and back via the Gregg cannula (Fig.2). With continuous perfusion, the cannula was ligated into the left main coronary artery. Thegreat cardiac vein was cannulated via the left hemiazygos vein. A catheter-tipped manometer wasinserted through a purse-string in the left atrial appendage into the left ventricle.
Arterial perfusion Venous drainagesystem system
Air Pressure Pressure Air2control 3' Level Level control
control control
exchanger Fedbc Feed-bckxcaner
Fig. 2. Schematic diagram of experimental preparation. EM = electromagnetic flowprobe, LM = left main coronary artery, LC = left circumflex artery, LAD = left anteriordescending artery, CA = carotid artery, GCV = great cardiac vein, JV = jugular vein.With a high pressure proximal to a high stenosis a constant flow was obtained. For adetailed description, see text.
Arterial perfSsion systemThe perfusion system was essentially similar to the one described by Spaan et al. (1981 a). Blood
from the left carotid artery was pumped into a 30 ml reservoir via a heat exchanger and filter(40 ,um Pall, type SQUOS). A precision regulator (Fairchild, model 10R) connected to a laboratorycompressed-air system held reservoir pressure at a pre-set value. Perfusion pressure was measuredat the cannula tip via a small lumen catheter (Braun FDR 07 x 1s2 mm) connected to aHewlett-Packard (model 1280c) pressure transducer. An electromagnetic cannulating flow probeinterposed in the perfusion line monitored coronary arterial flow (Statham 5 mm, model Sp2202).A clamp between flow probe and steel cannula could produce a large resistance on the perfusion linegiving the perfusion system the characteristics of a constant-flow source. The pressure proximal tothe resistance had to be increased to compensate for the pressure los over the resistance.The blood reservoir was equipped with a level controller (M.S.A. automatic suction control) with
feed-back to the roller pump which held the reservoir blood level constant.
Venous drainage systemBlood from the cannulated great cardiac vein drained into a similar pressure-controlled reservoir
(M.S.A.) via a 25 mm flow probe (Statham). Thheregult oflte venous pressure was adjustedso as to keep epicardial venous pressure, measured with the Herd-Barger catheter, as low as
300
) by guest on July 10, 2011jp.physoc.orgDownloaded from J Physiol (

CORONARY ADJUSTMENT TO A CHANGE INHEART RATE 301
possible. Venous blood was pumped back into the left jugular vein via a heat exchanger and filter(40 ,um Pall, type SQUOS).
Mea,9urement8Left ventricular, coronary arterial, coronary venous and epicardial venous pressure as well as,
coronary arterial and coronary venous flow were continuously recorded on a Hewlett-Packard FMinstrumentation recorder (HP 3968A) for analog back-up.A/D conversion was done on-line with an Olivetti M24 PC equipped with a Teckmarboard and
using the software package SALT (Fenster & Ford, 1985). Digitized data were stored on harddisc.Haemoglobin content, pH, and arterial and coronary sinus PO and PCO were measured every
30 min with an automated blood gas analyser (model ABLl, Radiometer). Arterial and coronaryvenous oxygen saturation were measured with a Hemoximeter (model OSM 2, Radiometer). Atleast twice during each protocol the perfusion line was clamped for more than 15 s to check the zeroof the arterial flowmeter, to measure the peak reactive hyperaemic flow at maximal vasodilatationand the pressure at zero flow (Pw). This pressure value was considered as the coronary wedgepressure (Spaan et at. 1981 a).
After vasodilatation with adenosine, the arterial perfusion line was clamped again for 15 s totest whether reactive hyperaemia was still present. The infusion rate of adenosine was increasedwhen necessary.At the end of the experiment the weight of the perfused tissue was measured by injection of a
mixture of gelatine and white paint (Latex) at 37 °C through the cannula into the left maincoronary artery. After cooling in the freezer for approximately half an hour the coloured tissuecould be dissected and weighed.
ProtocolThe heart rate was altered stepwise from 60 to 90 to 120 to 150 beats min-' and down again from
150 to 120 to 90 to 60 beats min-'. Each step was completed within one beat. Before each stepsteady state was waited for which was generally achieved within a few minutes. This protocol wasfollowed either with constant-flow or constant-pressure perfusion. Moreover, high and low levels ofcoronary arterial pressure were applied in both perfusion methods. These two levels of pressurewere approximately 80 and 120 mmHg at a heart rate of 90 beats min-'.The same heart rate steps were repeated after vasodilatation, but only at one level of coronary
arterial pressure in the case of constant pressure and one level of flow in the case of constant-flowperfusion. Coronary arterial pressure was set to approximately 50 mmHg with a heart rate of90 beats min-'.
Data analyse8All signals were digitized on-line at a sample rate of 80 Hz for 50 s starting 5 s before the step
change in heart rate (HR). The response of the coronary bed was analysed according to Belloni &Sparks (1977). Coronary arterial pressure and flow were averaged per beat. Then the coronarypressure-flow ratio (p/q) was calculated as the quotient of mean driving pressure and mean arterialflow. The means were calculated over each heart beat defined by the period in between the startof two diastoles. This start was defined by the moment left ventricular pressure fell below athreshold of 15 mmHg. Driving pressure was defined as the difference between coronary arterialpressure and wedge pressure. The wedge pressure is the coronary peripheral pressure after 10 s ofarterial occlusion. The coronary pressure-flow ratio only reflects resistance in the steady state orin conditions where flow and/or pressure vary slowly enough to neglect capacitance effects.The t50 values were defined as the time in seconds after the heart rate step at which the
pressure-flow ratio has changed 50 % of its total final change. This value was calculated by linearregression over a period of 10 s in the range around the 50% value of the pressure-flow ratio. Thisrange was delineated by eye on the computer screen.To compare the time course of the responses to the different interventions p/q was normalized.
For this, p/q was averaged over the first 5 s of control yielding (p/q)0, and over the last 5 s yielding(p/q),. The normalized response of the pressure-flow ratio was then given by:
(plq). (p/q) - (p/q) (6)=(p/q)1 - (p/q)0 6
) by guest on July 10, 2011jp.physoc.orgDownloaded from J Physiol (

J. DANKELMAN AND OTHERS
The normalized response varies from zero to unity regardless of intervention.The pressure-flow ratio and therefore the normalized response is not a continuous
variable (e.g. Fig. 4), but only known once every beat. In order to make averagingof normalized responses at different heart rates possible the following was done. It was assumedthat the pressure-flow ratio was defined at the beginning of a beat period. Then, this ratio wascalculated for the intermediate time at 0-0125 s intervals by linear interpolation. At these intervalsthe average response over all heart rates could be determined.An estimation of the intramyocardial blood volume change was determined from the digitized
flow signals as described before by Vergroesen et al. (1987 b). The intramyocardial volume changewas given by:
T(CAF-aCVF) dt, (7)
to
with CAF = coronary arterial flow,CVF = coronary venous flow,
to = time of HR step,T = time after HR step,a = correction factor, being the inverse of the fraction of the arterial inflow that is drained
by the great cardiac vein.The constant a was calculated over the initial 5 s by assuming the volume to be steady in the
steady state over this period:
I-(CAF-a CVF) dt = 0.0
Volume changes calculated from interventions with venous pressure above 6 mmHg were omittedfrom further analysis. Above this pressure value there is danger of changing the outflowdistribution of the coronary bed (Scharf, Bromberger-Barnea & Permutt, 1971; Vergroesen et al.1987b). In one of the seven goats it was not possible to cannulate the great cardiac vein.
Statistical significance was tested using Student's t test.
RESULTS
Typical recordings of experiments with constant-pressure and constant-flowperfusion are shown in Fig. 3. Note that the compression of the heart is manifest bya pulsatile arterial pressure at constant-flow perfusion but by a pulsatile flow atconstant-pressure perfusion (e.g. Spaan, Breuls & Laird, 1981 b). Heart rate wasdecreased from 120 to 90 beats min-' in both perfusion conditions at the momentsindicated by the arrows and vertical dashed lines. With constant-pressure perfusion(Fig. 3, left-hand panel) coronary flow decreased with heart rate as a consequenceof constriction due to metabolic adjustment. With constant-flow perfusion thisconstriction was measured as an increase in perfusion pressure (Fig. 3, right-handpanel). However, the normalized responses of the pressure-flow ratio increased fromzero to one, only after an initial fall as shown in Fig. 3. This dip in normalizedresponse was consistently found after a change in heart rate, either up or down. Thenoise on the response is due to the influence of the respirator. The sudden decreasein heart rate was accompanied by a rapid increase in intramyocardial volume (lowerpanels), being larger at constant-pressure than at constant-flow perfusion.
In Table 1 the perfusion pressure and coronary flow values for experiments withautoregulation under different perfusion conditions are given. It shows that averageperfusion pressure and flow values for the high-pressure, high-flow conditions,respectively, were in the same range.
302
) by guest on July 10, 2011jp.physoc.orgDownloaded from J Physiol (

CORONARY ADJUSTMENT TO A CHANGE INHEART RATE 303
00
t E
* (N
0ov0N
t
0.
- IUR
a),.E._
oC14 I
I0
___--- _C
L8so
-CZ X r,
0 r 0)
"E °- E
C - m C_
Co-cA-i6o- 0 3' UMo t- ° F:2 _
E -
8 0
--.1
C
0
4-ic
UA
U,
c0-
U)
C
Cu
CoCL0C)
r 0
1,
4
Ln I
6
i0
O
1r_
I
O-00 cS8
._-Cu
4-' -4~- Ca)4)-h >
2 UM
o O 3 0
o az ° EU)> ;W- _
E-
r
114
) by guest on July 10, 2011jp.physoc.orgDownloaded from J Physiol (

J. DANKELMAN AND OTHERS
Apart from a small divergence, the change in pressure-flow ratio due to an increasein heart rate is the mirror image of the response to a heart rate decrease including theinitial opposite reaction. Hence, normalization allows the averaging of responseswith heart rate decrease and increase. The normalized responses, regardless of thedirection of heart rate change, were grouped according to constant-flow andconstant-pressure perfusion and flow level in the former and pressure level in thelatter perfusion condition. The averaged responses of those four groups are depictedin Fig. 4. It is clear that the normalized responses changes more rapidly at constant-pressure perfusion than at constant-flow perfusion.
TABLE 1. Initial coronary arterial perfusion pressures (mmHg) and total coronary arterial flowvalues (ml s-' (100 g)-1). Mean+ S.E.M.
Perfusion pressure Arterial flow
HR up HR down HR up HR down
High-pressure perfusion 119-3 + 1-4 116-7 + 0 3 1-63 + 0-15 1-63 + 0-16Low-pressure perfusion 78-2 + 0-6 77-7 + 0-6 1-19 + 0 10 1-36+ 0 10High-flow perfusion 113-8+2-6 106-0+3-5 1-66+0-14 1-74+0-16Low-flow perfusion 76-4+ 3-5 67-7 + 2-3 1-37 + 0-15 1-35+ 0-16
Table 2 presents the t50 values of the pressure-flow ratio under different circum-stances. The ratio varies significantly faster with constant-pressure comparedto constant-flow perfusion. No significant difference is seen between the two levels inconstant-flow perfusion. However, at constant-pressure perfusion the pressure-flowratio response changes significantly faster at the lower perfusion pressure. For bothperfusion methods a difference in speed is seen depending on the direction of a HRchange. No significant differences were observed in the t50 values between heartrate steps with high heart rates (e.g. 120-150 beats min-') and low heart rates(e.g. 60-90 beats min-1).The calculated volume change in the case of constant-pressure perfusion was
0-31 +0-03 ml (100 g)-1 (mean±+s.E.M.) and in the case of constant-flow perfusion0 13+0-02 ml (100 g)-'. The difference is significant (P < 0-001).With vasodilatation, the pressure-flow ratio increased with a heart rate increase
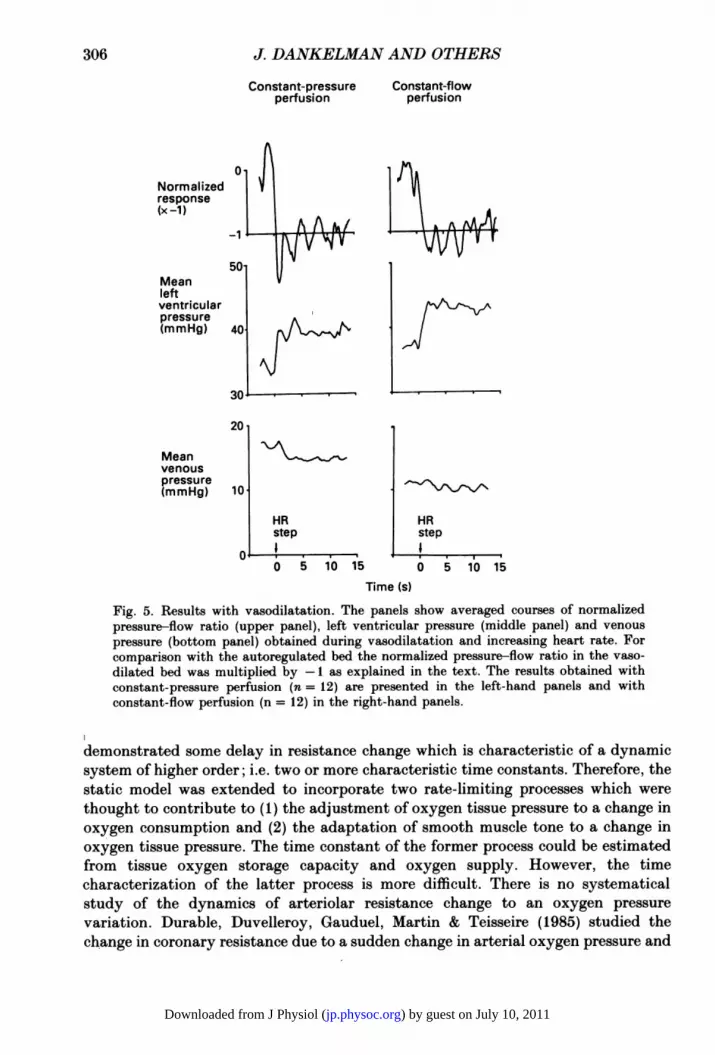
and decreased with a heart rate decrease. The average of the normalized responsesobtained with a heart rate increase at the two perfusion conditions is depicted inFig. 5. The averaged courses of mean left ventricular pressure and epicardial venouspressure are depicted as well. These two pressures were not normalized which is whythe figure is restricted to the heart rate increase. It was our aim to compare the initialnormalized response with autoregulation to the response with vasodilatation. Tofacilitate this comparison the normalized response of the pressure-flow ratiomultiplied by minus one is presented in Fig. 5. Initially the normalized responsesexceed their final value while mean left ventricular pressure exhibited a step change.Mean epicardial venous pressures were quite high (bottom panels). Due to the highflow rates epicardial venous pressure could not be maintained at such a low levelas was the case with autoregulation. With autoregulation, an epicardial venous
304
) by guest on July 10, 2011jp.physoc.orgDownloaded from J Physiol (

CORONARY ADJUSTMENT TO A CHANGE IN HEART RATE 305
Constant pressure Constant flow
All HR steps
HRstep
. Ni0 5 1V,715
Low flow
20 25 30 35 40Time (s)
Fig. 4. Summary of the dynamic change of normalized pressure-flow ratio as a resultof heart rate changes. Left-hand panels are results obtained with constant-perfusionpressure and right-hand panels with constant-flow perfusion. Upper panels show theaveraged results of all experiments with high pressure and high flow and bottom panelsshow averaged results obtained with low pressure and low flow. Numbers and t50 valuesrelated to these four panels are defined in Table 2.
TABLE 2. t5 values, the time in seconds after the heart rate step at which the coronary indexhas changed 50% of its final change (mean+s.E.M., n in parentheses)
Heart rate step Heart rate stepup down
High-pressure perfusionLow-pressure perfusionHigh-flow perfusionLow-flow perfusion
16-0+0-9 (25)13-4+0-9 (20)20-5+±11 (20)21-3+1±0 (17)
18-0+0-6 (19)15-3+0-8 (19)23-12+10 (19)24-2+1-3 (17)
pressure of 6 mmHg was used as a threshold above which data were not used forvolume change measurements.
DISCUSSION
In general the dynamic response of a control system provides information on thenature of the control mechanism over and above that obtained from static analysis.Therefore, we extended the theoretical and experimental study of the local controlof coronary flow to the situation of a sudden change in metabolism as induced by a
heart rate change. The design of the study developed departed from the staticoxygen model as published earlier by our group (Drake-Holland et al. 1984) and theexperimental results presented by Belloni & Sparks (1977). The latter study
a,U)
(nr- I..
'0
C, 0.
0
.,
'0.0= Ua a
E a,
o wz
0
z
o 3sn -0
N tn= 0M -
E Coz
1r
-1 L
) by guest on July 10, 2011jp.physoc.orgDownloaded from J Physiol (
J. DANKELMAN AND OTHERS
Constant-pressureperfusion
Normalizedresponse(x -1)
-1
Meanleftventricularpressure(mmHg)
HRstep
0 5 10 15
HRstep
0 5 10 15
Time (s)
Fig. 5. Results with vasodilatation. The panels show averaged courses of normalizedpressure-flow ratio (upper panel), left ventricular pressure (middle panel) and venous
pressure (bottom panel) obtained during vasodilatation and increasing heart rate. Forcomparison with the autoregulated bed the normalized pressure-flow ratio in the vaso-
dilated bed was multiplied by -1 as explained in the text. The results obtained withconstant-pressure perfusion (n= 12) are presented in the left-hand panels and withconstant-flow perfusion (n = 12) in the right-hand panels.
demonstrated some delay in resistance change which is characteristic of a dynamicsystem of higher order; i.e. two or more characteristic time constants. Therefore, thestatic model was extended to incorporate two rate-limiting processes which were
thought to contribute to (1) the adjustment of oxygen tissue pressure to a change inoxygen consumption and (2) the adaptation of smooth muscle tone to a change inoxygen tissue pressure. The time constant of the former process could be estimatedfrom tissue oxygen storage capacity and oxygen supply. However, the timecharacterization of the latter process is more difficult. There is no systematicalstudy of the dynamics of arteriolar resistance change to an oxygen pressure
variation. Durable, Duvelleroy, Gauduel, Martin & Teisseire (1985) studied thechange in coronary resistance due to a sudden change in arterial oxygen pressure and
Constant-flowperfusion
20
10
Meanvenouspressure(mmHg)
306
04
) by guest on July 10, 2011jp.physoc.orgDownloaded from J Physiol (

CORONARY ADJUSTMENT TO A CHANGE IN HEART RATE 307
found a rapid response, which was explained by a direct oxygen effect on arteriolarsmooth muscle tone. The reported time constant for this process was in between 9and 16 s. We had to choose 20 s for the second time constant in order to predict half-times of the responses found in our experiments. This discrepancy might be due tothe fact that the model does not include the effect of compression on the coronaryresistance. This point will be discussed in more detail below. However, the charac-teristic behaviour of the control model, i.e. the difference in constant-flow andconstant-pressure perfusion, is insensitive to the exact choice of the magnitude ofthe time constants.The difference between constant-pressure and constant-flow perfusion was studied,
because in the latter condition a part of the control loop was eliminated. Thecomparison of the coronary response to a heart rate change obtained under these twoconditions requires a single quantity of which the course can be predicted andmeasured in both conditions. We choose the ratio between pressure and flow. In ourmodel this ratio equals resistance, but this is not the case in our experiments, as willbe discussed below.The model predicted a linear response for the constant-flow perfusion meaning
that the course of change of the pressure-flow ratio is independent of the flow level.However, for constant-pressure perfusion the course of the response was predicted tobe non-linear, meaning that the course of the pressure-flow ratio depends on thelevel of pressure. Hence, the model analysis resulted in predictions verifiable byexperiments.
The course of the experimental pressure-flow ratioIn the model analysis pressure and flow were both non-pulsatile since the model
did not contain an element describing the compression of the coronary micro-circulation by cardiac contraction. We assumed that the ratio between pressureand flow, both averaged per beat, should reflect the pressure-flow ratio predicted bythe model. This pressure-flow ratio is not necessarily equal to coronary resistance.Because of compliance effects, the measured flow need not be determined solely bypressure and resistance but also by intramyocardial blood volume changes. Fromour measurements, one might conclude that these volume changes, and hencecompliance effects, are over in 2 s. However, even if compliance effects are over, thepressure-flow ratio need not be equal to coronary resistance. This depends on themodel one assumes for the interaction between coronary flow and compression bycardiac contraction (Klocke, Mates, Canty & Ellis, 1985; Spaan, 1985). Since thisstudy is primarily directed to the rate of coronary adjustment, this discussion is notof primary importance to this study. However, the initial inverse response of theexperimental pressure-flow ratio is due to this compression effect and will bediscussed in more detail below. Apart from this initial reversed response theexperimental outcome of the rate of change of the pressure-flow ratio confirmed thetheoretical predictions.The relation between pressure and flow in the coronary artery is not only
determined by the coronary system but also by the impedance of the perfusionsystem. Interpretation of the signals in terms of coronary properties alone becomesmore simple, if either flow or pressure is constant. In this respect our perfusion
) by guest on July 10, 2011jp.physoc.orgDownloaded from J Physiol (

J. DANKELMAN AND OTHERS
system was better suited to detect rapid changes in coronary input conditions thanthe one Belloni & Sparks (1977) used. In the experiments of Belloni and Sparks aperfusion system was used based on a constant-flow pump. In order to damp thepressure pulses caused by this pump, a windkessel was included in the perfusion line.However, this windkessel not only damped the pressure pulses originating from thepump but also the rapid changes in pressure caused by changes in the coronarysystem. The authors reported that the time constant of their perfusion system wasin order of 0 5 s. However, we suspect that this time constant was measured withoutthe load of the coronary system and hence with minimal resistance (R) in the RC timeconstant reported. The coronary arterial pressure signal is very pulsatile, whenperfusing the coronary artery at constant flow (see Fig. 4). The pressure tracepublished by Belloni and Sparks is quite flat which must be due to the magnitude ofthe windkessel. Hence, the perfusion system used by these authors provided neithera constant flow nor a constant pressure at the coronary input. The absence of aperfusion windkessel is the probable reason why our initial dip in the normalizedresponse is more pronounced when applying constant-flow perfusion as reported byBelloni & Sparks (1977).
In order to have some indication about the mechanical effects of the change inheart rate on the coronary vasculature, the change in intramyocardial blood volumewas estimated. The coronary system lacks a single outflow channel. Hence, it wasassumed that the course of total coronary venous outflow of the tissue perfused bythe left main coronary artery resembled that of the great cardiac vein. One of themain errors that may occur is that during the intervention the amount of blood thatis drained by the great cardiac vein is changing. This partition of venous blood hasbeen shown by Scharf et al. (1971) for venous pressures above 10 mmHg. We tried tominimize this effect by maintaining the epicardial venous pressure below 6 mmHg.This procedure was justified by a recent study of our group (Vergroesen et al. 1987 b).This condition could seldom be met when the coronary bed was dilated by adenosinedue to the high flow rates and venous cannula resistance.The major noise on the pressure-flow ratio signal was due to the effect of
respiration. Obviously, the effect of the respiration noise is more pronounced withsmaller changes in coronary resistance which is the case with vasodilatation. Theeffect of the noise on the estimate of t50 is minor as is illustrated by the small relativeerror in this quantity when determined from single responses obtained under equalcircumstances (Table 2). The effect of the noise on the normalized response could bereduced by averaging responses obtained under equal conditions. This averaging isespecially of importance in eliciting the initial dip.
In theory it is possible that the changes in pressure-flow ratio are not only due tothe dynamics of the coronary flow regulation but also indirectly due to changes in thesystemic circulation. If the load of the left ventricle varies slowly due to reflexes fromthe systemic circulation, the pressure-flow ratio might change in a continuousresponse to this. The only way in the present protocol to assess whether this was thecase was the evaluation of the transients in mean left ventricular pressure and/ormean aortic pressure. These quantities were constant after 2 s. Hence, it is unlikelythat the long time constants determined for the change in pressure-flow ratio are dueto indirect effects.
308
) by guest on July 10, 2011jp.physoc.orgDownloaded from J Physiol (
CORONARY ADJUSTMENT TO A CHANGE INHEART RATE 309
Pressure-flow ratio and arteriolar resistance
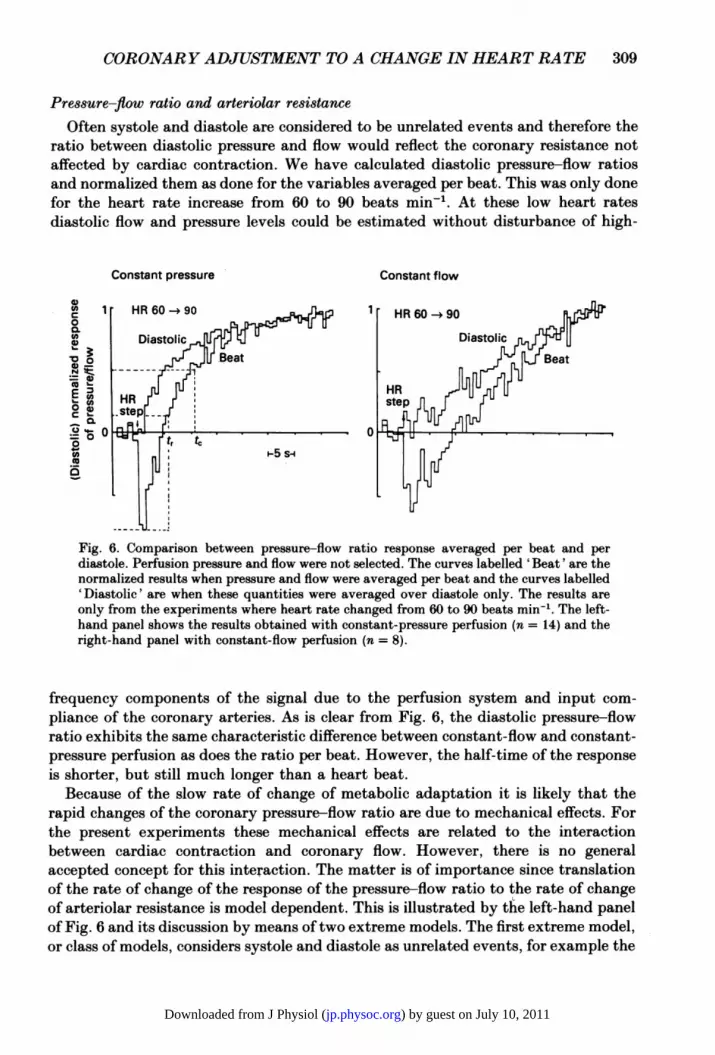
Often systole and diastole are considered to be unrelated events and therefore theratio between diastolic pressure and flow would reflect the coronary resistance notaffected by cardiac contraction. We have calculated diastolic pressure-flow ratiosand normalized them as done for the variables averaged per beat. This was only donefor the heart rate increase from 60 to 90 beats min-'. At these low heart ratesdiastolic flow and pressure levels could be estimated without disturbance of high-
Constant pressure Constant flow
1 HR 60 90 HR60-+900
CDsDiastolic'o0..eat ~~~~~~~~~~~~~~~eat
C')
rihthad pane wthcosatfw pefuio (n=)Fig. 6. Comparison between pressure-flow ratio response averaged per beat and perdiastole. Perfusion pressure and flow were not selected. The curves labelled 'Beat' are thenormalized results when pressure and flow were averaged per beat and the curves labelled'Diastolic' are when these quantities were averaged over diastole only. The results areonly from the experiments where heart rate changed from 60 to 90 beats min-. The left-hand panel shows the results obtained with constant-pressure perfusion (n = 14) and theright-hand panel with constant-flow perfusion (n = 8).
frequency components of the signal due to the perfusion system and input com-
pliance of the coronary arteries. As is clear from Fig. 6, the diastolic pressure-flowratio exhibits the same characteristic difference between constant-flow and constant-pressure perfusion as does the ratio per beat. However, the half-time of the responseis shorter, but still much longer than a heart beat.
Because of the slow rate of change of metabolic adaptation it is likely that therapid changes of the coronary pressure-flow ratio are due to mechanical effects. Forthe present experiments these mechanical effects are related to the interactionbetween cardiac contraction and coronary flow. However, there is no generalaccepted concept for this interaction. The matter is of importance since translationof the rate of change of the response of the pressure-flow ratio to the rate of changeof arteriolar resistance is model dependent. This is illustrated by the left-hand panelof Fig. 6 and its discussion by means of two extreme models. The first extreme model,or class of models, considers systole and diastole as unrelated events, for example the
) by guest on July 10, 2011jp.physoc.orgDownloaded from J Physiol (
J. DANKELMAN AND OTHERS
waterfall model (Downey & Kirk, 1975) or the extravascular resistance model. Therate of change of resistance should then be measured with reference to the lowestvalue of the response. The half-time (tr) is then equal to 7 s in this particular case.The other extreme model is the linear intramyocardial pump model (Spaan et al.1981 a). The dip is caused by a sudden change in compression due to the change inheart rate. This change in compression is a transient effect, over in one or twoseconds, and the rate of change of pressure-flow ratio after this time equals the rateof change of arteriolar resistance. The half-time (t,) is then equal to 12 s.From our data it can be concluded that neither model is correct. Our volume
change measurements show that compliance effects are over in two seconds but thatthe response is still negative. This is incompatible with the pure compliance model.On the other hand, the models in which systole and diastole are unrelated eventspredict that the pressure-flow ratio in the dilated situation should change with heartrate according to the change in mean left ventricular pressure signal. As is clear fromFig. 5, this is not the case. The pressure-flow ratio exhibits an overshoot and theventricular pressure signal does not.We have evaluated the significance of different more sophisticated models on the
contraction-flow interaction presented more recently (Arts, 1978; Lee, Chambers,Akizuki & Downey, 1984; Bruinsma, Arts & Spaan, 1985; Spaan, Dankelman &Vergroesen, 1986). Each of the models is able to predict to some extent thecharacteristics of the normalized response and, hence, we could not discriminatebetween them. Therefore, presenting the model results in the context of this paperwould not be very useful and is therefore omitted. However, it should be noted thatthe prediction of rate of change of arteriolar resistance from our data by these modelsremained in the same range as discussed above.Rapid changes of coronary vascular tone have been reported by Schwartz, MeHale
& Greenfield (1982). These authors show coronary vasodilatation after a singleventricular extra activation within one heart beat. However, the coronary vascularresponse was analysed by a diastolic index, being simply the relation betweendiastolic pressure and flow as was done in Fig. 6. Since coronary arterial pressure wasnot maintained constant, it is very well possible that the change in diastolic indexwas induced by the concomitant change in aortic pressure. Some studies report arapid vasoconstriction during long diastoles (Klocke, Weinstein, Klocke, Ellis,Kraurs, Mates, Canty, Anbar, Romanowski, Wallmeyer & Echt, 1981; Spaan &Laird, 1981; Eng, Jentzer & Kirk, 1982) with a t50Of 4-5 s while some other studiesreport that coronary flow remained constant during a prolonged diastole for as longas 5 s (Dole & Bishop, 1982a, b). It is very likely that this discrepancy is due todifferent mechanical conditions during the experiments and the lack of the propermodel for the interpretation of the results.
It is tempting to relate the compression-induced changes in the pressure-flow ratioquantitatively in the cases with and without regulation. However, such a comparisonwould require similar haemodynamic conditions as for example perfusion pressureand flow. It is hardly possible to study experimentally the compression effect in thefully dilated coronary bed and autoregulated coronary bed at the same combinationsof pressure and flow levels. In the first place, with autoregulation the flow dis-tribution is about even, but quite uneven in the fully dilated bed. Moreover, with
310
) by guest on July 10, 2011jp.physoc.orgDownloaded from J Physiol (
CORONARYADJUSTMENTTOA CHANGEINHEARTRATE 311
vasodilatation and at a perfusion pressure of 50 mmHg coronary flow was in ourexperiments three times higher than with regulation at the same perfusion pressure.Lowering perfusion pressure in the vasodilated bed to match at least the flow withinthe autoregulated bed at higher perfusion pressure would certainly have resulted insubendocardial ischaemia (Rouleau, Boerboom, Surjadhana & Hoffman, 1979).Hence, the results with vasodilatation do show that a change in heart rate has asteady-state mechanical effect on coronary resistance apart from the effect viacontrol of smooth muscle tone and compliance. However, more quantitative con-clusions require a sophisticated model accounting for the non-linear effects. Sucha model is not available at present.
REFERENCES
ARTS, M. G. J. (1978). A mathematical model of the dynamics of the left ventricle and the coronarycirculation. Ph. D. thesis, R. U. Limburg, Maastricht, The Netherlands.
BELLONI, F. L. & SPARKS, H. V. (1977). Dynamics of myocardial oxygen consumption andcoronary vascular resistance. American Journal of Physiology 233 (1), H34-43.
BRUINSMA, P., ARTS, T. & SPAAN, J. A. E. (1985). Coronary pressure flow characteristics in relationto the distensibility of the microvessels. Medical and Biological Engineering and Computing 23,suppl. 2, 1325-1326.
CHILIAN, W. M. & MARCUS, M. L. (1984). Coronary venous outflow persists after cessation ofcoronary arterial inflow. American Journal of Physiology 247, H984-990.
DOLE, W. P. & BISHOP, V. S. (1982a). Influence of autoregulation and capacitance on diastoliccoronary artery pressure-flow relationships in the dog. Circulation Research 51, 261-270.
DOLE, W. P. & BISHOP, V. S. (1982b). Regulation of coronary blood flow during individualdiastoles in the dog. Circulation Research 50, 377-385.
DOLE, W. P. & NUNO, D. W. (1986). Myocardial oxygen tension determines the degree and pressurerange of coronary autoregulation. Circulation Research 59, 202-215.
DOWNEY, J. M. & KIRK, E. S. (1975). Inhibition of coronary blood flow by a vascular waterfallmechanism. Circulation Research 36, 753-760.
DRAKE-HOLLAND, A. J., LAIRD, J. D., NOBLE, M. I. M., SPAAN, J. A. E. & VERGROESEN, I. (1984).Oxygen and coronary vascular resistance during autoregulation and metabolic vasodilation inthe dog. Journal of Physiology 348, 285-299.
DURUBLE, M., DUVELLEROY, M., GAUDUEL, Y., MARTIN, J. L. & TEISSEIRE, B. (1985). Transientresponses of coronary flow in the blood-perfused isolated rat heart submitted to changes inoxygen content. Journal of Physiology 358, 321-334.
ENG, C., JENTZER, J. H. & KIRK, E. S. (1982). The effects of the coronary capacitance on theinterpretation of diastolic pressure-flow relationships. Circulation Research 50, 334-341.
FENSTER, S. D. & FORD, L. E. (1985). SALT. Byte, 147-164.KAJIYA, F. (1985 a). Evaluation of coronary inflow and outflow from myocardium by laser doppler
method. Medical and Biological Engineering and Computing 23, suppl. 2, 1315-1316.KAJIYA, F., TSUJIOKA, K., GOTO, M., WADA, Y., TADAOKA, S., NAKAI, M., HIRAMATSU, O.,OGASAWARA, Y. & MITO, K. (I1985 b). Evaluation of phasic blood flow velocity of the great cardiacvein by a laser doppler method. Heart and Vessels 1, 16-23.
KLOCKE, F. J., MATES, R. E., CANTY, J. M. & ELLIS, A. K. (1985). Coronary pressure-flowrelationships. Controversial issues and probable implications. Circulation Research 56, 310-323.
KLOCKE, F. J., WEINSTEIN, I. R., KLOCKE, J. F., ELLIS; A. K., KRAURS, D. R., MATES, R. E.,CANTY, J. M., ANBAR, R. D., ROMANOWSKI, R. R., WALLMEYER, K. W. & ECHT, M. P. (1981).Zero-flow pressure and pressure-flow relationship during single long diastoles in the caninecoronary bed before and during maximum vasodilation. Journal of Clinical Investigations68, 970-980.
LAIRD, J. D. (1983). Cardiac metabolism and the control of coronary blood flow. In CardiacMetabolism, ed. DRAKE-HOLLAND, A. J. & NOBLE, M. I. M., pp. 257-279. New York: Wiley.
LAIRD, J. D. & SPAAN, J. A. E. (1981). A simple computer model of coronary flow regulation basedon interstitial oxygen tension. Journal of Physiology 324, 1P.
) by guest on July 10, 2011jp.physoc.orgDownloaded from J Physiol (

J. DANKELMAN AND OTHERS
LEE, J., CHAMBERS, D. E., AKIZUKI, S. & DOWNEY, J. M. (1984). The role of vascular capacitancein the coronary arteries. Circulation Research 55, 751-762.
ROULEAU, J., BOERBOOM, L. E., SURJADHANA, A. & HOFFMAN, J. I. E. (1979). The role ofautoregulation and tissue diastolic pressures in the transmural distribution of left ventricularblood flow in anesthetized dogs. Circulation Research 45, 804-815.
SCHARF, S. M., BROMBERGER-BARNEA, B. & PERMUTT, S. (1971). Distribution of coronary venousflow. Journal of Applied Physiology 30, 657-662.
SCHWARTZ, G. G., MCHALE, P. A. & GREENFIELD JR, J. C. (1982). Coronary vasodilation after asingle ventricular extra-activation in the conscious dog. Circulation Research 50, 38-46.
SPAAN, J. A. E. (1985). Coronary diastolic pressure-flow relation and zero flow pressure explainedon the basis of intramyocardial compliance. Circulation Research 56, 293-309.
SPAAN, J. A. E., BREULS, N. P. W. & LAIRD, J. D. (1981a). Diastolic-systolic coronary flowdifference are caused by intramyocardial pump action in the anesthetized dog. CirculationResearch 49, 584-593.
SPAAN, J. A. E., BREULS, N. P. W. & LAIRD, J. D. (1981 b). Forward coronary flow normally seenin systole is the result of both forward and concealed back flow. Basic Research in Cardiology 76,582-586.
SPAAN, J. A. E., DANKELMAN, J. & VERGROESEN, I. (1986). Coronary circulation dynamics.Proceedings of the IEEE in Medicine and Biology 1, 191-195.
SPAAN, J. A. E. & LAIRD, J. D. (1981). Coronary vasoconstriction in long diastoles. Circulation 64,suppl. IV, p. 39.
STEINER, C. & KOVALIK, A. T. (1968). A simple technique for production of chronic completeheartblock in dog. Journal of Applied Physiology 25, 631-632.
VERGROESEN, I., NOBLE, M. I. M., WIERINGA, P. A. & SPAAN, J. A. E. (1987a). Quantification of02 consumption and arterial pressure as independent determinants of coronary flow. AmericanJournal of Physiology 252, H545-553.
VERGROESEN, I., NOBLE, M. I. M. & SPAAN, J. A. E. (1987b). Intramyocardial blood volumechange in the first moment of cardiac arrest in the anesthetised dog. American Journal ofPhysiology 253, H307-316.
312
) by guest on July 10, 2011jp.physoc.orgDownloaded from J Physiol (