Modeling suspended sediment sources and transport in the Ishikari River Basin using SPARROW

Article
Volume 12, Number 3
26 March 2011
Q03008, doi:10.1029/2010GC003380
ISSN: 1525‐2027
Grain size control of river suspended sediment geochemistry:Clues from Amazon River depth profiles
Julien Bouchez and Jérôme GaillardetInstitut de Physique du Globe de Paris‐Sorbonne Paris Cité, Université Paris Diderot, UMR 7154,1 rue Jussieu, F‐75238 Paris CEDEX 05, France ([email protected])
Christian France‐LanordCentre de Recherches Pétrographiques et Geochimiques‐Centre National pour la Recherche Scientifique,15 rue Notre‐Dame‐des‐Pauvres, F‐54501 Vandoeuvre‐lès Nancy, France
Laurence Maurice and Poliana Dutra‐MaiaLaboratoire des Mécanismes de Transfert en Géologie‐Institut de Recherche pour le Developpement,14 Avenue Edouard Belin, F‐31400 Toulouse, France
[1] Residual solid products of erosion display a wide range of size, density, shape, mineralogy, and chemicalcomposition and are hydrodynamically sorted in large river channels during their transport. We characterizethe chemical and isotopic variability of river sediments of the Amazon Basin, collected at different waterdepths, as a function of grain size. Absolute chemical concentrations and Sr and Nd isotopic ratios greatlyvaries along channel depth. The Al/Si ratio, tightly linked to grain size distribution, systematically decreaseswith depth, mostly reflecting dilution by quartz minerals. A double‐normalization diagram is proposed tocorrect from dilution effects. Elements define fan‐shaped patterns and can be classified in three differentgroups with respect to hydrodynamic sorting during transport in the Amazon: (1) “poorly sorted” insolubleelements like Al, Fe, Th, and REEs, (2) “well‐sorted” insoluble elements like Zr and Ti, mainly carried byheavy minerals, and (3) alkali (Na to Cs) and alkali‐earth elements (Mg to Ba), for which a large variety ofpatterns is observed, related, for alkali, to their variable affinity for phyllosilicates. Sr isotopes show thatthe Amazon River at the mouth is stratified, the Madeira‐ and Solimões‐derived sediments being preferen-tially transported near the channel surface and at depth, respectively. The comparison between the Solimõesand Madeira rivers shows how the interplay between grain sorting, weathering, and crustal compositioncontrols the composition of the suspended river sediments.
Components: 23,300 words, 9 figures, 3 tables.
Keywords: Amazon River; suspended sediments; hydrodynamic sorting; depth profiles; grain size.
Index Terms: 1030 Geochemistry: Geochemical cycles (0330); 1051 Geochemistry: Sedimentary geochemistry; 1862Hydrology: Sediment transport (4558).
Received 6 October 2010; Revised 5 January 2011; Accepted 13 January 2011; Published 26 March 2011.
Bouchez, J., J. Gaillardet, C. France‐Lanord, L. Maurice, and P. Dutra‐Maia (2011), Grain size control of river suspendedsediment geochemistry: Clues from Amazon River depth profiles, Geochem. Geophys. Geosyst., 12, Q03008,doi:10.1029/2010GC003380.
Copyright 2011 by the American Geophysical Union 1 of 24

1. Introduction
[2] Erosion and weathering reactions are key geo-logical processes, through which the chemical ele-ments present in the continental rocks are distributedamongst river solutes, colloidal material, suspendedsediments, bed sediments, gravels and boulders.Despite the relatively small number of studies thatinvestigated the chemical composition of largeriver suspended sediments [Martin and Meybeck,1979; Gaillardet et al., 1999; Viers et al., 2009,and references therein], the available data show agreat variability with climatic, geomorphic and tec-tonic settings, suggesting that the solid materialtransported by rivers contains important informationon chemical weathering. So far, river suspendedsediments have been used (1) to characterize theweathering intensity at the scale of the drainagebasin using the most soluble elements (mainlyalkali and alkali‐earth elements) [e.g., Canfield,1997; Gaillardet et al., 1999], (2) to integrate thechemical and isotopic composition of the drainedportion of upper continental crust and constrain itshistory, using the most insoluble elements (i.e., notpartitioned between dissolved and particulatephase and concentrated in the latter) [Dupré et al.,1996; Louvat and Allègre, 1997], or Nd and Pbisotopes [Goldstein and Jacobsen, 1988; Allègreet al., 1996; Millot et al., 2004], (3) to detectanthropogenic contamination for metals [Meybeckand Ragu, 1996; Chen et al., 2009], (4) to estimatethe flux of particulate organic carbon that is deliv-ered to the sea [France‐Lanord and Derry, 1997;Galy et al., 2007; Hilton et al., 2008], and (5) toestimate the residence time of particles in drainagebasins, based on U series disequilibria [Vigier et al.,2001; Dosseto et al., 2006; Granet et al., 2007].
[3] Most of these studies rely on suspended sed-iment samples taken at the surface of the riverchannel, at one single sampling time. However,river suspended sediment concentration and grainsize distribution vary as a function of samplingdepth, because of hydrodynamic sorting of particles[Bouchez et al., 2010a], which likely results in achemical variability of the suspended load overdepth [Galy et al., 2008; Garzanti et al., 2010a].Time series of river suspended sediment chemistryclearly demonstrate that the chemical and isotopiccomposition of sediments varies throughout thehydrological cycle [e.g.,Viers et al., 2008]. Changingriver flow conditions throughout the hydrologicalcycle influences the particles sorting process, whichcan explain some of the temporal variability of
chemistry observed in river surface suspendedsediments.
[4] In this paper, we investigate the chemical andisotopic effects of hydrodynamic sorting within theriver water column in the Amazon River and itstwo main Andean tributaries, the Solimões andMadeira rivers. The aim of our approach is toestablish distributions of elements as a function ofgrain size in the largest river system of the worldin order to capture the geochemical behavior ofelements with respect to sorting processes at alarge scale. Although mineralogical compositionlinks grain size distribution of sediments to theirchemical composition [Garzanti et al., 2010a],this contribution is not a mineralogical study butrather addresses the global behavior of elementsregarding a geological process from a geochemi-cal perspective (e.g., similarly to what was donefor partial melting) [Hofmann, 1988].
[5] The Amazon is the appropriate river system totest the effects of hydrodynamic sorting onto thesuspended load geochemistry. The Amazon is thelargest river of the world in terms of water dis-charge (200,000 m3.s!1) [Molinier et al., 1996] anddrainage area (6.4 million km2). The flux of solidsdischarged to the ocean by the Amazon is between500 and 1200 MT.yr!1 [Meade et al., 1979; Dunneet al., 1998; Maurice‐Bourgoin et al., 2007]. It istherefore a significant geological operator at theglobal scale. Finally, at the mouth, the AmazonRiver is a several kilometers wide, more than 50 mdeep channel, allowing for a strong potential hydro-dynamic differentiation of particles along the watercolumn [Bouchez et al., 2010a]. River sedimentsamples were collected along depth profiles of theSolimões, Madeira and Amazon mainstreams, andcharacterized for chemical and isotopic (Sr and Nd)composition. These rivers show a clear chemical andisotopic stratification. The variation in elementconcentrations can be related to the grain size dis-tribution of the transported material, hence to hydro-dynamics. Chemical variations are partly caused by adilution effect by quartz. The use of normalizationdiagrams allows us to show that dilution by quartzis not the sole process and that elements can beclassified into different groups reflecting their geo-chemical properties during chemical weatheringand transport in the Amazon Basin. The behaviorof alkali elements (from Na to Cs) is of particularinterest since they show a gradual depletion/enrichment pattern in the finest fractions from lowto high atomic masses. Finally, the comparisonbetween the Solimões and the Madeira basins
GeochemistryGeophysicsGeosystems G3G3 BOUCHEZ ET AL.: RIVER SEDIMENTS GRAIN SIZE AND CHEMISTRY 10.1029/2010GC003380
2 of 24
provides insights into the relationships betweenweathering, sorting and crustal composition.
2. Settings, Sampling, and AnalyticalMethods
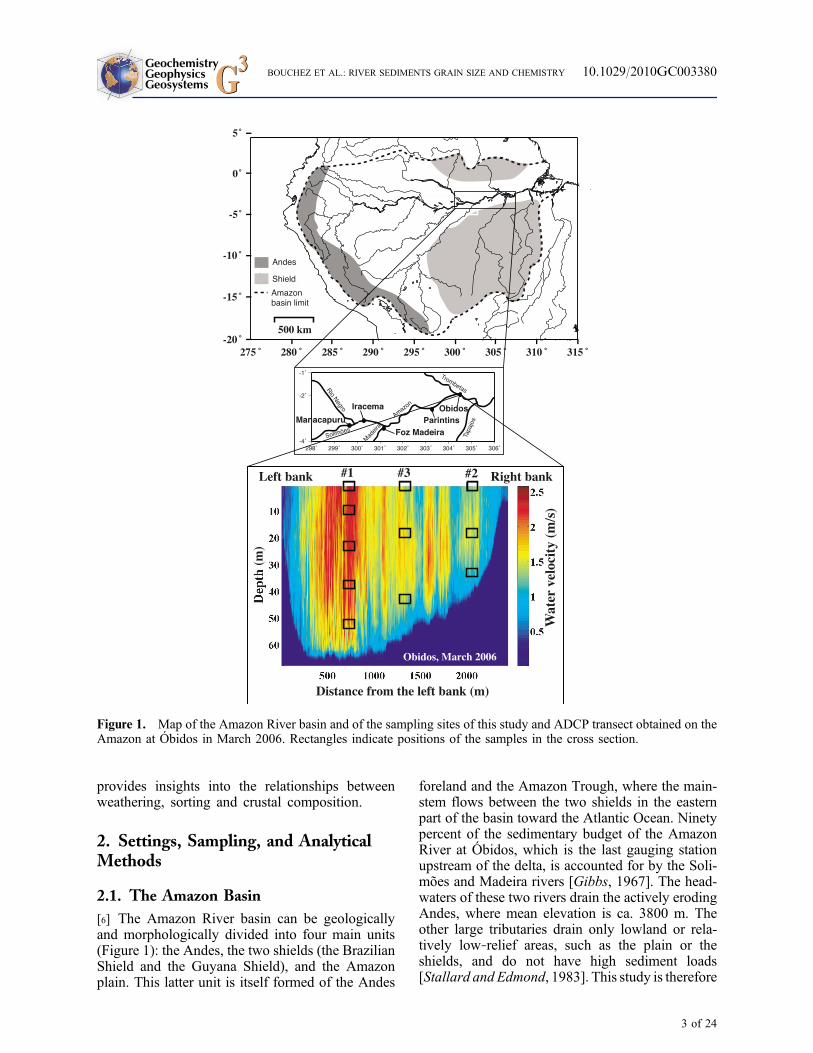
2.1. The Amazon Basin[6] The Amazon River basin can be geologicallyand morphologically divided into four main units(Figure 1): the Andes, the two shields (the BrazilianShield and the Guyana Shield), and the Amazonplain. This latter unit is itself formed of the Andes
foreland and the Amazon Trough, where the main-stem flows between the two shields in the easternpart of the basin toward the Atlantic Ocean. Ninetypercent of the sedimentary budget of the AmazonRiver at Óbidos, which is the last gauging stationupstream of the delta, is accounted for by the Soli-mões and Madeira rivers [Gibbs, 1967]. The head-waters of these two rivers drain the actively erodingAndes, where mean elevation is ca. 3800 m. Theother large tributaries drain only lowland or rela-tively low‐relief areas, such as the plain or theshields, and do not have high sediment loads[Stallard and Edmond, 1983]. This study is therefore
Figure 1. Map of the Amazon River basin and of the sampling sites of this study and ADCP transect obtained on theAmazon at Óbidos in March 2006. Rectangles indicate positions of the samples in the cross section.
GeochemistryGeophysicsGeosystems G3G3 BOUCHEZ ET AL.: RIVER SEDIMENTS GRAIN SIZE AND CHEMISTRY 10.1029/2010GC003380
3 of 24

focused onto the Amazon mainstem and the Soli-mões and the Madeira rivers. The Madeira RiverAndean tributaries mainly drain Ordovician‐Silurianshales in the Central Cordillera and Cretaceousto early Cenozoic terrigenous sediments whileflowing through the fold‐and‐thrust belt [Putzer,1984]. These sedimentary units are thought to ulti-mately derive from the erosion and weathering ofthe Brazilian craton [Basu et al., 1990]. In additionto similar old sedimentary terranes (Paleozoic toCenozoic shales and carbonates), the SolimõesRiver basin incorporates a relatively recent compo-nent of subduction arc plutonic and volcanic rocks(Cenozoic to present) [Basu et al., 1990]. In bothbasins, the lowland rivers drain Tertiary to modernfluviolacustrine sediments, with a contribution ofthe Precambrian granulites of the Brazilian Shieldin the Madeira lowland basin. The differencesbetween these two basins will allow us to examinethe importance of bedrock composition in the sortingprocesses affecting river sediments. The Amazonriver system was sampled at five sites (Figure 1), inJune 2005 and in March 2006: (1) at the mouth ofthe Solimões River, near the town of Manacapuru,(2) downstream from the Solimões‐Negro conflu-ence, near the town of Iracema, (3) at the mouthof the Madeira River, (4) downstream from theAmazon‐Madeira confluence, near the town ofParintins, and (5) on the Amazon River near thetown of Óbidos.
2.2. Sample Collection[7] At each sampling location, Acoustic DopplerCurrent Profiler (ADCP, RD Instruments, frequency600 kHz) [Filizola and Guyot, 2004] transects wereconducted to obtain accurate water velocity profiles,river bottom depth measurements, and water dis-charge (Figure 1). Then, one to four vertical profilesof the river water column were sampled, distributedover the river cross section. Each of these verticalprofiles consisted in two to five samples, distributedonto the vertical profile, from the top to the bottomof the river channel. Approximately 8 liters of riversamples were taken by submerging a point‐sedimentsampler (HyBAmProject, http://www.ore‐hybam.org)down to the desired sampling depth. UnderpressureTeflon filtration units (PSE filter sheets, 0.22 mm)were used to filter the river water. Membranes wererinsed with a limited amount of filtered water. Allsuspended matter was removed from the filtermembranes and then stored into tainted borosilicateglass bottles. In the lab, the bottles were decantatedduring several days, the supernatant pipetted out,and the remaining sediments dried at 50°C. Bed
sediments were also dredged from the bottom ofthe river, stored in plastic bags and dried in the labat 50°C. The sediments were finally transferred in amortar and weighed. Fifty milligrams were keptaside for size distribution analysis, and the remain-ing sediments were finely crushed for mineralogical,chemical and isotopic analysis. Suspended matterconcentrations were obtained by dividing the weightof recovered sediment from the filter sheet by theweight of recovered water from the sampler. Theestimated relative uncertainty on SPM concentrationsis 10%.
2.3. Analytical Methods[8] Samples, along with their main characteristicsand analytical results are listed in Table 1. Non-crushed aliquots of dried sediments were dispersedinto distilled water using ultrasonication, and sizedistribution analyses were made using a MalvernMastersizer laser diffraction granulometer, at theLaboratoire d’Environnement et de Minéralurgie(LEM, Nancy, France). Relative standard deviationon the modal size of repeated analysis of the samesamples allowed us to estimate an analytical repro-ducibility of 10% for the grain size distributionanalysis. Major, minor and trace element con-centrations in suspended sediments were measuredat the Service d’Analyse des Roches et Minéraux(SARM, INSU facility, Vandoeuvre‐ls‐Nancy,France, analytical details available on http://helium.crpg.cnrs‐nancy.fr/SARM), by ICP‐OES and ICP‐MS, after alkali fusion. Uncertainties were lowerthan 3% for major elements, and lower than 10% forminor and trace elements. XRD data were obtainedon a CuK‐a diffractometer (Rigaku) at the ÉcoleNormale Supérieure, Paris, France, using powderedaliquots. For isotopic analysis, ca. 50 mg of driedpowder were digested into a concentratedHF‐HNO3mixture in Teflon bombs at 120°C. The resultingsolution was evaporated to dryness, and the residuewas dissolved in a H3BO3‐HNO3 mixture. Afterappropriate dilution, a few milliliters of the solutionwere loaded onto a Sr‐SPEC (Eichrom) resin chro-matography column to separate ca. 300 ng of Sr[Birck, 1986]. Sr was then loaded onto a Re filamentwith a Ta‐oxide activator and measured on a MC‐TIMS Triton (Thermo Electron) at the Institut dePhysique du Globe de Paris, in dynamic mode, withtypical signals of 3.5 V on mass 88 (1011 W). Massdiscrimination was corrected using the invariantratio 88Sr/86Sr (0.1194). Accuracy and reproduc-ibility were tested through repeated analysis of theNBS standard SRM 987, that yielded a 87Sr/86Srvalue of 0.71024, with an external reproducibility
GeochemistryGeophysicsGeosystems G3G3 BOUCHEZ ET AL.: RIVER SEDIMENTS GRAIN SIZE AND CHEMISTRY 10.1029/2010GC003380
4 of 24

Table 1. Sample List, Main Characteristics, and Chemical Composition in ppma
Sample Stream Site Date
SectionWidth(m)
Discharge(m3/s) Profile
Distance FromLeft Bank
(m) Longitude Latitude
SamplingDepth(m)
SPM(mg/L) D90
Al/Si(mm)
AM‐05‐01 Solimões Manacapuru 6/4/2005 3200 124,700 1 800 60°33′13.8″ 03°18′51.0″ 24 95.7 73 0.292AM‐05‐02 Solimões Manacapuru 6/4/2005 3200 124,700 1 800 60°33′13.8″ 03°18′51.0″ 12 92.3 65 0.327AM‐05‐03 Solimões Manacapuru 6/4/2005 3200 124,700 1 800 60°33′13.8″ 03°18′51.0″ 4 76.4 58 0.334AM‐05‐04 Solimões Manacapuru 6/4/2005 3200 124,700 2 1600 60°32′58.0″ 03°19′28.9″ 28 282.5 199 0.217AM‐05‐05 Solimões Manacapuru 6/4/2005 3200 124,700 2 1600 60°32′58.0″ 03°19′28.9″ 21 197.4 316 0.239AM‐05‐06 Solimões Manacapuru 6/4/2005 3200 124,700 2 1600 60°32′58.0″ 03°19′28.9″ 14 136.5 122 0.289AM‐05‐07 Solimões Manacapuru 6/4/2005 3200 124,700 2 1600 60°32′58.0″ 03°19′28.9″ 7 139.7 100 0.304AM‐05‐08 Solimões Manacapuru 6/4/2005 3200 124,700 2 1600 60°32′58.0″ 03°19′28.9″ 2 135.1 105 0.290AM‐05‐10 Solimões Manacapuru 6/4/2005 3200 124,700 Bedload 522 0.079AM‐05‐11 Amazon Iracema 6/5/2005 1900 163,300 1 480 58°49′44.4″ 03°19′33.9″ 45 228.4 117 0.266AM‐05‐12 Amazon Iracema 6/5/2005 1900 163,300 1 480 58°49′44.4″ 03°19′33.9″ 30 140.7 77 0.294AM‐05‐13 Amazon Iracema 6/5/2005 1900 163,300 1 480 58°49′44.4″ 03°19′33.9″ 15 127.3 84 0.311AM‐05‐14 Amazon Iracema 6/5/2005 1900 163,300 1 480 58°49′44.4″ 03°19′33.9″ 3 46.0 69 0.373AM‐05‐15 Madeira Foz Madeira 6/6/2005 1650 21,800 1 440 58°48′30.1″ 03°27′00.9″ 23 94.3 78 0.382AM‐05‐16 Madeira Foz Madeira 6/6/2005 1650 21,800 1 440 58°48′30.1″ 03°27′00.9″ 18 85.5 49 0.392AM‐05‐17 Madeira Foz Madeira 6/6/2005 1650 21,800 1 440 58°48′30.1″ 03°27′00.9″ 12 74.0 31 0.405AM‐05‐18 Madeira Foz Madeira 6/6/2005 1650 21,800 1 440 58°48′30.1″ 03°27′00.9″ 8 61.1 32 0.437AM‐05‐19 Madeira Foz Madeira 6/6/2005 1650 21,800 1 440 58°48′30.1″ 03°27′00.9″ 3 49.1 36 0.456AM‐05‐20 Madeira Foz Madeira 6/6/2005 1650 21,800 Bedload 363 0.090AM‐05‐21 Madeira Foz Madeira 6/6/2005 1650 21,800 2 1450 58°47′57.9″ 03°27′22.5″ 21 100.7 30 0.405AM‐05‐22 Madeira Foz Madeira 6/6/2005 1650 21,800 2 1450 58°47′57.9″ 03°27′22.5″ 15 87.7 32 0.389AM‐05‐23 Madeira Foz Madeira 6/6/2005 1650 21,800 2 1450 58°47′57.9″ 03°27′22.5″ 3 71.0 29 0.431AM‐05‐24 Madeira Foz Madeira 6/6/2005 1650 21,800 Bedload 115 0.228AM‐05‐26 Amazon Parintins 6/7/2005 3150 192,600 1 3000 56°35′58.1″ 02°39′40.3″ 60 92.6 89 0.279AM‐05‐27 Amazon Parintins 6/7/2005 3150 192,600 1 3000 56°35′58.1″ 02°39′40.3″ 50 142.3 100 0.268AM‐05‐28 Amazon Parintins 6/7/2005 3150 192,600 1 3000 56°35′58.1″ 02°39′40.3″ 30 144.9 87 0.273AM‐05‐29 Amazon Parintins 6/7/2005 3150 192,600 1 3000 56°35′58.1″ 02°39′40.3″ 10 67.5 35 0.327AM‐05‐30 Amazon Parintins 6/7/2005 3150 192,600 1 3000 56°35′58.1″ 02°39′40.3″ 2 38.8 45 0.396AM‐05‐31 Amazon Parintins 6/7/2005 3150 192,600 2 1170 56°39′37.3″ 02°35′08.5″ 20 270.1 77 0.281AM‐05‐32 Amazon Parintins 6/7/2005 3150 192,600 2 1170 56°39′37.3″ 02°35′08.5″ 10 105.7 64 0.312AM‐05‐33 Amazon Parintins 6/7/2005 3150 192,600 2 1170 56°39′37.3″ 02°35′08.5″ 2 32.3 43 0.373AM‐05‐34 Amazon Parintins 6/7/2005 3150 192,600 Bedload 71 0.254AM‐05‐35 Amazon Óbidos 6/8/2005 2100 128,800 1 730 55°30′09.8″ 01°56′07.3″ 58 318.5 170 0.196AM‐05‐36 Amazon Óbidos 6/8/2005 2100 128,800 1 730 55°30′09.8″ 01°56′12.3″ 45 296.6 165 0.209AM‐05‐37 Amazon Óbidos 6/8/2005 2100 128,800 1 730 55°30′09.8″ 01°56′12.3″ 30 174.6 147 0.243AM‐05‐38 Amazon Óbidos 6/8/2005 2100 128,800 1 730 55°30′09.8″ 01°56′12.3″ 15 76.0 55 0.346AM‐05‐39 Amazon Óbidos 6/8/2005 2100 128,800 1 730 55°30′09.8″ 01°56′12.3″ 2 47.4 82 0.282AM‐05‐40 Amazon Óbidos 6/8/2005 2100 128,800 2 1685 55°30′40.3″ 01°56′37.1″ 43 592.0 133 0.230AM‐05‐41 Amazon Óbidos 6/8/2005 2100 128,800 2 1685 55°30′40.3″ 01°56′37.1″ 30 259.7 57 0.365AM‐05‐43 Amazon Óbidos 6/8/2005 2100 128,800 2 1685 55°30′40.3″ 01°56′37.1″ 2 95.9 61 0.322AM‐05‐44 Amazon Óbidos 6/8/2005 2100 128,800 Bedload 235 0.081
Geochem
istryG
eophysicsG
eosystemsG
3G
3BOUCHEZETAL.:RIV
ER
SEDIM
ENTSGRAIN
SIZEAND
CHEMIST
RY
10.1029/2010GC003380
5of
24

Table 1. (continued)
Sample Stream Site Date
SectionWidth(m)
Discharge(m3/s) Profile
Distance FromLeft Bank
(m) Longitude Latitude
SamplingDepth(m)
SPM(mg/L) D90
Al/Si(mm)
AM‐05‐46 Amazon Óbidos 6/8/2005 2100 128,800 Bedload 434 0.073AM‐06‐01 Solimões Manacapuru 3/15/2006 3200 109,200 Bedload 530 0.062AM‐06‐02 Solimões Manacapuru 3/15/2006 3200 109,200 Bedload 445 0.094AM‐06‐03 Solimões Manacapuru 3/15/2006 3200 109,200 Bedload 489 0.078AM‐06‐04 Solimões Manacapuru 3/15/2006 3200 109,200 Bedload 514 0.063AM‐06‐05 Solimões Manacapuru 3/15/2006 3200 109,200 Bedload 351 0.130AM‐06‐06 Solimões Manacapuru 3/15/2006 3200 109,200 Bedload 360 0.081AM‐06‐07 Solimões Manacapuru 3/16/2006 3200 109,200 1 975 60°33′12.0″ 03°18′42.1″ 20 424.8 176 0.220AM‐06‐08 Solimões Manacapuru 3/16/2006 3200 109,200 1 975 60°33′12.0″ 03°18′42.1″ 10 218.8 89 0.335AM‐06‐09 Solimões Manacapuru 3/16/2006 3200 109,200 1 975 60°33′12.0″ 03°18′42.1″ 0 130.9 46 0.371AM‐06‐10 Solimões Manacapuru 3/16/2006 3200 109,200 2 1675 ND ND 22 302.1 83 0.307AM‐06‐11 Solimões Manacapuru 3/16/2006 3200 109,200 2 1675 ND ND 15 277.2 72 0.318AM‐06‐12 Solimões Manacapuru 3/16/2006 3200 109,200 2 1675 ND ND 10 209.1 77 0.307AM‐06‐13 Solimões Manacapuru 3/16/2006 3200 109,200 2 1675 ND ND 5 140.8 47 0.369AM‐06‐14 Solimões Manacapuru 3/16/2006 3200 109,200 2 1675 ND ND 0 78.5 35 0.386AM‐06‐15 Solimões Manacapuru 3/16/2006 3200 109,200 3 2550 60°33′11.0″ 03°19′41.0″ 25 333.2 127 0.266AM‐06‐16 Solimões Manacapuru 3/16/2006 3200 109,200 3 2550 60°33′11.0″ 03°19′41.0″ 18 142.9 0.328AM‐06‐17 Solimões Manacapuru 3/16/2006 3200 109,200 3 2550 60°33′11.0″ 03°19′41.0″ 12 92.1 55 0.373AM‐06‐18 Solimões Manacapuru 3/16/2006 3200 109,200 3 2550 60°33′11.0″ 03°19′41.0″ 6 73.4 43 0.381AM‐06‐19 Solimões Manacapuru 3/16/2006 3200 109,200 3 2550 60°33′11.0″ 03°19′41.0″ 0 54.5 40 0.438AM‐06‐23 Amazon Iracema 3/18/2006 1950 134,500 1 600 58°49′40.3″ 03°19′04.5″ 35 118.1 53 0.366AM‐06‐24 Amazon Iracema 3/18/2006 1950 134,500 1 600 58°49′40.3″ 03°19′04.5″ 25 125.6 51 0.340AM‐06‐25 Amazon Iracema 3/18/2006 1950 134,500 1 600 58°49′40.3″ 03°19′04.5″ 15 112.6 54 0.336AM‐06‐26 Amazon Iracema 3/18/2006 1950 134,500 1 600 58°49′40.3″ 03°19′04.5″ 0 52.6 37 0.421AM‐06‐27 Amazon Iracema 3/18/2006 1950 134,500 2 1470 58°49′46.2″ 03°19′33.5″ 45 178.9 57 0.332AM‐06‐28 Amazon Iracema 3/18/2006 1950 134,500 2 1470 58°49′46.2″ 03°19′33.5″ 25 127.9 46 0.359AM‐06‐29 Amazon Iracema 3/18/2006 1950 134,500 2 1470 58°49′46.2″ 03°19′33.5″ 15 132.2 43 0.373AM‐06‐30 Amazon Iracema 3/18/2006 1950 134,500 2 1470 58°49′46.2″ 03°19′33.5″ 0 59.7 34 0.436AM‐06‐31 Amazon Iracema 3/18/2006 1950 134,500 Bedload 0.012AM‐06‐32 Amazon Iracema 3/18/2006 1950 134,500 Bedload 384 0.100AM‐06‐33 Madeira Foz Madeira 3/19/2006 2100 47,200 1 330 58°47′28.8″ 03°24′28.6″ 12 1269.5 102 0.222AM‐06‐34 Madeira Foz Madeira 3/19/2006 2100 47,200 1 330 58°47′28.8″ 03°24′28.6″ 6 523.9 56 0.288AM‐06‐35 Madeira Foz Madeira 3/19/2006 2100 47,200 1 330 58°47′28.8″ 03°24′28.6″ 0 218.8 29 0.395AM‐06‐36 Madeira Foz Madeira 3/19/2006 2100 47,200 2 1100 58°47′06.9″ 03°24′28.1″ 15 455.1 64 0.284AM‐06‐37 Madeira Foz Madeira 3/19/2006 2100 47,200 2 1100 58°47′06.9″ 03°24′28.1″ 10 473.3 56 0.285AM‐06‐38 Madeira Foz Madeira 3/19/2006 2100 47,200 2 1100 58°47′06.9″ 03°24′28.1″ 0 426.4 48 0.305AM‐06‐39 Madeira Foz Madeira 3/19/2006 2100 47,200 3 1470 ND ND 11 461.1 47 0.298AM‐06‐40 Madeira Foz Madeira 3/19/2006 2100 47,200 3 1470 ND ND 5 456.5 55 0.285AM‐06‐41 Madeira Foz Madeira 3/19/2006 2100 47,200 3 1470 ND ND 0 263.2 30 0.334AM‐06‐42 Madeira Foz Madeira 3/19/2006 2100 47,200 4 1600 58°46′54.6″ 03°24′36.7″ 7 441.6 69 0.293AM‐06‐43 Madeira Foz Madeira 3/19/2006 2100 47,200 4 1600 58°46′54.6″ 03°24′36.7″ 0 303.2 38 0.357
Geochem
istryG
eophysicsG
eosystemsG
3G
3BOUCHEZETAL.:RIV
ER
SEDIM
ENTSGRAIN
SIZEAND
CHEMIST
RY
10.1029/2010GC003380
6of
24

Table 1. (continued)
Sample Stream Site Date
SectionWidth(m)
Discharge(m3/s) Profile
Distance FromLeft Bank
(m) Longitude Latitude
SamplingDepth(m)
SPM(mg/L) D90
Al/Si(mm)
AM‐06‐44 Madeira Foz Madeira 3/19/2006 2100 47,200 Bedload 264 0.062AM‐06‐46 Amazon Parintins 3/21/2006 3200 179,900 1 2050 56°39′42.6″ 02°35′37.8″ 36 521.1 0.255AM‐06‐47 Amazon Parintins 3/21/2006 3200 179,900 1 2050 56°39′42.6″ 02°35′37.8″ 27 318.6 92 0.275AM‐06‐48 Amazon Parintins 3/21/2006 3200 179,900 1 2050 56°39′42.6″ 02°35′37.8″ 18 317.0 77 0.290AM‐06‐51 Amazon Parintins 3/21/2006 3200 179,900 1 2050 56°39′42.6″ 02°35′37.8″ 8 106.5 34 0.390AM‐06‐52 Amazon Parintins 3/21/2006 3200 179,900 1 2050 56°39′42.6″ 02°35′37.8″ 0 88.5 26 0.430AM‐06‐53 Amazon Parintins 3/21/2006 3200 179,900 Bedload 357 0.087AM‐06‐54 Amazon Parintins 3/21/2006 3200 179,900 Bedload 195 0.134AM‐06‐55 Amazon Óbidos 3/22/2006 2300 168,900 1 630 55°30′18.6″ 01°56′05.3″ 55 341.3 205 0.214AM‐06‐56 Amazon Óbidos 3/22/2006 2300 168,900 1 630 55°30′18.6″ 01°56′05.3″ 40 192.7 67 0.308AM‐06‐57 Amazon Óbidos 3/22/2006 2300 168,900 1 630 55°30′18.6″ 01°56′05.3″ 25 198.3 56 0.325AM‐06‐58 Amazon Óbidos 3/22/2006 2300 168,900 1 630 55°30′18.6″ 01°56′05.3″ 10 124.1 52 0.331AM‐06‐59 Amazon Óbidos 3/22/2006 2300 168,900 1 630 55°30′18.6″ 01°56′05.3″ 0 101.1 31 0.398AM‐06‐60 Amazon Óbidos 3/23/2006 2300 168,900 2 1900 ND ND 35 482.5 66 0.292AM‐06‐61 Amazon Óbidos 3/23/2006 2300 168,900 2 1900 ND ND 20 158.8 39 0.352AM‐06‐62 Amazon Óbidos 3/23/2006 2300 168,900 2 1900 ND ND 0 84.4 30 0.430AM‐06‐63 Amazon Óbidos 3/23/2006 2300 168,900 3 1200 ND ND 45 249.5 58 0.315AM‐06‐64 Amazon Óbidos 3/23/2006 2300 168,900 3 1200 ND ND 20 140.9 42 0.364AM‐06‐65 Amazon Óbidos 3/23/2006 2300 168,900 3 1200 ND ND 0 81.0 27 0.423AM‐06‐66 Amazon Óbidos 3/23/2006 2300 168,900 Bedload 71 0.261
aSPM, suspended particulate matter.
Geochem
istryG
eophysicsG
eosystemsG
3G
3BOUCHEZETAL.:RIV
ER
SEDIM
ENTSGRAIN
SIZEAND
CHEMIST
RY
10.1029/2010GC003380
7of
24

of 10!5 (relative 2s). A few milliliters of thedigested sediments solution were loaded onto aTRU‐SPEC and then onto Ln‐SPEC (Eichrom)resin columns, to separate REEs and then Nd,respectively. Nd was measured in 3% HNO3 solu-tions on a MC‐ICPMS Neptune (Thermo Electron)at IPGP, in static mode. Typical signals on mass 142were 8 V. Mass discrimination was corrected usingthe invariant ratio 146Nd/144Nd (0.7219). Repeatedanalysis of an in‐house standard (calibrated by TIMSon the La Jolla standard) gave accurate results withan external reproducibility of 10 ppm (relative 2s).
3. Results
3.1. Concentration and Grain SizeDistribution of Sediments[9] Results regarding suspended particulate matter(SPM) concentration and grain size distribution arereported and extensively discussed by Bouchez et al.[2010a]. A large increase of SPM concentrationwith sampling depth is observed in almost all of thevertical profiles, by a factor of up to five (Figures 2aand 2b). In the Solimões River, bed sedimentsamples are representative of the sand component,having a modal size of ca. 300 mm. This sandcomponent is also visible in the deepest suspendedload samples, with a significant fining with decreas-ing depth (at !28 m and !21 m for the profile 2 inJune 2005, Figure 2c). The silt component is dom-inant in all suspended load samples, with a modalsize around 25 mm. In any sample, clays representless than 3% of the sediment. In the Madeira, amore homogenous grain size pattern is observed,with overall finer grain size distributions than inthe Solimões (Figure 2d). Silts, coarsening from 7to 35 mm from 0 m to !12 m, are clearly dominantin all suspended load samples, while sands aredominant only in the bed sediment sample. Clayproportion is approximately twice as high as inthe Solimões.
[10] The downward increase of SPM concentrationis accompanied by a broad pattern of grain coars-ening (Figures 2c and 2d). In other words, theincrease of SPM concentration with sampling depthis the largest for coarse grain size fractions, whereasfine grain size fractions display a rather constantconcentration with depth (equation (1)). Theseobservations agree with the results of sedimenttransport dynamics in a turbulent flow. Assumingthe equilibrium between the downward flux ofsettling suspended particles and the upward flux
of particles from the bed by turbulent dispersion,the predicted SPM concentration profile is [Rouse,1950]
C z! "C a! " #
H $ zz
% aH $ a
! "ZR
!1"
where H is the channel depth, z is the heightabove river bed and a is a reference height abovebed, C is the SPM concentration and ZR is the so‐called Rouse number
ZR # w!u*
!2"
where u* is the shear bottom velocity, ! the vonKármán constant [García, 2008], and w is the set-tling velocity of sediments. The lower term of theRouse number (!u*) reflects the intensity of the tur-bulent fluctuations of the flow velocity, and deter-mine the ability of the flow to carry particles insuspension through turbulent diffusion. The upperterm (the settling velocity w) indicates the abilityof particles to settle down toward the bed, and theresulting enrichment at the bottom of the channel.Fast‐settling (e.g., coarse and/or dense) particles willhave high Rouse numbers (equation (2)) and willdisplay a pronounced increase of concentrationwith depth (equation (1)). On the contrary, slowsettling fine particles will have low Rouse numbersimplying nearly constant SPM concentration withdepth. Therefore, our observations concerning sedi-ment grain size distribution and concentration arecompatible with the Rouse model. These combinedeffects of size, density and shape of grains acting ontheir distribution throughout depth profiles arereferred to in the following as hydrodynamic sortingduring riverine transport. The Amazon vertical pro-files of SPM concentration are well explained bythe Rouse model, although Rouse numbers yieldedby the analysis of these profiles are higher thancalculated Rouse numbers from sediment grain sizedistribution and flow parameters [Bouchez et al.,2010a]. This discrepancy was attributed to particleaggregation in the river.
3.2. Chemical Composition of Sediments
3.2.1. Chemical Composition Versus Depth
[11] Chemical composition of the sampled sedi-ments are listed in Table 2. Large variations areobserved even in a single vertical profile. Al and Siconcentrations in three vertical profiles sampled onthe Solimões River in March 2006 are shown inFigure 3 for example. Si concentration increases with
GeochemistryGeophysicsGeosystems G3G3 BOUCHEZ ET AL.: RIVER SEDIMENTS GRAIN SIZE AND CHEMISTRY 10.1029/2010GC003380
8 of 24

depth, typically from 260,000 ppm to 300,000 ppm(i.e., from 55 to 65 SiO2 wt.%), with concentrationsreaching more than 400,000 ppm in bed sedimentsamples (85 SiO2 wt.%). Al concentration decreaseswith depth: more than 100,000 ppm to 70,000–80,000 ppm (i.e., 21 to 13–14 Al2 O3 wt.%), and iseven more depleted in bed sediment samples. Sim-ilar trends are observed in the vertical profiles ofother sampling sites. More generally, very largevariations of elemental concentrations in sedimentsare observed for all elements over depth in single
depth profiles (Table 2). These variations are almostas large as the site‐to‐site variations (for example,observed between theMadeira and Solimões rivers),and as large as the variations from one dischargestage to another (for example, Madeira in June 2005and in March 2006).
3.2.2. Link Between Grain Size Distributionand Chemical Composition of Sediments
[12] Concentrations of Al and Si exhibit large andopposite variations in single depth profiles (Figure 3)
Figure 2. Representative suspended particulate matter (SPM) concentration depth profiles: (a) the Solimões River inMarch 2006, and (b) the Madeira River in June 2005. Representative grain size distributions in depth profiles: (c) theSolimões River in June 2005 and (d) the Madeira River in March 2006. See Table 1 for profiles and samplescharacteristics.
GeochemistryGeophysicsGeosystems G3G3 BOUCHEZ ET AL.: RIVER SEDIMENTS GRAIN SIZE AND CHEMISTRY 10.1029/2010GC003380
9 of 24

making the Al/Si weight ratio a good proxy ofvertical chemical differentiation. In the sedimentsof the Amazon Basin rivers, a relationship isobserved between the Al/Si ratio and the grain sizedistribution D90 (see Table 2 and Figure 4). D90 isthe grain size below which 90% of the grains arefound in a given sample. D90 is an interesting metricfor grain size distribution since it integrates thewhole size spectrum and the different granulometriccomponents, independently of the number of modalsizes, for instance.
[13] The relationship of Figure 4 shows a tight linkbetween grain size distribution and chemicalcomposition of suspended sediments: coarse sam-ples are Si enriched, while fine samples are Al rich.The Solimões, Madeira and Amazon rivers donot display significantly different grain size–Al/Sirelationships, despite different grain size distribu-tion patterns (section 3.1).
[14] The variation of Al/Si as a function of depthalong vertical profiles in the Solimões and Madeirarivers is shown in Figure 3. Similar patterns areobserved in the Amazon mainstem sampling sites.
Al/Si points toward low values (ca. 0.15, silicon‐rich coarse sediments) in bottom suspended sedi-ments and high values (ca. 0.45, aluminum‐richfine sediments) in surface suspended sediments.Such a relationship was observed in previous studieson the Ganga‐Brahmaputra system by Galy et al.[2007, 2008]. Variations of the Al/Si ratio of sus-pended sediments are also observed with samplingdate. All the sediment samples from the AmazonRiver basin have a grain size and Al/Si that resultfrom a mixing between two end‐members, bestrepresented by bed sediments on one hand (coarse,low Al/Si) and surface suspended sediments onthe other hand (fine, high Al/Si). These end‐members are referred hereafter to as coarse andfine, respectively.
[15] Figure 4 demonstrates that despite the largetemporal and spatial variations of sediment grainsize, Al/Si and grain size always vary consistently.For example, during the Madeira low‐water stage(June 2005), suspended sediment samples displayhigher Al/Si, because coarse, high‐Rouse number,Si‐rich sediments are less readily transported high
Figure 3. Concentration of Si and Al in suspended sediments versus depth in the Solimões River, March 2006. Al/Siversus depth in the Solimões and Madeira rivers (weight ratio). White, grey, and black symbols represent samplesfrom profiles 1, 2, and 3, respectively. See Table 1 for profiles and samples characteristics.
GeochemistryGeophysicsGeosystems G3G3 BOUCHEZ ET AL.: RIVER SEDIMENTS GRAIN SIZE AND CHEMISTRY 10.1029/2010GC003380
10 of 24

in the water column under these rather slow flowconditions than during high‐water stage. Low‐water stage samples thus plot in the bottom rightcorner of the D90‐Al/Si diagram. High‐water stagesamples have both higher D90 and lower Al/Si, andwill plot closer to the top left corner of the diagram.However, all these sediments plot on the sameline in the D90‐Al/Si diagram.
[16] The Al/Si ratio is thus a surrogate for grain size.In the following, chemical and isotopic composi-tions are examined as a function of Al/Si, rather thansampling depth, allowing for a chemical study of thewhole size spectrum of river sediments.
3.2.3. Chemical Composition Versus Al/SiRatio
[17] Chemical composition of surface sedimentsamples are comparable with previous studies onthe Amazon River [Gibbs, 1967; Gaillardet et al.,1997; Elbaz‐Poulichet et al., 1999; Viers et al.,2008]. The Amazon at Iracema exhibits the sameconcentrations as the Solimões, since the Rio Negrodoes not contribute significantly to the Amazonsedimentary budget [Gibbs, 1967]. Downstreamfrom the Madeira‐Amazon confluence (at Parintinsand Óbidos), the Amazon has intermediate values ofchemical concentrations, well explained by amixingbetween the two tributaries.
[18] The concentration of Si is negatively related tothe Al/Si ratio, with bed sediment samples havingthe highest concentrations, whereas Al concentra-tion displays the inverse behavior (Table 2). TheAmazon, Solimões and Madeira rivers define asingle relationship, which is probably due to thefact that the abundances of these major elementsdo not vary from a bedrock to another at the largecatchment scale.
[19] Concentrations of Th andREEs (Figure 5 for Th)display a linear positive relationship with Al/Si. Onebed sediment sample from the Madeira clearly liesoutside of the general trend and is very enriched inTh and REEs. The Solimões and Amazon mainstemdisplay similar relationships for Th and REEs con-centrations and Al/Si. TheMadeira River is enrichedin Th and REEs compared to the Solimões for agiven Al/Si value.
[20] Transition metals (Cr, Fe, Co, Cu, Zn) follow aclear increase in concentration with increasing Al/Si(although two possibly contaminated samples dis-play very high concentrations of Cu, Table 2). Nosignificant difference was found between the dif-ferent rivers.
[21] Concentrations of Zr and Hf decrease withincreasing Al/Si (Figure 5 for Zr), except for thelowestAl/Si‐suspended load samples of the SolimõesRiver. Some bed sediment samples are highlyenriched in Zr and Hf. Ti, Nb and Ta concentra-tions increase with increasing Al/Si. Then, theseconcentrations slightly decrease with increasingAl/Si for Al/Si values above 0.35. The relationshipsare different for the two tributaries, except at highAl/Si.
[22] In suspended load samples, Na concentrationdecreases with increasing Al/Si (Figure 5), whilein bed sediment samples, Na decreases withdecreasing Al/Si. These two trends result in a bell‐shaped curve of Na concentrations as a function ofAl/Si. The variability observed in the bed sedimentsamples is as large as the one observed for the sus-pended load samples. Conversely, K, Rb, Cs, Mgand Ba increase with increasing Al/Si in all rivers(Figure 5 for K, Cs and Mg), bed sediment sampleslying on the same trend as suspended load samples.Relationships are different between the Solimõesand Madeira rivers. Ca and Sr concentrations inthe Solimões decrease in the suspended load withincreasing Al/Si, and decrease in bed sedimentsamples with decreasing Al/Si, similarly to Na.In the Madeira River, Ca and Sr increase withincreasing Al/Si.
Figure 4. Relationship between D90 and Al/Si, for allsamples. White symbols represent Solimões River andthe Amazon River at Iracema, black symbols representMadeira River, and grey symbols represent AmazonRiver at Parintins and at Óbidos. Bedload samples arerepresented by squared symbols, and suspended loadsamples are represented by circles.
GeochemistryGeophysicsGeosystems G3G3 BOUCHEZ ET AL.: RIVER SEDIMENTS GRAIN SIZE AND CHEMISTRY 10.1029/2010GC003380
11 of 24

[23] To summarize, the above relations describehow element concentrations vary as a function ofgrain size in the particulate load of the Amazon riversystem. For most of the elements, concentrationsincreasewith decreasing grain size (increasingAl/Si).This is particularly true for Al, Fe Th, REEs, K, Rb,Cs, Mg and transition metals. It is interesting to notethat this group contains elements classically knownas soluble elements (mobile during water‐rockinteractions, and partitioned between solid and dis-solved phase) [Dupré et al., 1996] and insolubleelements (nonmobile and transported essentially in
the solid load). Si, Zr, Hf, Ti, Nb, Ta, Na, Ca, Ba andSr show decreasing concentrations (at least in thesuspended load) with decreasing grain size. Gener-ally, these relations are not dependent upon thewaterstage for a given river. However, for most elementsdifferent correlations are defined for each river, therelationships between element concentrations andAl/Si differing between the Solimões and theMadeira.For a given Al/Si ratio, concentrations of Th, REEs,K, Rb and Cs are higher in the Madeira River than inthe Solimões River while Na, Ca and Mg are lowerin the Madeira.
Figure 5. Th, Zr, Na, K, Cs, and Mg concentrations in the particulate phase versus Al/Si. White symbols representSolimões River; black symbols represent Madeira River. Bedload samples are represented by squared symbols, andsuspended load samples are represented by circles.
GeochemistryGeophysicsGeosystems G3G3 BOUCHEZ ET AL.: RIVER SEDIMENTS GRAIN SIZE AND CHEMISTRY 10.1029/2010GC003380
12 of 24

[24] Altogether, these observations clearly indicatethat the change in chemical composition of sus-pended sediments throughout depth in a single riverchannel, observed for instance in Figure 3, is relatedto a change in grain size, which is in turn inducedby hydrodynamic sorting. Therefore, chemical ele-ments are greatly and variably affected by hydro-dynamic sorting processes in the river channel.
3.3. Sr and Nd Isotopic Ratios[25] Sr isotopic ratios have been determined forsome of the suspended load and bed sedimentsamples (Table 3). The values we obtain agree wellwith results reported by Goldstein and Jacobsen[1988], Allègre et al. [1996], and Viers et al.[2008]. Mean values for the Solimões River areca. 0.713, whereas for the Madeira River moreradiogenic values around 0.733 are obtained. Thesenumbers are consistent with the occurrence of rel-atively young magmatic provinces in the Solimõesdrainage basin. Large variations of Sr isotopic ratiosare observed in the Solimões River: more than 2 !10!3 for the suspended load, and nearly 5 ! 10!3 ifthe bed sediment sample is taken into account.In the Madeira River, the variation of 87Sr/86Srwithin the suspended load is less than 10!3, althoughthe measured 87Sr/86Sr for theMadeira bed sedimentsample is more than 10!2 below the mean value ofthe suspended load.
[26] For the Solimões and the Amazon at Óbidos,significant positive correlations are observed betweenAl/Si and 87Sr/86Sr (Figure 6). Similarly, Douglaset al. [1995] reported increasing 87Sr/86Sr withdecreasing grain size in size‐fractionated sus-pended sediments of the Murray River. No rela-tionship is observed between 87Sr/86Sr and Al/Sifor the Madeira River, at least concerning sus-pended load. However, the analyzed bed sedimentsample, which displays a very low Al/Si, is lessradiogenic than the suspended load samples, sim-ilar to what is observed in the Solimões River.
[27] Nd isotopic ratios are presented in Table 3.The observed variability is low compared to Sr iso-topic ratios, and the results agreewell with previouslyreported data by Goldstein et al. [1984], Goldsteinand Jacobsen [1988], Allègre et al. [1996], andViers et al. [2008], with typical "Nd values of !8for the Solimões, 12 for the Madeira (except forone sample) and !10 for the Amazon at Óbidos.Significant variations with depth, or Al/Si areobserved between samples of a given river. Therange of Nd isotopic ratios covered by the Solimõesand Amazon suspended load samples is 2 "Nd units,and is 3 "Nd units for the Madeira. Bed sedimentsamples have higher ratios from suspended loadsamples in the Solimões and in the Amazon (6 and2 "Nd units higher than the suspended load, respec-tively), but not in the Madeira. For the SolimõesRiver, a significant decreasing trend of "Nd isobserved as a function of Al/Si. For the MadeiraRiver, "Nd shows no trend with Al/Si.
[28] The above isotopic data demonstrate that sig-nificant fractionations of Nd and especially Srisotopes occur along depth profiles. This is partic-ularly true for the Solimões River. These resultsshow that the common assumption that suspendedsediments in large rivers are isotopically homoge-nous from surface to bottom is not correct.
4. Discussion
4.1. Behavior of Chemical Elements WithRespect to Hydrodynamic Sorting in theAmazon River: The Fan‐Shaped Diagram
4.1.1. Dilution of Chemical Concentrationby Quartz and Normalization to Th
[29] As shown above, concentrations of most ele-ments decrease with decreasing Al/Si. Dilution bya phase with low concentration of these elementscan explain this observation. Potential candidates
Figure 6. Sr isotopic ratios versus Al/Si. White, black,and grey symbols represent Solimões, Madeira, andAmazon (at Óbidos) samples, respectively. Bedloadsamples are represented by squared symbols, and sus-pended load samples are represented by circles.
GeochemistryGeophysicsGeosystems G3G3 BOUCHEZ ET AL.: RIVER SEDIMENTS GRAIN SIZE AND CHEMISTRY 10.1029/2010GC003380
13 of 24

are quartz and organic matter. Because organiccarbon concentration in Amazon sediments is rela-tively low (of the order of 1%) [Hedges et al., 1986],organic matter cannot account for the extent ofdilution observed for elements such as Al, Fe, REEsand Th at low Al/Si. Hence, the amount of quartz inthe samples is the main factor controlling the con-centration of these elements throughout the sampleddepth profiles. The decrease of the Al/Si ratio atdepth accompanying the decrease of most elementalconcentrations, can thus be attributed to the hydro-dynamic enrichment of relatively coarse quartzgrains near the bottom of the channel, consistentlywith the observed coarsening of grain size distribu-tions at depth (section 3.1). This feature, observedhere in river sediments during their transport, wasalso reported for sand deposits and consolidatedterrestrial sediments, for example. Low concentra-tions of most elements in sandstones compared toassociated siltstones and shales have been reportedby Cullers [1995] and Cullers et al. [1997] and havebeen attributed to higher quartz concentrations.
[30] This effect of dilution by quartz obscures fur-ther differential variabilities between chemical ele-ments due to hydrodynamic sorting, and has to becorrected for. Elemental concentrations are thusnormalized to Th concentration. Th is an insolubleelement essentially carried by the solid phase inrivers. In order to represent all families of elementson the same diagram for a given river, Th‐normalizedconcentrations are normalized to the mean value ofthe same elemental ratio in the suspended sedimentsamples of the considered river. In the following,these doubly‐normalized concentrations are exam-ined as a function of the Al/Si ratio, used as anindex of grain size. The resulting plot is called inthe following the fan‐shaped diagram (Figure 7),referring to the characteristic shape of thesedoubly Th‐normalized ratios‐Al/Si relationshipsin that space.
[31] Here again, the pattern of the Amazon atIracema is comparable to that of the Solimões atManacapuru, and the Amazon mainstem at Parintinsand Óbidos patterns are well explained by a“mixing” between the patterns of the Solimões andthe Madeira rivers. Bed sediment samples show asignificant scatter of the Th‐normalized ratios,which can be attributed to local enrichment ordepletion by selective entrainment of Th‐bearingheavy minerals such as monazite [Slingerland,1977], thus inducing normalizations artifacts. Thisis the reason why bed sediment samples are notrepresented in Figure 7. In the following, we firstfocus on the fan‐shaped diagram of the Solimões.
Then, we will further examine the differencesbetween the Madeira and the Solimões.
4.1.2. Behavior of Insoluble Elements
[32] Elemental ratios Al/Th, Fe/Th and REE/Th (aswell as Cu/Th, Cr/Th, Zn/Th and Ga/Th, not shownhere) are rather constant with Al/Si (Figure 7). Thismeans that increasing dilution by quartz towardlow Al/Si is the only process inducing a variationof concentration of these elements in suspendedsediment with depth. Variations of Al, Fe, REEs,Cu, Cr, Zn and Ga concentrations in suspendedsediments throughout the water column can thus bedescribed by a two end‐member mixture betweenfine, Al‐rich grains that are enriched in suspendedsediments near the surface of the channel, and quartz,enriched toward the bottom of the channel.
[33] However, a number of insoluble elements shownonhorizontal patterns in Figure 7. This means thattheir abundance is not only controlled by dilutionby quartz of aluminous phases, but also by mixingbetween nonquartz minerals with contrasted con-centrations of these elements. In the Amazon Basinrivers, Si/Th, Ti/Th and Zr/Th ratios (as well asCo/Th and Ge/Th, not shown here) increase fordecreasing Al/Si ratios. Nb and Ta follow the samebehavior as Ti, and Hf follows that of Zr. River bedsediment samples are particularly enriched in theseelements. This feature, commonly observed in riversystems [e.g., Albarède and Semhi, 1995; Garzantiet al., 2010b] is generally attributed to the enrich-ment of heavy minerals in this fraction. While Si ispreferentially carried by quartz, Ti (with Nb and Ta)and Zr (with Hf) are probably carried by rutile andzircons, respectively. These so‐called heavy miner-als were all detected by XRD in the bed sedimentsamples (section 4.2), and are likely to be enrichednear the bottom of the channel (thus in low Al/Si,coarse samples) by hydrodynamic sorting. It isinteresting to notice that elements such as Th andREEs, which are likely to be significantly trans-ported by heavy minerals such as monazite, do notshow the same pattern as Zr and Hf. This surprisingobservation suggests that in the Amazon, theseheavyminerals are not the primary carriers of Th andREEs in suspension.
[34] The abundance of insoluble elements in theMadeira, Solimões and Amazon rivers are thuscontrolled by a mixing between minerals differen-tially sorted within the river section. The bed andchannel bottom suspended sediments are enrichedin heavy minerals and quartz, while channel surfacesamples are enriched in clay minerals. Two major
GeochemistryGeophysicsGeosystems G3G3 BOUCHEZ ET AL.: RIVER SEDIMENTS GRAIN SIZE AND CHEMISTRY 10.1029/2010GC003380
14 of 24

Figure 7. The fan‐shaped diagram: doubly‐normalized elemental concentrations versus Al/Si in the Solimões andMadeira rivers. Th‐normalized concentrations are normalized to the mean value of the same ratio in the suspendedload samples of the river. In such a diagram, dilution by quartz is represented by a horizontal line. Best fits by linearrelationships are also shown (except for Ca/Th in the Madeira, for which the correlation with Al/Si is not significant).
Geochem
istryG
eophysicsG
eosystemsG
3G
3BOUCHEZETAL.:RIV
ER
SEDIM
ENTSGRAIN
SIZEAND
CHEMIST
RY
10.1029/2010GC003380
15of
24

types of insoluble elements can be distinguished:(1) the elements present in the Al‐rich componentdominating the channel surface samples, dilutedwith depth by quartz (and possibly other mineralsrelatively poor in those elements), and (2) the ele-ments significantly carried by heavy minerals andquartz. We predict, according to the occurrence ofvarious heavy minerals in a catchment area, thatdifferent patterns for insoluble elements in the fan‐shaped diagram should be observed for other riversystems.
4.1.3. Behavior of Alkali and Alkali‐EarthElements
[35] Alkali (Na, K, Rb) and alkali‐earth elements(Mg, Ca, Sr, Ba), referred to hereafter as A‐AE,have been shown by many authors to be depleted inriver surface sediments with respect to the conti-nental crust [Dupré et al., 1996; Canfield, 1997;Gaillardet et al., 1997, 1999]. This depletion is dueto their mobility during water‐rock interactions.The chemical investigation of the depth profiles ofthe Amazon shed light on the behavior of A‐AEduring the weathering‐erosion‐transport process (seeFigure 7 for Na, K, Rb, Cs, Mg and Ca).
[36] 1. The doubly‐normalized ratios of most A‐AEvary with grain size. The fan‐shaped diagramshows that the weathering intensity of particulates,which can be defined from the A‐AE depletioncompared to the source rock, is grain size dependent.
[37] 2. The coarsest material is enriched comparedto the finest for Na, K, Mg and Ca. Rb, which has afairly flat pattern, shows no enrichment in eitherend‐member. Unlike any other A‐AE,Cs is enrichedin the fine end‐member.
[38] 3. The heavier the alkali element, the moreenriched (or the less depleted) in the fine‐grainedsediments, compared to the coarse‐grained sedi-ments. The extent of fractionation of a chemicalelement between different grain sizes can be quan-tified by the sorting factor S.F.
S:F: # X=Th! "fineX=Th! "coarse
!3"
S.F. is related to the “slope” of the element pattern inthe fan‐shaped diagram (Figure 7): S.F. = 1 means aflat pattern in the fan‐shaped diagram and no frac-tionation of the element between fine and coarsesediments. Conversely, S.F. different from 1 meansthat the chemical element is undergoing fraction-ation due to sorting. We arbitrarily choose to useAl/Si = 0.20 as representative of the coarse sedi-ments, and Al/Si = 0.45 for the fine sediments.Then, linear best fits in the fan‐shaped diagramyield the corresponding X/Th ratios and to calculateS.F. A very good correlation is obtained betweenS.F. and the ionic radius for alkali elements, asshown in Figure 8.
[39] 4. For alkali elements, the depletion/enrichmentpattern is related to solubility, as shown in Figure 8,where S.F. for Na, K, Rb and Cs are plotted versus
Figure 8. Sorting factor (S.F.) of alkali elements: (enrichment of alkali elements in the fine fraction of SolimõesRiver suspended sediments, compared to the coarse fraction) as a function of ionic radius and solubility. S.F. is quan-tified using the X/Th ratio of samples having a Al/Si ratio of 0.45 (fine sediments), divided by the X/Th ratio of sam-ples having a Al/Si of 0.20 (coarse sediments).
GeochemistryGeophysicsGeosystems G3G3 BOUCHEZ ET AL.: RIVER SEDIMENTS GRAIN SIZE AND CHEMISTRY 10.1029/2010GC003380
16 of 24

Table 2 (Sample). Chemical Element Concentrations in Amazon Samplesa [The full Table 2 is available in the HTML version ofthis article]
Sample Na Mg Al Si K Ca Ti Cr Fe Co Ni Cu Zn
AM‐05‐01 10,625 9528 85,373 291,961 18,513 11,143 4944 68 44,926 16.1 31.4 59.2 167AM‐05‐02 10,038 10,176 89,704 274,671 18,894 13,364 5094 74 49,525 16.9 34.2 50.0 158AM‐05‐03 9808 10,224 90,593 270,895 18,745 13,200 5094 71 50,960 16.7 32.7 51.7 160AM‐05‐04 10,387 7794 69,358 319,256 16,488 10,921 4044 52 36,484 13.5 27.4 27.6 132AM‐05‐05 10,313 8364 74,186 311,005 17,201 11,336 4248 56 39,277 14.2 40.6 22.2 121AM‐05‐06 9860 9498 84,081 290,607 18,172 10,907 4932 70 45,444 16.6 32.3 34.1 143AM‐05‐07 10,921 10,002 86,008 283,094 18,596 13,021 5004 69 45,423 16.6 32.6 37.9 135AM‐05‐08 10,216 9588 84,341 290,701 18,355 11,164 4872 65 44,604 16.2 32.5 34.9 158AM‐05‐10 7597 3390 31,071 390,964 10,480 6150 3204 32 21,273 7.5 14.8 4.5 41AM‐05‐11 11,025 9372 79,888 300,211 17,840 11,514 4926 60 41,727 15.9 28.9 98.9 190AM‐05‐12 10,291 9714 85,590 291,130 18,537 10,807 5022 65 44,303 16.9 31.4 47.6 156AM‐05‐13 9920 9846 87,533 281,549 18,504 11,286 5040 75 46,305 18.1 40.3 35.3 152AM‐05‐14 7701 9882 97,359 260,694 18,977 9643 5112 81 52,675 17.1 37.6 35.0 166AM‐05‐15 5312 8634 103,611 271,259 27,093 3186 5418 93 51,870 16.3 38.6 42.5 175AM‐05‐16 5379 8700 103,643 264,651 26,736 4136 5178 94 54,985 16.2 39.5 29.3 185AM‐05‐17 4956 8550 106,544 263,317 26,927 3279 5100 99 55,132 17.0 42.0 38.5 165AM‐05‐18 5090 9012 110,435 252,910 27,673 4443 4962 105 59,325 17.3 46.1 35.8 147AM‐05‐19 5194 9240 111,822 245,341 27,848 5379 4746 97 60,368 16.7 43.1 33.1 163AM‐05‐20 4971 2544 35,756 395,817 13,592 1793 2784 29 21,413 10.9 20.2 7.8 49AM‐05‐21 4993 8724 105,427 260,181 27,317 3321 5394 95 53,263 17.9 43.5 35.5 202AM‐05‐22 4912 8376 102,727 264,381 26,387 3400 5106 98 52,640 17.5 42.5 32.9 160AM‐05‐23 4771 8688 109,403 253,871 27,649 3214 5124 93 57,610 16.9 40.1 32.6 150AM‐05‐24 5105 6528 73,191 321,001 20,496 2693 4818 66 37,352 13.6 29.6 17.6 87AM‐05‐26 8532 8454 81,884 293,813 18,703 8136 4878 68 42,119 16.1 31.9 26.9 129AM‐05‐27 8577 8352 79,835 297,626 18,355 8143 4770 65 41,958 15.6 31.0 32.9 144AM‐05‐28 8443 8646 81,768 299,647 18,861 8171 5004 68 42,553 16.3 31.0 26.1 129AM‐05‐29 7976 9120 90,731 277,079 19,724 7407 5202 77 45,920 16.2 36.4 32.6 178AM‐05‐30 6715 9450 100,424 253,559 20,463 7293 5184 92 52,570 15.8 40.4 40.4 219AM‐05‐31 8896 9144 83,425 296,604 19,127 8793 5208 77 43,134 16.2 35.1 29.7 120AM‐05‐32 8295 9348 89,465 286,781 19,882 8543 5238 81 46,137 15.8 35.9 29.7 125AM‐05‐33 7167 9444 98,730 265,015 20,546 8407 5136 85 51,653 16.4 38.4 38.1 181AM‐05‐34 7323 8274 78,565 309,297 20,695 6293 5952 65 43,106 15.7 28.8 23.1 101AM‐05‐35 8354 6876 65,234 332,229 16,413 7564 4146 48 33,264 12.4 23.8 18.9 92AM‐05‐36 8577 6936 67,961 325,313 17,060 7536 4062 49 34,335 13.2 24.8 20.2 93AM‐05‐37 8332 7764 75,907 312,522 18,206 7529 4590 51 38,752 13.0 25.8 21.2 102AM‐05‐38 7301 9330 95,199 275,333 20,745 7600 5238 70 49,322 15.0 36.2 39.1 176AM‐05‐39 8406 8862 82,911 293,547 19,284 8629 5238 60 43,687 15.3 28.5 26.2 115AM‐05‐40 8970 7926 72,784 315,887 17,923 8221 4686 51 37,072 13.4 24.9 22.8 96AM‐05‐41 7204 9324 95,765 262,379 20,413 8864 5130 76 51,849 15.7 36.5 46.7 192ËM‐05‐43 7679 9054 90,429 280,789 20,197 7543 5310 72 46,459 15.6 33.9 30.3 136AM‐05‐44 5646 5718 29,234 359,973 8356 8629 14,334 114 58,926 12.3 20.1 10.7 81AM‐05‐46 6870 2460 29,531 403,312 10,887 4207 2274 18 15,750 5.1 9.6 3.8 33AM‐06‐01 6188 2760 25,698 411,180 8945 5186 2082 21 15,260 5.8 11.3 4.2 32AM‐06‐02 8777 4392 36,842 391,216 11,849 7871 2964 36 21,336 8.6 17.1 6.2 50AM‐06‐03 7486 3168 31,426 401,534 11,401 5807 1848 24 16,695 7.3 33.4 5.0 35AM‐06‐04 6180 2982 25,481 405,258 8895 5200 2970 26 17,528 6.3 14.7 4.5 36AM‐06‐05 11,040 6030 47,017 361,844 13,492 10,686 5466 59 32,963 11.8 22.3 8.0 72AM‐06‐06 7983 3780 32,538 399,317 10,829 6657 2952 30 18,375 6.8 14.6 4.3 41AM‐06‐07 10,714 7866 70,306 319,079 17,359 10,000 3942 55 34,419 13.1 26.7 21.5 102AM‐06‐08 8599 10,392 91,668 273,644 19,774 9536 5010 74 46,655 17.1 35.1 35.3 164AM‐06‐09 7783 10,716 98,042 264,077 20,579 8650 5028 75 49,693 16.3 33.9 34.6 140AM‐06‐10 8925 9834 86,019 280,224 19,027 10,136 4824 66 44,681 15.7 31.5 28.6 129AM‐06‐11 8762 10,128 88,745 279,417 19,259 10,193 4956 72 46,137 16.4 32.5 29.8 134AM‐06‐12 9207 10,062 87,231 283,710 19,293 10,486 4932 69 45,101 16.1 33.6 28.3 130AM‐06‐13 7568 10,572 97,613 264,213 20,106 8821 5058 100 48,923 16.1 45.4 30.3 138AM‐06‐14 7301 10,770 100,535 260,358 20,778 9050 5064 78 50,092 16.3 34.0 31.6 142AM‐06‐15 10,402 8790 79,539 298,769 17,857 10,650 4416 57 39,452 14.9 27.7 21.5 112AM‐06‐16 8080 9714 90,349 275,627 18,720 10,079 4962 68 47,810 15.3 30.6 26.2 145AM‐06‐17 6915 10,188 98,074 262,999 19,417 8543 4896 75 51,940 16.7 34.6 33.1 177AM‐06‐18 6729 10,158 99,450 260,993 19,483 9721 4848 76 53,627 16.6 33.9 31.8 151
aBDL, below detection limit.
GeochemistryGeophysicsGeosystems G3G3 BOUCHEZ ET AL.: RIVER SEDIMENTS GRAIN SIZE AND CHEMISTRY 10.1029/2010GC003380
17 of 24

the ratio Xw/Xp, which is a way to quantify thesolubility of an element. Xw is the representativevalue for the quantity of an element present as dis-solved species in one liter of Solimões river water.Xp is the representative value for the quantity ofthe same element transported in the particulatephase in one liter of Solimões river water. Tocalculate Xw and Xp, average of dissolved con-centrations [Bouchez, 2009; Bouchez et al., 2010b]and suspended sediment concentrations and chem-ical composition (Tables 1 and 2) were calculatedover all available Solimões samples. The more analkali element is soluble (the higher Xw/Xp is), themore enriched in coarse sediments it is. SinceGoldschmidt [1937], A‐AE are broadly consideredas soluble elements because they easily formmonoatomic cations in aqueous solution. How-ever, the affinity between alkali elements and soilphyllosilicates increases with ionic radius, result-ing in a so‐called lyotropic series [Jenny, 1932].Altogether, this demonstrates that there is a tightrelationship between the chemical properties of thesealkali elements (e.g., ionic radius), their solubilityand their behavior with respect to hydrodynamicsorting.
[40] The fan‐shaped diagram of Figure 7 is thegraphic representation of the gradual depletion/enrichment of the finest fraction compared to thecoarsest from Na (and Ca) to Cs. These variousdepletion/enrichment patterns offer a new approachfor considering the geochemical mobility of A andAE elements through the whole spectrum of grainsize produced by weathering processes.
4.1.4. Toward a New GeochemicalClassification of Elements During Weatheringand Erosion
[41] At this stage, based on the fan‐shaped diagram(Figure 7), a classification of elements during erosionand transport in the Amazon Basin can be proposedas follows.
[42] 1. Th, REEs, Cr, Cu, Ga, Zn, Al and Fe con-centration variations in the river with channel depthare simply due to the dilution of an Al‐rich com-ponent by quartz. Some particular enrichment ofTh and REEs can be observed in bed sedimentsamples due to concentration of heavy minerals.As these elements are all insoluble elements, theirratios are fairly constant over depth profiles andlikely reflect the corresponding ratios of the con-tinental crust eroded by the river. We propose tocall them insoluble and poorly sorted elements.
[43] 2. Zr, Hf, Ti, Nb, Ta, Ge, and Co are not onlydiluted by quartz. Their variability with depth alsostems from the occurrence of heavy minerals in thecoarse sediments. Like those of the previous group,these elements are insoluble elements. They areinsensitive to chemical weathering but are highlyinfluenced by sorting in the river system. Theyare strongly fractionated by erosion processes, afeature that was already noticed and used for theLu/Hf isotopic system [Patchett et al., 1984]. Wepropose to call this group the insoluble and well‐sorted elements.
[44] 3. Alkali and alkali‐earth elements (A‐AE) aredepleted in the fine samples compared to the coarsesamples, except for Cs, and a remarkable gradual“enrichment/depletion” factor from Na and Ca toCs is depicted in the Solimões River basin. Thepatterns of these elements in the fan‐shaped dia-gram (Figure 7) show that phases other than quartzand clays are necessary to explain their composi-tional gradient in the river column. These elementsare not best characterized by their solubility, sincethey display various contributions of dissolvedload to total transport, but rather by their mobilityduring weathering reactions that enrich fine frac-tions in heavy alkali elements and coarse fractionsin light alkali elements.
[45] Finally, the observations and conclusions re-ported here for the Solimões also apply to theMadeira river system. It can be seen from Figure 7that a steeper gradient for Zr but flatter patternsfor A‐AE characterize the Madeira River. Futurestudies will be necessary to tell whether these con-clusions deduced from the Amazon river systemapply to other large river systems. The differencesbetween the two subbasins are examined below inmore detail (section 4.3).
4.2. Identification of the MineralogicalEnd‐Members Explaining A‐AE Patterns[46] The above discussion shows that the relation-ships between element concentrations (or ratios)and grain size can be interpreted in terms of min-eralogical mixing. Since quartz dilution is not theonly process explaining A‐AE abundances in depthprofiles of suspended sediments (Figure 7), addi-tional mineralogical phases are necessary to explainthe observed patterns.
[47] XRD investigation revealed a large variety ofminerals. Qualitative inspection shows that quartzis present in all samples and albite in almost allsamples. Zircons, rutile and anatase were detected
GeochemistryGeophysicsGeosystems G3G3 BOUCHEZ ET AL.: RIVER SEDIMENTS GRAIN SIZE AND CHEMISTRY 10.1029/2010GC003380
18 of 24

in bed sediment samples, consistently with thefindings of Vital et al. [1999] and Vital andStattegger [2000]. In all samples, kaolinite, illite,chlorite were found; in the <2 mm fraction, ver-miculite and smectite were additionally identified,consistently with the findings of Gibbs [1967],Vital et al. [1999], and Guyot et al. [2007]. Nocarbonates or micas were detected. The identifiedminerals explain qualitatively the two main end‐members of the observed grain size‐Al/Si correla-tion. As demonstrated above, coarse, low‐Al/Sisediments found near the bottom of the channelare quartz rich, but probably also albite rich. Thealuminous phase enriched in fine suspendedsediments is better explained by a phyllosilicateminerals assemblage, these minerals being usuallysmall, tabular and relatively light, and thus expectedto be preferentially transported at the surface ofthe water column. The correlation in Figure 4thus reflects the finer nature of secondary Al‐richminerals (clays) [Meunier, 2006] compared toSi‐rich primary minerals (such as quartz, feldspars,etc.).
[48] The 87Sr/86Sr ratio in river sediment reflectthat of bedrock minerals or of secondary mineralsresulting from their chemical alteration in soils.The lowest isotopic ratios found in the coarsesample are compatible with the presence of feld-spars, which are relatively dense minerals, and arethus likely to be enriched near the bottom of the
channel. The increase of 87Sr/86Sr with increasingAl/Si in the Solimões and Amazon rivers is con-sistent with the occurrence of phyllosilicates in thefinest samples because these minerals have rela-tively high Rb/Sr ratios and with time acquireradiogenic compositions. These phyllosilicates arelikely to be illite, kaolinite, chlorite, smectite andvermiculite as indicated by XRD analyses (sincemicas have not been detected). These phyllosili-cates do not contain high amounts of Na and Ca,but may contain significant amounts of K (in illite),Mg (in smectites), Rb and Cs (in illite and interfoliarspaces of smectites) [e.g., Poinssot et al., 1999].From Na to Cs, the increase in ionic radius tends tofacilitate the incorporation in clay interlayers [e.g.,Jenny, 1932; Sawhney, 1972], which is in turn likelydue to the size of the hydration sphere of theiraqueous species. This mechanism explains therelationship between alkali elements enrichmentin the fine sediments of the Amazon River andtheir ionic radius, as well as their decreasingsolubility with increasing ionic radius (Figure 8).Despite being not detectable by XRD, smallamounts of micas might also be present in the finesediments and contribute to the A‐AE patterns.
[49] As a conclusion, A‐AE patterns are mainly theresults of a mixing of coarse feldspars (enriched inlow‐Al/Si samples) and an assemblage of fine clayparticles (enriched in high‐Al/Si samples). Theenrichment of A‐AE in the coarse fraction couldalso partly be attributed to the occurrence of heavyminerals and of lithic fragments [Franzinelli andPotter, 1983; Johnsson and Meade, 1990], pro-vided that these lithic fragments are inherited fromregions of low Sr isotopic ratios (for example, fromthe volcanic areas of the Andes). It should also beemphasized, for a more complete picture, thatoxy‐hydroxides and organic matter are likely tobe enriched in the finest, near surface suspendedload samples.
4.3. Comparison Between the Solimões andthe Madeira: The Weathering‐Sorting‐Lithology Triptych[50] Several differences can be observed betweenthe Solimões and Madeira rivers in terms of elementconcentrations, Al/Si range and chemical ratios.Here we attempt to explain these differences andto distinguish the effects of weathering processes,sorting processes and composition of the continentalcrust from which river sediments are derived.
[51] The differences between the two basins in termsof sorting of chemical elements can be explored
Figure 9. S.F. (sorting factor between fine and coarseparticles) for the chemical elements, ranked followingthe classification established in section 4.1. White sym-bols represent Solimões River data, and black symbolsrepresent Madeira River data. S.F. was assumed to be 1for Ca in the Madeira River.
GeochemistryGeophysicsGeosystems G3G3 BOUCHEZ ET AL.: RIVER SEDIMENTS GRAIN SIZE AND CHEMISTRY 10.1029/2010GC003380
19 of 24

using the fan‐shaped diagram (section 4.1) and theS.F. ratio as defined in section 4.1.3. In Figure 9, inwhich the S.F. ratio is shown for the two river sys-tems, chemical elements are grouped by familiesas defined in section 4.1. For the Solimões, S.F.ranges from 0.22 (Na) to 1.59 (Cs), whereas for theMadeira, it ranges from 0.31 (Zr) to 1.42 (Cs), andonly from 0.60 (Na) to 1.42 (Cs) for alkali elements.Nevertheless, the progressive depletion/enrichmentpattern as a function of ionic radius of alkalielements (section 4.1.3) is also observed in theMadeira. For the Madeira, alkali‐earth elementsare close to the horizontal line S.F. = 1, whereassignificant fractionations were observed for theSolimões for alkali‐earth elements in section 4.1.3.Finally, for both rivers, sorted insoluble elementshave comparable S.F. values. Therefore, with thenoticeable exception of Zr and Ti, hydrodynamicfractionation throughout depth is weaker in theMadeira than in the Solimões. In other words,Madeira sediments are more homogenous thanthose of the Solimões. This feature is also visible(1) in the grain size distributions, for which theMadeira River display more homogenous patternsthan the Solimões River (section 3.1), and (2) onthe range of 87Sr/86Sr ratios (Table 3 and Figure 6);the relative variability of Sr isotopic ratios is3.4 ‰ for the Solimões suspended load, and only1.7 ‰ for the Madeira suspended load.
[52] The flatter patterns of Na, K, Ca, and Srobtained for the Madeira in the fan‐shaped diagram(Figures 7 and 9) are explained by the depletion ofprimary minerals containing these elements in thelow‐Al/Si sediments compared to the Solimões. Forexample, an absence of plagioclase would resultin the depletion of Na in the coarse fraction. Thepotentially very low content of feldspars in thecoarsest fraction of the Madeira River sedimentscompared to the Solimões River sediments could be
attributed to (1) hydrodynamic sorting, i.e., prefer-ential deposition of feldspars between the sedimentsource region and the sampling site (physical effect),(2) weathering in Andean soils or in the floodplain(chemical effect), and (3) crustal composition(source effect).
[53] Because the two river basins do not drasticallydiffer in terms of geomorphic features and bothhave the ability to transport zircons and other heavyminerals in the coarse fractions (as clearly shownby Figure 7), both river systems likely have similarability to transport feldspars from the source areasto the outlet. Furthermore, the flux of dissolved Naexported out of the Solimões drainage basin, oncecorrected from rain input, is about 250–350 kg/s,i.e., more than twice the flux of dissolved Na atthe outlet of the Madeira River basin, which is30–100 kg/s, depending on the water stage. Thesenumbers have been calculated using water dischargedetermined byADCP on the day of sampling and theconcentrations of Cl and Na measured in the dis-solved phase [Bouchez et al., 2010b]. Because albiteis the main mineral that provides dissolved Naduring chemical weathering reactions, these fluxessuggest that albite weathering is more important inthe Solimões basin than it is in the Madeira basin.Moreover, climate, surface area and geomorphicconditions are not significantly different betweenthe Solimões and Madeira river systems. Thisanalysis suggests that the very low content of albitein the suspended sediments of the Madeira River isnot due to albite dissolution by present chemicalweathering. The amount of feldspars in the sus-pended sediments of the Solimões and Madeirarivers is thus most probably related to theiroccurrence in the bedrock. This conclusionis consistent with the geology of the two basins:the Madeira River drains mostly sedimentary rockswhile an additional magmatic subduction‐related
Table 3. Isotopic Ratios of Sr and Nda
Sample 87Sr/86Sr 143Nd/144Nd Sample 87Sr/86Sr 143Nd/144Nd
AM‐05‐15 0.733377 N.D. AM‐06‐36 0.732585 0.512054AM‐05‐17 0.733729 N.D. AM‐06‐38 0.733749 0.512018AM‐05‐18 0.732780 0.512198 AM‐06‐39 0.732746 0.512027AM‐05‐19 0.732524 0.512098 AM‐06‐40 N.D. 0.512046AM‐05‐20 N.D. 0.512135 AM‐06‐43 0.732881 0.512083AM‐06‐05 0.709477 0.512534 AM‐06‐44 0.721334 0.512078AM‐06‐07 0.713024 0.512206 AM‐06‐63 0.720738 0.512127AM‐06‐10 0.713024 0.512193 AM‐06‐64 0.722395 0.512141AM‐06‐11 0.714477 0.512210 AM‐06‐65 N.D. 0.512229AM‐06‐13 0.714749 0.512196 AM‐06‐66 0.716047 0.512333AM‐06‐14 0.715431 0.512101
aRelative uncertainties are 10 ppm (2s).
GeochemistryGeophysicsGeosystems G3G3 BOUCHEZ ET AL.: RIVER SEDIMENTS GRAIN SIZE AND CHEMISTRY 10.1029/2010GC003380
20 of 24

component is present in the Solimões River basin.This is confirmed by geochemical studies [Basu et al.,1990; Allègre et al., 1996; Viers et al., 2008] thatall detected, based on Nd and Sr isotopic ratios, arelatively recent magmatic component in theSolimões River sediments, and not in the MadeiraRiver sediments.
[54] The differences in the fan‐shaped diagrampatterns between the Solimões and Madeira rivers(Figure 7) are thus related to the nature of the con-tinental crust submitted to chemical weathering.“Flat” patterns of A‐AE characterize highly evolvedsedimentary crustal material, i.e., a mixing betweencoarse quartz and heavy minerals on one hand, andfine phyllosilicate assemblages on the other hand. Inthe Solimões, a magmatic component constitutes asource of Na‐ and Ca‐containing primary mineralsand lithic fragments, that mix with quartz, heavyminerals and clays, giving rise to a higher degreeof chemical variability with grain size. This is alsoshown by Sr isotopes (Figure 6): the Solimões Riversystem mixes nonradiogenic minerals, enriched inthe coarse suspended sediments and likely derivingfrom magmatic areas of the Andes; with moreradiogenic minerals such as micas or sedimentaryclays, enriched in the finest samples, and similar tothose found in the Madeira suspended load. Sortingin Solimões‐like river systems induces an isotopicfractionation leading to more radiogenic phases inthe fine‐grained fraction for Sr and less radiogenicphases for Nd. This fractionation is possible becauseof the occurrence of feldspars or lithic fragments inthe suspended sediments.
[55] The present‐day weathering processes do notpermit the weathering of all primary minerals thatare evacuated out of the Solimões river system.Conversely, the sedimentary rocks that constitutemost of the Madeira River drainage basin wereaffected over geological times by successive rework-ing and weathering episodes, which have led toprogressive loss of Ca and Na elements and to theflat patterns observed in Figure 7. In other words,sedimentary cannibalism [Veizer and Jansen, 1979]explains the distribution of Na and Ca with grainsize in the suspended sediments of the MadeiraRiver.
[56] We conclude from the above discussion thatthe differences between the Solimões and Madeirarivers in terms of effects of hydrodynamic sortingon chemical elements distribution are not onlyinfluenced by present‐day weathering and sortingregimes, but also largely by bedrock characteristics.The persistence of unweathered minerals or lithic
fragments in the Solimões River sediments showsthat the weathering conditions (climate, soil devel-opment and residence time) in the magmatic pro-vinces from which they derive are not active enoughto entirely transform them into clay minerals. Wespeculate that more drastic weathering regimes(higher precipitation and temperature, deeper soilswith longer residence time) could have led to theabsence of feldspars or lithic fragments in the riversediments of the Solimões and less differencesbetween the chemical depth profiles of Solimões andMadeira river sediments. Altogether, a combinationof bedrock composition, weathering intensity insoils and hydrodynamic processes during transportdetermines the distribution of elements along thegrain size range of river sediments.
4.4. Sr Isotopes as a Tracer of a“Stratification of Sediment Source”in the Amazon River[57] The very distinct Sr isotopic signatures of theSolimões and the Madeira rivers allow us to con-strain their relative contribution in the AmazonRiver, and to trace the particles in the mixing pro-cess. As shown in Figure 6, the Amazon River atÓbidos displays very different 87Sr/86Sr ratios asa function of Al/Si. The Al‐rich samples have a Srisotopic composition close to the one of theMadeira,whereas the Si‐rich samples have less radiogenic87Sr/86Sr, resembling the Solimões samples. Thecontribution of the Madeira River to the Amazonsediments thus varies with grain size, the Madeirasediments being enriched near the surface of thechannel of the Amazon at Óbidos. This is confirmedby Nd isotopes: at Óbidos, the highest "Nd areobtained for low‐Al/Si samples collected at depth(higher than !8.2), similarly to the Solimões sedi-ment samples (mostly around !8.2). The lowest "Ndare measured in channel surface sediments (closeto !10), similarly to what is observed in Madeirasediments. Using Sr isotopes in the mixing equation
87Sr86Sr
! "
Obidos# XSolimoes %
87Sr86Sr
! "
Solimoes
& 1$ XSolimoes! " %87Sr86Sr
! "
Madeira!4"
with XSolimoes =Sr' (SolimoesSr' (Obidos
· MSolimoesMObidos
, with MSolimoesMObidos
beingthe weight proportion of Solimões‐supplied sedi-ments in the Amazon sediments at Óbidos. Takinga mean 87Sr/86Sr of 0.713 for the Solimões Riversediments and a 87Sr/86Sr of 0.735 for Madeirasediments, a mixing equation yields ca. 90%, 70%
GeochemistryGeophysicsGeosystems G3G3 BOUCHEZ ET AL.: RIVER SEDIMENTS GRAIN SIZE AND CHEMISTRY 10.1029/2010GC003380
21 of 24

and 60% of Solimões sediments in the Amazonsediments, respectively, for bed sediment, suspendedload at !45 m and !20 m. Thus, in the AmazonRiver, the Madeira solid material is preferentiallytransported near the channel surface, whereas theSolimões River is preferentially transported near thechannel bottom. This conclusion is consistent withthe smaller grain size of Madeira sediments com-pared to Solimões sediments: once the sedimentsof both tributaries are transported one single channel,i.e., the Amazon, the relatively coarser sediments ofthe Solimões are hydrodynamically enriched nearthe bottom of the channel. We emphasize that thisfeature is probably not transient: the describedmechanism of hydrodynamic sorting is also validfor steady state transport. To our knowledge, this isthe first time that such a “stratification” of sedimentprovenance is reported in a large river system.
5. Conclusion
[58] From depth profiles of river water sampling,made at two distinct water stages and in five loca-tions of the largest river basin on Earth, the AmazonRiver appears to act as a “sorting machine” of ero-sion products of the Andes. Important gradients inchemical and isotopic compositions are observedat all locations with depth, best characterized by theAl/Si ratio chemical index. A major result of thisstudy is that a basin‐wide inverse relationship isobserved between grain size and Al/Si ratio, Al‐rich,clay‐rich samples being the finest, and Si‐rich,quartz‐rich samples being the coarsest. The quartzenrichment from channel surface to bottom and thento bed sediment, induced by hydrodynamic sorting,explains a large part of the variability in chemicalcomposition of Amazon riverine sediments. Adouble‐normalization (fan‐shaped) diagram is pro-posed in this paper to correct for dilution effects ofclay minerals by quartz and shows that additionalprocesses of mineralogical sorting within the watercolumn are needed to explain the distribution ofchemical elements throughout the Al/Si spectrum.
[59] Another significant result of this study is theenrichment of the finest fraction of river suspendedsediments (in terms of absolute concentrations) in alarge number of major (Al, Fe, K, Mg) and trace(Th, REEs, Co, Zn, Rb, Cs) elements relatively tothe coarse fraction. Isotopically, Sr and Nd isotoperatios are significantly more radiogenic in the finestsuspended sediments, at least in the SolimõesRiver. Therefore, sorting of river products results insignificant chemical and isotopic fractionations,implying that (1) the composition of river suspended
sediments in large river systems can only be knownprecisely if it is integrated along depth profiles and(2) fine sedimentary rocks do not necessarily recordthe concentrations and isotopic ratios of the bedrockfrom which they derive; Sr and Nd isotopic ratios offine sediments may not be a reliable record of thecrustal bedrocks, a finding with important implica-tions regarding studies of continental crust evolution.Interestingly, Sr isotopes show that the AmazonRiver profiles result from a mixing between thesetwo tributaries with the suspended sediments of thetop and the bottom of the depth profiles preferen-tially derived from the Madeira and Solimões riversediments, respectively.
[60] We established in this paper a classificationof elements during erosion and transport for theAmazon Basin. Three main groups can be distin-guished. The first group is composed of insolubleand poorly sorted elements Th, REEs, Cr, Cu, Ga,Zn, Al and Fe, in which concentration variations inthe river with channel depth are simply due to thedilution of an Al‐rich component (most likely aphyllosilicate assemblage) by quartz. The secondgroup is composed of insoluble and well‐sortedelements Zr, Hf, Ti, Nb, Ta, Ge and Co, in whichconcentration variabilities with depth are also due tothe presence of heavy minerals in the coarse sedi-ments. The third group is composed of alkali andalkali‐earth elements (A‐AE); they are soluble ele-ments and are partitioned between dissolved andsuspended load, except Cs. They are not only dilutedby quartz, but their variability also reflects themixing of a phyllosilicate component, preferentiallytransported at the river surface and primary minerals(i.e., feldspars and lithic fragments) in the coarsestfraction. A remarkable chemical gradient of the“sorting factor” of alkali elements (from Na to Cs)is observed in the Solimões River basin, related totheir mobility during weathering, and to their grad-ual affinity with secondary phyllosilicates.
[61] The Madeira River profiles appear less vari-able than those of the Solimões in terms of chem-istry and grain size distribution. Arguments basedon the alkali elements suggest that the low chem-ical and isotopic variability of the Madeira Riverprofiles is controlled by crustal rock compositionrather than by present‐day weathering conditions.Our results suggest that recycled crust leads tohomogenized profiles, while magmatic crust willfavor the sorting of grains, provided that weatheringconditions are not too drastic.
[62] The composition of river particles resultsfrom the interplay of crustal bedrock type (recycled
GeochemistryGeophysicsGeosystems G3G3 BOUCHEZ ET AL.: RIVER SEDIMENTS GRAIN SIZE AND CHEMISTRY 10.1029/2010GC003380
22 of 24

versus primary), weathering (and the controllingfactors, i.e., climate, residence time, etc.) and sortingprocesses (hence hydrodynamic and geomorpholo-gic properties). These three parameters can definewhat we call an erosion regime, encompassingpresent‐day weathering conditions, bedrock typeand fluvial transport features. Any use of past riversediments to infer paleoenvironmental conditionswill have to take into account these three controllingparameters and their interplay. The investigation ofother river systems is clearly necessary to infer amore global picture on the links between sedimentcomposition and erosion systems.
Acknowledgments
[63] This work was funded by the “Reliefs de la Terre” INSU‐CNRS program. The field campaigns, supported by the FrenchInstitute for Development (IRD), were realized in the frame ofthe HyBAm (Hydrology and Geochemistry of the AmazonianBasin, http://www.mpl.ird/hybam/), in which the cooperationagreement with the Brazilian Research Centre (CNPq) is492685/2004‐5. We sincerely acknowledge the Brazilian Insti-tutions and Universities (ANA, UnB, UFF, CPRM), whichcollaborated on this project. We particularly thank P. Moreira‐Turcq for the organization and all the staff of the Cte Cuadrosship for their help during the fieldwork. B. Lartiges, N. Findling,J.‐L. Birck, and F. Capmas are greatly acknowledged for theiranalytical help. B. Velde and N. Hovius are thanked for helpfuldiscussions. E. Garzanti and an anonymous reviewer greatlyhelped us to improve the paper. This is IPGP contribution 3122.
References
Albarède, F., and K. Semhi (1995), Patterns of elemental trans-port in the bedload of the Meurthe River (NE France), Chem.Geol., 122, 129–145.
Allègre, C. J., B. Dupré, P. Négrel, and J. Gaillardet (1996),Sr‐Nd‐Pb isotope systematics in Amazon and Congo riversystems: Constraints about erosion processes, Chem. Geol.,131, 93–112.
Basu, A. R., M. Sharma, and P. G. DeCelles (1990), Nd,Sr‐isotopic provenance and trace elements geochemistry ofAmazonian foreland basin fluvial sands, Bolivia and Peru:Implications for ensialic Andean orogeny, Earth Planet.Sci. Lett., 100, 1–17.
Birck, J. L. (1986), Precision K‐Rb‐Sr isotopic analysis:Application to Rb‐Sr chronology, Chem. Geol., 56, 73–83.
Bouchez, J. (2009), Dynamique sédimentaire et cinétiquesd’altération dans les grands fleuves, Ph.D. thesis, Univ. ParisDiderot, Paris.
Bouchez, J., F. Métivier, M. Lupker, L. Maurice, M. A. Perez,and C. France‐Lanord (2010a), Prediction of depth‐integratedfluxes of suspended sediment in the Amazon River: Particleaggregation as a complicating factor, Hydrol. Processes, 25,778–794, doi:10.1002/hyp.7868.
Bouchez, J., E. Lajeunesse, J. Gaillardet, C. France‐Lanord,P. Dutra‐Maia, and L. Maurice (2010b), Turbulent mixingin the Amazon River: The isotopic memory of confluences,Earth Planet. Sci. Lett., 290, 37–43.
Canfield, D. E. (1997), The geochemistry of river particulatesfrom the continental USA: Major elements, Geochim.Cosmochim. Acta, 61, 3349–3365.
Chen, J., J. Gaillardet, P. Louvat, and S. Huon (2009), Znisotopes in the suspended load of the Seine River, France:Isotopic variations and source determination, Geochim.Cosmochim. Acta, 73, 4060–4076.
Cullers, R. L. (1995), The controls on the major‐ and trace‐element evolution of shales, siltstones and sandstones ofOrdovician to Tertiary age in the Wet Mountains region,Colorado, U.S.A, Chem. Geol., 123, 107–131.
Cullers, R. L., B. Bock, and C. Guidotti (1997), Elemental dis-tribution and neodymium isotopic compositions of Silurianmetasediments, western Maine, USA: Redistribution ofthe rare earth elements, Geochim. Cosmochim. Acta, 61,1847–1861.
Dosseto, A., B. Bourdon, J. Gaillardet, L. Maurice‐Bourgoin,and C. J.Allègre (2006),Weathering and transport of sedimentsin the Bolivian Andes: Time constraints from uranium‐seriesisotopes, Earth Planet. Sci. Lett., 248, 759–771.
Douglas, G. B., C. M. Gray, B. T. Hart, and R. Beckett (1995),A strontium isotopic investigation of the origin of suspendedparticulate matter (SPM) in the Murra‐Darling River system,Australia, Geochim. Cosmochim. Acta, 59, 3799–3815.
Dunne, T., L. A. K. Mertes, R. H. Meade, J. E. Richey, andB. R. Forsberg (1998), Exchanges of sediment between theflood plain and channel of the Amazon River in Brazil, Geol.Soc. Am. Bull., 110(4), 450–467.
Dupré, B., J. Gaillardet, D. Rousseau, and C. J. Allègre (1996),Major and trace elements of river‐borne material: The CongoBasin, Geochim. Cosmochim. Acta, 60, 1301–1321.
Elbaz‐Poulichet, F., P. Seyler, L. Maurice‐Bourgoin, J.‐L.Guyot, and C. Dupuy (1999), Trace element geochemistryin the upper Amazon drainage basin (Bolivia), Chem. Geol.,157, 319–334.
Filizola, N., and J.‐L. Guyot (2004), The use of Doppler tech-nology for suspended sediment discharge determinationson the River Amazon at Óbidos, Hydrol. Sci. J., 49(1),143–153.
France‐Lanord, C., and L. A. Derry (1997), Organic carbonburial forcing of the carbon cycle from Himalayan erosion,Nature, 390, 65–67.
Franzinelli, E., and P. E. Potter (1983), Petrology, chemistry,and texture of modern river sands, Amason River system,J. Geol., 91, 23–39.
Gaillardet, J., B. Dupré, C. J. Allègre, and P. Négrel (1997),Chemical and physical denudation in the Amazon RiverBasin, Chem. Geol., 142, 141–173.
Gaillardet, J., B. Dupré, and C. J. Allègre (1999), Geochemis-try of large river suspended sediments: Silicate weatheringor recycling tracer?, Geochim. Cosmochim. Acta, 63,4037–4051.
Galy, V., C. France‐Lanord, O. Beyssac, P. Faure, H. Kudrass,and F. Palhol (2007), Efficient carbon burial in the Bengalfan sustained by the Himalayan erosional system, Nature,450, 407–410.
Galy, V., C. France‐Lanord, and B. Lartiges (2008), Loadingand fate of particulate organic carbon from the Himalayato the Ganga‐Brahmaputra delta, Geochim. Cosmochim.Acta, 72, 1767–1787.
GeochemistryGeophysicsGeosystems G3G3 BOUCHEZ ET AL.: RIVER SEDIMENTS GRAIN SIZE AND CHEMISTRY 10.1029/2010GC003380
23 of 24

García, M. H. (2008), Sediment transport and morphody-namics, in Sedimentation Engineering: Processes, Mea-surements, Modeling and Practice, edited by M. H. García,pp. 21–145, Geol. Soc. of Civil Eng., Reston, Va.
Garzanti, E., S. Ando, C. France‐Lanord, P. Censi, P. Vignola,V. Galy, and M. Lupker (2010a), Mineralogical and chemi-cal variability of fluvial sediments. 2. Suspended‐load silt(Ganga‐Brahmaputra, Bangladesh), Earth Planet. Sci. Lett.,302, 107–120, doi:10.1016/j.epsl.2010.11.043.
Garzanti, E., S. Ando, C. France‐Lanord, G. Vezzoli, P. Censi,V. Galy, and Y. Najman (2010b), Mineralogical and chemicalvariability of fluvial sediments. 1. Bedload sand (Ganga‐Brahmaputra, Bangladesh), Earth Planet. Sci Lett., 299,368–381, doi:10.1016/j.epsl.2010.09.217.
Gibbs, R. J. (1967), Amazon river system: Environmental fac-tors that control its dissolved and suspended load, Science,156, 1734–1737.
Goldschmidt, V. M. (1937), The principles of distribution ofchemical elements in minerals and rocks, J. Chem. Soc.,655–673, doi:10.1039/JR9370000655.
Goldstein, S. J., R. K. O’Nions, and P. J. Hamilton (1984),A Sm‐Nd isotopic study of atmospheric dusts and particu-lates from major river systems, Earth Planet. Sci. Lett., 70,221–236.
Goldstein, S. J., and S. B. Jacobsen (1988), Nd and Sr isotopicsystematics of river water suspended material: Implicationsfor crustal evolution, Earth Planet. Sci. Lett., 87, 249–265.
Granet, M., F. Chabaux, C. France‐Lanord, P. Stille, andE. Pelt (2007), Time‐scales of sedimentary transfer andweathering processes from U‐series nuclides: Clues fromthe Himalayan rivers, Earth Planet. Sci. Lett., 261, 389–406.
Guyot, J.‐L., J.‐M. Jouanneau, L. Suares, G. R. Boaventura,N. Maillet, and C. Lagane (2007), Clay mineral compositionof river sediments in the Amazon Basin,Catena, 71, 340–356.
Hedges, J. I.,W.A. Clark, P. D. Quay, J. E. Richey, A. H. Devol,andU. deM. Santos (1986), Compositions and fluxes of par-ticulate organic material in the Amazon River, Limnol.Oceanogr., 31, 717–738.
Hilton, R. G., A. Galy, and N. Hovius (2008), Riverine par-ticulate organic carbon from an active mountain belt:Importance of landslides, Global Biogeochem. Cycles, 22,GB1017, doi:10.1029/2006GB002905.
Hofmann, A. W. (1988), Chemical differentiation the Earth:The relationship between mantle, continental crust and oceaniccrust, Earth Planet. Sci. Lett., 90, 297–314, doi:10.1016/0012-B21X(88)90132-X.
Jenny, H. (1932), Studies on the mechanism of ionicexchange in colloidal aluminum silicates, J. Phys. Chem.,36, 2217–2258.
Johnsson, M. J., and R. H. Meade (1990), Chemical weather-ing of fluvial sediments during alluvial storage: The Macua-panim Island point bar, Solimões River, Brazil, J. Sediment.Petrol., 60, 827–842.
Louvat, P., and C. J. Allègre (1997), Present denudation rateson the island of Réunion determined by river geochemistry:Basalt weathering and mass budget between chemical andmechanical erosions, Geochim. Cosmochim. Acta, 61,3645–3669.
Martin, J. M., and M. Meybeck (1979), Elemental mass balanceof material carried by world major rivers, Mar. Chem., 7,173–206.
Maurice‐Bourgoin, L., M.‐P. Bonnet, J.‐M.Martinez, P. Kosuth,G. Cochonneau, P. Moreira‐Turcq, J.‐L. Guyot, P. Vauchel,
N. Filizola, and P. Seyler (2007), Temporal dynamics of waterand sediments exchanges between the Curuaí floodplain andthe Amazon River, Brazil, J. Hydrol., 335, 140–156.
Meade, R. H., C. F. Nordin Jr., W. F. Curtis, F. M. CostaRodrigues, C. M. Do Vale, and J. M. Edmond (1979), Sedi-ments load in the Amazon River, Nature, 278, 161–163.
Meybeck, M., and A. Ragu (1996), River discharge to theoceans: An assessment of suspended solids, major ionsand nutrients, environment information and assessmentreport, U. N. Environ. Programme, Nairobi, Africa.
Meunier, A. (2006), Why are clay mineral small?, Clay Miner.,41, 551–566.
Millot, R., C. J. Allègre, J. Gaillardet, and S. Roy (2004), Leadisotopic systematics of major river sediments: A new esti-mate of the Pb isotopic composition of the upper continentalcrust, Chem. Geol., 203, 75–90.
Molinier, M., J.‐L. Guyot, E. De Oliveira, and V. Guimarães(1996), Les régimes hydrologiques de l’Amazone et de sesaffluents, IAHS Publ., 238, 209–222.
Patchett, P. J., W. M. White, H. Feldmann, S. Kielinczuk, andA. W. Hofmann (1984), Hafnium/rare earth element fraction-ation in the sedimentary system and crustal recycling intothe Earth’s mantle, Earth Planet. Sci. Lett. 69, 365–378.doi:10.1016/0012-821X(84)90195-X.
Poinssot, C., B. Baeyens, and M. H. Bradbury (1999), Exper-imental and modelling studies of caesium sorption on illite,Geochim. Cosmochim. Acta, 63, 3217–3227.
Putzer, H. (1984), The geological evolution of the AmazonBasin and its mineral resources, in The Amazon: Limnologyand Landscape Ecology of a Mighty Tropical River and itsBasin, edited by H. Sioli, pp.15–46, Dordrecht, Netherlands.
Rouse, H. (1950), Engineering Hydraulics, Wiley, New York.Sawhney, B. L. (1972), Selective adsorption and fixation ofcations by clay minerals: A review, Clays Clay Miner., 20,93–100.
Slingerland, R. (1977), The effect of entrainment on thehydraulic equivalence relationships of light and heavyminerals in sands, J. Sediment. Petrol., 33, 180–190.
Stallard, R. F., and J. M. Edmond (1983), Geochemistry ofthe Amazon 2. The influence of geology and weatheringenvironment of the dissolved load, J. Geophys. Res., 88,9671–9688.
Veizer, J., and S. L. Jansen (1979), Basement and sedimentaryrecycling and continental evolution, J. Geol., 87, 341–370.
Viers, J., M. Roddaz, N. Filizola, J.‐L. Guyot, F. Sondag,P. Brunet, C. Zouiten, C. Boucayrand, F. Martin, and G. R.Boaventura (2008), Seasonal and provenance controls onNd‐Sr isotopic compositions of Amazon rivers suspendedsediments and implications for Nd and Sr fluxes exportedto the Atlantic Ocean, Earth Planet. Sci. Lett., 274, 511–523.
Viers, J., B. Dupré, and J. Gaillardet (2009), Chemical compo-sition of suspended sediments in World Rivers: New insightsfrom a new database, Sci. Total Environ., 407, 863–868.
Vigier, N., B. Bourdon, S. Turner, and C. J. Allégre (2001),Erosion timescales derived from U‐decay series measure-ments in rivers, Earth Planet. Sci. Lett., 193, 549–563.
Vital, H., K. Stattegger, and C.‐D. Garbe‐Schönberg (1999),Composition and trace‐element geochemistry of detrital clayand heavy‐mineral suites of the lowermost Amazon River: Aprovenance study, J. Sediment. Res., 69, 563–575.
Vital, H., and K. Stattegger (2000), Major and trace elementsof stream sediments from the lowermost Amazon River,Chem. Geol., 168, 151–168.
GeochemistryGeophysicsGeosystems G3G3 BOUCHEZ ET AL.: RIVER SEDIMENTS GRAIN SIZE AND CHEMISTRY 10.1029/2010GC003380
24 of 24
Copyright © 2022 FDOKUMEN