
Damage Identification in Elastic Suspended Cables through Frequency Measurement
31
http://jvc.sagepub.com Journal of Vibration and Control DOI: 10.1177/1077546308096107 2009; 15; 867 originally published online Feb 13, 2009; Journal of Vibration and Control Marco Lepidi, Vincenzo Gattulli and Fabrizio Vestroni Measurement Damage Identification in Elastic Suspended Cables through Frequency http://jvc.sagepub.com/cgi/content/abstract/15/6/867 The online version of this article can be found at: Published by: http://www.sagepublications.com can be found at: Journal of Vibration and Control Additional services and information for http://jvc.sagepub.com/cgi/alerts Email Alerts: http://jvc.sagepub.com/subscriptions Subscriptions: http://www.sagepub.com/journalsReprints.nav Reprints: http://www.sagepub.co.uk/journalsPermissions.nav Permissions: http://jvc.sagepub.com/cgi/content/refs/15/6/867 Citations at Dip Teoria Dello Stato on May 25, 2009 http://jvc.sagepub.com Downloaded from
Transcript of Damage Identification in Elastic Suspended Cables through Frequency Measurement

http://jvc.sagepub.com
Journal of Vibration and Control
DOI: 10.1177/1077546308096107 2009; 15; 867 originally published online Feb 13, 2009; Journal of Vibration and Control
Marco Lepidi, Vincenzo Gattulli and Fabrizio Vestroni Measurement
Damage Identification in Elastic Suspended Cables through Frequency
http://jvc.sagepub.com/cgi/content/abstract/15/6/867 The online version of this article can be found at:
Published by:
http://www.sagepublications.com
can be found at:Journal of Vibration and Control Additional services and information for
http://jvc.sagepub.com/cgi/alerts Email Alerts:
http://jvc.sagepub.com/subscriptions Subscriptions:
http://www.sagepub.com/journalsReprints.navReprints:
http://www.sagepub.co.uk/journalsPermissions.navPermissions:
http://jvc.sagepub.com/cgi/content/refs/15/6/867 Citations
at Dip Teoria Dello Stato on May 25, 2009 http://jvc.sagepub.comDownloaded from
Damage Identification in Elastic Suspended Cablesthrough Frequency Measurement
MARCO LEPIDIVINCENZO GATTULLIDipartimento di Ingegneria delle Strutture, delle Acque e del Terreno, Universitá dell’Aquila,Italy
FABRIZIO VESTRONIDipartimento di Ingegneria Strutturale e Geotecnica, Universitá di Roma “La Sapienza”, Italy([email protected])
(Received 1 January 2008� accepted 15 May 2008)
Abstract: Structural cables in cable-stayed systems are subject to potential damage, mainly due to fatiguephenomena and galvanic corrosion. The paper analyzes how the dynamical behavior of cables is affected bydiffuse damage, and investigates whether the damage can be identified through information selected fromthe dynamical response. A continuous monodimensional model of a damaged cable is used for this purpose.Damage is described as a reduction of the cable cross section, and defined in terms of its intensity, extentand position. The major effects of these different damage parameters on the cable static response and spec-tral properties are evidenced and discussed to verify the observability of the damage. The frequencies of thedominant transversal motion of the cable are chosen as damage indicators, since they are sufficiently sensitiveto the damage intensity and extent, while the damage position requires additional information. The damageidentification problem is formulated by defining an objective error function between the measured and themodel frequencies, to be minimized in the space of the damage parameters. Pseudo-experimental data are ini-tially used to test the effectiveness and resolution of the procedure. The results confirm the uniqueness of theproblem solution and its correctness. The robustness of the solution is discussed while considering the pres-ence of random errors of increasing amplitude. The procedure is also positively verified with experimentalmeasures from a prototype model of an artificially damaged spiral strand.
Key words: Damaged cables, inverse problem, damage identification, frequency measurements, data errors.
1. INTRODUCTION
Monitoring the modal parameters may be an efficient means for the early detection of de-caying mechanical properties in many engineering structures. Experimental measures of thenatural frequencies, as well as of modal shapes and damping coefficients, can be used toassess structural integrity, that is, to detect the presence of damage and its significance andextent (Agbabian et al., 1991� Hearn and Testa, 1991� Doebling et al., 1998� Kosmatka andRicles, 1999).
Journal of Vibration and Control, 15(6): 867–896, 2009 DOI: 10.1177/1077546308096107
��2009 SAGE Publications Los Angeles, London, New Delhi, Singapore
Figures 4, 8, 11, 12 appear in color online: http://jvc.sagepub.com
at Dip Teoria Dello Stato on May 25, 2009 http://jvc.sagepub.comDownloaded from

868 M. LEPIDI ET AL.
Considering the damaged structure as a perturbation of the undamaged structure, themechanical properties of which are assumed to be known, and having formulated a reliableparametric model of the damage, only a few damage parameters have to be determined. Thispeculiar statement of the damage identification problem drastically reduces the dimension ofthe solution. Consequently, the minimum required data set is much lower with respect to themore general reconstruction problem, whose solution consists of the mechanical parameterdistribution and calls for an amount of data that is seldom available (Vestroni and Capecchi,2000).
Since the measured response of vibrating structures furnishes precise and robust infor-mation concerning the natural frequencies, changes in these frequencies are often selectedas an easy-to-use and reliable damage indicator. Taking both analytical and empirical con-siderations into account, few frequency data can theoretically be sufficient to successfullyand univocally identify the damage position and severity (Capecchi and Vestroni, 1999�Morassi, 2000). Nonetheless, as with most inverse problems, frequency-based identificationtechniques may suffer from marked ill-conditioning of the solution. Thus, the quality andredundancy of the available measures are critical for many practical applications.
Literature studies have shown that damage identification techniques based on changesin frequencies can effectively be applied to different monodimensional structural elements,such as rods (Morassi, 2001), beams (Cerri and Vestroni, 2003) and arches (Cerri and Ruta,2004). Their application field has also been successfully extended to geometrically complexsystems, such as beam frames, truss structures, and bridges, mainly with the support of finite-element modeling (Casas and Aparicio, 1994� Liu, 1995� Vestroni and Capecchi, 1996� Renand De Roeck, 2002a,b).
Considering that the damage identification problem is often solved by minimizing afrequency-defined error function in the space of the damage parameters, a variety of pro-posed enhancements focus either on increasing the sensitivity of this objective function, oron reducing the ill-conditioning of the solution. Different proposed refinements regard intro-ducing error measures based on the frequency-response functions (Thyagarajan et al., 1998),the time-evolving instantaneous frequency (Di Paola et al., 2006) or the generalized Fouriercoefficients (Morassi, 2007). More generally, a procedure for damage identification shouldachieve an acceptable balance between the target sensitivity and the minimum requirementsand quality of the data.
Minor research effort has been focused on dynamical response-based procedures for theidentification of damage in cables. A process of early deterioration in cables have been ex-perienced by many cable-stayed structures worldwide. In fact, while the structural efficiencyin carrying and transferring loads is rapidly increasing the use of cables in many engineer-ing applications, the high transversal flexibility and low damping properties of cables makethem vulnerable to fatigue phenomena. Moreover, severe environmental conditions and highstresses expose them to galvanic corrosion. This scenario gives rise to many challenges con-cerning the formulation and application of non-destructive methods for health monitoringand condition assessment (Tabatabai, 2005).
The damage identification problem in cables is characterized by some peculiar aspects,which have been evidenced studying the direct problem using a dynamical continuous modelof a damaged cable (Lepidi et al., 2007). First, the modeling of the longitudinal elasticity iscrucial for the description of the damage effects on both the cable statics and transversaldynamics. Second, the evaluation of the static configuration is a preliminary requirement for
at Dip Teoria Dello Stato on May 25, 2009 http://jvc.sagepub.comDownloaded from

DAMAGE IDENTIFICATION IN ELASTIC SUSPENDED CABLES 869
approaching the dynamical problem. In fact, damage first influences the cable static preten-sion, which consequently affects the transversal dynamical stiffness, which is of a whollygeometric nature.
The paper focuses initially on the effects of damage on the static and dynamical response.Care is devoted to distinguishing between the pretensioned and non-pretensioned cables,which may present different response sensitivities with respect to the damage parameters.The mechanical origin of each damage effect on the static equilibrium configuration and themodal properties is discussed separately. The influence of each parameter is studied individ-ually, with the aim of isolating the factors that independently influence the modification ofthe system frequencies.
The damage identification problem is formulated as a search for the minima of a response-based error function in the space of the damage parameters. The procedure is initially testedusing pseudo-experimental data, self-generated from the model. The results obtained allowthe evaluation of the procedure effectiveness and resolution, and the optimal selection of theminimum number of independent measures required to ensure mono-valued solutions. Then,the potential advantages of a two-phase reformulation of the procedure are introduced, andthe solution robustness is evaluated by simulating non-systematic errors that could affect thepseudo-experimental data.
Finally the practical application of the damage identification procedure is verified fromthe results of an experimental campaign on a laboratory-scale prototype of a spiral strand,realized for the purpose and damaged artificially. The resulting findings are presented, withsome considerations about the influence of experimental errors and disturbances caused bythe measuring instrumentation.
2. DIRECT PROBLEM
The static and dynamical response of an elastic suspended cable subject to diffuse damage isdescribed by a monodimensional continuous model, assuming negligible shear and flexuralrigidity. The statement of the direct problem and the solution process are summarized in thefollowing, while further details and a deeper discussion on the results can be found in Lepidiet al. (2007).
The curvilinear abscissa s is used to span the total arc-length L0 of the natural (un-stressed) configuration �0 (Figure 1(a)). Retaining the hypothesis of linear elastic materialbehavior, the damage of structural cables can be suitably represented as a diffused reductionof the constant axial stiffness E A. For sake of simplicity, a non-segmented constant-intensitydamage region is assumed, with residual stiffness E Ad between the boundary abscissae a1
and a2. Under these assumptions, the damage intensity, position and extent represent threeindependent parameters, which in non-dimensional form read
� � E A � E Ad
E A� � � a2 � a1
2L0� � � a2 � a1
L0� 0 � � � 1� 0 � � � 1� 0 � � � 1� (1)
where the position � and extent � represent the central abscissa and the length of the damagedregion with respect to the unstrained cable arc-length. The additional conditions 2� � 2� �
at Dip Teoria Dello Stato on May 25, 2009 http://jvc.sagepub.comDownloaded from

870 M. LEPIDI ET AL.
Figure 1. Damaged cable: (a) natural unstressed configuration �0� (b) static equilibrium� (c) staticconfiguration �S under self-weight.
and 2� � � impose the physical requirement that the cable ends represent strict limits for thedamaged region.
2.1. Static Equilibrium Configuration
Since the cable model admits only axial internal forces, everywhere tangential to its localprofile, determining the cable response to self-weight requires the solution of a geometricshape-finding problem, pursuing the unknown static configuration �S in the vertical plane(Figure 1(c)).
Consider the cable suspended between two fixed supports at the same level, at relativedistance L. Adopting the Lagrangian curvilinear abscissa s as the only independent variable,the unknown Cartesian coordinate functions x�s� and y�s�, which parametrically locate theposition of each cable particle point P�s�, have to be determined to solve the static problem.
Introducing the geometric constraint which states that the cable wholly lies in the verti-cal plane, imposing the global equilibrium conditions under the assumption of constant cableself-weight per unit arc-length and, finally, adopting an exact kinematic formulation in theelastic constitutive relation of the material, the exact closed-form solution can be achieved.To present it, a convenient non-dimensional form of the variables and the mechanical para-meters is introduced
�s � s
L0� �x � x
L� �y � y
L� h � 2H
W� � 2V
W� � W
2E A� � � L0
L(2)
at Dip Teoria Dello Stato on May 25, 2009 http://jvc.sagepub.comDownloaded from

DAMAGE IDENTIFICATION IN ELASTIC SUSPENDED CABLES 871
where H and V are the vertical and horizontal reactions at the left-hand support (Figure 1(b)),and W is the total cable weight. The cable flexibility factor represents the elongation ofa half-unit length fixed-free cable hanging vertically under self-weight, while the so-calledaspect ratio � (Irvine and Sinclair, 1976) is a geometrical parameter distinguishing betweenpretensioned (� � 1) and non-pretensioned (� � 1) cables.
Geometrically, the cable equilibrium configuration is described by a parametric com-posite plane curve (Deniskin, 1999), whose map from the s-parameter domain to the verticalplane is defined by the piecewise functions
x�s� �
�������
h� [s � 1�s�] if 0 � s � �1
h� [� �s � ��1�� 1�s�] if �1 � s � �2
h� [s � ��� � 1�s�] if �2 � s � 1
y�s� �
�������
� [s� � s�� 2�s�] if 0 � s � �1
� [�s� � s�� ���1 � � �1�� 2�s�] if �1 � s � �2
� [s� � s�� ��� � � 2��� 2�s�] if �2 � s � 1
(3)
where � � �1 � ���1, the tilde is omitted for sake of simplicity, and the auxiliary functions 1�s� and 2�s�, which only depend on the support reactions, are reported in the appendix.The boundaries of the damaged region represent the joints among the three adjacent segmentscomposing the curve.
Exact closed-form solutions are obtainable also for the axial tension and the elongationper unit length of the cable. As expected from considerations on the local equilibrium, thetension is found to vary with continuity along the whole cable length, whereas the elongationjumps to higher values in the damaged region, owing to the reduced axial stiffness. Note thatthe horizontal component of the axial tension is constant and equal to the reaction h, owingto the absence of horizontal loads.
The present model accurately tracks the transition to the undamaged case, since as thedamage intensity vanishes, the cable profile exactly approaches the elastic catenary curve,first obtained by Irvine (1981). Assuming the cable horizontal tension h and the midspansag f as global descriptors of the static solution, the comparison with the undamaged cableproves that the damage essentially produces two major effects: (i) a tension loss, due to theminor axial stiffness in the damaged region� and (ii) a sag augmentation of the parabolicprofile, due to the consequent reduction in the transversal geometric stiffness. Two main ob-servations can be drawn immediately: first, both of these effects can be captured only if theaxial elasticity is considered in the cable model� and, second, the two effects are not inde-pendent. Indeed, the sag amplification would be exactly the inverse of the tension reductionfor uniform horizontal distribution of the cable self-weight density, which is rigorously validonly for the taut strings.
Making reference to the known tension hu and sag fu of the undamaged cable, h and fassume the meaning of residual tension and amplified sag, and are suitably introduced as
h � � 2hu� f � �2 fu (4)
at Dip Teoria Dello Stato on May 25, 2009 http://jvc.sagepub.comDownloaded from

872 M. LEPIDI ET AL.
Figure 2. Effects of damage on the cable static response: (a) tension reduction factor �2 and (b) sagaugmentation �2 versus the Irvine parameter �2.
where the tension reduction factor (� � 1) and the sag augmentation factor (� � 1) havebeen introduced. In view of the influence of the two factors on the cable dynamics, their de-pendence on the cable mechanical properties and the damage parameters should be outlinedseparately.
A major property shown by the static problem solution is that the knowledge of theonly Irvine parameter �2, which comprehensively accounts for the cable elasto-geometricalproperties
�2 � 64 f 2u
hu(5)
is sufficient to completely describe both the effects of damage on the cable response to self-weight, since the factors � and � depend only on �2. As an example, two initially undamagedcables with different lengths and materials (different and � values), but having the sameIrvine parameter, present equal tension loss � and sag augmentation �, if subject to the samedamage conditions. In other words, once the static solution of the undamaged cable (hu andfu) is known, the Irvine parameter (5) is sufficient to determine the modified static solutionof the damaged cable (h and f ). Furthermore, the Irvine parameter describes the transition,across a critical value (��2 24), from pretensioned (�2 � ��2) to non-pretensioned cable(�2 � ��2). In Figure 2 the factors �2 and �2 show asymptotical limit behavior for bothpretensioned, highly taut cables (�2 ��2) and for non-pretensioned, highly slack cables(�2 � ��2). In particular, the damage minimally affects the static response of the slackcables (�2 � 1� �2 � 1), while for taut cables the two factors tend to constant values,corresponding to those of a taut string.
With respect to the damage parameters, both the factors �2 and �2 increase for moresevere damage, as observable from Figure 2, looking at the curves for different intensities
at Dip Teoria Dello Stato on May 25, 2009 http://jvc.sagepub.comDownloaded from

DAMAGE IDENTIFICATION IN ELASTIC SUSPENDED CABLES 873
and fixed damage extent (� � 0�1). However, a significant note, in view of the inverseproblem, is that some cases of indeterminacy may occur. Indeed equal values of the tensionloss and sag augmentation may correspond to:
(i) greater intensity (�2 � �1), or extent (�2 � �1), of damage in slacker cables (�22 � �2
1)�(ii) different combinations of damage and extent (�2 � �1, �2 � �1) in the same cable
(�22 � �2
1).
Therefore, the knowledge of the Irvine parameter �2 is not only sufficient to determine thetwo major effects of given damage to the static configuration of the cable, but also necessaryto remove at least the first source of indeterminacy.
Finally, it can be demonstrated that the two factors are substantially independent of thedamage position, which only slightly disturbs the symmetry of the static profile.
2.2. Dynamical Problem
The exact static configuration �S of the damaged cable, once mapped by a convenient repara-meterization y�x�, can be used as the initial reference for the actual dynamical configuration�, which is described by the dimensional Cartesian components of motion u�x� t� and ��x� t�in the vertical plane.
Letting �1 be the first frequency of the undamaged cable, the following non-dimensionalvariables and mechanical parameters are introduced
�u � u
L� �� � �
L� �� � �1�� � � E A
H� � 2 � 1
�21
H
mL2� (6)
where � is the ratio between the axial elastic stiffness and the transversal geometric stiffnessof the cable, and � is the inverse ratio between the first frequency of the undamaged cableand that of the taut string with the same mechanical properties (� � 1).
If the hypothesis of quasi-static cable stretching is assumed for the low-frequency dy-namics, as is commonly used for undamaged cables, the longitudinal component u�x� t� canbe condensed in the description of the dominant transversal motion. Differently from undam-aged cables, this hypothesis does not determine a spatially uniform, but a piecewise constantaxial strain
� �x�s�� �� ����
e���� �1 � s � �2
�e�� �� otherwise(7)
where e��� � 1� �
1� ��1� ��
�� 1
0y � dx � 1
2
� 1
0�� �2dx
�� (8)
Since � � 1, it can be noted that a greater strain value affects the damaged region, whichhas reduced axial stiffness with respect to the undamaged regions. However, even if the axialstrain presents two jump discontinuities at the boundaries of the damaged region, its valuedepends only on the amplitude of the jumps and the distance between them (the intensity andextent of damage), but not on their location (the position of damage), owing to the integraldefinition of e���.
at Dip Teoria Dello Stato on May 25, 2009 http://jvc.sagepub.comDownloaded from

874 M. LEPIDI ET AL.
The static condensation procedure lets the model describe the oscillations of the dam-aged cable through the only dynamic variable ��x� t�, which is also demonstrated to be con-tinuous within the whole domain, meaning that no tangent discontinuities arise at the dam-aged region boundaries even in the dynamical configuration. Thus, the non-linear equationgoverning the free undamped oscillations of the cable reads, in non-dimensional form,
�� � �2� 2� � �� 2
y � �
e��� � 0� (9)
where the tilde has been omitted for sake of simplicity, while dot and apex denote differenti-ation with respect to the non-dimensional time � and horizontal abscissa x , respectively.
Equation (8), equipped with the homogeneous boundary conditions ��0� � 0 and ��1� �0, represents a non-linear integral-differential equation with a variable coefficient (the vari-able static curvature y ). As for the statics, the dynamical model consistently degeneratesinto the Irvine model of undamaged cable for vanishing damage.
2.2.1. Linear Modal Properties
The small amplitude oscillations of the damaged cable can be studied by linearizing theequation (8) around the reference static configuration. Therefore, the solution of the ensuinglinear problem can be tackled by employing the separation-of-variables method. If the solu-tion ��x� � � � ei����x� is assumed, and the dependence on time is eliminated, the ordinarydifferential equation in the spatial variable ��x� yields
� 2� � �2� � �y 1� �
1� ��1� ��
� 1
0y� dx� � � �
��1(10)
with homogeneous boundary conditions ��0� � 0 and ��1� � 0.Equation (9) constitutes the model integral-differential eigenproblem, to be solved in the
unknown system eigenfunctions ��x� and eigenfrequencies �. The right-hand term of theequation degenerates into a constant if the damaged cable static configuration is convenientlydescribed by the symmetric parabola y�x� � 4 f �x�x2�, which has been proved to representa satisfying approximation if the cable is non-shallow (Irvine, 1981), and the damage is notheavy (Lepidi et al., 2007).
Since in the right-hand term of (9) the integral vanishes for the anti-symmetric integrandfunctions, a distinction should be made between the case of anti-symmetric (homogeneouseigenproblem) and symmetric eigenfunctions (non-homogeneous eigenproblem).
The cable frequencies of the anti-symmetric eigenfunctions are the integer multiples ofthe product 2�� . Thus, an explicit expression for the i th frequency can be given
� i
2�� i�� i � �� (11)
whereas the frequencies of the symmetric eigenfunctions satisfy the characteristic equation
�
2�� tan
��
2�
�� 4
��2
��
2�
�3
� � � 1� �
1� ��1� ��
�4
�2� (12)
at Dip Teoria Dello Stato on May 25, 2009 http://jvc.sagepub.comDownloaded from

DAMAGE IDENTIFICATION IN ELASTIC SUSPENDED CABLES 875
It should be noted that the eigensolution is formally identical to that of the Irvine model forundamaged cables (Irvine, 1981). In particular, for vanishing damage (� � 1, � � 1),the loci of the cable frequencies versus �2 exactly recover the well-known Irvine diagram.Starting from this reference solution, the sensitivity of the eigenfrequencies with respect tothe damage parameters can be discussed.
Although formally identical, (10) and (11) differ from those of the undamaged cable on:(i) the denominator � applied to the frequency � of both the symmetric and anti-symmetricmodes� and (ii) the denominator � affecting the cubic term of the characteristic equation forthe frequencies of only the symmetric modes. They can be recognized as two simultaneouseffects induced by the damage on the cable spectrum.
From a mechanical viewpoint, the first damage effect is due to the reduction of thegeometric stiffness resulting from the static tension loss, and is referred to as geometric effect.It acts on both the anti-symmetric and symmetric modes, producing a frequency reductionexactly equal to the tension reduction factor � . Increasing one of the damage parameters, �or �, determines a greater reduction in the frequencies. In view of the inverse problem, it isworth noting that different damage conditions, corresponding to different couples (�� �), leadto undistinguished geometric effects if they determine the same tension loss.
The second damage effect directly follows from the augmentation in the static sag, andis referred to as the static sag effect. However, recalling that in solving the static problem thissecond effect itself was proved to partially dependent on the reduced geometric stiffness, itcannot be considered independent of the first effect. Differently from the geometric effect,the static effect acts only on the frequencies of symmetric modes. Formally, it can be con-sidered as a correction to the Irvine parameter of the undamaged cable, which because ofthe damage assumes the equivalent value �2
eq � ��2. Otherwise, it can be said that a dam-aged cable possesses the same symmetric frequencies, although reduced by the factor � , ofan undamaged cable with the equivalent Irvine parameter �2
eq. An exceptional case exists inwhich the symmetric frequencies are not sensitive to the static effect: those cables whoseunstrained length is exactly coincident with the distance between the supports (� � 1), forwhich �2
eq � �2 (� � 1).Figure 3 shows the ratio ri � �i��u�i versus the Irvine parameter of the undamaged
cable, for a selected extent (� � 0�2), and increasing damage intensities �. The damageinduces a frequency reduction (ri � 1) for both the symmetric (i � 1� 3) and the anti-symmetric (i � 2� 4) modes in the whole �2-range, but with some differences. The curvesof the first anti-symmetric frequency possess monotonic properties (i � 2, Figure 3(c)),and show asymptotical limiting behavior for strongly pretensioned cable (constant effect, forlow �2-value), or non-pretensioned slack cables (negligible effect, for high �2-value). Themonotonic decrease of the frequency reduction is explained recalling that the anti-symmetricfrequencies are sensitive only to the geometric effect due to the tension loss, which monoton-ically decreases for increasing �2-values (Figure 2). It can be observed from (10) that thegeometric effect on the anti-symmetric frequencies does not depend on the mode number.Therefore, the curves depicted in Figures 3(c) are representative of the damage effects alsoon the higher anti-symmetric frequencies.
The curves of the first symmetric frequency (i � 1, Figure 3(a)) result instead from thesuperposition of the static effect on the geometric effect. The static effect destroys the curvemonotonic property just around the transition point ��2, while it does not modify the curves
at Dip Teoria Dello Stato on May 25, 2009 http://jvc.sagepub.comDownloaded from

876 M. LEPIDI ET AL.
Figure 3. Damage effect on the cable frequencies. Frequency ratio: (a), (b) r1 of the first symmetricmode� (c) r2 of the first anti-symmetric mode� (d) r3 of the second symmetric mode.
for the low and high �2-value regions, where the curves maintain the asymptotic behaviordriven by the geometric effect only. In Figure 3(b) the two effects have been distinguishedfor the curve with damage intensity � � 0�6. Taking as a reference the monotonic curve dueto the geometric effect only (continuous line), the superimposed static effects determines aminor frequency reduction (light gray, dashed line) in the pretensioned cables range (�2 ���2), and a major frequency reduction (dark gray, dashed line) in the non-pretensioned cablesrange (�2 � ��2). This behavior wholly depends on a different modification of the Irvineparameter around the transition point ��2. In fact, it can be shown that in this region thestatic effect alternatively produces an apparent increasing (� � 1, for pretensioned cables)or decreasing (� � 1, for non-pretensioned cables) of the Irvine parameter (Lepidi et al.,2007).
3. INVERSE PROBLEM
The inverse problem of damage identification is addressed here by employing proceduresbased on the comparison between the analytical and the experimentally measured dynamical
at Dip Teoria Dello Stato on May 25, 2009 http://jvc.sagepub.comDownloaded from
DAMAGE IDENTIFICATION IN ELASTIC SUSPENDED CABLES 877
response of the cables. In previous literature studies similar procedures have been effec-tively applied to many mechanical examples (Vestroni and Capecchi, 2000� Morassi, 2001�Cerri and Ruta, 2004), and various authors suggest different meaningful and synthetic datato characterize the response and drive the comparison (for instance, the spectral properties).The best estimate of the damage parameters is that which ensures the maximum closenessbetween the experimental data and the analytical results.
A few preliminary points should be made about the application of this technique to thedamaged cables, since the identification of damage based on dynamical measures may as-sume peculiar features here, strictly inherent in the cable model. The major difference withrespect to other structural elements concerns the preliminary knowledge of the static de-formed configuration, which is a strict requirement in the assessment of the cable spectralproperties. Consequently, any identification procedure based on the dynamical response, forinstance in terms of frequencies, should first consider how the damage modifies the cablestatic profile. The solution of the identification procedure might instead turn out to be in-correct or meaningless if the dynamical response were evaluated without first updating thestatic configuration, that is, considering its modification due to damage. It is here pertinentto recall that, having introduced the tension loss and the sag augmentation as convenient de-scriptors, the knowledge of the only Irvine parameter of the undamaged cable is sufficient toassess this modification.
An additional remark is that neither the geometric nor the static effect of damage onthe cable frequencies could be captured if the axial elasticity of the cable were not consid-ered in solving the static problem. This requirement excludes the possibility of assuming thehypothesis of inextensible cable under static loads, as instead is common practice in cabledynamics, in order to deal with a reference static solution easier-to-handle (Irvine, 1981).
In the following a frequency-based identification procedure is proposed to identify thedamage parameters. To preliminarily verify the possibility of univocally assessing the dam-age starting from frequency information, consider the characteristic equation (11) for thesymmetric frequencies, which can be written in compact form as g��� �� �� � 0. Knowingthe model frequencies ��j ( j � 1� 2� � � �) due to generic simulated damage p� � ���� ���, theuniqueness of the identification solution is proved if there exists a minimum number N offrequencies ��j , which permits univocally locating the point p� in the damage parameter plane� � ���� �� � �2 : 0 � � � 1� 0 � � � 1� by inverting N equations g j��� �� �
�j� � 0.
Based on the aforementioned considerations regarding the static and dynamical effectsof damage, it is convenient to tackle the problem into two steps. The first step consists ofa search for the minimum number of frequencies sufficient to univocally determine the twodamage descriptors represented by tension loss (geometric effect) and the Irvine parametervariation (static effect). To this end, the characteristic equation (11) can be written as
g1��� �� � 1
�g2��� �� (13)
and can be solved to have an explicit form for the modification factor � of the Irvine para-meter as a function of the only tension loss �
���� �� � g2��� ��
g1��� ��� (14)
at Dip Teoria Dello Stato on May 25, 2009 http://jvc.sagepub.comDownloaded from

878 M. LEPIDI ET AL.
Figure 4. Uniqueness of the damage identification problem based on frequency measurements:(a) functions � j ��� �
�j �� (b) functions ���� �� and ���� ��.
The uniqueness of the problem of evaluating the parameters � and � is verified if the systemof equations � j��� �
�j�, for all of the frequencies ��j , admits the unique solution (��� ��).
To illustrate the problem, the curves corresponding to the functions � j��� ��j�, with j �
1� 2� 3, are shown in Figure 4(a) for a particular damage p�, defined by the parameter values���� ��� � �0�25� 0�125� in a cable with �2 � 24�315. The knowledge of the first and secondsymmetric frequencies ( j � 1� 2) furnishes two curves which cross only in the right solution(��� ��� � �0�9977� 0�9932�, marked with a filled black circle. In this case the additionof information related to other frequencies would be redundant. However, different pairsof frequencies do not always define one solution, as occurs for the curves �2��� ��2� and�3��� �
�3�, which have two more cross points (unfilled circles), well distinct from the correct
point. In any case, even when two frequencies determine two or more possible solutions, theaddition of a further frequency is sufficient to identify the correct solution.
Once the correct descriptors (��� ��) have been determined, a second step is requiredto verify with certainty that their values correspond to a unique pair of damage parameters(�� �). To this end, the equations to be simultaneously satisfied are
���� �� � ��� ���� �� � ��� (15)
Even if the explicit dependence ���� cannot be found from either of the equations, eachequation is satisfied by a root locus of couples (�� �). The uniqueness of the problem solutionis verified if they cross at a single point. At this step two equations are requested to univocallydetermine two unknowns, that is, no redundancy would be available to resolve possible casesof multiple solutions. Figure 4(b) shows the contour plot of the functions ���� �� and ���� ��.The two roots loci of (14), although close to each other, are found to cross at a unique point inthe parameter plane �, and are therefore sufficient to correctly determine the target damagesolution p�.
at Dip Teoria Dello Stato on May 25, 2009 http://jvc.sagepub.comDownloaded from

DAMAGE IDENTIFICATION IN ELASTIC SUSPENDED CABLES 879
3.1. Frequency-based Damage Identification
Linear frequencies robustly characterize the experimental dynamics of civil structures� hencethey can be used efficiently to identify possible damages through a synthetic comparison ofthe structural measured response with the eigensolution of predictive analytical models.
Since the cable transversal frequencies show appreciable sensitivity to the damage inten-sity and extent, these parameters are expected to be observable from an identification methodbased on the inverse eigenproblem. Two frequency-based procedures are presented here toverify this possibility, and their efficacy and robustness are discussed. On the other hand,additional information from the cable response is necessary to identify the damage position,whose effect on the transversal frequencies is practically negligible. Finally, it is worth not-ing that enriching the procedure by the addition of further observed spectral quantities wouldturn out to be essentially ineffective. In fact, the eigenfunctions of cables, in distinction fromother structures, are only minimally modified by damage (Lepidi et al., 2007).
3.1.1. Single-phase Procedure
An optimal estimate of the damage is furnished by the parameter combination �p � � ��� ���which in the parameter space minimizes an objective function ���� �� : � �� �� measuringthe error between the experimental and the analytical frequencies. Among the others, anefficient choice is to consider a square measure of the errors, defining the function
���� �� �k
i�1
�����d�i � �d�i��� ��
�u�i
����2
� (16)
where �d�i and �d�i��� �� represent the i th experimental and analytical frequencies of thedamaged cable, respectively, while �u�i represents the corresponding frequency of the un-damaged cable.
Even if it has been verified that the measures of the two lowest symmetric frequencies(k � 2) can be sufficient to univocally determine the damage parameters, a larger number ofmeasures (k � 2) could in any case improve the solution reliability in the presence of data er-rors. The effectiveness of the procedure has been initially verified using pseudo-experimentaldata, self-generated from the model for a selected damage p� � ���� ��� in cables with dif-ferent Irvine parameters. Using the two lowest symmetric frequencies, the results systemat-ically show that a single absolute minimum point �p of the objective function ���� �� existsin the whole space �, which always allows a univocal and correct identification of the target( �p � p�).
Figure 5(a) shows on a logarithmic scale the contour plot of the objective function���� �� in the parameter space Pr � ���� �� � �2 : 0 � � � 0�6� 0 � � � 0�3� forthe damaged cable with �2 � 0�1 and the damage p� � �0�25� 0�125�. Repeating the iden-tification process under different Irvine parameters and damage conditions always leads tosimilar results (Lepidi, 2006). In particular, a recurrent observation is that the absolute mini-mum is hosted within a narrow curved concavity �, whose contour can be easily recognizedfollowing the function gradient. Within the concavity, the search for the minimum may beill-conditioned by the extremely low values here assumed by the objective function. This
at Dip Teoria Dello Stato on May 25, 2009 http://jvc.sagepub.comDownloaded from

880 M. LEPIDI ET AL.
Figure 5. One-phase procedure for the identification of the simulated damage p� � ���� ��� in a cablewith �2 � 0�1: (a) objective function ���� ��� (b) tension loss function �2��� ��.
particular behavior can be explained by superimposing � to the contour plot of the tensionreduction factor �2��� �� in the same parameter region (Figure 5(b)). It is evident that theconcavity approximately lies on a iso-�2 curve, which identifies a locus of damage parame-ter pairs which induce the same static tension loss (�2 � 0�9798 in this case). Thus, it can bepointed out that: (i) the tension loss �2 represents a synthetic, significant and, in particular,easily observable damage measure� but, on the other hand, (ii) difficulties may arise in dis-tinguishing the correct solution �p among all the parameter pairs p � �, which approximatethe pseudo-experimental spectrum equally well.
To briefly discuss the result, recall that � is also the reduction factor of the cable fre-quencies due to the geometric effect only. Therefore, the above observations clarify that,since the frequencies have higher sensitivity to the reduction of geometric stiffness, the lossof static tension is the damage effect that is easiest to identify. On the other hand, the lowersensitivity of the frequencies to the static effect may turn out to be insufficient to distinguishbetween different damage conditions which produce the same geometric effect. Moreover,adding experimental data (k � 2) could reduce this ill-conditioning only if the symmetricfrequencies are selected. Consider instead the opposite case, in which the objective functionis defined using anti-symmetric frequencies only. Since they are not sensitive to the staticeffect anyway, it would be impossible to distinguish between all of the damage conditionsproducing the same geometric effect, and the identification problem would present a locusof indifferent solutions, corresponding to equally valued minima of the objective function.It is worth noting that the same shortcomings would affect the procedure also using the fre-quencies of the out-of-plane cable motion, whose variation in damaged cable equally dependonly on the loss of static tension (Lepidi, 2006).
at Dip Teoria Dello Stato on May 25, 2009 http://jvc.sagepub.comDownloaded from

DAMAGE IDENTIFICATION IN ELASTIC SUSPENDED CABLES 881
3.1.2. Two-phase Procedure
To partially reduce the aforementioned drawbacks, the identification procedure can be con-veniently rearranged into a two-phase scheme, already described in the literature (see, forexample, Cerri and Vestroni (2003)), which is commonly appreciated for the computationaladvantages of decomposing the resolutive algorithm in successive searches for the minimumof different single-variable functions. Its employment is here accompanied by the reformu-lation of the objective function in terms of the measure of damage which is more easilyobservable, that is, the tension loss expressed by the factor � . Therefore, it also permits asignificant optimization of the inverse problem resolution.
Since the relation ���� �� is monotonic, it can be numerically inverted to realize an op-portune change of variable ���� �� in the objective function (15). The new function ���� �� :Q �� �� yields
���� �� �k
i�1
�����d�i � �d�i��� ��
�u�i
����2
(17)
whose domain Q is generally non-rectangular, since it is still bounded within the limitsexpressed by the conditions 0 � � � 1 and 0 � ���� �� � 1.
The identification problem still requires searching for the minimum of a two-variablefunction, but the unknown parameters are now the damage intensity � and the tension loss� � once these parameters are identified, the damage extent is determined through the relation���� �� already used in (16). For sake of completeness, it could be observed that the role ofthe parameters � and � can certainly be inverted.
The advantage of this reformulation consists of having made explicit the dependence ofthe objective function on the �-parameter, with respect to which it is more sensitive. Underthe same damage conditions as before, the contour plot of the function ���� �� is shown inFigure 6(a). As expected, the target solution is again obtained. In addition, two points shouldnow be clear: (i) the concavity hosting the minimum lies parallel to the horizontal axes, ona constant �-value� and (ii) the new function is highly sensitive to the �-parameter, on thevertical axis. The main practical consequence is that the tension loss could potentially beevaluated without strict necessity of simultaneously seeking the correct damage intensity.In fact, fixing a generic damage intensity on the horizontal axis, the target tension loss isanyway expected to represent a minimum point of the objective function.
To give analytical consistency to the above idea, the solution of the identification prob-lem can be organized in a two-phase procedure as follows.
� Phase I: searching the minima constrained over � of the function (16) furnishes the newfunction
����� � min����� �� (18)
which is a restriction of ���� �� to the locus, described by a function �����, of the para-meter pairs which minimize the function ���� �� with respect to the only variable � .
at Dip Teoria Dello Stato on May 25, 2009 http://jvc.sagepub.comDownloaded from
882 M. LEPIDI ET AL.
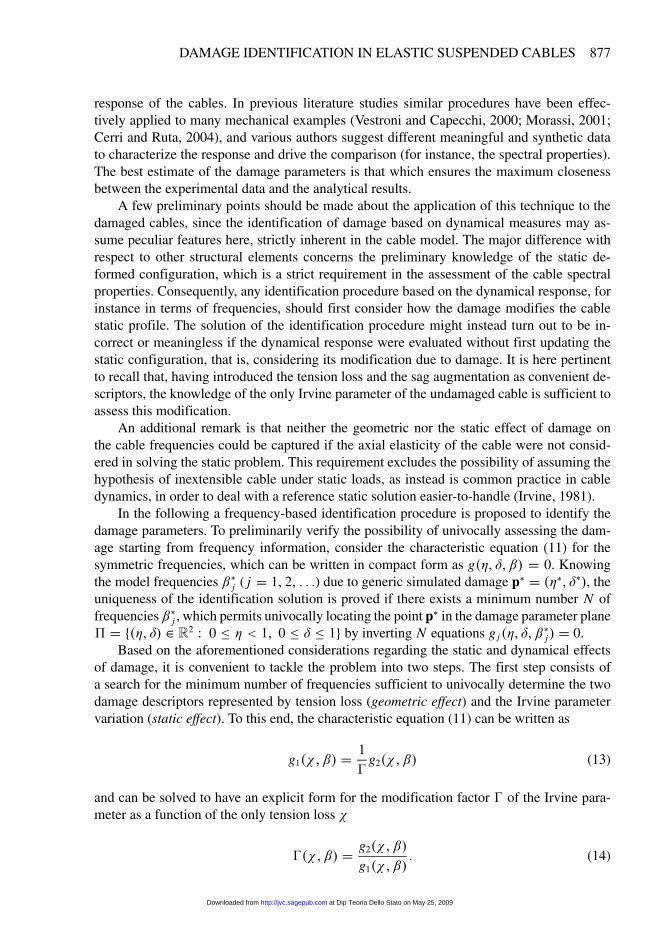
Figure 6. Two-phase procedure for the identification of the simulated damage p� � ���� ��� in a cablewith �2 � 0�1: (a) objective function ���� ��� (b) locus of minima ������ (c) single-variable objectivefunction �����.
� Phase II: the identification problem is solved by the value �� which minimizes the single-variable function �����. Finally the tension loss and the damage extent are �� � ��� ���,�� � ����� ���.
The efficacy of the two-phase procedure can be visually appreciated from Figure 6(c), wherethe function ����� is plotted. The target damage intensity (�� � 0�25) can be easily recog-nized, since it still represents an isolate and absolute minimum. However, the objective func-tion ����� maintains low values (less than 10�10) in the whole � range. This scenario couldstill compromise the identification of the damage intensity in the presence of errors, whosereal influence is discussed in the following paragraph.
Thanks to the reformulation of the objective function in terms of the �-variable, the ap-plication of the two-phase scheme to damaged cables gains additional advantages, since thealgorithm is consistent with the double effect of damage. In fact here, differently from otherapplications, the first step can already furnish us with useful information. Looking at thefunction ����� plotted in Figure 6(b), the ��-values can be considered largely independent of�. The practical consequence which has to be pointed out is twofold. First, the identificationof the tension loss does not necessarily require the completion of the second phase, since itis robustly estimated by the mean value
�� � 1
�2 � �1
� �2
�1
����� d�� (19)
where the boundaries �1 and �2 can be selected arbitrarily. In the specific case, the correctidentification (�2 � 0�9798) is obtained if they satisfy the condition ��k��� � 10�6, which
at Dip Teoria Dello Stato on May 25, 2009 http://jvc.sagepub.comDownloaded from

DAMAGE IDENTIFICATION IN ELASTIC SUSPENDED CABLES 883
limits the integration interval to the gray region in Figure 6(b). Second, the robustness ofthe tension loss identification is not reduced by the ill-conditioning which may affect theidentification of the damage intensity.
Finally, the identification of only the tension loss, which may even be sufficient in sometechnical applications, can be further simplified if the frequencies of only the anti-symmetricmodes are employed. Indeed, substituting (10) into (16) and recalling that the anti-symmetricfrequencies are only sensitive to the geometric effect, the single-variable objective functionyields
���� �k
i�1
��d�i
�u�i� �
�2
� (20)
Imposing the minimum condition ����� � 0, and making use of simple properties of thederivatives, the solution has the closed form
�� � 1
k
k i�1
�d�i
�u�i� (21)
that is, as expected, the tension loss results in the mean values of the ratios between theexperimental frequencies of the damaged cable and those of the undamaged cable. It can beconcluded that, from a computational viewpoint, it might sometimes be convenient to drivethe first phase of the identification procedure using only the frequencies of anti-symmetricmodes.
3.1.3. Influence of Errors
Modeling, algorithm and experimental errors could reduce the effective robustness of thedamage identification. Before moving from pseudo-experimental (error-free) to experimentaltests, a brief discussion is needed in order to numerically evaluate, and likely reduce, theinfluence of the error on the procedure presented. Systematic errors are not considered, sincethey can be related, for instance, to measurements biases, and therefore can be controlledonly by a proper calibration of the instruments.
The algorithmic errors are essentially inherent in the inverse eigenproblem, which needsto be solved numerically and forces the identification procedure solution to belong to a dis-crete domain with finite resolution. However, reducing the sensitivity to algorithmic errors isalways possible by properly fitting the domain discretization, paying only for the increasedcomputational effort. For instance, Figure 5(a) has been obtained by setting the procedureresolution to �!��!�� � ��0�005��0�0025�.
Greater attention should be paid to the errors which are certainly present in the data �d�i ,and propagating therefrom to the solution. In particular, attention is focused on accidentalerrors, which can be treated as random variables, obeying statistical laws, even if their am-plitude cannot be quantified a priori. To evaluate the sensitivity to data errors, random per-turbations have been artificially added to the pseudo-experimental measures, progressivelyincreasing the perturbation amplitude up to the limit value destroying the exactness of the
at Dip Teoria Dello Stato on May 25, 2009 http://jvc.sagepub.comDownloaded from

884 M. LEPIDI ET AL.
Figure 7. Effects of random errors with uniform distribution and increasing amplitude on the identificationof the damage intensity.
solution. Since the identification of the tension loss has more robust results with respect tothe damage intensity, the following analyses are focused on this last parameter.
Defining the error function ed�i�n� � zi 10�n, where zi is the i th outcome of a randomdiscrete variable z � �z1� z2� � � � � zk� with uniform probability distribution in the interval[�1� 1], the perturbed objective function is introduced
�p��� �� �k
i�1
�������d�i � ed�i�n�
�� �d�i��� ��
�u�i
�����2
� (22)
The order of the perturbation affecting each of the pseudo-experimental non-dimensional fre-quencies �d�i is represented by the integer n. It is expected that the procedure loses efficacyover a minimum value n, meaning that the non-dimensional frequency measures cannot beaffected by errors greater than 10�n .
The two-phase procedure has been applied to again identify the damage p� � �0�25�0�125� in the cable with �2 � 0�1, using the lowest three frequencies of symmetric modes(k � 3). In Figure 7 the results of the identification procedure for increasing error ampli-tudes (n � 6� 5� 4, dashed lines) are compared with the error-free case (continuous line).The minimum of the objective function ��p���, even if progressively losing its depth, con-tinues to indicate the target value (�� � 0�25) until n � 4, that is, for the error amplitude
at Dip Teoria Dello Stato on May 25, 2009 http://jvc.sagepub.comDownloaded from

DAMAGE IDENTIFICATION IN ELASTIC SUSPENDED CABLES 885
Table 1. Geometrical and mechanical properties of the 19-wire spiral strand used in theexperiments.
Strand Wire diameter Weight per Ultimate strength Elastic modulusDiameter (mm) (mm) unit length (N m�1) (kN) (kN mm�2)
8.0 1.6 3.22 53.0 150.0
ed�i�n� � 10�4. For this value, two successive independent runs can give an underestimation( ��1 � 0�205, curve c1) and an overestimation ( ��2 � 0�310, curve c2) of the right solution,respectively. However the analyses show that, if a larger set of error-affected measures isprocessed, the mean of the solutions still turns out to estimate the target well, even for highererror amplitudes, and despite the non-linearity of the frequency–parameters relationship. Inparticular, ten available measures are sufficient for increasing the error level required up toed�i�n� � 10�3, while error ed�i�n� � 10�2 can even be admitted using a larger set of data.Moreover, the choice of the uniform distribution of z might perhaps be considered too con-servative, since other less scattered, zero-mean distributions should be also appropriate, sothat the aforementioned limits likely represent a cautious estimate.
3.2. Experimental Validation
The applicability of the damage identification procedure to real cables has been tested througha campaign of experimental tests performed at the Laboratory for Dynamics of the Univer-sity of L’Aquila, where a light model has been realized for the purpose of reproducing thebehavior of the spiral strands commonly used in many engineering applications.
A stainless steel strand made of 19 wires, with a nominal diameter of 8.0 mm (nomi-nal cross section area 50.27 mm2) has been selected with the aim of accurately simulatingthe three-dimensional dynamics of a taut cable, including the anchorages at the supports(Figure 8). The main geometrical and mechanical properties of the strand, furnished by themanufacturer, are summarized in Table 1.
3.2.1. Experimental Set-up
A rectangular steel frame was designed to create a stiff restraining structure for hosting thestrand (Figure 8(d)). It was built with two C-shaped beams, on the long side, and two stiffenedplates, on the short side. The cable was anchored to the plates with terminal connectors. Atone end a lever mechanism (Figure 8(e)) allowed the strand to be placed under tension bythe application of a controlled longitudinal displacement. Once a proper tension level wasreached, the free end was fixed.
The tension force applied was estimated to be Hu � 1910�09 N, while the cable wasverified to have a free oscillation length L � 3000 mm, sag-to-span ratio fu � 0�00063,longitudinal axial to transversal geometric stiffness ratio � � 2999�53 and Irvine parameter�2 � 0�07669. These values classify the strand tested in the range of pretensioned cables,close to those commonly used as structural stays, and also not far from that whose pseudo-experimental response was simulated in the previous section.
at Dip Teoria Dello Stato on May 25, 2009 http://jvc.sagepub.comDownloaded from

886 M. LEPIDI ET AL.
Figure 8. Experimental set-up (dimensions in millimeters): (a) instrumentation positioning on theexperimental spiral strand� (b) instrumented sections at 1
2 and 14 of the cable length� (c) instrumented
section at 13 and 2
3 of the cable length� (d) the beam frame and cable cross section� (e) the levermechanism for placing the strand under tension� (f) the accelerometer clamped to the strand.
The experimental dynamical response has been recorded through a set of mono-directio-nal accelerometers anchored to the strand, whose positions were selected to collect the max-imum accelerations related to the lowest symmetric modes. Their model (Brüel and Kjær4383, Figure 8(f)) was chosen for its lightness and high sensitivity over a large frequency
at Dip Teoria Dello Stato on May 25, 2009 http://jvc.sagepub.comDownloaded from

DAMAGE IDENTIFICATION IN ELASTIC SUSPENDED CABLES 887
range. They were clamped to the strand by vice PVC elements which ensure optimal ad-herence. The complete set-up of the instrumentation is presented in Figure 8(a), where therecording directions of the accelerometers are also indicated.
The acceleration data were registered through an acquisition board (model dSPACE1103), managed by a computer operator within the framework of the SIMULINK platformfor dynamical systems. The excitation was furnished either by an imposed displacement,obtained from the instantaneous release of a point static load, or by the impacts of an in-strumented hammer. Both the excitation sources acted on a quarter of the strand length (Fig-ure 8(a)).
3.2.2. Spectral Identification of the Undamaged Cable
The early portion of the experimental campaign regarded the assessment of the spectral prop-erties of the strand in its undamaged condition. Each test was repeated many times to ensurethe redundancy of the data and to limit the impact of accidental random errors in the mea-surements.
The free oscillations of the strand, following the release of the imposed displacement orthe hammer impacts, were recorded with 2048 samples per second, to avoid aliasing phe-nomena which could disturb the frequency identification. The recording time was extendedto 30 s after the excitation, to allow the complete damping of the oscillations. Finally, thedigital signal was treated with an IIR filter with null-phase distortion.
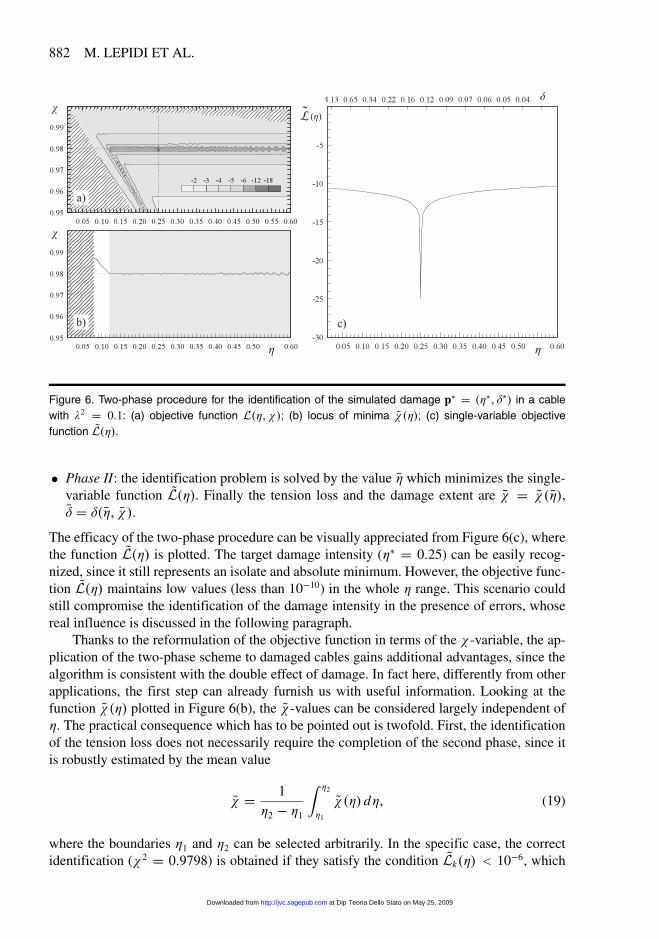
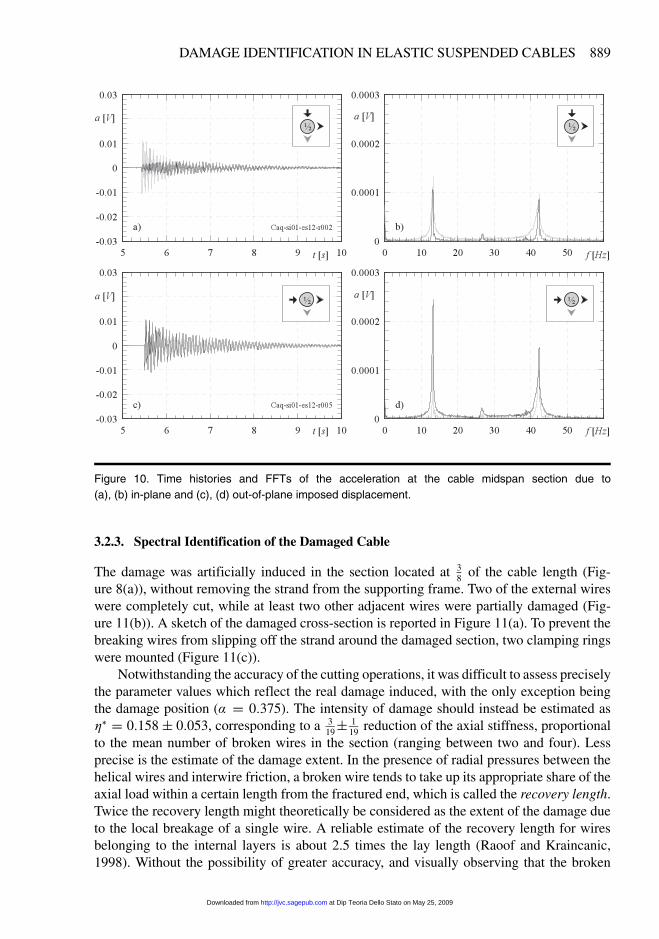
Figures 9 and 10 show a five-second interval of the acceleration time histories registeredby the two midspan accelerometers (1 and 2 in Figure 8) after a hammer impact and the re-lease of an imposed displacement, respectively. The registration furnishes both the in-plane(black) and out-of-plane component (gray) of the oscillations produced by a vertical (TestT1, Figures 9(a) and 10(a)) and horizontal impact (Test T2, Figures 9(c) and 10(c)). In bothof the tests the two components of displacement are excited, allowing the simultaneous iden-tification of the response properties. Some of the possible causes of the energy transfer fromthe directly excited component to the other are discussed later.
Assuming that the excitations furnished to the cable were able to approximate a white-noise input signal (Ewins, 2001), and having limited the oscillation amplitude to avoid non-linear effects, the frequencies of the cable were easily determined by picking the frequencypeaks from the fast Fourier transforms (FFTs) of the measured response, which are presentedin Figures 9(b) and (d) and 10(b) and (d). As expected for the frequencies of pretensionedtaut cables, it can be observed that the lowest three peaks are approximately equispaced. Thelow value obtained for the second frequency peak is due to the anti-symmetric shape of thesecond mode, which presents a node at the cable midspan, so that it minimally participatesin the measured acceleration. For damage identification, only the frequencies of the in-planemodes are considered in the following.
A robust evaluation of the frequencies was achieved by performing ten repetitions ofeach test and taking the arithmetic mean m��� of the values obtained. Table 2 summarizes theresults of the hammer tests T1 and T2. The frequencies of the symmetric modes are obtainedby processing the midspan acceleration (accelerometer 1 in Figure 8), while those of theanti-symmetric modes are obtained by processing the acceleration measured at a quarter ofthe cable length (accelerometer 4 in Figure 8). Similar results are obtained independently
at Dip Teoria Dello Stato on May 25, 2009 http://jvc.sagepub.comDownloaded from
888 M. LEPIDI ET AL.
Figure 9. Time histories and FFTs of the acceleration at the cable midspan section due to (a), (b) in-planeand (c), (d) out-of-plane hammer impact.
Table 2. Identified frequencies (Hz) of the spiral strand used in the experiments.
of the excitation direction. The variance " 2��� around the mean value is generally verylow, substantially negligible for the first frequency, and slightly increasing for the higherfrequencies (up to " 2��3� � 0�0011 for the test T1).
Based on the identified frequencies, the mechanical parameters of the analytical modelwere updated to better simulate the experimental spectrum. The minor adjustments requiredon the parameter values ( fu � 0�00058, � � 2701�67, �2 � 0�05751) can be justified con-sidering that some aspects of the experiment (for instance, the additional lumped masses ofthe accelerometers or the flexural stiffness of the strand) cannot be captured by the analyticalmodel except with opportune tuning of the mechanical parameters.
at Dip Teoria Dello Stato on May 25, 2009 http://jvc.sagepub.comDownloaded from
DAMAGE IDENTIFICATION IN ELASTIC SUSPENDED CABLES 889
Figure 10. Time histories and FFTs of the acceleration at the cable midspan section due to(a), (b) in-plane and (c), (d) out-of-plane imposed displacement.
3.2.3. Spectral Identification of the Damaged Cable
The damage was artificially induced in the section located at 38 of the cable length (Fig-
ure 8(a)), without removing the strand from the supporting frame. Two of the external wireswere completely cut, while at least two other adjacent wires were partially damaged (Fig-ure 11(b)). A sketch of the damaged cross-section is reported in Figure 11(a). To prevent thebreaking wires from slipping off the strand around the damaged section, two clamping ringswere mounted (Figure 11(c)).
Notwithstanding the accuracy of the cutting operations, it was difficult to assess preciselythe parameter values which reflect the real damage induced, with the only exception beingthe damage position (� � 0�375). The intensity of damage should instead be estimated as�� � 0�158� 0�053, corresponding to a 3
19� 119 reduction of the axial stiffness, proportional
to the mean number of broken wires in the section (ranging between two and four). Lessprecise is the estimate of the damage extent. In the presence of radial pressures between thehelical wires and interwire friction, a broken wire tends to take up its appropriate share of theaxial load within a certain length from the fractured end, which is called the recovery length.Twice the recovery length might theoretically be considered as the extent of the damage dueto the local breakage of a single wire. A reliable estimate of the recovery length for wiresbelonging to the internal layers is about 2.5 times the lay length (Raoof and Kraincanic,1998). Without the possibility of greater accuracy, and visually observing that the broken
at Dip Teoria Dello Stato on May 25, 2009 http://jvc.sagepub.comDownloaded from

890 M. LEPIDI ET AL.
Figure 11. Artificially induced damage: (a) cross section� (b), (c) photos.
wires completely lost adherence to the remaining section between the two clamping rings,it should be assumed that a lower bound for the damage extent is furnished by the distancebetween the rings (80 mm), plus twice the recovery length (350 mm, since the lay length isaround 70 mm). This estimate corresponds to a target parameter �� � 0�143 � 0�024, sincea variation up to 20% should be expected for the recovery length (Raoof and Kraincanic,1998). Finally, it should be noted that it was practically impossible to avoid the loss of theaxial symmetry in the damaged section. However, due to the helical arrangement of thewires, the damage involved all of the radial directions within a loop of the broken wires,and the axial symmetry was recovered (in a mean sense) in the region around the damagedsection.
The same tests performed on the undamaged cable were repeated on the damaged cable,replicating as much as possible the same operational conditions. In particular, ten repetitionsof the tests T1 and T2 were again performed, picking the peaks of the FFT of the accelerationsmeasured. The statistical data of the lowest frequencies identified are summarized in Table 2.Again the results of the two tests are consistent with each other and minimally scattered (witha maximum variance " 2��3� � 0�0005 for T1). Nonetheless, the frequencies seem to be moredependent on the excitation direction, which could be a secondary effect of the non-axiallysymmetric damage.
A detailed comparison between the spectra of the damaged and the undamaged cable ispresented in Table 2, where the mean of the ratio r � �d��u is reported. It can be first notedthat the damage induces a constant reduction of all of the observed frequencies (0�9721 �r � 0�9878). This result is consistent with the prediction of the analytical model of the cable.In fact, due to the low Irvine parameter (�2 � 0�05751), the cable spectrum is expected to beaffected by the geometric effect more than by the static effect.
Figure 12 compares the results of the identification in terms of frequencies and accelera-tion amplitudes, as obtained by varying the angle of the hammer impact. Only the frequenciesof symmetric modes, more significant for the damage identification, are reported. Even if theresults are more scattered in amplitude, due to difficulties in controlling the impact force, thefrequencies seem to not depend on the vibration amplitude, as would be the case in presenceof non-negligible non-linear effects. It is also useful to recognize visually that, even if thefrequency ratio is the same (r1 r3), the absolute shift of the third frequency is approxi-mately three times that of the first frequency (!�3 3!�1). This observation, althoughobvious, could be useful for resolving the frequency shift if the FFT does not have sufficient
at Dip Teoria Dello Stato on May 25, 2009 http://jvc.sagepub.comDownloaded from

DAMAGE IDENTIFICATION IN ELASTIC SUSPENDED CABLES 891
Figure 12. Comparison between the identified frequencies of the damaged and the undamaged cablefor different angle impacts: (a) first frequency� (b) third frequency.
Table 3. Statistics of the results from the identification of the damage parameters.
m��� " ��� M���[n]
��I 0.117 0.0057 0.110[3]
��I 0.186 0.0067 0.255[3]
��2I 0.97010 0.0000 0.96945[3]
��2II 0.97008 0.0000 0.96944[3]
frequency resolution. In these cases it might be convenient to consider higher frequencies,whose modification, under fixed damage conditions, is easier to observe.
3.2.4. Damage Identification
Selecting the identified frequencies of only the symmetric modes (�1 and �3), the iden-tification of the damage parameters was initially performed by applying the single-phaseprocedure based on the minimization of the objective function in (15), where only the firstand third frequency are used (i � 1� 3), and the function minimum was searched for in theparameter plane �r � ���� �� � �2 : 0 � � � 0�6� 0 � � � 0�3�.
Ten measures of the damaged cable frequencies, one from each test repetition, wereused for the identification of the damage parameters. Each identification run furnished asingle solution corresponding to an isolated and absolute minimum, the position of whichin the parameter plane �r is presented in Figure 13(a) for the T1 test. The statistics of thesingle-phase identification results (with subscript I) are instead presented in Table 3, in whichthe mean and the variance of the identified parameters are reported, together with the mostrecurrent value M���[n], where n is the number of recurrences.
at Dip Teoria Dello Stato on May 25, 2009 http://jvc.sagepub.comDownloaded from

892 M. LEPIDI ET AL.
Figure 13. Identification of the damage parameters. Minima of the objective function: (a) ���� ���(b) ���� ��.
The mean value of the damage intensity m� ��I� � 0�117 is consistent with the rangeof expected value (�� � 0�158 � 0�053). Recalling that the undamaged section is made of19 wires, the mean intensity can be more significantly written as m� ��I� 2
19 � 2190 , which
exactly corresponds to two wires broken completely, plus a third partially cut (with a loss ofaxial stiffness of 2
10 ). The mean value of the damage extent m���I� � 0�186 is instead slightlygreater than the maximum expected target ��max � 0�167. This result can probably be justifiedif an increase in the recovery length is admitted for the particular broken wires, since theybelong to the external layer and therefore exchange minor interwire friction with the adjacentwires. Similar comments can be made regarding the most recurrent values obtained for thedamage intensity M� ��I� � 0�110, and extent M���I� � 0�255. Although encouraging withregard to the mean, it should be recognized that the values are in fact significantly scattered,with variance " 2� ��I� � 0�0057 and " 2���I� � 0�0067. Their dispersion is observable inFigure 13(a), where it can also be noted that it is greater for the extent than for the intensityof damage.
The procedure is instead more robust in identifying the tension loss, consistently withthe conclusions already drawn from pseudo-experimental data. In fact, the factors �2 cal-culated from each identified couple of parameters present a negligible variance around themean m� ��2
I � � 0�9701, corresponding to an appreciable tension loss of about 3%. Visualconfirmation of this good result can be run out from Figure 13(a), in which the iso-�2 linesare reported in the background. It can be easily observed that all of the identified couples ofparameters � ��� ��� lie around the same curve, corresponding to ��2 � 0�97.
Based on these remarks, the fast identification of the tension loss was addressed apply-ing the two-phase procedure based on the search for the minimum of the objective function(16), using again the first and third frequency (i � 1� 3). Taking advantage of the possibilityof identifying the tension loss already at the end of the first phase, the factor � was identifiedthrough the integral expression (18), and its statistics are reported in Table 3 (with subscript
at Dip Teoria Dello Stato on May 25, 2009 http://jvc.sagepub.comDownloaded from

DAMAGE IDENTIFICATION IN ELASTIC SUSPENDED CABLES 893
II). As expected, a negligible variance of the results exists around the mean, whose valuem� ��2
II� � 0�9701 exactly agrees with m� ��2I �. This remark can be better appreciated by look-
ing at the positions of the identified couples of parameters � ��� ��� in Figure 13(b), which areall aligned at approximatively the same vertical abscissa of their mean value.
3.2.5. Effects of the Instrumentation on the Measures
Validating the identification procedure through experimental data requires some care con-cerning the approximations inherent in the analytical model used to describe the mechanicalbehavior of the physical object. For instance, the model necessarily neglects the presenceof the accelerometers, which could instead locally disturb the theoretical inertial and geo-metrical properties of the cable section, such as the axial symmetry (see Figure 8(b) and (c)).Nonetheless, and considering that the disturbances due to the instrumentation are limited to afew sections, the procedure was applied assuming that the cable experimental behavior couldstill be described consistently by the analytical model� in particular, the modal shapes wereconsidered uncoupled in the vertical and the horizontal components. This result implies thatno mechanical energy should flow towards the component not excited directly. Observing aposteriori that the experimental results slightly but systematically disagree with this model-ing expectation (recall Figures 10 and 11), a minor disturbance caused by the accelerometersmust be admitted, and a quantitative evaluation of the consequent reduction in the modelaccuracy should be assessed.
According to the model, it was assumed that the accelerometers oriented in the vertical(horizontal) plane would measure the cable in-plane (out-of-plane) oscillations� one mightask whether, in the practical implementation, a significant modal coupling of the compo-nents of motion arises instead. To answer this question, a finite element model of the cablewas formulated, including the eccentric lumped masses of the accelerometers. The resultsobtained for the lowest frequencies are summarized in Table 4. Only the symmetric modesin the horizontal (1 and 5) and the vertical planes (2 and 6) are reported, due to their sig-nificance for the purpose of damage identification. It can be observed first that the numericalfrequencies exhibit an excellent agreement with those identified from the experiments. Themodal components in the transversal plane ZY of the symmetric modes are presented in Fig-ure 14 for the sections at 1
2 (M), 13 (T) and 1
4 (Q) of the cable length. It is verified that themodes maintain their planarity, since the three sectional modal components present the sameorientation. The angle # with respect to the horizontal plane is also reported in Table 4, andcompared with the theoretical value (# � 90� for the in-plane, and # � 0� for the out-of-plane modes). It is found that the presence of the instrumentation in fact induces a rotation ofthe modal shapes, but this is limited to a few degrees for the first in-plane and out-of-planemodes (# � 4� for modes 1 and 2), while it increases for the second in-plane and out-of-planemodes (# 21� for modes 5 and 6). Therefore, the model accuracy is expected to decreaseprogressively for the higher modes, which are more sensitive to the disturbances from theinstrumentation, while is largely sufficient in describing the lowest experimental modes. Infact, according to these results, the accelerometers should in fact have effectively registered99% (modes 1 and 2) and 93% of the modal components (modes 5 and 6).
It should finally be noted that other factors, such as incorrect positioning or inherentdefects of the instrumentation, or inaccuracy in the application angle of the excitation, are
at Dip Teoria Dello Stato on May 25, 2009 http://jvc.sagepub.comDownloaded from

894 M. LEPIDI ET AL.
Table 4. Experimental and numerical spectral properties of the undamaged cable.
FE model Experimental Model Dominant��2� �Hz� # ��2� �Hz� # Component
Mode 1 13.325 �3�56� 13.328 0� Out-of-planeMode 2 13.342 86.43� 13.343 90� In-planeMode 5 43.047 �21�17� 42.894 0� Out-of-planeMode 6 43.066 69.03� 42.962 90� In-plane
Figure 14. Modal components at selected sections from the finite element model: (a) first symmetricmodes out-of-plane (mode 1) and in-plane (mode 2)� (b) second symmetric modes out-of-plane (mode 5)and in-plane (mode 6).
more related to the operational activities. They could also have affected the results, and mayalso provide a partial explanation of the experimental evidence.
4. CONCLUSIONS
The possibility of using vibration measures for damage identification in elastic suspendedcables through procedures based on their experimental response is investigated. A continu-ous monodimensional model allows the description of different effects produced by a diffusereduction of the axial stiffness on the cable statics and linear dynamics. The damage is syn-thetically described by three parameters: position, intensity and extent.
The closed-form solution of the model eigenproblem is possible for non-shallow ca-bles recurring to the static condensation of the longitudinal component of motion. All of thefrequencies of the transversal motion are reduced, owing to the minor geometric stiffness fol-lowing from the damage-induced loss of the static pretension (geometric effect). Moreover,only the frequencies of symmetric modes are subjected to a second damage effect, owing tothe modification of the reference static configuration of the cable (static effect), which may
at Dip Teoria Dello Stato on May 25, 2009 http://jvc.sagepub.comDownloaded from

DAMAGE IDENTIFICATION IN ELASTIC SUSPENDED CABLES 895
alternatively increase or decrease the frequency reduction, depending on the cable Irvine pa-rameter. Only the intensity and extent of damage are verified to significantly affect the cabletransversal spectral properties, whereas they are not sensitive to the damage position, whichaffects essentially the longitudinal spectral properties.
The damage parameters are identified through a frequency-based procedure which mini-mizes an objective function expressing the error between the analytical and the experimentalresponse. The lowest transversal symmetrical frequencies are selected as observed quanti-ties. Pseudo-experimental data are initially used to verify the procedure. The possibility ofeffectively identifying the damage intensity and extent was confirmed, since the uniquenessand correctness of the solution were verified. Then the mechanical origin of possible ill-conditioning affecting the solution is discussed, providing evidence of the high sensitivityof the frequencies to the geometric effect that makes the identification of the static tensionloss easier. In distinction to this, if errors are present, the low sensitivity of the frequenciesto the static effect may turn out to be insufficient to distinguish between different combina-tions of damage intensity and extent which produce the same geometric effect. Therefore,a two-phase procedure is formulated, which takes advantage of a direct dependence of theobjective function on the tension loss, with respect to which the function is more sensitive.Then a simple method is used to evaluate the limits of the procedure in reliably identifyingthe less observable parameters, given an increasing level of random errors.
The effectiveness of the damage identification procedure has been tested on real cablesthrough a campaign of experimental tests performed at the Laboratory for Dynamics of theUniversity of L’Aquila, where a light physical model has been constructed purposely to re-produce the behavior of the spiral strands commonly used in many engineering applications.The tests essentially ensure the applicability of the procedure to real cases of in-service ca-ble, providing an easy and reliable identification of tension loss, which is itself a measure ofdamage. Knowing the tension loss, the assessment of the other damage parameters of inten-sity and extent suffers from a certain dispersion of the data around the mean values, whichare in any case consistent with the expected results. Finally, we evaluated how the spectralproperties of the instrumented cable may be affected by the presence of the instrumentation,which does not, in any case, compromise the reliability of the measurement.
Acknowledgments. This work was partially supported under the FY 2006-2007 PRIN Grant “Health assessment andmonitoring of civil engineering structures through advanced dynamics methods” from the Italian Ministry of Univer-sity and Research.
APPENDIX
The auxiliary functions introduced to describe the cable static configuration �S for the coor-dinate functions (3) read
1�s� � 1
2
�arcsinh
�h
�� arcsinh
� � 2s
h
���
2�s� � h
2
���1�
�h
�2 ��
1�� � 2s
h
�2�� � (A.1)
at Dip Teoria Dello Stato on May 25, 2009 http://jvc.sagepub.comDownloaded from

896 M. LEPIDI ET AL.
REFERENCES
Agbabian, M. S., Masri, S. F., Miller R. K., and Caughey T. K., 1991, “System identification approach to thedetection of structural changes,” ASCE Journal of Engineering Mechanics 117(2), 370–390.
Capecchi, D. and Vestroni, F., 1999, “Monitoring of structural systems by using frequency data”, Earthquake Engi-neering and Structural Dynamics 28(5), 447–461.
Casas, J. R. and Aparicio, A. C., 1994, “Structural damage identification from dynamic-test data,” Journal of Struc-tural Engineering 120(8), 2437–2450.
Cerri, M. N. and Ruta, G. C., 2004, “Detection of localised damage in plane circular arches by frequency data,”Journal of Sound and Vibration 270(1–2), 39–59.
Cerri, M. N. and Vestroni, F., 2003, “Use of frequency change for damage identification in reinforced concretebeams,” Journal of Vibration and Control 9(3), 475–491.
Deniskin, Y., 1999, “Design of closed composite parametric curves and surfaces,” Computer Graphics and Geometry1(1), 1–24.
Di Paola, M., Navarra, N., and Pirrotta, A., 2006, “Damage detection based on the analytical signal rappresentation,”in Proceedings of the 4th World Conference on Structural Control and Health Monitoring, San Diego, CA.
Doebling, S. W., Farrar C. R., and Prime M. B., 1998, “A summary review of vibration-based damage identificationmethods,” The Shock and Vibration Digest 30(1), 91–105.
Ewins, D. J., 2001, Modal Testing: Theory, Practice and Application, Research Studies Press Ltd, Baldock, UK.Hearn, G. and Testa, R. B., 1991, “Modal-analysis for damage detection in structures,” ASCE Journal of Structural
Engineering 117(10), 3042–3063.Irvine, H. M., 1981, Cable Structures (Series in Structural Mechanics), MIT Press, London.Irvine, H. M. and Sinclair, G. B., 1976, “The suspended elastic cable under the action of concentrated vertical
loads,” International Journal of Solids and Structures 12(4), 309–317.Kosmatka, J. B. and Ricles, J. M., 1999, “Damage detection in structures by modal vibration characterization,”
ASCE Journal of Structural Engineering 125(12), 1384–1392.Lepidi, M., 2006, “Damage identification in taut cables through dynamic measures” (in Italian), Doctorate Thesis,
University of Rome “La Sapienza”.Lepidi, M., Gattulli, V., and Vestroni, F., 2007, “Static and dynamic response of elastic suspended cables with
damage,” International Journal of Solids and Structures 44(25–26), 8194–8212.Liu, P.-L., 1995, “Identification and damage detection of trusses using modal data”, Journal of Structural Engineer-
ing 121(4), 599–608.Morassi, A., 2000, “The crack detection problem in vibrating beams”, in Problems in Structural Identification and
Diagnostics: General Aspects and Application, Springer, Berlin.Morassi, A., 2001, “Identification of a crack in a rod based on changes in a pair of natural frequencies,” Journal of
Sound and Vibration 242(4), 577–596.Morassi, A., 2007, “Damage detection and generalized Fourier coefficients,” Journal of Sound and Vibration 302(1–
2), 229–259.Raoof, M. and Kraincanic, I., 1998, “Determination of wire recovery length in steel cables and its practical appli-
cations,” Computers & Structures 68(5), 445–459.Ren, W. X. and De Roeck, G., 2002a, “Structural damage identification using modal data. I: Simulation verification,”
Journal of Structural Engineering 128(1), 87–95.Ren, W. X. and De Roeck, G., 2002b, “Structural damage identification using modal data. II: Test verification,”
Journal of Structural Engineering 128(1), 96–104.Salawu, O. S., 1997, “Detection of structural damage through changes in frequency: a review,” Engineering Struc-
tures 19(9), 718–723.Tabatabai, H., 2005, “Inspection and maintenance of bridge stay cable systems,” NCHRP Synthesis Report 353,
TRB, Washington, DC.Thyagarajan, S. K., Schulz, M. J., Pai, P. F., and Chung, J., 1998, “Detecting structural damage using frequency
response functions,” Journal of Sound and Vibration 210(1), 162–170.Vestroni, F. and Capecchi, D., 1996, “Damage evaluation in vibrating beams using experimental frequencies and
finite element models”, Journal of Vibration and Control 2(1), 69–86.Vestroni, F. and Capecchi, D., 2000, “Damage detection in beam structures based on frequency measurements,”
ASCE Journal of Engineering Mechanics 126(7), 761–768.
at Dip Teoria Dello Stato on May 25, 2009 http://jvc.sagepub.comDownloaded from