
Resettlement Plan Viet Nam: Secondary Cities Development ...
Upload
independentCategory
view
0download
0
Journal of Hydrology (2007) 334, 199–214
ava i lab le a t www.sc iencedi rec t . com
journal homepage: www.elsevier .com/ locate / jhydrol
The changing flow regime and sediment load of theRed River, Viet Nam
Thi Phuong Quynh Le a,b, Josette Garnier a,*, Billen Gilles a, Thery Sylvain a,Chau Van Minh b
a UMR Sisyphe, University P. and M. Curie, Box 123, 4 Place Jussieu, 75005 Paris, Franceb Institute of Natural Product Chemistry, Vietnam Academy of Natural Science and Technology, 18 Hoang Quoc Viet Road,Cau Giay District, Hanoi, Viet Nam
Received 6 June 2005; received in revised form 8 October 2006; accepted 11 October 2006
00do
*
45
ga
KEYWORDSThe VietnameseRed River;Suspended matters;Particulate phosphorus;Reservoirs
22-1694/$ - see front mattei:10.1016/j.jhydrol.2006.10
Corresponding author. Tel88.E-mail addresses: [email protected] (J. Gar
r ª 200.020
.: +33 1 4
tp@yahoonier).
Summary South-East Asian Rivers contribute very significantly to the global sedimentload to the ocean, hence to global biogeochemical cycles, and are subject to rapidchanges owing to recent population and economic growth. The Red River system (VietNam and China) offers a good example of these changes. Previous estimates (beforethe year 1980) of the suspended matter loading of the Red River ranged from 100 to170 · 106 t yr�1, i.e. from 640 to 1060 t km�2 yr�1. The strong dependence of suspendedsolid transport on hydrology results in a large year-to-year variability. Based on the avail-able hydrological data from the period 1997–2004, and on a one-year survey of daily sus-pended matter of the three main tributaries of the Red River system in 2003, a simplifiedmodeling approach, distinguishing between surface runoff and base flow, is established toestimate the mean suspended loading of the Red River under present conditions. Theobtained value is 40 · 106 t yr�1, corresponding to a specific load of 280 t km�2 yr�1. Itreflects a 70% decrease of the total suspended load since the impoundment of the HoaBinh and Thac Ba reservoirs in the 1980s. Following the planned construction of two addi-tional reservoirs, the model predicts a further reduction by 20% of the suspended load ofthe Red River, which might be compensated by an expected increase in suspended loadingdue to enhanced rainfall induced by climate change. Using measurements of the totalphosphorus content of the suspended material in the different Red River tributaries,the present phosphorus delivery by the Red River can be estimated as 36 · 106 kgP yr�1.ª 2006 Elsevier B.V. All rights reserved.
6 Elsevier B.V. All rights reserved
4 27 70 27; fax: +33 1 44 27
.com (T.P.Q. Le), josette.
Introduction
Sediments transported by rivers to the coastal sea play animportant role in the global biogeochemical cycles of many
.

200 Le, T.P.Q. et al.
elements. Martin and Meybeck (1979) thus estimated thatover 90% of the global riverine delivery of some major bio-genic elements such as phosphorus or iron was transportedwith suspended matter. Ludwig et al. (1996) showed that45% of the total organic carbon annually discharged fromglobal rivers into the ocean was in particulate form.
At the global and regional scale, the factors controllingriverine sediment fluxes have been extensively studied (Mil-liman and Syvitski, 1992; Walling and Fang, 2003; Meybecket al., 2003; Syvitski, 2003; Syvitski et al., 2003). Non-hu-man factors linked to climate, topography and lithology of
Red R.
Son T
Thao R.
Da
R.
LoR.
BoitichR
Hoa Binh
Hoa Binh Reservoir
Thac Ba Reservoir
100 km100 km
50 km50 km
Figure 1 Map of the Red River basin: (a) its three m
the watershed, obviously play a major role. However, hu-man activities may also be important. Some of them, likedeforestation, crop-farming, surface mining, road construc-tion or urbanization would have led to a 50% increase of sed-iment discharge at the global scale in the last 2000 years(Milliman and Syvitski, 1992). More recently, on the con-trary, reservoir construction has caused a significant de-crease of sediment loads at the global scale (Milliman,1997; Walling and Fang, 2003). Vorosmarty et al. (1997);Vorosmarty et al. (2003) estimated that 30% of the globalsediment flux was trapped in large reservoirs.
Duong R.
Day R.
Ba Lat
Tra Ly
Haiphong
Day
R.
Ninh
Co
Hanoï
ay
NhueR.
.
Luc Nam R.
Tonkin Bay
a
b
ajor upstream tributaries and (b) its delta area.
The changing flow regime and sediment load of the Red River, Viet Nam 201
South and South-East Asia, due to their peculiar tectonicstatus linked to the Himalaya mountain formation, contrib-ute a much larger share than other areas in the world to theglobal riverine flux of suspended solids (Holeman, 1968; Mil-liman and Mead, 1983; Milliman and Syvitski, 1992; Ludwigand Probst, 1998; Meybeck et al., 2003). These authors esti-mated that 30–70% of the present global suspended matterdelivered by rivers to the coastal ocean originates fromSouthern Asia (e.g. 6–14 · 109 t yr�1). The mean specificsediment yield of Asian and South-Eastern Asian riversamounts to 380–600 t km�2 yr�1, compared to a globalmean of 116 t km�2 yr�1 (Milliman and Mead, 1983). Thisarea of the world is also the one where recent changes inpopulation and economic development are the more rapid,strongly affecting the functioning of hydrosystems. Predict-ing these modifications is therefore one major challenge forpresent days of environmental science.
The Red River in Viet Nam and China is a good example ofa South-East Asian river system strongly affected by anthro-pogenic activities. Its overall sediment load has been ranked15th in the world (Milliman and Syvitski, 1992). It is doubtfulhowever whether these general estimates, which have beenfor decades cross-cited by many authors (Holeman, 1968;Meybeck et al., 1989; Ludwig et al., 1996; Van Maren andHoekstra, 2004), take into account the recent man-madechanges in the Red River watershed, like deforestationand damming.
In this paper, we analyze a set of measured dischargesand suspended solid concentrations, gathered from severalsources in Viet Nam, in order to assess the present sus-pended matter load of the Red River system and the trendsof its variations over the last 40 years. Furthermore, we use
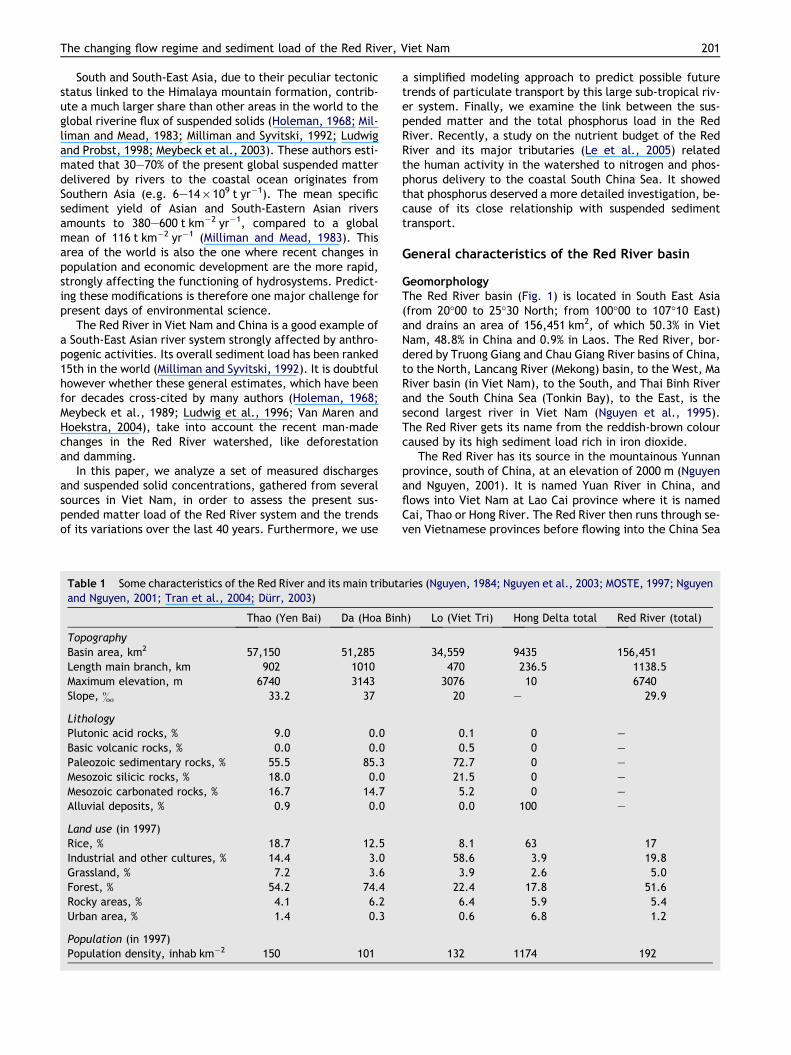
Table 1 Some characteristics of the Red River and its main tributaand Nguyen, 2001; Tran et al., 2004; Durr, 2003)
Thao (Yen Bai) Da (Hoa Bin
TopographyBasin area, km2 57,150 51,285Length main branch, km 902 1010Maximum elevation, m 6740 3143Slope, & 33.2 37
LithologyPlutonic acid rocks, % 9.0 0.0Basic volcanic rocks, % 0.0 0.0Paleozoic sedimentary rocks, % 55.5 85.3Mesozoic silicic rocks, % 18.0 0.0Mesozoic carbonated rocks, % 16.7 14.7Alluvial deposits, % 0.9 0.0
Land use (in 1997)Rice, % 18.7 12.5Industrial and other cultures, % 14.4 3.0Grassland, % 7.2 3.6Forest, % 54.2 74.4Rocky areas, % 4.1 6.2Urban area, % 1.4 0.3
Population (in 1997)Population density, inhab km�2 150 101
a simplified modeling approach to predict possible futuretrends of particulate transport by this large sub-tropical riv-er system. Finally, we examine the link between the sus-pended matter and the total phosphorus load in the RedRiver. Recently, a study on the nutrient budget of the RedRiver and its major tributaries (Le et al., 2005) relatedthe human activity in the watershed to nitrogen and phos-phorus delivery to the coastal South China Sea. It showedthat phosphorus deserved a more detailed investigation, be-cause of its close relationship with suspended sedimenttransport.
General characteristics of the Red River basin
GeomorphologyThe Red River basin (Fig. 1) is located in South East Asia(from 20�00 to 25�30 North; from 100�00 to 107�10 East)and drains an area of 156,451 km2, of which 50.3% in VietNam, 48.8% in China and 0.9% in Laos. The Red River, bor-dered by Truong Giang and Chau Giang River basins of China,to the North, Lancang River (Mekong) basin, to the West, MaRiver basin (in Viet Nam), to the South, and Thai Binh Riverand the South China Sea (Tonkin Bay), to the East, is thesecond largest river in Viet Nam (Nguyen et al., 1995).The Red River gets its name from the reddish-brown colourcaused by its high sediment load rich in iron dioxide.
The Red River has its source in the mountainous Yunnanprovince, south of China, at an elevation of 2000 m (Nguyenand Nguyen, 2001). It is named Yuan River in China, andflows into Viet Nam at Lao Cai province where it is namedCai, Thao or Hong River. The Red River then runs through se-ven Vietnamese provinces before flowing into the China Sea
ries (Nguyen, 1984; Nguyen et al., 2003; MOSTE, 1997; Nguyen
h) Lo (Viet Tri) Hong Delta total Red River (total)
34,559 9435 156,451470 236.5 1138.5
3076 10 674020 – 29.9
0.1 0 –0.5 0 –
72.7 0 –21.5 0 –5.2 0 –0.0 100 –
8.1 63 1758.6 3.9 19.83.9 2.6 5.0
22.4 17.8 51.66.4 5.9 5.40.6 6.8 1.2
132 1174 192

202 Le, T.P.Q. et al.
through four distributaries called, Ba Lat, Lach Gia, Tra Lyand Day (Fig. 1), (Dang, 2000). The Red River receives twomajor tributaries: the Da and Lo rivers. The Da Riverreaches the Thao River at Ha Nong district, in Viet tri city,at position 105�20 05000E and 21�15 000 0N. The Lo River joinsthe main branch of the Red River at Viet Tri city, slightlydownstream, at position 105�26 04000E and 21�17 050 0N. Somegeneral characteristics of the sub-basins (morphology,lithology, land use and population) are listed in Table 1.
The mountain areas that form a large part of the up-stream basin of the Red River are tectonically very activeand show high erosion rates (Fullen et al., 1998). The geo-logic substratum of the upper basin is dominated by consol-idated paleozoic sedimentary rocks of complex lithology,with variable contributions of mesozoic silicic or carbonaterocks. Naturally, alluvial deposits dominate the delta area.Soils in the upper basins are typically Ultisols (by US classi-fication) or ‘‘red soil’’ (by Chinese soil classification), whilein the delta area grey soil and alluvial soil dominate (MOSTE,1997).
Meteorology
The climate of the Red River basin is of sub-tropical mon-soon type, characterised by the alternation of a dry and arainy season, the latter lasting from May to October andcumulating 85–95% of the total yearly rainfall. Meteorolog-ical data (temperature, humidity, rainfall and solar radia-tion) were obtained from 12 Vietnamese meteorologicalstations in the Red River basin (IMH, 1997–2004), as wellas from the Kunming station in China (Chinadata, 1998–2001) for the period 1997–2004. The 13 meteorological sta-tions were distributed within the different sub-basins on thebasis of Thiessen polygons (Fig. 2), and the integrated meanvalues by sub-basin were calculated.
In the period from 1997 and 2004, the 10-day meantemperature in the three upstream sub-basins varied from14–16 �C in winter to 26–27 �C in summer. In the Deltaarea, temperature was higher, varying from 17 to 30 �C.
N
Kunming1228
Ha Noi1600
Thai Binh1577Nam Dinh
1602
Ha Giang2332
Son La 1341
Lai Chau2413
Sa Pa2578
Tuyen Quang1635
Hoa Binh1930
Phu Tho1242
Yen Bai 1738
Lao Cai1771
0 20 50 70 100km
Annual rainfall values in period of 1997- 2003
2000 mm
1600 ÷ 2000 mm
1600 mm
Kunming1228
Ha Noi1600
Thai Binh1577Nam Dinh
1602
Ha Giang2332
Son La 1341
Lai Chau2413
Sa Pa2578
Tuyen Quang1635
Hoa Binh1930
Phu Tho1242
Yen Bai 1738
Lao Cai1771
0 20 50 70 100km
Annual rainfall values in period of 1997- 2003
2000 mm
1600 ÷ 2000 mm
1600 mm
Kunming1228
Ha Noi1600
Thai Binh1577Nam Dinh
1602
Ha Giang2332
Son La 1341
Lai Chau2413
Sa Pa2578
Tuyen Quang1635
Hoa Binh1930
Phu Tho1242
Yen Bai 1738
Lao Cai1771
0 20 50 70 100km
Annual rainfall values in period of 1997- 2003
2000 mm
1600 ÷ 2000 mm
1600 mm
≥
<
2000 mm
1600 ÷ 2000 mm
1600 mm
Figure 2 Rainfall distribution within the Red River basin:annual values for the period 1997–2003, at the differentstations.
Humidity averaged from 82% to 84% throughout the year inthe Vietnamese part of the basin (IMH, 1997–2004), whileit was lower, about of 67–70%, in the Chinese part (China-data, 1998–2001).
The mean annual rainfall was 1590 mm in the whole RedRiver basin. The rainfall in the Chinese territory (annualaverage value of 1230 mm) was lower than in the Vietnam-ese part (1810 mm). It varied greatly in space (Fig. 2), withthe highest values (2000–2600 mm yr�1) in the upstreamarea of Lai Chau, Sa Pa, Ha Giang, smaller values in the Chi-nese upper basin (cf. above 1230 mm yr�1) and in the inter-mediate zone of Tuyen Quang, Yen Bai and Lao Cai (from1630 to 1770 mm yr�1), and show its lowest values in themedian zone of Son La and Phu Tho (1250–1350 mm yr�1).In the Delta, the values were around 1600 mm yr�1
(Fig. 2). Considering the four sub-basins, the mean annualvalues were 1904 mm yr�1 for the Thao, 1889 mm yr�1 forthe Da, 1874 mm yr�1 for the Lo and 1677 mm yr�1 in thedelta. In the period from 1997 to 2004, the lowest rainfallwas observed in 1999 and the highest value in 1997 and2001 in all three upstream sub-basins (Fig. 3).
Potential evapotranspiration (PET, mm) was calculatedby Turc’s formula (Turc, 1961), based on monthly tempera-ture (T, �C) and sunshine duration (Sdur, h). These data wereobtained from the respective meteorological stations:
PETmm=month ¼ 0:4 T �CðIgþ 50Þ=ðT �Cþ 15Þ
where T �C is the atmospheric temperature in �C during theconsidered period. Ig is the total solar radiation expressedin cal cm�2 d�1 in the considered period, which can be cal-culated by the relation:
Ig ¼ IgAð0:18þ 0:62 h=HÞ
in which IgA is the energy of solar radiation in the absence ofatmospheric attenuation, expressed in cal cm�2 d�1; h/H isthe relative duration of sunshine, H is the duration of theastronomic day and h, the duration of sunshine period perday; IgA and H values, which only depend on the latitudeand the period of the year, are provided by Turc (1961).
The use of Turc’s formula, sometimes criticized whenapplied to arid climate, is justified under humid conditions,as shown by the comparative review of Jensen et al. (1990).
The mean annual PET (from 1997 to 2004) was ratherhomogeneously distributed over the whole basin area, vary-ing within a rather narrow range, from 880 to 1150 mm yr�1.Annual PET values were 1040 mm yr�1 in the Thao basin,1040 mm yr�1 in the Da, 1000 mm yr�1 in the Lo and 1080mm yr�1 in the delta (Fig. 3).
Population and land use
The population in the whole Red River basin was estimatedat 30 million inhabitants in 1997, of which 34% in China, 65%in Viet Nam and less than 1% in Laos (Chinadata, 1998–2001;MOSTE, 1997). The population density in the different sub-basins varied significantly from 101, 132 and 150 inhab km�2
in the Da, Lo and Thao sub-basins, respectively, to 1174 in-hab km�2 in the delta area (Table 1).
Land use is very diverse from one upstream sub-basin toanother, as well as between these basins and the delta area(Le et al., 2005). Industrial crops (mainly coffee, rubber,cotton, sugar, tobacco, etc.) dominate (58.1%) in the Lo

Thao sub-basin
0
5
10
15
20
1997 1998 1999 2000 2001 2002 2003
PL
U-P
ET
, mm
.d-1
PETPLU
Da sub-basin
0
5
10
15
20
1997 1998 1999 2000 2001 2002 2003
PL
U-P
ET
, mm
.d-1
Lo sub-basin
10
15
20
1997 1998 1999 2000 2001 2002 2003
PL
U-P
ET
, mm
.d-1
Delta sub-basin
5
10
15
20
1997 1998 1999 2000 2001 2002 2003
PL
U-P
ET
, mm
.d-1
Thao sub-basin
0
5
10
15
20
1997 1998 1999 2000 2001 2002 2003
PL
U-P
ET
, mm
.d-1
PETPLU
Thao sub-basin
0
5
10
15
20
1997 1998 1999 2000 2001 2002 2003
PL
U-P
ET
, mm
.d-1
PETPLU
Da sub-basin
0
5
10
15
20
1997 1998 1999 2000 2001 2002 2003
PL
U-P
ET
, mm
.d-1
Da sub-basin
0
5
10
15
20
1997 1998 1999 2000 2001 2002 2003
PL
U-P
ET
, mm
.d-1
Lo sub-basin
10
15
20
1997 1998 1999 2000 2001 2002 2003
PL
U-P
ET
, mm
.d-1
Lo sub-basin
0
5
10
15
20
1997 1998 1999 2000 2001 2002 2003
PL
U-P
ET
, mm
.d-1
Delta sub-basin
5
10
15
20
1997 1998 1999 2000 2001 2002 2003
PL
U-P
ET
, mm
.d-1
Delta sub-basin
0
10
15
20
1997 1998 1999 2000 2001 2002 2003
PL
U-P
ET
, mm
.d-1
Figure 3 Potential evapotranspiration (PET) and rainfall(PLU) variations (mm d�1) in the upstream sub-basins of theRed River from 1997 to 2003 (Thao, Da, Lo) and in the Delta sub-basin (Delta).
The changing flow regime and sediment load of the Red River, Viet Nam 203
basin, forests (74.4%) in the Da basin, paddy rice fields(66.3%) in the delta area, while the Thao basin is character-ized by a larger diversity of land use including forest (54.2),paddy rice fields (18.7) and industrial crops (12.8).
The forest cover of the Chinese Yunnan province, in theupper part of the Red River basin, declined from about 60%in the 1950s to 24.2% in 1990 (UNEP, 1990). About 10% of theland in this province was categorized as severely eroded inthe 1980s. Moreover, (Fullen et al., 1998) reported that,
over last 250–500 years, erosion rates in the Yunnan prov-ince have increased 15-fold as the result of poor land man-agement, cultivation on steep slopes, deforestation andlack of conservation. Similarly, deforestation has been in-tense in North Viet Nam especially in the northern moun-tains and the centre, where the percentage of forestcover decreased from 95% in 1943 to 17% in 1991 (WorldBank, 1996).
Dams and discharge regulation
There are two large reservoirs in the Red River watershed:Hoa Binh and Thac Ba (Fig. 1 and Table 2). The Hoa Binh res-ervoir, damming the Da River, is the largest one in VietNam. It was constructed in 1985, has a surface of 208 km2
and an effective storage capacity of 9.5 km3 (Vu, 2002b;Ngo and Tran, 1998). Besides protecting the Hanoi city fromexceptional peak floods like this in 1971, and providingwater for irrigation at low river flow, it serves to generateelectric power and provides 40% of Viet Nam electricity(7.8 billion kW h). The Thac Ba reservoir, impounded in1972 on the Chay River (a tributary to the Lo River) is thesecond largest reservoir in Viet Nam, with a surface areaof 235 km2 and a storage volume of 2.94 km3 (Vu, 2002a).It provides 0.4 billion kW h (Dang, 2001; Vu, 2002a).
Another large reservoir, the Son La, upstream of the HoaBinh on the Da river, is planned to start operating in 2010–2015. It will have a surface area of 440 km2, a total storagecapacity of 25.5 km3 (an effective storage of 16.2 km3), anda water level of 265 m above sea level. The Dai Thi reservoiris already in construction on the Lo River and is planned tobe operational in 2010. It will have a surface area of 42 km2,a total storage of 3.0 km3 and a water level of 115 m (Dang,2000).
Hydrological regime of the Red River and itstributaries
Total and specific discharge of the sub-basinsThe average annual discharge at the Son Tay station (down-stream of the confluence of the three main tributaries) re-ported by To (2000) for the period 1902–1990 was3740 m3 s�1, corresponding to a specific discharge of26.1 L s�1 km�2. For the period 1997–2004, for which weobtained the daily values from Ministry of Environmentand Natural Resources, (MONRE (1997–2004)), we calcu-lated a rather similar value of 3389 m3 s�1 (23 L s�1 km�2).
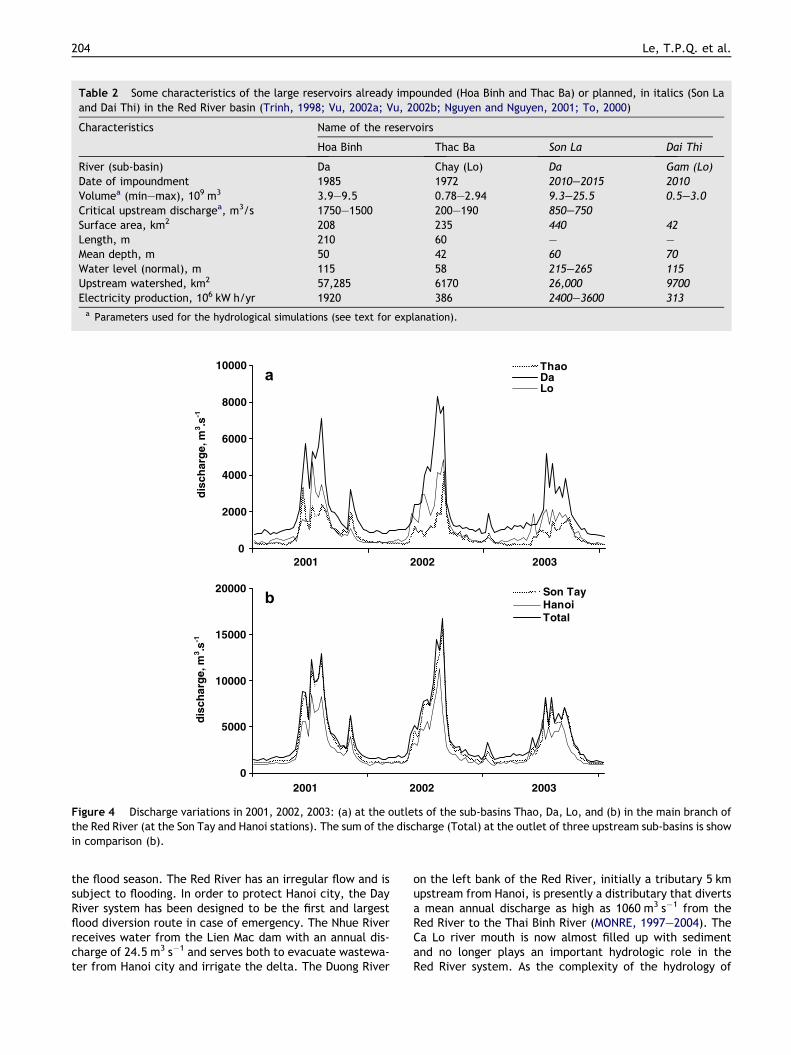
The discharge measured at the Son Tay station is logi-cally equal to the sum of the discharge of the three majortributaries Da, Thao and Lo, except in the dry season, whensome water is diverted through irrigation channels (Fig. 4).The discharge at Hanoi however, is substantially lower byabout 20% in all seasons. Downstream of the Son Tay sta-tion, and upstream of Hanoi, water from the main branchcan be diverted through four main distributaries: the DayRiver and the Nhue River in the south east side and the CaLo River and the Duong River in the North East side(Fig. 1). Since the implementation of the Day River FloodDiversion Scheme in the 1937, the Day River draws waterfrom the Red River main branch through the Day Dam, lo-cated 35 km upstream from Hanoi, possibly opened during
0
2000
4000
6000
8000
10000
dis
char
ge,
m3 .s
-1
ThaoDaLo
2001 2002 2003
0
5000
10000
15000
20000
dis
char
ge,
m3 .s
-1
Son TayHanoiTotal
2001 2002 2003
b
a
Figure 4 Discharge variations in 2001, 2002, 2003: (a) at the outlets of the sub-basins Thao, Da, Lo, and (b) in the main branch ofthe Red River (at the Son Tay and Hanoi stations). The sum of the discharge (Total) at the outlet of three upstream sub-basins is showin comparison (b).
Table 2 Some characteristics of the large reservoirs already impounded (Hoa Binh and Thac Ba) or planned, in italics (Son Laand Dai Thi) in the Red River basin (Trinh, 1998; Vu, 2002a; Vu, 2002b; Nguyen and Nguyen, 2001; To, 2000)
Characteristics Name of the reservoirs
Hoa Binh Thac Ba Son La Dai Thi
River (sub-basin) Da Chay (Lo) Da Gam (Lo)Date of impoundment 1985 1972 2010–2015 2010Volumea (min–max), 109 m3 3.9–9.5 0.78–2.94 9.3–25.5 0.5–3.0Critical upstream dischargea, m3/s 1750–1500 200–190 850–750Surface area, km2 208 235 440 42Length, m 210 60 – –Mean depth, m 50 42 60 70Water level (normal), m 115 58 215–265 115Upstream watershed, km2 57,285 6170 26,000 9700Electricity production, 106 kW h/yr 1920 386 2400–3600 313a Parameters used for the hydrological simulations (see text for explanation).
204 Le, T.P.Q. et al.
the flood season. The Red River has an irregular flow and issubject to flooding. In order to protect Hanoi city, the DayRiver system has been designed to be the first and largestflood diversion route in case of emergency. The Nhue Riverreceives water from the Lien Mac dam with an annual dis-charge of 24.5 m3 s�1 and serves both to evacuate wastewa-ter from Hanoi city and irrigate the delta. The Duong River
on the left bank of the Red River, initially a tributary 5 kmupstream from Hanoi, is presently a distributary that divertsa mean annual discharge as high as 1060 m3 s�1 from theRed River to the Thai Binh River (MONRE, 1997–2004). TheCa Lo river mouth is now almost filled up with sedimentand no longer plays an important hydrologic role in theRed River system. As the complexity of the hydrology of

Thao River
0
50
100
150
200
250
1997 1998 1999 2000 2001 2002 2003
Sp
ec. d
isch
., L
.s-1
.km
- ²
Da River
0
50
100
150
200
250
1997 1998 1999 2000 2001 2002 2003
Sp
ec. d
isch
., L
.s-1
.km
-²Lo River
0
50
100
150
200
250
1997 1998 1999 2000 2001 2002 2003
Sp
ec. d
isch
., L
.s-1
.km
- ²
Hong River
0
50
100
150
200
250
1997 1998 1999 2000 2001 2002 2003
Sp
ec. d
isch
., L
.s-1
.km
-²
Figure 5 Seasonal specific discharge (Spec. disch. L s�1 km�2)at the outlet of the three sub-basins (Thao, Da, Lo) and in themain branch of the Red River (at the Son Tay station, Hongriver) from 1997 to 2003.
The changing flow regime and sediment load of the Red River, Viet Nam 205
the delta system, comprising these multiple distributariesof the Red River, would require a separate study, we mainlyanalysed the outputs of water and suspended matter frommeasurements at the outlets of the three main tributariesand/or at the upstream Son Tay station on the main branch.
Over the last 100 years, the maximum daily discharge atthe Son Tay station, 37,800 m3 s�1 was observed in August1971, while the minimum value, 368 m3 s�1 was observedin May 1960. High floods are always a threat for the highlypopulated delta area. In the recent history of Viet Nam,serious floods causing dyke breakage were noted in 1913,1915, August 1945 and 1971 when water level in Hanoireached, respectively, 11.35 m, 11.2 m, 11.45 m and13.3 m (the highest known),(To, 2000). In fact, the four ma-jor floods within the return period of 100 years were causedby the simultaneous strong floods in the Lo, Thao and Da riv-ers. The Da River generally plays the major role, represent-ing 53–57% of total discharge. Since the Hoa Binh reservoirwas constructed on the Da River (1985), the floods in Hanoihave been fairly well controlled (Le, 1997).
The seasonal variations of specific discharge at the out-lets of the three upstream sub-basins and the main branchduring the period 1997–2004 (MONRE, 1997–2004) are pre-sented in Fig. 5. The Da and Lo basins have much higher spe-cific discharges (34 and 25 L s�1 km�2 as an annual mean in2003), than the Thao river (9.6 L s�1 km�2), which has alarge part of its basin in the drier Chinese territory.
Modelling the rainfall–runoff relationship
In order to further explain the differences in mean specificdischarge between sub-basins as well as their seasonal vari-ations, we tried to relate the specific discharge to rainfall.In view of the small number of meteorological stationswhere rainfall data are available, only a simplified, spatiallylumped approach is possible. We chose to use the Hydrost-rahler model, as described by Billen et al. (1994). This sim-ple and non distributed model of the rainfall–runoffrelationship considers two water reservoirs in the watershed(Fig. 6a), (i) a superficial (or soil) reservoir, with short res-idence time, supplied by rainfall and feeding evapotranspi-ration, infiltration and surface/sub-surface runoff, and (ii) agroundwater reservoir, with longer residence time, fed byinfiltration and at the origin of the base flow. The model in-volves four parameters: surface runoff rate, soil saturationcontent (above which all excess rainfall is evacuated as sur-face runoff), infiltration rate and groundwater dischargerate. A calculation procedure has been developed to opti-mize the values of these four parameters, based on the Nashcriterion (Nash and Sutcliffe, 1970) calculated with the ob-served (obsQ) and calculated (calcQ) values of dailydischarge:
Nash ¼ 1�XðobsQ � calcQÞ2=
XðobsQ �meanQÞ2
h i
In order to avoid systematic bias related to the poorknowledge of the total rainfall over the whole basin, weadjusted the mean daily rainfall data of the 4–5 meteoro-logical stations available for each sub-basin, by multiplyingthem with the factor required to equilibrate the annualbalance between observed cumulative discharge at theoutlet of the basin and cumulative rainfall minus actual
evapotranspiration (AET). The assumption behind thisadjustment is that the available rainfall data provide acorrect picture of the temporal distribution of precipita-tion, but only a poor estimate of its absolute value. Theapproach was applied to the series of daily rainfall and dis-charge data available over the period 1997–2004 for theThao basin, providing the simulation of discharge over 3years shown in Fig. 7. The calibrated values of the param-eters are listed in Table 3. The value of the required rain-fall correcting coefficient, always below 1 for the Thaoriver indicates that in general, the rainfall data gathered

Infiltration= rinf . SW
SWsoil
GWgroundwater
baseflow= rgwr . GW
PLU AETIf SW > 0.1 solsat then AET=PETelse AET=0
surf.runoff= rssr . SW + sup.runoff
superf.runoffIf SW > solsat then =PLU-PETelse =0
solsat
total spec discharge= baseflow + surf. runoff
Qout = Qin – Qfill + Qempt
Qin= qspec. RBA
QfillIf Vol<volmax and Qin>qcritf then Qfill = Qinelse Qfill = 0
volmax
VolQempt
If Vol>volmin and Qin<qcrite then Qempt = 0.5 Qinelse Qempt = 0
volmin
RBA
a
b
Figure 6 Principles of the hydrological model: (a) The Hydrostrahler model (Billen et al., 1994). SW: soil water (mm); GW:groundwater (mm). AET: actual evapotranspiration (mm day�1); PET: potential evapotranspiration (mm day�1). Solsat: soilsaturation content (above which all excess rainfall is evacuated as surface runoff), infr: infiltration rate, srr: surface runoff rate andgwrr: groundwater runoff rate; (b) Representation of the hydrology of the large reservoirs in the model. RBA: watershed areaupstream from the reservoir. Qin, Qout: inflowing and outflowing discharge (m3 s�1); Qfill, Qempt: discharge of filling or emptying ofthe reservoir; volmax, volmin (m3): maximum and minimum volume of the reservoir; Qcritf, Qcrite (m3 s�1): critical discharge abovewhich the reservoir is allowed being filled or below which it is allowed being emptied.
206 Le, T.P.Q. et al.
for the Chinese territory, spatially under-represented,overestimated the water balance in the Thao basin. Withcorrected rainfall data, discharge simulation with a Nashcriterion above 0.7 could be obtained (Table 3). The mainadvantage of using this hydrological model is that, in thetotal discharge of the river, a component correspondingto (sub)-surface runoff can be distinguished from anothercorresponding to base flow (Fig. 7). This is the basis forsuspended load model (see below).
The model was adapted to take into account the fillingand emptying of a reservoir, if it is present in the watershed
(case of the Da and Lo rivers, Fig. 8). Four additional param-eters are taken into account to describe, in a simplifiedway, the management rules of each reservoir (Table 2):the minimum and maximum volume of the reservoir andtwo critical values of the river discharge above which wateris stored (Qcritf), or below which the reservoir is emptied(Qcrite) to sustain the downstream discharge, provided thevolume of the reservoir has not yet reached its maximumor minimum value, respectively (cf. Fig. 6b). The modelfirst calculates the daily specific discharge for the wholewatershed area, then the absolute discharge entering the

2003
0
1000
2000
3000
4000
j j f m a m j j a s o n d
dis
char
ge,
m3 .s
-1
J F M A M J J A S O N D
2002
0
1000
2000
3000
4000d
isch
arg
e, m
3 .s-1
obs.sim.base flow
J F M A M J J A S O N D
2004
0
1000
2000
3000
4000
dis
char
ge,
m3 .s
-1
J F M A M J J A S O N D
Thao R.
Figure 7 Simulations and observations of the discharge at theoutlet of the Thao sub-basin from 2002 to 2004 (obs: dischargeobservations; sim.: discharge simulations; base flow).
The changing flow regime and sediment load of the Red River, Viet Nam 207
reservoir (Qin), considering the watershed area upstreamfrom the reservoir. It is allowed to store water when its vol-ume is below the maximum value and Qin is aboveQcritf. Thereservoir is emptied if its volume is above the minimum
Table 3 Adjusted hydrological parameters of the hydrological m
Parameters Thao Da
Solsat, mm 110 165Infr, day�1 0.0619 0.0375Srr, day�1 0.0384 0.0745Gwrr, day�1 0.0132 0.0026
Year Factor PLU. Nash Factor PLU
1997 0.65 0.83 0.871998 0.68 0.91 1.071999 0.76 0.81 1.052000 0.61 0.73 1.012001 0.81 0.66 1.092002 0.73 0.79 1.002003 0.58 0.83 0.902004 0.51 0.73 0.95
Solsat: soil saturation content (above which all excess rainfall is evacurate and gwrr: groundwater runoff rate. Factor PLU.: factor used in thbased on observed and calculated values by 10-day period, see text fo
value and if Qin is below Qcrite. In all other situations, thedischarge downstream the reservoir is equal to the oneentering it. The result of discharge simulation of the Daand Lo rivers, show major differences in May and June iftheir reservoirs are taken into account or ignored (Fig. 8).
The optimized hydrological parameters obtained on thebasis of the observed discharge and rainfall data duringthe period 1997–2004 for the Lo river and, to a less extendfor the Da (Table 3) show higher infiltration rates and lowergroundwater runoff rates than for the Thao basin, indicatinga more stable contribution of base flow in their hydrologicalregimes.
Suspended matter transport of the Red Riverand its tributaries
The results of a detailed survey of daily suspended materialconcentration in the Red River and its three main tributariesin the year 2003 were made available to us by MONRE(1997–2004). This database is the only one available at thisfrequency for recent years. It concerns the stations Yen Bai,Son Tay and Hanoi on the Thao, Hoa Binh on the Da, and VuQuang on the Lo rivers. We compare these data with earlierresults published by several authors in the Vietnamese andinternational literature, often providing only monthly or an-nual means.
Total and specific suspended load
Several authors reported figures for the total annual loadingof the Red River system at its outlet (Table 4). Their esti-mates ranged from 100 to 166 · 106 t yr�1, i.e. from 640to 1060 t km�2 yr�1. As mentioned above, many of these fig-ures are cross-cited from one author to another, and it israther difficult to determine to which period they refer.Year-to-year variations of the hydrology introduce a largevariability. Thus, Nguyen (1984) pointed out that, althoughthe mean annual sediment load of the Red River in the per-iod 1958–1971 was about 111 · 106 tons, it varied from a
odel for the three sub-basins of the Red River (Thao, Da, Lo)
Lo
2100.050.06750.0010
. Nash Factor PLU. Nash
0.69 1.10 0.770.75 1.20 0.650.80 1.20 0.770.81 1.00 0.680.90 1.05 0.870.86 1.10 0.930.86 0.80 0.790.51 – –
ated as surface runoff), infr: infiltration rate, srr : surface runoffe hydrological model to correct rainfall data. Nash: Nash criterionr explanations).

Table 4 Sediment load (106 t yr�1) transported by the Red River gathered from several studies
Authors Total suspendedload, 106 t yr�1
Remarks
Lisitzin (1972), Holeman (1968), UNESCO (1991),Milliman and Mead (1983) and Milliman and Syvitski (1992)
130 Before the Hoa Binh reservoir impoundment
Nguyen (1984) and World Bank (1996) 116 Before the Hoa Binh reservoir impoundmentMeybeck et al. (1989) 160 Before the Hoa Binh reservoir impoundmentNguyen et al. (1995) 140–150 Before the Hoa Binh reservoir impoundmentLudwig et al. (1996) 166 Before the Hoa Binh reservoir impoundmentVan Maren and Hoekstra (2004) 100 Period not stated
This paper, observations in 2003 41 Measurements at the Hanoi station in 2003This paper, calculations for the period 1997–2003 38.8 Calculation with the model for the period
1997–2003
Da R., 2003
0
2500
5000
7500
10000
dis
char
ge,
m3 .s
-1
obs.sim.sim.without res.base flow.
J F M A M J J A S O N D
Lo R., 2003
0
1000
2000
3000
4000
5000
dis
char
ge,
m3 .s
-1
J F M A M J J A S O N D
Figure 8 Simulations and observations of the discharge at the outlet of the Da and Lo sub-basins in the year 2003 (obs: dischargeobservations; sim.: discharge simulations; sim. Without res.: simulation without the presence of any reservoir; base flow).
208 Le, T.P.Q. et al.
minimum of 56 · 106; yr�1 in 1963, a rather dry year, to amaximum of 202 · 106 t yr�1 in 1971, when a disastrousflood occurred. Nguyen et al. (2003) reported that the sus-pended solid load at the Son Tay station decreased from114 · 106 t yr�1 in the period 1958–1985 to 73 · 106 t yr�1
in the period 1986–1997, after the Hoa Binh reservoir onthe Da river has come into operation. The detailed data ob-tained from MONRE for the year 2003 at the Son Tay and Ha-noi stations lead to much lower values, respectively, 26 and41 · 106 t yr�1, i.e. 178–274 t km�2 yr�1 (Table 4).
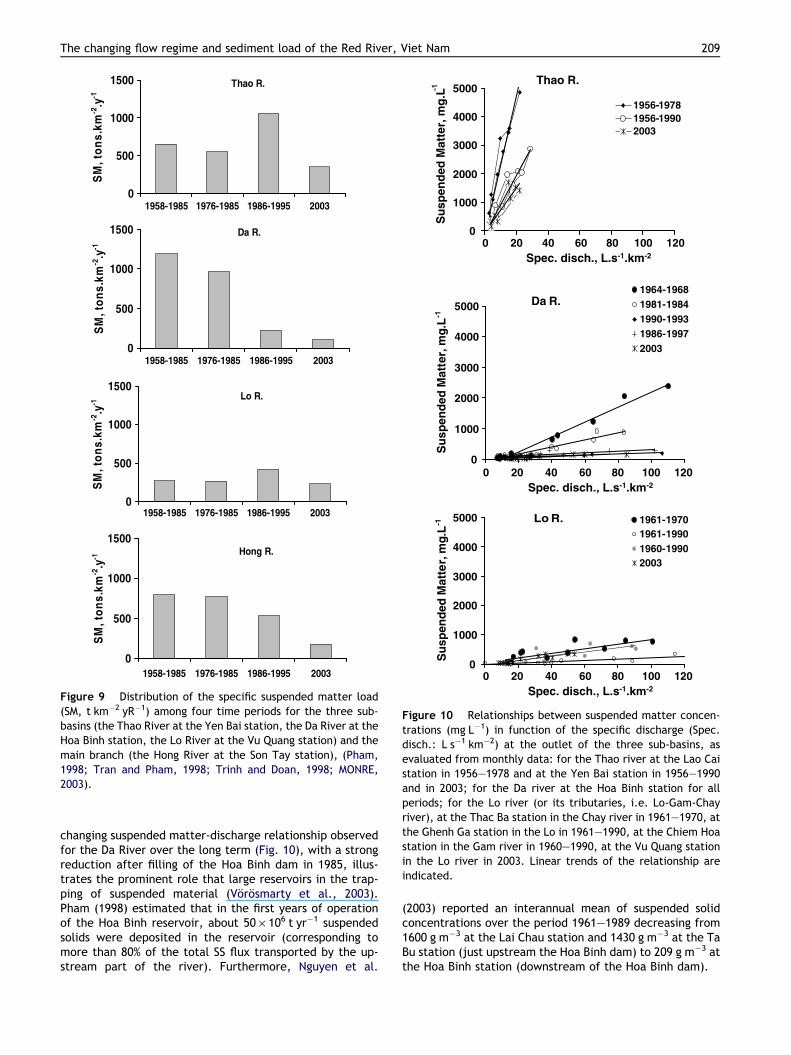
The data provided by Pham (1998) and Tran and Pham(1998) showed large differences between the sub-basinswith the specific suspended load varying between 262 and417 t km�2 yr�1 for the Lo River, 228–1193 t km�2 yr�1 forthe Da River and 55–1060 t km�2 yr�1 for the Thao Riverin the period from 1958 to 1995 (Fig. 9). These differencesare confirmed by our data from 2003, which however showlower values due to rather dry hydrological conditions(Fig. 9).
Seasonal and long-term variations ofsuspended load
It is a general characteristic of tropical river systems, and ofthe sub-tropical Red River as well, that most of the sus-pended load is transported during the rainy season and athigh discharge (Nguyen, 1984; Pham, 1998; Van Maren andHoekstra, 2004). This is because during the rainy summermonths, both the discharge and suspended matter concen-tration are high. During a flood, suspended matter concen-
trations often increase from 1000 to 5000 g m�3 in theThao river, 500 to 2500 g m�3 in the Da river and 150 to500 g m�3 in the Lo river (Nguyen et al., 2003). For a givensub-basin, there is a significant linear relationship betweensuspended matter concentration and specific discharge andthe different behaviour of the three sub-basins describedabove are clearly visible (Fig. 10). The rather low suspendedmatter concentrations in the Lo river, compared to those ofthe Thao and the Da rivers before damming are striking.Note that the name of the ‘‘Lo’’ river means ‘‘clear’’ inVietnamese, indicating that its low suspended matter con-tent is an ancient characteristic. Nguyen et al. (2003) re-ported that year-to-year mean suspended matterconcentrations over the period 1961–1990 in the Lo river,were 710 g m�3 at the Dao Duc station (in Ha Giang prov-ince), 410 g m�3at the Chiem Hoa station (in Tuyen Quangprovince) and 290 g m�3 at the Vu Quang station (in PhuTho province). These low values might be surprising whenit is remembered that the Lo watershed is the one withthe smallest share of forest and rice fields (low erosion landuses), and the highest areas of industrial crops (potentiallysubject to high erosion), as compared with the other twosub-basins (Table 1). The lower general slope and differentgeology of the Lo basin (Table 1) probably explain thisparadox.
Over the period investigated, dating back to about 40–50years, the data we collected for the Red River do not showany evidence of an increase in suspended loading, even atthe scale of individual sub-basins (Fig. 10), despite thewell-documented reduction of forested areas and increaseof bare land in the watershed (Le et al., 2005). More, the
Thao R.
0
500
1000
1500
1958-1985 1976-1985 1986-1995 2003
SM
, to
ns.
km-2
.y-1
Da R.
0
500
1000
1500
1958-1985 1976-1985 1986-1995 2003
SM
, to
ns.
km-2
.y-1
Lo R.
0
500
1000
1500
1958-1985 1976-1985 1986-1995 2003
SM
, to
ns.
km-2
.y-1
Hong R.
0
500
1000
1500
1958-1985 1976-1985 1986-1995 2003
SM
, to
ns.
km-2
.y-1
Figure 9 Distribution of the specific suspended matter load(SM, t km�2 yR�1) among four time periods for the three sub-basins (the Thao River at the Yen Bai station, the Da River at theHoa Binh station, the Lo River at the Vu Quang station) and themain branch (the Hong River at the Son Tay station), (Pham,1998; Tran and Pham, 1998; Trinh and Doan, 1998; MONRE,2003).
Da R.
0
1000
2000
3000
4000
5000
Su
spen
ded
Mat
ter,
mg.
L-1
1964-19681981-19841990-19931986-19972003
Lo R.
0
1000
2000
3000
4000
5000
Su
spen
ded
Mat
ter,
mg.
L-1 1961-1970
1961-19901960-19902003
Thao R.
0
1000
2000
3000
4000
5000
0 20 40 60 80 100 120Spec. disch., L.s-1.km-2
0 20 40 60 80 100 120Spec. disch., L.s-1.km-2
0 20 40 60 80 100 120Spec. disch., L.s-1.km-2
Su
spen
ded
Mat
ter,
mg
.L -1
1956-19781956-19902003
Figure 10 Relationships between suspended matter concen-trations (mg L�1) in function of the specific discharge (Spec.disch.: L s�1 km�2) at the outlet of the three sub-basins, asevaluated from monthly data: for the Thao river at the Lao Caistation in 1956–1978 and at the Yen Bai station in 1956–1990and in 2003; for the Da river at the Hoa Binh station for allperiods; for the Lo river (or its tributaries, i.e. Lo-Gam-Chayriver), at the Thac Ba station in the Chay river in 1961–1970, atthe Ghenh Ga station in the Lo in 1961–1990, at the Chiem Hoastation in the Gam river in 1960–1990, at the Vu Quang stationin the Lo river in 2003. Linear trends of the relationship areindicated.
The changing flow regime and sediment load of the Red River, Viet Nam 209
changing suspended matter-discharge relationship observedfor the Da River over the long term (Fig. 10), with a strongreduction after filling of the Hoa Binh dam in 1985, illus-trates the prominent role that large reservoirs in the trap-ping of suspended material (Vorosmarty et al., 2003).Pham (1998) estimated that in the first years of operationof the Hoa Binh reservoir, about 50 · 106 t yr�1 suspendedsolids were deposited in the reservoir (corresponding tomore than 80% of the total SS flux transported by the up-stream part of the river). Furthermore, Nguyen et al.
(2003) reported an interannual mean of suspended solidconcentrations over the period 1961–1989 decreasing from1600 g m�3 at the Lai Chau station and 1430 g m�3 at the TaBu station (just upstream the Hoa Binh dam) to 209 g m�3 atthe Hoa Binh station (downstream of the Hoa Binh dam).

210 Le, T.P.Q. et al.
The data concerning the Thao river basin show highersuspended loading at the Lao Cai station, on the Chineseborder, than at the Yen Bai indicating that the upstreampart of the basin is subject to greater erosion than the lowerpart (Fig. 10). Nguyen et al. (2003) reported mean sus-pended matter concentration of 2730 g m�3 at the Lao Caiagainst 1760 g m�3 at the Yen Bai station in the same peri-od, from 1958 to 1990 (Fig. 10). No significant long termtrends appeared in the data from the Yen Bai station overthe period 1956–2003.
Modeling the suspended loading
The seasonal variations of river suspended load have oftenbeen related to discharge (or rainfall) variations (see the re-views by Ludwig and Probst, 1998; Morehead et al., 2003).In the case of the Thao series, a very large dispersion ofthe data is observed when daily suspended matter concen-tration is plotted against discharge (Fig. 11a). No clear hys-teresis loops, showing variations on rising and falling limbsof the flood, can be detected. A somewhat lower dispersionoccurs when suspended matter is plotted against the frac-tion of surface runoff in total discharge, as calculated bythe above described hydrological model (Fig. 11b). High sus-pended matter concentrations are known to result from ero-sion processes and to depend on topography, lithology andland use in the watershed. On this basis, in spite of a largevariability, Fig. 11b supports our assumption that base flowis characterized by a constant and low base-line suspendedmatter concentration while surface runoff comprises highersuspended matter concentration; the calibrated values(respectively 160 mg L�1 and 2400 mg L�1 for the Thao, Ta-ble 5) are in agreement with the extreme values found inFig. 11b. A similar hypothesis was already suggested byWalling and Webb (1982), but they assumed that suspendedmatter concentration of each discharge component dependson earlier hydrological events. The Hydrotrend model con-ceived by Syvitski et al. (1998) is based on a comparable ap-proach but considered a constant suspended matter contentfor each water discharge source. Here, using our simple
0
2000
4000
0 20 40 60
Specific discharge, L.s-1.km-2
Su
spen
ded
Ma
tter
, mg
.L-1
a
Figure 11 Plot of daily suspended matter concentration versussuspended matter concentrations in function of specific discharge arunoff as a fraction of total runoff. The main trends of the dataconcentrations for 100% surface runoff and base flow in b panel.
hydrological model that provides a daily estimate of thebase-flow and the superficial runoff, we thus calculatedthe daily variations of suspended matter using, for eachsub-basin, a single value of the characteristic suspendedmatter concentration for both components of the discharge.These two values can be calibrated by optimizing the recon-structed daily variations of suspended matter concentrationwith respect to the observed ones, using the Nash criterionas explained above for the discharge modeling.
Where there is a reservoir, a simple, steady state, modelis taken into account, relating suspended mater concentra-tion at the outlet of the dam (SMout) to the concentration atthe inlet (SMin) and the hydraulic residence time (s) in thereservoir:
SMout ¼ SMin � ½1=ð1þ ksed � sÞ�
A reasonable value for ksed (day�1) is 0.25 day�1, represent-
ing the ratio of the particulate settling velocity of particles(about 0.5 m h�1, as determined experimentally by follow-ing the settling rate of Red River water samples collectedin Hanoi) to the mean depth of the reservoir (about 50 m).
Results of these model calculations are compared withthe observations in the Thao, Da and Lo rivers for the year2003 for which daily suspended matter concentration dataare available (Fig. 12). We also applied the model to a setof monthly suspended load data from the Da river beforethe Hoa Binh reservoir was impounded using the same cali-brated parameters (see Table 5). The Nash criterion, calcu-lated on mean values by decades, ranges between 0.5 and0.76. Note that an alternative model in which the suspendedconcentration of the surface runoff component was consid-ered as a linear function of the specific superficial runoff,instead of as a constant, did not provide better results.The model calculations of annual loading for the Thao, Daand Lo rivers in 2003 equaled 17.8 · 106, 6.2 · 106 and8.8 · 106 t yr�1 respectively, very close to the values result-ing from measured daily discharge and suspended matterconcentration, respectively, 20.0 · 106, 5.5 · 106 and7.9 · 106 t yr�1. This model, although admittedly rathersimplistic, thus provides a means of estimating the sus-
0
2000
4000
0.0 0.2 0.4 0.6 0.8 1.0
Runoff, surperficial:total
Su
spen
ded
Mat
ter,
mg
.L-1
b
discharge at the Yen Bai station in the Thao river in 2003: (a)nd (b) suspended matter concentrations in function of surfaceset are highlighted by an ellipse, white squares indicating the

Table 5 Suspended matter concentrations (SM, mg l�1) inthe base flow and surface runoff determined for the threesub-basins (Thao, Da, Lo) of the Red River to calculate thesuspended matter load
SM concentrations, mg l�1 Thao Da Lo
Surface runoff concentration 2400 2100 520Base flow concentration 160 30 30
Da R.
0
200
400
600
800
Su
spen
ded
Mat
ter,
mg
.L-1
J F M A M J J A S O N D
Lo R.
0
200
400
600
800
360
Su
spen
ded
Mat
ter,
mg
.L-1
J F M A M J J A S O N D
Thao R.
0
1000
2000
3000
4000
Su
spen
ded
Mat
ter,
mg
.L-1
simulationobservation
J F M A M J J A S O N D
Figure 12 Seasonal simulations (sim.) and observations (obs.)of suspended matter concentrations (mg L�1) at the outlets ofthe Thao, Da and Lo Rivers for the year 2003.
The changing flow regime and sediment load of the Red River, Viet Nam 211
pended solid loading of the three sub-basins from hydrolog-ical data, although important discrepancies can be observedespecially at high discharges. Additional daily data for otheryears with different flow patterns would be necessary tofurther explore the validity of such a model.
Using the same model, and the calibrated parameters ofTable 5, we have calculated the suspended loading over theperiod 1997–2004, for which the discharge values have beenmodeled and validated (see above), but daily suspended
matter data are not available. The results provide a meaninter-annual suspended matter loading of 22.5 · 106,6.5 · 106 and 9.8 · 106 t yr�1, respectively, for the Thao,Da and Lo sub-basin, and a total suspended matter loadingat the Son Tay station of 38.8 · 106 t yr�1 (Table 6).
The model was also used to calculate the suspended mat-ter load in the Da and Lo basins that would have been ob-served in the absence of any reservoirs. The value of87 · 106 and 12 · 106 t yr�1 were obtained for the Da andLo respectively, resulting a value of 122 · 106 t yr�1 forthe total loading at the Son Tay station (Table 6).
To what extend our estimates of the suspended load atthe mouth of its three main tributaries reflect the sus-pended matter delivery of the Red River to the coastalzone is difficult to assess. The delta area, where the slopeof the rivers is very weak and the flow diverted into manynatural and man-made distributaries might be the site ofa net sediment deposition. However, sedimentation pro-cesses are observed mostly in areas along the coast orinfluenced by seawater like in Hai Phong harbour, withinBa Lat, Ninh Co and Day estuaries, as well as on the veryactive tidal flats of the neighbouring seashore (Nguyenet al., 1995; Van Maren and Hoekstra, 2004). In 2003,the daily suspended matter and discharge data at the Ha-noi station showed a suspended matter flow of40 · 106 t yr�1, close to our loading estimate for the threemain upstream tributaries for the same year. This indi-cates that no significant net deposition of solid materialoccurs in the upper portion of the delta, upstream fromHanoi.
Relationship between suspended solid andphosphorus transport
The median phosphorus concentration of suspended solids inWorld Rivers was estimated by Meybeck (1982) to1.15 mgP g�1. The phosphorus content of suspended matterwas measured on samples taken monthly at the station SonTay, Hoa Binh, Vu Quang and Hanoi in 2003 with the methoddescribed by Rodier (1984). The results show significantlydifferent mean values in the sub-basins, ranging from 0.42to 0.85 mgP g�1 in the upper tributaries (Table 7). The val-ues found at the station Hanoi are consistently higher(0.93 mgP g�1), probably reflecting the adsorption on thesuspended matter of some phosphorus of human origin inthe lower course of the Red River basin (Table 7). As thesevalues show no clear seasonal variations, we calculated themean annual particulate phosphorus loading by simply mul-tiplying the P contents by the respective suspended solidloads estimated above. The values obtained compare wellwith the phosphorus export previously calculated by an-other approach (Le et al., 2005; Table 7).
Future scenarios of suspended matter load
Effects of planned dams
As mentioned above, the construction of additional largereservoirs is planned for the next 10 years in the Red Riverbasin (Table 2). Assuming constant rainfall regime over a

Table 6 Calculations by the model of the mean annual sediment load (106 t yr�1) transported by the three main tributaries ofthe Red River for the year 2003 at the various stations of the different rivers (R.)
Mean annual sediment load Yen Bai, Thao R. Hoa Binh, Da R. Vu Quang, Lo R. Son Tay, Hong R.
With the presence of the two reservoirs(Hoa Binh and Thac Ba)
22.5 6.5 9.8 38.8
Without the presence of the tworeservoirs (Hoa Binh and Thac Ba)
22.5 86.8 12.5 121.8
With the presence of two additionalreservoirs (Son La and Daithi)
22.5 3.3 6.5 32.3
With climate change 27.9 8.5 11.5 47.9
Table 7 Phosphorus content (P content, mgP g�1) of the suspended matter load (SM load, 106 t yr�1) measured at the outlet ofthe three main tributaries (Thao, Da, Lo) of the Red River system and in the main branch at Hanoi
Thao Da Lo Main branch
P content, mgP g�1 0.43 ± 0.09 0.68 ± 0.17 0.85 ± 0.28 0.93 ± 0.14SM load, 106 t yr�1 22.5 6.5 9.8 38.8P load, 106 kgP yr�1 (this study) 9.7 4.4 8.3 36.1P load, 106 kgP yr�1 (see Le et al., 2005) 8.3 3.5 5.1 51
Calculation of the corresponding mean annual phosphorus load (106 kgP yr�1) and comparison with the budget estimates reported by Leet al. (2005).
212 Le, T.P.Q. et al.
period of 8 years, the model described above can be used tocalculate the effect of these new reservoirs on the sus-pended load of the Red river system (Table 6). The Son Ladam, on the Da river upstream from the Hoa Binh reservoirwill further decrease the suspended loading by about 50%.The Dai Thi dam, in the upper basin of the Lo river, will dou-ble the effect of the existing Thac Ba reservoir on the totalsuspended matter delivery by the Lo river, reducing its loadby about 30%. As a whole, the total loading of the Red Riverwill decrease from 40 · 106 to 32 · 106 t yr�1 based on thehydrology of the period 1997–2004.
Effect of climate change
As a result of increased greenhouse gas concentrations inthe atmosphere and consecutive global warming, the hydro-logical cycle should be amplified. In Asia, in particular, theIntergovernmental Panel on Climate Change (IPCC, 2001)predicts an annual mean rainfall increase of about 3 ± 1%in the 2020s and 11 ± 3% in the 2080s, along with a 2–5 �Cmean temperature increase. More local or detailed predic-tions are extremely uncertain because of the large inter-model variations. Moreover, no models are presently ableto predict the effect of climate change on the frequencyof extreme events. In order to gain some insights into theorder of magnitude of the suspended loading variations inthe Red River induced by a climate change, we ran the de-scribed model for the last 8 years, with a 10% rainfall in-crease, and an increase of potential evapotranspirationcorresponding to a 3 �C temperature rise (which leads to aroughly 5% increase of PET) (Table 6). With respect to theconditions of the period 1997–2004, the model predictsan increase of about 20% of the suspended matter loading,i.e. from 40 to 48 · 106 t yr�1. These fluxes could be under-
estimated if one consider that increased rainfall could in-crease the suspended concentrations of the two dischargecomponents, with respect to the values calibrated on thepresent situation.
Conclusion
Despite some potential weakness of the modelling approach,our study has allowed to analysemost of existing hydrologicaland suspended matter data of the Red River. With the datapresented in this paper, a reliable estimate can be obtainedof the total suspended matter load presently carried by theRed Rivermain branch and its twomajor tributaries. Our esti-mate is around 40 · 106 t yr�1 over the period 1997–2004,corresponding to a specific load of 280 t km�2 yr�1. The fig-ures show both the variability linked to year-to-year varia-tions in hydrology, and sub-basin to sub-basin differencesrelated to their lithology and morphology. The specific loadof the Thao, the Da and the Lo rivers during the same periodare respectively 394, 127 and 282 t km�2 yr�1. Our resultsare lower than the range of previous estimates (Table 4), inwhich, however, many cases are based on measurementsmade several decades ago.
Many authors have discussed the increase in erosion andriverine suspended solid transport resulting from forestclearance in South-East Asian countries. The Philippines isa well documented example where sediment load has in-creased from 1100 t km�2 yr�1 to 4500 t km�2 yr�1 duringthe last three decades (Dudgeon et al., 2000). On the otherhand, the construction of large reservoirs has resulted in adecrease of suspended solid transport by many Asian rivers.Walling and Fang (2003) thus reported the case of the Yel-low River in China whose the sediment flux declined by50% between the 1950s and the 1980s.

The changing flow regime and sediment load of the Red River, Viet Nam 213
For the Red River, the well-documented reduction offorested area does not appears to have contributed to asignificant increase in suspended loading, On the contrary,the impoundment of two large reservoirs in the Da and theLo watersheds has resulted in a considerable reduction ofthe total suspended load carried to the sea by the RedRiver.
Using a simplified modeling approach, we estimated thisreduction to be about 70%, on the basis of a calculation car-ried out with the hydrological data of the last 8 years. Theplanned construction of two additional reservoirs would fur-ther reduce the total suspended load by 20%, according toour model. This is also the order of magnitude of the ex-pected increase in suspended loading due to higher rainfallinduced by climate change (Table 6), so that over the longterm, one effect should compensate for the other.
To conclude, the Red River system represents a repre-sentative example of the changes now occurring in theSouth and South-East Asia watersheds. The growing humanpressures in this part of the world are likely to result in de-creased inputs of suspended matter and associated nutri-ents to the coastal ocean.
Acknowledgements
The work was carried out in the scope of the Espoir pro-gram, in the framework of a cooperation between CNRS-France and ASTV-Viet Nam. Thanks are due to GeorgesVachaud who coordinated the program. We are grateful totwo anonymous reviewers for their contribution in improv-ing the manuscript.
References
Billen, G., Garnier, J., Hanset, P., 1994. Modelling phytoplanktondevelopment in whole drainage networks: the RIVERSTRALERmodel applied to the Seine river system. In: Descy, J.P.,Reynolds, C.S., Padisak, J. (Eds.), Phytoplankton in TurbidEnvironments: Rivers and Shallow lakes, Hydrobiologia, 289.Kluwer academic Publishers, Belgium, pp. 119–137.
Chinadata, 1998–2001. Statistical Yearbook of Yunnan, vols. 1997–2000. China Statistical Publishing House (Basic Information ofYunnan, China). <http://chinadatacenter.org>.
Dang, A.T., 2000. The Red River Delta – The Cradle of the Nation.Hanoi National University Publisher, Hanoi.
Dang, Q.T., 2001. Participatory planning and management for floodmitigation and preparedness and trends in the Red River basin,Vietnam. In: Proceedings of the Workshop International onStrengthening Capacity in Participatory Planning and Manage-ment for Flood Mitigation and Preparedness in Large River Basin,Bangkok, Thailand, 20th–23rd November.
Dudgeon, D., Choowaew, S., Ho, S.C., 2000. River conservation inSouth-East Asia. In: Boon, P.J., Davies, B.R., Petts, G.E. (Eds.),Global Perspectives on River Conservation: Science, Policy andPractice. John Wiley& Sons Ltd., Chichester, England.
Durr, H.H., 2003. Towards a typology of global river systems: someconcepts and examples at medium resolution. Ph-D, UniversityParis VI - Pierre and Marie Curie. 432 pp.
Fullen, M.A., Mitchel, D.J., Barton, A.P., Hocking, T.J., Liu,Liguang, Wu Bo Zhi, Zheng Yi, Xia Zheng Yuan., 1998. Soilerosion and conservation in the Headwaters of the YangtzeRiver, Yunnan Province, China. In: Haigh, M.J., Krecek, J.,
Rajwar, S., Kilmartin, M.P., (Eds.), Headwaters: WaterResources and Soil Conservation. pp. 299–306.
Holeman, J.N., 1968. Sediment yield of major rivers of the world.Water Resources Res. 4, 737–747.
IMH, 1997–2004. Vietnamese Journal of Meteo-hydrology, Instituteof Meteo-Hydrology in Vietnam, Hanoi. (Journal monthly duringthe periods of from 1997 to 2004).
IPCC, 2001. Climate change 2001. Intergovernmental Panel onclimate change. Third Assessment Report. <http://www.gri-da.no/climate/ipcc_tar/>.
Jensen, M.E., Burman, R.D., Allen, R.G. (Eds.), 1990. ASCE,Evaporation and irrigation water requirements. ASCE Manualsand Reports on Engineering Practices No. 70, 360 pp.
Le, B.H., 1997. The especial flood in the Da River and downstreamof the Red River in August 1996: the role of Hoa Binh reservoirfor flood control in the delta. Vietnamese Journal of Meteo-Hydrology 4 (439), 6–15.
Le, T.P.Q., Billen, G., Garnier, J., Thery, S., Fezard, C., Chau,V.M., 2005. Nutrient (N, P) budgets for the Red River basin(Vietnam and China). Journal of Global Biogeochemical Cycles19 (2), 1–16. doi:10.1029/2004GB002405, 2005 (GB2022).
Lisitzin, A.P., 1972. Sedimentation in the World Ocean. Society ofEconomic Paleontologist and Mineralogists, Tulsa, Ok, SpecialPublication 17, pp. 218.
Ludwig, W., Probst, J.L., 1998. River sediment discharge to theoceans: present-day controls and global budgets. AmericanJournal of Science 298, 265–295.
Ludwig, W., Probst, J.L., Kempe, S., 1996. Predicting the oceanicinput of organic carbon by continental erosion. Global Biogeo-chemical Cycles 10 (1), 23–41.
Martin, J.M., Meybeck, M., 1979. Elemental mass-balance ofmaterial carried by major world rivers. Marine Chemistry 7,173–206.
Meybeck, M., 1982. Carbon, nitrogen and phosphorus transport byworld rivers. American Journal of Science 282, 401–450.
Meybeck, M., Chapman, D., Helmer, R., 1989. Global FreshwaterQuality: A First Assessment. World Health Organization/UnitedNations Environment Programme Basil Blackwell, Inc., Cam-bridge, MA.
Meybeck, M., Laroche, L., Durr, H.H., Syvitski, J.P.M., 2003. Globalvariability of daily total suspended solids and their fluxes inrivers. Global and Planetary Change 39, 65–93.
Milliman, J.D., 1997. Blessed dams or damned dams? Nature 386,325–327.
Milliman, J.D., Mead, R.H., 1983. World-wide delivery of riversediment to the oceans. The Journal of Geology 91 (1), 1–21.
Milliman, J.D., Syvitski, J.P.M., 1992. Geomorphic/tectonic controlof sediment discharge to the ocean: the importance of smallmountainous rivers. The Journal of Geology 100, 525–544.
MONRE, 1997–2004. Vietnamese Ministry of Environment andNatural Resources. Report Annual on Hydrological Observationin Vietnam.
Morehead, M.D., Syvitski, J.P., Hutton, E.W.H., Peckham, S.D.,2003. Modeling the temporal variability in the flux of sedimentfrom ungauged river basins. Global and Planetary Change 39,95–110.
MOSTE, 1997. Vietnamese General Statistics Officer, Ministry ofScience, Technology and Environment of Vietnam, GeneralStatistics Editor, Hanoi.
Nash, J.E., Sutcliffe, J.V., 1970. River flow forecasting throughconceptual models. Journal of Hydrology 10, 282–290.
Ngo, T.T., Tran, B.N., 1998. Erosion of Da and Hong riverscaused by the Hoa Binh reservoir operation. In: Proceedingsof International Conference on Economic development andenvironmental protection of the Yuan-Red River watershed,Hanoi, 4–5 March.
Nguyen, V.P., 1984. Streams in Vietnam. Science Publishing House,Hanoi, 209 pp.

214 Le, T.P.Q. et al.
Nguyen, H.K., Nguyen, V.T., 2001. Geography and Hydrology inVietnam. Vietnam National University publisher, Hanoi, Viet-nam, 194 pp.
Nguyen, N.S., Hua, C.T., Nguyen, C.H., Nguyen, V.T., Lang, V.K.,Pham, V.N., Nguyen, V.T., 1995. Case Study Report on Red RiverDelta in Vietnam – Project on Integrated Management andConservation of Near Shore Coastal and Marine Areas in East AsiaRegion (EAS-35) United Nations Environment Program. Regionalcoordinating for the East Seas (ESA/RCU).
Nguyen, V.P., Vu, V.T., Tran, T.X., 2003. Water Resources inVietnam. Vietnamese Institute of Meteo-hydrologie. AgiculturalEditor (in Vietnamese).
Pham, Q.S., 1998. Fundamental characteristics of the Red River bedevolution. In: Proceedings of International Conference onEco-nomic development and environmental protection of the Yuan-Red River watershed, Hanoi, 4–5 March.
Rodier, J., 1984. In: Dunot (Ed.), L’analyse de l’eau. 7eme edition.France, 1365 pp.
Syvitski, J.P.M., 2003. Supply and flux of sediment along hydrolog-ical pathway: research for the 21st century. Global and Plane-tary Change 39, 1–11.
Syvitski, J.P.M., Morehead, M.D., Nicholson, M., 1998. HYDRO-TREND: a climate-driven hydrologic transport model for pre-dicting discharge and sediment load to lakes or oceans.Computers and Geosciences 24, 51–68.
Syvitski, J.P.M., Peckham, S.D., Hilberman, R., Mulder, T., 2003.Predicting the terrestrial flux of sediment to the global ocean: aplanetary perspective. Sedimentary Geology 162, 5–24.
To, T.N., 2000. Flood control planning for the Red River Basin. In:Proceedings of the International European–Asian Workshop:Ecosystem & Flood 2000, Hanoi, Vietnam, June 27–29.
Tran, T.X., Pham, H.P., 1998. Impact of Hoa Binh reservoir onsediments flux to the downstream of the Red River. VietnameseJournal of Meteo-Hydrology 4 (448), 7–12.
Tran, D.T., Yoshiki, S., Dinh, V.H., Nguyen, V.L., Ta, T.K.O.,Masaaki, T., 2004. Regimes of human and climate impacts oncoastal changes in Vietnam. Regional Environmental Change 4,49–62.
Trinh, Q.H., 1998. Water balance for purpose of socio-economicdevelopment in the Red River delta. In: Proceedings of Interna-tional Conference on Economic Development EnvironmentalProtection of the Yuan-Red River Watershed, Hanoi, 4–5thMarch.
Trinh, D.L., Doan, C.D., 1998. Impact of Hoa Binh reservoiroperation on hydrological factors at the downstream of theRed River. Vietnamese Journal of Meteo-Hydrology 4 (448), 34–40.
Turc, L., 1961. Evaluation des besoins en eau d’irrigation, evapo-transpiration potentielle. Ann. Agron. 12 (I), 3–49.
UNEP, 1990. United Nations Environment Programme. China Con-servation Strategy, UNEP & China Environmental Science Press,Beijing, China.
UNESCO, 1991. Water Related Issues and Problems of the HumidTropics and Other Warm Humid Regions. International Hydro-logical Programme. UNESCO, Paris.
Van Maren, D.S., Hoekstra, P., 2004. Seasonal variation of hydro-dynamics and sediment dynamics in a shallows subtropicalestuary: the Ba Lat River, Vietnam. Estuarine, Coastal and ShelfScience 60, 529–540.
Vorosmarty, C.J, Meybeck, M., Fekete, B., Sharma, K., 1997.The potential impact of neo-Castorization on sedimenttransport by the global network of rivers. In: Walling,D.E., Probst, J.L. (Eds.), Human Impact on Erosion andSedimentation. Proc eedings of the Rabat Symposium, April1997. IAHS Publication No. 245. IAHS Press, Wallingford,UK, pp. 261–273.
Vorosmarty, C.J., Meybeck, M., Fekete, B., Sharma, K., Green, P.,Syvitski, J.P.M., 2003. Anthropogenic sediment retention: majorglobal impact from registered river impoundments. Global andPlanetary Change 39, 169–190.
Vu, V.T., 2002a. The Thac Ba reservoir and the general gestation ofits basin area. Vietnamese journal of Meteorology and Hydrology8, 39–45.
Vu, V.T., 2002b. The Hoa Binh reservoir and the general gestation ofits basin area. General Centre for Meteorology and Hydrology ofVietnam, 250.
Walling, D.E., Webb, B.W., 1982. Sediment availability and theprediction of storm-period sediment yields. In: Walling, D.E.,(Ed.), Recent developments in the explanation and prediction oferosion and sediment yield. IAHS Publ. No. 137, 412pp.
Walling, D.E., Fang, D., 2003. Recent trends in suspended sedimentloads of the world’s rivers. Global and Planetary Change 39,111–126.
World Bank, 1996. Vietnam Water Resources Sector Review.Selected Working Papers of the World Bank, ADB, FAO/UNPand NGO Water Resources Sectoral Group, Hanoi, 340 pp.
Copyright © 2022 FDOKUMEN