Final_Submission.pdf - TU Delft Research Portal
140
Delft University of Technology SAVing the Internet Measuring the adoption of Source Address Validation (SAV) by network providers Lone, Q.B. DOI 10.4233/uuid:cfed8540-76cf-4d35-b528-b03230ef98e0 Publication date 2022 Document Version Final published version Citation (APA) Lone, Q. B. (2022). SAVing the Internet: Measuring the adoption of Source Address Validation (SAV) by network providers. https://doi.org/10.4233/uuid:cfed8540-76cf-4d35-b528-b03230ef98e0 Important note To cite this publication, please use the final published version (if applicable). Please check the document version above. Copyright Other than for strictly personal use, it is not permitted to download, forward or distribute the text or part of it, without the consent of the author(s) and/or copyright holder(s), unless the work is under an open content license such as Creative Commons. Takedown policy Please contact us and provide details if you believe this document breaches copyrights. We will remove access to the work immediately and investigate your claim. This work is downloaded from Delft University of Technology. For technical reasons the number of authors shown on this cover page is limited to a maximum of 10.
-
Upload
khangminh22 -
Category
Documents
-
view
0 -
download
0
Transcript of Final_Submission.pdf - TU Delft Research Portal

Delft University of Technology
SAVing the InternetMeasuring the adoption of Source Address Validation (SAV) by network providersLone, Q.B.
DOI10.4233/uuid:cfed8540-76cf-4d35-b528-b03230ef98e0Publication date2022Document VersionFinal published versionCitation (APA)Lone, Q. B. (2022). SAVing the Internet: Measuring the adoption of Source Address Validation (SAV) bynetwork providers. https://doi.org/10.4233/uuid:cfed8540-76cf-4d35-b528-b03230ef98e0
Important noteTo cite this publication, please use the final published version (if applicable).Please check the document version above.
CopyrightOther than for strictly personal use, it is not permitted to download, forward or distribute the text or part of it, without the consentof the author(s) and/or copyright holder(s), unless the work is under an open content license such as Creative Commons.
Takedown policyPlease contact us and provide details if you believe this document breaches copyrights.We will remove access to the work immediately and investigate your claim.
This work is downloaded from Delft University of Technology.For technical reasons the number of authors shown on this cover page is limited to a maximum of 10.

SAVING THE INTERNET
MEASURING THE ADOPTION OF SOURCE ADDRESSVALIDATION (SAV ) BY NETWORK PROVIDERS


SAVING THE INTERNET
MEASURING THE ADOPTION OF SOURCE ADDRESSVALIDATION (SAV ) BY NETWORK PROVIDERS
Dissertation
for the purpose of obtaining the degree of doctorat Delft University of Technology,
by the authority of the Rector Magnificus prof.dr.ir. T.H.J.J. van der Hagen,chair of the Board for Doctorates
to be defended publicly onMonday 28 March 2022 at 17:30 o’clock
by
Qasim Bilal LONE
Master of Science in Computer Networking,North Carolina State University, NC, USA,
born in Karachi, Pakistan.

This dissertation has been approved by the promotors:
Prof. dr. M.J.G. van EetenDr.ir. C. Hernandez Gañán
Composition of the doctoral committee:
Rector Magnificus, ChairpersonProf. dr. M.J.G. van Eeten, Delft University of Technology, PromotorDr.ir. C. Hernandez Gañán, Delft University of Technology, Co-promotor
Independent members:Prof. dr. J.A. (Hans) de Bruijn Delft University of TechnologyProf. dr. G. Smaragdakis Delft University of TechnologyProf. dr. ir. A. Pras University of TwenteProf. dr. A. Duda University of Grenoble AlpesProf. dr. K.C. Claffy University of California, San Diego
Keywords: Source Address Validation, SAV, BCP38, BCP84, DDoS, cybersecurity,incentives, vulnerability scan, data analysis, statistical models,metrics,notifications
Printed by: Gildeprint
Cover design: Usama Alam
ISBN 978-94-6419-468-5
An electronic version of this dissertation is available athttp://repository.tudelft.nl/.

To my parents


ACKNOWLEDGEMENTS
A Ph.D. is a long journey with a mixed bag of happiness, chaos, and achievements. Nowthat I am near completion, I can look back and reflect on some of the memorable mo-ments. I remember getting my manuscript accepted or finally solving a problem aftermonths would make me feel like being at the top of the world. However, those feelingsdid not stay for long, as the next challenge was usually around the corner.
In this long journey of ups and downs, I was fortunate to receive support from someamazing people, and I would like to thank them. First and foremost, I would like to thankmy promoter and supervisor, Michel van Eeten for his unwavering trust in my abilities.I wouldn’t have finished without his support. His supervision not only helped me learnthe requisite research skills but also boosted my confidence to stand my ground as anindependent researcher. Thank you for being a wonderful mentor and a supervisor.
Next, I want to thank my supervisors, Carlos, Maciej, and Giovane. I am deeplygrateful to them for their countless hours of brainstorming sessions, which have helpedme gain critical insights into scientific methods and Internet measurements. I am alsothankful to them for giving me the freedom to bring new ideas to the table and their kindhelp conceptualizing those ideas into a complete manuscript.
I like to express my gratitude to my external collaborators, Matthew Luckie, AlisaFrik, and Mobin Javed. I really enjoyed their passion for research, which also served as amotivation for me. I am thankful to my collaborators for their valuable insights, helpingme with new ideas, and for improving the overall manuscript. Specifically, I have hada chance to collaborate with Matthew Luckie on several manuscripts, and I am gratefulthat despite the significant time difference, Matthew was always available for a quickmeeting to discuss specific agenda. I learnt a lot from these collaborations, and I hopewe can continue our cooperation in the future.
Ph.D. studies at O&G gave me a chance to meet many amazing people and makefriends. For this, I want to thank my wonderful colleagues, Samaneh, Arman, Orcun,Rolf, Elsa, Matthew, Maria, Natalia, Kate, Xander, Arwa, Radu, Ugur, and all of my fan-tastic new colleagues who have recently joined the team. I have thoroughly enjoyed ourdiscussions and coffee breaks. The daily discussions provided a welcome distractionfrom Ph.D. work and also made me realize that everybody is going through the samechallenges, and I am not alone in this journey.
I was fortunate to find a passionate community of long-term friends outside work. Iwant to thank Neil, Sarah, Saad, Hussam, Irfan, Imran, Shakeel, Aftab, Mohsan, Tabish,Nauman, Mubariz, Samad, Hassan, Rehan, Haris, Haider, and Osama for providing family-like support in my difficult times when my own family was miles away. I thoroughlyenjoyed our meetups on the weekend, along with delicious food and late-night discus-sions on every possible topic. Given that I am terrible at cooking but fond of traditionalPakistani food, fantastic food was always a great motivation to not miss any gathering.
vii

viii
My father’s passion and trust of my mother were always a major push to pursue mydreams and never settle without fulfilling them. My father encouraged me to take onthis journey and trained me to face difficult situations with a smile. I wish my father washere to see my success. I lost my father in 2017, and at that time, it seemed impossibleto continue and complete my studies. I am thankful to my mother for her unrelentingemotional support and for always standing by me when I needed it the most. Besides,I am deeply grateful to my brother and sister for their encouragement throughout thejourney. Last but not least, I am thankful to my loving wife, who supported me in everyway possible and brought so much joy and happiness to my life.

SUMMARY
IP spoofing is the act of forging source IP addresses assigned to a host machine. Spoofingprovides users the ability to hide their identity and impersonate another machine. Mali-cious users use spoofing to invoke a variety of attacks. Examples are Distributed Denialof Service (DDoS) attacks, policy evasion and a range of application-level attacks.
Despite source IP address spoofing being a known vulnerability for at least 25 years,and despite many efforts to shed light on the problem, spoofing remains a popular attackmethod for redirection, amplification and anonymity. Defeating these attacks requiresoperators to ensure that their networks filter packets with spoofed source IP addresses.This is a Best Current Practice (BCP), known as Source Address Validation (SAV).
Yet, widespread SAV adoption is hindered by a misalignment of incentives: networksthat adopt SAV incur the cost of deployment, while the security benefits diffuse to allother networks. The challenges posed by SAV adoption exemplify the failure of tradi-tional governance models to provide solutions in the Internet ecosystem. Policy inter-ventions usually require transparency in measurements to quantify and assess the vul-nerability landscape. However, measuring SAV requires a vantage point inside the net-work or in the upstream provider of the network. Once a packet with a spoofed sourceaddress leaves the upstream network provider, it is almost impossible to ascertain itsorigin.
Furthermore, various stakeholders have different aggregation and precision require-ments for measurement results. For instance, policymakers need SAV compliance andremediation to be measured at the organizational level. However, current methodolo-gies report noncompliance at the network level – i.e., counting noncompliant IP addressspace, aggregating noncompliant /24 prefixes or Border Gateway Protocol (BGP) prefixannouncements – or at the Autonomous Systems (ASes) level.
A more pressing question is how can more operators be moved to adopt SAV. Multiplestudies show varying degrees of success in use of notifications to stimulate remediationof vulnerable or compromised devices. Improving SAV adoption is made more chal-lenging by the aforementioned misaligned incentives. The Spoofer Project reported thatnotifying operators boosted remediation rates by about 50%. However, its findings werebased only on observational data. In the absence of a control group, we cannot establishwhether interventions in fact had significant impact on SAV compliance.
Therefore, for the adoption of SAV, we require not only representative data points,but also a better understanding of the current landscape of SAV deployment. We alsoneed to introduce relevant interventions for network operators to adopt SAV. This leadsto the main question of the current research:
How can we measure and improve the adoption of Source Address Validation (SAV) bynetwork operators?
ix

x SUMMARY
The following chapters explore multiple research topics. Collectively, chapters 2, 3, 4and 5 answer the main research question. These chapters form the core of the thesis andhave been individually published in separate peer-reviewed venues.
Chapter 2 sets out to expand the coverage of the existing Spoofer tool for measuringSAV compliance using crowdsourcing platforms. In six weeks, we recruited 1,519 work-ers from 91 countries and 784 unique ASes, at a cost of approximately €2,000. Some342 of these ASes were not previously covered, representing a 15% increase in ASes overthe prior 12 months. We draw the following conclusions from our work. First, com-mercially crowdsourced vantage points are relatively costly, especially for longer-termstudies. If longitudinal measurements are required, workers can be compensated withsmaller bonuses per week or month to keep the tool running. Second, if a study seeksa specific set of vantage points outside its current coverage, then accurately screeningworkers can make crowdsourcing quite cost-effective – offering an almost ‘no cure, nopay’ approach. Third, crowdsourcing can be seen as a way to acquire ground truth datafor researchers to validate conclusions based on other, cheaper network measurements.Fourth, there appears to be potential to retain some of the workers as volunteers. Withinour study, we found that more than one in four workers kept the tool running and sub-mitted follow-up tests unpaid.
Chapter 3 introduces a new methodology to measure SAV noncompliance amongupstream providers. We used routing loops appearing in traceroute data to infer inad-equate SAV at the transit provider edge. Our method utilizes a router misconfiguration,which functions as a vantage point to observe the absence of SAV between the customerand the transit provider. In other words, our methodology does not require a vantagepoint within the customer network. We found 703 provider ASes that did not implementingress filtering on at least one of their links for 1,780 customer ASes.
Chapter 4 investigates the impact of various incentives on SAV adoption. It com-bines two independent datasets (misconfigured open resolvers and Spoofer) with obser-vations on the absence of SAV to statistically model causal drivers for non compliance.In this study, our analysis focused on a critical population with a rather homogeneouscomposition: Internet Service Providers (ISPs), here defined as the businesses that offerInternet access to end-users. Given that they provide Internet access to billions of users,ISPs are a critical control point for adopting SAV and for blocking potential miscreantsfrom IP spoofing. Nonetheless, we found evidence of the absence of SAV for certain pre-fixes of 250 ISPs. We then set out to explain what proportion of an ISP’s address spaceallowed spoofing based on four causal factors – network complexity, security effort, ISPcharacteristics and institutional environment. These were measured via 12 indicators.In sum, evidence suggests that larger ISPs have a larger proportion of noncompliant IPspace. ISP security efforts, most notably adoption of Resource Public Key Infrastructure(RPKI) and hygiene of the network, such as the number of amplifiers, were positivelycorrelated with SAV. Finally, we found that ISPs in countries with more developed ICTinfrastructures were more likely to adopt SAV.
Chapter 5 explores various interventions to improve SAV adoption. It presents a first-ever randomized control experiment to measure the effectiveness of various notificationmechanisms on SAV deployment. Psychology and behavioral science literature suggestthat nudges and minor changes in message framing may lead to higher compliance with

SUMMARY xi
a recommendation. We used behavioral nudges in notification messages to test their ef-fect on SAV compliance. We also sent notifications to a public operator forum (NetworkOperator Group). Finally, we tested the impact of a notification treatment directly ad-ministered by a national computer emergency response team (CERT). Nic.br, a leadingBrazilian CERT, sent the notification on our behalf and followed up on questions fromoperators. This allowed us to test the impact of direct CERT notifications on remedi-ation. Our rigorous design reveals a painful reality that contrasts with earlier observa-tional studies: none of the notification treatments significantly improved SAV deploy-ment compared to the control group. We explore the reasons for these findings and re-port on a survey among operators to identify ways forward. A proportion of the operatorsindicated that they did plan to deploy SAV and asked for better notification mechanisms,training and support materials for SAV implementation.
Finally, Chapter 6 synthesizes our findings and discusses their implications for gover-nance. Lessons learned are presented with respect to collecting and analyzing SAV com-pliance data, and the implications of our findings are examined in light of four canonicalgovernance models. We propose future directions of research to measure and improveSAV.

CONTENTS
Acknowledgements vii
Summary ix
1 Introduction 11.1 The trust-based nature of the internet . . . . . . . . . . . . . . . . . . . 1
1.1.1 The threat landscape. . . . . . . . . . . . . . . . . . . . . . . . . 11.2 Source Address Validation to the rescue. . . . . . . . . . . . . . . . . . . 31.3 Factors affecting noncompliance . . . . . . . . . . . . . . . . . . . . . . 41.4 Research gaps . . . . . . . . . . . . . . . . . . . . . . . . . . . . . . . . 4
1.4.1 Measuring SAV adoption . . . . . . . . . . . . . . . . . . . . . . . 51.4.2 Drivers of adoption of SAV . . . . . . . . . . . . . . . . . . . . . . 61.4.3 Interventions to improve SAV adoption . . . . . . . . . . . . . . . 6
1.5 Research aims and questions . . . . . . . . . . . . . . . . . . . . . . . . 71.5.1 Study 1:Improving the coverage of existing methodology . . . . . . 71.5.2 Study 2:Proposing a new methodology to identify noncompliant
networks . . . . . . . . . . . . . . . . . . . . . . . . . . . . . . . 81.5.3 Study 3:Understanding factors responsible for noncompliance . . . 81.5.4 Study 4: Improving SAV compliance . . . . . . . . . . . . . . . . . 8
1.6 Dissertation outline . . . . . . . . . . . . . . . . . . . . . . . . . . . . . 9
2 Using Crowdsourcing Marketplaces for Network Measurements: The Case ofSpoofer 112.1 Introduction . . . . . . . . . . . . . . . . . . . . . . . . . . . . . . . . 112.2 Related Work . . . . . . . . . . . . . . . . . . . . . . . . . . . . . . . . 132.3 Background on the Spoofer Project . . . . . . . . . . . . . . . . . . . . . 142.4 Crowdsourcing Platforms . . . . . . . . . . . . . . . . . . . . . . . . . . 152.5 Infrastructure Design . . . . . . . . . . . . . . . . . . . . . . . . . . . . 16
2.5.1 Measurement Goal. . . . . . . . . . . . . . . . . . . . . . . . . . 162.5.2 Measurement Infrastructure . . . . . . . . . . . . . . . . . . . . . 162.5.3 Measurement Campaigns . . . . . . . . . . . . . . . . . . . . . . 172.5.4 Ethical considerations . . . . . . . . . . . . . . . . . . . . . . . . 182.5.5 Interaction with workers . . . . . . . . . . . . . . . . . . . . . . . 192.5.6 Follow up tests . . . . . . . . . . . . . . . . . . . . . . . . . . . . 19
2.6 Evaluation of design . . . . . . . . . . . . . . . . . . . . . . . . . . . . 202.7 Analysis of platforms . . . . . . . . . . . . . . . . . . . . . . . . . . . . 212.8 Contributions to Spoofer . . . . . . . . . . . . . . . . . . . . . . . . . . 222.9 Conclusion . . . . . . . . . . . . . . . . . . . . . . . . . . . . . . . . . 24
xiii

xiv CONTENTS
3 Using Loops Observed in Traceroute to Infer Ability to Spoof 253.1 Introduction . . . . . . . . . . . . . . . . . . . . . . . . . . . . . . . . 253.2 Background on Ingress Filtering . . . . . . . . . . . . . . . . . . . . . . 263.3 Related Work . . . . . . . . . . . . . . . . . . . . . . . . . . . . . . . . 273.4 Motivation of Ingress ACLs . . . . . . . . . . . . . . . . . . . . . . . . . 273.5 Inferring Absence of Filtering using Traceroute . . . . . . . . . . . . . . . 28
3.5.1 Input Data . . . . . . . . . . . . . . . . . . . . . . . . . . . . . . 293.5.2 Construction of Topology . . . . . . . . . . . . . . . . . . . . . . 293.5.3 Algorithm to Infer Absence of Ingress Filtering from Loops . . . . . 303.5.4 Finding Needles in a Haystack . . . . . . . . . . . . . . . . . . . . 313.5.5 Persistence of Loops . . . . . . . . . . . . . . . . . . . . . . . . . 32
3.6 Validation by Network Providers . . . . . . . . . . . . . . . . . . . . . . 323.7 Results . . . . . . . . . . . . . . . . . . . . . . . . . . . . . . . . . . . 333.8 Conclusion . . . . . . . . . . . . . . . . . . . . . . . . . . . . . . . . . 35
4 SAVing the Internet: Explaining the Adoption of Source Address Validationby Internet Service Providers 374.1 Introduction . . . . . . . . . . . . . . . . . . . . . . . . . . . . . . . . 374.2 Background and Literature Review . . . . . . . . . . . . . . . . . . . . . 39
4.2.1 SAV – Source Address Validation . . . . . . . . . . . . . . . . . . . 394.2.2 Inferring SAV Deployment . . . . . . . . . . . . . . . . . . . . . . 394.2.3 Modeling Security Performance . . . . . . . . . . . . . . . . . . . 40
4.3 Theoretical Framework . . . . . . . . . . . . . . . . . . . . . . . . . . . 414.3.1 Incentives . . . . . . . . . . . . . . . . . . . . . . . . . . . . . . 414.3.2 Explanatory Factors for SAV Compliance. . . . . . . . . . . . . . . 42
4.4 Data Collection . . . . . . . . . . . . . . . . . . . . . . . . . . . . . . . 444.4.1 Mapping observations to ISPs . . . . . . . . . . . . . . . . . . . . 454.4.2 Data on IP Spoofing . . . . . . . . . . . . . . . . . . . . . . . . . 454.4.3 Network Properties Data . . . . . . . . . . . . . . . . . . . . . . . 504.4.4 Security Effort Data . . . . . . . . . . . . . . . . . . . . . . . . . 514.4.5 ISP Characteristics Data . . . . . . . . . . . . . . . . . . . . . . . 534.4.6 Institutional Environment Data . . . . . . . . . . . . . . . . . . . 53
4.5 Statistical Model for Non-Compliance . . . . . . . . . . . . . . . . . . . 534.5.1 Model Specification . . . . . . . . . . . . . . . . . . . . . . . . . 544.5.2 Discussion of Results. . . . . . . . . . . . . . . . . . . . . . . . . 54
4.6 Challenges in the Adoption of SAV . . . . . . . . . . . . . . . . . . . . . 594.6.1 Reducing the cost of adoption . . . . . . . . . . . . . . . . . . . . 594.6.2 Reducing Information Asymmetry . . . . . . . . . . . . . . . . . . 614.6.3 Internalizing Externalities . . . . . . . . . . . . . . . . . . . . . . 614.6.4 Community Action to Reduce Weak Links . . . . . . . . . . . . . . 61
4.7 Conclusions. . . . . . . . . . . . . . . . . . . . . . . . . . . . . . . . . 62
5 Deployment of Source Address Validation by Network Operators: A Random-ized Control Trial 635.1 Introduction . . . . . . . . . . . . . . . . . . . . . . . . . . . . . . . . 63

CONTENTS xv
5.2 Related Work . . . . . . . . . . . . . . . . . . . . . . . . . . . . . . . . 655.2.1 Methods to Infer the Adoption of SAV . . . . . . . . . . . . . . . . 655.2.2 Security Notification Experiments . . . . . . . . . . . . . . . . . . 665.2.3 Behavioral Nudges . . . . . . . . . . . . . . . . . . . . . . . . . . 67
5.3 Methodology . . . . . . . . . . . . . . . . . . . . . . . . . . . . . . . . 675.3.1 Vulnerability Discovery . . . . . . . . . . . . . . . . . . . . . . . 685.3.2 Experimental Design. . . . . . . . . . . . . . . . . . . . . . . . . 695.3.3 Notification Procedure . . . . . . . . . . . . . . . . . . . . . . . . 735.3.4 Post-Experiment Survey Design . . . . . . . . . . . . . . . . . . . 735.3.5 Ethics . . . . . . . . . . . . . . . . . . . . . . . . . . . . . . . . 74
5.4 Results . . . . . . . . . . . . . . . . . . . . . . . . . . . . . . . . . . . 755.4.1 Organization-Level Remediation. . . . . . . . . . . . . . . . . . . 755.4.2 Partial Remediation . . . . . . . . . . . . . . . . . . . . . . . . . 765.4.3 Main Experimental Effects . . . . . . . . . . . . . . . . . . . . . . 775.4.4 Comparison with Spoofer . . . . . . . . . . . . . . . . . . . . . . 79
5.5 Factors affecting remediation rates . . . . . . . . . . . . . . . . . . . . . 805.6 Survey Results . . . . . . . . . . . . . . . . . . . . . . . . . . . . . . . 835.7 Discussion & Conclusions. . . . . . . . . . . . . . . . . . . . . . . . . . 85
5.7.1 Treatment Effects . . . . . . . . . . . . . . . . . . . . . . . . . . 855.7.2 Remediation in the Control Group . . . . . . . . . . . . . . . . . . 855.7.3 Comparison with Previous Studies . . . . . . . . . . . . . . . . . . 855.7.4 Reasons for Non-Remediation . . . . . . . . . . . . . . . . . . . . 865.7.5 Moving Forward: Recommendations . . . . . . . . . . . . . . . . 87
6 Conclusion 896.1 Contribution to the research gaps. . . . . . . . . . . . . . . . . . . . . . 90
6.1.1 Transparency of Measurements . . . . . . . . . . . . . . . . . . . 906.1.2 Incentives . . . . . . . . . . . . . . . . . . . . . . . . . . . . . . 936.1.3 Interventions . . . . . . . . . . . . . . . . . . . . . . . . . . . . 94
6.2 Moving forward . . . . . . . . . . . . . . . . . . . . . . . . . . . . . . . 966.2.1 Improving transparency . . . . . . . . . . . . . . . . . . . . . . . 966.2.2 New Interventions . . . . . . . . . . . . . . . . . . . . . . . . . . 97
6.3 Closing Thoughts . . . . . . . . . . . . . . . . . . . . . . . . . . . . . . 100
A APPENDIX A 115A.1 Notification Text . . . . . . . . . . . . . . . . . . . . . . . . . . . . . . 115
A.1.1 Direct Notifications – Baseline . . . . . . . . . . . . . . . . . . . . 115A.1.2 Direct Notification – Social Nudge . . . . . . . . . . . . . . . . . . 115A.1.3 Direct Notification – Reciprocity . . . . . . . . . . . . . . . . . . . 116A.1.4 CERT Notification – Baseline. . . . . . . . . . . . . . . . . . . . . 116A.1.5 CERT Notification–Social Nudge . . . . . . . . . . . . . . . . . . . 117A.1.6 CERT Notification–Reciprocity . . . . . . . . . . . . . . . . . . . . 118A.1.7 NOG Notification . . . . . . . . . . . . . . . . . . . . . . . . . . 118
A.2 Questionnaire. . . . . . . . . . . . . . . . . . . . . . . . . . . . . . . . 119A.3 Screen shot of Website . . . . . . . . . . . . . . . . . . . . . . . . . . . 121


1INTRODUCTION
1.1. THE TRUST-BASED NATURE OF THE INTERNETThe Internet can be defined as a global system of interconnected computer networksthat links multiple devices to exchange digital information [1]. The architecture of theInternet was kept simple on purpose so that it can accommodate various services withminimal intervention [1], [2]. In essence, any device that wants to communicate over theInternet divides the information into equal chunks of data, or ‘packets’. In the headerof the packet, it then adds its own address, known as the source Internet Protocol (IP)address and the address of the recipient the (destination IP address). The core of theInternet consists of routers that maintain a map of all connected devices (IP addresses)in a routing table. Each router determines the IP address of the next ‘hop’ (next closestrouter) based on the destination address, and forwards the packet to it. The packets areprocessed at each hop, with the next hop determined until the packet reaches its desireddestination.
The destination device uses the source IP address of the incoming packet to estab-lish the connection and reply to requests from the sender. Users are oblivious of sourceand destination IP addresses, since applications usually fill in this information for the IPpacket. However, users can override the IP header and customize the source or destina-tion address. Unlike in the real world, where official documents like driving licenses andpassports are used to authenticate people and information sources, the Internet lacksvalidation of source addresses in IP packets. Network operators and hardware manufac-turers are not obligated to validate a device’s IP address before routing a packet on theglobal Internet. Senders can therefore ‘spoof’ or falsify the source IP address of a packet.This constitutes a critical flaw in the design of the Internet.
1.1.1. THE THREAT LANDSCAPEMalicious actors use this flaw to their advantage. It provides them with anonymity, asreceivers are unable to trace the origin of malevolent communications. Moreover, userscan evade liability for impersonating another machine or user, since it is difficult to trace
1

1
2 1. INTRODUCTION
packets back to their actual sender. Many types of malicious attack rely on IP spoofing.This section describes some of the more common ones, from congesting a victim’s net-work or device to redirecting users to compromised domains using DNS (Domain NameSystem) cache manipulation.
BANDWIDTH CONGESTION ATTACKS
In a bandwidth congestion attack, an attacker directs a high volume of traffic towardthe target’s network, congesting the victim’s network and resulting in a Denial of Service(DoS). Such an attack relies on open services like DNS, NTP (Network Time Protocol) andmemcached reflection and amplification. Exploiting these open protocols, the attackerfinds services that result in an amplified response. For instance, an attacker might finda large TXT record in a DNS system, then send spoofed DNS packets to the open DNSservers requesting the TXT record with the victim’s source address. The public resolversthen send the replies to the spoofed address, i.e., that of the victim. Hence, each smallquery to the DNS generates an amplified response. An attacker can also launch a Dis-tributed Denial of Service (DDoS) attack by exploiting botnets and sending millions ofpackets with a spoofed source address to open resolvers from various networks, devicesand geographic locations. This effectively chokes the victim’s bandwidth.
Bandwidth congestion DDoS attacks can affect multiple users sharing the same net-work. In a recent survey [3], network operators named DDoS attacks as one of the mostsignificant threats to their network operations. The victims of DDoS attacks span accessnetworks, governmental networks, educational networks, gaming servers and influentialdomains. Figure 1.1 presents a timeline of the biggest DDoS attacks between 2013 and2020. Among the targets of these attacks were an organization that reports on maliciousactivities (SpamHaus) and well-known websites providing a range of entertainment, fi-nancial and productivity services. Outages caused by DDoS attacks result in significantmonetary losses. Recently, a Voice over IP (VoIP) service provider (bandwidth.com) re-ported a loss of nearly US $12 million because of customers leaving their services dueto DDoS attacks [4]. In another instance, a ransomware group (REvil) demanded $4.5million from VoIP.ms to end a week-long attack [4].
TCP/IP-BASED TARGETED ATTACKS
Attackers can also exploit other protocols to launch non-bandwidth attacks. One suchexample is to exploit the ‘three-way handshake’ of the Transmission Control Protocol/InternetProtocol (TCP/IP). TCP/IP provides for reliability in data transmission over the Internet.The ‘handshake’ is a three-step process performed by the client and the server beforethey start transmitting data. The steps are as follows:
1. The client sends a synchronization (SYN) packet to the server, indicating that itwants to initiate data transfer.
2. The server replies to the client with a SYN and acknowledgment (ACK) of the SYNpacket sent by the server.
3. The client responds to the SYN packet of the server with an ACK.

1.2. SOURCE ADDRESS VALIDATION TO THE RESCUE
1
3
SpamHaus20
13 SpamHaus is an organisation that notifies participants about spam emails and spam related activity. It received a 300 Gbps attack , which was largest recorded at that time
2017
Amazon
2020
Dyn
2016
GitHub
2018
Dyn, a DNS provider, suffered a DDoS attack that disrupted many well-known sites, including Netflix, PayPal, Visa, Amazon, Reddit, and GitHub. The attacker used Mirai's malware, which forms a botnet of compromised IoT devices, to conduct the DDoS attack.
Google's cloud business received a DDoS attack that lasted over a six months, peaking at 2.5Tbps in traffic. It is, to date, the biggest attack recorded in terms of traffic.
GitHub, a popular online code management service, received an attack that reached 1.3 Tbps. The DDoS attack on GitHub only lasted only 20 minutes.
AWS reported a DDoS attack with a peak rate of 2.3 Tbps. AWS did not disclose which customers were targeted by the attack.
Figure 1.1: Examples of particularly significant DDoS attacks (2013-2020)
An attacker can exploit the three-way handshake process by sending the server aspoofed packet with the source IP address of the victim. The server then responds withthe SYN-ACK packet to the victim. Since the victim did not initiate the connection, itdrops these packets. The server keeps resending the SYN-ACK, assuming the packetswere lost due to network issues. An attacker can launch a coordinated attack in whichmultiple servers sends a burst of high packet per second (PPS) SYN-ACK traffic to thevictim. While this attack is low bandwidth, it nonetheless congests the network equip-ment or machine of the victim. Akamai reported that several of its customers had beentargets of a SYN-ACK attack [5].
DNS-BASED ATTACKS
The Domain Name System (DNS) forms the backbone of our Internet. Every websitewe visit gets the translation of the IP address hosting it from a DNS resolver. In a DNS-based attack, the attacker sends a request for resolution to the local DNS resolver. If thelocal resolver does not have the record, it requests an answer from the upstream author-itative server. However, the attacker attempts to send a rogue response with a spoofedIP address for the authoritative server before arrival of the legitimate response. If the at-tacker’s response arrives before the legitimate reply, the local resolver accepts the answerand keeps it in the cache. When the victim queries for the website, it is redirected to thecompromised machine controlled by the attacker. Since the discovery of this vulnerabil-ity in 2008, several patches have been released to circumvent such attack. A recent study[6], however, indicates that DNS-based attacks may still succeed.
In summary, numerous types of attacks are made feasible by IP spoofing. The scourgeof IP spoofing led Internet Hall of Fame technologist Paul Vixie [7] to observe, “Nowherein the basic architecture of the Internet is there a more hideous flaw than in the lack ofenforcement of simple source-address validation (SAV) by most gateways."
1.2. SOURCE ADDRESS VALIDATION TO THE RESCUETo mitigate cyber-attacks, the operator of the victim’s network usually needs two sets ofinformation: the source of the attack and a methodology to drop traffic from this pointof origin. However, IP spoofing makes it almost impossible to identify the source IP ad-dress, and attacks can originate from various networks. So operators cannot block themalicious communications without dropping legitimate traffic.

1
4 1. INTRODUCTION
A simpler solution is for the majority of network operators to verify the source ad-dress of packets originating from their own networks and drop illegitimate packets. Thiswould curtail attackers’ ability to send spoofed packets in the first place. Defeating am-plification attacks and other threats based on IP spoofing requires that providers filterout any incoming packets with spoofed source IP addresses. In other words, they mustimplement BCP 38 [8] , the Best Current Practice also known as Source Address Valida-tion (SAV).
The Spoofer Project [9], which measures SAV compliance, reported that as of Novem-ber 2021 some 24% of networks still allowed users to send packets with a false source ad-dress. Thus, despite source IP address spoofing being a known vulnerability for at least25 years, and despite much effort to shed light on the problem, spoofing remains a viablemethod for redirection, amplification and anonymity of attackers.
1.3. FACTORS AFFECTING NONCOMPLIANCE
Numerous community-driven programs have encouraged operators to implement thebest practice. However, many networks are still observed to be noncompliant, discov-ered through various methodologies. The question that arises is why do we still findoperators without SAV, despite all the efforts made to implement SAV and despite DDoSattacks being one of the most significant challenges facing network operators?
The most-used argument in favor of noncompliance is borrowed from the economicsliterature and known as the tragedy of the commons. In simple terms, it depicts a situa-tion where an individual user with access to a shared resource acts selfishly in their owninterest, to the detriment of the common interest of all users. This results in depletion ofthe resource and losses to others. Translated to network operators’ non-implementationof SAV, the Internet is the shared resource and those network providers that have imple-mented SAV are the ones who experience the loss. This is because they incur the costof hardware, training and time to keep the hardware updated. However, their adoptionof SAV does not protect their own network from attacks involving IP spoofing; it onlyprevents their networks from being used by attackers.
In short, adoption of SAV is hindered by a clear misalignment of incentives: the cost isborne by the networks that implement it, while the benefits go to the rest of the Internet.Noncompliance can therefore be termed a negative externality (a cost incurred by a thirdparty for the actions of other parties). Seen in this light, it is actually remarkable that asizeable proportion of all networks are in fact SAV compliant.
There are other reasons for noncompliance, including technical issues, economicdrivers and network complexity. These are briefly touched upon in the discussion of theresearch gaps below, and detailed further in Chapter 4.
1.4. RESEARCH GAPS
Various authors have examined SAV compliance among network providers. This sectionpresents an overview of efforts to measure and understand SAV compliance, and somelimitations in the current state of the art.

1.4. RESEARCH GAPS
1
5
1.4.1. MEASURING SAV ADOPTION
A wealth of tools has been developed to collect data on network policies and practicesacross the Internet – e.g., for quality, security and transparency purposes. Many mea-surements rely on a distributed set of vantage points to capture representative data.Having adequate vantage points is particularly critical for tools that must be run fromwithin a network to enable accurate inferences. SAV measurements, too, require van-tage points within networks, in order to measure whether the network allows IP packetswith a spoofed source address or blocks these before the packet leaves the network.
One way to gain the needed vantage points is by recruiting volunteers to deploy avantage point within their network to measure compliance. This is a solution offered bythe Spoofer Project. However, it brings several challenges. Particularly, (1) it is not easyto find volunteers willing to install the spoofer client software, (2) the participants needto be in diverse networks to get appropriate coverage and (3) the tool needs to conductlongitudinal tests to assess whether noncompliant networks have gone on to deploy SAV.
Another approach to measure compliance is by collaborating with Internet ExchangePoints (IXP). IXPs provide connectivity to Internet service providers and as such are at thecore of the Internet. Previous studies [10], [11] have compared the source IP addresses ofincoming packets from Internet providers with the IP ranges allocated to them to inferwhether the network operator had deployed SAV. However, a significant challenge in us-ing this methodology is non-availability of data, as IXPs don’t publicly share their data.Moreover, many network providers are multiple hops away from an IXP, which rendersthis method ineffective for measuring SAV compliance. In addition, IXPs receive pack-ets in the order of petabytes, which can be challenging to store and process for ongoingmeasurements.
Finally, a previous study [12] exploited a misconfiguration in home routers to infernoncompliance. When probed, the misconfigured devices acted as vantage points andresponded with incorrect source IP addresses to a specially crafted DNS request. How-ever, this methodology depends on the misconfigured devices and only reveals noncom-pliant networks that host these devices. Moreover, the authors did not run longitudinalanalysis using the methodology.
Finally, a previous study [12] had used a misconfiguration in home routers to infernon-compliance. When probed, the misconfigured devices act as a vantage point andsend packets with incorrect source IP addresses. Their methodology depends on themisconfigured devices and only reveals noncompliant networks that host these devices.Moreover, the authors did not run any longitudinal analysis using this methodology.
In summary, there is no reliable metric to estimate the current status of SAV deploy-ment. Multiple methodologies reveal noncompliant networks. However, no datasets arepublicly available, except for those of the Spoofer Project, which has only partial cov-erage. This results in information asymmetry. Which network operators have imple-mented SAV is seldom visible to customers, providers and outside observers. Neither isthis information readily available to the public or to other providers, which might useit in peering decisions. Thus, while adopting SAV is a good practice, it does not resultin a better reputation. Conversely, non-compliance does not generate a clear negativereputational impact.

1
6 1. INTRODUCTION
1.4.2. DRIVERS OF ADOPTION OF SAVWe know little about why certain operators do not implement SAV in their network.Lichtblau and colleagues surveyed 84 network providers in early 2017 [11]. The oper-ators raised several reasons for noncompliance, including technical difficulties and thetime and knowledge required to deploy SAV. Moreover, many respondents reported alack of motivation to implement SAV, stating that spoofed traffic was only a fraction oftheir total traffic volume. While providing some insight into obstacles to SAV deploy-ment, the sample in this research was biased toward a small set of operators that alreadyunderstood the implications of noncompliance and might already have deployed somenetwork filtering measures.
No research has yet systematically scrutinized the underlying causes of non-adoption.Is it the size of the network or general complexity that drives network operators awayfrom compliance? Can compliance be explained by economic drivers? For instance, isSAV adoption more widespread in countries with better Internet infrastructure and re-sources? Or, are providers simply unconcerned with network hygiene in general? Simi-larly, little has been done to develop empirical models to quantify the impact of differentcausal drivers of noncompliance.
1.4.3. INTERVENTIONS TO IMPROVE SAV ADOPTION
A stream of studies has examined the effectiveness of notifications to network operatorsto remediate vulnerabilities. However, substantially less effort has gone into improvingSAV adoption among operators. A global initiative called Mutually Agreed Norms forRouting Security (MANRS) is leading the effort to improve routing security [13]. Oneof its main action items is providing knowledge, awareness and technical assistance tonetwork operators to implement SAV in their networks. MANRS recommends that allof its member organizations be fully compliant with SAV. It provides technical docu-ments for different routers, and conducts workshops and seminars to educate operatorson best practices. Despite leading the effort, as of February 2022 MANRS has only 809Autonomous Systems (ASes) as participants [14], out of a total of more than 70,000 ASesadvertised in Border Gateway Protocol (BGP). Participants were, furthermore, concen-trated in developed countries. The MANRS initiative promotes its objectives throughattendance at network operator conferences and via social media. While its observatoryhas information about noncompliant providers, it does not actively send notifications.
Regarding notifications, multiple channels are available to reach noncompliant net-work operators. We can reach them using the abuse contact provided in the WHOISdatabase. Or, we can use public databases, like peeringDB, to find an email addressto contact the providers. Another way to contact noncompliant operators is via an in-termediary, like a national computer emergency response team (CERT). Finally, we canuse public forums, like social media and network operator lists, to reach the providers.The Spoofer Project disseminates the data that it collects only on the network operators’mailing list. The project sends monthly reports of networks that are noncompliant andthose that have remediated. Despite the importance of an effective means of approach-ing providers, no study provides information on what is the best channel to reach them.We are similarly in the dark about whether providers contacted through Network Oper-ator Group (NOG) lists have enough knowledge and sufficient motivation to implement
1.5. RESEARCH AIMS AND QUESTIONS
1
7
SAV in their networks.In summary, we observe three main gaps in current research. First, the multiple
methodologies currently available afford only a partial view of noncompliance, while ef-forts to assess compliance, as yet, either lack coverage or do not make their data publiclyavailable. Second, we lack information about causal drivers that explain non-adoptionby providers. Finally, limited work has been done examining interventions and the meth-ods that work best to improve SAV adoption.
1.5. RESEARCH AIMS AND QUESTIONSSAV adoption requires policy interventions that differ from traditional remediation ap-proaches. Unlike other network policies, there is no way to measure adoption of SAVfrom outside a network. Whether a network operator is compliant with SAV is seldomvisible to customers, providers and outside observers. Neither is the information read-ily available to the public or to other providers, which might use it in peering decisions.Thus, while adopting SAV is a good practice, it does not result in a better reputation. Con-versely, noncompliance does not generate a clear negative reputational impact. In thecurrent research, we set out to improve the visibility and coverage of SAV noncomplianceby network providers. We estimated the impact of various incentives on SAV adoptionand statistically modelled causal drivers for the absence of SAV. To understand how toimprove compliance, we conducted a randomized control experiment with several in-terventions and a comparison of channels for notifying operators. The main researchquestion is the following:
• How can we measure and improve the adoption of Source Address Validation (SAV)by network operators?
To answer this question, we conducted four studies, presented in chapters 2-5 of thisthesis. We briefly introduce these studies below.
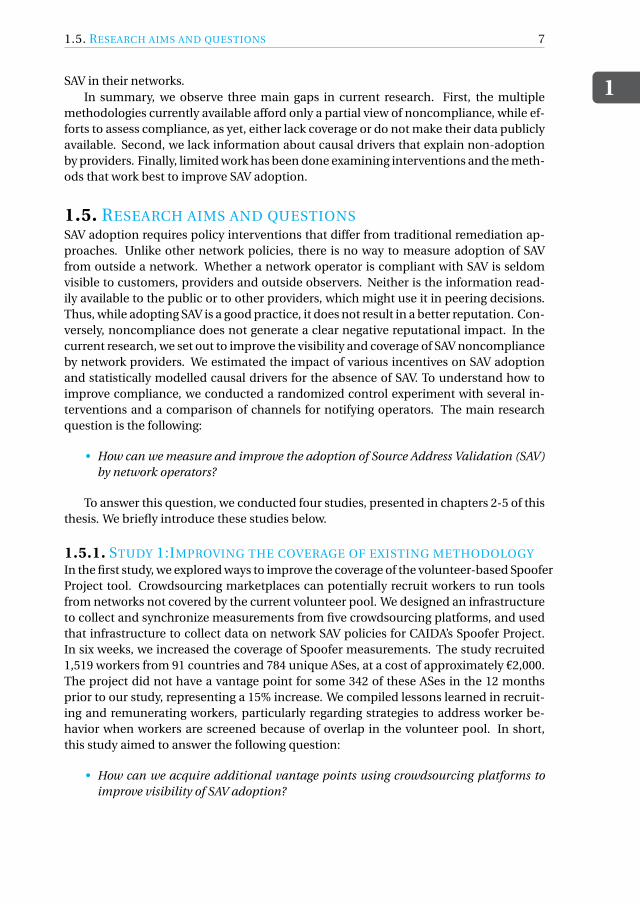
1.5.1. STUDY 1:IMPROVING THE COVERAGE OF EXISTING METHODOLOGYIn the first study, we explored ways to improve the coverage of the volunteer-based SpooferProject tool. Crowdsourcing marketplaces can potentially recruit workers to run toolsfrom networks not covered by the current volunteer pool. We designed an infrastructureto collect and synchronize measurements from five crowdsourcing platforms, and usedthat infrastructure to collect data on network SAV policies for CAIDA’s Spoofer Project.In six weeks, we increased the coverage of Spoofer measurements. The study recruited1,519 workers from 91 countries and 784 unique ASes, at a cost of approximately €2,000.The project did not have a vantage point for some 342 of these ASes in the 12 monthsprior to our study, representing a 15% increase. We compiled lessons learned in recruit-ing and remunerating workers, particularly regarding strategies to address worker be-havior when workers are screened because of overlap in the volunteer pool. In short,this study aimed to answer the following question:
• How can we acquire additional vantage points using crowdsourcing platforms toimprove visibility of SAV adoption?
1
8 1. INTRODUCTION
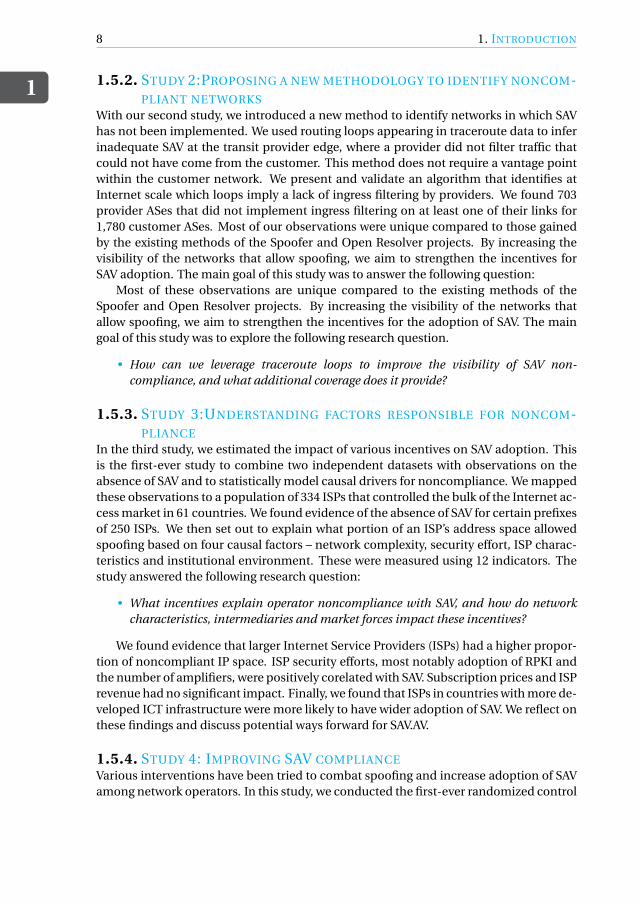
1.5.2. STUDY 2:PROPOSING A NEW METHODOLOGY TO IDENTIFY NONCOM-PLIANT NETWORKS
With our second study, we introduced a new method to identify networks in which SAVhas not been implemented. We used routing loops appearing in traceroute data to inferinadequate SAV at the transit provider edge, where a provider did not filter traffic thatcould not have come from the customer. This method does not require a vantage pointwithin the customer network. We present and validate an algorithm that identifies atInternet scale which loops imply a lack of ingress filtering by providers. We found 703provider ASes that did not implement ingress filtering on at least one of their links for1,780 customer ASes. Most of our observations were unique compared to those gainedby the existing methods of the Spoofer and Open Resolver projects. By increasing thevisibility of the networks that allow spoofing, we aim to strengthen the incentives forSAV adoption. The main goal of this study was to answer the following question:
Most of these observations are unique compared to the existing methods of theSpoofer and Open Resolver projects. By increasing the visibility of the networks thatallow spoofing, we aim to strengthen the incentives for the adoption of SAV. The maingoal of this study was to explore the following research question.
• How can we leverage traceroute loops to improve the visibility of SAV non-compliance, and what additional coverage does it provide?
1.5.3. STUDY 3:UNDERSTANDING FACTORS RESPONSIBLE FOR NONCOM-PLIANCE
In the third study, we estimated the impact of various incentives on SAV adoption. Thisis the first-ever study to combine two independent datasets with observations on theabsence of SAV and to statistically model causal drivers for noncompliance. We mappedthese observations to a population of 334 ISPs that controlled the bulk of the Internet ac-cess market in 61 countries. We found evidence of the absence of SAV for certain prefixesof 250 ISPs. We then set out to explain what portion of an ISP’s address space allowedspoofing based on four causal factors – network complexity, security effort, ISP charac-teristics and institutional environment. These were measured using 12 indicators. Thestudy answered the following research question:
• What incentives explain operator noncompliance with SAV, and how do networkcharacteristics, intermediaries and market forces impact these incentives?
We found evidence that larger Internet Service Providers (ISPs) had a higher propor-tion of noncompliant IP space. ISP security efforts, most notably adoption of RPKI andthe number of amplifiers, were positively corelated with SAV. Subscription prices and ISPrevenue had no significant impact. Finally, we found that ISPs in countries with more de-veloped ICT infrastructure were more likely to have wider adoption of SAV. We reflect onthese findings and discuss potential ways forward for SAV.AV.
1.5.4. STUDY 4: IMPROVING SAV COMPLIANCEVarious interventions have been tried to combat spoofing and increase adoption of SAVamong network operators. In this study, we conducted the first-ever randomized control

1.6. DISSERTATION OUTLINE
1
9
experiment to measure the effectiveness of various notification mechanisms on SAV de-ployment. Specifically, we tested different nudges and notification channels. We also rana survey among operators to identify ways forward. A portion of the operators indicatedthat they did plan to deploy SAV and welcomed better notification mechanisms, train-ing and support materials for SAV implementation. In addition to exploring how moreoperators might be moved to adopt SAV, we zoomed in on the effectiveness of particularincentives and notifications, asking the following:
• What intervention offers the strongest incentives for network operators to imple-ment SAV, and how can we improve SAV notifications to make them most effectivefor network operators?
This study revealed a painful and disappointing reality: there was no evidence of anyremediation driven by any of the treatments compared to the control group. All in all,our findings are sobering but important if we are to correct our understanding of theseinterventions and move forward on this critical issue. Our survey among operators helpsus identify how.
1.6. DISSERTATION OUTLINEThe remainder of this dissertation is organized as follows. Chapters 2 through 5 presentthe studies introduced above. Chapter 6 presents conclusions and proposals for fu-ture work. The four main chapters (2-5) were originally published separately as peer-reviewed articles in distinguished outlets. Table 1.1 provides an overview of these. Dur-ing the course of this dissertation, I was fortunate to collaborate with some of the greatresearchers, whose contributions I gratefully acknowledge at the end of the dissertation.
Chapter Publication
2
Qasim Lone, Matthew Luckie, Maciej Korczynski, Hadi Asghari,Mobin Javed, and Michel Van Eeten.“Using crowdsourcing market-places for network measurements: The case of spoofer." In 2018 Net-work Traffic Measurement and Analysis Conference (TMA), pp. 1-8.IEEE, 2018.
3
Qasim Lone, Matthew Luckie, Maciej Korczynski, and Michel VanEeten. “Using loops observed in traceroute to infer the ability tospoof." In International Conference on Passive and Active NetworkMeasurement, pp. 229-241. Springer, Cham, 2017.
4
Qasim Lone, Maciej Korczynski, Carlos Gañán, and Michel van Eeten.“SAVing the Internet: Explaining the Adoption of Source Address Vali-dation by Internet Service Providers." In Workshop on the Economicsof Information Security. 2020.
5
Qasim Lone, Alisa Frik, Matthew Luckie, Maciej Korczynski, Michelvan Eeten, Carlos Gañán. “Deployment of Source Address Validationby Network Operators: A Randomized Control Trial." To appear in theIEEE Symposium on Security & Privacy, May 2022
Table 1.1: Overview of dissertation chapters


2USING CROWDSOURCING
MARKETPLACES FOR NETWORK
MEASUREMENTS: THE CASE OF
SPOOFER
Internet measurement tools are used to make inferences about network policies andpractices across the Internet, such as censorship, traffic manipulation, bandwidth, andsecurity measures. Some tools must be run from vantage points within individual net-works, so are dependent on volunteer recruitment. A small pool of volunteers limits theimpact of these tools. Crowdsourcing marketplaces can potentially recruit workers torun tools from networks not covered by the volunteer pool.
We design an infrastructure to collect and synchronize measurements from five crowd-sourcing platforms, and use that infrastructure to collect data on network source addressvalidation policies for CAIDA’s Spoofer project. In six weeks we increased the coverageof Spoofer measurements by recruiting 1519 workers from within 91 countries and 784unique ASes for 2,000 Euro; 342 of these ASes were not previously covered, and representa 15% increase in ASes over the prior 12 months. We describe lessons learned in recruit-ing and renumerating workers; in particular, strategies to address worker behavior whenworkers are screened because of overlap in the volunteer pool.
2.1. INTRODUCTIONA wealth of tools have been developed to collect data on network policies and prac-tices across the Internet – e.g., for quality, security, and transparency purposes. Manymeasurements rely on a distributed set of vantage points to capture representative data.This is even more critical for tools that need to be run from within a network to enablecorrect inferences, such as censorship measurement [15], network performance debug-
11

2
122. USING CROWDSOURCING MARKETPLACES FOR NETWORK MEASUREMENTS: THE CASE
OF SPOOFER
ging [16]–[19], or detecting security policies such as deployment of Source Address Vali-dation (SAV) [20].
A common challenge is acquiring an adequate set of vantage points. A conventionalapproach is recruiting volunteers via conferences, mailing lists, and other channels todeploy a tool or hardware probe [21]. Another approach is to use established distributedmeasurement platforms with a substantial number of vantage points, such as RIPE At-las [21] and SamKnows [22]. As of October 2017, RIPE Atlas has 10,113 connected vantagepoints within 3,596 ASes routing IPv4 prefixes. However, these platforms only allow alimited set of measurement tools under their user agreements. For example, while thereis demand among RIPE Atlas probe hosts for SAV testing (the case we examine in thisstudy), and operators of 117 probes within 83 IPv4 ASes have voluntarily tagged theirprobes asking for this testing, SAV testing on Atlas is unlikely to be supported, at leastin the near future [23]. Other platforms, like PlanetLab [24], have most of their vantagepoints in educational networks, or have few vantage points to begin with. Project BIS-mark [25], for example, has only 57 active vantage points. Such limitations greatly reducethe types of networks that can be included in a study, especially for measurements thatneed to be conducted from within networks.
Crowdsourcing marketplaces offer an attractive complementary option for recruit-ing vantage points, as payment makes studies less reliant on volunteer recruitment.These platforms offer workers small monetary benefits for carrying out micro jobs thatusually do not require extensive knowledge and can be completed within few minutes,and attract workers with diverse backgrounds and geographical locations.
In this study, we explore how effective crowdsourcing marketplaces are in extending,within a limited budget, the coverage of vantage points for network measurements, com-pared to the volunteer-based approaches commonly used in network measurements.We design and test a system to conduct parallel measurements across five marketplaces,each with a different geographical reach, and assess the improvement in network cov-erage. We collect data for CAIDA’s Spoofer project [20]. The client tests whether thenetwork in which the vantage point is located filters packets with spoofed source IP ad-dresses, a best practice known as SAV [8]. More comprehensive visibility into SAV com-pliance is important to incentivize network operators combat IP spoofing and mitigatethe associated threats, most notably large-scale distributed denial of service attacks [26],[27].
Spoofer provides a very informative case study, as it is dependent on the coverageof vantage points inside networks. It is well known and has been recruiting volunteersfor over a decade. To extend its reach, it cannot turn to platforms like RIPE Atlas, whichcurrently does not allow spoofing measurements [23]. These factors make marketplacesvaluable, but the tool also poses hurdles, as workers must be willing to install and runan executable, and such a task must be permitted within the Terms of Service of theplatform.
To summarize, our main contributions are as follows:
1. We design an infrastructure to collect and synchronize parallel measurements viamultiple marketplaces. Our infrastructure prevents invalid submissions, and canbe extended to any measurement tool which reports a proof of completion.

2.2. RELATED WORK
2
13
Operated by CAIDA
IPv4/2
4
Uniq
ue
Uniq
ue
AS
Ns
Spoofa
ble
IPv4/2
4
Cum
ula
tive
Cum
ula
tive
AS
Ns
AS
Ns
(%)
Spoofa
ble
IPv4/2
4 (
%)
Slashdot experiment
Crowdsourcing
ReleasedGUI
Operated by CAIDA
IPv4/24
IPv4/24
1.4K 1.2K 1.0K 0.8K 0.6K 0.4K 0.2K 0
7K 6K 5K 4K 3K 2K 1K
0
ASNs
IPv4/24
6K 5K 4K 3K 2K 1K 0
60K 50K 40K 30K 20K
0
15
30
45
Jan’06
Jan’08
Jan’10
Jan’12
Jan’14
Jan’16
Jan’18
0
15
30
45
10K 0
ASNs
ASNs
Figure 2.1: Overview of Spoofer project data collection over time, aggregated per month. The gaps are due tohardware failures. Between November 2016 and December 2017, the range of spoofable IPv4 prefixes is 4.9% –6.8%, and the range of spoofable ASNs is 13.1% – 14.5%. The two data collection peaks in April and May 2017are due to the crowdsourcing experiments in this study, and those results are qualitatively similar to thosecollected between November 2016 and December 2017.
2. We present experiences of how this design interacts with the marketplace plat-forms during measurement studies.
3. We assess the geographical diversity of the workers willing and able to completethe test, both between and within the platforms. We measure the effect of priceelasticity (higher compensation) on the recruitment of additional workers. In to-tal, we acquired vantage points from 91 countries and 784 unique AutonomousSystems (AS) and 1519 IP addresses at a price of approximately 2,000 Euro on plat-form fees and worker compensation.
4. We show that in six weeks, we increased the coverage of Spoofer by 342 uniqueASes and 1470 /24’s, a 15% increase of ASes over the prior 12 months.
5. We make our code available to the community[28].
2.2. RELATED WORKNumerous papers used crowdsourcing platforms from diverse fields such as behavioralsciences, automation [29], [30], and computer vision [31], [32]. Researchers have alsoexplored the dynamics of microjob platforms, and estimated the worker demographicsand geographical dispersion [33]. Furthermore, studies have looked at increasing exper-iment efficiency in terms of price or new users [34]–[36].
Closer to our work, there is a handful of studies in the area of information security.Christin et al. were able to hire 965 workers to execute their program for an hour [37].The program collected the Windows version, the list of active processes, and detectedwhether the application was running in a virtual machine. The goal was to test if raisingthe price has an impact on participants willingness to execute potentially malicious ap-plications. They observed that significantly more people downloaded the program when

2
142. USING CROWDSOURCING MARKETPLACES FOR NETWORK MEASUREMENTS: THE CASE
OF SPOOFER
the price was raised to $0.50 and then $1.00. In another study, researchers were able toidentify 85% of browsers running plug-ins with known vulnerabilities using JavaScript[38]. They concluded that for a mere $52, 1,000 machines could be compromised.
Huz et al. conducted two Internet measurements on the MTurk platform, acquiringadditional vantage points for broadband speed tests and the state of IPv6 adoption [39].They found that participants from the US and India constituted 89% of completed tasks.The campaigns were shorter than ours and only on MTurk. Their exploration of pric-ing effects had inconclusive results. They were also unable to conduct tests using anexecutable, as this was against the terms of service at the time. Similarly, Varvello et al.studied page load times recruiting 1000 paid participants [40]. This study accepted allworkers and did not control for, nor optimize, the distribution of vantage points overnetworks.
Some experiments require workers to conduct subjective assessments, relying on theworker actively participating in the experiment. Mok et al. proposed a method to de-tect low-quality workers that reduce experiment quality in a Quality of Experience con-text [41]. We do not face the same challenges in this work; the spoofer system automati-cally evaluates the reliability of the host for conducting SAV measurements.
We build on prior work, most notably [39], by designing an infrastructure to controland optimizing network coverage across platforms, by comparing platforms with differ-ent geographical coverage, by running measurements using an executable, and by moresystematically observing the impact of job pricing.
2.3. BACKGROUND ON THE SPOOFER PROJECTDetermining if a given network blocks packets with spoofed source addresses requiresa system within that network try sending packets with spoofed source addresses. TheSpoofer project began in March 2005 as an effort by Beverly et al. to understand theprevalence of SAV deployment in the Internet using crowd-sourced measurements. Theybuilt a client/server system that allows the client to test whether or not packets withspoofed source addresses are discarded before they reach the server. For their initialstudy [20], they solicited volunteers through the North American Network OperatorsGroup (NANOG) and dhsield security mailing lists to install and run the client. Theyreceived 459 client reports from unique IP addresses within 302 different prefixes; theserver received packets with spoofed source addresses from 24.2% of these prefixes [20].
Between 2005 and 2009, the client-server system was updated to include a simpleGUI for MacOS, IPv6 probing for UNIX systems, multiple destination support and tracer-oute probing to provide for tomography on paths where SAV is not deployed [42], andtracefilter to find where SAV is deployed [43]. However, there were three key issues limit-ing volunteer adoption and use of the system: (1) the lack of a user interface to the clientsoftware, (2) the user had to manually run the client software, and (3) the results werenot made public so ISPs were not incentivized to deploy filtering. Figure 2.1 summarizesthe data collection and project results over time; the peak in May 2006 coincides with apost to Slashdot seeking volunteers to run measurements [44].
In May 2015, CAIDA took over stewardship of the spoofer project, and in May 2016released a new system that included a GUI and feature parity across all supported plat-forms (MacOS, Windows, and UNIX). The client operates in the background, testing

2.4. CROWDSOURCING PLATFORMS
2
15
PlatformClaimedCoverage
ClaimedPopulation
Min Amount Payment
MTurk US, IN 500,000 No min Credit CardProA GB, US, EU 56,556 $7.50 USD/hr PaypalRW IN, BD, US N/A $0.01 USD Skrill, PaypalJobboy US, BD 152,000 $0.01 USD Paypal, PayzaMinijobz BD, IN N/A $0.01 USD Paypal, Payza
Table 2.1: Crowdsourcing marketplaces we used in this study. The source of these demographics is variousblog posts and platform websites, discussed in section 2.4. US: United States, IN: India,EU: Europe, GB: GreatBritain, BD: Bangladesh.
networks as the volunteer’s computer is attached to them, and once a week thereafter.CAIDA built a public reporting engine providing an anonymized view of results, allow-ing affected IPv4 /24 and IPv6 /40 blocks to be identified, reported with the origin ASof the block and IP geolocation. Raw IPv4 and IPv6 addresses of the tester are kept in adatabase, and are only disclosed to the affected network if the user consents to the rawIP addresses being shared for remediation, and the operator requires them to remedi-ate. The client software deliberately does not include any tracking capability that wouldallow CAIDA to determine if tests conducted in different networks are from the samevolunteer.
The crowdsourcing measurements we report in this dissertation contributed to thecurrent peak volume of measurements received by the spoofer project in a single month(middle panel of figure 2.1). The measurements are, in spoofability, qualitatively simi-lar to other measurements collected between November 2016 and December 2017, i.e.these measurements are no more biased in that dimension than other measurementscollected during this period (bottom panel of figure 2.1).
2.4. CROWDSOURCING PLATFORMS
We compiled a list of 15 crowdsourcing platforms from prior research and blog posts [45]–[47]. First, we selected platforms that allowed tasks which require workers to installand run an executable on their machine, ruling out platforms like CrowdFlower [48].We also excluded platforms where language barriers prevented us from determiningwhether running executables were allowed (e.g., zbj.com and crowdworks.jp). Sec-ond, the marketplace should support micro jobs. Platforms like CloudFactory[49] andUpwork [50] only support more complex jobs and impose higher minimum compensa-tion levels.
Based on these requirements, we selected the following five platforms: Amazon Me-chanical Turk (MTurk) [51], Prolific Academic (ProA) [52], RapidWorkers (RW) [53], Job-boy (JB) [54], and Minijobz (MJ) [55]. Table 2.1 lists features of the selected platforms.They provide diversity of coverage across Europe, the United States, and South Asia (In-dia and Bangladesh), are flexible in setting compensation levels, and offer secure pay-ment methods.

2
162. USING CROWDSOURCING MARKETPLACES FOR NETWORK MEASUREMENTS: THE CASE
OF SPOOFER
Platform Job PostingWorker proofour website
Worker proofJob website
ViewSubmission
Payment
MTurk iframe - URL API APIProA iframe URL + ID - CSV CSVRW link URL Validation code Web UI ManualMJ link URL Validation code Web UI ManualJB link URL Validation code Web UI Manual
Table 2.2: Interactions between the microjob platforms and our infrastructure.
2.5. INFRASTRUCTURE DESIGNUsing marketplaces for network measurements is not trivial, as these platforms were notenvisioned to support this use case. Screening of workers is based on worker demo-graphics rather than properties of the network or client machines. Furthermore, tasksare generally integrated into the platform. Support for tracking completion of exter-nal tasks (e.g., running tools) is not directly available. In this section, we discuss howwe tackle these challenges and design a measurement infrastructure to collect networkmeasurement data.
2.5.1. MEASUREMENT GOAL
We articulate our measurement goal as follows: given a limited budget of 2,000 euro,maximize the coverage of vantage points (workers) over networks. After estimating workerpayouts, platform overhead, and unforeseen costs at 2 euro per worker, we estimated wecould acquire data from 1,000 vantage points (VPs). In total, we obtained data from 1,519VPs, which we discuss in §2.7 and §2.8.
Next, we consider how to distribute these points across the IP address space to op-timize diversity across networks. One starting point is to seek one data point per Au-tonomous System. This might be too restrictive for very large ASes, which may havesubstantial internal heterogeneity. For large ASes, we allow one measurement per each/11 subnet. We chose the granularity of /11 based on two observations: (1) we expectmost workers on the platforms to be located in broadband networks, and (2) we knowthese networks collectively represent around 2.4 billion addresses [56]). When distribut-ing 1,000 vantage points across this space, the closest block aggregation is /11. Note thatthis granularity can be changed based on a study’s budget and objectives.
2.5.2. MEASUREMENT INFRASTRUCTURE
Researchers may need to screen out workers from network blocks where they alreadyhave a vantage point. We therefore determined the eligibility of workers interested inour task and selected them accordingly. We discuss our measurement infrastructure andhow we integrate this design consideration.
(i) Job posting: All platforms allow linking to an external website in the job posting.For MTurk and ProA, our website was rendered as an iframe inside the platform site.We redirected workers for the other platforms to our website with platform name in theURL arguments to record which platform they participated from.

2.5. INFRASTRUCTURE DESIGN
2
17
●
●● ●
●
●
●● ● ●
● ●●
●
● ●
●
●
●
●
●●
●
●
●●
●●
●●
●
●
●
●●
●
Campaign 2
0
50
100
150
200
250
5 10 15Day
# of
Tes
tsMTurkProA
●
●
●
●
●
●
●
●
● ● ●
●
●
● ●
●
Campaign 2
0
5
10
15
20
5 10 15 20Day
● JobboyMinijobzRapidWorkers
Figure 2.2: Job completion for bigger (left) and smaller (right) platforms. When we increased compensation(campaign 2) we attracted additional workers on all platforms.
(ii) Screening: When a potential worker visits our website, we check whether we al-ready have a test result for the corresponding network block they connected from. If so,the potential worker is told that they are ineligible. Otherwise, they are presented withinstructions and a form to submit the result from running the Spoofer tool.
(iii) Proof of completion and payment: Upon completion, the Spoofer tool generatesa URL with a unique session ID. We ask the workers to submit this URL as a proof ofcompletion. For Mturk, the completion URL must be submitted to Mturk instead of ourwebsite, because the terms of service require that all worker-submitted data be stored onAmazon servers first. We set up a cron job to download these URLs and the correspond-ing Mturker IDs to our centralized database. This allowed us to automate payments onMturk using the provided payment API. For ProA, we requested workers to submit theworker ID and completion URL to our website. For bulk payments, we uploaded theCSV with worker IDs to the platform. For RapidWorkers, Jobboy, and Minijobz, we askedworkers to submit the completion URL to the platform, as there is no easy way to extracta worker ID from these platforms, which is necessary for payments. Further, these plat-forms do not provide an automatic payment method, and we had to manually approvepayment for each successful submission.
(iv) Centralized data collection: A centralized database is required to synchronize theresults collected from different crowdsourcing platforms in order to screen workers. Be-cause MTurk required us to store data on Amazon servers, and there is a delay before wesubsequently copied the data to our centralized database, we might be too late to screenout subsequent submissions from the same worker on MTurk. To avoid this, we usedMTurk’s qualification criteria: when a given worker accepts our task, we set a qualifica-tion criteria on the worker ID that disqualifies them for accepting it again. We reset thisflag in new campaigns, so that workers can participate from a different network block, ifeligible.
2.5.3. MEASUREMENT CAMPAIGNSWe ran three subsequent campaigns to evaluate the effectiveness in recruiting vantagepoints across different networks and to measure price elasticity.
Campaign 1: 50 cents per test. The first campaign lasted two weeks on all platforms.

2
182. USING CROWDSOURCING MARKETPLACES FOR NETWORK MEASUREMENTS: THE CASE
OF SPOOFER
On average, it takes around 4 minutes to download, install, and run the client and toreport the completion code to the platform. Offering 50 cents for this time is roughlyequivalent to the minimum wage in the Netherlands [57]. Further, Christin et al. foundthat when workers need to install software, raising the compensation to 50 cents causeda dramatic increase in workers [37].
The goals of this experiment were to test our setup and exhaust the pool of workerswilling to do the job for 50 cents. We ran this campaign for two weeks, and the com-pletion rate from each platform decreased per day. The last five days brought in only10% of the results. In total, we received completed submissions from 1,155 workers in 85countries.
Campaign 2: $1 per test. When few new workers were selecting the job, we in-creased compensation to $1 to assess price elasticity – i.e., whether higher paymentattracted additional workers. The higher compensation was set at the start of day 15.Figure 2.2 shows that all platforms had an increase in potential workers and completedtasks. RapidWorkers had an outage after we raised the price, so the increase occurred onday 19, when the platform was back online.
We were able to get 364 new submissions from 63 countries after the price increase.Some of these workers will have seen, but not taken up, the task during campaign 1. Ofthe 364 new submissions, 63 were from IP addresses from which we saw workers view-ing, but not selecting, the task during campaign 1. This undercounts the fraction of userswho responded directly to the price increase. Workers can see the title and the compen-sation level on the task list of the platform, without visiting our page. In other words, aportion of the workers from new IP addresses have also seen the task during campaign1 and are now responding to the higher price, though we cannot estimate what portion.Combined with the fact that the higher price also brought in more new users than dur-ing the last period of campaign 1, we can safely conclude that the price level makes asignificant difference in recruiting additional vantage points.
Campaign 3: 10 cent job plus 90 cent bonus. In the final phase, we changed thecompensation structure. We ran this campaign as a proof of concept and to resolve theproblem of ProA and MTurk worker complaints about compensations (more in section2.6). We offered 10 cents to workers for just reading our task. We offered an extra “bonus"to workers who were eligible, to be paid after completing the test. The campaign ranfor two days on ProA. 1243 workers participated from which 43 received bonuses. OnMTurk, we ran the campaign for a week, 12 workers from a total of 211 participants re-ceived bonuses. The low ratio of eligible workers (4-6% compared to 38% for campaigns1 and 2) combined reflects that eligibility rate goes down over time as more addressblocks are already covered. That also makes this pricing structure less efficient, sincean increasing fraction of spending will be on workers testing their eligibility rather thanactual tests. In our analysis we did not use results from this campaign (§2.7,2.8) becauseit was limited to two platforms (ProA, Amazon) and lasted only for 2 and 7 days respec-tively.
2.5.4. ETHICAL CONSIDERATIONS
Ethical considerations informed the design of our study. The first was fair compensa-tion. One could argue that since microjob platforms are markets, workers can refuse low

2.5. INFRASTRUCTURE DESIGN
2
19
payouts. Still, due to personal convictions, we did not want to go below the approxi-mate equivalent of the Dutch minimum wage, the location of the majority of this disser-tation’s authors. The second consideration was that the measurement tool should notharm worker machines. The Spoofer tool is from a trusted source, does not slow downthe machine or the network, is open-source, and can be easily un-installed. Third, weneeded to work within the terms of service of the platforms. We only ran our measure-ments on platforms which allowed software to be downloaded and executed on usermachines. Note that previously, Huz et al. was not allowed to run the Spoofer tool onMTurk [39], but the terms have since been relaxed to only prohibit software that can beharmful to users. Finally, for privacy considerations we did not ask workers for personalinformation, which is also forbidden on many platforms. We saved the minimum datanecessary to ensure measurement validity: the worker’s IP address and user-agent. Wesaved the worker’s IP address to ensure the IP address recorded by the Spoofer project(§ 5.4.4) corresponded to the IP address used by the worker when selecting our task. Last,to ensure informed consent, we provided clear information about the study.
2.5.5. INTERACTION WITH WORKERS
ProA and MTurk provide an option to allow communication between workers and jobposters; we resolved all worker questions and complaints. There were only two questionsregarding the legitimacy of the Spoofer tool and data being collected. We sent them theprior paper on Spoofer and an example of the data being collected. One user proceededto test the tool, while the other one did not respond. The breakdown of the rest of themessages received is summarized in Table 2.3.
The majority of comments were about the screening process. Potential workers wantedto know if they would be allowed to run the test in the future and also showed their in-terest in conducting our study. A few workers demanded to be paid for reading the inel-igibility message.
Some workers requested additional help for installing the software. We improved thedescription of our task based on the feedback we received. A few workers were still un-able to run the application, which was mostly due to an incompatible operating system,old hardware, or firewall preventing the installation. We compensated them for theirtime and effort.
We also received a few messages where workers, after successfully running Spoofer,were not able to upload the results due to some temporary failure of crowdsourcingplatform or our server. After verifying their test, we manually entered the result in ourdatabase and paid them for the task.
Finally, there were some workers who requested early acceptance of their submis-sions. We changed our payment process from one time per week to every three days forsuccessful submissions.
2.5.6. FOLLOW UP TESTS
The task description included instructions on how to un-install the Spoofer tool aftersubmitting the unique result identifier. Still, the Spoofer project received at least one ormore follow-up tests from 433 of the 1519 (28.5%) IP addresses that the workers tested.

2
202. USING CROWDSOURCING MARKETPLACES FOR NETWORK MEASUREMENTS: THE CASE
OF SPOOFER
Classification MTurk ProA TotalScreening 32 118 150Unclear instruction 5 22 27Application error 0 32 32Platform error 4 68 72Request early payment 9 20 29Total 50 260 310
Table 2.3: Interaction with workers from the ProA and MTurk platforms. Despite having similar numbers ofpotential workers (Table 2.4) we had much more interaction with ProA workers, particularly on screening.
2.6. EVALUATION OF DESIGN
Our infrastructure met the requirements outlined in section 2.5.2. However, we did en-counter several complications along the way, all related to worker behavior.
First, crowdsourcing platforms are designed for screening human subjects, not van-tage points. In other words, the platforms offer screening in terms of subject demo-graphics. We had to implement our own automated screening mechanisms, the resultof which then had to be returned to the platform in a platform-specific way for handlingtask selection and completion. This limitation caused problems on ProA in particular,as the platform allowed participants to mark the task as complete, even if we screenedthem as not eligible. We ended up with a large number of users who submitted invalidcompleted tasks. We could have rejected their entries, but cancelling would result innegative scores for these workers. We discussed this issue with ProA staff and ProA can-celled these submissions.
A second issue is that some participants behaved strategically. Some workers on ProAignored instructions, seemingly consciously, and reported a task as complete, perhaps tosee if they would get paid anyway. Due to our requirement that the worker submits a URLwith a unique session key that only they can know upon completion of the test, theseworkers were easily detected. Some workers who were not eligible also sent complaints,arguing that they should be compensated for reading the message that they were noteligible. Interestingly, complaints increased with the higher price of campaign 2. Someworkers also complained directly to the platform operator, which led MTurk to suspendone campaign. The automated message cited a violation of their terms of use by col-lecting Personally Identifiable Information (PII). We think this is because the complaintform on MTurk only offered two options: report a broken task or a privacy violation. Inresponse, campaign 3 tested the compensation model of small payout plus larger bonus,which prevented further complaints.
The final complication is that we could not clearly identify why certain eligible par-ticipants did not complete the test. There could be a number of reasons. First, the priceof the job might be too low for some workers. Second, they might not like running exe-cutables. Third, some workers were using mobile devices for which there is no Spooferclient. Fourth, language barriers may have discouraged some workers. Further researchis required on how to improve task uptake.

2.7. ANALYSIS OF PLATFORMS
2
21
Figure 2.3: Location of workers which completed the task. The majority were located in the US and India.
MTurk ProA RW JB MJCC Number CC Number CC Number CC Number CC NumberUS 4226 (49.7%) GB 3615 (47.0%) IN 719 (40.6% ) BD 634 (65.1% ) BD 67 (20.4%)IN 2925 (34.4%) US 2238 (29.1%) BD 495 (28.0%) US 80 (8.2%) IN 53(16.2%)VE 110 (1.3% ) PT 231 (3.0%) US 133 (7.5%) IN 40 (4.1%) MA 37 (11.3%)CA 102 (1.2%) CA 194 (2.5%) NP 86 (4.9%) NP 26 (2.7%) US 29(8.9%)GB 78 (0.9%) IT 177 (2.3%) LK 29 (1.6%) EG 12 (1.2%) DZ 14(4.3%)
Other 1161 (13.7%) Other 1231(16.01%) Other 307(17.35%) Other 182(18.7%) Other 127(38.9%)Total 8500 (100%) Total 7686(100%) Total 1769(100%) Total 974(100%) Total 327(100%)
Table 2.4: Number of potential workers interested in performing the study by country code. We report thetop 5. US: United States, IN: India, VE: Venezuela, CA: Canada, GB: Great Britain, PT: Portugal, IT: Italy, BD:Bangladesh, NP: Nepal, LK: Sri Lanka, EG: Egypt, MA: Morocco, DZ: Algeria.
2.7. ANALYSIS OF PLATFORMSCoverage of platforms. Our website was visited from 1,978 unique ASes in 142 countries.Even though there is a diversity of networks and countries, we observed that 10 ASes ofall potential workers account for 90% of the unique IP addresses. This highlights theneed for screening of workers to obtain an effective distribution of vantage points acrossnetworks.
Table 2.4 shows the distribution of potential workers for the largest five countriesper platform, by unique IP address. The majority of potential workers for MTurk werebased in US (49.7%) and India (34.4%), whereas 47% and 29.1% of potential workers inProA were from UK and US, respectively. RapidWorkers, Jobboy, and Minijobz were moredominant in Bangladesh, India and US.
In terms of the added value of each platform, 29 countries were unique to MTurk,five to only ProA, another five to RapidWorkers, two to Minijobz, and one to Jobboy.
Furthermore, the overlap of ASes between platforms from which workers were in-terested in completing the task was significant. In the case of smaller platforms (Job-boy, Rapidworkers and Minijobz) the overlap was 75%, 77% and 85%, respectively, whencompared to all ASes from which workers visited our website. It was 42% for MTurk and46% for ProA. However, the overlap in terms of unique /24 networks is relatively small,indicating the significance of choosing prefixes that can be tested by adding multipleplatforms. Table 2.7 illustrates pairwise crowdsourcing platform intersections as a ma-trix, with unique /24 networks from which workers were interested in completing the

2
222. USING CROWDSOURCING MARKETPLACES FOR NETWORK MEASUREMENTS: THE CASE
OF SPOOFER
Platform Tests ASes Countries
MTurk 424 (27.9%) 255 51ProA 806 (53.1%) 423 69RW 165 (10.9%) 134 36JB 92 (6.1%) 85 24MJ 32 (2.1%) 24 18
Total(Unique) 1519 784 91
Table 2.5: Distribution of workers which completed the Spoofer task. The majority of tasks were completed onthe ProA platform.
OS Crowdsourced Volunteer
Linux 1.2 % (0.14) 8.1%MacOS 10.6% (0.52) 20.4%Windows 88.2% (1.24) 71.1%
Table 2.6: Spoofer client OSes of crowdsourced workers compared to volunteers. The portion of MacOS andLinux users in the crowdsourced population is much less than the volunteer (0.52 and 0.14) population.
task. The rightmost column indicates the percentage and absolute number of /24 net-works that the platform has in common with all other platforms combined. In the caseof ProA we find only 3% of such /24 networks, while it was only 6% for MTurk whencompared to all other platforms.
Fluctuations over time. Figure 2.2 shows the number of new potential workers perday for MTurk stabilized after the initial peak. The number of potential workers fromRapidWorkers fluctuates over different days of the week. The number of potential work-ers increases for Jobboy over time while the pool decreases for ProA.
Completion per platform. Since our design accepts one observation per addressblock, only 38% of potential workers were eligible to complete the task. Figure 2.3 showsthe countries of the workers who completed the task and ran the Spoofer tool; while wehave submissions from 91 countries, the majority of submissions are from US and India.
Table 2.5 shows the tests contributed by each platform from respective ASes andcountries. The three smaller platforms (RapidWorkers, Minijobz, and Jobboy) added re-sults from 7 countries which were absent from the results from MTurk and ProA. MTurkand ProA added measurements from 12 and 14 countries absent from other platforms,respectively.
Table 2.6 shows the OS distribution of participants of the study along with overallusers of spoofer tool. Crowdsourcing platform users seem to be closer to global OS mar-ket share statcounter when compared to volunteer spoofer users.
2.8. CONTRIBUTIONS TO SPOOFERWhat is the added value of the crowdsourcing marketplaces compared to the volunteerpool of Spoofer? Within the study period, we collected data from 1,519 vantage points.
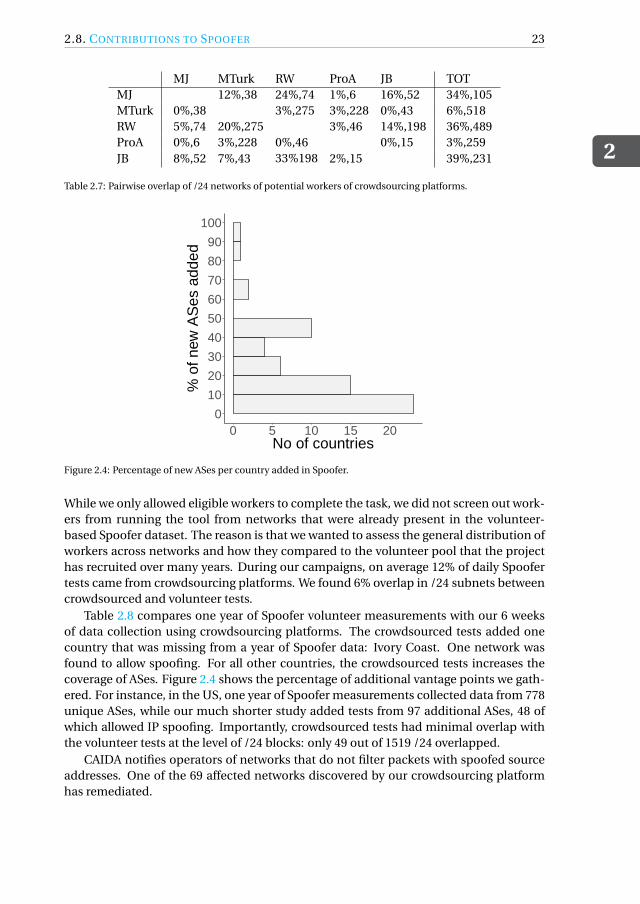
2.8. CONTRIBUTIONS TO SPOOFER
2
23
MJ MTurk RW ProA JB TOTMJ 12%,38 24%,74 1%,6 16%,52 34%,105MTurk 0%,38 3%,275 3%,228 0%,43 6%,518RW 5%,74 20%,275 3%,46 14%,198 36%,489ProA 0%,6 3%,228 0%,46 0%,15 3%,259JB 8%,52 7%,43 33%198 2%,15 39%,231
Table 2.7: Pairwise overlap of /24 networks of potential workers of crowdsourcing platforms.
0
10
20
30
40
50
60
70
80
90
100
0 5 10 15 20No of countries
% o
f new
AS
es a
dded
Figure 2.4: Percentage of new ASes per country added in Spoofer.
While we only allowed eligible workers to complete the task, we did not screen out work-ers from running the tool from networks that were already present in the volunteer-based Spoofer dataset. The reason is that we wanted to assess the general distribution ofworkers across networks and how they compared to the volunteer pool that the projecthas recruited over many years. During our campaigns, on average 12% of daily Spoofertests came from crowdsourcing platforms. We found 6% overlap in /24 subnets betweencrowdsourced and volunteer tests.
Table 2.8 compares one year of Spoofer volunteer measurements with our 6 weeksof data collection using crowdsourcing platforms. The crowdsourced tests added onecountry that was missing from a year of Spoofer data: Ivory Coast. One network wasfound to allow spoofing. For all other countries, the crowdsourced tests increases thecoverage of ASes. Figure 2.4 shows the percentage of additional vantage points we gath-ered. For instance, in the US, one year of Spoofer measurements collected data from 778unique ASes, while our much shorter study added tests from 97 additional ASes, 48 ofwhich allowed IP spoofing. Importantly, crowdsourced tests had minimal overlap withthe volunteer tests at the level of /24 blocks: only 49 out of 1519 /24 overlapped.
CAIDA notifies operators of networks that do not filter packets with spoofed sourceaddresses. One of the 69 affected networks discovered by our crowdsourcing platformhas remediated.

2
242. USING CROWDSOURCING MARKETPLACES FOR NETWORK MEASUREMENTS: THE CASE
OF SPOOFER
Mar (2016,-2017)Spoofer Tool
(25 Mar-4 May 2017)CS Platform
UniqueCS Platform
Total Spoofable Total Spoofable Total SpoofableCountries 143 - 91 - 1 -
ASes 2,237 294 784 66 342 48/24 blocks 13,081 583 1519 69 1470 69
Table 2.8: Comparison of spoofer vantage points with crowdsourcing platforms.
2.9. CONCLUSIONWe have presented the first systematic study to deploy multiple crowdsourcing market-places to acquire vantage points for Internet measurements. We designed and tested aninfrastructure that was able to control the distribution of vantage points. We provide thecode of our infrastructure [28].
Using CAIDA’s Spoofer tool as a case study, we found that with a limited budget of2,000 euro, we were able to acquire vantage points in 91 countries and 784 ASNs, 342 ofwhich did not have a vantage point in the 12 months before our study. The measure-ments are, in spoofability, qualitatively similar to volunteer-based measurements andthey do not introduce additional bias. We find evidence that measurement tasks arequite price sensitive and that higher compensation is likely to recruit even more vantagepoints.
Crowdsourcing marketplaces provide a realistic and valuable option for recruitingvantage points for Internet measurements. Whether it is the right option for a specificproject, depends on several considerations. First, commercially crowdsourced vantagepoints are relatively costly, especially for longer-term studies. Prolific and Amazon doallow giving bonuses based on worker ID’s. If longitudinal measurements are required,workers can be compensated with smaller bonuses per week or month to keep the toolrunning. Second, if a study seeks a specific set of vantage points outside of its currentcoverage, then accurately screening workers can make crowdsourcing quite cost effec-tive – almost offering a ’no cure, no pay’ approach. Third, one could also see crowd-sourcing as a way to acquire ground truth data for researchers to validate conclusionsbased on other, cheaper network measurements. Fourth, and final, there seems to be apotential to retain some of the workers as volunteers. Within our study, we found thatover one in four workers kept the tool running and submitted unpaid follow-up tests.A project can motivate workers to contribute. For example, the GalaxyZoo project hadgreat success, where 150,000 people participated in a year because they enjoyed the taskand they wanted to help advance astronomy.
While crowdsourcing vantage points cost money, important policy efforts, such asthe adoption of SAV, should not be wholly dependent on volunteers. Being able to com-pensate participants in an easy and scalable way is a valuable option to improve ourvisibility into issues in security, privacy, censorship, and other areas, and designers ofmeasurement systems should consider including built-in payment mechanisms.

3USING LOOPS OBSERVED IN
TRACEROUTE TO INFER ABILITY TO
SPOOF
Despite source IP address spoofing being a known vulnerability for at least 25 years,and despite many efforts to shed light on the problem, spoofing remains a popular at-tack method for redirection, amplification, and anonymity. To defeat these attacks re-quires operators to ensure their networks filter packets with spoofed source IP addresses,known as source address validation (SAV), best deployed at the edge of the networkwhere traffic originates. In this dissertation, we present a new method using routingloops appearing in traceroute data to infer inadequate SAV at the transit provider edge,where a provider does not filter traffic that should not have come from the customer.Our method does not require a vantage point within the customer network. We presentand validate an algorithm that identifies at Internet scale which loops imply a lack ofingress filtering by providers. We found 703 provider ASes that do not implement ingressfiltering on at least one of their links for 1,780 customer ASes. Most of these observationsare unique compared to the existing methods of the Spoofer and Open Resolver projects.By increasing the visibility of the networks that allow spoofing, we aim to strengthen theincentives for the adoption of SAV.
3.1. INTRODUCTIONDespite source IP address spoofing being a known vulnerability for at least 25 years [58],and despite many efforts to shed light on the problem (e.g. [59]–[61]), spoofing remainsa viable attack method for redirection, amplification, and anonymity, as evidenced inFebruary 2014 during a 400 Gbps DDoS attack against Cloudfare [62]. That particularattack used an amplification vector in some implementations of NTP [62]; a previousattack against Spamhaus [26] in March 2013 achieved 300+ Gbps using an amplificationvector in DNS. While some application-layer patches can mitigate these attacks [63], at-tackers continuously search for new vectors.
25

3
26 3. USING LOOPS OBSERVED IN TRACEROUTE TO INFER ABILITY TO SPOOF
Defeating amplification attacks, and other threats based on IP spoofing, requiresproviders to filter incoming packets with spoofed source IP addresses [8] – in other words,to implement BCP 38, a Best Current Practice also known as source address validation(SAV). SAV suffers from misaligned incentives: a network that adopts SAV incurs the costof deployment, while the security benefits diffuse to all other networks. That being said,SAV is a widely supported norm in the community. Increasing the visibility of whichnetworks have or have not adopted SAV reduces the incentive problem by leveragingreputation effects and the pressure of other providers and stakeholders. These factorsput a premium on our ability to measure SAV adoption.
In this dissertation, we report on the efficacy of a new measurement technique thatis based on an idea of Jared Mauch. It allows an external observer to use traceroute toinfer the absence of filtering by a provider AS at a provider-customer interconnect. Thisstudy makes the following five contributions: (1) We show that it is generally feasible forproviders to deploy static ingress ACLs, as their customers rarely change address space.(2) We describe a scalable algorithm for accurately inferring the absence of ingress filter-ing from specific patterns in traceroute data. (3) We validate the algorithm’s correctnessusing ground truth from 7 network operators. (4) We demonstrate the utility of the al-gorithm by analyzing Internet-scale inferences we made. (5) We build a public websiteshowing the provider-customer edges that we inferred to imply the absence of filtering,combined with actionable data that operators can use to deploy filtering.
3.2. BACKGROUND ON INGRESS FILTERING
The canonical documents describing the use of ingress filtering methods for SAV areRFCs 2827 [8] and 3704 [64], known in the network operations and research communitiesas BCPs 38 and 84. BCP 38 describes the basic idea: the source address of packets shouldbe checked at the periphery of the Internet against a set of permitted addresses. For anaccess network, this check could be at the point of interconnection with a single cus-tomer; for an enterprise, this could be on their edge routers to their neighbors; and fora transit provider, this could be on the provider-edge router where a customer connects.For single-homed customers, a transit provider can discard packets that have a sourceaddress outside the set of prefixes the customer announces to the transit provider, usingStrict or Feasible Reverse Path Forwarding (RPF). A router using Strict RPF will drop apacket if it arrived on a different interface than the router would choose when forward-ing a packet to the packet’s source address; a router using Feasible RPF will consider allpaths it could use to reach the source address, not just the best path.
BCP 84 discusses challenges in deploying ingress filtering on multi-homed networks.Both Strict and Feasible RPF are not always feasible if a customer is multi-homed anddoes not announce all of its prefixes to each neighbor router, as it might do for trafficengineering purposes. Instead, an operator might define a set of prefixes covering sourceaddresses in packets the router will forward, known as an Ingress Access List, or IngressACL. BCP 84 states that while ingress ACLs require manual maintenance if a neighboracquires additional address space, they are “the most bulletproof solution when doneproperly”, and the “best fit ... when the configuration is not too dynamic, .. if the numberof used prefixes is low.”

3.3. RELATED WORK
3
27
Jan’08
Jan’10
Jan’12
Jan’14
Jan’16
Fra
cti
on o
f A
Ses
0
5
10
15
20
25IPv6
30
Jan’98
Jan’00
Jan’02
Jan’04
Jan’06
IPv4
Figure 3.1: Fraction of ASes whose prefix announcements changed month-to-month.
3.3. RELATED WORKTesting a network’s SAV compliance requires a measurement vantage point inside (oradjacent to) the network, because the origin network of arbitrary spoofed packets can-not be determined [64]. The approach of the Spoofer project [59] is to allow volunteersto test their network’s SAV compliance with a custom client-server system, where theclient sends spoofed packets in coordination with the server, and the server infers thatthe client can spoof if the server receives these spoofed packets. However, the Spooferproject requires volunteer support to run the client to obtain a view from a given net-work. In May 2016, CAIDA released an updated client [65] that operates in the back-ground, automatically testing attached networks once per week, and whenever the sys-tem attaches to a network it has not tested in the previous week. The number of prefixestested per month has increased from ≈ 400 in May 2016 to ≈ 6000 in December 2016 [65].
Jared Mauch deployed the first technique to infer if a network had inadequate SAVwithout requiring a custom client-server system. As a product of the Open ResolverProject [66], he observed DNS resolvers embedded in home routers forwarding DNSqueries from his system with I PX to other resolvers, without rewriting the source IP ad-dress of the packet. These other resolvers returned the subsequent answer directly toI PX , rather than to the DNS resolver in the home router as they should have.
We emphasize that these methods are complementary, and that no one technique isable to test deployment of SAV for all networks.
3.4. MOTIVATION OF INGRESS ACLSAs described in §3.2, the best place to deploy filtering is at the edge. However, not alledge networks have the technical ability or motivation to filter their own traffic. A tran-sit provider, however, is often managed by skilled network operators who may alreadydeploy defenses to prevent their customers from announcing inappropriate routes. Theprovider-customer interconnect for an edge network represents the other straightfor-ward place to deploy ingress filtering.
Figure 3.1 quantifies the dynamism of address space announced by stub ASes overtime. Using BGP data collected by Routeviews and RIPE RIS with the method describedin §3.5.1, we aggregated the prefixes each stub AS originated in BGP into the minimum
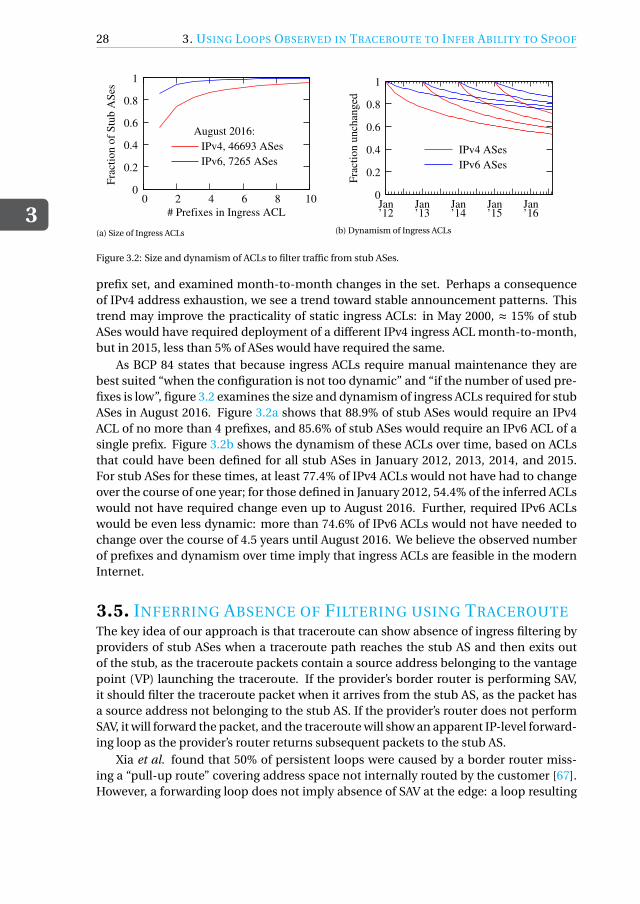
3
28 3. USING LOOPS OBSERVED IN TRACEROUTE TO INFER ABILITY TO SPOOF
August 2016:
0
0.4
0.6
0.8
1
0 2 4 6 8 10
# Prefixes in Ingress ACL
Fra
ctio
n o
f S
tub A
Ses
IPv6, 7265 ASes
IPv4, 46693 ASes
0.2
(a) Size of Ingress ACLs
IPv4 ASes
IPv6 ASes
0
0.6
0.8
1
Jan’12
Jan’13
Jan’14
Jan’15
Jan’16
Fra
ctio
n u
nch
anged
0.2
0.4
(b) Dynamism of Ingress ACLs
Figure 3.2: Size and dynamism of ACLs to filter traffic from stub ASes.
prefix set, and examined month-to-month changes in the set. Perhaps a consequenceof IPv4 address exhaustion, we see a trend toward stable announcement patterns. Thistrend may improve the practicality of static ingress ACLs: in May 2000, ≈ 15% of stubASes would have required deployment of a different IPv4 ingress ACL month-to-month,but in 2015, less than 5% of ASes would have required the same.
As BCP 84 states that because ingress ACLs require manual maintenance they arebest suited “when the configuration is not too dynamic” and “if the number of used pre-fixes is low”, figure 3.2 examines the size and dynamism of ingress ACLs required for stubASes in August 2016. Figure 3.2a shows that 88.9% of stub ASes would require an IPv4ACL of no more than 4 prefixes, and 85.6% of stub ASes would require an IPv6 ACL of asingle prefix. Figure 3.2b shows the dynamism of these ACLs over time, based on ACLsthat could have been defined for all stub ASes in January 2012, 2013, 2014, and 2015.For stub ASes for these times, at least 77.4% of IPv4 ACLs would not have had to changeover the course of one year; for those defined in January 2012, 54.4% of the inferred ACLswould not have required change even up to August 2016. Further, required IPv6 ACLswould be even less dynamic: more than 74.6% of IPv6 ACLs would not have needed tochange over the course of 4.5 years until August 2016. We believe the observed numberof prefixes and dynamism over time imply that ingress ACLs are feasible in the modernInternet.
3.5. INFERRING ABSENCE OF FILTERING USING TRACEROUTEThe key idea of our approach is that traceroute can show absence of ingress filtering byproviders of stub ASes when a traceroute path reaches the stub AS and then exits outof the stub, as the traceroute packets contain a source address belonging to the vantagepoint (VP) launching the traceroute. If the provider’s border router is performing SAV,it should filter the traceroute packet when it arrives from the stub AS, as the packet hasa source address not belonging to the stub AS. If the provider’s router does not performSAV, it will forward the packet, and the traceroute will show an apparent IP-level forward-ing loop as the provider’s router returns subsequent packets to the stub AS.
Xia et al. found that 50% of persistent loops were caused by a border router miss-ing a “pull-up route” covering address space not internally routed by the customer [67].However, a forwarding loop does not imply absence of SAV at the edge: a loop resulting

3.5. INFERRING ABSENCE OF FILTERING USING TRACEROUTE
3
29
from a transient misconfiguration or routing update can occur anywhere in the network.The key challenge in this work is inferring the provider-customer boundary in tracer-oute [68], [69]. In this chapter, we superimpose millions of traceroutes towards randomIP addresses in /24 prefixes to build a topology graph, and use a small set of heuristics toinfer provider-customer edges for stub ASes in the graph. §3.5.1 describes the Internettopology datasets that we used, and §3.5.3 describes the algorithm we used to filter theloops that imply the absence of ingress filtering by the provider – in other words, the lackof compliance with BCP 38.
3.5.1. INPUT DATA
CAIDA IPv4 routed /24 topology datasets: We used CAIDA’s ongoing traceroute mea-surements towards every routed /24 prefix in the Internet. CAIDA’s probing of all routed/24s is especially useful here, as the goal is to find unrouted space that can result in a for-warding loop. CAIDA’s traceroute data is collected with scamper [70] using Paris tracer-oute which avoids spurious loops by keeping the ICMP checksum value the same forany given traceroute [71]. As of August 2016, CAIDA probes every routed /24 using 138Vantage Points (VPs) organized into three teams; each team probes the address spaceindependently. Each team takes roughly 1.5 days to probe every routed /24.
CAIDA IPv4 AS relationships: We used CAIDA’s ongoing BGP-based AS relationship in-ferences [72] to identify customer-provider interconnections in traceroute paths. Therelationship files were inferred by CAIDA using public BGP data collected by Routeviewsand RIPE RIS, using RIB files recorded on the 1-5 of each month. We also used the sameBGP data to identify the origin AS announcing each prefix measured with traceroute.
CAIDA Sibling Inferences: We used CAIDA’s ongoing WHOIS-based AS-to-organizationinference file [73] to identify ASes that belong to the same underlying organization (aresiblings). The sibling files were inferred by CAIDA using textual analysis on WHOISdatabases obtained from Regional Internet Registries (RIRs) at 3-month intervals. Weused sibling inferences to avoid mis-classifying a loop that occurs within a single orga-nization using multiple ASes as one that occurs between distinct provider and customerASes.
3.5.2. CONSTRUCTION OF TOPOLOGY
Our first goal is to correctly identify the provider-customer boundaries towards stub ASeswith high precision. Because the customer usually uses address space provided by theprovider to number their interface on their router involved in the interconnection, thecustomer-edge router usually appears in traceroute using an IP address routed by theprovider. Therefore, one of our goals is to accurately identify customer routers usingprovider address space without incorrectly inferring that a provider’s backbone routerbelongs to a customer.
We assemble all traceroutes collected for a single cycle by a single team that do notcontain loops, and label each interface with (1) the origin AS of the longest matchingprefix for the interface address, and (2) the set of destination ASes the interface addressis in the path towards. If an address is in the path towards multiple ASes, the addresscould not be configured on a customer router of a stub AS.

3
30 3. USING LOOPS OBSERVED IN TRACEROUTE TO INFER ABILITY TO SPOOF
a4
a1
R1
R3
AS A AS B
a2
a3
a5
R2
path to B
2 3
4
51
AS C
R5
c1
c2
Traceroute to prefix announced by B
not routed by B: a1
a3
a5
a4
a5
R3
configured with default
route via a4
on R2
R4
b1
b2
R6
d1
d2
AS D
Figure 3.3: A simple loop between AS A and its customer B implying absence of filtering by A at R2. R2 shoulddiscard packet 4 because it arrives with a source address outside of B’s network, rather than send it back to B(5).
3.5.3. ALGORITHM TO INFER ABSENCE OF INGRESS FILTERING FROM LOOPS
Our algorithm considers two different ways a traceroute path may enter a stub AS andexit through a provider AS: (1) a simple point-to-point loop between a single provider-edge router and a single customer-edge router, (2) a loop from a customer-edge routerthat exits using a different provider.
Simple point-to-point loops: Figure 3.3 illustrates the first case, where R3 is a customer-edge router belonging to AS B configured with a default route via R2. If the operator ofB announces address space in BGP but does not have an internal route for a portion ofthat address space, and does not have a “pull-up route” covering the unused portion onR3, then R3 forwards the packet back to R2 using the default route [67]. R2 will then for-ward the packet back to R3, the loop sequence will likely be a5 (customer-edge router),a4 (provider-edge router), and a5 (customer-edge router), with a4 and a5 assigned fromthe same IPv4 /30 or /31 prefix the routers use to form the point-to-point link. There-fore, our criteria are: (1) that the addresses in the loop are assigned from a single /30 or/31 prefix, (2) that the AS originating the longest matching prefix is an inferred providerof the stub AS and not a sibling of the stub AS, (3) that the assumed customer routeronly appears in traceroute paths towards the stub AS, (4) that there is at least one otheraddress originated by the provider in the traceroute path towards the stub. Criteria #3avoids incorrectly inferring a provider-operated router as a customer-edge router whena loop occurs before the stub AS (e.g. a1 a3 a2 a3) as a3 appears in traceroute paths to-wards both B and C. Criteria #4 avoids incorrectly inferring which router in a traceroutepath is the customer-edge router when the customer-edge router is multi-homed andthe traceroute path enters via a second provider AS D (e.g., d2 a4 a5 a4).
Two-provider loops: Figure 3.4 illustrates the second case, where R3 and R4 arecustomer-edge routers belonging to AS B, with default routes configured on R3 and R4.The underlying routing configuration issues are the same as a point-to-point loop, ex-cept the default route is via a different AS than the AS the traceroute entered the net-work. Figure 3.4 shows the traceroute visiting two routers operated by AS B; however, itis possible that the traceroute will never contain an IP address mapped to B, depending

3.5. INFERRING ABSENCE OF FILTERING USING TRACEROUTE
3
31
a4
a1
R1
R3
AS A
AS B
a2
a3
a5
R2
2 3
4
5
1
Possible traceroutes to prefixes
announced by B not routed by B
R3
configured with default
R4
b1
b2
c4
c1
R6
AS C
c2
c3
R5
6
7
route via b2 on R
4
8
c5
c6
R4 configured with defaultroute via c
2 on R
5
a1
a3
a5
b2 c
2 c4
c6
a3
a1
a3
b1
b2
c2
c4
c6
a3
a1
a3
a5
c1
c2
c4
c6
a3
a
b
c
Figure 3.4: A two-provider loop between ASes A and C and their customer B implying absence of filtering by Cat R5. R5 should discard packet 5 because it arrives with a source address outside of B, rather than forward thepacket to R6.
on how many routers in B the traceroute visits, and how the routers respond to tracer-oute probes. Therefore, our criteria are: (1) that the assumed customer router where thetraceroute exits appears only in paths towards the stub AS, (2) that both the ingress andegress AS in the traceroute path are inferred providers of the stub AS and not a siblingof the stub AS, (3) that there is no unresponsive traceroute hop in the traceroute pathwhere a customer router could be located, (4) that at least two consecutive IP addressesmapped to the same egress AS appear in the loop. Criteria #2 does not require differentprovider ASes: if the stub AS is multi-homed to the same provider with different routers,our method will still infer an absence of filtering. Criteria #3 ensures that we do not mis-infer where the customer router is located in the path, and thus incorrectly infer the ASthat has not deployed ingress filtering. Finally, criteria #4 reduces the chance that a loopinside the customer network is mis-classified as crossing into a provider network if thecustomer router responds with a third-party IP address.
3.5.4. FINDING NEEDLES IN A HAYSTACK
As discussed in §3.5.1, CAIDA uses three teams of Ark VPs to probe a random addressin every routed /24 prefix. In this section, we report on the characteristics of cycle 4947conducted by team 3. The characteristics of data conducted by other teams and for othercycles is quantitatively similar. In total, cycle 4947 contains 10,711,132 traceroutes, and163,916 (1.5%) of these contain a loop. 105,685 (64.5%) of the traceroutes with loops werenot towards a stub network.
Of the remaining 58,231 traceroutes with loops towards stub ASes, we inferred 31,023(53.3%) had a loop within the stub network, i.e. the addresses in the loop were an-nounced in BGP by the stub, or involved the customer-edge router. A further 11,352traceroutes (19.5%) contained a loop with an unresponsive IP address, and 1,373 tracer-outes (2.4%) contained an unrouted IP address that prevented us from inferring if theloop occurred at a provider-customer interconnect. 610 traceroutes (1.0%) had a loopthat we disqualified as occurring at a customer-provider boundary, as the loop occurredat a router that also appeared in paths towards multiple destination ASes, and 494 tracer-outes (0.8%) contained an IP address that could have been a third party address on a cus-tomer router, rather than a router operated by a provider. In total, only 2,530 traceroutes

3
32 3. USING LOOPS OBSERVED IN TRACEROUTE TO INFER ABILITY TO SPOOF
with loops (4.3%) contained simple point-to-point loops, and only 93 (0.2%) containedmore complex two-provider loops.
3.5.5. PERSISTENCE OF LOOPS
Given that we are looking for needles in haystacks, how reliably can we find them? Ide-ally, we would be able to consistently reproduce the loops that imply absence of ingressfiltering, and discard observations caused by transient events. Unfortunately, there iscurrently no straightforward way of doing so.
The data we used was collected by CAIDA using traceroutes conducted by a dis-tributed set of VPs towards a random IP address in each routed /24 prefix. This approachadds efficiency by reducing the number of probes, at the cost of potentially missing loopsthat occur for smaller prefixes. It also means that when such a loop is in fact discovered,the next probe might miss it again by selecting a random address outside the smaller pre-fix. In other words, the traceroute data itself does not tell us much about the persistenceof loops.
To better understand the impact of random address selection and the persistence ofloops, we collected traceroutes towards the same addresses that revealed the loops. Wefirst applied the algorithm outlined in §3.5.3 to the traceroute data for August 2016 andfound 2,500 unique loops between 703 provider and 1,780 customer ASes. In October2016, we collected traceroutes towards the same IP addresses that revealed the loops,using two different vantage points. We were able to reproduce 1,240 of the loops between461 provider and 1,026 customer ASes. Next, we repeated this procedure for over a yearof traceroute data: August 2015-August 2016. We found 7,784 unique loops between1,286 provider and 3,993 customer ASes. In October 2016, we were able to reproduce1,542 unique loops between 505 provider and 1,176 customer ASes. In other words, theadditional data identified 342 loops that persisted.
A significant portion of all loops could not be reproduced and the longer the time lag,the higher the odds of failure, for four reasons. First, the loop might have been transient,i.e., it only occurred during routing protocol convergence [74] or temporary misconfig-uration [67]. Second, it might depend on the vantage point of the probe, e.g., because ofmulti-homed routers. Third, the provider might have fixed the routing issue that causedthe loop. Fourth, and most relevant, the provider has implemented ingress filtering.
Future work is needed to untangle these causes. We know from our validation effort(§3.6) that even loops that appeared only once can correctly signal absence of ingressfiltering. Some of the loops that we could not reproduce had already been validated bythe provider as true positives. In the remainder of the chapter, we will work with the fullset of loops as identified by our algorithm.
3.6. VALIDATION BY NETWORK PROVIDERSIn order to validate our results and obtain ground truth, we contacted providers in tworounds: September 2015 and September 2016. We got feedback from one hosting provider,four ISPs, two national research and education networks, and two Tier 1 networks. Wecontacted some providers only in one round, some in both, depending on whether weinferred absence of ingress filtering for links involving their network at both times, and

3.7. RESULTS
3
33
our ability to reach the right specialist in the organization. We gave all providers a formalassurance that their names would not be included in the study.
Feedback from the providers during the first round resulted in improvements in ourmethodology. We applied the final methodology to both the August 2015 and August2016 data. We then compared the final results to the feedback that we received from theproviders in both rounds. We talked to 6 providers in round 1 and 7 in round 2, and 4providers participated in both rounds.
We defined a result as a true positive if we identified a provider-to-customer linkwhere the provider does not perform ingress filtering and an operator at the providerconfirms this. That is, we correctly inferred the absence of SAV as well as the boundarybetween provider and customer. A false positive occurred when we either incorrectlydetected the boundary or the provider is actually performing SAV at the boundary. Ourmethodology correctly identified the absence of ingress filtering on the provider bound-ary in 95 out of 97 IP links between provider and customer ASes (45 of 47 links in round1, and 50 of 50 links in round 2).
The two false positives had different causes. One of them occurred because of routeaggregation. Providers perform route aggregation by consolidating multiple routes in asingle, more general route. This practice can lead to problems with our border routerdetection. Imagine this scenario: a provider is assigned a /16 prefix X by the RegionalInternet Registry (RIR). The provider allocates a /24 subnet Y from prefix X to a customer,and the customer assigns addresses from Y to its routers. The customer also has its ownprefix Z allocated by an RIR. If the provider aggregates Y into a single /16 advertisementfor X, we would infer that customer routers with addresses in Y belong to the provider AS.Our methodology would then categorize a loop between provider prefix X and customerprefix Z as signaling the absence of SAV, when the loop was actually within the customernetwork.
For the second false positive, the provider informed us that the traceroute data sug-gested that the loop had occurred inside their network rather than on the boundary.However, they could not reproduce it anymore and blamed it on a transient event. Notethat in the second round, we found 2 loops for the same provider and they were bothtrue positives.
One additional piece of feedback that we received was that some of the providers,while confirming the validity of our inference that they were not doing ingress filter-ing on their boundary, objected to the implication that they should be filtering. Theysaw their services as offering transit and contracted them as such, which meant no fil-tering on the provider’s side. In the view of these providers, the downstream customerAS should perform SAV at their border router. The customer ASes were business entitieslike ISPs, hosting providers or large enterprises. Evaluating whether this interpretation ofBCP 38 [8] is merited falls outside the scope of this dissertation and is for the communityto address. For this dissertation, the key point is that the proposed method performedaccurately.
3.7. RESULTSWe first summarize the results in terms of the number of networks that do not imple-ment SAV. We then compare our method to the two alternatives: the Spoofer and the

3
34 3. USING LOOPS OBSERVED IN TRACEROUTE TO INFER ABILITY TO SPOOF
Open Resolver projects. Like those methods, our approach only observes a subset of thenetworks without SAV. In the absence of loops, we cannot tell anything about the pres-ence of ingress filtering.
Using one month of CAIDA’s traceroute data from August 2016, our approach iden-tified 2,500 unique loops involving 703 provider ASes as lacking SAV on one or more oftheir customer-facing links and 1,780 customer ASes. These represent approximately1.3% and 3.2% of all advertised ASes, respectively. Moreover, when compared to alladvertised stub ASes and their providers [72], we found 9.0% of provider ASes withoutingress filtering involving 3.8% of all stub ASes.
As discussed in §3.6, some providers argued that customer ASes should be respon-sible for SAV within their networks or at their borders. However, we found that about63% of the involved customer ASes advertise /20 or smaller prefix lengths. It is unlikelythat such small entities have the resources and incentives to implement SAV in their net-works. On the other hand, such small prefixes should allow the providers to implementstatic ACLs.
We now compare our results to the data from the Spoofer and Open Resolver projects(see §3.3 for details). Our method only detects the lack of ingress filtering for providernetworks, which means that their customer ASes might be able to spoof. We comparedthose customer ASes with the Spoofer data from February to August 2016 [65]. Of 54overlapping ASes, 38 of the Spoofer tests were only conducted from behind a NetworkAddress Translation (NAT) device that likely prevented spoofing. Of the systems not be-hind a NAT, 10 of the 16 stub ASes allowed spoofing, i.e., more than half of these ASeshad not deployed SAV, suggesting the provider’s expectation for their customers to de-ploy filtering is not being met, and supporting the case for transit providers to filter theircustomers. This means that the connected provider ASes do not implement ingress fil-tering, which is consistent with our results. Packets with spoofed source addresses fromSpoofer tests in the 6 remaining customer ASes were not received, suggesting that fil-tering took place in the customer AS. The overlap between both methods contains onlya small sample, but it does indicate that the majority of the overlapping customer net-works were not doing SAV – a finding that reinforces the point that providers should notexpect their customer ASes to be willing and able do SAV, even if they are not that small.
Kührer et al. used the Open Resolver data in 2014 by to identify 2,692 unique ASesfrom within which spoofing was possible [12]. Following the same approach, we ana-lyzed the August 2016 data from the Open Resolver project, generously provided to us byJared Mauch, and found a total of 3,015 unique ASes that were able to spoof. We com-pared these to the customer ASes that our method identified as allowing spoofing – i.e.,those connected to the providers which lack ingress filtering. We found only a modestoverlap: 244 ASes.
In sum: these findings show that our method can add unique data points to bothexisting methods, and improve visibility of networks lacking SAV. In terms of the volumeof observations, it resides between Spoofer and Open Resolver. The three methods arecomplementary and provide views into the problem, contributing to improved overallvisibility of SAV adoption.

3.8. CONCLUSION
3
35
3.8. CONCLUSIONIn this chapter we implemented and validated an algorithm that uses traceroute data toinfer a lack of SAV between a stub and provider network. We inferred 703 providers thatdo not implement ingress filtering on at least one of their links facing 1,780 customerASes. We also built a public website showing the provider-customer edges that we in-ferred as lacking ingress filtering: https://spoofer.caida.org/. Providers can usethe data to deploy filtering, which would not only stop attackers from sending packetswith spoofed addresses from the customer’s network, but also block attempts to attackthe provider-customer link by sending packets to addresses that enter the forwardingloop [67].
To improve the reliability of the method, future work is needed on border detectionand on untangling the different factors that prevent loops from being reproduced, toseparate the implementation of ingress filtering from the other causes. A completelydifferent direction for future work is to experimentally test the strength of reputationeffects among providers and network operators. The networks that allow spoofing couldbe made public in varying ways, to see which mechanism best incentivizes providersinto taking action.
For the community of network operators, the results support efforts such as the Rout-ing Resilience Manifesto [75] and other community initiatives to improve network secu-rity. By complementing the Spoofer and Open Resolver data, our method increases visi-bility into the adoption of SAV. Public visibility of spoofing-enabled networks is a criticalstep in incentivizing providers to deploy ingress filtering in their networks. The datasetis also useful for the national CERTs who want to push BCP 38 compliance in their coun-tries. The problems caused by IP spoofing have been recognized for years [58], and thetask to reduce its role in attacks is becoming increasingly urgent.


4SAVING THE INTERNET:
EXPLAINING THE ADOPTION OF
SOURCE ADDRESS VALIDATION BY
INTERNET SERVICE PROVIDERS
Spoofed Internet traffic is used by miscreants, most visibly for amplification DDoS at-tacks. Source Address Validation (SAV) by network operators is a security best practiceto stop spoofed traffic from leaving their network. Its adoption is hampered by incentivemisalignment: the cost is borne by the operator, while the benefits go to the rest of theInternet. This chapter estimates the impact of various incentives on SAV adoption. Itis the first study that combines two independent datasets with observations for the ab-sence of SAV and that statistically models its causal drivers. We map these observationsto a population of 334 ISPs that control the bulk of the market share for Internet accessin 61 countries. We find evidence for the absence of SAV for certain prefixes of 250 ISPs.Next, we try to explain what portion of an ISP’s address space allows spoofing from fourcausal factors – network complexity, security effort, ISP characteristics and institutionalenvironment – as measured via 12 indicators. We find evidence larger ISPs have a higherproportion of non-compliant IP space. ISP security efforts, most notably the adoptionof RPKI and the number of amplifiers, are positively related to SAV. Subscription pricesand ISP revenue have no significant impact. Finally, we find that ISPs in countries withmore developed ICT infrastructures are also more likely to have a wider adoption of SAV.We reflect on these findings and discuss potential ways forward for SAV
4.1. INTRODUCTIONSpoofed Internet traffic—crudely put, IP packets with forged source IP addresses—hasbeen a persistent security problem for decades. Used in a variety of attacker practices, its
37

4
384. SAVING THE INTERNET: EXPLAINING THE ADOPTION OF SOURCE ADDRESS
VALIDATION BY INTERNET SERVICE PROVIDERS
most visible consequence has been the problem of Distributed Denial-of-Service (DDoS)attacks based on amplification. This has led Internet Hall of Fame technologist Paul Vixieto conclude: ‘Nowhere in the basic architecture of the Internet is there a more hideousflaw than in the lack of enforcement of simple SAV (source-address validation) by mostgateways’ [7].
The way attackers abuse spoofed traffic in amplification DDoS attacks is by sendingqueries with a forged source IP to a multitude of servers running amplification protocols,such as open DNS resolvers or Memcached servers. The spoofed packets set the victim’sIP address as the source IP address. As a result, the victim receives a large number ofserver responses that congest its network or system, making it unavailable for incomingand outgoing traffic. This attack is hard to mitigate by the victim’s network. However, ifnetwork operators would verify the source address of the packets originating from theirown networks, and drop illegitimate packets, it would curtail the ability of the attackerto successfully send spoof packets in the first place. This practice is commonly knownas Source Address Validation (SAV), most notably documented in BCP38. The idea ofBCP38 is that a network operator checks the source address of every outgoing packetbefore it leaves its network against a set of allocated addresses. They should drop thepacket if the source address is outside the range of IPs assigned to them.
Even though for years now there has been a push for the implementation of BCP38across operators, we still observe 22% of all observed ASes being non-compliant in theSpoofer dataset [9]. The adoption of BCP38 suffers from a clear misalignment of incen-tives: the cost is borne by the network that adopts it, while the benefits go to the rest ofthe Internet. Non-compliance can therefore be seen as causing a negative externality.Seen in this light, it is actually remarkable that a sizeable portion of all networks are infact compliant.
This chapter presents the first study that measures the current state of SAV usingtwo independent measurement techniques and that identifies causal factors for non-compliance. We use the terms compliance and adoption interchangeably. The under-lying causal mechanisms are likely to be different, if not outright incomparable, acrossthe enormous heterogeneity of operators behind the more than 60,000 Autonomous Sys-tems (AS) that currently make up the Internet. For this reason, we focus our analysis ona critical population with a more homogeneous composition: Internet Service Providers(ISPs), here defined as the businesses that offer Internet access to end users. Given thatthese networks offer access to billions of users, they are also a critical control point foradopting SAV and block potential miscreants from IP spoofing. What is also importanthere is that the BCP38 unambiguously applies to such so-called ‘stub’ networks that ISPsoperate, as opposed to the more complicated case of transit networks [76]. The un-derlying problem for transit providers is that they might have customers that are notannouncing routes to them, due to traffic engineering. If the non-stub network dropsthese IP packets, they are losing legitimate traffic destined towards its downstream cus-tomers. BCP84 introduced several improvements to BCP38 and proposed filtering usingstatic Access Control Lists (ACLs) or Reverse Path Forwarding (RPF) [77]. It also suggeststhat in the case of asymmetric routing, network operators should only drop packets with“martian addresses” or currently not routed IP addresses. This will limit the problem,but the routable IP space can still be spoofed. Since our dataset only deals with ISPs,
4.2. BACKGROUND AND LITERATURE REVIEW
4
39
there are very few transit networks. Some of these transit ASes can also be siblings ofstub Ases, belonging to the same organization where routing information can be shared.
The research question that we set out to answer is: What factors explain the extentin which Internet Service Providers are not compliant with BCP38? We will be looking atfactors like network complexity, security effort and the institutional environment of thecountry where the ISP is located.
After we discuss the related work, we will unpack various economic factors that shapethe incentives for compliance. We then explain how BCP38 non-compliance was mea-sured across our study population of 250 ISPs in 61 countries. We collect various indica-tors for our theoretical framework and then estimate an OLS regression model to explainnon-compliance. Finally, we discuss our findings in light of current industry proposalson how to increase the adoption of BCP38.
4.2. BACKGROUND AND LITERATURE REVIEW
4.2.1. SAV – SOURCE ADDRESS VALIDATION
Best Current Practice 38, also referred to as Source Address Validation (SAV), was pro-posed in RFC 2827 almost 20 years ago to respond to a growing problem of DoS at-tacks [78]. The RFC describes the straightforward idea of ingress filtering, which assumesthat source IP addresses should be checked against a set of allowed addresses and dis-carded if they are not following filtering rules. If a network provider is aggregating rout-ing announcements for its single-homed client networks, it should strictly prohibit traf-fic which claims to have originated from outside of these networks. RFC 3704 proposeddifferent ways to implement ingress filtering using static Access Control Lists (ACLs) orReverse Path Forwarding (RPF) [77].
Adversaries take advantage of the absence of SAV to launch DDoS attacks by exploit-ing public services vulnerable to reflection. In a typical scenario, end-user machinessend requests from networks that allow spoofing to public services by forging source IPaddresses of the victim [79]. The victim is then overloaded with the traffic coming fromthe public services rather than from the compromised machines. Therefore, the originof the attack is not traceable.
4.2.2. INFERRING SAV DEPLOYMENT
Numerous papers proposed methods to infer SAV deployment [10], [11], [76], [80]–[85].The approach of the Spoofer project [80] is to enable volunteers and “workers” remu-nerated through five crowdsourcing platforms in a pilot study [83] to test SAV compli-ance of their networks with a custom client-server system. The client sends spoofed andnon-spoofed traffic to the server periodically or when it detects a different network. Theserver infers if SAV is deployed in a tested network. Even though the Spoofer project pro-vides the most confident picture of the deployment of SAV, those that are unfamiliar withthe problem or do not implement BCP38 are less likely to run the Spoofer client on theirnetworks.
Another approach proposed by Mauch [85] and implemented by Kührer et al. [82]leverage the misconfiguration of DNS resolvers. DNS servers perform resolutions ofhuman-readable domain names to IP addresses interpretable by machines. Local DNS

4
404. SAVING THE INTERNET: EXPLAINING THE ADOPTION OF SOURCE ADDRESS
VALIDATION BY INTERNET SERVICE PROVIDERS
resolvers can be configured to forward requests to other DNS servers that perform reso-lutions on their behalf. When a misbehaving open DNS resolver receives a request froman external client, it may forward the request to another DNS resolver located outsideits network without changing the packet source IP address to its address. If SAV is notdeployed at the network edge, the client will receive the request resolution from the IPaddress of another resolver. The method is more practical than the Spoofer because themeasurement can be performed remotely and does not require volunteers inside thetested networks.
Lone et al. [76] proposed another technique using routing loops appearing in tracer-oute data to infer inadequate SAV at the transit provider edge. When packets are sent toa customer network with an address that is routable but not allocated, and the defaultroute is set to provider, the packets will be forwarded back to the provider’s router with-out changing the packet source. If the router does not perform SAV, the traceroute willshow a forwarding loop as the provider’s router will again return subsequent packets tothe customer’s network.
Lichtblau et al. [11] and Müller et al. [10] have passively analyzed traffic at Inter-net Exchange Points (IXPs) to infer which source addresses should legitimately appearacross IXP parts by leveraging Autonomous System (AS) topology extracted from BorderGateway Protocol (BGP) data. Even though the proposed detection method does notdepend on volunteers running any custom software or existing misconfigurations, it re-quires privileged access to the traffic exchange points and cannot be easily replicatedwithout special access to the data.
Luckie et. al [84] analyzed Spoofer dataset and ran remediation campaigns. Theyfound at least a quarter of ASes did not filter packets for the year ending Aug 2019. Theyalso found networks behind Network Address Translation (NAT) not always perform SAV.Finally, they analyzed remediations and found that 21% of networks remain unremedi-ated for more than six months.
While the above-proposed methods infer SAV deployment for outbound traffic (i.e.,coming from inside the customer network to the outside), Korczynski et al. proposed anew technique to identify networks not filtering inbound traffic to the customer network[81], [86], [87]. It consists of identifying open and closed DNS resolvers handling requestscoming from the outside of the network with the spoofed source address from the rangeassigned inside the network under the test. This method covers roughly 50% of all ASesand provides the most complete picture of the status of inbound SAV deployment atnetwork providers.
This dissertation presents the first study to combine two independent measurementtechniques (based on Spoofer and DNS Resolvers) to identify the lack of outbound SAV,as well as the first to statistically model causal factors for SAV non-compliance at the ISPlevel.
4.2.3. MODELING SECURITY PERFORMANCE
A few studies have explored concentrations of abuse events across different types of In-ternet intermediaries, with the intent to explain what factors correlate with abuse lev-els. Tajalizadehkhoob et al. [88] and Noroozian et al. [89] explored analytical models toestimate the security performance of the hosting providers. By building generalized lin-
4.3. THEORETICAL FRAMEWORK
4
41
ear models (GLM) for phishing abuse counts, they demonstrated that hosting providers’structural properties, such as domain names space size or IP space size, but also fac-tors reflecting security performance can predict a large amount of the variance in abuseincident counts.
Other studies have explored factors driving domain abuse of operators of Top-LevelDomains (TLD) [90], [91]. They concluded that apart from structural properties of theoperators, security efforts such as strict policies of domain names registration signifi-cantly reduce the number of domains used in phishing and malware attacks.
Our work is closely related to [92] in which Zhang et al. systematically explored therelationship between the mismanagement of networks using Internet-scale measure-ments of BGP routers, SMTP, HTTP and DNS servers, and malicious activities. Theyfound a statistically significant correlation between networks that are mismanaged andnetworks that are responsible for distributing spam, malware, or phishing attacks. In thiswork, we collect various indicators reflecting network properties, security efforts, insti-tutional factors and characteristics of ISPs to explain the absence of SAV using the datafrom the Spoofer project and measurements of misbehaving open DNS resolvers.
4.3. THEORETICAL FRAMEWORKSeveral economic concepts help understand the incentives of network operators to adoptor ignore best security practices like SAV. We first discuss these concepts and then presentthe causal framework that is the basis for our empirical study.
4.3.1. INCENTIVES
COST OF ADOPTION:First, the most obvious incentive against adoption is the demand for resources, includ-ing technical expertise, time, and hardware requirements for the implementation of SAV.The two well-known methods to deploy SAV are Access Control Lists (ACLs), which re-quires manually maintaining a list of all the prefixes announced by the AS, and UniversalReverse Path Filtering (uRPF), where the router checks if a source address exists in itsrouting table before forwarding it. Other than the requirements for implementing SAV,organizations also face ongoing maintenance costs, e.g., engineering time needed forkeeping the ACL-based filtering up to date or hardware requirements for uRPF to main-tain good throughput rates.
EXTERNALITIES:An externality can be defined as the cost or benefit that affects a third party without thisbeing reflected in the market price. SAV adoption suffers from externalities because thecost of adoption is borne by the operator, while the benefits go to others, e.g., the vic-tims of amplification DDoS attacks. Simply put, operators do not see a direct economicbenefit to implementing SAV in their networks. While one could argue that the cost ofdelivering spoofed traffic also implies a cost to the operator where it originates [93], thiseffect is seen to be very small. In a survey on SAV adoption, the majority of respondentssaid that spoofed traffic constitutes only a small fraction of all traffic in terms of totalvolume [11].
4
424. SAVING THE INTERNET: EXPLAINING THE ADOPTION OF SOURCE ADDRESS
VALIDATION BY INTERNET SERVICE PROVIDERS
INFORMATION ASYMMETRY:Whether a network operator is compliant with SAV is often not visible to customers,other providers or outside observers. Adopting this good practice, therefore, doesn’t gen-erate a benefit in terms of a better reputation, as the information is not readily availableto the public or to other providers who might use it in peering decisions. Conversely,non-compliance doesn’t generate a clear negative reputation impact.
WEAKEST LINK:Finally, SAV suffers from being a weakest-link problem. If there are even a handful ofnon-compliant networks, the attack will remain possible. It would be difficult to traceit back to the offending network where it originates. Innovators and early adopters candefinitely help the cause by reducing the number of vantage points from where an attackcan be launched. However, it would not be possible to eradicate the attack vector untilall of the operators are compliant. Since SAV adoption is a good practice, and there areno regulations or fines, it is unlikely all the operators will become fully compliant.
4.3.2. EXPLANATORY FACTORS FOR SAV COMPLIANCEIn light of the above-mentioned incentives, we are developing a causal model that hy-pothesizes the cost of adoption to impact adoption. We approximate this cost in twoways. First, the more complex and dynamic the operator network is, the more costly SAVadoption will be. We include this variable as ‘network complexity’. Second, if an opera-tor has a large customer base, it will have economies of scale and be more likely to haveexpertise in network engineering, making it less costly to implement SAV adoption. Thisfactor is included as ‘ISP characteristics’.
The impact of the cost of adoption is moderated by other factors. First, the will-ingness of the operator to incur costs for security efforts. Second, by the overall develop-ment level and wealth of the country in which it operators (‘institutional environment’)—in other words, the extent to which they can past these costs on to their customers.
For each of these four factors, we identified several indicators that can be empiricallyobserved. Figure 4.1, shows an overview of variables and the indicators to understandnon-compliance of SAV. The dependent variable is defined as non-compliance becauseof the way compliance is measured. As we will discuss in Section 4.4, the two measure-ment techniques are able to observe the lack of compliance, rather than its complement.
NETWORK COMPLEXITY:We hypothesize that the more complex and dynamic a network is, the more costly it willbe to implement SAV safely; thus, the more likely it is that the operator will not be com-pliant. We measure network complexity from several observable network properties.One of the important indicators is the amount of IPv4 address space advertised by ISPs.It gives us a proxy of the size of the ISP. If the operator is announcing a large number ofIPs, it is more likely that they have a more complex network. They might also be runningvarious network policies for different IP ranges, which would mean they are required toapply SAV at multiple points in the network.
Similarly, we calculated the stability of ASes based on the number of prefixes that arechanging over time. The more prefixes there are, the more costly it will be to maintain

4.3. THEORETICAL FRAMEWORK
4
43
Non Compliance (SAV )
Institutional Factors
Security Effort
Network ComplexitySize of Adv IP Space
Avg # of PrefixesAS Stability
ISP Characteristics
# of Spam Bot IPs# of Amplifiers IPs# of Spam Trap IPs
RPKI
ICT Dev IndexMANRS
# of SubscribersAverage Sub Price
Revenue
Figure 4.1: Causal Model for Non-Compliance with Source Address Validation
the ACLs needed to implement SAV. We calculated the total number of prefixes adver-tised per week by ASes for April-Sept, 2019. The more the prefixes change, this will alsoincrease the cost of adoption. We calculated the ones that remain consistent throughoutthe year. If advertisements are constantly changing, it would mean that it is difficult forASes to implement ACL-based BCP38 implementation.
SECURITY EFFORT:We used network hygiene to understand how well the networks are maintained. Theidea behind network hygiene is to measure proxies for how much effort operators putinto keeping their networks secure. We use two factors to calculate the hygiene of thenetworks. First, the presence of amplifiers in the network. Services like Open Resolvers,Memcached servers, and Chargen are constantly used by attackers to redirect and am-plify a DDoS attack. There has been a consistent effort in the operator community toget operators to reduce the number of such amplifiers in their network. We calculatedthe number of amplifiers per ASN and used it as an indicator that the network operatorswith a higher count of amplifiers are less likely to have SAV in place.
Second, we calculated abuse in the network in the form of the number of bots and thenumber of spam-sending IPs. We hypothesize that the network operators who performpoorly on keeping their networks clean are less likely to care about SAV.
Finally, we checked if operators have signed one or more of their prefixes using Re-source Public Key Infrastructure (RPKI). We assigned a binary value for adoption. RPKI isa framework that allows service providers to sign the prefixes allocated to them. It allowsother ASNs to validate the ownership of the advertised prefix.
Since RPKI is a relatively new framework, and it is an opt-in service, we hypothesizethat the operators that sign one or more prefix are security-aware and are more likely toadopt SAV for their networks.

4
444. SAVING THE INTERNET: EXPLAINING THE ADOPTION OF SOURCE ADDRESS
VALIDATION BY INTERNET SERVICE PROVIDERS
ISP CHARACTERISTICS:We define ISP characteristics as a function of the number of subscribers and availablefunds of ISPs. These characteristics give us a different picture compared to networkproperties. For instance, IPv4 allocation is not evenly distributed. It has a limited pooland was assigned based on a first-come, first-serve basis. As a result, we have many ISPswith a large customer base and fewer IP addresses.
We use subscriber numbers from Telegeography data [94] and manually map com-pany names to ASes. Moreover, we use an average subscription price as a proxy to theirearnings for available funds. We hypothesize that ISP with a large number of subscriberswill face difficulties for the implementation of SAV. However, ISPs with a higher subscrip-tion price will have more funds to invest in good security practices like SAV.
INSTITUTIONAL FACTORS:Additionally, we measure the impact of institutional characteristics on ISPs for the im-plementation of BCP38. We expect ISPs in countries with more mature ICT developmentmore likely to be compliant as there will be more resources, more mature networks,and more initiatives for better security. For this, we use the U.N.’s ICT DevelopmentIndex [95].
Similarly, we test whether ISPs are a signatory of Mutually Agreed Norms for RoutingSecurity regulations (MANRS). MANRS initiative recommends best practices for ISPs toreduce the most common routing threats. It requires SAV for single-homed ISPs or forthose whose customer network is owned by the ISP. There are currently 209 member ISPs.We expect that these ISPs are likely to be more compliant compared to non-members.
In sum, the basic idea is that the cost and benefit of SAV adoption are highly asym-metrically distributed, making adoption much less likely. We want to estimate the im-pact of various causal factors on adoption. First, network complexity (via various indi-cators), where we assume this would increase the cost of adoption and thus lower theprobability of adoption. Second, security effort, where we assume this reflects the will-ingness of network operators to invest in security measures that also, or even primarily,benefits third parties. We assume this increases the likelihood of adoption. Third, insti-tutional factors, where we assume that more operators in more wealthy countries andwith more mature networks and regulatory environments are more likely to accept thecost of adoption as a ‘cost of doing business’, thus increasing the likelihood of adoption.
4.4. DATA COLLECTIONIn this section, we describe the sources for various datasets that we use to estimate themodel. As explained before, we focus our analysis on ISPs to have a somewhat homoge-neous study population, but also because the majority of the user devices are in an ISPnetwork. They form a critical control point because they are closer to the origin of thetraffic and can not only detect but also block spoofed traffic.
Several of our datasets of the independent and dependent variables are based on IPaddresses and Autonomous System Numbers (ASNs). The relationship between ASesand ISPs is not that simple. Yes, many ISPs have a single AS, but a fraction of ISPs havemultiple ASNs, some ISPs share a single ASN. We first explain how we mapped ASNs toISPs, followed by an explanation of how we collected data on IP addresses that were ob-

4.4. DATA COLLECTION
4
45
served to facilitate spoofed traffic. Finally, we explain our methodology to obtain andanalyze the datasets for network complexity, security effort, and institutional environ-ment.
4.4.1. MAPPING OBSERVATIONS TO ISPSWe define an ISP as a company that provides access services, typically in residentialbroadband markets. To map to ISPs our indicators and our observations of compliance,we need to identify their network address space.
We start our identification of the network space of ISPs with market analysis datafrom Telegeography: the GlobalComms database [94]. The database contains a highlyreliable overview of the main broadband ISPs in each country, drawn from annual re-ports and market filings. We focused on the ISPs in 64 countries who together possess abroadband market share of over 85% in those countries [96]. This gives us a total popu-lation of 334 ISPs.
In the next step, we used CAIDA’s AS ranking dataset [97]. It provides an approximatemap of the organization name based on AS, the number of IP addresses announced, thecountry from which AS originate and the AS number. We then manually mapped theASNs that belong to these ISPs by matching their names and the registration informationto ASes that reside (at least partially) in that country.
In some cases, due to mergers, acquisitions, or branding changes, the AS name in-formation might be outdated and no longer consistent with the current ISP name. TheTeleGeography data also contains historical information about the ISPs. We search forhistorical names and updated mappings if we find evidence that an AS belongs to one ofthe ISPs in our dataset.
Finally, we look at the description of prefix announcements from the Hurricane Elec-tric dataset [98] and exclude ASes that appear to be used primarily for other purposes likehosting, cellular data, IPTV, etc. There is a possibility that an ISP might provide multipleservices from the same AS. In such a scenario, the identified AS might include some ser-vices like hosting infrastructure inside an access network. For our purposes, however, itstill falls within the category of providing access services and should be included in themapping of ISP network space.
We then map the IP addresses belonging to each AS number using BGP data fromthe Routeviews project [99]. Via the AS, we can then connect the IP address to the ISPsand country. Now, as some ASes span multiple countries, we geo-locate all IP addressesusing the MaxMind GeoIP2 database [100]. For each ISP, we map only the portion of theAS that geo-locates to the country in which the ISP resides. This way, multi-country ASesget split up over the subsidiaries of the ISP in the various countries.
4.4.2. DATA ON IP SPOOFINGTo measure whether networks allow outbound spoofing to their upstream networks, weanalyze data from the Spoofer project and from our Internet-wide scans of misbehavingopen DNS resolvers. We merge these two sources into a variable that indicates non-compliance at the /24 prefix level. In this section, we first give an overview of the twotechniques, followed by why and how of the data aggregation methodology.
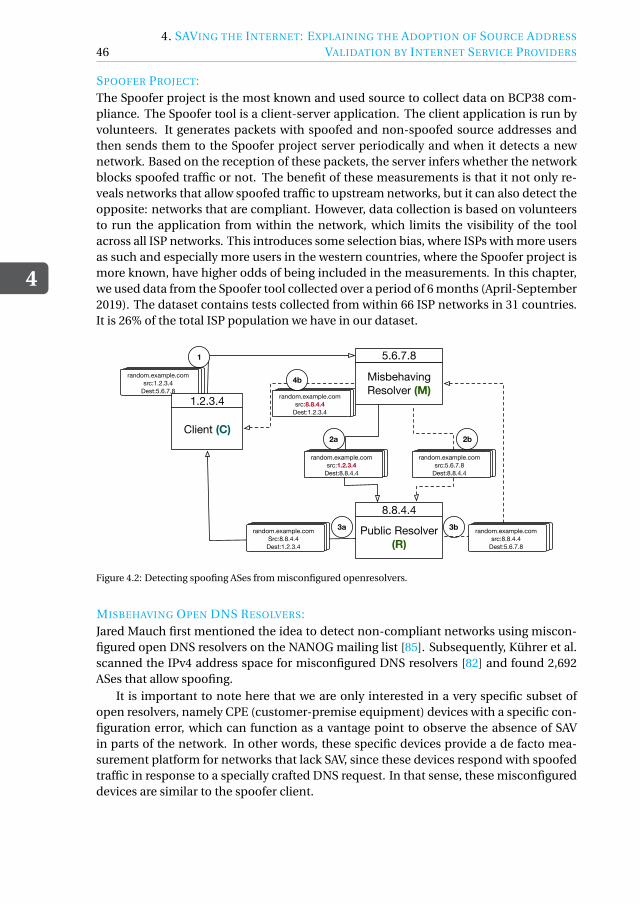
4
464. SAVING THE INTERNET: EXPLAINING THE ADOPTION OF SOURCE ADDRESS
VALIDATION BY INTERNET SERVICE PROVIDERS
SPOOFER PROJECT:The Spoofer project is the most known and used source to collect data on BCP38 com-pliance. The Spoofer tool is a client-server application. The client application is run byvolunteers. It generates packets with spoofed and non-spoofed source addresses andthen sends them to the Spoofer project server periodically and when it detects a newnetwork. Based on the reception of these packets, the server infers whether the networkblocks spoofed traffic or not. The benefit of these measurements is that it not only re-veals networks that allow spoofed traffic to upstream networks, but it can also detect theopposite: networks that are compliant. However, data collection is based on volunteersto run the application from within the network, which limits the visibility of the toolacross all ISP networks. This introduces some selection bias, where ISPs with more usersas such and especially more users in the western countries, where the Spoofer project ismore known, have higher odds of being included in the measurements. In this chapter,we used data from the Spoofer tool collected over a period of 6 months (April-September2019). The dataset contains tests collected from within 66 ISP networks in 31 countries.It is 26% of the total ISP population we have in our dataset.
Client (C)
MisbehavingResolver (M)
Public Resolver (R)
random.example.comsrc:1.2.3.4
Dest:5.6.7.8
1.2.3.4
5.6.7.8
8.8.4.43b3a
2a
random.example.comsrc:1.2.3.4
Dest:8.8.4.4
random.example.comSrc:8.8.4.4
Dest:1.2.3.4
random.example.comsrc:8.8.4.4
Dest:5.6.7.8
random.example.comsrc:8.8.4.4
Dest:1.2.3.4
4b
1
random.example.comsrc:5.6.7.8
Dest:8.8.4.4
2b
Figure 4.2: Detecting spoofing ASes from misconfigured openresolvers.
MISBEHAVING OPEN DNS RESOLVERS:Jared Mauch first mentioned the idea to detect non-compliant networks using miscon-figured open DNS resolvers on the NANOG mailing list [85]. Subsequently, Kührer et al.scanned the IPv4 address space for misconfigured DNS resolvers [82] and found 2,692ASes that allow spoofing.
It is important to note here that we are only interested in a very specific subset ofopen resolvers, namely CPE (customer-premise equipment) devices with a specific con-figuration error, which can function as a vantage point to observe the absence of SAVin parts of the network. In other words, these specific devices provide a de facto mea-surement platform for networks that lack SAV, since these devices respond with spoofedtraffic in response to a specially crafted DNS request. In that sense, these misconfigureddevices are similar to the spoofer client.

4.4. DATA COLLECTION
4
47
A previous study [82] has fingerprinted these misconfigured open resolvers and foundthe majority of them were running on home routers. These open resolvers have a veryspecific configuration error that makes them act as a forwarder for incoming packets.They probably have either misconfigured NAT rules or erroneous DNS proxy implemen-tations [82]. We use these devices basically as vantage points. If we receive a response,this tells us two things: first, that there are no edge controls in place and, second, thatthere is no SAV at the network level, i.e., on border routers. In other words, there is nocompliance with BCP38. In short, the misconfigured resolvers are a means for us to mea-sure that anti-spoofing measures are not in place within the ISP’s network.
Figure 4.2 illustrates how the proposed misconfiguration works. A client (C ) with anIP 1.2.3.4 sends a DNS request to an IP address 5.6.7.8 to resolve random.example.com in step 1. If it reaches a misbehaving DNS resolver (M), it may forward the DNSrequest to another DNS resolver (R) to resolve the request in step 2a (in the example itis Google’s open public resolver with an IP address 8.8.4.4). However, a misbehavingresolver M may not change the source IP address of the original request to its own beforeforwarding it to R (step 2a). If SAV is not deployed at the network edge of the testednetwork, the forwarded query will reach R, which will perform the resolution and willsend the response directly to the client in step 3a, revealing the lack of SAV in the testednetwork. In a second scenario, the misbehaving resolver M may correctly forward thequery to R by replacing the client’s IP with its own in step 2b. After performing a recursivequery resolution, R may send the response back to M , in step 3b. However, M mayforward the DNS response to the client C without changing the source IP address of R toits own in step 4b, thus again revealing a non-compliant network.
To collect the data on networks without SAV using the method explained above, weextended the implementation of the myDig software [101]. We generated a list of uniquesubdomains for each routable IPv4 address and sent DNS requests from our server. Eachtime we get the response, we compare the destination IP address we sent the request towith the IP address that replied. We conclude that spoofing is feasible if the IP addressfrom the response belongs to a different AS than we initially queried. We have repeatedthe scan for a period of 6 months from April till September 2019 on a weekly basis. Withthis technique, we observed IP addresses that can send spoofed packets in 240 ISPs and60 countries.
FROM MEASUREMENTS TO NETWORKS:The Spoofer and Open Resolver measurements observe individual IP addresses wheresending spoofing traffic was feasible. A key methodological issue is how to infer, fromthese individual IP addresses, what overall portion of an ISP’s network is non-compliant.In order to estimate the amount of IP space that allows spoofing, we need to aggregatethe tested IP to the prefix level. SAV compliance requires configurations of the routers;hence it is more likely that either the entire prefix is compliant or not. It is, however,challenging to infer how the ISP has segmented its network in different prefixes, since itis operator dependent and is not reported publicly.
In principle, we could aggregate the non-compliant space at three different levels.First, we could classify the entire AS as spoofable if we find measurements showing thatIPs can spoof in either of our two datasets. However, if policies are implemented on a

4
484. SAVING THE INTERNET: EXPLAINING THE ADOPTION OF SOURCE ADDRESS
VALIDATION BY INTERNET SERVICE PROVIDERS
prefix level, it will mean we would overcount the amount of addresses space that is non-compliant. Moreover, some large ASes operate across different countries, containingmultiple ISPs (country-level subsidiaries of a multi-national ISP). Parts of the same ASmight therefore be under the control of different organizations, which might result invarying SAV policies within that AS.
The second and more realistic approach would be to deduce policies from BGP inter-domain routing tables. The BGP table contains reachability information, which is sharedamongst the ASes. We can map the IPs observed in our two datasets to the longestmatching prefix from the BGP routing table and count that prefix as being non-compliant.These counts are better than assigning the entire space of ASN based on a few measure-ments. However, it still suffers from overcounting due to IP space aggregation by ISPs forefficient routing.
In this study, we have chosen a more conservative third approach. If we find one ormore IPs that allow spoofing within a /24 prefix (256 addresses), we classify the entire /24prefix as non-compliant. We also check BGP routing data and if an AS is announcing aprefix that is less than /24, we chose the smaller prefix as the more conservative estimate.
In [84], Luckie et al. show that in about 30% of the remediated cases in Spoofer,the client can still spoof address space outside the /24 prefix. This confirms that ourapproach is conservative and likely to underestimate the portion of an ISP’s IP spacethat allows spoofed traffic to leave the network.
In Figure 4.3, we show the distribution of non-compliant IP space per ISP. It can beseen that 40% of ISP have a non-compliant address space of less than 1000 IP addresses,while around 86% percent has 10,000 or fewer IPs that can potentially send spoofedpackets. In terms of /24 prefixes, we observe that around 16% ISPs have only one prefix,while around 37% of ISPs we have measurements from two /24 prefixes.
Spoofable Space (Log10)
Fre
quen
cy
2 3 4 5 6 7
010
2030
4050
60
0.00
0.25
0.50
0.75
1.00
3 4 5 6Spoofable Space (Log10)
Cum
ulat
ive
Den
sity
Figure 4.3: Distribution of Amount of Non-Compliant Address Space of ISPs
COMPARISON OF DATASETS:The Spoofer client not only detects when a network allows a host to send spoofed traffic,but when it is blocked. The latter can be because the network has implemented BCP38
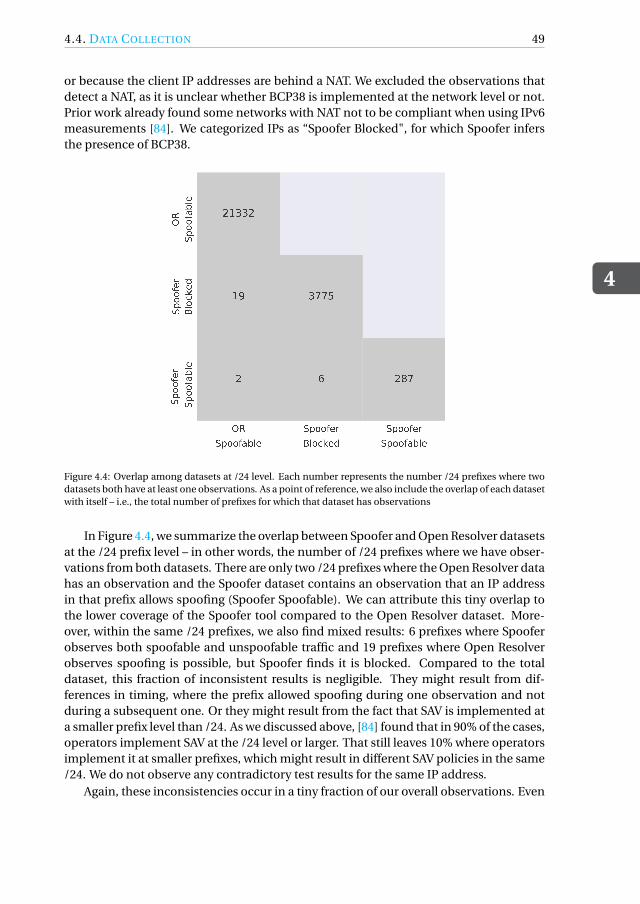
4.4. DATA COLLECTION
4
49
or because the client IP addresses are behind a NAT. We excluded the observations thatdetect a NAT, as it is unclear whether BCP38 is implemented at the network level or not.Prior work already found some networks with NAT not to be compliant when using IPv6measurements [84]. We categorized IPs as “Spoofer Blocked", for which Spoofer infersthe presence of BCP38.
Figure 4.4: Overlap among datasets at /24 level. Each number represents the number /24 prefixes where twodatasets both have at least one observations. As a point of reference, we also include the overlap of each datasetwith itself – i.e., the total number of prefixes for which that dataset has observations
In Figure 4.4, we summarize the overlap between Spoofer and Open Resolver datasetsat the /24 prefix level – in other words, the number of /24 prefixes where we have obser-vations from both datasets. There are only two /24 prefixes where the Open Resolver datahas an observation and the Spoofer dataset contains an observation that an IP addressin that prefix allows spoofing (Spoofer Spoofable). We can attribute this tiny overlap tothe lower coverage of the Spoofer tool compared to the Open Resolver dataset. More-over, within the same /24 prefixes, we also find mixed results: 6 prefixes where Spooferobserves both spoofable and unspoofable traffic and 19 prefixes where Open Resolverobserves spoofing is possible, but Spoofer finds it is blocked. Compared to the totaldataset, this fraction of inconsistent results is negligible. They might result from dif-ferences in timing, where the prefix allowed spoofing during one observation and notduring a subsequent one. Or they might result from the fact that SAV is implemented ata smaller prefix level than /24. As we discussed above, [84] found that in 90% of the cases,operators implement SAV at the /24 level or larger. That still leaves 10% where operatorsimplement it at smaller prefixes, which might result in different SAV policies in the same/24. We do not observe any contradictory test results for the same IP address.
Again, these inconsistencies occur in a tiny fraction of our overall observations. Even

4
504. SAVING THE INTERNET: EXPLAINING THE ADOPTION OF SOURCE ADDRESS
VALIDATION BY INTERNET SERVICE PROVIDERS
Figure 4.5: Overlap among datasets at ISP level. Each number represents the number of ISPs both datasetshave at least one observation. As a point of reference, we also include the overlap of each dataset with itself –i.e., the total number of ISPs for which that dataset has observations
in these cases, we have proof that spoofing is allowed from a least a portion of the /24.For this reason, we consider this fraction of prefixes also to be non-compliant. In the restof the chapter, we only consider the non-compliant address space.
Figure 4.5 shows where we have observations for the same ISP in two datasets. ISPstypically operate their address space as multiple networks, sometimes even multipleASes. This explains why a large number of ISPs where we detected spoofing also hadother parts of their network where SAV was implemented. It is important to note that,on average, we find 10.5 more non-compliant addresses than compliant addresses inthese ISPs. In any case, as explained earlier, even if there are a few addresses that allowspoofing, the possibility of a DDoS attack remains intact. From our overall population of343 ISPs, we have observations that indicate non-compliance for 250 of them (73%). For182 ISPs (53%), we also have test results indicating that they did deploy SAV on some pre-fixes. We have no test results whatsoever for 51 (15%) of ISPs. For 149 of all ISPs (43%),we have mixed results: hosts can send spoofed packets from some prefixes and whilespoofed traffic is filtered in other prefixes.
4.4.3. NETWORK PROPERTIES DATA
TOTAL SIZE OF ADVERTISED IP SPACE:We used routing data collected by Routeviews project [99] to estimate the number of IPsper ISP. We analyzed weekly BGP routing data for the period of April-September 2019. Weused the pyasn library [102] to determine the prefixes announced for the ASNs, which arethen mapped to ISPs in our dataset. We then aggregated the total number of IPs for each

4.4. DATA COLLECTION
4
51
of the ASNs per ISP. Finally, we took the average number of IPs from the weekly data perISP.
AVERAGE NUMBER OF PREFIXES:IP space is announced in BGP tables in the form of prefixes. An IP prefix represents thenumber of bits, which is used to identify a network and determine the total number ofhosts. Network operators usually aggregate the total advertised space to the maximumprefix announcement possible for efficient routing and lower number of advertisements,which is useful routing tables. However, in some cases, due to routing policies or theirusage, they advertise multiple prefixes for the same range. Once a week, we calculatedthe number of prefixes announced per ISP between Apr-September 2019. We then tookan average of these counts.
STABILITY OF PREFIX ANNOUNCEMENTS:Moreover, using the BGP data and pyasn, we determined the stability of the announcedprefixes by calculating the percentage of prefixes per operator that remained unchangedcompared to the total set of prefixes that were announced at some point during the mea-surement period (Apr-Sep, 2019).
4.4.4. SECURITY EFFORT DATA
RPKI:Internet operators use BGP to exchange routing data. It contains prefixes and the num-ber of hops they are away from the AS announcing the information. Routing informationis constantly changing and BGP is flexible enough to converge for these route changes.However, BGP lacks a mechanism to validate if the prefixes being announced actually be-long to the entity announcing them. To verify the authenticity of the announcement, In-ternet Engineering Task Force (IETF) developed a mechanism known as Resource PublicKey Infrastructure (RPKI) [103]. Internet operators can now use a cryptographic systemof public/private keys to sign prefixes, thereby authenticating that they are authorized toannounce them. The Regional Internet Registries (RIRs) maintain public key certificates.The operators can detect announcements with an invalid route origin. It is important tonote that RPKI doesn’t secure the path. It is, however, the first step towards BGP routesecurity.
We interpret the adoption of RPKI as an indicator of security effort by the ISP. Weused Nlnetlabs Routinator, an RPKI validator tool [104], to download prefixes that weresigned by their respective ISPs. We then mapped these ASNs, where we observed signedprefixes to ISPs from our dataset. We assigned a binary value of 1 to the ISPs that hadsigned one or more prefixes, and 0 to the ISPs that had no signed prefixes.
SPAM BOTS:Like the lack of SAV compliance, infected end-user machines in an ISP network are awidely recognized security externality [105]. While ISPs have been involved in mitigat-ing botnets, many of the benefits of mitigation go to the third parties that are attacked bybotnets. Contrary to SAV, though, the ISP might suffer some cost via blacklisting when

4
524. SAVING THE INTERNET: EXPLAINING THE ADOPTION OF SOURCE ADDRESS
VALIDATION BY INTERNET SERVICE PROVIDERS
it does not mitigate outbound spam. We interpret the relative number of bots is an in-dicator of the security effort ISPs are willing to undertake in light of significant externaleffects.
We measured the number of bots in the ISP networks using multiple data feeds. First,we used the Composite Blocking List (CBL) of SpamHaus [26]. The dataset contains IPsof spam bots, including Cutwail, Rustock, Lethic, Kelihos, and Necurs. We receive a dailyreport from SpamHaus and map the IPs in the feed to their respective ISPs. We haveto control for DHCP churn, which would lead to serious overcounting for ISPs with verydynamic IP address allocation, as the same infected machine would show up under mul-tiple IP addresses. [106]. In order to compensate for this churn, we count the number ofunique IPs observed each day and then calculate the average of all daily counts over ourmeasurement period. The downside of this methodology could be that we are under-counting. However, due to our long time-frame, the averages would bring the estimatedcount closer to the actual number of infected machines.
A second indicator on bots is based on a spam trap operated by Dave Rand of Trend-Micro. We follow the same approach as with Spamhaus CBL: extract the IP addresses,map them to the ISPs and calculate the daily average number of unique IPs seen overthe measurement period.
AMPLIFIERS:
Finally, we look at the presence of so-called amplifiers in the networks of ISPs. Amplifiersare legitimate services that can be abused in amplification attacks with spoofed traffic,exactly as was explained at the start of this chapter. Again, this is an example of a securityexternality for the ISP, thus providing us with an indicator for measuring security effortrelated to threats with significant external effects.
We downloaded Rapid7 data containing IP addresses of UDP amplifiers in ISPs’ net-work [107]. Rapid7 scans for various protocols are publicly available every month. Inour study, we used IP addresses for Chargen, DNS resolvers, Memcached, Netbios, Ntp-monlist, Portmap and Qotd.
We have decided to combine the observations of amplifiers into a single proxy. Ourgoal is to capture a signal on overall network hygiene, not the ISP response to a specifictype of amplifier. The protocols that we have included in our study have been identifiedas potential attack vectors by US CERT advisory [108]. Network operators should eithertake down the amplifiers or at least deny access to the services over the Internet. Theycan also deploy Response Rate Limiting (RRL) to reduce the rate at which replies are sentand thus limiting the impact of amplification. By combining the amplifier observations,we also get much better coverage of observations across the ISP population, further im-proving the statistical behavior of the proxy. (To telegraph ahead to the statistical analy-sis: when we include each amplifier type as a separate predictor in the model, the sigalgets too weak and we no longer find any significant relationships.) A high correlation be-tween non-compliant networks and the presence of a large number of amplifiers wouldindicate operators’ inaction for DDoS problem. We mapped the reported IP addressesto each ISP. Finally, to mitigate the effect of churn, we calculated daily averages of thenumber of observed amplifiers using the methodology explained above.

4.5. STATISTICAL MODEL FOR NON-COMPLIANCE
4
53
4.4.5. ISP CHARACTERISTICS DATA
NUMBER OF SUBSCRIBERS:We used the total number of subscribers as a proxy to determine the size of ISPs. Tele-geography database reports the total number of subscribers per quarter, and we selectedquarter two of 2019, as it matches the closest to the spoofing datasets.
AVERAGE SUBSCRIPTION PRICE AND REVENUE:Telegeography reports revenue and average subscription price per company. However,they do not have data for all Internet providers. We mapped revenue and subscriptionprices to our dataset. We are missing 68 ISPs and do not have any reliable estimates tofill in missing values.
4.4.6. INSTITUTIONAL ENVIRONMENT DATAFinally, we collected indicators for the institutional environment of the ISPs. The firstone is at the level of countries, the second at the level of the provider community, i.e.,whether the ISP is part of a group of industry peer committing themselves to adopt goodsecurity practices for routing, among which is SAV.
ICT DEVELOPMENT INDEX:We also used the ICT development index, which is an indicator representing ICT de-velopment per country. The dataset is provided by ITU (United Nations InternationalTelecommunication Union). It assigns values from 1 to 10, with a higher number repre-senting a higher level of development based on various ICT indicators.
MANRS DATASET:MANRS initiative requires best practices for ISPs to reduce the most common routingthreats. We downloaded member ASNs of MANRS from their website and mapped it toISPs in our dataset [13].
4.5. STATISTICAL MODEL FOR NON-COMPLIANCEIn this section, we first explain the transformations we did for some of the indicators,followed by basic statistics of the dataset. Next, we estimate a linear model and discussthe results and interpretations.
The number of non-compliant IP addresses per ISP has a correlation of 0.52 with thetotal number of IP addresses being announced by that ISP. ISPs with a larger numberof IP addresses have a higher chance of having tests and are hence more likely to havenon-compliant address space being observed. For this reason, we first transform thedependent variable into a relative metric: the ratio of the non-compliant address spaceto the whole address space being announced by the ISP. In Figure 4.6 (a), we show thedistribution of this normalized variable. One of the concerns is that the distribution isleft-skewed, partially because of the fact that we adopted a conservative approach toestimate the amount of non-compliance address space, likely undercounting it. Thisdistribution would violate the assumptions of linear regression. We perform a naturallog transformation to resolve this issue. Figure 4.6(b) shows that the transformed distri-bution is much closer to normal. We used this transformed variable as the dependent

4
544. SAVING THE INTERNET: EXPLAINING THE ADOPTION OF SOURCE ADDRESS
VALIDATION BY INTERNET SERVICE PROVIDERS
variable in our model. For the same reasons, we also log-transform some of our inde-pendent indicators, namely the number of subscribers and the security effort indicatorsfor bots and amplifiers. Table 4.1 summarizes the indicators that are used in the model.
0
50
100
150
200
250
0.0 0.2 0.4 0.6
Fre
quen
cy
(a) Portion IP Space Non-Compliant
0
10
20
−9 −6 −3 0F
requ
ency
(b) Log-transformed Portion IP Space Non-Compliant
Figure 4.6: Distribution of Transformed Spoofable IPs per ISP
4.5.1. MODEL SPECIFICATIONTo reiterate: we measure SAV compliance as the number of IP addresses in all /24 blockswhere one or more IP addresses were observed as being non-compliant in our Spoofer orOpen Resolver datasets. Our response variable is a normalized count of non-compliantaddresses divided by the total number of IP addresses announced by the operator. Wedefine our response variable Yi as the log of the normalized size of non-compliant ad-dress space by ISPi for i = 1, . . . ,n, where n is the total number of ISPs for which we haveour tests. To estimate the impact of network properties, security effort, ISP characteris-tics and institutional factors on non-compliant address space, we use a linear regression,which takes the following form:
ln(Yi ) =β0 +k∑
j=1β j xi j +xi j ∗ yi j +ϵi
where β0 is the intercept and xi j , j = 1, . . . ,k, are the indicators for network complex-ity, security efforts, ISP characteristics and institutional environment and xi j ∗ yi j is theinteraction terms for the model. Our error term ϵi is normally distributed with mean 0and the variance sigma squared.
4.5.2. DISCUSSION OF RESULTSWe construct models following step-wise inclusions for the various indicators. A sum-mary of four models is presented in Table 4.2. Our goal is to understand the relationshipof various indicators and improve the goodness of fit for these models. The Adjusted-R-

4.5. STATISTICAL MODEL FOR NON-COMPLIANCE
4
55
Variables N Min Mean Median MaxPortion of adv. IP space non-compliant 250 0.00002 0.006 0.0012 0.522Total size of adv. IP space 250 6,617 6M 1,4M 124MAvg # of prefixes 250 3.61 204.0 88.15 2,668AS stability (percentage) 250 4.03. 79.75 86.38 100Avg # of bots Spamhaus 250 18.3 29,772 4,264 1,1MAvg # of amplifiers 250 86.3 13,979 2,703 0,51MAvg # of bots spam trap 250 1.06 43.25 14.36 1,681RPKI 250 0 n/a 1 1# Subscribers 250 5,500 3M 0,7M 174MAvg sub price (USD) 182 4.5 47.02 41.04 883Revenue (USD) 182 12 2,302 533.7 46,377ICT Dev Index 250 2.42 6.68 7.04 8.98MANRS 250 0 n/a 0 1
Table 4.1: Summary of indicators used in the model
squared value increases from 0 in the model (1) to 0.47 in the model (3), which meanswe were able to explain 47% of variance by adding the indicators for network complex-ity, security effort, and institutional environment. Moreover, the signs of coefficients donot change from the model (2) to model (4). Note that we had to drop 68 ISPs in themodel (4) due to missing information on revenue and subscription prices. Since thesetwo indicators do not add any explanatory power, nor affect the other variables, we omitthem and select model (3) as our final model. It performs the best in terms of explainedvariance.
In the final model, we also include interaction terms to understand the effect of ad-vertised IP space in combination with subscribers and prefixes. Note that the distribu-tion of IPv4 address space is asymmetric: early adopters were able to acquire a largenumber of addresses, while more recent market entrants got smaller allocations for thesame number of users – due to the shrinking pool of address space held by RIRs – andthey therefore have to rely more on NAT. Furthermore, IPs are allocated to ISPs in termsof prefixes. The early adopters were able to acquire bigger ranges. Later on, ISPs wereallocated smaller prefixes, as IPv4 started running out. This presents an interesting in-teraction effect: ISPs with a large number of IP addresses and a small number of prefixeswould have a relative advantage in SAV adoption because routes would be easier to con-figure and maintain. We included the interaction of total IP space advertised with thenumber of prefixes to test this hypothesis.
The indicators that measure the size of the ISP, in terms of address space and in termsof subscribers, are significant and have a negative sign. However, we need to be carefulwith their interpretations due to interaction effects. We explain this in more detail later inthe section, but to telegraph ahead: we observe that the signs change for both the num-ber of advertised IPs and the number of subscribers when the number of announced IPsget past the 450,000 mark (see intersecting point Figure 6). From our dataset, a large ma-jority (76%) of ISPS advertise more than 450K IP addresses. We can therefore state that,by and large, larger ISPs have a higher proportion of non-compliant IP space.

4
564. SAVING THE INTERNET: EXPLAINING THE ADOPTION OF SOURCE ADDRESS
VALIDATION BY INTERNET SERVICE PROVIDERS
Response Variable: Portion of adv. IP space non-compliant (ln)
(1) (2) (3) (4)
# Advertised IPs (ln) −1.782∗∗∗ −2.080∗∗∗ −1.844∗∗(0.342) (0.382) (0.617)
Avg # prefixes 0.011∗∗ 0.016∗∗∗(0.003) (0.004)
AS stability (percentage) 0.001 0.002(0.004) (0.004)
RPKI −0.313∗ −0.207(0.156) (0.187)
Avg # amplifiers (ln) 0.368∗∗∗ 0.283∗∗∗(0.075) (0.080)
Avg # bots SH.(ln) 0.099 0.071(0.077) (0.090)
Avg # bots ST.(ln) −0.068 0.027(0.090) (0.099)
# Subscribers (ln) −0.842∗ −1.257∗∗ −0.936(0.353) (0.410) (0.642)
Average subs price 0.001(0.001)
Revenue 0.00001(0.00003)
ICT Dev Index −0.164∗ −0.236∗∗(0.065) (0.081)
Adv. IPs(ln):# subs(ln) 0.077∗∗ 0.094∗∗∗ 0.079(0.024) (0.028) (0.045)
Adv.IPs(ln):Avg# prefixes −0.001∗∗ −0.001∗∗∗(0.0002) (0.0003)
Constant −6.725∗∗∗ 15.000∗∗ 18.924∗∗∗ 14.959(0.101) (4.736) (5.205) (8.555)
Observations 250 250 250 182R2 0.000 0.333 0.495 0.463Adjusted R2 0.000 0.325 0.472 0.421Residual Std. Error 1.601 (df = 249) 1.315 (df = 246) 1.163 (df = 238) 1.134 (df = 168)F Statistic 40.929∗∗∗ (df = 3; 246) 21.209∗∗∗ (df = 11; 238) 11.131∗∗∗ (df = 13; 168)
Note: ∗p<0.05; ∗∗p<0.01; ∗∗∗p<0.001
Table 4.2: Linear regression model

4.5. STATISTICAL MODEL FOR NON-COMPLIANCE
4
57
In the case of BCP38, size plays an essential role in the implementation of SAV. ISPswith larger address space are more likely to peer with a higher number of upstreamproviders, to avoid a single point of failure. To be compliant, they would then have toimplement BCP38 on multiple edge routers. This would be more costly. However, acounteracting effect of size, especially when measured in terms of the number of cus-tomers, is that larger ISPs have more resources and expertise than smaller operators.Furthermore, there are likely economies of scale in implementing BCP38. The modelsuggests these cost-reducing effects of size are smaller than the cost increases becauseof the increased network complexity. In the case of the number of prefixes, we observefor around 96% of ISPs increasing the number of prefixes would also lead to an increasein non-compliant IP space. We give a detail explanation in the latter part of the section.We did not find the stability of prefixes significant in our model.
Next, we look at the impact of ISP security efforts. We have used the signing of BGPprefixes (RPKI), as a positive indicator of effort, i.e., the willingness to invest in securityissues with significant externalities. The number of DDoS amplifiers and spambots inthe network is a negative indicator of this willingness. The model finds a weak but sig-nificant relationship with RPKI. Operators that sign their prefixes are more likely to im-plement SAV in their networks. From our results, holding all variables constant, an ISPthat signs its prefixes with RPKI will have a 31.3% lower portion of non-compliant spacecompared to ISPs that don’t sign their prefixes. We find the indicator for the number ofamplifiers per ISP has a significant positive impact. In other words, for a 1% increase inthe number of amplifiers, there is an increase of 0.36% of the portion of non-compliantaddress space, holding all other variables constant. Please note that when we treat eachamplification protocol independently in the model, the relationships are no longer sig-nificant. However, by combining these observations, we can approximate overall hy-giene, as observed by the fact of whether operators reduce amplifiers across the board.
The two indicators for spambots are not significant. There could be several reasonsfor this. Contrary to RPKI and the number of amplifiers, the number of spambots is in-fluenced by attacker behavior. This could confound the indicator in terms of measuringprovider effort. Also, ISPs have another incentive than security for dealing with spam-bots: they might get blacklisted. This, in turn, might impact the service quality for theircustomers (e.g., legitimate email might also get blocked). In other words, this indicatormight also include effects that are not capturing the provider’s willingness to invest insecurity issues with serious externalities.
When looking at the ISP characteristics, we find that the number of subscribers hasan impact. We discuss this below, where we interpret the interaction effects. The othertwo indicators, average subscription price and revenue of the ISP, were included in themodel (4). Both of these variables are non-significant and have a small coefficient. Thismight be partially due to missing data, since we have no information for about 27% (68)of ISPs. Future work is needed to collect data on the financials of ISPs to understandthese relationships.
Next, we measure the impact of the institutional environment. The model shows aweak but significant effect for the ICT development index. ISPs that operate in countrieswith lower ICT development have a higher percentage of non-compliant address space.In other words, for a 1% increase in ICT index, there is a decrease of 16.4% of the portion
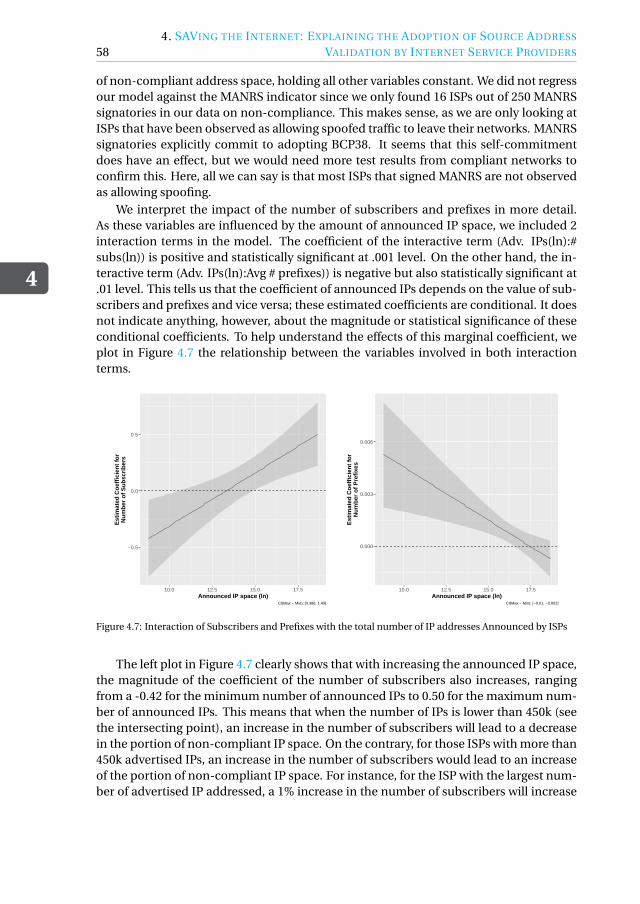
4
584. SAVING THE INTERNET: EXPLAINING THE ADOPTION OF SOURCE ADDRESS
VALIDATION BY INTERNET SERVICE PROVIDERS
of non-compliant address space, holding all other variables constant. We did not regressour model against the MANRS indicator since we only found 16 ISPs out of 250 MANRSsignatories in our data on non-compliance. This makes sense, as we are only looking atISPs that have been observed as allowing spoofed traffic to leave their networks. MANRSsignatories explicitly commit to adopting BCP38. It seems that this self-commitmentdoes have an effect, but we would need more test results from compliant networks toconfirm this. Here, all we can say is that most ISPs that signed MANRS are not observedas allowing spoofing.
We interpret the impact of the number of subscribers and prefixes in more detail.As these variables are influenced by the amount of announced IP space, we included 2interaction terms in the model. The coefficient of the interactive term (Adv. IPs(ln):#subs(ln)) is positive and statistically significant at .001 level. On the other hand, the in-teractive term (Adv. IPs(ln):Avg # prefixes)) is negative but also statistically significant at.01 level. This tells us that the coefficient of announced IPs depends on the value of sub-scribers and prefixes and vice versa; these estimated coefficients are conditional. It doesnot indicate anything, however, about the magnitude or statistical significance of theseconditional coefficients. To help understand the effects of this marginal coefficient, weplot in Figure 4.7 the relationship between the variables involved in both interactionterms.
−0.5
0.0
0.5
10.0 12.5 15.0 17.5Announced IP space (ln)
Est
imat
ed C
oeffi
cien
t for
Num
ber
of S
ubsc
riber
s
CI(Max − Min): [0.386, 1.49]
0.000
0.003
0.006
10.0 12.5 15.0 17.5Announced IP space (ln)
Est
imat
ed C
oeffi
cien
t for
Num
ber
of P
refix
es
CI(Max − Min): [−0.01, −0.002]
Figure 4.7: Interaction of Subscribers and Prefixes with the total number of IP addresses Announced by ISPs
The left plot in Figure 4.7 clearly shows that with increasing the announced IP space,the magnitude of the coefficient of the number of subscribers also increases, rangingfrom a -0.42 for the minimum number of announced IPs to 0.50 for the maximum num-ber of announced IPs. This means that when the number of IPs is lower than 450k (seethe intersecting point), an increase in the number of subscribers will lead to a decreasein the portion of non-compliant IP space. On the contrary, for those ISPs with more than450k advertised IPs, an increase in the number of subscribers would lead to an increaseof the portion of non-compliant IP space. For instance, for the ISP with the largest num-ber of advertised IP addressed, a 1% increase in the number of subscribers will increase

4.6. CHALLENGES IN THE ADOPTION OF SAV
4
59
the portion of spoofable IPs by 0.5%. The confidence intervals (see caption at the rightbottom corner of Figure 4.7) of the difference between the conditioned effects of the an-nounced IP space at the minimum and maximum values of the subscribers.
The second interaction term shows a negative relationship between conditional co-efficient of the announced IP space and the number of prefixes, i.e., increasing the an-nounced IP space, the magnitude of the coefficient of the number of prefixes decreases,ranging from a 0.05 for the minimum number of announced IPs to -0.0007 for the maxi-mum number of announced IPs. This means that when the number of IPs is larger than39 million, an increase in the number of prefixes will lead to a decrease of the portionof non-compliant IP space. On the contrary, for those ISPs with less than 39 million ad-vertised IPs, an increase in the number of prefixes will lead to an increase of the portionof non-compliant IP space. For instance, for the ISP with the largest number of adver-tised IP addressed, a 1% increase in the number of prefixes will increase the portion ofspoofable IPs by 5%. From our dataset, we have 242(96%) of ISPs that advertise less than39 million IPs.
In summary, we observe that network complexity plays a significant role in non-compliant IP space. Our interaction terms for the number of IPs announced with sub-scribers, and prefixes give us insights on the variability of policies for significantly largeISPs. From our security effort indicators, we found the number of amplifiers signifi-cant, which shows us that non-compliant ISPs are also part of the bigger ecosystem ofDDoS attacks since amplifiers are commonly used to redirect and amplify the spoofedIP packets. Other than the number of subscribers, we did not find the rest of the ISPcharacteristics significant.
Comparing this with institutional factors, ISPs that are in countries with better ICTinfrastructure are more compliant. We observe very few ISPs within MANRS, which isa positive sign. However, future work is needed to understand the role of MANRS forcompliance.
4.6. CHALLENGES IN THE ADOPTION OF SAVLack of SAV by network operators has been a concern for many years now. In a recentsurvey by RIPE NCC, the RIR for Europe, West Asia and the former USSR, 4,161 opera-tors responded that DDoS was the most significant security problem for them [3]. Eventhough ISPs acknowledge that DDoS is a considerable challenge, we still find evidence ofnon-compliance in part of the networks of 250 ISPs (73%). A key reason is the cost asso-ciated with the adoption and maintenance of SAV, while at the same time providing verylimited benefits for ISPs. Moving forward, we need to re-align the incentive structure ifwe want to see any uptick in compliance. In this section, we review some of the avail-able options and the role various actors can play to improve SAV compliance and reducethe number of hosts that can successfully send spoofed traffic and launch amplificationDDoS attacks.
4.6.1. REDUCING THE COST OF ADOPTION
One of the ways to persuade operators to comply is by reducing the cost of SAV adop-tion. Our empirical findings emphasize the importance of cost incentives for smaller

4
604. SAVING THE INTERNET: EXPLAINING THE ADOPTION OF SOURCE ADDRESS
VALIDATION BY INTERNET SERVICE PROVIDERS
providers. They have, on average, higher rates of non-compliant address space. Largerproviders benefit from the resources, non-compliance in their network can largely beattributed to limited incentives. However, it is challenging for smaller ISPs to configureSAV correctly for their network.
In the RIPE survey, 36% of the respondents suggested the best way RIPE can helpthem is by providing security-specific training programs. It is important to note here thatRIPE attracts participants from various businesses, including ISPs, hosting providers, ed-ucational networks, etc. The security issues they require help with do not necessarily allapply to ISPs. In another survey among 84 network operators, a vast majority of respon-dents reported that SAV is out of reach for them in terms of knowledge, planning, andtime need to maintain up-to-date access control lists (ACLs) for the implementation ofSAV [11].
There are multiple ways network operators can get support to implement SAV, in-cluding training engineers via industry communities like RIPE and Network Operators’Groups (NOGs). Another option is getting router vendors to providing SAV complianceas the default option [84]. Other areas in security have shown that better tools can alsoreduce the cost of adoption of new solutions. Notable examples include an RPKI prefixsigning tool by RIPE. It provides a simple web-based or API based interface for providersto sign prefixes [109]. Similarly, Let’s Encrypt, a non-profit certificate authority, hasplayed a significant role in improving HTTPS adoption after major browsers started flag-ging HTTP sites as insecure. It is currently serving over 180 million websites [110]. Oneof the key reasons for this success is open-source, free software with clear and concisedocumentation that requires few clicks or commands to configure a TLS certificate toserve HTTPS traffic.
A usable open-source tool for SAV implementation would have to accommodate thedynamic nature of Internet routing. Building such software is a challenging task, dueto complex routing policies based on the various needs and contractual relationshipsof ISPs. Moreover, the tool would be required to keep updated information about cus-tomers and network allocations to feed automated systems. Any mishap potentially dis-ruptive and cause downtime for customers. Unless thoroughly tested and backed bymajor players, it is highly unlikely that ISPs would use a tool that affects the backbone oftheir business.
Some other suggestions include decentralizing the BGP routing [111] or offloadingit to cloud where SAV implementation could benefit from economies of scale [112]. Re-cently, the University of Massachusetts Amherst has received a $1.2 million grant to de-velop and test “logically centralized interdomain routing architecture.” [112]. It is yet tobe seen how this solution will pan out and if Internet providers would trust cloud net-works to route their traffic. Another new direction is the emergence of reconfigurablenetworks [113]. The P4 programming language, in combination with supported hard-ware, would enable network operators to change the configuration of the connectedswitches without any downtime. It is still in its early days, and it is hard to predict ifoperators will end up adopting it.
All in all, some options to reduce cost are within reach, such as training via industryassociations, but substantial cost reductions would require some form of automation.This still seems infeasible in the short term.

4.6. CHALLENGES IN THE ADOPTION OF SAV
4
61
4.6.2. REDUCING INFORMATION ASYMMETRY
Another way to re-align the incentives is to reduce information asymmetry. In a recentdevelopment, Cloudflare launched a website isbgpsafeyet.com to reduce informationasymmetry on RPKI deployment. Participants can run a test to check if their ISP wouldaccept a legitimate route with an invalid announcement. If the test fails, it means theISP would likely accept a leaked or a hijacked route. The users are encouraged to tweetthe results to increase awareness, which might result in increasing pressure on ISPs toimplement RPKI.
CAIDA’s Spoofer project has been publishing lists of non-compliant and remediatedprefixes and ASes on its website. It sends updates to various network operators mailinglists making transparent which networks are not compliant and which networks remedi-ated. However, they do not present results at the level of ISPs, but at the level of ASes andprefixes, i.e., technical identifiers rather than actors. AS names might not even matchISP names in some cases. Furthermore, these results do not rank networks in terms ofcompliance. If there is a reputation effect or social proof nudge to be gained from mak-ing non-compliance and remediation more visible, then it would likely be more effectiveat the level of the ISP, since that is the actor who needs to be incentivized to remedi-ate. Similarly, ISPs that remediate non-compliant address space could be incentivizedby receiving recognition in the industry.
Moreover, after the launch of the ‘Is BGP safe yet’ website, network operator groups(NOGs) (e.g., [114]) are already discussing to add a social nudge to www.bcp38.info. Itis important to note that residential IP space provides an easily accessible vantage pointfor attackers to send spoof packets. If subscribers request their ISPs to be compliant, itwill offer them an incentive to deploy SAV. We propose creating a more visible list of ISPsand their degrees of compliance to be shared not only on the operator mailing list butalso with the users and on the website of the RIRs and perhaps with national CERTS.
4.6.3. INTERNALIZING EXTERNALITIES
A third option would be to internalize some of the external costs of non-compliance tothe ISP. One study suggested regulating government procurement to require all government-contracted network providers to adopt SAV [84]. Another route might be pressure fromother providers. They could, for example, require SAV to be implemented before enter-ing into a peering agreement. Upstream providers, commonly known as tier 1 or tier2 providers, hold a strong vantage point to observe SAV compliance, since they giveconnectivity to many ISPs. They can detect if ISPs are not filtering traffic, especiallywhen they are the only provider of that ISP [76]. There have been examples where up-stream providers have leveraged their position to achieve security improvements in BGProuting. Hurricane Electric and Portugal’s IPTelecom joined forces to cut off Bitcanalfrom the global Internet, after it had consistently observed to conduct BGP route hijack-ing [115]. The organization was later also removed by German Internet exchange DE-CIXand others in the routing ecosystem.
4.6.4. COMMUNITY ACTION TO REDUCE WEAK LINKS
We see no path towards overcoming the weakest-link problem, i.e., the fact that a sin-gle non-compliant provider would mean amplification DDoS attacks are still possible.

4
624. SAVING THE INTERNET: EXPLAINING THE ADOPTION OF SOURCE ADDRESS
VALIDATION BY INTERNET SERVICE PROVIDERS
Miscreants who want to conduct such attacks need only to rent hosts in these non-compliant networks. From there, they can reach all amplifiers with their spoofed pack-ets. That being said, the community of ISPs might reduce the number of such networksvia collective action. MANRS is a good example of this. We could not include MANRSin the regression model precisely because operators that signed MANRS are unlikelyto be observed in the tests of Spoofer and Open Resolver used in our study. In otherwords, participating in such an initiative does seem strongly correlated with SAV adop-tion. However, we did observe a small number of member ISPs (16 out of 250) with oneor more prefix being non-compliant. While MANRS promotes best-practices and helpswith running a healthy BGP environment, operators are not legally bound to implementany of the promoted policies.
Moreover, some pressure can be exerted by National CERTs and RIRs on ISPs to be-have more in line with community norms. We recently saw an example of the Amer-ican Registry for Internet Number (ARIN) banning Cogent, a large ISP, from accessingits WHOIS database for 6 months, after several ISPs complained that they had receivedunsolicited marketing calls from the Cogent’s sales team [116].
4.7. CONCLUSIONSWe have presented the first study to combine two independent techniques to measurethe state of SAV across networks. We used these measurements to estimate the extent towhich the population of 334 ISPs in 61 countries is not compliant with BCP38. A largeportion of them, 73% to be precise, has at least one prefix that allows IP spoofing. Whatportion of its IP address space is not compliant is influenced by network complexity, se-curity efforts, ISP characteristics and the institutional environment. As SAV adoptionsuffers from misaligned incentives, the main route forward seems to be to either reducethe cost of compliance for the providers or to increase the cost of non-compliance. Someof these forces seem to be at play, already, as a significant portion of the ISP populationhas in fact adopted SAV for all, or at least most, of its address space. Our study onlylooked at ISPs with at least one prefix that allows spoofing. We did not study the fac-tors that explain why some ISPs are, in fact, fully compliant. Future work might look atthat glass-half-full part of the picture and find factors apparently overrode the incentivemisalignment that has plagues SAV adoption for a long time now.

5DEPLOYMENT OF SOURCE
ADDRESS VALIDATION BY
NETWORK OPERATORS: ARANDOMIZED CONTROL TRIAL
IP spoofing, sending IP packets with a false source IP address, continues to be a primaryattack vector for large-scale Denial of Service attacks. To combat spoofing, various in-terventions have been tried to increase the adoption of source address validation (SAV)among network operators. How can SAV deployment be increased? In this work, weconduct the first randomized control trial to measure the effectiveness of various notifi-cation mechanisms on SAV deployment.
We include new treatments using nudges and channels, previously untested in no-tification experiments. Our design reveals a painful reality that contrasts with earlierobservational studies: none of the notification treatments significantly improved SAVdeployment compared to the control group. We explore the reasons for these findingsand report on a survey among operators to identify ways forward. A portion of the opera-tors indicate that they do plan to deploy SAV and ask for better notification mechanisms,training, and support materials for SAV implementation.
5.1. INTRODUCTIONDistributed Denial of Service (DDoS) attacks remain a significant challenge for networkoperators. In a 2019 survey by RIPE NCC of more than 4,000 participants, operatorsidentified DDoS as the most critical security problem [3]. Attacks keep increasing in size.In February 2020, Amazon web services received the largest DDoS attack observed todate, which peaked at approximately 2.3 Tbps and lasted three days [117]. IP spoofing—sending Internet Protocol (IP) packets with a false source IP address—continues to serve
63

5
645. DEPLOYMENT OF SOURCE ADDRESS VALIDATION BY NETWORK OPERATORS: A
RANDOMIZED CONTROL TRIAL
as a primary attack vector for large-scale DDoS attacks [118]. It is used in amplificationattacks, where an attacker forges the victim’s IP address in requests sent to systems thatact as amplifiers, such as DNS or Memcached servers. These systems reply with largerresponses than the request sent by the attacker, thereby congesting victim’s network orserver. IP spoofing is also used in SYN flood attacks, to obscure the origin of the attacktraffic.
The scourge of IP spoofing has Internet Hall of Fame technologist Paul Vixie [7] toobserve: ‘Nowhere in the basic architecture of the Internet is there a more hideous flawthan in the lack of enforcement of simple source-address validation (SAV) by most gate-ways.’ Over the last decade, a movement of sorts has emerged around a manifesto onrouting security [13]. It aims to remediate this problem by encouraging network op-erators to adopt a best current practice referred to as BCP38 [77]. BCP38—also moregenerally referred to as SAV—defines a method for routers to validate the source addressof every outgoing packet. A router should drop packets if the source address is not validfor the attachment point. Around 25-32% of the Autonomous Systems (ASes) tested byvolunteers of the Spoofer project are reported to have problematic or wholly lacking SAVadoption [84].
This brings us to our main question: How can more operators be moved to adoptSAV? Earlier work on other security issues found that operators do act on notificationsthat report vulnerabilities or abuse in their networks, albeit to varying degrees [119]–[122]. Specifically for SAV, researchers at the Spoofer project recently reported that noti-fying operators boosted remediation rates by about 50% [84]. Their findings were basedonly on observational data. The authors argued that “ideally” one would undertake A/Btesting to more reliably measure the effect of various interventions on remediation.
In this paper, we present the first randomized control trial (RCT, also called ‘A/B test’)for measuring the impact of notifications sent to 2,320 network operators on SAV reme-diation rates. This population is much larger than in any prior study on SAV. It is pos-sible because we use misconfigured open resolvers as vantage points [79], [123]—a dif-ferent technique to observe the lack of SAV adoption than the volunteer-based Spooferproject [9]. We include a control group in the design, which no earlier study on SAV didand which yields a crucial insight that puts the earlier findings in a different light: theimprovements that [84] observed might be incorrectly attributed to the interventions.
Our study is novel in other aspects as well. We contribute to the research on notifi-cation mechanisms by conducting the first test of social and reciprocity nudges in themessage design. In terms of channels, we test private messages to operators versus no-tifying national CERTs versus using geographically-organized Network Operator Group(NOG) mailing lists. Sending notifications to a public forum (NOG) has not before beentested in an experiment. Finally, we partnered with NIC.br, a leading Brazilian CERT, tohave them deliver the treatment first-hand. CERTs are a trusted partner in the opera-tor community and a critical player in the security notification ecosystem, yet it has notbeen measured if their notifications have more impact than those of researchers or secu-rity companies. We complement our experiment by a survey among operators, to helpus interpret the findings and identify ways forward. In short: we conduct the largest andmost rigorous study on improving SAV adoption to date, as well as advance the knowl-edge on notification mechanisms.

5.2. RELATED WORK
5
65
Our study reveals a painful and disappointing reality: there is no evidence of any re-mediation driven by any of the treatments, compared to the control group. This includestreatments that prior work has thought to be effective. Even for the notifications fromthe Brazilian CERT, the trusted entity, we found no effect compared to the control group.Importantly, we did observe some remediation across all groups, including the controlgroup. It might explain why [84] did report an impact of their notifications. Since theyhad no control group, they could not see that the remediation they measured was notactually driven by the intervention. All in all, our findings are sobering but important,if we are to correct our understanding of these interventions and move forward on thiscritical issue. Our survey among operators helps us identify how. In sum, we make thefollowing contributions:
• We present the first rigorous notification experiment with a control group that fo-cused on network operators as the primary population to be incentivized to adoptmore secure practices.
• We perform the first large-scale notification experiment to measure the impact ofsocial and reciprocity nudges in the notification messages, the use of a public fo-rum (NOG mailing lists), and a national CERT sending out the notifications. Noneof the treatments performed better than the control.
• We use a Cox mixed-effects model therneau2000cox to quantify the impact of net-work complexity factors and socio-technical country level effects on the deploy-ment of SAV. Our results show that smaller networks with fewer edge routers arelikely to implement SAV faster than larger networks.
• Our survey confirmed that notifying contacts registered in WHOIS does, in fact,mostly reach the operator staff responsible for implementing SAV. The reasonsthey give for not implementing it are a lack of time and technical expertise. Abouthalf of respondents do indicate that they plan to implement SAV in the future.To improve SAV adoption, the operators recommend better notification systems,training on SAV implementation and better supporting resources like software andtechnical documentation.
5.2. RELATED WORKIn this section we review the existing methods to infer the adoption of SAV among net-work operators, prior experiments that tested the effectiveness of security notifications,and literature on nudging.
5.2.1. METHODS TO INFER THE ADOPTION OF SAVPrevious work [9]–[11], [76], [80]–[82], [84], [124], [125] have proposed methods to detectnetworks that do or do not implement the SAV standard. They differ with respect to thedirection of filtering, whether they infer the presence or absence of SAV, and whether themeasurements can be performed remotely or from inside the network under test.
The Spoofer project [9], [80], [84], [125] develops and supports a client-server systembased on volunteers that run the client software from inside their networks. The client

5
665. DEPLOYMENT OF SOURCE ADDRESS VALIDATION BY NETWORK OPERATORS: A
RANDOMIZED CONTROL TRIAL
periodically sends and receives packets with spoofed source IP addresses to test if theSAV is deployed for both inbound and outbound traffic.
Lone et al. [76] described a remote method that relies on traceroute loops. When apacket is sent to a destination network with a routable but unallocated IP address space,it is forwarded back to the provider router, thus resulting in a loop. Such a packet shouldbe dropped by the provider router as the source IP does not belong to the customer net-work. The main limitation is that it relies on a routing misconfiguration, and thereforecoverage of the method is relatively small.
Müller et al. [10] and Lichtblau et al. [11] passively analyzed inter-domain traffic atlarge inter-connection points (IXPs) to detect networks not deploying SAV. However, theproposed methods need to overcome several challenges to be effective, such as analyz-ing noisy BGP data sources, AS relationship inference, and require collaboration withIXPs.
To detect the lack of SAV for outbound traffic, we implement a different method thatdoes not require volunteers for vantage points inside the tested network and that en-abled us to include a larger sample of operators in our study than prior work.
5.2.2. SECURITY NOTIFICATION EXPERIMENTS
There has been a rich stream of studies on the effectiveness of notifications to operatorsof networks, websites and DNS infrastructure. Cetin et al. [126] described how ISPs noti-fied and quarantined customers who were running devices that were vulnerable to beingabused in amplification DDoS attacks. They reported the quarantined users achievedvery high remediation rates, around 87%, even though these devices did not pose a riskto the users themselves and the users could easily exit the quarantine.
In another study, Kührer et al. [82] sent notifications to the network operators aboutopen resolvers, which provide amplification and redirection for DDoS attacks in theirnetwork. They were able to remediate 92% of the open NTP servers which supportedmonlist. They used various intermediaries, including national CERTs, Network Opera-tion Centers (NOCs), and notifications using the open NTP project. They, however, didnot compare the effectiveness of these channels.
Luckie et al. notified network operators who had not implemented SAV in their net-works [84]. They initially contacted them directly using email addresses listed in theWHOIS. Subsequently, they sent monthly emails to NOGs identifying ASes in a given re-gion with apparent gaps in SAV deployment. They observed around 48.2% of remedi-ation took at least 1 month to deploy. Furthermore, they reported NOG was twice aseffective as private notifications.
Our work comes closest to the study by Luckie et al. [84], since we also notify networkoperators who have not implemented SAV in their networks. However, their analysis ofthe impact of their interventions was based on observational data, not a randomizedcontrol trial. The lack of randomization and a control group makes causal inferencesabout the impact of notification on SAV deployment less reliable. Moreover, we alsotested the significance of interventions using nudges and the impact of sending notifi-cations through national CERTs on remediations. Another difference is that our studyis based on a much larger sample [79], [123]. Our technique to detect SAV via open re-solvers has two advantages over Spoofer data [84]: we find 10 times more providers that

5.3. METHODOLOGY
5
67
are not compliant (Oct 2020–Feb 2021) and we are not dependent on volunteers, so wecan reliable re-check the identified networks for remediation.
In summary, we present the first study using randomized control trial to measureeffectiveness of notifications on SAV remediations. We also tested the impact of socialand reciprocity nudges on compliance.
Notification Channels Previous studies have utilized various channels for reaching outto the network operators: the “abuse email” listed in the WHOIS database [127], physi-cal letters [119], [128], and manually collected email addresses, postal addresses, phonenumbers, and social media contacts [128]. Other studies used the authorized interme-diaries, such as national CERTs [79], [122], [129], or clearinghouses, to deliver the notifi-cations.
Max et al. [119] more than doubled the remediation rates for non-GDPR compliantwebsites (from 33.9% to 76.3%) by sending using physical letters instead of emails. De-spite the effectiveness, sending notifications via post costs time and money: Maass etal. [119] spent around 5,000 Euros on postage alone to notify 3,997 non GDPR compliantwebsites. On the other hand, sending email using WHOIS record also presents challenges.Previous studies have experienced a bounce rate of over 50% in some cases [130], [131].In our paper we prioritize contacts from peeringDB over WHOIS, where available. Weexplain this further in the methodology section.
5.2.3. BEHAVIORAL NUDGES
Behavioral science literature suggests that nudges and minor changes in the framing of amessage may lead to a higher compliance with a recommendation and drive the behav-ior change [132]–[134]. For example, in the security domain, previous studies have foundthat nudges are effective in motivating users to choose stronger passwords [135], updatesoftware [136], and make better online privacy and security choices [137]. Some com-mon nudges utilize social comparison, authority, and reciprocity mechanisms to influ-ence behavior. Specifically, social comparison raises normative behavioral expectationsby contrasting target individual’s behavior with the behavior of other people in their so-cial group [138], [139]. Making a request on behalf of authority is another persuasiontechnique leading to higher level of compliance than requests made by someone with-out authoritarian power [140]–[142]. Finally, in social psychology, reciprocity indicates asocial norm that encourages people to respond to a positive or kind action with anotherpositive or kind action [143]–[146]. For example, in the ‘repeated helping game’ partic-ipants were more likely to provide costly help to other participants if they had receivedsuch help from them in previous rounds [147], [148].
In our study, we leveraged social comparison, authority, and reciprocity mechanismsin attempt to improve the effectiveness of notifications and nudge network operators todeploy SAV.
5.3. METHODOLOGYWe first explain the forwarders-based method for identifying operators who did not im-plement SAV. We then describe the experimental treatments and random assignment

5
685. DEPLOYMENT OF SOURCE ADDRESS VALIDATION BY NETWORK OPERATORS: A
RANDOMIZED CONTROL TRIAL
method. Finally, we discuss the design of the post-RCT survey.
5.3.1. VULNERABILITY DISCOVERYTo identify networks that do not implement BCP38, we leverage a technique that usesmisbehaving forwarding open resolvers as vantage points. It was proposed by Mauch [85]and later implemented by Kührer et al. [82] and Lone et al. [123]. Figure 5.1 illustrates theidea of the method. A Scanner (controlled by us) with IP 192.0.2.32 sends a DNS queryto a misbehaving DNS Forwarder (with IP 203.0.113.54) to resolve the randomly gen-erated random.example.com subdomain (Figure 5.1a). When the Forwarder receivesthe DNS query, it does not rewrite the source IP with its IP before forwarding it to a Re-cursive Resolver (e.g., 8.8.8.8) located outside the network under test. If the networkhosting the vantage point has not deployed SAV, the forwarded query will reach the Re-cursive Resolver (Figure 5.1a: 2nd packet). The recursive resolver will perform a queryresolution and return the query response directly to the Scanner under our control. An-other possibility is that when the Forwarder receives a DNS query, it correctly rewritesthe source IP address with its IP address and then passes it to the Recursive Resolver(Figure 5.1b).However, the forwarder sends the response from the recursive resolver toour scanner without rewriting the source address (Figure 5.1b: 4th packet). If the net-work does not implement SAV at the network edge, it will arrive at our Scanner with aspoofed IP address belonging to the Recursive Resolver.
(3) 8.8.8.8
192.0.2.32 203.0.113.54
RecursiveResolver
8.8.8.8
(1) 192.0.2.32
(4) 8.8.8.8
(2) 203.0.113.54
(3) 8.8.8.8
192.0.2.32 203.0.113.54
RecursiveResolver
8.8.8.8
(1) 192.0.2.32
(2) 192.0.2.32
Scanner
Scanner
(a) Forwarder sends query to Recursive Resolver
without rewriting source address � 2nd packet
(b) Forwarder sends reply to Scanner
without rewriting source address � 4th packet
Forwarder
"vantage point"
Forwarder
"vantage point"
Figure 5.1: Methodology to infer absence of SAV using forwarding resolvers.
We performed Internet-wide forwarders-based scans of IPv4 space weekly betweenSeptember 2020 and February 2021 to identify misbehaving DNS resolvers in each routablenetwork. We mapped their IP addresses to their ASNs and inferred 2,433 ASes operatedby 2,320 providers in 118 countries had not at least partially deployed SAV for outboundspoofing. We also used the Maxmind GeoIP database [100] to map the IP address ofmisconfigured forwarders to their respective countries. Finally, we extracted contact ad-dresses of the ASes using peeringDB [149] and WHOIS [127]. We also identified the rele-

5.3. METHODOLOGY
5
69
vant national CERT for each country using the APIs from FIRST [150] and SEI [151] andvia manual search. The Spoofer project already sends notifications to NOG mailing lists.We utilized Spoofer’s NOG lists to map IP addresses in each country to the relevant NOGmailing list, if one was available.
The study population is network operators where we observed a lack of SAV with thetechnique explained above, which we operationalized as ASes with unique WHOIS con-tact email addresses. If two ASes had the same contact email address, we would assumethey belong to the same operator and collate them. So to put it differently: the studypopulation consists of 2320 unique WHOIS email addresses representing that number ofoperators.
Limitations of remediation tracking Our data set that observes IP spoofing via mis-configured forwarders presents a few challenges to infer remediation. If a vantage pointno longer shows up in our scan, this could mean the operator implemented SAV, but itcould also mean the vantage point (temporarily) disappeared for other reasons. Therecould be DHCP churn [152], which means the forwarder’s IP address changed, thoughthis will be to another address in the operator’s IP space. The user of the device couldalso switch it off. Or the operator could fix the misconfiguration, thereby making thedevice no longer send spoofed packets.
These factors mean that observations of spoofed traffic will appear and disappearalso when there is no change in the adoption of SAV. If we have multiple vantage pointsfor a network, then the impact of these measurement issues will be limited. Averagedacross all weekly measurement cycles, we have more than one vantage point in 73% ofall ASes. More importantly, the random assignment of our RCT design controls for thismeasurement problem. It will affect treatment groups and the control group more orless equally, meaning we can still reliably observe the impact of the treatments on reme-diation by looking at the difference among those groups.
To corroborate our findings on the presence or absence of SAV, we also included ad-vice in the notification to run the Spoofer client, which can more directly observe SAV.However, only a small number of operators appeared to have done so (see Section 5.4.4).While Spoofer is more reliable, it requires volunteers to run the test and has lower cover-age of networks than the open resolver-based method.
5.3.2. EXPERIMENTAL DESIGNTo explore the effectiveness of notifications, we designed a large-scale randomized con-trol trial (RCT) experiment. In an RCT, the subjects are randomly assigned to controland treatment groups. The effectiveness of the treatments are then assessed based onthe comparison of the remediation rate in each treatment group with the control group.If the treatment is significantly different than the control group, researchers can confi-dently conclude that the intervention was successful.
We designed eight experimental treatments along two dimensions: delivery channelsand message content. Figure 5.2 illustrates our experimental treatments, which we willnow describe in more detail.
In every treatment group, using the communications channel associated with thattreatment (see 5.3.2), we sent notifications about the discovered vulnerability and pro-
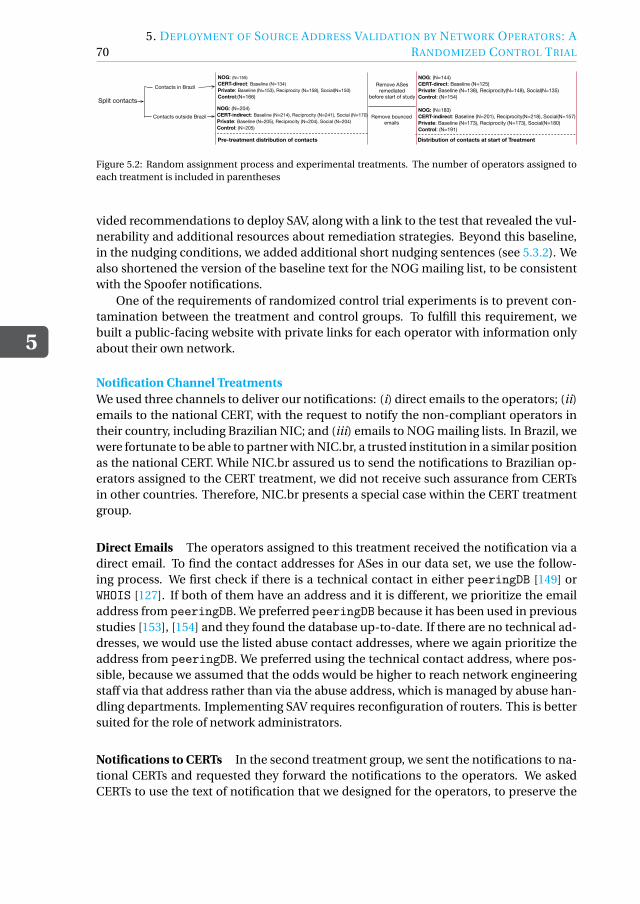
5
705. DEPLOYMENT OF SOURCE ADDRESS VALIDATION BY NETWORK OPERATORS: A
RANDOMIZED CONTROL TRIAL
Split contacts
Contacts in Brazil
Contacts outside Brazil
NOG: (N=144)CERT-direct: Baseline (N=125)Private: Baseline (N=138), Reciprocity(N=148), Social(N=135)Control: (N=154)
NOG: (N=183)CERT-indirect: Baseline (N=201), Reciprocity(N=218), Social(N=157)Private: Baseline (N=173), Reciprocity (N=173), Social(N=180)Control: (N=191)
Distribution of contacts at start of Treatment
NOG: (N=204)CERT-indirect: Baseline (N=214), Reciprocity (N=241), Social (N=170)Private: Baseline (N=205), Reciprocity (N=204), Social (N=204)Control: (N=205)
NOG: (N=155)CERT-direct: Baseline (N=134)Private: Baseline (N=153), Reciprocity (N=158), Social(N=150)Control:(N=166)
Pre-treatment distribution of contacts
Remove bounced emails
Remove ASes remediated
before start of study
Figure 5.2: Random assignment process and experimental treatments. The number of operators assigned toeach treatment is included in parentheses
vided recommendations to deploy SAV, along with a link to the test that revealed the vul-nerability and additional resources about remediation strategies. Beyond this baseline,in the nudging conditions, we added additional short nudging sentences (see 5.3.2). Wealso shortened the version of the baseline text for the NOG mailing list, to be consistentwith the Spoofer notifications.
One of the requirements of randomized control trial experiments is to prevent con-tamination between the treatment and control groups. To fulfill this requirement, webuilt a public-facing website with private links for each operator with information onlyabout their own network.
Notification Channel TreatmentsWe used three channels to deliver our notifications: (i) direct emails to the operators; (ii)emails to the national CERT, with the request to notify the non-compliant operators intheir country, including Brazilian NIC; and (iii) emails to NOG mailing lists. In Brazil, wewere fortunate to be able to partner with NIC.br, a trusted institution in a similar positionas the national CERT. While NIC.br assured us to send the notifications to Brazilian op-erators assigned to the CERT treatment, we did not receive such assurance from CERTsin other countries. Therefore, NIC.br presents a special case within the CERT treatmentgroup.
Direct Emails The operators assigned to this treatment received the notification via adirect email. To find the contact addresses for ASes in our data set, we use the follow-ing process. We first check if there is a technical contact in either peeringDB [149] orWHOIS [127]. If both of them have an address and it is different, we prioritize the emailaddress from peeringDB. We preferred peeringDB because it has been used in previousstudies [153], [154] and they found the database up-to-date. If there are no technical ad-dresses, we would use the listed abuse contact addresses, where we again prioritize theaddress from peeringDB. We preferred using the technical contact address, where pos-sible, because we assumed that the odds would be higher to reach network engineeringstaff via that address rather than via the abuse address, which is managed by abuse han-dling departments. Implementing SAV requires reconfiguration of routers. This is bettersuited for the role of network administrators.
Notifications to CERTs In the second treatment group, we sent the notifications to na-tional CERTs and requested they forward the notifications to the operators. We askedCERTs to use the text of notification that we designed for the operators, to preserve the

5.3. METHODOLOGY
5
71
consistency of the notifications across groups (see Appendix A.1). Since this channel isindirect, it requires the cooperation of CERTs to forward our message to the relevant net-work operators. We have no way of ensuring that the messages were actually forwarded.This treatment leverages the CERT’s role and reputation (or authority, as discussed inSection 5.2.3), so we can empirically measure whether they fulfill this role. We hypothe-size that operators are more likely to take action if they receive a notification from CERTcompared to an email from university researchers.
Notifications Directly from CERT As we explained earlier, we partnered with NIC.br,a trusted CERT entity in the Brazilian operator community that routinely sends notifica-tions about vulnerabilities to operators. This allowed us to set up a separate treatmentwhere the CERT itself would issue the notifications. In contrast to the CERT treatmentoutside Brazil, the messages in the Brazilian CERT treatment would be directly sent byNIC.br, in Portuguese, and from their official email address. We hypothesized that thenotifications are more likely to have impact if they come from an entity trusted by thenetwork operator community. This allowed us to perform the first experimental testwhether messages from CERTs, a critical player in the security ecosystem, have more im-pact than those of researchers. (An earlier study [129] also sent notifications to CERTs,but these were meant to be forwarded by the CERTs to the final recipients, the same asin our ‘notifications to CERT’ channel (b). The researchers could not ascertain if theCERTs actually forwarded the notifications.) To limit the effort required from NIC.br, weasked them to conduct only one treatment. This is consistent with how we approachedall other CERTs: each received only a single treatment and a single message to forwardto operators. Different CERTs were assigned to different treatments.
Notifications to NOGs In the third group, we bundled our notification with the Spoofernotifications sent by the NOG lists. The Spoofer project measures the absence of SAV us-ing a client-server application [84]. The project has been sending monthly emails sinceDec 2018. The operators are used to these messages and already know that it is aboutmissing SAV. In terms of what operators are covered by either data set, the Spoofer datahas minimal overlap with our open-resolver data. We discuss the comparison in moredetail in the section 5.4.4.
The advantage of bundling the notifications and combining the measurements isthat it saves network operators from receiving multiple emails about the same problem.Moreover, we hypothesize that publicly identifying the ASes on NOG mailing list wouldencourage them to deploy SAV more than when they receive this message through a pri-vate channel.
Nudging TreatmentsIn the CERT and private-email treatment groups, we differentiated our messages by in-corporating specific nudges aiming at further motivating network operators to imple-ment SAV. We created three conditions in each group: (i) the baseline message, whichonly contained the guidelines for the operators to understand the issue and how to fixit; (ii) the baseline message plus a social nudge; and (iii) the baseline message plus areciprocity nudge. The full text of notifications is included in Appendix A.1.

5
725. DEPLOYMENT OF SOURCE ADDRESS VALIDATION BY NETWORK OPERATORS: A
RANDOMIZED CONTROL TRIAL
In the social nudge condition, we urged the operators to deploy SAV and pointed outthat most providers have already done so. To this purpose, we added following text tothe content of the notification: “Note that 75% of network operators in the world alreadydeploy BCP38 in their networks. Deploy BCP38 in your network to become one of them.”
In the reciprocity condition, we asked the providers to return the favor to operatorswho did implement SAV, thus reducing the attacks on everyone else, including the recip-ient. We added the following text to the baseline message: “Note that your network isreceiving fewer DDoS attacks because other networks have deployed BCP38. Return thefavor - deploy BCP38 in your network to make the Internet more secure.”
We chose encouraging (positive) framing of the nudges to the providers, rather than‘naming and shaming’ (negative), because positive framing has been shown more effec-tive in driving behavior change than negative framing [155]–[157].
Treatment Group AssignmentWe use the data on the operators who lack SAV from October 2020 and randomly as-sign them—or more precisely, the unique WHOIS contact addresses for the ASes—to theexperimental groups. We first separate the population in Brazilian and non-Brazilianoperators (Figure 5.2). The special Brazilian CERT treatment meant we needed to ran-domly assign the Brazilian operators separately from the rest of the world. Then in bothbranches, we randomly assigned each operator to a treatment or control group. We hadfive treatment groups and one control group for the Brazilian sample, and seven treat-ment groups and one control group outside of Brazil. The treatments are the same, ex-cept for the CERT group, which outside of Brazil includes two additional treatments forthe social nudges. In total, we apply eight different treatments.
We had to modify the assignment process since CERT and NOG treatments operateat country-level: instead of assigning the operator contacts, we assign a country to atreatment group. The process becomes complicated since we want to have a balancedpopulation across treatments, and the number of operators in each country is not thesame. We designed our solution based on a best-effort algorithm to distribute contactsamong different groups. We run the algorithm separately for contacts in Brazil and con-tacts in other countries. In each assignment, our random algorithm first validates if itcan assign the contact to the treatment group. This is not always the case for the CERTand NOG treatments. For a few countries we have no contact point for a national CERTor for a NOG mailing list. If, for a specific operator, we have no CERT or NOG mailing listin our data set, the algorithm randomly selects another operator.
Under some conditions, the randomization could lead to unbalanced assignments.Stratification would then be used to ensure balanced treatment groups. However, method-ological studies [158] have shown that in moderate and large samples, like ours, randomassignment and stratification achieve similar variances. Furthermore, we checked vari-ous network and economic factors after the assignment to determine if the groups werein fact balanced. We statistically tested the group differences using ANOVA for: aver-age AS size (i.e., number of IPv4 addresses calculated using longest matching prefixesin BGP announcement per AS), number of misconfigured forwarders, number of coun-tries, number of stub ASes, membership of MANRS, Gross Domestic Product, and ICTDevelopment Index assigned to each group. We found no statistical difference betweenthe groups, which means they were similar for these variables.
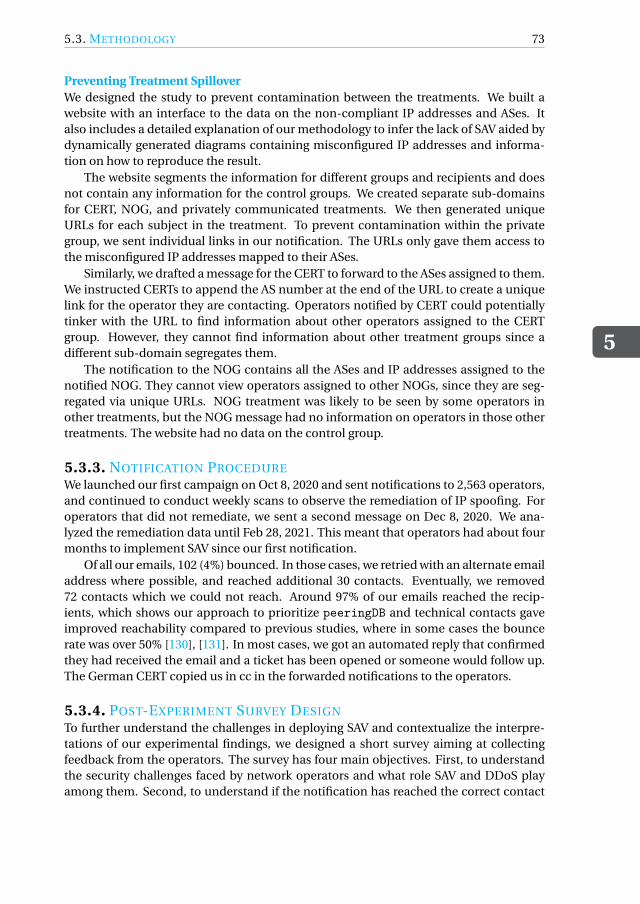
5.3. METHODOLOGY
5
73
Preventing Treatment SpilloverWe designed the study to prevent contamination between the treatments. We built awebsite with an interface to the data on the non-compliant IP addresses and ASes. Italso includes a detailed explanation of our methodology to infer the lack of SAV aided bydynamically generated diagrams containing misconfigured IP addresses and informa-tion on how to reproduce the result.
The website segments the information for different groups and recipients and doesnot contain any information for the control groups. We created separate sub-domainsfor CERT, NOG, and privately communicated treatments. We then generated uniqueURLs for each subject in the treatment. To prevent contamination within the privategroup, we sent individual links in our notification. The URLs only gave them access tothe misconfigured IP addresses mapped to their ASes.
Similarly, we drafted a message for the CERT to forward to the ASes assigned to them.We instructed CERTs to append the AS number at the end of the URL to create a uniquelink for the operator they are contacting. Operators notified by CERT could potentiallytinker with the URL to find information about other operators assigned to the CERTgroup. However, they cannot find information about other treatment groups since adifferent sub-domain segregates them.
The notification to the NOG contains all the ASes and IP addresses assigned to thenotified NOG. They cannot view operators assigned to other NOGs, since they are seg-regated via unique URLs. NOG treatment was likely to be seen by some operators inother treatments, but the NOG message had no information on operators in those othertreatments. The website had no data on the control group.
5.3.3. NOTIFICATION PROCEDUREWe launched our first campaign on Oct 8, 2020 and sent notifications to 2,563 operators,and continued to conduct weekly scans to observe the remediation of IP spoofing. Foroperators that did not remediate, we sent a second message on Dec 8, 2020. We ana-lyzed the remediation data until Feb 28, 2021. This meant that operators had about fourmonths to implement SAV since our first notification.
Of all our emails, 102 (4%) bounced. In those cases, we retried with an alternate emailaddress where possible, and reached additional 30 contacts. Eventually, we removed72 contacts which we could not reach. Around 97% of our emails reached the recip-ients, which shows our approach to prioritize peeringDB and technical contacts gaveimproved reachability compared to previous studies, where in some cases the bouncerate was over 50% [130], [131]. In most cases, we got an automated reply that confirmedthey had received the email and a ticket has been opened or someone would follow up.The German CERT copied us in cc in the forwarded notifications to the operators.
5.3.4. POST-EXPERIMENT SURVEY DESIGNTo further understand the challenges in deploying SAV and contextualize the interpre-tations of our experimental findings, we designed a short survey aiming at collectingfeedback from the operators. The survey has four main objectives. First, to understandthe security challenges faced by network operators and what role SAV and DDoS playamong them. Second, to understand if the notification has reached the correct contact

5
745. DEPLOYMENT OF SOURCE ADDRESS VALIDATION BY NETWORK OPERATORS: A
RANDOMIZED CONTROL TRIAL
person and preferable method for providers to receive similar notifications. Third, tounderstand the challenges in implementing SAV and whether the content of our noti-fications and referenced resources were sufficient for operators to deploy SAV in theirnetwork. Finally, we wanted to solicit suggestions on how to improve the notificationprocess in general. Our survey was partially inspired by Lichtblau et al. [11], who in 2017surveyed network operators about the impact of spoofing on their network, their filter-ing strategies, and challenges in the adoption of SAV.
In the survey, we asked participants about four main topics: 1) what security issuesthey believe their networks have, and how they discover them; 2)whether they have im-plemented or have planned to implement SAV and a subsequent question on their cho-sen methodology to deploy filtering from operators with SAV 3) who is responsible forimplementing SAV in their organization, and whether the issue was escalated to the re-sponsible entity; 4) whether MANRS guidelines provide sufficient information on howto implement SAV, what other strategies can help achieve better compliance, and howwould network operators prefer to be notified about IP spoofing issues. The full ques-tionnaire is included in Appendix A.2. As compensation for their valuable time and com-ments, we offered all respondents a 50 Euro gift card through a raffle with a 1:15 chanceof winning. Participants were offered an option to stay anonymous and let us donate theprize to a charity.
5.3.5. ETHICS
We had a detailed discussion with the university’s IRB and received clearance to conductthe notification experiment and the survey. Our study followed all the active monitor-ing guidelines for ethical network measurement research [159], including creating a webpage running at the IP address of the scanner, communicating with Internet responseteams, and providing an opt-out option for operators.
We conducted our own scans since there is no existing public dataset that revealsnon-compliance for SAV using our methodology. It is important to note that our scansare different from scans that aim to detect open resolvers, since we track responses thatarrive from a different source IP address than the probed address. This means we cannotuse existing data from open resolver scans conducted by Shadowserver and others. Werandomly distributed our queries across the IPv4 address space, so the scanner doesnot consistently query the same AS before moving on to the next one. Furthermore, inline with the Menlo report [160], we considered that the marginal negative impacts ofthese measurements are outweighed by the beneficence of improved SAV adoption andreduced spoofed attack traffic.
We only received two requests to opt-out and we immediately removed their IP rangesfrom the study. The content of the notification has a positive framing as we wanted toencourage the providers to deploy SAV. So even in public notifications (NOG), we did not‘shame’ them for not implementing SAV.
Finally, we asked for consent from providers at the start of the survey and explainedto them that we will anonymize their responses before publishing them. We offered com-pensation in the form of a lottery with gift cards. If they did not want to receive gift cardsdue to the nature of the job or for any other reason, we gave them an option to donatethe amount to a charity and stay anonymous.

5.4. RESULTS
5
75
+ + +
++
+
+ +
+ ++
++ + +
+
++ +
+
+ + + + + +
+
++ +
+
++ +
+ +
+
+
+
+ +
+
+
++ + +
+
+ ++
+ +
++ +
++ +
+
+ +
+
++ + + + ++
+ +
++
+ +
World (excl. Brazil) Brazil
0 50 100 150 0 50 100 150
0.00
0.25
0.50
0.75
1.00
Time in days
Sur
viva
l pro
babi
lity
++
++
++
++
CERT BaselineCERT Reciprocity
CERT SocialControl
NOGPrivate Baseline
Private ReciprocityPrivate Social
Figure 5.3: Contact remediation survival plots for organizations in World excl. Brazil (left) and in Brazil (right).
5.4. RESULTSIn this section, we analyze the impact of our notifications on remediation rates acrossdifferent treatment groups. We start by examining remediation at three different levels:organization, AS, and prefix level. Then, we compare the remediation rates betweenCERTs and NOGs.
5.4.1. ORGANIZATION-LEVEL REMEDIATION
We start the analysis at the organizational level. Organizations can operate multiple ASesand while the SAV compliance can differ per AS, the decision to implement SAV can bedriven by organizational policies. Therefore, we bundled the ASes with the same contactemail address together as they are most likely sibling ASes under the same administrativedomain. Thus our unit of analysis is contact email addresses for the ASes. Our data setcontains 200 (8.6%) contacts with more than one AS registered in WHOIS.
We only consider remediation as successful if all ASes under the contact email ad-dress do not appear in our scans after we have notified them. It is a high bar to passsince it might miss partial compliance, where providers might be remediating some ASesin their network or just a part of their AS.
To understand the differences across the groups, we compute the Kaplan-Meier sur-vival curves per group as shown in Figure 5.3. On the y-axis, we have the probability ofan organization deploying SAV t days after they received the notification (x-axis). Thisis estimated taking into account the number of organizations that had deployed SAV attime t divided by the total number of organizations that had not deployed SAV at time t .Overall, the survival curves show the same downwards trend for all the groups includingthe control. In Brazil, the NOG and Private Social groups do slightly better: they remedi-ated 10% and 6% more than the control group, respectively. In the rest of the countries,networks in the NOG group remediated 5% more than in the control group.

5
765. DEPLOYMENT OF SOURCE ADDRESS VALIDATION BY NETWORK OPERATORS: A
RANDOMIZED CONTROL TRIAL
CERT Social Control NOG Prvt. Baseline Prvt. Reciprocity Prvt. Social0
20
40
60
80
100
Perc
ent R
emed
iate
d
Figure 5.4: Remediation per treatment group for countries that also received a notification in CERT Socialgroup.
To check whether these differences in remediation rates are statistically significant,we ran the log-rank test comparing the survival curves of the control group with thetreatments. It tests the null hypothesis H0 : S1(t ) = S2(t ) for all t where the two exposureshave survival functions S1(t ) and S2(t ). We consider (≤ 0.05) as statistically significant.Confirming our initial visual observations, most of the groups did not have significantlydifferent remediation rates. Only the result for the NOG group in Brazil is weakly statis-tically significant (p = 0.049). However, in light of how many treatments we tested, a 1 in20 probability of this outcome being due to chance, is actually quite plausible. So we donot see this as enough evidence of an impact of that treatment group.
For all countries except Brazil, we also observed the CERT Social group remediatedslightly slower (p = 0.043) than the control group. To understand why the CERT Socialgroup remediated slower than the control group, we investigated the distribution of or-ganizations at the start of our analysis in Figure 5.2. There are 34 (17.8%) fewer contactsin the CERT Social group than in the control. Hence, the baseline probability of remedia-tion is also lower. Some network operators might have upgraded their routers or policies,which we count as baseline, or natural, remediation. In Figure 5.4, we compare remedi-ation in the CERT Social group with other groups. We observe that remediation for con-tacts in the CERT Social group is similar to the control, NOG, and Private Social groups.Moreover, the average remediation in the CERT Social group is around 54%, while the av-erage is only slightly higher for the rest of the countries (58%). In short, we can concludethat remediation in the CERT Social group is worse than in the control group mainly dueto sampling differences.
5.4.2. PARTIAL REMEDIATION
An organization can choose to implement SAV for a few ASes but not for all the ASes theyoperate. Multiple ASes could also be managed by different teams, especially if these arelocated in different countries. Similarly, due to technical reasons like ASes not being stubor multihomed networks, operators might not be able to implement SAV in their entirenetwork. To further investigate this, we analyzed partial remediation measured as the

5.4. RESULTS
5
77
+
++
+
+ +
+ + ++
++
+ +
+ + +
+ + + + + +
++
+ ++
+ + +
+
+ ++
+ +
+
+
++ + +
+
++
++ +
++ +
++ +
+
+ +
+
++ + + + +
++
+ +
++
+ +
World (excl. Brazil) Brazil
0 50 100 150 0 50 100 150
0.00
0.25
0.50
0.75
1.00
Time in days
Sur
viva
l pro
babi
lity
++
++
++
++
CERT BaselineCERT Reciprocity
CERT SocialControl
NOGPrivate Baseline
Private ReciprocityPrivate Social
Figure 5.5: AS remediation survival plots for ASes in the World excluding Brazil (left) and in Brazil (right).
number of ASes and prefixes within an organization that implemented SAV within thestudy period.
AS-level remediation: Figure 5.5 shows the survival curves using ASes as unit ofanalysis. The results are almost identical to the organization-level results. The globalremediation rates are not significantly different between the treatments and the controlgroup. Only the ASes in NOG group in Brazil remediate significantly faster than the con-trol group (p = 0.05).
Prefix-level remediation: Remediation can also occur at the prefix level, having bothSAV compliant and non-compliant prefixes within the same AS. Figure 5.6 shows thesurvival curves of remediation using BGP prefixes as unit of analysis. Similar to both theorganization- and AS-level remediation, we observe no significant difference betweenthe groups. Again, the only exception is the NOG group which remediated slightly fasterthan the rest of the groups.
5.4.3. MAIN EXPERIMENTAL EFFECTSIn this section, we analyze the differences in remediation rates across different experi-mental groups. We use relative risk ratio (RR) as a descriptive statistic to measure theprobability of deploying SAV in one group compared to the probability of deploying SAVin the other group.
IMPACT OF THE CERTS GROUPS
We further compared the remediation across the CERT groups. Our motivation was toexplore if there are significant differences between national CERTs. We calculate relativerisk ratio between each pair of CERTs. In simple terms, this ratio produces a factor bywhich one CERT is different from the other in terms of remediation rate.
Figure 5.7 only displays the countries for which risk ratios—the differences in remediation—were significant. We determine the significance by looking at the confidence intervals

5
785. DEPLOYMENT OF SOURCE ADDRESS VALIDATION BY NETWORK OPERATORS: A
RANDOMIZED CONTROL TRIAL
+
++ +
+ +
+
+ +
+ ++
+ +
+
++ + +
++ + + +
+
+ + +
+ + + +
+
+
+ +
+
++ + +
+
++
++ +
++ +
++
+
+ +
++
+ ++ + ++
+ +
+ +
+ +
World (excl. Brazil) Brazil
0 50 100 150 0 50 100 150
0.00
0.25
0.50
0.75
1.00
Time in days
Sur
viva
l pro
babi
lity
++
++
++
++
CERT BaselineCERT Reciprocity
CERT SocialControl
NOGPrivate Baseline
Private ReciprocityPrivate Social
Figure 5.6: Prefix remediation survival plots for World excluding Brazil (left) and in Brazil (right).
(CI). If the CI includes the value 1, the RR is not statistically significant. If CI contain 1,it would mean that the relative remediations have no difference [161]. We interpret thefigure row-wise for each national CERT. For instance, France had 4.2 times higher reme-diation rate than Argentina. In our sample, only networks in France, Iran, Iraq, and theNetherlands assigned to the CERT group were more likely to remediate than the othercountries.
IMPACT OF THE NOG GROUP
We also calculated the relative risk ratios between the countries assigned to a NOG exper-imental group. Figure 5.8 only shows the countries that significant differ in remediation.We used the confidence intervals to determine the significance as explained earlier. Ger-many, France and Lebanon NOG’s were more likely to remediate than other countriesoutside of Brazil in our sample. The RR for Brazilian NOG did not have any significantvalue, which in other words means that ASes in Brazilian NOG did not remediate morethan other countries.
IMPACT OF NUDGES ON REMEDIATION
We explore the effectiveness of adding social and reciprocity nudges to the baseline textof notifications on remediation rates. We aggregate data for each of the nudging condi-tions (baseline, social, and reciprocity) from the different treatment groups and comparethem against the control group. In Table 5.1, we show the relative risk of remediationwith reference to the control group. All of the nudges have a relative risk of around onecompared to the control, which shows the nudges did not significantly impact remedia-tion. In other words, operators that received the notification with a nudge were as likelyto remediate as operators in the control group.

5.4. RESULTS
5
79
AR BR CN CZ ES FR IN IQ IR IT NL PL RU UA US
ARBRCNCZESFRINIQIRIT
NLPLRUUAUS
1
2
3
4
5
6
7
8
Figure 5.7: Relative risk ratios among countries in the CERT group. Only the countries with significant riskratios are displayed.
Table 5.1: Risk Ratios for nudging conditions compared to the control group
Group Remediated Exposed RR CI
Control 112 345 - -Baseline (no nudge) 206 637 0.99 0.82-1.2Reciprocity nudge 175 539 1 0.82-1.22Social nudge 150 472 0.97 0.80-1.19
5.4.4. COMPARISON WITH SPOOFER
We requested operators to run the Spoofer tool [84] to validate if they have correctly de-ployed SAV. A total of 1,670 ASes submitted tests using the Spoofer tool in the study pe-riod (Oct 2019 - Feb 2021). While we cannot know if our request caused the operators touse Spoofer tool, the overlap between the ASes from the Spoofer tool and our methodol-ogy is around 12% (296 ASes). It signifies that our experiment did not get contaminatedbecause of the Spoofer project. Note that the Spoofer project sends monthly notifica-tions to NOG lists and often gets presented at conferences. MANRS also recommendsusing the Spoofer tool to test SAV deployment [162].
We also analyzed the remediations reported by the Spoofer tool [84]. In total acrossall Spoofer measurements, 98 ASes in Spoofer data implemented SAV in their networkduring our study period (Oct 2020 - Feb 2021). Of these, 22 ASes overlap with our mea-surements and 5 of them are in the control group. Since we did not send notificationsto the control group, this clearly demonstrates that there is some natural remediationoccuring. It is important to note that we sent notifications to 2,563 ASes which had notdeployed SAV, while during the study period, the Spoofer dataset revealed only 248 ASeswithout SAV.
We can conclude from these results that there is limited evidence that operatorsacted upon our notifications. Moreover, positive remediation rates in the control groupsignals that factors other than our interventions influenced SAV as well.

5
805. DEPLOYMENT OF SOURCE ADDRESS VALIDATION BY NETWORK OPERATORS: A
RANDOMIZED CONTROL TRIAL
AR BD BR CA DE FR ID IN IQ LB US
ARBD
BRCA
DEFR
IDIN
IQLB
US
1
2
3
4
5
6
7
8
9
Figure 5.8: Relative risk ratios among countries in the NOG group.
5.5. FACTORS AFFECTING REMEDIATION RATESMultiple factors could have affected remediation rates. Such factors could range fromthe size and complexity of the network, to the lack of budget and/or expertise. In thissection we first identify potential factors that might have an impact on SAV implemen-tation rates, and then quantify this impact through regression analysis.
In response to our notifications, three operators requested additional guidance orinformation. For instance, one operator claimed that his network was fully compliant.However, in further discussion, with the evidence from the measurements, he acknowl-edged that part of his network was recently upgraded and was not compliant. The op-erator subsequently implemented SAV in the network and did not reappear in our mea-surements. Other operators showed signs they lacked SAV knowledge. For example, twooperators did not fully understand our measurement methodology and thought that wewere notifying them about open-resolvers in their networks. We responded with a de-tailed explanation of our methodology. We did not receive further responses.
This anecdotal evidence suggests that lack of information or knowledge could haveinfluenced the operators’ decisions to not implement SAV in their networks. There couldalso be socio-technical reasons for non-compliance, such as operators in countries withlow GDP based on Purchasing Power Parity(PPP), lower Internet penetration, and limitedlearning opportunities. To further understand the impact of these factors, we built aCox proportional hazards model with mixed effects. At the multivariate level of analysis,we performed a two-level Cox proportional regression analysis to examine the effectsof AS- and country-level characteristics on SAV implementation rate, and to determinethe extent to which characteristics at the AS and country levels explain variations in SAVimplementation rates. The multi-level Cox proportional hazards model allowed us toaccount for the hierarchical structure of the data. We hypothesize that ASes are nestedwithin countries with different socio-economic characteristics. This suggests that ASeswith similar characteristics can have different SAV implementation rates when operatingin countries with different characteristics.
Using the multi-level Cox proportional hazards model, the probability of implement-

5.5. FACTORS AFFECTING REMEDIATION RATES
5
81
ing SAV after receiving the notification was regarded as the hazard. We assessed the as-sumption of proportional hazard using visual inspections of graphs and statistical testsbased on weighted Schoenfeld residuals. Two-sided p-values (≤ 0.05) indicated statis-tical significance. As explanatory variables we used socio-technical factors and a set offactors derived from the operators’ email responses, including the following:
CERT : boolean variable. True if the notification was sent to the national CERT, Falseotherwise.
NOG: boolean variable. True if the notification was sent to the NOG, False other-wise.
Private: boolean variable. True if the notification was sent to the technical contactemail address of the AS, False otherwise.
AS size: numerical variable. We estimated the size of an AS by counting the numberof advertised IPv4 addresses. We calculated the size using BGP data from Routeviewsproject [99]. We used weekly data for Oct 2020 and calculated the average IP space ad-vertised by the ASes in our data set.
ISP: boolean variable. True if the AS belonged to an Internet Service Provider, Falseotherwise. To check whether an AS is used by an ISP we leveraged Telegeography: theGlobalComms database [94]. The database contains a highly reliable overview of themain broadband ISPs in each country, drawn from annual reports and market filings.The database contains details of major ISPs in 84 countries.
Edge Rtr: numerical variable. This variable is calculated by counting the numberof edge routers of an AS. We used CAIDA’s Internet Topology Data Kit (ITDK) for March2021 [163] to count the number of border routers per AS. The ITDK consists of routersand links observed in traceroute data collected from multiple vantage points, alias res-olution to identify which IP addresses belong to the same router [164], and a mappingfrom router to AS heuristically inferred using bdrmapIT [165]. We counted the numberof border routers for ASes in our dataset connected to other ASes.
Stub: boolean variable. True if the AS is stub, False otherwise. We used Caida’s ASrelationship data [166] to determine if the ASes in our data set are stub or not.
IDI : numerical variable. This variable represents the ICT Development Index (IDI)which is provided by ITU (United Nations International Telecommunication Union) andrepresents ICT development per country [95]. It assigns values from 1 to 10 to each coun-try, with a higher value representing a higher level of development based on various ICTindicators.
In Table 5.2, we present the results from the Cox model. The parameter estimatesreported in the est column are log-hazard ratios. Their exponentiation produces hazardratios. P-values indicate the statistical significance of each factor.
The notification channels did not impact significantly the implementation of SAV.Interestingly, only the NOG group has a positive coefficient which indicates that ASesthat received a notification via this channel have higher probability of remediating thanthose in the control group. In particular, the hazard ratio for the NOG group is exp(0.23)= 1.25. Therefore, notifying operators via NOG increases the probability of remediationby 1.25 times compared to ASes that received no notification.
Regarding the impact of AS size on SAV deployment, the argument can be made onboth sides. For instance, bigger networks are more likely to have more resources to im-

5
825. DEPLOYMENT OF SOURCE ADDRESS VALIDATION BY NETWORK OPERATORS: A
RANDOMIZED CONTROL TRIAL
Table 5.2: Cox mixed-effects model with random effects for countries.
Parameter Est Std.err P-value CI
Fixed effectsCERT -0.06 0.12 0.60 [-0.29; 0.16]NOG 0.23 0.13 0.07 [-0.02;0.48]Private -0.02 0.11 0.85 [-0.23;0.19]ASsize(ln) -0.06 0.03 0.02 [-0.11;-0.01]ISP 0.12 0.17 0.48 [-0.21;0.44]Edge Rtr(ln) -0.05 0.02 0.00 [-0.08;-0.01]Stubs 0.33 0.10 0.00 [0.13;0.54]IDI -0.05 0.03 0.15 [-0.11;0.02]Random effectsGroup Variable Std Dev VarianceCountries Intercept 0.217 0.04
plement SAV. On the other hand, smaller networks are likely to have less complex net-works and hence require relatively simpler configurations to implement SAV. In our re-sults, we observe that smaller ASes were more likely to implement SAV in their networks.In particular, a 10% increase in the size of an AS, holding all other variables constant, wasassociated with a 5.82% decrease in the probability of SAV deployment.
The number of edge routers also decreases the probability of remediation. Networkoperators use multiple links to load-balance the traffic and avoid a single point of failure.To remediate, operators have to implement filtering policies near all edge routers. Wefound that networks with fewer edge routers were more likely to remediate after beingnotified. In particular, a 10% increase in the number of edge routers in an AS, holding allother variables constant, was associated with a 4.87% decrease in the probability of SAVdeployment.
There could be technical reasons preventing network operators from implementingSAV in their network. One factor could be having a non-stub or a transit AS. A customerof non-stub AS might not announce all routes to a provider because the AS is a customerof other providers as well. Hence, it is not technically feasible for provider ASes to ap-ply strict filtering policies on their network [77]. We find that stub networks have 1.4times higher remediation rate than the control group (holding all other variables con-stant). The country-level effect, an estimated intercept (excess risk) for each country,has a standard deviation of 0.21. This means that countries that are 1 standard deviationor more above the mean SAV remediation rate will have 1.24 times faster remediationrate than the norm, a modestly small country-level effect.
The other factors we considered did not significantly impact the remediation. Onecould hypothesize that ISPs would be more likely to implement SAV in their networksince most end users are behind their networks and can be abused for an attack. Whilethe hazard ratio sign indicates such relationship, we did not find statistically significantdifference in remediation rate for networks that are ISPs compared to the control group.Finally, socio-economic factors defined by the ICT Development Index (IDI) did not in-fluence the remediation, suggesting that the economic situation of a country has no im-

5.6. SURVEY RESULTS
5
83
pact on the remediation hazard.
In summary, we can conclude that network complexity plays an important role inremediation, i.e., the networks that are smaller in size and have fewer edge routers arelikely to remediate faster. Similarly, stub networks are more likely to implement SAVfaster in their network compared to non-stub.
5.6. SURVEY RESULTSTo gain additional insights and feedback from the participants, we sent out the surveyone month after our final notification. We sent a reminder to participate in the survey tonon-responders after waiting for a month. We received responses from 32 network oper-ators (less than 2%). While sample size does not allow us to make statistical comparisonsbetween treatment groups, we believe that survey responses provide useful clarificationsfor interpreting our results.
Vulnerability Awareness Ninety percent of survey respondents knew they had not de-ployed SAV, either because of the Spoofer tool test (30%), notifications from security re-searchers (20%), from NOGs (20%), from CERTs(10%), or based on their prior knowledge(10%). The remaining 10% were not sure if their networks deployed SAV.
SAV Implementation Although 90% of respondents were aware that their network lackedSAV, more than half (52.7%) of the respondents reported that they have no filtering inplace. Another 17% reported only partial implementation on some segments of the net-works. Only 26% have implemented SAV throughout their network, and 4% were notsure.
More than half of respondents (53%) filtered out packets with a source IP addresswithin private address space (RFC1918), so that only packets with a source address fromroutable IP space leave their network. It is important to note that filtering RFC1918 issimple as it has static address space and the filtering mechanisms are widely available.Lichtblau et al. [11] reported 70% of participants in their survey filtered RFC1918 ad-dresses.
Moreover, 30% of respondents deployed SAV on routers that were customer-facing,11% on their stub ASes, and 6% deployed SAV towards peering/IXP interfaces as well. Inother words, they have deployed SAV in user space and those IPs cannot be abused tosend spoofed traffic.
When we asked participants if they planned to deploy SAV in the future, we receivedmixed responses. Around 42% said that they were planning to deploy SAV, 33% had noplan, and 25% were not sure. One provider also sent us an email in response to our noti-fication, saying that he acknowledges the issue and will get back to it after implementinganother security practice (RPKI) in his network. Given that non-compliance is not anactive “battleground,” it is likely that some providers assign SAV deployment to a lowerpriority compared to other network issues, but they might return to it later. However, westill think that 4 months we gave to the participants provided sufficient time to plan andremediate the issue, yet, we did not observe a significant impact on the outcome.

5
845. DEPLOYMENT OF SOURCE ADDRESS VALIDATION BY NETWORK OPERATORS: A
RANDOMIZED CONTROL TRIAL
Notification Targets It is possible that despite awareness, the respondents did not im-plement SAV, simply because they are not responsible for it. We wanted to confirmwhether we reached the operator staff responsible for implementing SAV. There could bemultiple reasons for not reaching the operator staff responsible for implementing SAV.For instance, 83% of the contacts we notified only had the address of the abuse mailbox.The abuse team is generally responsible for threats like spam, malware, and phishingcampaigns from or towards the network. In cases where operators are not responsible,they may have another team performing network configurations.
However, a large majority (67%) of respondents said that they were responsible forimplementing SAV. Only 13% said that they were not responsible, and 20% did not knowwhat SAV is. Subsequently, respondents that believed they were not responsible for SAVsaid they did not escalate the issue to the responsible contact.
Reasons for Non-Compliance We also asked operators why they had not implementedSAV in their networks. 30% of the respondents lacked the technical knowledge on how toperform filtering, and 30% lacked time to implement SAV. Another 18% were concernedthat implementation may cause downtime or other performance issues. 12% mentionedtechnical reasons (multi-homed network, non-stub network) for not implementing SAV.Finally, 6% of the respondents thought that SAV is ineffective in addressing the attacksthat use spoofed source addresses.
We can conclude from the survey results that the main reasons for non-complianceare driven by misaligned incentives and lack of knowledge, which are relatively easy toimprove, compared to the concerns related to downtime, performance, or technical lim-itations.
Respondents’ Suggestions for Improvements In the final section of the survey, weasked participants for suggestions about possible improvements in the notification pro-cess. We sent MANRS guidelines [167] as part of our notification. About 73% of therespondents said that MANRS had sufficient information explaining how to implementSAV. However, 23% were not sure, and 4% said that MANRS does not provide sufficientdetails. They explained that the guide currently provides configurations only for CISCOand Juniper routers, and needs to cover configurations for other brands of routers aswell. For example, one of our respondents said they used a Mikrotik router, which is notcovered in MANRS.
One respondent suggested to create a dedicated channel for SAV notifications, whereoperators can also discuss technical difficulties in implementing SAV. 64% of the respon-dents requested more community-driven seminars that discuss SAV implementation.Finally, 36% of respondents suggested that routers should provide user friendly configu-rations to implement SAV.
While the sample size of our survey does not allow us to extensively generalize theresults, it still provides valuable insights. We provide recommendations for improvingthe notification process and policies for SAV compliance in section 5.7.

5.7. DISCUSSION & CONCLUSIONS
5
85
5.7. DISCUSSION & CONCLUSIONSIn this section, we interpret our results, discuss issues that might have played a role inlow remediation, and present future avenues for improving both notifications and SAVadoption.
5.7.1. TREATMENT EFFECTS
Except for the Brazilian NOG group, there are no significant differences when comparingremediation between the treatments and the control group. There can be multiple rea-sons why the Brazilian NOG group had higher remediation rates than the control group.First, operators that have subscribed to a NOG show their willingness to understand anddiscuss network challenges. Second, it creates peer pressure because the names of ASesare publicly available, while they can ignore the private communication. Finally, oper-ators might trust the NOG channel, since the communication was part of the alreadyknown Spoofer project [84].
5.7.2. REMEDIATION IN THE CONTROL GROUP
We also observed remediation in the control group, where we did not send any notifica-tions. There could be several reasons for that. First, some network operators might haveupgraded their routers or policies, which we count as a natural remediation.
Second, some operators might have read articles or attended conference talks orseminars about current routing issues, which could have urged the operators to adoptSAV. For instance, in the RIPE meeting in Oct 2020, with more than 1200 participants,MANRS presented their initiatives about routing security, including available resourcesto deploy SAV [168]. SAV is also discussed in various network operator conferences andchannels, which might have further encouraged the adoption [169]–[171].
Finally, the MANRS program, which encourages members to be SAV compliant, hasbeen very active in the recent years. They provide resources in the form of documen-tation, tutorials, and seminars to help network operators deploy best security practices.They reported that their members doubled in 2020, reaching 588 by the end of December2020 [172].
While there can be many factors driving natural remediation, they affect all treat-ment and control groups equally. So we can still have confidence in our conclusionsabout the null effect of the treatments. This is the essence of the random assignmentprocess: it neutralizes the impact of confounding factors.
5.7.3. COMPARISON WITH PREVIOUS STUDIES
Even though previous studies showed some success with large-scale notifications, ourresults show little to no impact. We attribute these to the following factors.
Complexity: Complexity can play a vital role in the success of notification studies.SAV requires significant time and expertise and can cause downtime if not correctly im-plemented. Previous studies ( [129], [173], [174]) notified hosting providers and usersabout compromised websites which usually requires fixing the access privileges or re-moving malicious files. Similarly, other experiments [175], [176] notified web adminsabout misconfigurations or best practices for their domains. To properly configure their
5
865. DEPLOYMENT OF SOURCE ADDRESS VALIDATION BY NETWORK OPERATORS: A
RANDOMIZED CONTROL TRIAL
web server, the domain owners usually have to follow a set of simple steps in the no-tification. In comparison, SAV requires a thorough understanding of the network. Theconfigurations and types of routers make it difficult to provide a similar guide. Finally,the recipients of the notification might need to escalate the issue to senior network op-erators since it requires downtime, and misconfiguration can cause major disruptions.
Target Audience: Multiple studies notified network operators about routing and se-curity issues [82], [84]. However, none of these had a control group, which is required toreliably assess the effectiveness of remediation. Our study is the first one that focuses onnetwork operators and performs a randomized control trial. Previous studies using RCTseither sent notifications to the domain owners [129], [173], [174] or to the network oper-ator about compromised user devices [126]. In those cases, the operators are only askedto forward the message. They do not incur the main cost, as they rely on their users toremediate the problem.
Liability and incentives: The incentives of treatment subjects in our experiment isdifferent from most operators of vulnerable or compromised resources. The benefits ofimplementing SAV flow to the rest of the Internet, not the operators themselves. Thenetwork implementing SAV is still vulnerable to DDoS attacks from other networks. Interms of liability, a prior study had found higher remediation rates because of legal con-sequences [119]. However, there is no liability on operators prevent spoofed traffic fromleaving their network.
Language of Notification: We sent out our treatments in English, except for thoseadministered by the Brazilian CERT, which were in Portuguese. Notifications in networkoperators’ native language could have improved the effectiveness of interventions. How-ever, our study found no impact of the language difference. This is consistent with ear-lier work where more languages were included in a notification experiment, which alsofound no impact on remediation [122].
Awareness of Vulnerability: There has been a significant effort by the security com-munity to deploy SAV over the last several years [84], [162], [177]. It is possible that somenetwork operators already know through notifications from the Spoofer project that theirnetwork is non-compliant and have either ignored prior notifications or cannot deploySAV due to technical limitations. That said, it is important to note that our dataset is verydifferent from that used in the Spoofer-based campaigns, the main notification effort inthis area. This dataset has not been used in previous notification campaigns.
5.7.4. REASONS FOR NON-REMEDIATION
Our survey results found that 57% of respondents did not follow the recommendationto implement SAV, even though they confirmed we reached the right recipient in mostcases. It contradicts previous work [11], where only 24% of the operators mentioned thatthey did not implement SAV in their networks. One possible explanation is that Lichtblauet al. [11] contacted only NOG members. The operators who have subscribed to the listare likely more aware of security challenges and willing to adopt best practices.
Our survey results revealed several reasons for non-compliance. Perhaps surpris-ingly, awareness about IP spoofing and the absence of responsibility for router configu-rations are not the prominent reasons. The majority of our survey respondents said thatthey were aware of the issue and were responsible for its remediation. Yet, many partic-

5.7. DISCUSSION & CONCLUSIONS
5
87
ipants acknowledged that they were not familiar with how to perform filtering. Thus, aswe discuss in Section 5.7.5, educating network operators about security vulnerabilitiesand remedies, further improving notification systems, and making sure the notificationsreach the target person responsible for remediation (including proper escalation of theissues by network operators) are important steps in improving the overall compliance.
A large proportion of participants also mentioned that they lack time for implement-ing SAV, or that it is not their top priority. Finally, some respondents acknowledgedconcerns about performance issues or technical limitations deferring them from imple-menting SAV in their networks. While understanding relative impact of those reasonson remediation requires future work, our research and previous studies [3], [11] con-clude that there is a need for community-driven efforts in aligning operators’ incentivesand providing better resources for addressing technical challenges with SAV implemen-tation. We further discuss the recommendations for improving SAV adoption in the nextsection.
5.7.5. MOVING FORWARD: RECOMMENDATIONSAlthough notifications did not dramatically increase SAV adoption, we propose a num-ber of steps that can help improve the adoption of routing and security vulnerabilityremediation.
Improving Notification Channels: Our survey response indicate that most of ournotifications reached the recipients. However, to make sure they reach the team respon-sible for security and routing, we propose that providers should be encouraged by RIRsto fill in and keep up-to-date the technical team’s contact details, in addition to abuse-email contacts.
Improving Resources: MANRS provides guidelines to network providers that de-scribe how to implement SAV in their network, in English. To increase SAV adoption,it should be available in other languages, and it should cover other popular brands ofrouters in addition to CISCO and Juniper.
Improving Incentives: The main issue with routing security is that the remediationentails financial costs and requires human resources, while benefits would be mostlyabsorbed by the rest of the Internet. To align the incentives, the Internet communitycan play its part. Most of the providers with stub networks get connectivity through up-stream providers. They hold a unique vantage point where they can detect if the incom-ing packets have a spoofed source [11], [76], [84]. If they exercise their position of powerand peer with compliant networks, the overall compliance could increase significantly.There are examples where network providers leveraged their power to achieve compli-ance. For instance, a provider dropped invalid prefixes from its customer ASes [178].The owners of the prefixes took corrective action and updated their Route Origin Autho-rizations (ROA) to fix the issue. Similarly, after observing a consistent BGP hijack fromBitcanal, Hurricane Electric and Portugal’s IP Telecom were able to cut them off fromthe Internet [179]. Thus, the network community needs to take corrective actions. Thiscould be supported by legislation that makes the providers liable for network attacks.Interestingly, two countries—Albania and the Philippines—consider avoiding correctingsecurity flaws as administrative and criminal offenses [180]. Both inside and outside thenetwork community, actions are possible to improve the incentives for SAV adoption.


6CONCLUSION
This chapter summarizes the main findings of the thesis and connects these to our cen-tral question: How can we measure and improve the adoption of Source Address Val-idation (SAV) by network operators? It also discusses the current state of the art andpaths forward in future work. The presented research focused on three major themes:measurement of SAV, the incentives structure for SAV deployment, and interventions re-quired to improve incentives for and adoption of SAV. Four empirical studies were pre-sented as separate research papers, answering the following sub-questions:
1. How can we acquire additional vantage points using crowdsourcing platforms toimprove the visibility of SAV adoption?
2. How can we leverage traceroute loops to improve the visibility of SAV non-compliance,and what additional coverage does it provide?
3. What incentives explain operator noncompliance with SAV, and how do networkcharacteristics, intermediaries and market forces impact these incentives?
4. What intervention offers the strongest incentives for network operators to imple-ment SAV, and how can we improve SAV notifications to make them most effectivefor network operators?
Section 6.1 returns to the research gaps identified in Chapter 1 and summarizes thecontributions of the current research towards reducing those gaps. Contributions fromchapters 2 and 3 center on improving SAV measurements. Those of Chapter 4 concernthe landscape of noncompliance and incentives affecting compliance. Contributionsof Chapter 5 relate to our understanding of what interventions improve compliance inpractice. Section 6.2 reflects on our findings and discusses next steps to improve thetransparency of SAV measurements. Actionable conclusions are presented for policy-makers, intermediaries and problem owners. Section 6.3 concludes the thesis with somefinal thoughts on the future work required to improve SAV measurement and compli-ance.
89

6
90 6. CONCLUSION
6.1. CONTRIBUTION TO THE RESEARCH GAPS
This section explores the research findings and contributions with respect to transparencyin measurements, incentives and policy interventions.
6.1.1. TRANSPARENCY OF MEASUREMENTS
We defined transparency as the ability to observe the current state of SAV deployment bynetwork operators and the impact of various interventions on remediation. In essence,we found a need for actionable measurements of SAV deployment. For instance, forpolicymakers, metrics need to summarize the state of deployment at the organizationor country level. In contrast, for network engineers, a more fine-grained measurementis required, enabling them to assess and remediate the prefixes from which spoofing ispossible.
We identified various challenges in collecting and analyzing network measurements.One of these concerns the flexible and scalable nature of the Internet, as networks canjoin and leave the wider Internet without much intervention. This introduces uncer-tainty in measurements, as paths and links are in constant flux. It also poses an aggrega-tion challenge, which hampers analysts’ ability to make inferences from SAV measure-ments. Nonetheless, security researchers rely on these measurements to draw conclu-sions about network hygiene, based on various network policies and Internet providerpractices.
Another challenge in accurately measuring the constantly changing Internet is thelimited availability and circumscribed global distribution of vantage points from whichto observe and measure network policies at the required level of granularity. We classi-fied Internet measurements into two broad categories: data collected from outside thenetwork and data collected from inside the network. The first type of data is obtainedby sending specially crafted probes from any Internet-connected machine to the net-work that we want to measure. Examples are sending Internet Control Message Protocol(ICMP) echo requests to determine the reachability of machines, and sending tracer-oute probes to determine the network path to the destination. For the second category,probes are leveraged within the network to send packets to a measurement server. Thesetypes of measurements are required to assess the outbound policies of Internet providersand can be used, for example, to study web censorship imposed by countries [25], secu-rity policies or the general network configuration of ISPs, such as their NAT (NetworkAddress Translation) or DHCP (Dynamic Host Configuration Protocol) [181].
To measure SAV policies, we must rely on the second category – i.e., we need a van-tage point from inside the network to send spoofed packets to measure compliance. Be-cause security researchers are unlikely to capture the network policies of all connectednetworks, they must make inferences based on a limited set of observations per network.Moreover, inaccuracies can arise due to measurement errors stemming from differentpolicies for a subset of a network, different policies for upstream network providers andcontradictory results caused by changes in paths to a destination. The current researchexplored various methodologies to obtain adequate vantage points to measure SAV com-pliance and create metrics for improved transparency.
6.1. CONTRIBUTION TO THE RESEARCH GAPS
6
91
Acquiring vantage points from inside the network: Chapter 2 presented a frameworkand an experiment to capture additional vantage points inside a network using the Spoofertool. The study provides a first-of-its-kind design that employs multiple crowdsourcedplatforms to acquire vantage points. Our design collects and synchronizes parallel mea-surements via multiple crowdsourcing marketplaces. We demonstrated the effects ofprice elasticity (higher compensation) on the hiring of additional vantage points. Theprimary benefit of combining various platforms was to achieve greater geographical di-versity and better network coverage in the results. In total, we acquired vantage pointsin 91 countries, 784 unique Autonomous Systems (ASes) and 1,519 IP addresses, at a costof approximately €2,000 for platform fees and worker compensation. In a six-week mea-surement period, we increased the coverage of the Spoofer tool by 342 unique ASes and1,470 /24s, a 15% increase over the prior 12 months.
Acquiring vantage points from outside the network: Chapter 3 presented the effi-cacy of a new measurement technique for SAV compliance. Here we implemented andvalidated an algorithm that uses traceroute data to infer the absence of filtering by aprovider AS at a provider-customer interconnect. Specifically, routing loops appear-ing in traceroute data were used to infer inadequate SAV at the transit provider edge,where a provider did not filter traffic that could not have come from the customer. Weshowed that it is generally feasible for providers to deploy static ingress Access ControlLists (ACLs), as customers rarely change address space. We found 703 provider ASes thatdid not implement ingress filtering on at least one of their links for 1,780 customer ASes.We validated the algorithm’s correctness using ground truth provided by seven networkoperators.
Chapter 4 presented a methodology – and its implementation – to acquire vantagepoints based on a vulnerability in an open resolver. We scanned for a very specific subsetof open resolvers, namely Customer-Premise Equipment (CPE) devices with a particularconfiguration error. These provided a vantage point to observe the absence of SAV inparts of the network. Even though we scanned the Internet from outside the network,the misconfigured devices forwarded a packet with the wrong source IP address. In otherwords, these specific devices provided a de facto measurement platform for networksthat lacked SAV, since they unintentionally responded to a specially crafted DNS requestwith spoofed traffic. In that sense, the misconfigured devices functioned similarly to theSpoofer client software.
In summary, using inferences from the traceroute data enabled us to improve the vis-ibility of SAV compliance. We also collected longitudinal data about SAV noncomplianceby exploiting misconfigured open resolvers. An advantage of these methodologies wasthat the datasets had minimal overlap; each thus increased the visibility of SAV compli-ance across the Internet. We mapped the IP addresses in our datasets (Spoofer and openresolver) to their respective ASes and then mapped those ASes to ISPs. We defined anISP as a company that provides access services, typically in residential broadband mar-kets. The relationship between ASes and ISPs is complicated. Many ISPs have a singleAS, but a fraction of ISPs has multiple ASNs (Autonomous System Numbers), and someISPs share a single ASN.
We started our identification of the network space of ISPs with market analysis data

6
92 6. CONCLUSION
/24 Prefix
/24 Prefix or Smaller in BGP
Autonomous System
Longest Prefix in BGP
Organization
Aggregation Precision
IP Address
Figure 6.1: Aggregation levels used in metrics for SAV
from the TeleGeography GlobalComms database [94]. It offers a highly reliable overviewof the main broadband ISPs in each country, drawn from annual reports and market fil-ings. We focused on ISPs in 64 countries. Together, these held a broadband market shareof over 85% in those countries [96]. This provided us a total population of 334 ISPs, withour dataset containing a number of these ISPs’ subscribers as well. From our overallpopulation, we had 250 observations of noncompliance (73%). Only 65 ISPs (26%) werepresent in both Spoofer and open resolver datasets. While the Spoofer and open resolverdatasets revealed noncompliant ISPs (customers), the traceroute-loop data revealed in-adequate SAV among the transit providers.
From measurements to metrics: SAV measurements suffer from selection bias andfalse positives. As such, a key issue is how to measure SAV adoption correctly. If weonly consider IP addresses that allow spoofing in the measurements, we would likelybe undercounting the problem since network policies are usually applied on prefixes.Similarly, if we consider only a few data points to determine whether an entire AS ororganization is compliant, our inferences might be inaccurate, as results for the unmea-sured space might be contradictory. AS or organization level results are more actionable,since we can introduce interventions for noncompliant network providers and incen-tivize compliant networks.
Figure 6.1 presents various aggregation levels used in previous analyses. The highestreported level of aggregation is the AS level. In Chapter 4, we presented the first-everstudy to report results at the organization level. We also normalized the spoofable IPspace with reference to the total advertised IP space, which allowed us to perform com-parative analysis. We compared the organizations based on the percentage of addressspace that was noncompliant. Yet, in so doing we had to compromise on precision sincewe counted the entire /24 or smaller Border Gateway Protocol (BGP) advertised prefix asspoofable for each IP address in our datasets.
The key takeaway from this work is that there is no single correct answer for the rightlevel of precision or aggregation; it depends on the purpose of the measurements. More-over, it is important to understand that compromises are required in reporting SAV com-

6.1. CONTRIBUTION TO THE RESEARCH GAPS
6
93
pliance data. For instance, Regional Internet Registries (RIRs) and governments will beinterested primarily in the proportion of networks that are largely noncompliant, so theycan improve compliance in their jurisdiction. Network operators, researchers and in-termediaries, however, need more precise data so that they can reproduce results andimplement SAV on the reported prefixes.
6.1.2. INCENTIVES
In economic terms, SAV deployment suffers from a negative externality: the networkoperators that allow spoofing save themselves the time and effort of deploying the SAV,while other operators incur the cost of this laxity in the form of attacks emanating fromthe noncompliant networks.
Chapter 4 empirically investigated the impact of different incentives on SAV deploy-ment. It also presented a theoretical framework which provided the basis for our em-pirical study. It identifies four key economic factors thought to shape incentives forSAV deployment: the cost of adoption, externalities, information asymmetry and theweakest-link property of antispoofing security. Furthermore, we built a statistical modelto explain the proportion of an ISP’s address space that allows spoofing, based on fourcausal factors – network complexity, security effort, ISP characteristics and the institu-tional environment. These were measured using 12 indicators. We found evidence thatcomplex networks were more prone to a larger proportion of noncompliant IP space.
To measure network complexity we used multiple proxy variables, including networksize, number of subscribers, number of prefixes and stability of BGP prefix announce-ments. An argument can be made that larger and more complex networks have multiplepoints of failure. However, these network operators might also have more experience,knowledge and time available to deploy SAV. We found that more complex ISPs – i.e.,those with a larger advertised IP space, more subscribers and a larger number of ad-vertised prefixes – had a larger proportion of noncompliant IP space. Though there arelikely to be economies of scale in SAV implementation, our model suggests that the cost-reducing effects of network size are smaller than the cost-increasing effects of greaternetwork complexity.
We defined the hygiene of a network using security practices, like the signing of RPKI(Resource Public Key Infrastructure), the number of amplifiers and the number of botsin the network. We used the signing of BGP prefixes (RPKI) as an indicator of a more hy-gienic network – i.e., operator willingness to invest in resolving security issues with sig-nificant externalities. The number of DDoS amplifiers and bots in a network was takenas a negative indicator, expressing an operator’s unwillingness to do so. In short, wefound that operators with one or more RPKI-signed prefixes had a smaller proportionof noncompliant space, compared to ISPs that did not sign their prefixes. Similarly, wefound that the number of amplifiers per ISP had a significant positive impact. In otherwords, ISPs with a larger number of amplifiers also had a larger proportion of noncom-pliant address space. We found no statistically significant effect of the number of bots ina network on noncompliant address space.
Finally, we tested economic factors under which these ISPs operated. Our resultsindicate a weak but significant effect of the ICT development index. That is, ISPs oper-ating in countries with lower ICT development had a larger proportion of noncompliant

6
94 6. CONCLUSION
address space.
Reflections on Incentives: For two decades now, we have had a Request for Comments(RFC) on Best Current Practice for SAV (BCP 38) [8], alongside numerous research articlesand ongoing discussions in operator communities. Yet, we still observe significant SAVnoncompliance. Previous work attributes such noncompliance primarily to misalignedincentives [11], [84], [123].
Nonetheless, there are dissenting views on operator incentives. For instance, MANRSpublished an article arguing that operators benefit from maintaining a clean network [93].The cost of SAV implementation is decreasing as well, and almost all new network equip-ment supports Unicast Reverse Path Forwarding (uRPF), a well-known feature to im-plement SAV. Similarly, RIPE NCC, published a draft business case for operator compli-ance [182]. It emphasized that BCP 38 implementation is a source of good publicity foroperators, while also limiting attacks within the own network as well as those of otherproviders.
We found that many operators had in fact implemented SAV. Spoofer tests show thatsome 20% of the ASes in their dataset had either fully or partially implemented SAV intheir networks. Yet, they could not test the majority of ASes (58%) due to NAT. Recenttests (Sept. 2020-Sept. 2021) found only 23% of ASes to be not fully compliant [183].Similarly, 179 previously noncompliant ASes were found to have implemented SAV inthe last year. This brings a different question to mind: what factors influence networkproviders to implement SAV? We speculated that operators could be influenced to adoptSAV by unobserved incentives, or factors we might not characterize as incentives – suchas social norms. Such norms might determine how expectations defined by society feedthrough to individual behavior. For instance, the operators attending Network Opera-tor Group (NOG) and RIR meetings were self-motivated and informed about attacks onnetworks operated by their peers due to noncompliance. Their decision to deploy SAVwas likely driven by more than economic incentives, being shaped by community ex-pectations as well. Disentangling these norms through examination of encouragement,community involvement and communication can enable us to better understand incen-tives and improve SAV compliance.
Though primarily anecdotal, our interactions with operators indicate that moral fac-tors have had considerable influence in driving adoption, notwithstanding economic in-centives. Moreover, all factors considered, operators in developed countries were morelikely to be compliant, as they had the resources required to fulfill the basic requirementsto run their networks. This is in line with our results from Chapter 4, which found thatoperators in countries with better ICT infrastructure were more compliant. However,further work is required to fully understand the effects of moral and social norms onoperators’ implementation of best practices.
6.1.3. INTERVENTIONSChapter 5 investigated interventions that might help us improve SAV compliance. Pre-vious studies on other security issues found that operators did act on notifications ofvulnerabilities and reports of abuse in their networks, albeit to varying degrees [119]–[122]. This brings us to our final sub-question: how can more operators be moved to

6.1. CONTRIBUTION TO THE RESEARCH GAPS
6
95
adopt SAV? To shed light on this issue, we performed the first-ever randomized controlexperiment to measure the impact of notifications sent to 2,320 network operators onSAV remediation rates. This population is much larger than in any prior study on SAV.We included a control group in the design, which no earlier study on SAV has done. Thisyielded a crucial insight that puts earlier findings in a different light. Specifically, the im-provements observed by Luckie et al. [84] might have been incorrectly attributed to theirinterventions.
Unlike previous work, our study focused on network operators as the primary pop-ulation to be incentivized to adopt more secure practices. We also experimented withframings, testing social and reciprocity nudges in message design. In terms of channels,we tested private messages to operators versus notifying national computer emergencyresponse teams (CERTs) versus using geographically organized NOG mailing lists. Send-ing notifications to a public forum (NOG) had not previously been tested using an ex-perimental design. Finally, we partnered with NIC.br, a leading Brazilian CERT, to havethem deliver the treatment directly. CERTs are a trusted partner in the operator commu-nity and a critical player in the security notification ecosystem. Yet, no previous studyon SAV has measured whether CERT notifications have more impact than those of re-searchers or security companies. Our findings, however, revealed a disappointing real-ity: there was no evidence of remediation driven by any of the treatments compared tothe control group. Importantly, we did observe some remediation across all groups, in-cluding the control group. This might explain why a prior study [84] reported an impactof notifications. Since that study had no control group, it could not ascertain whetherthe remediations were in fact driven by their intervention.
Reflections on interventions: Multiple factors likely influenced the null results, in-cluding providers’ reachability, their understanding of our notifications and their SAVknowledge. Below, we reflect on the intervention process and lessons learned in our no-tification study from Chapter 5.
Once network vulnerability is determined, a first step toward remediation is to deter-mine a methodology required to reach the operators. Our methods included obtainingabuse mailbox details of operators from peeringDB and WHOIS records. While previ-ous studies experienced a bounce rate of over 50% [130], [131], the large majority ofour emails (97%) did reach the operators’ mailboxes. This better success rate can beattributed to our having network operators rather than hosting providers as our tar-get group, as RIR anti-abuse groups monitor the presence of functional mailboxes forthese [184]. We recommend using the technical contact from WHOIS or peeringDB toreach operators about routing issues, since our survey confirmed that we reached theright contact to notify noncompliance.
Once reached, however, we experienced very little interaction with network providers.Only three operators requested additional guidance or information in response to ournotifications. There could be multiple reasons for providers’ minimal engagement. It ispossible that they missed our notification due to an excess of email in their mailboxes.Or, providers might simply ignore most abuse reporting and focus only on selected is-sues. It is also possible that they did not understand the content or were not in the habitof replying to notification emails. Further work is needed to understand the reasons for

6
96 6. CONCLUSION
the providers’ lack of interaction.
The third step in the cycle is having incentives and knowledge to remediate. As ex-plained, operators have limited incentive to implement SAV in their networks. Nonethe-less, we do observe networks adopting SAV. Other than the moral and ethical factorsdiscussed earlier, community actions also appear to influence adoption. During our no-tification campaigns, one of the operators informed us that they had prioritized imple-mentation of RPKI (another routing security protocol) in their network. The current sta-tus of RPKI had been a topic of discussion at all recent NOG and RIR meetings. Thoughanecdotal, this seems indicative of the community’s role in advancing moral and ethicalincentives to implement best current security practices.
In sum, multiple steps are required for a successful intervention. Although we did notfind a significant remediation group, our study outlines lessons learned and necessarysteps to move forward. We discuss these further below.
6.2. MOVING FORWARDThis section examines the implications of our findings for governance. It first sets outlessons learned from our studies that may be useful to the measurement community. Itthen presents interventions that could improve SAV compliance.
6.2.1. IMPROVING TRANSPARENCY
The measurement community has been focused on the reliability of Internet measure-ments. Previous work has used the results from the Spoofer tool to discuss the landscapeof SAV deployment [84]. The benefit of Spoofer is that it gives precise results for the IPthat is tested by the software. However, if we only consider the noncompliant addressspace based on IP addresses, we lack adequate coverage to analyze the overall SAV de-ployment landscape. We proposed additional measurement methodologies to extendcoverage of the noncompliant address space. However, these come at the cost of ac-curacy. It will be up to policymakers to decide what level of granularity and accuracyof results is required. For instance, network providers require the IP addresses shownin the measurements to identify the routers that need to be reconfigured to implementSAV. However, for the network operator community, such as members of NOGs, nationalCERTs and RIRs, granularity at the prefix level is needed, so they can estimate the sizeof the network from which spoofed traffic can originate. Similarly, governments mightneed only to know the number of providers that have not deployed SAV. They can thenprovide incentives for compliant operators, while nudging noncompliant operators toadopt SAV.
Furthermore, to improve transparency a responsible and sufficiently visible organi-zation is needed to host and notify operators that are not SAV compliant. Currently, theCenter for Applied Internet Data Analysis (CAIDA) is the only organization hosting boththe Spoofer tool and data on network operator compliance. Even though the projectis well maintained, its visibility is still limited. Network operators are unlikely to visitthe Spoofer page without an intervention or notification about their noncompliance.More visibility could be brought to the issue if RIR portals displayed information on theSAV compliance status of their operators, as network operators know about these portals

6.2. MOVING FORWARD
6
97
and visit them to update their organization’s information and to request resources likeIP addresses. Furthermore, RIRs could notify noncompliant operators and display non-compliant prefixes on operator dashboards. There are multiple other methodologies todetect networks that allow IP spoofing [10], [11], [76], [86], [123]. However, as in mostacademic research, these have remained mostly in the proof of concept stage. Therehave been scant follow-up studies and a lack of data collected longitudinally. Central au-thorities like the RIRs and community-driven initiatives like MANRS need to implementthese methodologies to increase their visibility and influence organizations to adopt SAV.In this regard, we must conclude that collective action by the community is needed if wehope to increase SAV compliance in the coming years.
6.2.2. NEW INTERVENTIONSNetwork operators are geographically distributed, operating under different social normsand with varying degrees of technical knowledge. At the same time, there is little formalregulation and limited governance mechanisms to improve network provider security.To effectively overcome problems related to network security in general, and SAV in par-ticular, a collaboration of different actors is required. This section examines the rolesthat multiple actors can play to improve the deployment of SAV, using the four canonicalgovernance models of market, hierarchy, network and community [185], [186].
Market: The market can be understood as a self-regulated form of governance basedon contracts, prices, property rights and competition. There are a number of meansby which market forces can drive increased SAV compliance. The self-regulatory func-tion can be performed by various forums in which the network operator communityparticipates. For instance, a hosting provider community in the Netherlands created acode of conduct prioritizing removal of child sex and abuse material [187]. Among itsrecommendations are automated removal of abuse content and establishment of trustchannels with the Bureau for Internet Fraud of the Dutch police to expedite immediateremoval of such content. Similarly, Australian ISPs signed a code of conduct to shareabuse information and established standardized steps to remediate malware from theirnetworks [188]. There is a need for global and country-level consortiums for SAV im-plementation as well. These would incentivize the ISPs that have implemented SAV intheir networks and provide a platform for information sharing and training opportuni-ties for noncompliant operators struggling to implement SAV due, for example, to lackof resources.
Another market player with a role in SAV deployment is router manufacturers. Oneof the findings from our survey in Chapter 5, in line with a previous study [11] of non-deployment of SAV, concerns the time and knowledge required to adopt SAV. If the majorplayers introduce more user-friendly configurations to implement SAV, more providersare likely to implement SAV in their networks. Implementing SAV as a default policyin routers would further add to compliance. Luckie et al. [84] found that single-homedstub ASes are on the rise, with around 38% of ASes falling into this category. Networkproviders of these ASes can run strict unicast Reverse Path Forwarding (uRPF), a well-known methodology for implementing SAV without impacting packet forwarding or drop-ping legitimate traffic. The main question then is why don’t router manufacturers pro-

6
98 6. CONCLUSION
vide easy-to-use functionality or SAV as the default in their operating systems. The an-swer lies somewhere between incentives and demand. Market parties can play a part inimproving demand and providing easy-to-use solutions. For instance, if a governmentmandates that it will only do business with compliant operators, network administratorsare more likely to choose hardware that provides easy-to-use configurations. SAV as adefault option on routers would also help increase network providers’ compliance. Cur-rently, five router providers – Cisco, Huawei, HPE, Nokia and Juniper – hold more than75% of the market [189], with Cisco having the most significant share, of around 56%.This market concentration shows that it is difficult for new entrants. However, if incen-tives are realigned among the more prominent manufacturers, SAV non-deployment canbe improved.
Similarly, the ISP market can leverage transparency to implement SAV if it can beencouraged to use security as a differentiator. For instance, RPKI, another routing se-curity practice, has gained attention within the operator community due to BGP routehijacking. Cloudflare started the initiative isbgpsafeyet.com to reduce informationasymmetry on RPKI deployment. Participants can run a test to check if their ISP has im-plemented RPKI. Users are encouraged to tweet the results to increase awareness, whichputs pressure on ISPs to implement RPKI.
Hierarchy: Hierarchy is the form of governance in which authorities regulate the mar-ket. One of the most significant issues in introducing new regulations is differences be-tween the laws of different countries. Regulations can be either national or international.For instance, Portugal and Thailand have government bodies that audit the cybersecu-rity of organizations within the country and can penalize companies with inadequatemeasures to protect their networks [180]. There are global initiatives too, like the Inter-national Telecommunication Union (ITU), which has broader reach but must accommo-date more differences between countries. Governments can either use global initiativesor nudge providers within their own jurisdiction by introducing criminal laws, rewardprograms and awareness campaigns. Examples of these instruments with reference toSAV are examined below.
(i) Regulation: Governments can use regulating bodies to introduce penalties fornoncompliance among network providers and network equipment manufacturers. Forinstance, the US Federal Trade Commission (FTC) sued a network equipment manu-facturer (D-Link) for failing to secure its routers and IP cameras. To settle the lawsuit,D-Link agreed to implement a comprehensive security program including third-partyassessment of its software and security for ten years [190]. Since it is difficult to track theorigin of DDoS attacks because of spoofed packets, governments or regulatory bodiescan introduce fines for network equipment manufacturers or noncompliant providers.This, however, requires legislation. A previous study of 156 countries found that only2 (Albania and The Philippines) had cybercrime legislation assigning liability to vulner-able resource owners [180]. Furthermore, the EU’s Network and Information Systems(NIS) Directive [191] mandates operators of essential services (OES) and digital serviceproviders (DSPs) to ensure service availability within the EU and minimize the impactof security incidents. It also provides liability clauses invoking financial penalties fornoncompliant organizations.

6.2. MOVING FORWARD
6
99
(ii) Reward Programs: Government can also introduce reward programs for Inter-net companies that adhere to best security practices, including implementing SAV intheir networks. For instance, the companies that report SAV compliance might receivetax benefits. This would encourage network operators to implement SAV. Similarly, theycan run programs like Bug Bounty, encouraging Internet company subscribers to iden-tify noncompliant networks for a small reward. This would increase transparency whileproviding an incentive for network operators to implement SAV. Finally, governmentscould issue directives to procure network services only from providers that are BCP 38compliant.
(iii) Awareness Campaigns: Awareness campaigns are another means available togovernments to incentivize compliance. For example, lists of compliant and noncompli-ant providers can be published on various public forums. Public “naming and shaming"can be a useful tool to motivate noncompliant networks to implement SAV, while pro-viding incentives to compliant operators. Government organizations can either conductthese measurements and notifications themselves, or delegate the job to a trusted thirdparty. For instance, in Japan, the National Institute of Information and CommunicationTechnology (NICT) surveyed Internet of Things (IoT) devices for known vulnerabilitiesand notified the network operators that had vulnerable customers [192]. Governmentorganizations could run a similar initiative for SAV compliance, to enhance transparencywhile providing incentives for the compliant operators.
Network: Governments have a role in supporting network governance too. For exam-ple, they can provide funding for peer groups, offer technical and logistical assistanceand publish reports from neutral third parties on SAV implementation in the various par-ticipating organizations. The Netherlands, for example, has several initiatives to combatabuse and DDoS. One of these is the Dutch Abuse Information Exchange Center (Abuse-Hub), in which multiple organizations formed a consortium to receive feeds on varioustypes of abuse originating from their networks. Members meet on a regular basis toexchange information regarding their ongoing efforts to deal with abuse, and the gov-ernment publishes reports of independent third-party researchers [193]. Similarly, aninitiative to curtail DDoS attacks was set up by the Dutch Continuity Board (DCB). Thisis a consortium of leading network operators in the Netherlands to share informationand cooperate to improve network resilience among member organizations, specificallyagainst DDoS attacks [194].
The most significant example of network governance for SAV implementation is theMANRS initiative. It recommends that member organizations implement SAV in theirnetworks. It also provides technical help to member operators via tutorials on its websiteand by organizing seminars and talks. Even though the initiative grew from 200 to morethan 500 members last year (2021), it still has a way to go, with more than 70,000 ASes,many of which still allow spoofing.
Moreover, national CERTs and RIRs can leverage their positions vis-à-vis ISPs to stim-ulate them to behave more in line with community norms. For instance, the Ameri-can Registry for Internet Numbers (ARIN) banned Cogent, a large ISP, from accessing itsWHOIS database for 6 months, after several ISPs complained that they had received un-solicited marketing calls from Cogent’s sales team [116]. There have also been examples

6
100 6. CONCLUSION
where upstream providers leveraged their position to achieve security improvements inBGP routing. Hurricane Electric and Portugal’s IPTelecom joined forces to cut off Bit-canal from the global Internet after it was consistently observed to conduct BGP routehijacking [115]. The organization was later also removed by the German Internet ex-change DE-CIX and others in the routing ecosystem.
Community: Community is the form of governance in which peers come together fora common cause. The difference between network and community is that personal con-nections are not required in this governance model. For instance, RIRs can create work-ing groups in which providers share ideas and experiences in implementing SAV. More-over, RIRs and NOGs have regular meetups where participants give talks and tutorialson various network issues. Operators often use these meetups to discuss BCP 38 imple-mentation and experiences.
Security researchers can play a part as a community too. Currently, the SpooferProject disseminates a monthly report on the NOG mailing list about vulnerable and re-cently remediated networks. This is a good first step, but not all network operators andcountries are on these mailing lists, and many operators likely miss these notifications.CERTs and local and global initiatives should also regularly notify networks within theirjurisdictions to extend the reach of these notifications. They can also use other datasets(open resolver, traceroute, IXP) to notify operators of noncompliance. Similarly, securityresearchers can advance solutions in the form of RFCs and software to implement SAV.In our survey, noncompliant operators noted that manuals for less popular routers, likeMicroTik routers, were missing from MANRS documentation. We recommend that se-curity researchers develop a more comprehensive guide with easy-to-use software as away forward to improve compliance.
6.3. CLOSING THOUGHTSThis research investigated various methods to measure and analyze the SAV compliancelandscape. We found limited incentives for network operators to comply. However,the community and service providers continue to suffer on a daily basis due to ever-increasing DDoS attacks. A joint effort is needed among stakeholders to improve com-pliance and limit the vantage points that malicious actors can exploit to launch attacks.We discussed several initiatives, including MANRS, which is at the forefront of improvingthe transparency of SAV adoption measurements. In addition to these, we need majorplayers, like RIRs, IXPs and influential network equipment manufacturers, to take a leadin improving SAV compliance. We hope that this research provides a stepping stone,helping policymakers and network providers understand the current landscape of SAVadoption and advancing compliance.

AUTHORSHIP CONTRIBUTION
The core of this dissertation is formed by four peer-reviewed publications, which wereconceptualized and published with the help of various co-authors. While I led all ofthe studies, I was fortunate to receive valuable contributions and feedback from my co-authors. Below I summarize their respective contributions per study.
In the first study (Chapter 2), I developed the website and methodology to collectand analyze the data from the crowdsourcing platforms. Matthew Luckie analyzed theadditional vantage points collected through the crowdsourcing platform and draftedbackground on the Spoofer Project. Mobin Javed, Maciej Korczynski, Hadi Asghari andMichel van Eeten helped with argumentation, proofreading the paper, and improvingthe draft.
For the second study (Chapter 3), I conducted the data analysis for the persistenceof traceroute loops, drafted the text and helped develop and validate the algorithm.Matthew Luckie implemented the algorithm to collect the data on traceroute loops anddid most of the analysis. Maciej Korczynnski helped in reaching out to the operators tovalidate the findings. Michel van Eeten helped with the structure of the text of the paperas well as the argumentation. All the co-authors contributed significantly to improvingthe text.
For the third study (Chapter 4), I handled most of the data collection process, model-ing, analysis and writing. Maciej Korczynski wrote the scanner to collect data and helpedin setting it up. Carlos Gañán helped with the modeling and interpretation of the results.Michel van Eeten helped in the conceptualization of the main idea and incentive struc-ture for the operators. All co-authors helped improve the text and sharpen the argumen-tation.
In the fourth study (Chapter 5), I collected the data, implemented the algorithm forrandom distribution of subjects in the treatment and control group, and did most ofthe writing and analysis. Alisa Frik helped in the development of the overall methodol-ogy and, more specifically, in designing and writing behavioral nudges and the survey.Matthew Luckie developed the website and sent notifications to the NOG lists. CarlosGanan and Maciej Korczynski helped with the statistical model and writing of the paper.All the co-authors contributed greatly to writing the text and improving the argumenta-tion.
101


BIBLIOGRAPHY
[1] B. M. Leiner, V. G. Cerf, D. D. Clark, et al., “A brief history of the internet,” ACMSIGCOMM Computer Communication Review, vol. 39, no. 5, pp. 22–31, 2009.
[2] S. Keshav, “Paradoxes of internet architecture,” IEEE Internet Computing, vol. 22,no. 1, pp. 96–102, 2018.
[3] R. NCC, Survey Results, https://ripe79.ripe.net/presentations/89-RIPE-NCC-Survey-2019-Report-Presentation.pdf, 2019.
[4] https://www.zdnet.com/article/ddos-attack-cost-bandwidth-com-nearly-12-million/.
[5] https://www.akamai.com/blog/security/anatomy- of- a- syn- ack-attack.
[6] K. Man, Z. Qian, Z. Wang, X. Zheng, Y. Huang, and H. Duan, “Dns cache poisoningattack reloaded: Revolutions with side channels,” in Proceedings of the 2020 ACMSIGSAC Conference on Computer and Communications Security, 2020, pp. 1337–1350.
[7] P. Vixie, “Rate-limiting state,” Communications of the ACM, vol. 57, no. 4, pp. 40–43, 2014.
[8] P. Ferguson and D. Senie, “Network ingress filtering: Defeating denial of serviceattacks which employ IP source address spoofing,” RFC 2827.
[9] CAIDA, The Spoofer Project, https://www.caida.org/projects/spoofer/,2020.
[10] L. F. Müller, M. J. Luckie, B. Huffaker, kc claffy, and M. P. Barcellos, “Challengesin inferring spoofed traffic at IXPs,” in ACM Conference on Emerging NetworkingExperiments And Technologies (CoNEXT), 2019, pp. 96–109.
[11] F. Lichtblau, F. Streibelt, T. Krüger, P. Richter, and A. Feldmann, “Detection, Classi-fication, and Analysis of Inter-domain Traffic with Spoofed Source IP Addresses,”in Internet Measurement Conference, ACM, 2017.
[12] M. Kührer, T. Hupperich, C. Rossow, and T. Holz, “Exit from hell? reducing theimpact of amplification ddos attacks,” in USENIX Security Symposium, 2014.
[13] MANRS, https://www.manrs.org/isps/participants/, 2020.
[14] MANRS, Network Operator Participants, https : / / www . manrs . org / isps /participants/, 2020.
[15] A. Filasto and J. Appelbaum, “Ooni: Open observatory of network interference.,”in FOCI, 2012.
103

104 BIBLIOGRAPHY
[16] A. Tirumala, F. Qin, J. Dugan, J. Ferguson, and K. Gibbs, “Iperf: The tcp/udp band-width measurement tool,” 2005.
[17] W. Matthews and L. Cottrell, “The pinger project: Active internet performancemonitoring for the henp community,” IEEE Comm. Magazine, vol. 38, no. 5, 2000.
[18] NDT, www.measurementlab.net/tools/ndt/.
[19] R. Hiran, N. Carlsson, and N. Shahmehri, “Crowd-based detection of routing anoma-lies on the internet,” in Communications and Network Security (CNS), 2015 IEEEConference on, IEEE, 2015, pp. 388–396.
[20] R. Beverly and S. Bauer, “The Spoofer project: Inferring the extent of source ad-dress filtering on the Internet,” in Usenix Sruti, 2005.
[21] RIPE Atlas, https://atlas.ripe.net/.
[22] Samknows, https://www.samknows.com/.
[23] D. Karrenberg, [atlas] "Spoofing" tests, https://www.ripe.net/ripe/mail/archives/ripe-atlas/2013-September/001026.html.
[24] Planet Lab, https://www.planet-lab.org/.
[25] S. Sundaresan, S. Burnett, N. Feamster, and W. De Donato, “Bismark: A testbedfor deploying measurements and applications in broadband access networks.,”in USENIX ATC, 2014.
[26] SpamHaus, 2020. [Online]. Available: %5Curl%7Bhttps://www.spamhaus.org/%7D.
[27] M. Prince, Technical details behind a 400Gbps NTP amplification DDoS attack,http://blog.cloudflare.com/, Feb. 2014.
[28] Crowdsourcing Tools, https://github.com/qblone/crowdsourcingTools.
[29] W. Mason and S. Suri, “Conducting behavioral research on amazon’s mechanicalturk,” Behavior research methods, vol. 44, no. 1, 2012.
[30] M. Restivo and A. van de Rijt, “No praise without effort: Experimental evidenceon how rewards affect wikipedia’s contributor community,” ICS, vol. 17, no. 4,2014.
[31] A. Sorokin and D. Forsyth, “Utility data annotation with amazon mechanical turk,”in CVPRW’08, IEEE, 2008.
[32] S. Branson, C. Wah, F. Schroff, et al., “Visual recognition with humans in theloop,” ECCV, 2010.
[33] J. Ross, L. Irani, M. Silberman, A. Zaldivar, and B. Tomlinson, “Who are the crowd-workers?: Shifting demographics in mechanical turk,” in CHI’10.
[34] A. Kittur, E. H. Chi, and B. Suh, “Crowdsourcing user studies with mechanicalturk,” in ACM SIGCHI, 2008.
[35] P. Dai, Mausam, and D. S. Weld, “Decision-theoretic control of crowd-sourcedworkflows,” in AAAI-10, Atlanta, Georgia, pp. 1168–1174. [Online]. Available: http://dl.acm.org/citation.cfm?id=2898607.2898793.

BIBLIOGRAPHY 105
[36] J. J. Horton and L. B. Chilton, “The labor economics of paid crowdsourcing,” inACM EC, ACM, 2010.
[37] N. Christin, S. Egelman, T. Vidas, and J. Grossklags, “It’s all about the benjamins:An empirical study on incentivizing users to ignore security advice,” in FC’11.
[38] C. Kanich, S. Checkoway, and K. Mowery, “Putting out a hit: Crowdsourcing mal-ware installs.,” in WOOT, 2011.
[39] G. Huz, S. Bauer, R. Beverly, et al., “Experience in using mturk for network mea-surement,” in SIGCOMM C2B(I)D Workshop, 2015.
[40] M. Varvello, J. Blackburn, D. Naylor, and K. Papagiannaki, “Eyeorg: A platform forcrowdsourcing web quality of experience measurements,” in CoNEXT’16.
[41] R. K. P. Mok, R. K. C. Chang, and W. Li, “Detecting low-quality workers in QoEcrowdtesting: A worker behavior-based approach,” IEEE Transactions on Multi-media, vol. 19, 3.
[42] R. Beverly, A. Berger, Y. Hyun, and k. claffy k, “Understanding the efficacy of de-ployed Internet source address validation filtering,” ser. IMC ’09.
[43] R. Beverly and S. Bauer, “Tracefilter: A tool for locating network source addressvalidation filters,” in USENIX Security Poster, 2007.
[44] Slashdot: Can you spoof IP packets? https://slashdot.org/story/06/05/02/1729257/can-you-spoof-ip-packets.
[45] www.behind- the- enemy- lines.com/2010/10/explosion- of- micro-crowdsourcing.html.
[46] E. Peer, S. Samat, L. Brandimarte, and A. Acquisti, “Beyond the turk: An empiri-cal comparison of alternative platforms for crowdsourcing online behavioral re-search,”
[47] D. Vakharia and M. Lease, “Beyond mechanical turk: An analysis of paid crowdwork platforms,” in iConference, 2015.
[48] Crowd Flower, http://www.crowdflower.com/.
[49] Cloudfactory, https://www.cloudfactory.com/.
[50] upwork, https://www.upwork.com/.
[51] Amazon Mechanical Turk, https://www.mturk.com/.
[52] Prolific, https://www.prolific.ac/.
[53] Rapidworkers, http://rapidworkers.com/.
[54] JobBoy, http://www.jobboy.com/.
[55] Minijobz, https://minijobz.com/.
[56] H. Asghari, “Cybersecurity via intermediaries: Analyzing security measurementsto understand intermediary incentives and inform public policy,” in 2016, ch. 3.
[57] Amount of the minimum wage, www.government.nl/topics/minimum-wage/contents/amount-of-the-minimum-wage.

106 BIBLIOGRAPHY
[58] S. Bellovin, “Security problems in the TCP/IP protocol suite,” CCR, vol. 19, no. 2,pp. 32–48, 1989.
[59] R. Beverly and S. Bauer, “The spoofer project: Inferring the extent of source ad-dress filtering on the Internet,” in Proceedings of USENIX SRUTI, Jul. 2005.
[60] R. Beverly, A. Berger, Y. Hyun, and k claffy, “Understanding the efficacy of de-ployed Internet source address validation,” in IMC, Nov. 2009, pp. 356–369.
[61] R. Beverly, R. Koga, and kc claffy, Initial longitudinal analysis of IP source spoofingcapability on the Internet, http://www.internetsociety.org/, Jul. 2013.
[62] M. Prince, Technical details behind a 400Gbps NTP amplification DDoS attack,http://blog.cloudflare.com/, Feb. 2014.
[63] P. Vixie, “Rate-limiting state: The edge of the Internet is an unruly place,” ACMQueue, vol. 12, no. 2, pp. 1–5, Feb. 2014.
[64] F. Baker and P. Savola, “Ingress filtering for multihomed networks,” RFC 3704,Mar. 2004, IETF BCP84.
[65] Spoofer, https://www.caida.org/projects/spoofer/.
[66] Open Resolver Project. [Online]. Available: http : / / openresolverproject .org/.
[67] J. Xia, L. Gao, and T. Fei, “A measurement study of persistent forwarding loops onthe internet,” Computer Networks, vol. 51, no. 17, pp. 4780–4796, 2007.
[68] M. Luckie, A. Dhamdhere, B. Huffaker, D. Clark, and k claffy, “Bdrmap: Inferenceof borders between IP networks,” in IMC, Nov. 2016. [Online]. Available: https://www.caida.org/~mjl/pubs/bdrmap.pdf.
[69] A. Marder and J. M. Smith, “MAP-IT: Multipass accurate passive inferences fromtraceroute,” in IMC, Nov. 2016.
[70] M. Luckie, “Scamper: A scalable and extensible packet prober for active measure-ment of the Internet,” in IMC, Nov. 2010, pp. 239–245.
[71] B. Augustin, X. Cuvellier, B. Orgogozo, et al., “Avoiding traceroute anomalies withParis traceroute,” in IMC, Oct. 2006, pp. 153–158.
[72] M. Luckie, B. Huffaker, A. Dhamdhere, V. Giotsas, and k claffy, “AS relationships,customer cones, and validation,” in IMC, Oct. 2013, pp. 243–256.
[73] B. Huffaker, K. Keys, R. Koga, and kc claffy, CAIDA inferred AS to organizationmapping dataset, https://www.caida.org/data/as-organizations/.
[74] P. Francois and O. Bonaventure, “Avoiding transient loops during igp convergencein ip networks,” in INFOCOM, Mar 2005, pp. 237–247.
[75] Mutually Agreed Norms for Routing Security (MANRS). [Online]. Available: https://www.routingmanifesto.org/manrs/.
[76] Q. Lone, M. Luckie, M. Korczynski, and M. van Eeten, “Using Loops Observedin Traceroute to Infer the Ability to Spoof,” in Passive and Active MeasurementConference, 2017.

BIBLIOGRAPHY 107
[77] F. Baker and P. Savola, Rfc3704: Ingress filtering for multihomed networks, 2004.
[78] D. Senie and P. Ferguson, Network Ingress Filtering: Defeating Denial of ServiceAttacks which employ IP Source Address Spoofing, RFC 2827, May 2000. [Online].Available: https://rfc-editor.org/rfc/rfc2827.txt.
[79] C. Rossow, “Amplification Hell: Revisiting Network Protocols for DDoS Abuse,”in NDSS, 2014.
[80] R. Beverly and S. Bauer, “The Spoofer Project: Inferring the Extent of Source Ad-dress Filtering on the Internet,” in USENIX Steps to Reducing Unwanted Traffic onthe Internet (SRUTI) Workshop, Jul. 2005.
[81] M. Korczynski, Y. Nosyk, Q. Lone, M. Skwarek, B. Jonglez, and A. Duda, “Don’tForget to Lock the Front Door! Inferring the Deployment of Source Address Vali-dation of Inbound Traffic,” in Passive and Active Measurement Conference (PAM),2020.
[82] M. Kührer, T. Hupperich, C. Rossow, and T. Holz, “Exit from Hell? Reducing theImpact of Amplification DDoS Attacks,” in 23th USENIX Security Symposium (USENIXSecurity 14), 2014.
[83] Q. Lone, M. Luckie, M. Korczynski, H. Asghari, M. Javed, and M. van Eeten, “UsingCrowdsourcing Marketplaces for Network Measurements: The Case of Spoofer,”in Traffic Monitoring and Analysis Conference, 2018.
[84] M. Luckie, R. Beverly, R. Koga, K. Keys, J. A. Kroll, and k. claffy k, “Network hy-giene, incentives, and regulation: Deployment of source address validation in theinternet,” in Proceedings of the 2019 ACM SIGSAC Conference on Computer andCommunications Security, 2019, pp. 465–480.
[85] J. Mauch, Spoofing ASNs, http://seclists.org/nanog/2013/Aug/132, 2013.
[86] The Closed Resolver Project, https://closedresolver.com.
[87] M. Korczynski, Y. Nosyk, Q. Lone, M. Skwarek, B. Jonglez, and A. Duda, “Inferringthe Deployment of Inbound Source Address Validation Using DNS Resolvers,” inThe Applied Networking Research Workshop 2020 (ANRW), 2020.
[88] S. Tajalizadehkhoob, R. Böhme, C. Gañán, M. Korczynski, and M. van Eeten, “Rot-ten Apples or Bad Harvest? What We Are Measuring When We Are MeasuringAbuse,” ACM Trans. Internet Techn., vol. 18, no. 4, 49:1–49:25, 2018.
[89] A. Noroozian, M. Ciere, M. Korczynski, S. Tajalizadehkhoob, and M. van Eeten,“Inferring security performance of providers from noisy and heterogenous abusedatasets,” in WEIS, 2017.
[90] M. Korczynski, S. Tajalizadehkhoob, A. Noroozian, M. Wullink, C. Hesselman, andM. van Eeten, “Reputation Metrics Design to Improve Intermediary Incentivesfor Security of TLDs,” in 2017 IEEE European Symposium on Security and Privacy,EuroS&P, 2017, pp. 579–594.
[91] M. Korczynski, M. Wullink, S. Tajalizadehkhoob, et al., “Cybercrime after the sun-rise: A statistical analysis of DNS abuse in new gtlds,” in Proceedings of the 2018on Asia Conference on Computer and Communications Security, (AsiaCCS 2018),2018, pp. 609–623.

108 BIBLIOGRAPHY
[92] J. Zhang, Z. Durumeric, M. Bailey, M. Liu, and M. Karir, “On the mismanagementand maliciousness of networks,” in Network and Distributed System Security Sym-posium (NDSS), The Internet Society, 2014.
[93] A. McConachie, Anti-Spoofing, BCP 38, and the Tragedy of the Commons. [On-line]. Available: %5Curl%7Bhttps://www.internetsociety.org/blog/2014/07/anti-spoofing-bcp-38-and-the-tragedy-of-the-commons/%7D.
[94] TeleGeography, https://www.telegeography.com/products/globalcomms/,2020.
[95] ITU, http://www.itu.int/net4/ITU-D/idi/2017/index.html, 2020.
[96] M. Van Eeten, J. M. Bauer, H. Asghari, S. Tabatabaie, and D. Rand, “The role ofinternet service providers in botnet mitigation an empirical analysis based onspam data,” TPRC, 2010.
[97] CAIDA, AS Rank IPv4, 2020. [Online]. Available: %5Curl%7Bhttps://asrank.caida.org/%7D.
[98] Hurricane Electric Toolkit, 2020. [Online]. Available: %5Curl%7Bhttps://bgp.he.net/%7D.
[99] University of Oregon Route Views Project, http : / / www . routeviews . org /routeviews/, 2020.
[100] M. LLC, Maxmind geoip, 2020. [Online]. Available: https://www.maxmind.com/en/geoip2-databases.
[101] M. Skwarek, M. Korczynski, W. Mazurczyk, and A. Duda, “Characterizing vulner-ability of DNS AXFR transfers with global-scale scanning,” in 2019 IEEE Securityand Privacy Workshops, 2019, pp. 193–198.
[102] H. Asghari, “pyasn–Python IP address to autonomous system number lookupmodule,” URL: https://github.com/hadiasghari/pyasn,
[103] R. Bush, “Origin Validation Operation Based on the Resource Public Key Infras-tructure (RPKI),” IETF RFC7115 (January 2014), 2014.
[104] Routinator 3000, 2020. [Online]. Available: %5Curl%7Bhttps://www.nlnetlabs.nl/projects/rpki/routinator/%7D.
[105] J. M. Bauer and M. J. Van Eeten, “Cybersecurity: Stakeholder incentives, external-ities, and policy options,” Telecommunications Policy, vol. 33, no. 10-11, pp. 706–719, 2009.
[106] R. Padmanabhan, A. Dhamdhere, E. Aben, k. claffy kc., and N. Spring, “ReasonsDynamic Addresses Change,” in Internet Measurement Conference, ACM, Nov.2016.
[107] Rapid7, 2020. [Online]. Available: %5Curl%7Bhttps://opendata.rapid7.com/sonar.udp/%7D.
[108] UDP-Based Amplification Attacks, 2020. [Online]. Available: %5Curl%7Bhttps://www.us-cert.gov/ncas/alerts/TA14-017A%7D.

BIBLIOGRAPHY 109
[109] Resource Public Key Infrastructure (RPKI), 2020. [Online]. Available: %5Curl%7Bhttps://www.ripe.net/manage-ips-and-asns/resource-management/certification/resource-certification-roa-management%7D.
[110] Let’s Encrypt, 2020. [Online]. Available: %5Curl%7Bhttps://letsencrypt.org/%7D.
[111] Using Cloud Resources to Dramatically Improve Internet Routing. [Online]. Avail-able: %5Curl%7Bhttps://www.umass.edu/newsoffice/article/using-cloud-resources-dramatically-improve%7D.
[112] NOIA Network, 2020. [Online]. Available: %5Curl%7Bhttps://noia.network/technology%7D.
[113] P. Bosshart, D. Daly, G. Gibb, et al., “P4: Programming protocol-independent packetprocessors,” ACM SIGCOMM Computer Communication Review, vol. 44, no. 3,pp. 87–95, 2014.
[114] NANOG 2020, 2020. [Online]. Available: %5Curl%7Bhttps://mailman.nanog.org/pipermail/nanog/2020-April/107356.html%7D.
[115] BGP hijacker booted off the Internet’s backbone. [Online]. Available: %5Curl%7Bwww.theregister.co.uk/2018/07/11/bgp%5C_hijacker%5C_booted%5C_off%5C_the%5C_internets%5C_backbone%7D.
[116] Cogent cut off from ARIN Whois. [Online]. Available: %5Curl%7Bwww.theregister.co.uk/2020/01/09/arin%5C_boots%5C_cogent%7D.
[117] Amazon ‘thwarts largest ever DDoS cyber-attack’, https://www.bbc.com/news/technology-53093611, 2020.
[118] NET SCOUT THREAT INTELLIGENCE REPORT, https://www.netscout.com/sites/default/files/2020-02/SECR_001_EN-2001_Web.pdf, 2020.
[119] M. Maass, A. Stöver, H. Pridöhl, et al., “Effective notification campaigns on theweb: A matter of trust, framing, and support,” in 30th {USENIX} Security Sympo-sium ({USENIX} Security 21), 2021.
[120] M. Carvalho, J. DeMott, R. Ford, and D. A. Wheeler, “Heartbleed 101,” IEEE Secu-rity & Privacy, vol. 12, no. 4, pp. 63–67, 2014.
[121] Z. Durumeric, F. Li, J. Kasten, et al., “The matter of heartbleed,” in Proceedings ofthe 2014 conference on internet measurement conference, 2014, pp. 475–488.
[122] F. Li, Z. Durumeric, J. Czyz, et al., “You’ve got vulnerability: Exploring effectivevulnerability notifications,” in 25th USENIX Security Symposium (USENIX Secu-rity 16), 2016, pp. 1033–1050.
[123] Q. Lone, M. Korczynski, C. Gañán, and M. van Eeten, “Saving the internet: Ex-plaining the adoption of source address validation by internet service providers,”in Workshop on the Economics of Information Security, 2020.
[124] M. Korczynski, Y. Nosyk, Q. Lone, M. Skwarek, B. Jonglez, and A. Duda, “Infer-ring the deployment of inbound source address validation using dns resolvers,”in Proceedings of the Applied Networking Research Workshop, 2020, pp. 9–11.

110 BIBLIOGRAPHY
[125] R. Beverly, A. Berger, Y. Hyun, and k. claffy k., “Understanding the Efficacy ofDeployed Internet Source Address Validation Filtering,” in Internet MeasurementConference, ACM, 2009.
[126] O. Cetin, C. Ganán, L. Altena, S. Tajalizadehkhoob, and M. van Eeten, “Tell meyou fixed it: Evaluating vulnerability notifications via quarantine networks,” in2019 IEEE European Symposium on Security and Privacy (EuroS&P), IEEE, 2019,pp. 326–339.
[127] R. Client, https://about.rdap.org/, 2020.
[128] B. Stock, G. Pellegrino, F. Li, M. Backes, and C. Rossow, “Didn’t you hear me?—towardsmore successful web vulnerability notifications,” 2018.
[129] B. Stock, G. Pellegrino, C. Rossow, M. Johns, and M. Backes, “Hey, you have aproblem: On the feasibility of large-scale web vulnerability notification,” in 25thUSENIX Security Symposium (USENIX Security 16), 2016, pp. 1015–1032.
[130] O. Cetin, M. Hanif Jhaveri, C. Gañán, M. van Eeten, and T. Moore, “Understandingthe role of sender reputation in abuse reporting and cleanup,” Journal of Cyber-security, vol. 2, no. 1, pp. 83–98, 2016.
[131] O. Cetin, C. Ganan, M. Korczynski, and M. van Eeten, “Make notifications greatagain: Learning how to notify in the age of large-scale vulnerability scanning,” inWorkshop on the Economics of Information Security (WEIS), 2017.
[132] R. H. Thaler and C. R. Sunstein, “Libertarian paternalism,” American economicreview, vol. 93, no. 2, pp. 175–179, 2003.
[133] Thaler, Richard H and Sunstein, Cass R, Nudge: Improving decisions about health,wealth, and happiness. Penguin, 2009.
[134] C. R. Sunstein, “Nudging: A very short guide,” in The Handbook of Privacy Studies,Amsterdam University Press, 2018, pp. 173–180.
[135] E. Peer, S. Egelman, M. Harbach, N. Malkin, A. Mathur, and A. Frik, “Nudge meright: Personalizing online security nudges to people’s decision-making styles,”Computers in Human Behavior, vol. 109, p. 106 347, 2020.
[136] A. Frik, N. Malkin, M. Harbach, E. Peer, and S. Egelman, “A promise is a promise:The effect of commitment devices on computer security intentions,” in Proceed-ings of the 2019 CHI Conference on Human Factors in Computing Systems, 2019,pp. 1–12.
[137] A. Acquisti, I. Adjerid, R. Balebako, et al., “Nudges for privacy and security: Under-standing and assisting users’ choices online,” ACM Computing Surveys (CSUR),vol. 50, no. 3, pp. 1–41, 2017.
[138] M. Nagatsu, “Social nudges: Their mechanisms and justification,” Review of Phi-losophy and Psychology, vol. 6, no. 3, pp. 481–494, 2015.
[139] A. Brandon, P. J. Ferraro, J. A. List, R. D. Metcalfe, M. K. Price, and F. Rundhammer,“Do the effects of social nudges persist? theory and evidence from 38 natural fieldexperiments,” National Bureau of Economic Research, Tech. Rep., 2017.

BIBLIOGRAPHY 111
[140] H. C. Kelman and V. L. Hamilton, Crimes of obedience: Toward a social psychologyof authority and responsibility. Yale University Press, 1989.
[141] R. B. Cialdini, “The psychology of persuasion,” New York, 1993.
[142] Cialdini, Robert B, “The science of persuasion,” Scientific American, vol. 284, no. 2,pp. 76–81, 2001.
[143] A. Falk and U. Fischbacher, “A theory of reciprocity,” Games and economic behav-ior, vol. 54, no. 2, pp. 293–315, 2006.
[144] A. W. Gouldner, “The norm of reciprocity: A preliminary statement,” Americansociological review, pp. 161–178, 1960.
[145] J. Berg, J. Dickhaut, and K. McCabe, “Trust, reciprocity, and social history,” Gamesand economic behavior, vol. 10, no. 1, pp. 122–142, 1995.
[146] E. Fehr and S. Gächter, “Fairness and retaliation: The economics of reciprocity,”Journal of economic perspectives, vol. 14, no. 3, pp. 159–181, 2000.
[147] M. A. Nowak and K. Sigmund, “Evolution of indirect reciprocity,” Nature, vol. 437,no. 7063, pp. 1291–1298, 2005.
[148] I. Seinen and A. Schram, “Social status and group norms: Indirect reciprocity in arepeated helping experiment,” European economic review, vol. 50, no. 3, pp. 581–602, 2006.
[149] PeeringDB, https://www.peeringdb.com, 2020.
[150] F. of Incident Response and S. Teams, https://www.first.org/, 2020.
[151] S. E. Institute, https://www.sei.cmu.edu/our- work/cybersecurity-center-development/national-csirts/, 2020.
[152] M. Kührer, T. Hupperich, J. Bushart, C. Rossow, and T. Holz, “Going Wild: Large-Scale Classification of Open DNS Resolvers,” in Internet Measurement Confer-ence, ACM, 2015.
[153] A. Lodhi, N. Larson, A. Dhamdhere, C. Dovrolis, and K. Claffy, “Using peeringdbto understand the peering ecosystem,” ACM SIGCOMM Computer Communica-tion Review, vol. 44, no. 2, pp. 20–27, 2014.
[154] T. Böttger, F. Cuadrado, and S. Uhlig, “Looking for hypergiants in peeringdb,”ACM SIGCOMM Computer Communication Review, vol. 48, no. 3, pp. 13–19, 2018.
[155] A. Kühberger, “The framing of decisions: A new look at old problems,” Organiza-tional Behavior and Human Decision Processes, vol. 62, no. 2, pp. 230–240, 1995.
[156] R. J. Donovan and G. Jalleh, “Positive versus negative framing of a hypotheticalinfant immunization: The influence of involvement,” Health Education & Behav-ior, vol. 27, no. 1, pp. 82–95, 2000.
[157] D. H. Rosenblatt, S. Bode, H. Dixon, et al., “Health warnings promote healthierdietary decision making: Effects of positive versus negative message framing andgraphic versus text-based warnings,” Appetite, vol. 127, pp. 280–288, 2018.
[158] J. E. Grizzle, “A note on stratifying versus complete random assignment in clinicaltrials,” Controlled clinical trials, vol. 3, no. 4, pp. 365–368, 1982.

112 BIBLIOGRAPHY
[159] J. Van Der Ham, “Ethics and internet measurements,” in 2017 IEEE Security andPrivacy Workshops (SPW), IEEE, 2017, pp. 247–251.
[160] E. Kenneally and D. Dittrich, “The Menlo Report: Ethical Principles Guiding In-formation and Communication Technology Research,” en, SSRN Electronic Jour-nal, 2012, ISSN: 1556-5068. DOI: 10.2139/ssrn.2445102. (visited on 12/08/2021).
[161] O. R. Understanding Relative Risk and R. Terms, https : / / www . pitt . edu /~bertsch/risk.pdf, 2020.
[162] M. for Network Operators, https://www.manrs.org/isps/, 2021.
[163] CAIDA, Macroscopic Internet Topology Data Kit (ITDK), https://www.caida.org/data/internet-topology-data-kit/, 2020.
[164] K. Keys, Y. Hyun, M. Luckie, and K. Claffy, “Internet-scale ipv4 alias resolutionwith midar,” IEEE/ACM Transactions on Networking, vol. 21, no. 2, pp. 383–399,2012.
[165] A. Marder, M. Luckie, A. Dhamdhere, B. Huffaker, K. Claffy, and J. M. Smith, “Push-ing the boundaries with bdrmapit: Mapping router ownership at internet scale,”in Proceedings of the Internet Measurement Conference 2018, 2018, pp. 56–69.
[166] X. Dimitropoulos, D. Krioukov, M. Fomenkov, B. Huffaker, Y. Hyun, G. Riley, et al.,“AS relationships: Inference and Validation,” ACM SIGCOMM Computer Commu-nication Review, vol. 37, no. 1, pp. 29–40, 2007.
[167] MANRS Implementation Guide, https : / / www . manrs . org / isps / guide /antispoofing/, 2020.
[168] RIPE 81, https://ripe81.ripe.net/archives/video/420/, 2020.
[169] RIPE Roundtable, https://www.ripe.net/participate/meetings/roundtable/january - 2017 / presentations / security - and - the - ripe - community,2020.
[170] NANOG 2018, https : / / pc . nanog . org / static / published / meetings /NANOG2019/1838/20180921_Wittkop_Routing_Security_Ddos_v1.pdf,2020.
[171] NANOG75, https://pc.nanog.org/static/published/meetings/NANOG75/1887/20190219_Compton_Ebgp_Flowspec_Peering_v1.pdf, 2020.
[172] NANOG 2018, https://www.internetsociety.org/issues/manrs/, 2020.
[173] M. Vasek and T. Moore, “Do malware reports expedite cleanup? an experimentalstudy.,” in CSET, 2012.
[174] M. Vasek, M. Weeden, and T. Moore, “Measuring the impact of sharing abusedata with web hosting providers,” in Proceedings of the 2016 ACM on Workshopon Information Sharing and Collaborative Security, 2016, pp. 71–80.
[175] W. Soussi, M. Korczynski, S. Maroofi, and A. Duda, “Feasibility of large-scale vul-nerability notifications after gdpr,” in 2020 IEEE European Symposium on Secu-rity and Privacy Workshops (EuroS&PW), IEEE, 2020, pp. 532–537.

BIBLIOGRAPHY 113
[176] E. Zeng, F. Li, E. Stark, A. P. Felt, and P. Tabriz, “Fixing https misconfigurations atscale: An experiment with security notifications,” 2019.
[177] RIPE IP Anti-Spoofing Task Force, https://www.ripe.net/participate/ripe/tf/anti-spoofing, 2021.
[178] NANOG75, https://pc.nanog.org/static/published/meetings/NANOG75/1956/20190219_Levy_Lightning_Talk_Dropping_v1.pdf, 2020.
[179] BGP hijacker booted off the Internet’s backbone, https://www.theregister.com/2018/07/11/bgp_hijacker_booted_off_the_internets_backbone,2020.
[180] S. M. Diop, J. D. Ndibwile, D. Fall, S. Kashihara, and Y. Kadobayashi, “To coerceor not to coerce? a quantitative investigation on cybersecurity and cybercrimelegislations towards large-scale vulnerability notifications,” in 2019 IEEE Inter-national Symposium on Software Reliability Engineering Workshops (ISSREW),IEEE, 2019, pp. 282–287.
[181] G. C. Moura, C. Ganán, Q. Lone, P. Poursaied, H. Asghari, and M. van Eeten, “Howdynamic is the isps address space? towards internet-wide dhcp churn estima-tion,” in 2015 IFIP Networking Conference (IFIP Networking), IEEE, 2015, pp. 1–9.
[182] Network hygiene pays off - the business case for ip source address verification,https://www.ripe.net/publications/docs/ripe-432.
[183] CAIDA, The Spoofer Project, https://spoofer.caida.org/summary.php.
[184] RIPE NCC, Abuse Contact Management in the RIPE Database, https://www.ripe.net/publications/docs/ripe-705, 2020.
[185] T. Tenbensel, “Multiple modes of governance: Disentangling the alternatives tohierarchies and markets,” Public Management Review, vol. 7, no. 2, pp. 267–288,2005.
[186] W. W. Powell et al., “Neither market nor hierarchy: Network forms of organiza-tion,” ThFr91, pp. 265–276, 1991.
[187] Stichting DINL, https://www.dinl.nl/nieuws/samenwerking-bestrijding-online-content-kindermisbruik/, 2021.
[188] OECD, https://www.oecd.org/sti/ieconomy/45509366.pdf, 2021.
[189] ENTERPRISE ROUTERS MARKET GROWTH, TRENDS, COVID-19 IMPACT, ANDFORECASTS, https://www.mordorintelligence.com/industry-reports/enterprise-routers-market.
[190] FTC, https://www.ftc.gov/enforcement/cases-proceedings/132-3157/d-link.
[191] https://www.itgovernance.eu/nl-nl/nis-directive-nl.
[192] The NOTICE Project to Survey IoT Devices and to Alert Users, https://www.nict.go.jp/en/press/2019/02/01-1.html.

114 BIBLIOGRAPHY
[193] M. van Eeten, Q. Lone, G. Moura, H. Asghari, and M. Korczynski, “Evaluatingthe impact of AbuseHUB on Botnet mitigation,” arXiv preprint arXiv:1612.03101,2016.
[194] Dutch Continuity Board, https://www.dcboard.nl/about-us.

AAPPENDIX A
A.1. NOTIFICATION TEXT
A.1.1. DIRECT NOTIFICATIONS – BASELINE
Subject : Possible IP spoofing from AS X
We are security researchers from Delft University of Technology (TU Delft). We haveconducted a test to detect potential IP spoofing.
DETECTED ISSUE: We have observed that your network may be allowing IP spoofing.You can check the test results at: [LINK]
WHAT TO DO: We encourage you to deploy Source Address Validation (BCP38) in yournetwork today: https://www.manrs.org/isps/guide/antispoofing/
HOW TO VALIDATE: Please run the Spoofer tool to validate if BCP38 was implementedcorrectly: https://www.caida.org/projects/spoofer/#software
CONTACT: If you have any questions, concerns, issues, or comments, please send anemail to [email protected]
A.1.2. DIRECT NOTIFICATION – SOCIAL NUDGE
Subject : Possible IP spoofing from AS X
We are security researchers from Delft University of Technology (TU Delft). We haveconducted a test to detect potential IP spoofing.
DETECTED ISSUE: We have observed that your network may be allowing IP spoofing.You can check the test results at: [LINK]
WHAT TO DO: We encourage you to deploy Source Address Validation (BCP38) in yournetwork today: https://www.manrs.org/isps/guide/antispoofing/.
115

116 A. APPENDIX A
Note that 75% of network operators in the world already deploy BCP38 in their networks.Deploy BCP38 in your network to become one of them.
HOW TO VALIDATE: Please run the Spoofer tool to validate if BCP38 was implementedcorrectly: https://www.caida.org/projects/spoofer/#software
CONTACT: If you have any questions, concerns, issues, or comments, please send anemail to [email protected]
A.1.3. DIRECT NOTIFICATION – RECIPROCITY
Subject : Possible IP spoofing from AS X
We are security researchers from Delft University of Technology (TU Delft). We haveconducted a test to detect potential IP spoofing.
DETECTED ISSUE: We have observed that your network may be allowing IP spoofing.You can check the test results at: [LINK]
WHAT TO DO: We encourage you to deploy Source Address Validation (BCP38) in yournetwork today: https://www.manrs.org/isps/guide/antispoofing/.
Note that your network is receiving fewer DDoS attacks because other networks havedeployed BCP38. Return the favor - deploy BCP38 in your network to make the Internetmore secure.
HOW TO VALIDATE: Please run the Spoofer tool to validate if BCP38 was implementedcorrectly: https://www.caida.org/projects/spoofer/#software
CONTACT: If you have any questions, concerns, issues, or comments, please send anemail to [email protected]
A.1.4. CERT NOTIFICATION – BASELINE
Subject : Possible IP Spoofing from ASes in COUNTRY
We are security researchers from Delft University of Technology (TU Delft). We haveconducted a test to detect potential IP spoofing.
We have observed that certain network operators in your country may be allowing IPspoofing. You can check the test results at: [LINK]
We encourage you to recommend those operators to deploy Source Address Validation(BCP38) in their network.
For your convenience, we tailored a draft of the notification for the network operators.This draft has been tested for clarity and comprehension and has been validated by theexperts. We highly recommend you including this draft in your notification to the net-work operators.
DRAFT OF THE NOTIFICATION: Security researchers from Delft University of Technol-ogy (TU Delft) have conducted a test to detect potential IP spoofing.

A.1. NOTIFICATION TEXT 117
DETECTED ISSUE: They have observed that your network may be allowing IP spoofing.You can check the test results at: [LINK] (NOTE: Before sending out the notification,please insert the appropriate AS NUMBER)
WHAT TO DO: We encourage you to deploy Source Address Validation (BCP38) in yournetwork today: https://www.manrs.org/isps/guide/antispoofing/
HOW TO VALIDATE: Please run the Spoofer tool to validate if BCP38 was implementedcorrectly: https://spoofer.caida.org/projects/spoofer/#software
CONTACT: If you have any questions, concerns, issues, or comments, please send anemail to [email protected]
A.1.5. CERT NOTIFICATION–SOCIAL NUDGE
Subject : Possible IP Spoofing from ASes in COUNTRY
We are security researchers from Delft University of Technology (TU Delft). We haveconducted a test to detect potential IP spoofing.
We have observed that certain network operators in your country may be allowing IPspoofing. You can check the test results at: [LINK]
We encourage you to recommend those operators to deploy Source Address Validation(BCP38) in their network.
For your convenience, we tailored a draft of the notification for the network operators.This draft has been tested for clarity and comprehension and has been validated by theexperts. We highly recommend you including this draft in your notification to the net-work operators.
DRAFT OF THE NOTIFICATION: Security researchers from Delft University of Technol-ogy (TU Delft) have conducted a test to detect potential IP spoofing.
DETECTED ISSUE: They have observed that your network may be allowing IP spoofing.You can check the test results at: [LINK] (NOTE: Before sending out the notification,please insert the appropriate AS NUMBER)
WHAT TO DO: We encourage you to deploy Source Address Validation (BCP38) in yournetwork today: https://www.manrs.org/isps/guide/antispoofing/
Note that 75% of network operators in the world already deploy BCP38 in their networks.Deploy BCP38 in your network to become one of them.
HOW TO VALIDATE: Please run the Spoofer tool to validate if BCP38 was implementedcorrectly: https://www.caida.org/projects/spoofer/#software
CONTACT: If you have any questions, concerns, issues, or comments, please send anemail to [email protected]

118 A. APPENDIX A
A.1.6. CERT NOTIFICATION–RECIPROCITY
Subject : Possible IP Spoofing from ASes in COUNTRY
We are security researchers from Delft University of Technology (TU Delft). We haveconducted a test to detect potential IP spoofing.
We have observed that certain network operators in your country may be allowing IPspoofing. You can check the test results at: [LINK]
We encourage you to recommend those operators to deploy Source Address Validation(BCP38) in their network.
For your convenience, we tailored a draft of the notification for the network operators.This draft has been tested for clarity and comprehension and has been validated by theexperts. We highly recommend you including this draft in your notification to the net-work operators.
DRAFT OF THE NOTIFICATION: Security researchers from Delft University of Technol-ogy (TU Delft) have conducted a test to detect potential IP spoofing.
DETECTED ISSUE: They have observed that your network may be allowing IP spoofing.You can check the test results at: [LINK] (NOTE: Before sending out the notification,please insert the appropriate AS NUMBER)
WHAT TO DO: We encourage you to deploy Source Address Validation (BCP38) in yournetwork today: https://www.manrs.org/isps/guide/antispoofing/
Note that your network is receiving fewer DDoS attacks because other networks havedeployed BCP38. Return the favor - deploy BCP38 in your network to make the Internetmore secure.
HOW TO VALIDATE: Please run the Spoofer tool to validate if BCP38 was implementedcorrectly: https://www.caida.org/projects/spoofer/#software
CONTACT: If you have any questions, concerns, issues, or comments, please send anemail to [email protected]
A.1.7. NOG NOTIFICATIONCAIDA’s source address validation measurement project (https://spoofer.caida.org)is automatically generating monthly reports of ASes originating prefixes in BGP for sys-tems from which we received packets with a spoofed source address.
We are publishing these reports to network and security operations lists in order to en-sure this information reaches operational contacts in these ASes. This report summarisestests conducted within ⟨COU N T RY ⟩.

A.2. QUESTIONNAIRE 119
Inferred improvements during ⟨D AT E⟩:
ASN Name Fixed byASNX ASN NAME DATE
Further information for the inferred remediation is available at: https://spoofer.caida.org/remedy.php
Source Address Validation issues inferred using Spoofer tool during ⟨D AT E⟩ :
ASN Name First-Spoofed Last-SpoofedASNX ASN NAME DATE DATE
Further information for these tests where we received spoofed packets using spoofer isavailable at: https://spoofer.caida.org/recent_tests.php?country_include=ccc,ccc&no_block=1
Source Address Validation issues inferred using misconfigured open resolvers during⟨D AT E⟩:
ASN Name First-Spoofed Last-SpoofedASNX ASN NAME DATE DATE
Further information for these tests where we received spoofed packets using open re-solver is available at:
Please send any feedback or suggestions to spoofer-info at caida.org
A.2. QUESTIONNAIREQ1: In your opinion, does your network have any of the following security issues?Choose all that apply
1. Susceptible to Route/Prefix Hijack
2. Does not prevent IP spoofing
3. Susceptible to DDoS
4. None of the above
5. I’m not sure
Q2: How did you discover the issue with IP spoofing? Choose all that apply.
1. I ran a Spoofer test
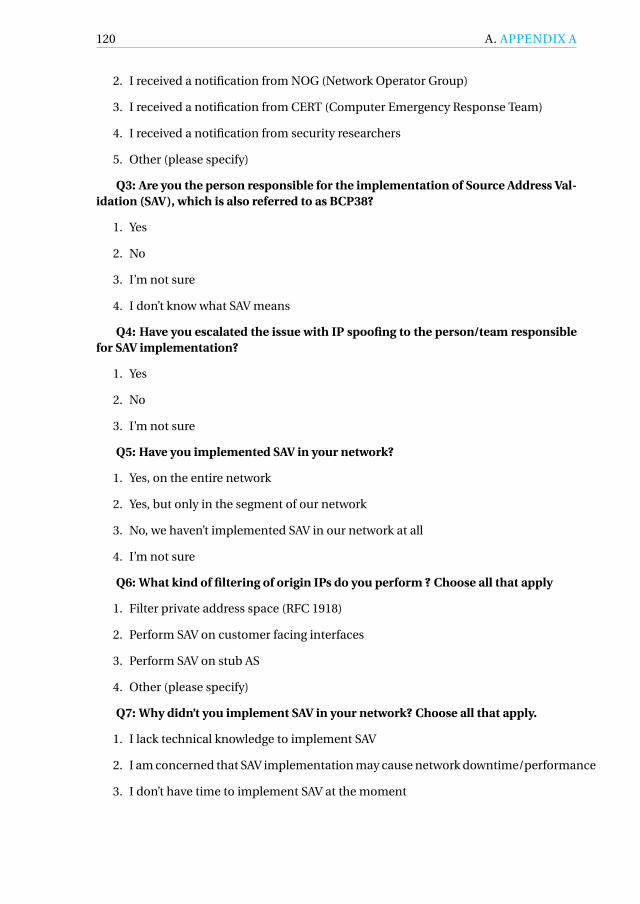
120 A. APPENDIX A
2. I received a notification from NOG (Network Operator Group)
3. I received a notification from CERT (Computer Emergency Response Team)
4. I received a notification from security researchers
5. Other (please specify)
Q3: Are you the person responsible for the implementation of Source Address Val-idation (SAV), which is also referred to as BCP38?
1. Yes
2. No
3. I’m not sure
4. I don’t know what SAV means
Q4: Have you escalated the issue with IP spoofing to the person/team responsiblefor SAV implementation?
1. Yes
2. No
3. I’m not sure
Q5: Have you implemented SAV in your network?
1. Yes, on the entire network
2. Yes, but only in the segment of our network
3. No, we haven’t implemented SAV in our network at all
4. I’m not sure
Q6: What kind of filtering of origin IPs do you perform ? Choose all that apply
1. Filter private address space (RFC 1918)
2. Perform SAV on customer facing interfaces
3. Perform SAV on stub AS
4. Other (please specify)
Q7: Why didn’t you implement SAV in your network? Choose all that apply.
1. I lack technical knowledge to implement SAV
2. I am concerned that SAV implementation may cause network downtime/performance
3. I don’t have time to implement SAV at the moment

A.3. SCREEN SHOT OF WEBSITE 121
4. I don’t think IP spoofing is an important issue
5. I don’t think DDoS (Distributed Denial of Service Attack) is an important issue
6. I don’t think SAV is effective in addressing IP spoofing issues
7. We are running a non-stub network
8. We are running a multi-homed network
9. Other (please specify)
Q8: Are you planning to implement SAV in your network?
1. Yes
2. No
3. I’m not sure
Q9: MANRS provides the following guidelines for implementing SAV: https://www.manrs.org/isps/guide/antispoofing/. Please review the guidelines and tellus your opinion: Do you think the MANRS guidelines a provide sufficient informationon how to to implement SAV in your network?
1. Yes
2. No
3. I’m not sure
Q10:What information, necessary for implementing SAV, is missing in MANRS guide-lines? Please, provide as much details as you can.
A.3. SCREEN SHOT OF WEBSITEBelow is an example for website linked to the notification to AS137612

122 A. APPENDIX A
Figure A.1: Main page with individual reports per IP address for AS137612
Figure A.2: Details about our methodology and steps to reproduce the results

A.3. SCREEN SHOT OF WEBSITE 123
Figure A.3: Explanation of the first case with dynamic IP addresses for the figures
Figure A.4: Explanation of the second case with dynamic IP addresses for the figures