
Final-Project-Assessment-Report-Caloundra-Substation ...
54
Regulatory Investment Test for Distribution (RIT-D) Caloundra Zone Substation Limitation Final Project Assessment Report 22 October 2021
-
Upload
khangminh22 -
Category
Documents
-
view
0 -
download
0
Transcript of Final-Project-Assessment-Report-Caloundra-Substation ...

Regulatory Investment Test for Distribution (RIT-D)
Caloundra Zone Substation Limitation
Final Project Assessment Report
22 October 2021

Final Project Assessment Report
Page 2 of 54
Energex Corporation Limited ABN 50 087 646 062
EXECUTIVE SUMMARY
About Energex
Energex Limited (Energex) is a subsidiary of Energy Queensland Limited and manages the electricity
distribution network in the growing region of South East Queensland which includes the major urban
areas of Brisbane, Gold Coast, Sunshine Coast, Logan, Ipswich, Redlands and Moreton Bay. Our
electricity distribution area runs from the NSW border north to Gympie and west to the base of the
Great Dividing Range.
Our electricity network consists of approximately 54,200 kilometres of powerlines and 680,000 power
poles, along with associated infrastructure such as major substations and power transformers.
Today, we provide distribution services to more than 1.4 million domestic and business connections,
delivering electricity to a population base of around 3.4 million people.
Identified Need
Caloundra Zone Substation (SSCLD) provides electricity supply to approximately 22,000
predominantly residential customers in the Aroona, Caloundra, Currimundi, Meridan Plains, Pelican
Waters and Shelly Beach areas. SSCLD is supplied from the Powerlink Palmwoods injection point
via a 132kV ring network, which also supplies Mooloolaba zone substation (SSMLB), Currimundi
zone substation (SSCMD), Birtinya zone substation (SSBTY), Kawana zone substation (SSKWA),
Alexandra Headlands zone substation (SSAHD) and West Maroochydore zone substation
(SSWMD). There is also a 33kV network that is supplied by Beerwah bulk supply substation
(SSBWH) that provides supply to Woodford zone substation (SSWFD) and Landsborough zone
substation (SSLBH). With new developments in the Bells Creek area, loads are forecast to increase
significantly causing network limitations in the area.
Final Project Assessment Report
Page 3 of 54
Energex Corporation Limited ABN 50 087 646 062
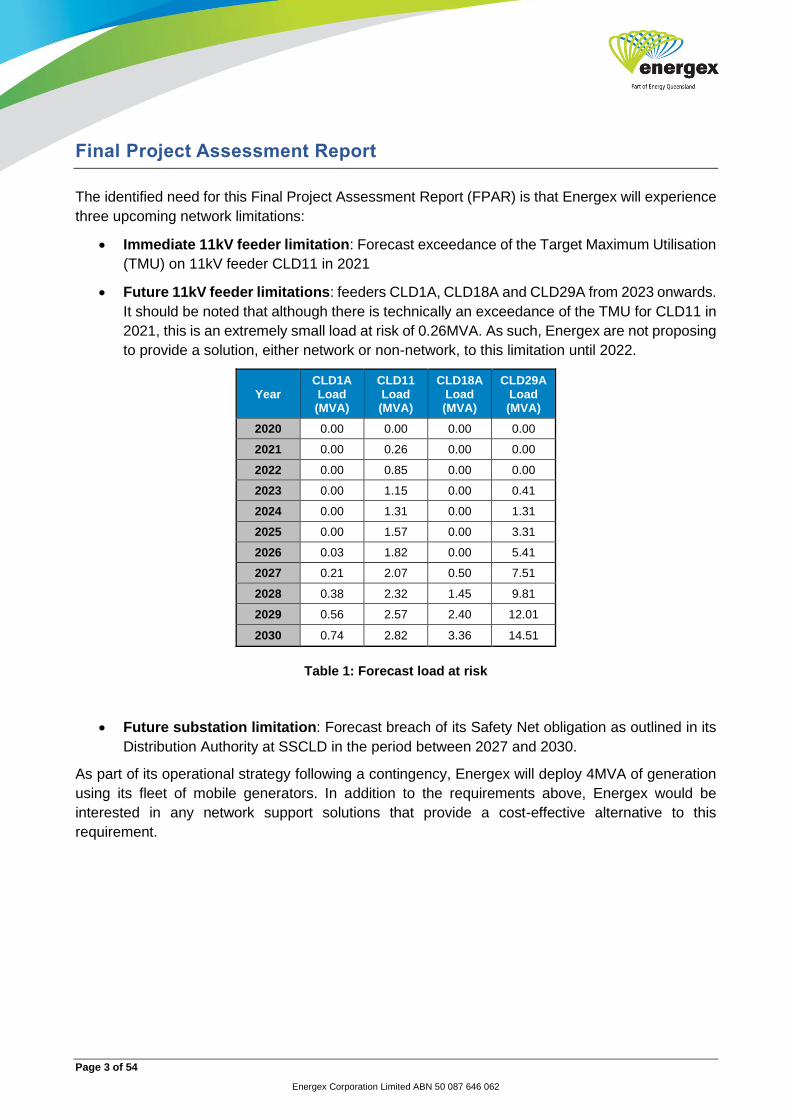
The identified need for this Final Project Assessment Report (FPAR) is that Energex will experience
three upcoming network limitations:
• Immediate 11kV feeder limitation: Forecast exceedance of the Target Maximum Utilisation
(TMU) on 11kV feeder CLD11 in 2021
• Future 11kV feeder limitations: feeders CLD1A, CLD18A and CLD29A from 2023 onwards.
It should be noted that although there is technically an exceedance of the TMU for CLD11 in
2021, this is an extremely small load at risk of 0.26MVA. As such, Energex are not proposing
to provide a solution, either network or non-network, to this limitation until 2022.
Year CLD1A Load (MVA)
CLD11 Load (MVA)
CLD18A Load (MVA)
CLD29A Load (MVA)
2020 0.00 0.00 0.00 0.00
2021 0.00 0.26 0.00 0.00
2022 0.00 0.85 0.00 0.00
2023 0.00 1.15 0.00 0.41
2024 0.00 1.31 0.00 1.31
2025 0.00 1.57 0.00 3.31
2026 0.03 1.82 0.00 5.41
2027 0.21 2.07 0.50 7.51
2028 0.38 2.32 1.45 9.81
2029 0.56 2.57 2.40 12.01
2030 0.74 2.82 3.36 14.51
Table 1: Forecast load at risk
• Future substation limitation: Forecast breach of its Safety Net obligation as outlined in its
Distribution Authority at SSCLD in the period between 2027 and 2030.
As part of its operational strategy following a contingency, Energex will deploy 4MVA of generation
using its fleet of mobile generators. In addition to the requirements above, Energex would be
interested in any network support solutions that provide a cost-effective alternative to this
requirement.

Final Project Assessment Report
Page 4 of 54
Energex Corporation Limited ABN 50 087 646 062
Approach
The National Electricity Rules (NER) require that, subject to certain exclusion criteria, network
business investments for meeting service standards for a distribution business are subject to a
Regulatory Investment Test for Distribution (RIT-D). Energex has determined that network
investment is essential in this case for it to continue to provide electricity to the consumers in the
Caloundra supply area in a reliable, safe and cost-effective manner. Accordingly, this investment is
subject to a RIT-D.
In order to eliminate the load at risk and satisfy the 11kV feeder limitations and Safety Net obligations,
Energex has identified nine network options to address the limitations identified, as below:
• Option 1: Supply New Demand with 11kV Feeders from SSCLD
• Option 2: Supply New Demand with 132kV Feeders (Tee off at Meridan Plains) to Bell’s
Creek Central Establishment
• Option 3: Supply New Demand with 11kV Feeders from SSCLD and Establish 132kV
Feeders, then Supply New Demand with 132kV Feeders (Tee off at Meridan Plains) to Bell’s
Creek Central Establishment
• Option 4: Supply New Demand with 132kV Feeders (Tee off at Meridan Plains) to Bell’s
Creek North Establishment
• Option 5: Supply New Demand with 33kV Feeders from Meridan Plains Establishment to
Bell’s Creek Central Establishment
• Option 6: Supply New Demand with 33kV Feeders from Meridan Plains (132/33/11kV)
Establishment to Bell’s Creek Central Establishment
• Option 7: Supply New Demand with 33kV Feeders from Meridan Plains (132/33kV, 33/11kV)
Establishment to Bell’s Creek Central Establishment
• Option 8: Supply New Demand with 132kV Feeders (Tee off at Mark Rd East) to Bell’s Creek
Central Establishment
• Option 9: Supply New Demand with 132kV Feeders from Caloundra Substation to Bell’s
Creek Central Establishment
Energex published a Non-Network Options Report for the above described network constraint on 16
November 2020 and one submission was received.
One potentially feasible option has been investigated:
• Option 10: Contract a 24MW Battery Energy Storage Solution (BESS)
Energex published a Draft Project Assessment Report (DPAR) for the identified need in the
Caloundra network area on the 16 August 2021. No submissions were received by the closing date
of the 8 October 2021.
Final Project Assessment Report
Page 5 of 54
Energex Corporation Limited ABN 50 087 646 062
This Final Project Assessment Report (FPAR), where Energex provides both technical and economic
information about possible solutions, has been prepared in accordance with the requirements of
clause 5.17.4(o) of the NER.
Energex’s preferred solution to address the identified need is Option 2 - Supply New Demand with
132kV Feeders (Tee off at Meridan Plains) to Bell’s Creek Central Establishment.

Final Project Assessment Report
Page 6 of 54
Energex Corporation Limited ABN 50 087 646 062
CONTENTS
Executive Summary ........................................................................................................................ 2
About Energex ..................................................................................................................................... 2
Identified Need .................................................................................................................................... 2
Approach ............................................................................................................................................. 4
1. Introduction ....................................................................................................................... 8
1.1. Response to the DPAR ............................................................................................................. 8
1.2. Structure of the Report .............................................................................................................. 8
1.3. Dispute Resolution Process ...................................................................................................... 8
1.4. Contact Details .......................................................................................................................... 9
2. Background ..................................................................................................................... 10
2.1. Geographic Region ................................................................................................................. 10
2.2. Existing Supply System .......................................................................................................... 11
2.3. Development Overview and Demand Forecast ...................................................................... 13
2.4. Load Profiles ........................................................................................................................... 14
2.4.1. Load Duration Curve .................................................................................................. 15
3. Identified Need ................................................................................................................ 17
3.1. Applied Service Standard ....................................................................................................... 17
3.1.1. Distribution Network ................................................................................................... 17
3.1.2. Sub-transmission Network ......................................................................................... 17
3.2. Description of the Identified Need ........................................................................................... 18
3.3. Quantification of the Identified Need ....................................................................................... 18
3.3.1. Safety Net Non-Compliance ....................................................................................... 18
3.4. Future Limitation ...................................................................... Error! Bookmark not defined.
3.5. Assumptions in Relation to Identified Need ............................................................................ 25
3.5.1. Forecast Maximum Demand ...................................................................................... 25
3.5.2. Load Profile ................................................................................................................ 25
4. Credible Options Assessed ............................................................................................. 26
4.1. Assessment of Network Solutions .......................................................................................... 26
4.1.1. Initial Limitation Network Option Identified ................................................................. 26
4.1.2. Future Limitation Network Options Identified ............................................................. 26
4.2. Preferred Network Option ....................................................................................................... 27
5. Summary of Submissions Received ................................................................................ 28
5.1. Option 10: Contract a 24MW/39.75MWh Battery Energy Storage Solution (BESS) .............. 28

Final Project Assessment Report
Page 7 of 54
Energex Corporation Limited ABN 50 087 646 062
6. Market Benefit Assessment Methodology ........................................................................ 28
7. Detailed Economic Assessment ...................................................................................... 29
7.1. Methodology ............................................................................................................................ 29
7.2. Key Variables and Assumptions ............................................................................................. 29
7.2.1. Discount Rate ............................................................................................................. 29
7.2.2. Cost Estimates ........................................................................................................... 29
7.2.3. Evaluation Test Period ............................................................................................... 29
7.3. Scenarios Adopted for Sensitivity Testing .............................................................................. 30
7.4. Net Present Value (NPV) Results ........................................................................................... 30
8. Conclusion ...................................................................................................................... 32
8.1. Preferred Option...................................................................................................................... 32
8.2. Satisfaction of RIT-D ............................................................................................................... 32
9. Compliance Statement .................................................................................................... 33
Appendix A – The Rit-D Process ................................................................................................... 34
Appendix B – Future Limitation Network Options .......................................................................... 35
Final Project Assessment Report
Page 8 of 54
Energex Corporation Limited ABN 50 087 646 062
1. INTRODUCTION
This FPAR has been prepared by Energex in accordance with the requirements of clause 5.17.4(o)
of the NER.
This report represents the third stage of the consultation process in relation to the application of the
RIT-D on potential credible options to address the identified need for the Caloundra network area.
In preparing this RIT-D, Energex is required to consider reasonable future scenarios. With respect
to major customer loads and generation, Energex has, in good faith, included as much detail as
possible while maintaining necessary customer confidentiality. Potential large future connections
that Energex is aware of are in different stages of progress and are subject to change (including
outcomes where none or all proceed). These and other customer activity can occur over the
consultation period and may change the timing and/or scope of any proposed solutions.
1.1. Response to the DPAR
Energex published a Draft Project Assessment Report (DPAR) for the identified need in the
Caloundra network area on the 16 August 2021. No submissions were received by the closing date
of the 8 October 2021.
1.2. Structure of the Report
This report:
• Provides background information on the network capability limitations of the distribution network supplying the Caloundra area.
• Identifies the need which Energex is seeking to address, together with the assumptions
used in identifying and quantifying that need.
• Describes the credible options that are considered in this RIT-D assessment.
• Describes the market benefit assessment methodology
• Provides the results of Net Present Value (NPV) analysis of each credible option and
accompanying explanatory statements regarding the results.
• Identifies the proposed preferred option, including detailed characteristics, estimated
commissioning date, indicative costs, and noting that it satisfies the RIT-D.
• Provides contact details for queries on this RIT-D.
1.3. Dispute Resolution Process
In accordance with the provisions set out in clause 5.17.5(a) of the NER, Registered Participants or
Interested Parties may, within 30 days after the publication of this report, dispute the conclusions
made by Energex in this report with the Australian Energy Regulator. Accordingly, Registered
Participants and Interested Parties who wish to dispute the conclusions outlined in this report based
on a manifest error in the calculations or application of the RIT-D must do so within 30 days of the
publication date of this report. Any parties raising a dispute are also required to notify Energex.
Dispute notifications should be sent to [email protected].

Final Project Assessment Report
Page 9 of 54
Energex Corporation Limited ABN 50 087 646 062
If no formal dispute is raised, Energex will proceed with the preferred option to establish a new zone
substation at Bells Creek Central.
1.4. Contact Details
For further information and inquiries please contact:
P: 13 74 66

Final Project Assessment Report
Page 10 of 54
Energex Corporation Limited ABN 50 087 646 062
2. BACKGROUND
2.1. Geographic Region
Caloundra Zone Substation (SSCLD) provides electricity supply to approximately 22,000
predominantly residential customers in the Aroona, Caloundra, Currimundi, Meridan Plains, Pelican
Waters and Shelly Beach areas. SSCLD is supplied from the Powerlink Palmwoods injection point
via a 132kV ring network, which also supplies Mooloolaba zone substation (SSMLB), Currimundi
zone substation (SSCMD), Birtinya zone substation (SSBTY), Kawana zone substation (SSKWA),
Alexandra Headlands zone substation (SSAHD) and West Maroochydore zone substation
(SSWMD). There is also a 33kV network that is supplied by Beerwah bulk supply substation
(SSBWH) that provides supply to Woodford zone substation (SSWFD) and Landsborough zone
substation (SSLBH).
The geographical location of Energex’s sub-transmission network and substations in the area is
shown in Figure 1 and Figure 2.
132kV Network
33kV Network
132/11kV Substation
33/11kV Substation
SSBWH
SSCLDSSLBH
F803
F804
Figure 1: Existing 132/33kV network arrangement (geographic view)

Final Project Assessment Report
Page 11 of 54
Energex Corporation Limited ABN 50 087 646 062
SSCLD
Figure 2: Existing 11kV network arrangement (geographic view)
2.2. Existing Supply System
Caloundra zone substation is supplied via 2 incoming 132kV feeders in a ring network from
Mooloolaba zone supply substation and Currimundi zone supply substation under system normal.
Caloundra zone substation has 2 x 60MVA 132/11kV transformers. The substation supplies 20 x
11kV distribution feeders.
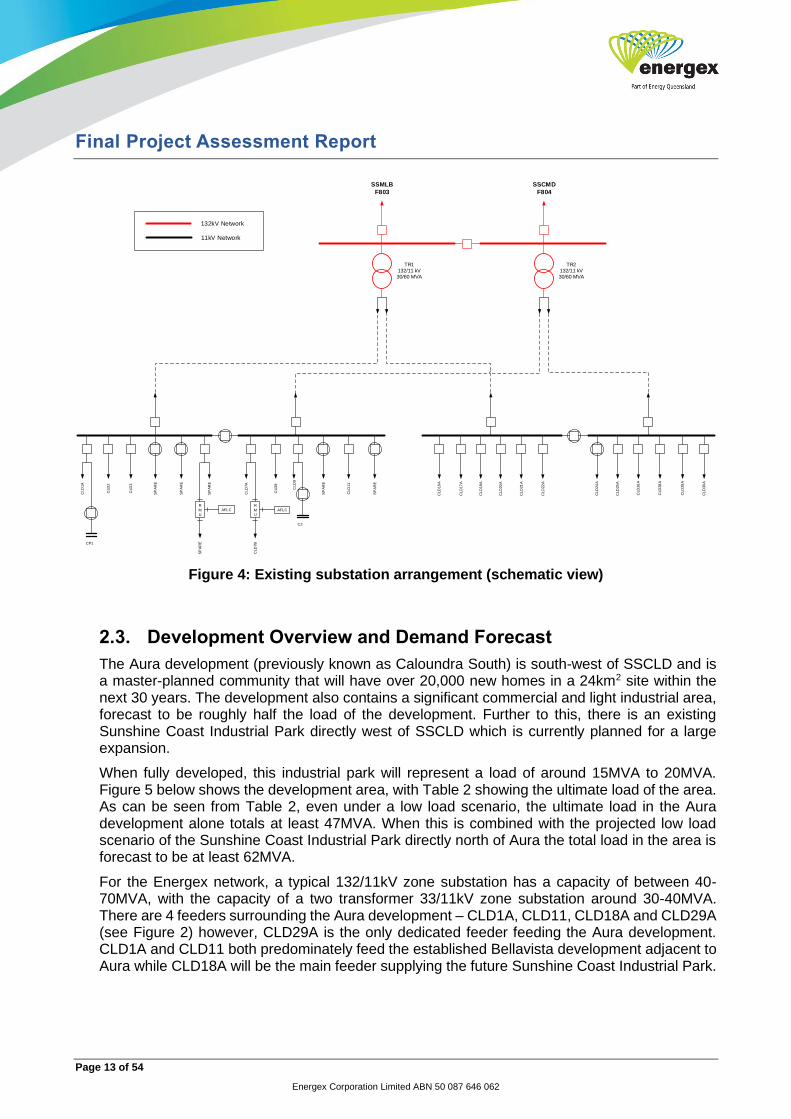
A schematic view of the existing sub-transmission network and substation arrangement is shown in
Figure 3 and Figure 4.

Final Project Assessment Report
Page 12 of 54
Energex Corporation Limited ABN 50 087 646 062
SSH9
Palmwoods
BUS 2
BUS 1
To H2
To H2
To H5
To H5
F77
7 F77
8
TR2
30MVA
SSMLBMooloolaba
TR2
60MVA
TR2
60MVA
TR1
60MVA
TR2
60MVA
TR2
30MVA
TR1
30MVA
SSWMDWest Maroochydore
SSAHDAlexandra Headlands
SSCLDCaloundra
SSKWAKawana
F81
6
F81
9
F81
5
F803
F804
TR1
30MVA
SSCMDCurrimundi
TR1
30MVA
TR2
30MVA
F82
1
TR1
60MVA
132kV F844
TR2
30MVA
TR1
30MVA
SSBTYBirtinya
132kV
132kV
132kV
132kV
132kV
132kV 132kV
132kV
132kV
TR1
60MVA
F851
Figure 3: Existing network arrangement (schematic view)
Final Project Assessment Report
Page 13 of 54
Energex Corporation Limited ABN 50 087 646 062
Figure 4: Existing substation arrangement (schematic view)
2.3. Development Overview and Demand Forecast
The Aura development (previously known as Caloundra South) is south-west of SSCLD and is a master-planned community that will have over 20,000 new homes in a 24km2 site within the next 30 years. The development also contains a significant commercial and light industrial area, forecast to be roughly half the load of the development. Further to this, there is an existing Sunshine Coast Industrial Park directly west of SSCLD which is currently planned for a large expansion.
When fully developed, this industrial park will represent a load of around 15MVA to 20MVA. Figure 5 below shows the development area, with Table 2 showing the ultimate load of the area. As can be seen from Table 2, even under a low load scenario, the ultimate load in the Aura development alone totals at least 47MVA. When this is combined with the projected low load scenario of the Sunshine Coast Industrial Park directly north of Aura the total load in the area is forecast to be at least 62MVA.
For the Energex network, a typical 132/11kV zone substation has a capacity of between 40-70MVA, with the capacity of a two transformer 33/11kV zone substation around 30-40MVA. There are 4 feeders surrounding the Aura development – CLD1A, CLD11, CLD18A and CLD29A (see Figure 2) however, CLD29A is the only dedicated feeder feeding the Aura development. CLD1A and CLD11 both predominately feed the established Bellavista development adjacent to Aura while CLD18A will be the main feeder supplying the future Sunshine Coast Industrial Park.
TR1132/11 kV30/60 MVA
TR2132/11 kV30/60 MVA
SSMLB
F803
SSCMD
F804
CLD
24
A
CLD
25
A
CLD
26
A
CLD
28
A
CLD
29
A
CLD
30
A
CLD
22
A
CLD
21
A
CLD
20
A
CLD
18
A
CLD
17
A
CLD
16
A
CLD
2
CLD
3
SP
AR
E
SP
AR
E
CLD
1A
SP
AR
E
SP
AR
E
CLD
11
SP
AR
E
CLD
8
CLD
7A
CLD
9
C2
R
M
U
AFLC
CLD
7BCP1
R
M
U
SP
AR
E
AFLC
132kV Network
11kV Network

Final Project Assessment Report
Page 14 of 54
Energex Corporation Limited ABN 50 087 646 062
Figure 5: Proposed Aura development area
Load Type Low Load Scenario (MVA) Medium Load Scenario (MVA)
Commercial 14.90 18.60
Industrial Light 8.50 10.60
Residential High 0.50 0.60
Residential High B5 1.80 2.40
Residential Medium 6.00 8.00
Residential Undeveloped 15.30 20.40
Total for Aura Development 47.00 60.40
Sunshine Coast Industrial Park 15.00 20.00
Area Total – South Caloundra 62.00 80.40
Table 2: Ultimate load for the development
2.4. Load Profiles
The load at Caloundra zone substation comprises a mix of residential and commercial/industrial
customers. The load duration curve for feeders CLD1A, CLD11, CLD18A and CLD29A are shown
in Figure 6 to Figure 9 below. It should be noted CLD29A is a new feeder established in September
2020 and approximately 2MVA of load was transferred from CLD18A. Due to the new feeder not
having historic data, the load duration curve for CLD29A was developed from CLD18A data and
utilising the new CLD29A load forecast.
CALOUNDRA
SUBSTATION
CURRIMUNDI
SUBSTATION
INDUSTRIAL
PARK

Final Project Assessment Report
Page 15 of 54
Energex Corporation Limited ABN 50 087 646 062
2.4.1. Load Duration Curve
Figure 6 to Figure 9 shows the load duration curves for SSCLD under System Normal (N) and
System Abnormal (N-1). These are based on the previous 3 years of data and are scaled to their
respective maximum 10% Probability of Exceedance (10PoE) and 50% Probability of Exceedance
(50PoE) forecasts.
Figure 6: Load duration curve for CLD1A
Figure 7: Load duration curve for CLD11
0
1
2
3
4
5
6
7
0.0% 10.0% 20.0% 30.0% 40.0% 50.0% 60.0% 70.0% 80.0% 90.0% 100.0%
Load
(M
VA
)
% OF TIME
0
1
2
3
4
5
6
7
0.0% 10.0% 20.0% 30.0% 40.0% 50.0% 60.0% 70.0% 80.0% 90.0% 100.0%
Load
(M
VA
)
% OF TIME

Final Project Assessment Report
Page 16 of 54
Energex Corporation Limited ABN 50 087 646 062
Figure 8: Load duration curve for CLD18A
Figure 9: Load duration curve for CLD29A
0
1
2
3
4
5
6
7
0.0% 10.0% 20.0% 30.0% 40.0% 50.0% 60.0% 70.0% 80.0% 90.0% 100.0%
Load
(M
VA
)
% OF TIME
0
1
2
3
4
5
6
7
0.0% 10.0% 20.0% 30.0% 40.0% 50.0% 60.0% 70.0% 80.0% 90.0% 100.0%
Load
(M
VA
)
% OF TIME

Final Project Assessment Report
Page 17 of 54
Energex Corporation Limited ABN 50 087 646 062
3. IDENTIFIED NEED
3.1. Applied Service Standard
3.1.1. Distribution Network
Energex plans its 11kV distribution network for a Target Maximum Utilisation (TMU) of 80% at 50% probability of exceedance (PoE) load. This ensures the feeder is not overloaded whist having sufficient transfer capacity for contingencies on the 11kV network. This level of utilisation also allows transfer capacity to ensure that Energex meets is Safety Net obligations under the Distribution Authority.
3.1.2. Sub-transmission Network
Under its Distribution Authority, Energex must adhere to the Safety Net which identifies the principles that apply to the operation of network assets under network contingency conditions. System contingency related capability is assessed against a 50% PoE forecast load, available load transfers, emergency cyclic capacity (ECC) ratings, non-network response, mobile plant, mobile generators, and short-term ratings of plant and equipment where available. This process allows load at risk under contingency conditions to be identified and assessed. Energex’s Distribution Authority can be accessed by the following link:
https://www.dnrme.qld.gov.au/__data/assets/pdf_file/0003/219486/distribution-authority-d0798-energex.pdf
As per the Energex Safety Net criteria, for substations supplying urban load, during a single
contingency event, interruption of supply up to 40MVA is permissible for the first 30 minutes, followed
by a maximum interruption of up to 12MVA, provided that all load except for up to 4MVA can be
restored within 3 hours, and the remaining 4MVA is fully restored within 8 hours. Table 3 below
outlines the Safety Net criteria.
Category Demand Range Allowed Outage to be OK
Urban
> 40MVA No outage OK
12-40MVA 30 minutes OK
4-12MVA 3 hours OK
<4MVA 8 hours OK
Table 3: Summary of Safety Net Criteria
Further to an assessment against its Safety Net obligations, Energex also undertake analysis of
system capacity under normal conditions with all plant in service against the 10% PoE load. The
total capacity of the substation or the system Normal Cyclic Capacity (NCC) limit with all assets in
service, shall not be exceeded to avoid reducing its designed life.

Final Project Assessment Report
Page 18 of 54
Energex Corporation Limited ABN 50 087 646 062
3.2. Description of the Identified Need
There are two major identified needs in this FPAR.
3.2.1. Initial Limitation Network Option Identified
• 11kV Feeder limitations – there are currently only 4x11kV feeders in the study area. Without
augmentation, these feeders will not be able to provide enough capacity to continue to supply
new customers, nor meet Energex’s TMU of 80%.
3.2.2. Future Limitation Network Option Identified
• Safety Net Limitation at SSCLD - where load continues to be added to SSCLD, the
redundancy requirement specified in Energex’s Distribution Authority will not be achieved.
3.3. Quantification of the Identified Need
3.3.1. Initial Limitation - 11kV Feeder Limitations
Energex has applied the following assumptions in developing it forecast load for the 11kV feeders
in the area:
• In the Aura development, Energex have forecast around 500 additional customers/year
between 2020 and 2025. After 2025, this will be around 1,000 customers/year.
• A demand increase is expected of between 1.3kVA/dwelling to 1.6kVA/dwelling which is
consistent with the existing demand/customer of the 2,418 customers already connected in
the development.
• After 2025, the Sunshine Coast Industrial Park is forecast to increase by around 1MVA/year.
As seen below in Table 4, CLD11 is forecast to exceed its TMU in 2021, with CLD29A, CLD1A and
CLD29A all forecast to exceed their TMU in the next ten years. Red cells indicate TMU exceedance.

Final Project Assessment Report
Page 19 of 54
Energex Corporation Limited ABN 50 087 646 062
Year CLD1A Load (MVA)
CLD11 Load (MVA)
CLD18A Load (MVA)
CLD29A Load (MVA)
80% (TMU)
5.17 5.91 4.89 5.99
2020 4.19 5.64 2.48 4.57
2021 4.25 6.17 2.55 5.01
2022 4.29 6.76 2.65 5.69
2023 4.38 7.07 2.76 6.38
2024 4.53 7.22 2.88 7.30
2025 5.02 7.49 3.87 9.29
2026 5.20 7.73 4.63 11.38
2027 5.38 7.98 5.39 13.48
2028 5.55 8.23 6.34 15.76
2029 5.73 8.48 7.30 18.05
2030 5.90 8.73 8.25 20.53
Table 4: 11kV feeders exceeding Target Maximum Utilisation (TMU) of 80%
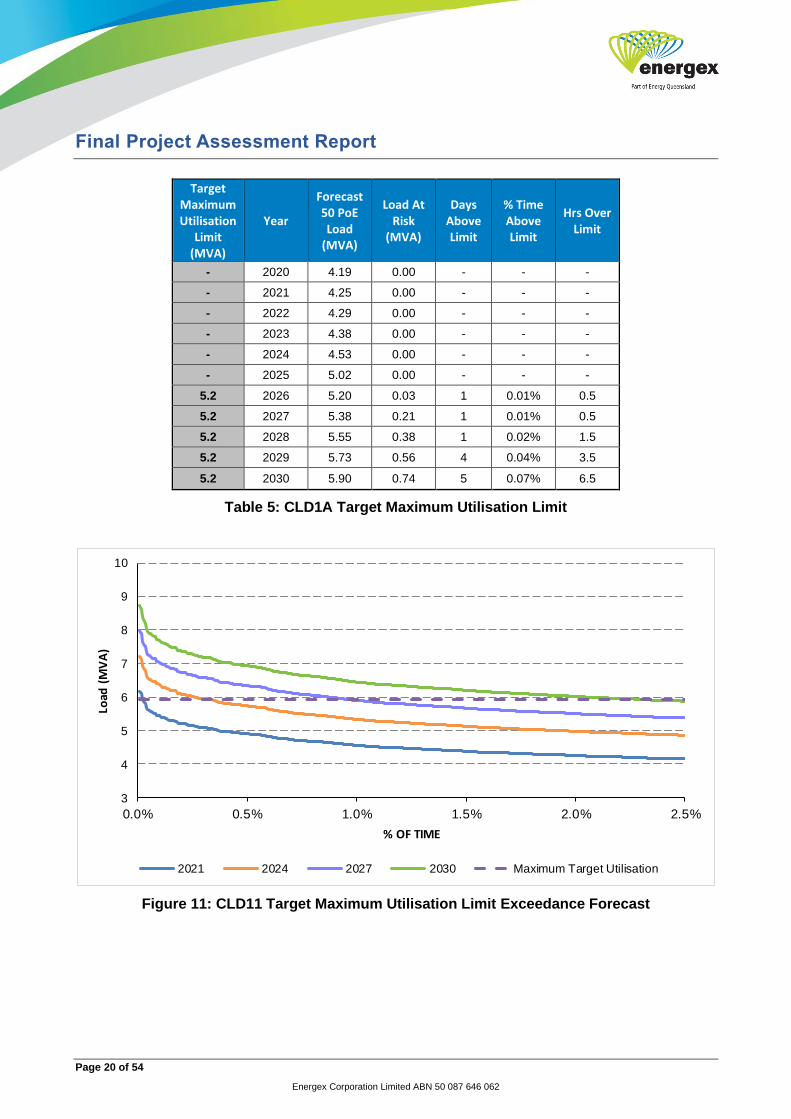
Figure 10 to Figure 13 show the proportion of the load duration curve for the 50% POE forecast for
each feeder that is above the TMU. Table 5 to Table 8 show the load at risk and the duration the
feeder is above the TMU limits.
Figure 10: CLD1A Target Maximum Utilisation Limit Exceedance Forecast
3.5
4
4.5
5
5.5
6
6.5
0.01% 0.02% 0.03% 0.04% 0.05% 0.06% 0.07% 0.08%
Load
(M
VA
)
% OF TIME
2026 2028 2030 Maximum Target Utilisation
Final Project Assessment Report
Page 20 of 54
Energex Corporation Limited ABN 50 087 646 062
Target Maximum Utilisation
Limit (MVA)
Year
Forecast 50 PoE Load
(MVA)
Load At Risk
(MVA)
Days Above Limit
% Time Above Limit
Hrs Over Limit
- 2020 4.19 0.00 - - -
- 2021 4.25 0.00 - - -
- 2022 4.29 0.00 - - -
- 2023 4.38 0.00 - - -
- 2024 4.53 0.00 - - -
- 2025 5.02 0.00 - - -
5.2 2026 5.20 0.03 1 0.01% 0.5
5.2 2027 5.38 0.21 1 0.01% 0.5
5.2 2028 5.55 0.38 1 0.02% 1.5
5.2 2029 5.73 0.56 4 0.04% 3.5
5.2 2030 5.90 0.74 5 0.07% 6.5
Table 5: CLD1A Target Maximum Utilisation Limit
Figure 11: CLD11 Target Maximum Utilisation Limit Exceedance Forecast
3
4
5
6
7
8
9
10
0.0% 0.5% 1.0% 1.5% 2.0% 2.5%
Load
(M
VA
)
% OF TIME
2021 2024 2027 2030 Maximum Target Utilisation

Final Project Assessment Report
Page 21 of 54
Energex Corporation Limited ABN 50 087 646 062
Target Maximum Utilisation
Limit (MVA)
Year
Forecast 50 PoE Load
(MVA)
Load At Risk
(MVA)
Days Above Limit
% Time Above Limit
Hrs Over Limit
- 2020 5.64 0.00 - - -
5.9 2021 6.17 0.26 1 0.02% 2.0
5.9 2022 6.76 0.85 6 0.11% 9.5
5.9 2023 7.07 1.15 11 0.23% 20.0
5.9 2024 7.22 1.31 17 0.34% 29.9
5.9 2025 7.49 1.57 25 0.54% 46.9
5.9 2026 7.73 1.82 28 0.71% 62.4
5.9 2027 7.98 2.07 39 0.97% 85.3
5.9 2028 8.23 2.32 52 1.34% 117.8
5.9 2029 8.48 2.57 67 1.79% 157.2
5.9 2030 8.73 2.82 88 2.34% 205.1
Table 6: CLD11 Target Maximum Utilisation Limit
Figure 12: CLD18A Target Maximum Utilisation Limit Exceedance Forecast
3
4
5
6
7
8
9
0% 2% 4% 6% 8% 10% 12% 14%
Load
(M
VA
)
% OF TIME
2027 2028 2029 2030 Maximum Target Utilisation

Final Project Assessment Report
Page 22 of 54
Energex Corporation Limited ABN 50 087 646 062
Target Maximum Utilisation
Limit (MVA)
Year
Forecast 50 PoE Load
(MVA)
Load At Risk
(MVA)
Days Above Limit
% Time Above Limit
Hrs Over Limit
- 2020 2.48 0.00 - - -
- 2021 2.55 0.00 - - -
- 2022 2.65 0.00 - - -
- 2023 2.76 0.00 - - -
- 2024 2.88 0.00 - - -
- 2025 3.87 0.00 - - -
- 2026 4.63 0.00 - - -
4.9 2027 5.39 0.50 9 0.14% 12.0
4.9 2028 6.34 1.45 73 1.60% 140.2
4.9 2029 7.30 2.40 165 6.27% 549.0
4.9 2030 8.25 3.36 252 13.65% 1195.8
Table 7: CLD18A Target Maximum Utilisation Limit
Figure 13: CLD29A Target Maximum Utilisation Limit Exceedance Forecast
2
4
6
8
10
12
14
16
18
20
0% 10% 20% 30% 40% 50% 60% 70% 80%
Load
(M
VA
)
% OF TIME
2023 2026 2028 2030 Maximum Target Utilisation

Final Project Assessment Report
Page 23 of 54
Energex Corporation Limited ABN 50 087 646 062
Target Maximum Utilisation
Limit (MVA)
Year
Forecast 50 PoE Load
(MVA)
Load At Risk
(MVA)
Days Above Limit
% Time Above Limit
Hrs Over Limit
- 2020 4.6 0.00 - - -
- 2021 5.0 0.00 - - -
- 2022 5.7 0.00 - - -
6.0 2023 6.4 0.41 5 0.05% 4.5
6.0 2024 7.3 1.31 40 0.70% 60.9
6.0 2025 9.3 3.31 204 8.34% 730.2
6.0 2026 11.4 5.41 294 22.93% 2008.3
6.0 2027 13.5 7.51 312 37.07% 3247.1
6.0 2028 15.8 9.81 316 52.46% 4595.6
6.0 2029 18.0 12.01 323 67.78% 5937.7
6.0 2030 20.5 14.51 340 74.97% 6567.0
Table 8: CLD29A Target Maximum Utilisation Limit
It should be noted that although there is technically an exceedance of the TMU for CLD11 in 2021, this is an extremely small load at risk of 0.26MVA. As such, Energex are not proposing to provide a solution, either network or non-network, to this limitation until 2022.

Final Project Assessment Report
Page 24 of 54
Energex Corporation Limited ABN 50 087 646 062
3.3.1. Future Limitation - SSCLD Limitations
SSCLD is equipped with 2 x 60MVA 132/11kV transformers. The substation capacity is limited by the cables from the transformer to the 11kV bus bars and has a NCC, ECC and 2 Hour Emergency Capacity (2HEC) as below:
• Normal Cyclic Capacity – 115.10MVA
• Emergency Cyclic Capacity – 64.50MVA
• 2 Hour Emergency Capacity – 81.00MVA
The substation currently has the capacity to supply all forecast loads and meet the Safety Net criteria
until 2025. As load in the Aura and surrounding developments continues to grow, Energex forecasts
that the Safety Net criteria may not be met somewhere between 2027 and 2030.
Figure 14: SSCLD Load at Risk
2020/21 2021/22 2022/23 2023/24 2024/25 2025/26 2026/27 2027/28 2028/29 2029/30
10 PoE Load 54.57 56.86 60.56 64.01 68.26 72.79 77.25 82.42 87.53 93.12
Summer NCC 115.10 115.10 115.10 115.10 115.10 115.10 115.10 115.10 115.10 115.10
Load > NCC 0.00 0.00 0.00 0.00 0.00 0.00 0.00 0.00 0.00 0.00
50 PoE Load 50.03 52.14 55.56 58.74 62.68 66.86 71.04 75.83 80.57 85.66
Summer ECC 64.50 64.50 64.50 64.50 64.50 64.50 64.50 64.50 64.50 64.50
Summer 2HEC 81.00 81.00 81.00 81.00 81.00 81.00 81.00 81.00 81.00 81.00
LAR 0.00 0.00 0.00 0.00 0.00 0.00 0.00 1.03 5.77 10.86
RLAR 0.00 0.00 0.00 0.00 0.00 0.00 0.00 0.00 0.00 0.00
Available Transfers 6.30 6.30 6.30 6.30 6.30 6.30 6.30 6.30 6.30 6.30
Avail Mobile Eqpt 4.00 4.00 4.00 4.00 4.00 4.00 4.00 4.00 4.00 4.00
0
20
40
60
80
100
120
140
MV
A
SSCLD Load Forecast - Existing

Final Project Assessment Report
Page 25 of 54
Energex Corporation Limited ABN 50 087 646 062
3.4. Assumptions in Relation to Identified Need
Below is a summary of key assumptions that have been made when the identified need has been
analysed and quantified.
It is recognised that the below assumptions may prove to have various levels of correctness, and
they merely represent a ‘best endeavours’ approach to predict the future identified need.
3.4.1. Forecast Maximum Demand
It has been assumed that forecast peak demand at SSCLD Substation will be consistent with the base case forecast outlined in Section Error! Reference source not found..
Please refer to Section 5 (Network Forecasting) of the latest Energex DAPR publication for in-depth details regarding the methods and assumptions behind Energex’s demand forecasts.
3.4.2. Load Profile
Characteristic peak day load profiles are unlikely to change significantly from year to year and the
shape of the load profile is assumed to remain virtually the same with increasing maximum
demand.

Final Project Assessment Report
Page 26 of 54
Energex Corporation Limited ABN 50 087 646 062
4. CREDIBLE OPTIONS ASSESSED
4.1. Assessment of Network Solutions
4.1.1. Initial Limitation Network Option Identified
The option considered to resolve CLD11 exceeding TMU is to establish a new feeder from SSCLD to Aura. The cost of establishing this new feeder is approximately $3 million, with an operating cost of around $6,861/year. Energex is proposing to establish this feeder in October 2022. The works involved to implement this option are:
• Establish 8km 11kV feeder in both new and existing conduits
• Install 800m conduit
4.1.2. Future Limitation Network Options Identified
A total of 9 network options were identified to resolve the identified limitations. Table 9 gives a summary, the initial capital costs and forecast yearly operating costs. Further details of each option can be found in Appendix B.
Option Option Name Initial Capital
Cost Operating Cost/Year
NPV
1 11kV Feeders from SSCLD, 132kV Feeders, 132/11kV Bells Creek Central Substation*
$4,257,500 $6,004 -$84,480,000
2 132kV Feeders from F803 & 132/11kV Bells Creek Central Substation
$60,878,334 $152,597 -$75,867,000
3 11kV Feeder from SSCLD & 132kV Feeders (Disconnected), 132/11kV Bells Creek Central Substation
$41,278,348 $112,053 -$77,765,000
4 132kV Feeders & 132/11kV Bells Creek North Substation $57,420,017 $116,955 -$82,812,000
5 132/33kV Meridan Plains Substation, 33kV Feeders & 33/11kV Bells Creek Central Substation
$53,844,406 $143,424 -$79,444,000
6 132/33/11kV Meridan Plains Substation & 33kV Feeders @11kV, 33/11kV Bells Creek Central Substation
$44,096,500 $101,354 -$79,873,000
7 132/33kV & 33/11kV Meridan Plains Substation & 33kV Feeders @11kV, 33/11kV Bells Creek Central Substation
$44,528,189 $103,370 -$80,443,000
8 132kV Feeders from Mark Rd East (83%UG 17%OH) & 132/11kV Bells Creek Central Substation
$63,167,951 $125,599 -$92,154,000
9 132kV Feeders from SSCLD (88%UG 12%OH) & 132/11kV Bells Creek Central Substation
$51,532,504 $102,683 -$100,969,000
Table 9: Future Limiation Network Options
* It should be noted that Option 1 requires a new 11kV feeder every two years to continue supplying
the load. Even though the upfront cost is lower, in NPV terms this has a worse economic outcome.

Final Project Assessment Report
Page 27 of 54
Energex Corporation Limited ABN 50 087 646 062
4.2. Preferred Network Option
In order to resolve the initial limitation for CLD11 exceeding the TMU, the identified network option is to establish a new 11kV feeder to de-load CLD11. This option is estimated approximately $3 million and the works involved to implement this option are:
• Establish 8km 11kV feeder
• Install 800m conduit
Option 2 is currently the preferred network option to resolve the future 11kV feeder limitations and emerging Safety Net limitation at SSCLD. This provides the most economically efficient network option, with the lowest NPV cost to address the network limitations. It is proposed to establish Bell’s Creek Central substation in October 2025. Works include:
• Installation of 2 x 13km of 132kV overhead feeders;
• installation of 132kV CBs:
o 2 x bus sections with 1 x bus section CB
o 1 x transformer CB
o 2 x feeder CBs;
• installation of 132kV control room;
• installation of 1 x 60MVA 132/11kV transformers;
• installation of an 11kV indoor switchroom including 1 x bus section with 1 x bus section CB, 1 x transformer CB, 5 x feeder CBs;
• installation of 1 x AFLC;
The preferred network option has an estimated initial capital project cost of $60.7M, and an annual operating cost of approximately $152,597/year. It should be noted that although this option has a higher initial capital cost than Option 1, the future stages associated with Option 1, which is essentially to establish a new 11kV feeder every two years, is not the most economically efficient solution in NPV terms.

Final Project Assessment Report
Page 28 of 54
Energex Corporation Limited ABN 50 087 646 062
5. SUMMARY OF SUBMISSIONS RECEIVED
On 16 November 2020, Energex published the Non-Network Options Report (NNOR) providing
details on the identified need at Caloundra zone substation.
In response to the NNOR, Energex received three submissions. In assessing these submissions,
Energex has identified one credible option as detailed in 5.1.
On 16 August 2021, Energex published the DPAR providing details on the identified need at
Caloundra Substation. This report provided both technical and economic information about
possible solutions and sought information from interested parties about possible alternate solutions
to address the need for investment.
In response to the DPAR, Energex received no submissions by 8 October 2021, which was the
closing date for submissions to the DPAR.
5.1. Option 10: Contract 24MW/39.75MWh Battery Energy Storage Solution (BESS)
This option involves contracting a proponent to provide multiple BESS totalling 24MW/39.75MWh
for an 8-year period to eliminate load at risk in the vicinity of SSCLD from 2022. Each BESS will be
fully charged and ready to provide peak load relief. At the end of the period of the contract, a new
zone substation is proposed to be established to eliminate the load at risk.
6. MARKET BENEFIT ASSESSMENT METHODOLOGY
The identified need outlined in the FPAR is a regulatory obligation to address the substation limitation
as outlined in the Distribution Authority. Because of this, the assessment methodology is a lowest
cost process, rather than a cost/benefit analysis based on market benefits. There is no material
difference in specific market benefits, such as Value of Customer Reliability between identified
Network and Non-Network Options. As such, no Market Benefits have been calculated for use in the
economic analysis to identify the preferred option.

Final Project Assessment Report
Page 29 of 54
Energex Corporation Limited ABN 50 087 646 062
7. DETAILED ECONOMIC ASSESSMENT
7.1. Methodology
The RIT-D requires Energex to identify the credible option that maximises the present value of net
economic benefit to all who produce, consume and transport electricity in the National Electricity
Market.
For the identified need presented in this FPAR, a Weighted Average NPV, based on a sensitivity
analysis, was conducted to establish the option that remained the lowest cost option in the
scenarios considered. In effect, this means that Energex create a separate NPV for each scenario
and assign a weighting to each, with the outcome a Weighted Average NPV to inform the lowest
cost option in a range of scenarios to proceed with.
7.2. Key Variables and Assumptions
7.2.1. Discount Rate
Calculations for annual deferral values of projects are based on Energex’s regulated pre-tax real
Weighted Average Cost of Capital (WACC). This value is prescribed by the AER for a specific
regulatory control period. The identified need described in this FPAR occurs in the 2020-2025
regulatory control period, where the WACC is 2.62%.
7.2.2. Cost Estimates
Project costs are calculated using standard estimate components which are developed and
evaluated by estimation teams in Energex. The costs are split into 2 components: direct cost, which
is the costs which are directly costed to the project; and indirect costs which cover overheads
associated with the business. All costs provided in this report are estimated to fall within ± 40%
accuracy of the stated cost.
7.2.3. Evaluation Test Period
Consideration of network options is assessed over an evaluation period of 60 years.

Final Project Assessment Report
Page 30 of 54
Energex Corporation Limited ABN 50 087 646 062
7.3. Scenarios Adopted for Sensitivity Testing
A sensitivity analysis was conducted on the base case to establish the option that remained the lowest cost option in the scenarios considered. In this instance, the scenarios that have been considered are:
1. Medium demand – under this scenario the existing load remains around the same as it currently is. This is consistent with the base case load forecast. This scenario has been assigned a likelihood of 50% in the weighted average NPV.
2. High demand – under this scenario the only change from the Medium Growth scenario is that the high growth load forecast has been used. This scenario has been assigned a likelihood of 20% in the weighted average NPV.
3. Low demand – under this scenario the only change from the Medium Growth scenario is that the low growth load forecast has been used. This scenario has been assigned a likelihood of 30% in the weighted average NPV.
7.4. Net Present Value (NPV) Results
Table 10 shows the Weighted Average NPV results for the identified options. The NPV cost results
have been withheld for Option 10 as it is based on the submission to the NNOR that was received,
which Energex and the proponent considers to be Commercial-in-Confidence.

Final Project Assessment Report
Page 31 of 54
Energex Corporation Limited ABN 50 087 646 062
Option Option Name Rank Initial
Capital Cost NPV
($ real) PV of Capex
($ real) PV of Opex
($ real)
1 Supply New Demand with 11kV
Feeders from SSCLD 8 $4,257,500 -$84,480,000 -$79,812,000 -$4,668,000
2
Supply New Demand with 132kV Feeders (Tee off at
Meridan Plains) to Bell’s Creek Central Establishment
1 $60,878,334 -$75,867,000 -$71,414,000 -$4,453,000
3
Supply New Demand with 11kV Feeders from SSCLD and
Establish 132kV Feeders, then Supply New Demand with 132kV Feeders (Tee off at
Meridan Plains) to Bell’s Creek Central Establishment
3 $41,278,348 -$77,765,000 -$73,251,000 -$4,514,000
4
Supply New Demand with 132kV Feeders (Tee off at
Meridan Plains) to Bell’s Creek North Establishment
7 $57,420,017 -$82,812,000 -$79,036,000 -$3,775,000
5
Supply New Demand with 33kV Feeders from Meridan Plains Establishment to Bell’s Creek
Central Establishment
4 $56,444,406 -$79,444,000 -$74,582,000 -$4,863,000
6
Supply New Demand with 33kV Feeders from Meridan Plains
(132/33/11kV) Establishment to Bell’s Creek Central
Establishment
5 $46,767,929 -$79,873,000 -$75,152,000 -$4,721,000
7
Supply New Demand with 33kV Feeders from Meridan Plains
(132/33kV, 33/11kV) Establishment to Bell’s Creek
Central Establishment
6 $47,199,618 -$80,443,000 -$75,718,000 -$4,725,000
8
Supply New Demand with 132kV Feeders (Tee off at Mark Rd East) to Bell’s Creek Central
Establishment
9 $63,167,951 -$92,154,000 -$87,681,000 -$4,473,000
9
Supply New Demand with 132kV Feeders from Caloundra
Substation to Bell’s Creek Central Establishment
10 $51,532,504 -$100,969,000 -$96,037,000 -$4,932,000
10 Install 24MW Battery 2 Withheld Withheld Withheld Withheld
Table 10: Weighted Average NPV Results

Final Project Assessment Report
Page 32 of 54
Energex Corporation Limited ABN 50 087 646 062
8. CONCLUSION
The FPAR represents the final stage of the consultation process in relation to the application of the
RIT-D.
Energex intends to take steps to progress the proposed preferred option to ensure any statutory
non-compliance is addressed and undertake appropriately justified network reliability improvements,
as necessary.
8.1. Preferred Option
Energex’s preferred option remains to be Option 2. This option involves supplying the Aura
subdivision and surrounding area with 11kV feeders from a new substation at Bell’s Creek central.
The scope of work and estimated capital cost and operating cost of this option are as below:
• Establish Bell’s Creek Central 132/11kV zone substation in 2026 with the following:
o single 132/11kV transformer,
o associated switchgear,
o 13km of 132kV overhead double circuit line;
• Establish 11kV feeders as required to supply the Aura and Industrial area;
• Establish the 2nd 132/11kV transformer in 2029 at Bell’s Creek Central;
• Establish Bell’s Creek North 132/11kV zone substation with a single transformer in 2047
based on continued demand growth.
• Estimated initial capital cost: $60.8 million ± 40% (2026)
• Estimated initial operating cost per annum: $152,597 (2026)
8.2. Satisfaction of RIT-D
The proposed preferred option satisfies the RIT-D.
This statement is made on the basis of the detailed analysis set out in this report. The proposed
preferred option is the credible option that has the highest net economic benefit under the most likely
reasonable scenarios.
Final Project Assessment Report
Page 33 of 54
Energex Corporation Limited ABN 50 087 646 062
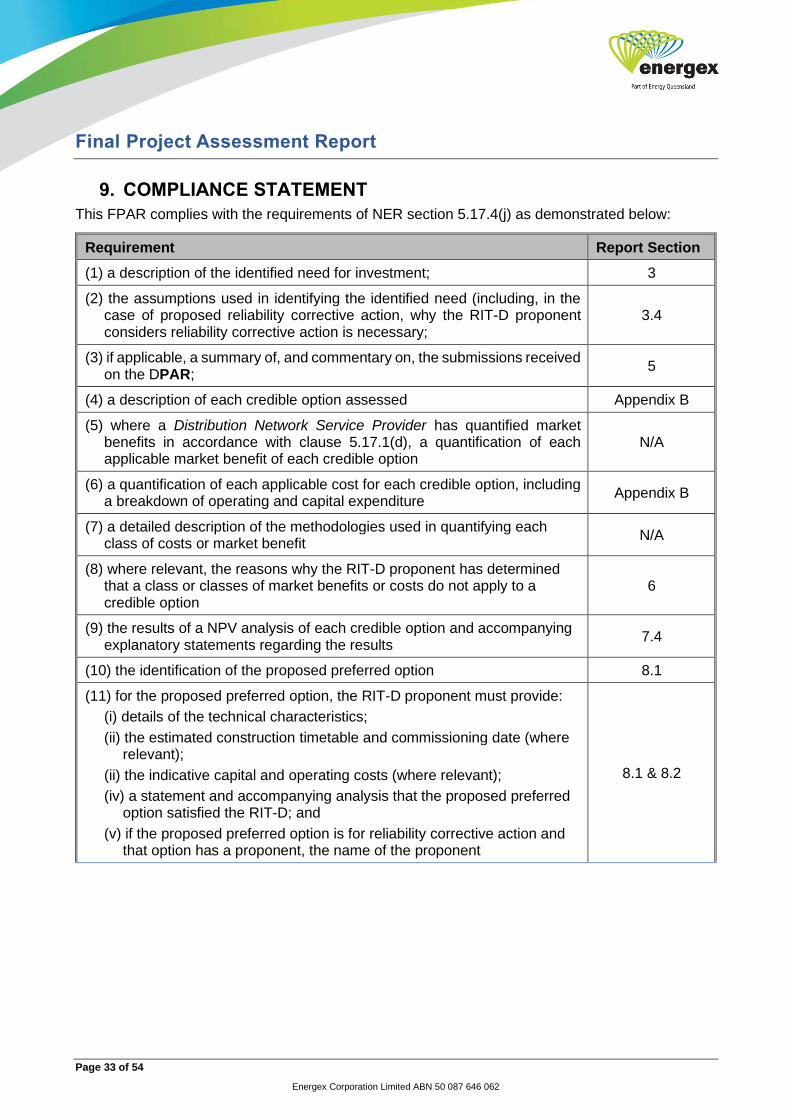
9. COMPLIANCE STATEMENT
This FPAR complies with the requirements of NER section 5.17.4(j) as demonstrated below:
Requirement Report Section
(1) a description of the identified need for investment; 3
(2) the assumptions used in identifying the identified need (including, in the case of proposed reliability corrective action, why the RIT-D proponent considers reliability corrective action is necessary;
3.4
(3) if applicable, a summary of, and commentary on, the submissions received on the DPAR;
5
(4) a description of each credible option assessed Appendix B
(5) where a Distribution Network Service Provider has quantified market benefits in accordance with clause 5.17.1(d), a quantification of each applicable market benefit of each credible option
N/A
(6) a quantification of each applicable cost for each credible option, including a breakdown of operating and capital expenditure
Appendix B
(7) a detailed description of the methodologies used in quantifying each class of costs or market benefit
N/A
(8) where relevant, the reasons why the RIT-D proponent has determined that a class or classes of market benefits or costs do not apply to a credible option
6
(9) the results of a NPV analysis of each credible option and accompanying explanatory statements regarding the results
7.4
(10) the identification of the proposed preferred option 8.1
(11) for the proposed preferred option, the RIT-D proponent must provide:
(i) details of the technical characteristics;
(ii) the estimated construction timetable and commissioning date (where relevant);
(ii) the indicative capital and operating costs (where relevant);
(iv) a statement and accompanying analysis that the proposed preferred option satisfied the RIT-D; and
(v) if the proposed preferred option is for reliability corrective action and that option has a proponent, the name of the proponent
8.1 & 8.2

Final Project Assessment Report
Page 34 of 54
Energex Corporation Limited ABN 50 087 646 062
Appendix A – The Rit-D Process
Source: AEMC, Rule determination: National Electricity Amendment (Replacement expenditure planning arrangements) Rule 2017, July
2017, p. 64.
Any party may provide notice to AER and start process to
dispute any conclusion on the grounds of RIT-D application or
assessment errors
Publish Notice
• Addressing urgent and unforeseen network issues
• Most expensive option costs less than $6 million
• Maintenance expenditure
no
yes
no
yes
<$11 million
>$11 million
STOP no
Within 30 days

Final Project Assessment Report
Page 35 of 54
Energex Corporation Limited ABN 50 087 646 062
Appendix B – Future Limitation Network Options
The following sections outline the identified Network Options in more detail.
Option 1: Supply New Demand with 11kV Feeders from SSCLD, then Supply New Demand with 132kV Feeders (Tee off at Meridan Plains) to Bell’s Creek Central Establishment
This option involves continuing to supply the Aura subdivision and surrounding area with 11kV feeders from SSCLD until an additional 132/11kV substation is triggered by the Safety Net limitation at SSCLD. The costs for 11kV feeders have been determined individually considering conduit requirements, civil and other works in each case. Standard costs include $1300/m for conduit installation (6 conduits), plus $250/m for cable installation.
The works required to implement this option are:
• Establish 11kV feeders from SSCLD to supply Aura up to 2029
• Establish 2 x 132kV feeders to Bell’s Creek Central, establish Bell’s Creek Central 132/11kV
zone substation in 2029 to supply the continued load growth in the area and address the
safety net limitation at Caloundra. In this case it is assumed the 132kV feeders are
constructed overhead for the first 9km and underground for the remaining 4km based on
the timing of the works;
• Establish 11kV feeders as required to supply the Aura and Industrial area;
• Establish the 2nd 132/11kV transformer in 2031 at Bell’s Creek Central;
• Establish Bell’s Creek North 132/11kV zone substation with a single transformer in 2047
based on continued demand growth.
• Estimated initial capital cost: $4.2 million ± 40% (2026)
• Estimated initial operating cost per annum: $6,004 (2026)
A schematic diagram of the proposed solution is shown in Figure 15 below.

Final Project Assessment Report
Page 36 of 54
Energex Corporation Limited ABN 50 087 646 062
Figure 15: Proposed network arrangement under option 1
Final Project Assessment Report
Page 37 of 54
Energex Corporation Limited ABN 50 087 646 062
Option 2: Supply New Demand with 132kV Feeders (Tee off at Meridan Plains) to Bell’s Creek Central Establishment
This option involves supplying the Aura subdivision and surrounding area with 11kV feeders from a new substation at Bell’s Creek central.
The works required to implement this option are:
• Establish Bell’s Creek Central 132/11kV zone substation in 2026 with the following:
o single 132/11kV transformer,
o associated switchgear,
o 13km of 132kV overhead double circuit line;
• Establish 11kV feeders as required to supply the Aura and Industrial area;
• Establish the 2nd 132/11kV transformer in 2029 at Bell’s Creek Central;
• Establish Bell’s Creek North 132/11kV zone substation with a single transformer in 2047
based on continued demand growth.
• Estimated initial capital cost: $60.8 million ± 40% (2026)
• Estimated initial operating cost per annum: $152,597 (2026)
A schematic diagram of the proposed solution is shown in Figure 16 below.

Final Project Assessment Report
Page 38 of 54
Energex Corporation Limited ABN 50 087 646 062
132kV
Aura
Fdr 16MVA
Fdr 26MVA
Fdr 36MVA
11kV Feeders from Caloundra zone substation
TR1132/11kV60MVA
Bell s Creek Central zone substation
F803
11kV
TR2132/11kV60MVA
132kV
TR1132/11kV60MVA
Bell s Creek North zone substation
11kV
Industrial Development
Existing
2026
2029
2030
2032
2034
2036
2047
Figure 16: Proposed network arrangement under option 2

Final Project Assessment Report
Page 39 of 54
Energex Corporation Limited ABN 50 087 646 062
Option 3: Supply New Demand with 11kV Feeders from SSCLD and Establish 132kV Feeders, then Supply New Demand with 132kV Feeders (Tee off at Meridan Plains) to Bell’s Creek Central Establishment
This option involves establishing the 132kV double circuit line to Bell’s Creek central and utilising it only when required at 132kV. This option de-risks the later construction of underground 132kV. An 11kV feeder from Caloundra will be established to supply the Aura subdivision and surrounding area to delay the establishment of the Bell’s Creek Central substation.
The works required to implement this option are:
• Establish 13km of 132kV overhead double circuit line and one 11kV feeder to from Caloundra
11kV in 2026;
• Establish Bell’s Creek Central 132/11kV zone substation in 2028 with the following:
o single 132/11kV transformer,
o associated switchgear,
• Establish 11kV feeders as required to supply the Aura and Industrial area;
• Establish the 2nd 132/11kV transformer in 2030 at Bell’s Creek Central;
• Establish Bell’s Creek North 132/11kV zone substation with a single transformer in 2047
based on continued demand growth
• Estimated initial capital cost: $41 million ± 40% (2026)
• Estimated initial operating cost per annum: $112,053 (2026)
A schematic diagram of the proposed solution is shown in Figure 17 below.

Final Project Assessment Report
Page 40 of 54
Energex Corporation Limited ABN 50 087 646 062
132kV
Aura
Fdr 16MVA
Fdr 26MVA
Fdr 36MVA
11kV Feeders from Caloundra zone substation
Fdr 46MVA
TR1132/11kV60MVA
Bell s Creek Central zone substation
F803
TR2132/11kV60MVA
132kV
11kV
132kV
TR1132/11kV60MVA
Bell s Creek North zone substation
11kV
Industrial Development
Existing
2026
2028
2030
2032
2034
2036
2038
2047
Figure 17: Proposed network arrangement under option 3

Final Project Assessment Report
Page 41 of 54
Energex Corporation Limited ABN 50 087 646 062
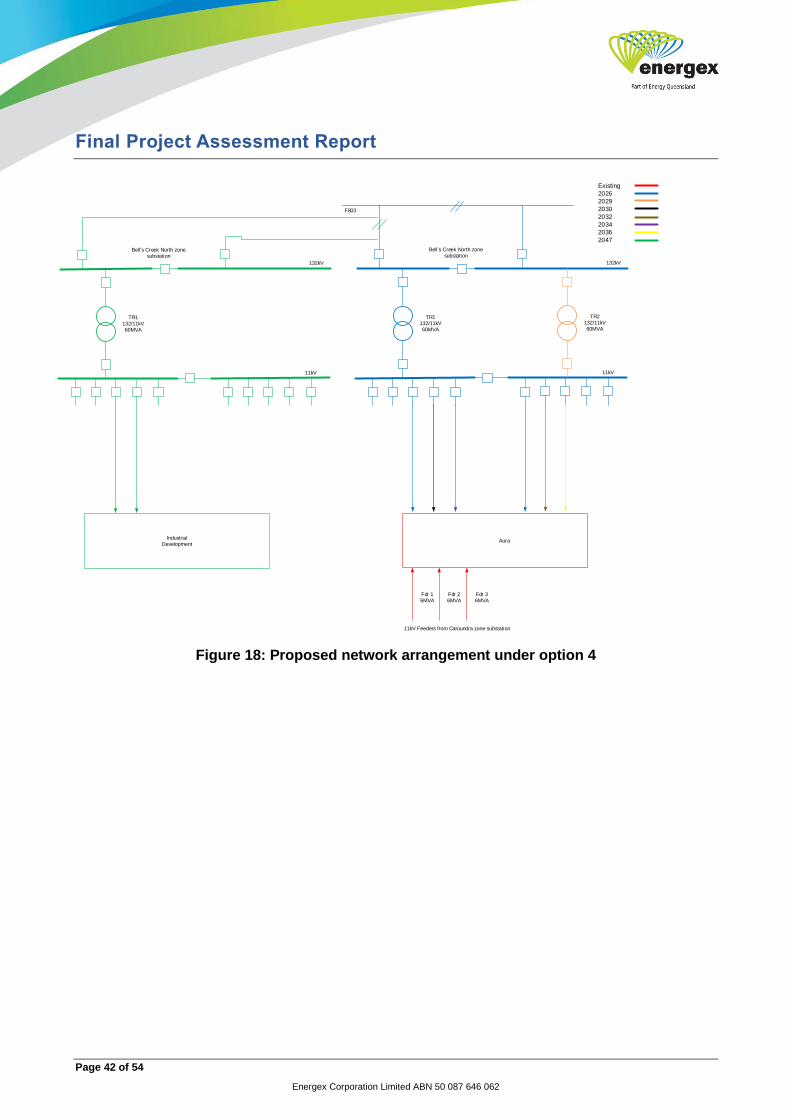
Option 4: Supply New Demand with 132kV Feeders (Tee off at Meridan Plains) to Bell’s Creek North Establishment
This option involves establishing a new substation at Bell’s Creek North to supply the Aura subdivision and surrounding area.
The works required to implement this option are:
• Establish Bell’s Creek North 132/11kV zone substation in 2026 with the following:
o single 132/11kV transformer,
o associated switchgear,
o 8km of 132kV overhead double circuit line;
• Establish 11kV feeders as required to supply the Aura and Industrial area;
• Establish the 2nd 132/11kV transformer in 2029 at Bell’s Creek North;
• Establish Bell’s Creek Central 132/11kV zone substation with a single transformer in 2047
based on continued demand growth.
• Estimated initial capital cost: $57.1 million ± 40% (2026)
• Estimated initial operating cost per annum: $116,955 (2026)
A schematic diagram of the proposed solution is shown in Figure 18 below.
Final Project Assessment Report
Page 42 of 54
Energex Corporation Limited ABN 50 087 646 062
132kV
Aura
Fdr 16MVA
Fdr 26MVA
Fdr 36MVA
11kV Feeders from Caloundra zone substation
TR1132/11kV60MVA
Bell s Creek North zone substation
F803
11kV
TR2132/11kV60MVA
132kV
TR1132/11kV60MVA
Bell s Creek North zone substation
11kV
Industrial Development
Existing
2026
2029
2030
2032
2034
2036
2047
Figure 18: Proposed network arrangement under option 4

Final Project Assessment Report
Page 43 of 54
Energex Corporation Limited ABN 50 087 646 062
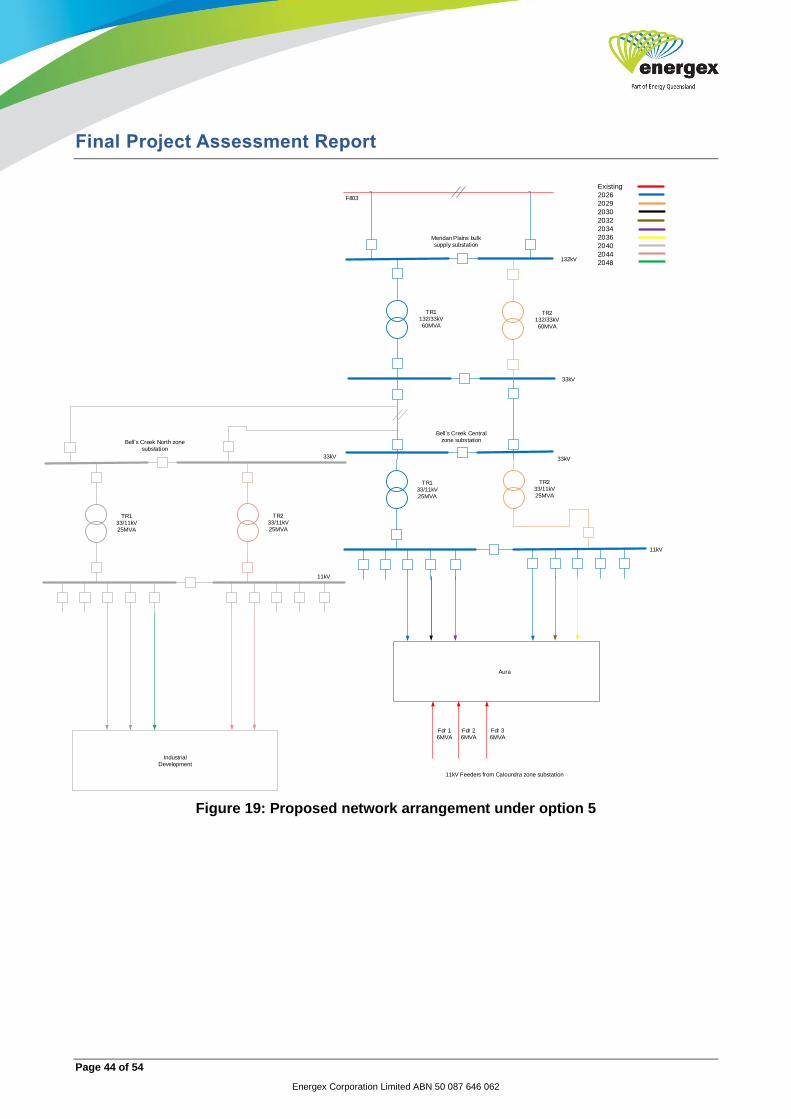
Option 5: Supply New Demand with 33kV Feeders from Meridan Plains Establishment to Bell’s Creek Central Establishment
This option involves establishing a new 132/33kV substation at Meridan Plains and a new 33/11kV substation at Bell’s Creek central.
The works required to implement this option are:
• Establish Meridan Plains 132/33 kV zone substation in 2026 with the following:
o single 132/33kV transformer,
o associated switchgear,
o 13km of 33kV overhead double circuit line to Bell’s Creek Central;
• Establish Bell’s Creek central 33/11kV zone substation in 2026 with the following:
o single 33/11kV transformer,
o associated switchgear;
• Establish 11kV feeders as required to supply the Aura and Industrial area;
• Establish the 2nd 132/33kV and 33/11kV transformer in 2029 at Meridan Plains and Bell’s
Creek Central respectively;
• Establish Bell’s Creek North 33/11kV zone substation with a single 33/11kV transformer in
2040 and a second 33/11kV transformer in 2044 based on continued demand growth.
• Estimated initial capital cost: $53.6 million ± 40% (2026)
• Estimated initial operating cost per annum: $143,424 (2026)
A schematic diagram of the proposed solution is shown in Figure 19 below.
Final Project Assessment Report
Page 44 of 54
Energex Corporation Limited ABN 50 087 646 062
TR1132/33kV60MVA
Meridan Plains bulk supply substation
132kV
33kV
Aura
Fdr 16MVA
Fdr 26MVA
Fdr 36MVA
TR133/11kV25MVA
33kV
11kV
Bell s Creek Centralzone substation
11kV Feeders from Caloundra zone substation
F803
TR2132/33kV60MVA
TR233/11kV25MVA
Existing
2026
2029
2030
2032
2034
2036
2040
2044
2048
33kV
TR133/11kV25MVA
Bell s Creek North zone substation
11kV
Industrial Development
TR233/11kV25MVA
Figure 19: Proposed network arrangement under option 5

Final Project Assessment Report
Page 45 of 54
Energex Corporation Limited ABN 50 087 646 062
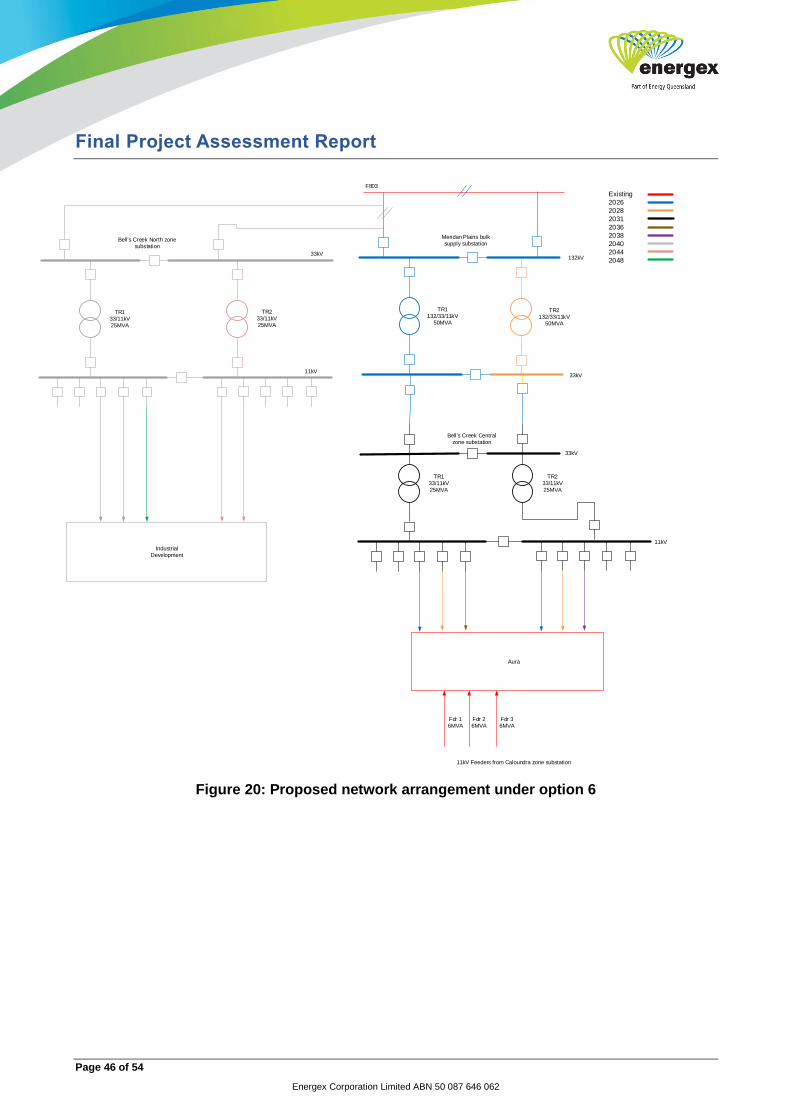
Option 6: Supply New Demand with 33kV Feeders from Meridan Plains (132/33/11kV) Establishment to Bell’s Creek Central Establishment
This option involves establishing the 132kV double circuit line to Bell’s Creek central and utilising it only when required at 132kV. This option de-risks the later construction of underground 132kV. An 11kV feeder from Caloundra will be established to supply the Aura subdivision and surrounding area to delay the establishment of the Bell’s Creek Central substation.
The works required to implement this option are:
• Establish Meridan Plains Bulk supply substation in 2026 with the following:
o single multivoltage 132/33/11kV transformer (Big Bertha),
o associated switchgear,
o 4 voltage regulators at Aura,
• 13km of 33kV overhead double circuit line to Aura (utlizied at 11kV);
• Establish 11kV feeders as required to supply the Aura and Industrial area;
• Establish the 2nd 132/33/11kV Big Bertha transformer at Meridan Plains in 2028;
• Establish Bell’s Creek Central 33/11kV zone substation in 2031 with the following:
o two 33/11kV transformers,
o associated switchgear;
• Establish Bell’s Creek North 33/11kV zone substation with a single 33/11kV transformer in
2040 and a second 33/11kV transformer in 2044 based on continued demand growth.
• Estimated initial capital cost: $43.9 million ± 40% (2026)
• Estimated initial operating cost per annum: $101,354 (2026)
A schematic diagram of the proposed solution is shown in Figure 20 below.
Final Project Assessment Report
Page 46 of 54
Energex Corporation Limited ABN 50 087 646 062
TR1132/33/11kV
50MVA
132kV
33kV
Aura
Fdr 16MVA
Fdr 26MVA
Fdr 36MVA
TR2132/33/11kV
50MVA
TR133/11kV25MVA
33kV
11kV
Bell s Creek Centralzone substation
TR233/11kV25MVA
11kV Feeders from Caloundra zone substation
Meridan Plains bulk supply substation
F803
Existing
2026
2028
2031
2036
2038
2040
2044
204833kV
TR133/11kV25MVA
Bell s Creek North zone substation
11kV
Industrial Development
TR233/11kV25MVA
Figure 20: Proposed network arrangement under option 6

Final Project Assessment Report
Page 47 of 54
Energex Corporation Limited ABN 50 087 646 062
Option 7: Supply New Demand with 33kV Feeders from Meridan Plains (132/33kV, 33/11kV) Establishment to Bell’s Creek Central Establishment
This option involves establishing a new 132/11kV and 33/11kV substation at Meridan Plains and establishing the 33kV double circuit line to Bells Creek central and utilising it initially at 11kV to supply the Aura subdivision and surrounding area. This option de-risks the later construction of underground 33kV by constructing it in 2026 and utilising it at 33kV only when required in 2031.
The works required to implement this option are:
• Establish Meridan Plains bulk supply substation in 2026 with the following:
o single 132/33kV transformer,
o single 33/11kV transformer,
o 4 voltage regulators at Aura,
• 13km of 33kV overhead double circuit line to Aura (utlizied at 11kV);
• Establish 11kV feeders as required to supply the Aura and Industrial area;
• Establish the 2nd 132/33kV transformer at Meridan Plains in 2028;
• Establish the 2nd 33/11kV transformer at Bell’s Creek Central in 2028;
• Establish Bell’s Creek Central 33/11kV zone substation in 2031 with the following:
o reuse the two 33/11kV transformers from Meridan Plains
o associated switchgear;
• Establish Bell’s Creek North 33/11kV zone substation with a single 33/11kV transformer in
2040 and a second 33/11kV transformer in 2044 based on continued demand growth.
• Estimated initial capital cost: $44.2 million ± 40% (2026)
• Estimated initial operating cost per annum: $103,370 (2026)
A schematic diagram of the proposed solution is shown in Figure 21 below.

Final Project Assessment Report
Page 48 of 54
Energex Corporation Limited ABN 50 087 646 062
TR1132/33kV60MVA
132kV
33kV
Aura
Fdr 16MVA
Fdr 26MVA
Fdr 36MVA
TR2132/33kV60MVA
TR133/11kV25MVA
33kV
11kV
Bell s Creek Centralzone substation
TR233/11kV25MVA
11kV Feeders from Caloundra zone substation
Meridan Plains bulk supply substation
F803
Existing
2026
2028
2031
2036
2038
2040
2044
2048
33kV
TR133/11kV25MVA
Bell s Creek North zone substation
11kV
Industrial Development
TR233/11kV25MVA
Figure 21: Proposed network arrangement under option 7

Final Project Assessment Report
Page 49 of 54
Energex Corporation Limited ABN 50 087 646 062
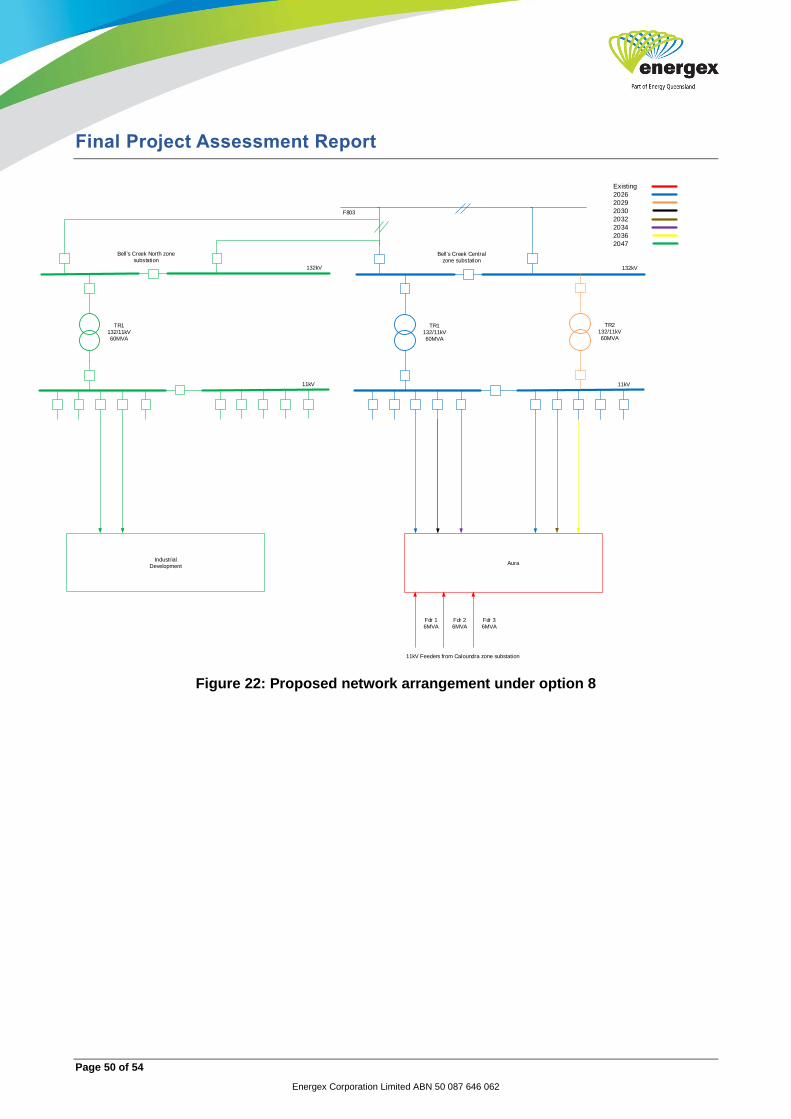
Option 8: Supply New Demand with 132kV Feeders (Tee off at Mark Rd East) to Bell’s Creek Central Establishment
This option involves establishing a new substation at Bell’s Creek Central to supply the Aura subdivision and surrounding area. This option is similar to Option 2.
The works required to implement this option are:
• Establish Bell’s Creek Central 132/11kV zone substation in 2026 with the following:
o single 132/11kV transformer,
o associated switchgear,
o 7km of 132kV double circuit line (1km OH, 6km UG) from Mark Rd East;
• Establish 11kV feeders as required to supply the Aura and Industrial area;
• Establish the 2nd 132/11kV transformer in 2029 at Bell’s Creek North;
• Establish Bell’s Creek North 132/11kV zone substation with a single transformer in 2047
based on continued demand growth.
• Estimated initial capital cost: $62.7 million ± 40% (2026)
• Estimated initial operating cost per annum: $125,599 (2026)
A schematic diagram of the proposed solution is shown in Figure 22 below.
Final Project Assessment Report
Page 50 of 54
Energex Corporation Limited ABN 50 087 646 062
132kV
Aura
Fdr 16MVA
Fdr 26MVA
Fdr 36MVA
11kV Feeders from Caloundra zone substation
TR1132/11kV60MVA
Bell s Creek Central zone substation
F803
11kV
TR2132/11kV60MVA
132kV
TR1132/11kV60MVA
Bell s Creek North zone substation
11kV
Industrial Development
Existing
2026
2029
2030
2032
2034
2036
2047
Figure 22: Proposed network arrangement under option 8

Final Project Assessment Report
Page 51 of 54
Energex Corporation Limited ABN 50 087 646 062
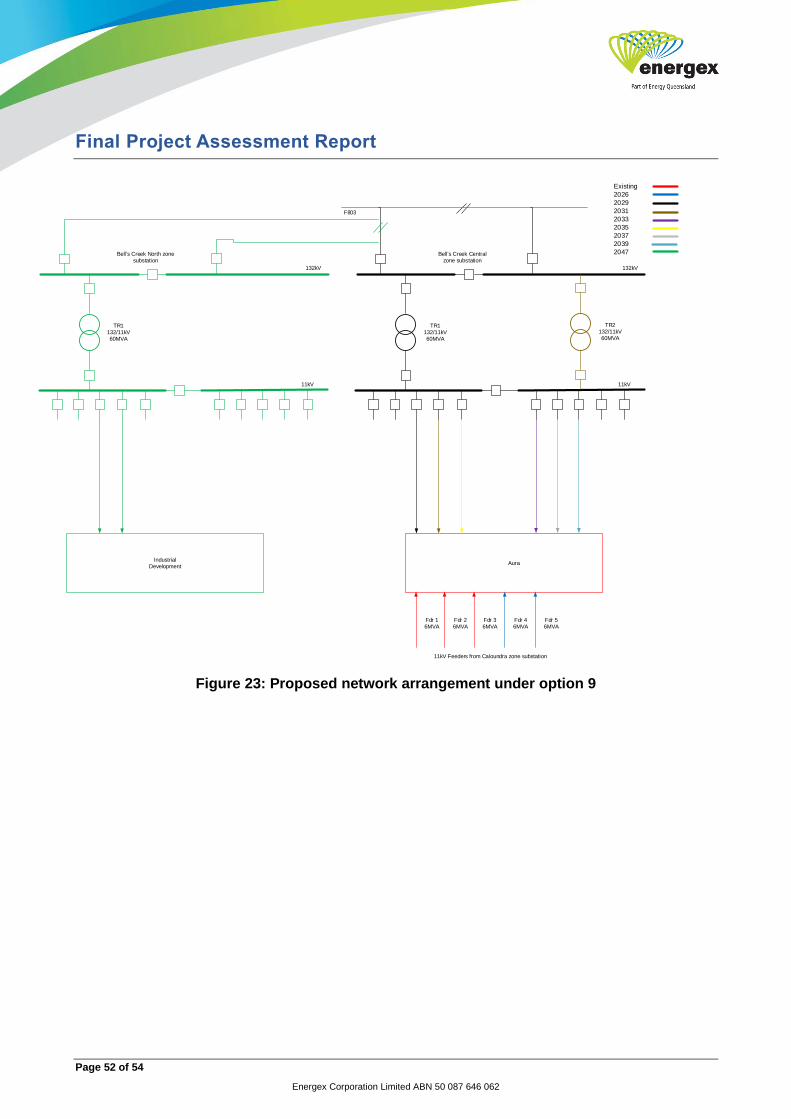
Option 9: Supply New Demand with 132kV Feeders from Caloundra Substation to Bell’s Creek Central Establishment
This option involves establishing a new 132kV double circuit line from Caloundra Substation and utilising it initially at 11kV to supply the Aura subdivision and surrounding area. This option is similar to Option 1 where the construction of Bell’s Creek Central establishment is deferred and constructed when required in 2029.
The works required to implement this option are:
• Establish 9km of 132kV double circuit line (1km OH, 8km UG) from SSCLD in 2026;
• Establish Bell’s Creek Central 132/11kV zone substation in 2029 with the following:
o two 132/11kV transformers,
o associated switchgear;
• Establish 11kV feeders as required to supply the Aura and Industrial area;
• Establish Bell’s Creek North 132/11kV zone substation with a single transformer in 2047
based on continued demand growth.
• Estimated initial capital cost: $50.9 million ± 40% (2026)
• Estimated initial operating cost per annum: $102,683 (2026)
A schematic diagram of the proposed solution is shown in Figure 23 below.
Final Project Assessment Report
Page 52 of 54
Energex Corporation Limited ABN 50 087 646 062
132kV
Aura
Fdr 16MVA
Fdr 26MVA
Fdr 36MVA
11kV Feeders from Caloundra zone substation
TR1132/11kV60MVA
Bell s Creek Central zone substation
F803
11kV
TR2132/11kV60MVA
Fdr 46MVA
Fdr 56MVA
Existing
2026
2029
2031
2033
2035
2037
2039
2047
132kV
TR1132/11kV60MVA
Bell s Creek North zone substation
11kV
Industrial Development
Figure 23: Proposed network arrangement under option 9
Final Project Assessment Report
Page 53 of 54
Energex Corporation Limited ABN 50 087 646 062
Option 10: Contract a 24MW/39.75MWh Battery Energy Storage Solution
This option involves contracting a proponent to provide a series of Battery Energy Storage Solution (BESS) totalling 24MW/39.75MWh for an 8-year period to eliminate load at risk in the vicinity of SSCLD from 2022. The BESS will be fully charged and ready to provide peak load relief.
The works required to implement this option are:
• Proponent to install and provide 24MW/39.75MWh battery support across CLD1A, CLD11,
CLD18A, CLD29A and the new CLD 11kV feeder from SSCLD to Aura.
o 2MW/2.3MWh on CLD11 in 2021
o 22MW/37.45MWH spread across CLD1A, CLD11, CLD18A, CLD29A and the new
CLD 11kV in 2027
• Establish 4km of 132kV underground double circuit line and one 11kV feeder to from
Caloundra 11kV in 2026;
• Establish a 11kV feeder tie between CLD18A and CLD29A with 132kV feeder but energised
at 11kV;
• Establish Bell’s Creek Central 132/11kV zone substation in 2030 with the following:
o 2 x 132/11kV transformer,
o associated switchgear,
o 9km of 132kV overhead double circuit line;
• Establish 11kV feeders as required to supply the Aura and Industrial area;
• Establish Bell’s Creek North 132/11kV zone substation with a single transformer in 2047
based on continued demand growth.
Note: capital and operating costs have been withheld as Commercial-in-Confidence with the proponent.

Final Project Assessment Report
Page 54 of 54
Energex Corporation Limited ABN 50 087 646 062
132kV
Aura
Fdr 16MVA
Fdr 26MVA
Fdr 36MVA
11kV Feeders from Caloundra zone substation
TR1132/11kV60MVA
Bells Creek Central zone substation
F803
11kV
TR2132/11kV60MVA
132kV
TR1132/11kV60MVA
Bells Creek North zone substation
11kV
Industrial Development
Existing
2026
2030
2034
2036
2047