FEMORAL MIDSHAFT HISTOMORPHOMETRIC PATTERNING: IMPROVING MICROSCOPIC AGE AT DEATH ESTIMATES FROM...
222
FEMORAL MIDSHAFT HISTOMORPHOMETRIC PATTERNING: IMPROVING MICROSCOPIC AGE AT DEATH ESTIMATES FROM ADULT HUMAN SKELETAL REMAINS Dissertation Presented in Partial Fulfillment of the Requirements for the Degree Doctor of Philosophy in the Graduate School of The Ohio State University By Megan E. Ingvoldstad, MA Graduate Program in Anthropology The Ohio State University 2012 Dissertation Committee: Dr. Sam Stout, Advisor Dr. Clark Spencer Larsen Dr. Paul W. Sciulli Dr. Julie Field
Transcript of FEMORAL MIDSHAFT HISTOMORPHOMETRIC PATTERNING: IMPROVING MICROSCOPIC AGE AT DEATH ESTIMATES FROM...

FEMORAL MIDSHAFT HISTOMORPHOMETRIC PATTERNING:
IMPROVING MICROSCOPIC AGE AT DEATH ESTIMATES FROM
ADULT HUMAN SKELETAL REMAINS
Dissertation
Presented in Partial Fulfillment of the Requirements for the Degree Doctor of Philosophy
in the Graduate School of The Ohio State University
By
Megan E. Ingvoldstad, MA
Graduate Program in Anthropology
The Ohio State University
2012
Dissertation Committee:
Dr. Sam Stout, Advisor
Dr. Clark Spencer Larsen
Dr. Paul W. Sciulli
Dr. Julie Field

Copyright by
Megan E. Ingvoldstad
2012

ii
ABSTRACT
Use of microscopic techniques to estimate adult age at death is well established
within physical anthropology’s subfields of bioarchaeology and forensic anthropology. In
order to become a more robust approach, however, the long-standing problems of the
osteon population density (OPD) asymptote and high standard error of the estimate (SEE)
must be overcome.
Review of the microscopic age at death estimation literature revealed that
arbitrarily changing skeletal elements, histological variables, sample demographics, and
sampling locations have not allowed for accurate age estimation of individuals over ~50
years or reduced the standard error of age estimates. This investigation therefore began
with substantiated theory. All healthy, mobile femurs have in common: genetic
programming to establish initial size and shape; the developmental processes of
endochondral ossification, appositional growth, and modeling; biomechanical and
periosteal adaptation; cortical thinning and shape change during aging; mechanosensation
and mechanotransduction; and bone remodeling.
Building from this theoretical knowledge base, it was first hypothesized that
topographical variation in remodeling exists around human femoral midshaft periosteal
cortices that reflects the constraints of normal anatomical development, customary
biomechanical usage, and standard mechanobiological functioning. Second, it was
hypothesized regions of interest (ROIs) associated with the Imin second moment of area

iii
would exhibit the lowest remodeling as a result of minimal biomechanical loading. Third,
it was hypothesized remodeling at biomechanical ROIs would be histomorphometrically
more consistent than at anatomical ROIs due to femoral functional constraints related to
obligate striding bipedalism.
These hypotheses were tested by counting remodeling events at eight standardized
periosteal ROIs [four anatomical—A (anterior), P (posterior), M (medial), L (lateral)—
and four biomechanical—ImaxAnt, ImaxPost, IminMed, and IminLat] of 200 adult femoral midshaft
cross-sections originally harvested by M.F. Ericksen from George Washington University
dissecting room cadavers.
While no evidence was found for reduced remodeling at Imin ROIs or for more
consistent remodeling at biomechanical ROIs, 14 statistically significant differences were
found between ROI OPD medians indicating topographical variation in remodeling exists
around the femoral midshaft. Specifically, the lowest OPDs occurred at the Anterior ROI,
followed by the Posterior, IminMed, ImaxPost, ImaxAnt, IminLat, Medial, and Lateral ROIs.
Additionally, although the anterior femoral cortex has traditionally been sampled
for microscopic age at death estimation, here, the Anterior ROI was found to reach the
OPD asymptote at approximately 50 years of age and was associated with the highest
SEE. Alternatively, the Posterior ROI, the location possessing the second lowest median
OPD value, was found to be associated with the lowest SEE and showed no sign of
having reached the OPD asymptote. It is therefore suggested bioarchaeologists and
forensic anthropologists utilize the Posterior ROI for production of the most accurate and
precise microscopic age at death estimates from adult human skeletal remains.

iv
For my Family –
My Parents, Dorothy and David,
And My Sisters, Lauren and Kiera.

v
ACKNOWLEDGEMENTS
I am truly grateful to the people and institutions that contributed to the successful
completion of my PhD: Dr. Joyce Sirianni at The State University of New York at
Buffalo who first sparked my interest in physical anthropology, Dr. Susan Antón at New
York University who provided opportunities to apply my osteological knowledge, the
NYC Office of Chief Medical Examiner Forensic Anthropology Unit for collective
mentorship, my OSU Anthropology Department instructors for their encouragement to
become a well-rounded anthropologist, my dissertation committee for improving the
quality of this research beyond measure, and Dr. Sam Stout, a truly skilled advisor and
role model. This research could also not have been completed without access to the
Ericksen collection, for which I would like to thank Dr. Sam Stout and Dr. Christian
Crowder; interobserver error data collection, for which I would like to thank Victoria
Dominguez; and editorial assistance, for which I would like to thank George Tsiatis.

vi
VITA
2005……………… BA, summa cum laude, The State University of New York at Buffalo
2007…………………………………………………………... MA, New York University
2006–2008………………..…………… Editorial Associate, Journal of Human Evolution
2006–2008………Graduate Student Intern, NYC Office of Chief Medical Examiner FAU
2007–2008…Lead Osteologist, Oriental Institute Nubian Expedition, 4th Cataract, Sudan
2008–2011.……..Graduate Teaching Associate, The Ohio State University Anthropology
Department
2011………Forensic Science Academy Fellow, Joint Prisoners of War Missing in Action
Accounting Command, Joint Base Pearl Harbor-Hickam, Hawaii
2012………………………...Adjunct Faculty, Queens College Anthropology Department
2012……Forensic Anthropologist, Joint Prisoners of War Missing in Action Accounting
Command, Joint Base Pearl Harbor-Hickam, Hawaii
FIELDS OF STUDY
Major Field: Anthropology
Area of Emphasis: Physical Anthropology
Minor Field: Anatomy

vii
TABLE OF CONTENTS
Abstract……………………………………………………………………………………ii
Dedication………………………………………………………………………………...iv
Acknowledgements………………………………………………………………………..v
Vita………………………………………………………………………………………..vi
Table of Contents………………………………………………………………………...vii
List of Tables……………………………………………………………………………viii
List of Figures…………………………………………………………………………….ix
Chapter 1: Introduction……………………………………………………………………1
Chapter 2: Literature Review…………………………………………………………….19
Chapter 3: Hypotheses…………………………………………………………………...55
Chapter 4: Materials and Methods……………………………………………………….62
Chapter 5: Results………………………………………………………………………..74
Chapter 6: Discussion and Conclusion…………………………………………………111
Bibliography……………………………………………………………………………117
Appendix A: Total Ericksen Sample Data……………………………………………...124
Appendix B: Research Sample Biomechanical Data…………………………………...135
Appendix C: Research Sample Cross-Sectional Images……………………………….140
Appendix D: Research Sample Cortical Thickness Data………………………………151
Appendix E: Research Sample Remodeling Data……………………………………...156
Appendix F: Research Sample Remodeling Data Images……………………………...161

viii
LIST OF TABLES
Table 1. Chronological Changes to Histologically Analyzed Skeletal Elements…………9 Table 2. Chronological Changes to Histological Variables Collected…..………………12 Table 3. Samples Used in Femoral Microscopic Age at Death Estimation Methods……13 Table 4. Definitions of Cross-Sectional Geometric Properties…………………………..31 Table 5. Anterior Compartment Muscles of the Thigh...…………………………….......43 Table 6. Medial Compartment Muscles of the Thigh...………………………………….45 Table 7. Posterior Compartment Muscles of the Thigh...………………………………..46 Table 8. Tests of Normality for the Cortical Thickness Measurements…………………75 Table 9. Correlations between Cortical Thickness Locations and Age………………….79 Table 10. Tests of Normality for the Biomechanical Variables…………………………82 Table 11. Correlations between Biomechanical Variables and Age……………………..82 Table 12. Intraobserver and Interobserver Error Raw Data……………………………...89 Table 13. Tests of Normality for the Observer Error Data………………………………90 Table 14. Test of Sphericity for the Observer Error Data………………………………..91 Table 15. Tests of Within-Subjects Effects for the Observer Error Data………………..91 Table 16. Intraobserver and Interobserver Error Test Descriptives……………………...92 Table 17. Tests of Normality for the Original OPD Data by ROI…...………………......94 Table 18. Tests of Normality for the OPD Data (Outliers Excluded) by ROI…………...96 Table 19. Significant Differences between ROI OPD Means (Outliers Excluded)…..….97 Table 20. Significant Differences between ROI OPD Means (Outliers Included)..........100 Table 21. Significant Differences between ROI OPD Medians………………………..102 Table 22. Correlations between ROI OPD Data and Age……………………………...107 Table 23. ROI OPD Linear Regression Data…………………………………………...108
Table 24. ROI OPD Linear Regression Data (Continued)……………………………..109

ix
LIST OF FIGURES
Figure 1. Microradiographs of the Femoral Cortex Over the Human Lifespan……….….3 Figure 2. Skeletal Elements Histologically Analyzed….…………………………………8 Figure 3. Histological Variables……………...………………………………………….11 Figure 4. Femoral Regions of Interest………….….…………………………………….15 Figure 5. Endochondral Ossification Process……………………………………………22 Figure 6. Bone Modeling………………………………………………………………...25 Figure 7. Forces Acting on Bones to Deform or Fracture Them………………………...28 Figure 8. The Relationship between Bone Stress and Strain…………………………….29 Figure 9. From Preosteoblast to Osteocyte………………………………………………37 Figure 10. The Structure of Bone………………………………………………………..39 Figure 11. Superficial Structures of the Thigh…………………………………………...41 Figure 12. The Anterior, Medial, and Posterior Compartments of the Thigh…………...42 Figure 13. Muscles of the Anterior Compartment of the Thigh…………………………43 Figure 14. Cross-Section of the Midshaft of the Femur…………………………………44 Figure 15. Muscles of the Medial Compartment of the Thigh…………………………..45 Figure 16. Muscles of the Posterior Compartment of the Thigh………………………...47 Figure 17. Neurectomy Effect on Tibia Shape…………………………………………..50 Figure 18. Remodeling Process………………………………………………………….54 Figure 19. The Lifecycle of the Femur…………………………………………………..55 Figure 20. Bar Chart: Research Sample Female-to-Male Ratio.…………………….......63 Figure 21. Bar Chart: Research Sample Black-to-White Ratio.………………………....63 Figure 22. Pie Chart: Research Sample Age Distribution...……………………………..64 Figure 23. Pie Chart: Research Sample Cause of Death Distribution…………………...64

x
Figure 24. Study Methodology………………………………………………………......65 Figure 25. Boxplots: Femoral Cortical Thickness Values at Standardized Locations…..75 Figure 26. Significant Pairwise Comparisons between Cortical Thickness Locations….77 Figure 27. Scatterplots: Linear Associations between Cortical Thicknesses and Age…..78 Figure 28. Scatterplots: Associations between Anterior, Medial, Posterior, and Lateral Cortical Thicknesses and Age……………………………………………...…80 Figure 29. Scatterplot: Linear Association between Cortical Area and Age.....................81 Figure 30. Scatterplot: Linear Association between Medullary Area and Age………….83 Figure 31. Scatterplot: Linear Association between Total Subperiosteal Area and Age...84 Figure 32. Scatterplot: Linear Association between Ix/Iy Ratio and Age………………..85 Figure 33. Scatterplot: Linear Association between Theta and Age ……………………87 Figure 34. Location of Imax over the Lifecycle of the Femur………………………….....87 Figure 35. Scatterplot: Linear Association between Zp and Age.......................................88 Figure 36. Boxplots: Intraobserver and Interobserver Error Data……...………………..90 Figure 37. Boxplots: All OPD Data Organized by Region of Interest………………......93 Figure 38. Boxplots: OPD Data (Outliers Excluded) Organized by Region of Interest…95 Figure 39. Bar Chart: Mean OPDs by Region of Interest (Outliers Excluded).…………98 Figure 40. Bar Chart: Mean OPDs by Region of Interest (Outliers Included)..………..101 Figure 41. Significant Pairwise Comparisons between ROI OPD Medians…………....103 Figure 42. Bar Chart: Median OPDs by Region of Interest (Kruskal-Wallis Test)..…...104 Figure 43. Scatterplots: Linear Associations between OPD and Age by ROI…...……..106 Figure 44. Scatterplots: 95% Confidence/Prediction Intervals for Age by ROI…….….110

1
CHAPTER ONE: INTRODUCTION
Physical anthropologists need to produce both accurate and precise age at death
estimates from human skeletal remains. Bioarchaeologists, for example, require correct
skeletal age data to comment on population structure, life expectancy, fertility, and
mortality rates in the past and to ultimately compare population trends. Similarly,
forensic anthropologists must develop an age at death estimate from unidentified skeletal
remains to eventually associate them with a missing individual of known chronological
age. In both cases, imprecise and inaccurate age estimates are detrimental: the
bioarchaeologist misunderstands the adaptive success of a past population, and the
forensic anthropologist fails to make an identification.
Accurate and precise age estimation is especially problematic for adult human
skeletal remains. Traditionally, physical anthropologists have assessed the degeneration
of macroscopic skeletal structures, such as the fourth sternal rib end (Iscan and Loth,
1986), pubic symphysis (Brooks and Suchey, 1990), and the auricular surface (Lovejoy et
al., 1985) to estimate adult age at death. The skeletal elements required to perform
macroscopic age analyses, however, ―are often missing or obliterated in fragmented,
eroded, or incomplete skeletons‖ (Kerley, 1965: 149), frequently preventing use of such
techniques. Additionally, as qualitative indicators of adult age, ―the accuracy of the
estimate [resulting from application of macroscopic techniques] depends greatly on the
experience of the examiner‖ (Kerley, 1965: 149).

2
As early as 1911, Balthazard and Lebrun recognized the need for an adult age at
death estimation technique based on quantitative traits that could be utilized even when
only fragments or degraded bone were available—development of such a technique
would circumvent the issues of poor preservation and observer experience. Thus, when
Jowsey (1960: 215; Fig. 1) demonstrated microscopic biological changes in the femoral
midshaft cortex were broadly correlated with chronological age, within five years,
physical anthropologist Ellis R. Kerley (1965) provided linear regression equations for
quantitatively correlating microscopic osseous data with adult age at death. Kerley (1965:
162) further examined femoral specimens 500–5000 years old from the Philippines,
Aleutian Islands, Virginia, and Florida to test the applicability of his proposed
microscopic method on remains exposed to a variety of taphonomic conditions. He found
all slides sufficiently clear and detailed for microscopic analysis, prompting its use in
bioarchaeological paleodemographic reconstruction (see Ubelaker, 1974: 53–58).
Later, forensic anthropologists also incorporated and further developed
microscopic methods for estimating adult age at death in an effort to assist the medico-
legal community. For example, following Kerley (1965), Stout (1986) provided an
equation for estimating age at death from the ribs, Stout and Paine (1994) a method for
using the rib and clavicle together, Stout and colleagues (1996) a revised clavicle
formula, and Cho and colleagues (2006) ancestry dependent equations to predict age at
death from the ribs. The ribs and clavicle were specifically chosen for forensic
microscopic analysis because they are easily accessed during routine autopsy, and
because they are typically removed from unidentified remains as part of forensic
anthropologists’ standard macroscopic age assessment procedure.

3
Figure 1. Micro-radiographs of the femoral cortex of a (a) 2 ½ -year-old male; (b) 17-
year-old male; and (c) 77-year-old female (x20). Modified from Jowsey (1960: 215) with
permission from Lippincott Williams & Wilkins.

4
Thus, use of microscopic, or histological, techniques to estimate adult skeletal age
at death is well established within physical anthropology’s subfields of bioarchaeology
and forensic anthropology. Just like the macroscopic techniques that preceded them,
however, microscopic approaches for estimating skeletal age at death also contain
challenges that have discouraged numerous researchers. Some of these challenges are
unavoidable aspects of histological research, such as the great expense incurred for
necessary embedding, grinding, sectioning, and microscopic equipment; the intensive
time and labor required to produce cross-sections for microscopic analysis; and the often
destructive sampling techniques (Kemkes-Grottenhalter, 2002). There are three long-
standing problems, however, that must be overcome to ensure the future of the field: high
observer error, the osteon population density (OPD) asymptote, and relatively high
standard error of the estimate (SEE).
To expand, because histological methods of estimating age at death are
quantitative, or largely based on counting of discrete traits, the experience level of the
observer should be unimportant. Lynnerup and colleagues (1998), however, found
intraobserver and interobserver error to be quite high. To test and document error rates in
histological age at death analysis, they photographed 29 anterior region femoral midshaft
sections from the Institute of Forensic Pathology at the University of Copenhagen and
covered each printed photograph with a clear plastic sheet. They then requested three
experienced histomorphologists count secondary osteons, Haversian canals, and osteon
fragments on two occasions approximately two months apart. When intraobserver error
was quantified by plotting difference between the two counts against the mean, there was
considerable lack of agreement with discrepancies of up to 14 for osteons, 13 for

5
Haversian canals, and 49 for osteon fragments. Interobserver discrepancies were of
almost the same magnitude: while osteons were reliably identified by all observers, the
limits of agreement in counts of fragments and Haversian canals were wide, indicating
difficulty in reliably assessing such structures (Lynnerup et al., 1998).
This documented high observer error rate likely stems from a lack of standardized
definitions for commonly encountered osseous histological structures. Robling and Stout
(2008), for example, have noted how histomorphologists differentially define the basic
structure of an osteon: Kerley (1965) counted an osteon when greater than or equal to 80
percent of the original lamellar area was present in association with an intact Haversian
canal, Stout (1986) required greater than or equal to 90 percent of a Haversian canal be
present, while Ericksen (1991) required 100 percent of the Haversian canal in order to be
counted. It is understandable that considerable observer error results when current
researchers differentially adhere to different structural definitions. Heinrich and
colleagues (2012) have therefore standardized the definitions of histological structures
commonly quantified for microscopic age at death estimation (intact and fragmentary
secondary osteons) in order to reduce future observer error.
The OPD asymptote and high SEE, however, are histological aging problems
without obvious solutions, and researchers have had less success resolving them. The
OPD asymptote is the age estimation limitation whereby ―as total osteon creations
accumulate in diaphyseal cross sections, some new osteons begin to remove all evidence
of some preexisting ones, and eventually the visible osteons plus fragments of partly
replaced ones tend to reach an asymptotic value and stay there during further creations‖
(Frost, 1987b: 240). As the microscopist only sees and measures visible osteons and

6
fragments, not missing ones, omitting the latter causes age underestimations. Although
different bones of the human skeleton likely reach the OPD asymptote at varying ages
(Amprino and Marotti, 1964; Frost et al., 1960; Marotti, 1976) depending on new osteon
creation rate, osteon size, and cortical area (Cho et al., 2002: 17), Wu and colleagues
(1970) have estimated it occurs around 60 years of age in the human rib. This suggests
estimating age of individuals over ~60 years with microscopic methods is impossible.
Frost (1987b) provided an algorithm for estimating missing osteons in an attempt
to adjust for the OPD asymptote. Stout and Paine (1994), however, tested this algorithm
on 44 autopsy rib samples and demonstrated estimates produced by it were in reasonable
agreement with age-matched tetracycline-based values, except for those individuals
beyond their fifth decade of life. This finding confirmed that estimating age in older
individuals is problematic, and it remains so today: individuals greater than or equal to 50
are often grouped into the single broad cohort of 50 years and older (Cho and Stout,
2003), a significant setback for bioarchaeologists comparing population structures and
forensic anthropologists attempting to age unidentified mature skeletal remains.
A final challenge is that age estimates produced from histological techniques are
associated with relatively high standard error, or inaccuracy of the prediction, due to
human variation in the aging process. Kerley (1965), for example, generated linear
regression equations that quantitatively correlated the microscopic variables of femoral,
tibial, and fibular osteons, osteon fragments, circumferential lamellar bone percentage,
and non-Haversian canals with adult age at death. These age predicting equations,
however, include standard errors that range from ± 5.27 years for fibular osteon
fragments to ± 13.85 years for femoral non-Haversian canals. Further, the standard error

7
of an age estimate generated for an independent sample could be even greater. An age
range of 35–45 or 26–54 years produced from a 40-year-old point age estimate is again of
limited utility to bioarchaeologists comparing populations containing middle-aged and
mature adults, and forensic anthropologists hoping to narrow a missing persons list.
Retrospective review of histological age at death estimation methods to the
present reveals how arbitrarily changing the (1) selected skeletal element analyzed, (2)
histological data type collected, (3) sample demographics, and (4) regions of interest
(ROIs) microscopically viewed will not provide the solutions to eliminating the pervasive
issues of the OPD asymptote and high SEE.
To expand, because various bones of the dog skeleton reach the OPD asymptote
at different ages (Marotti, 1976), skeletal element subjected to microscopic analysis for
age at death estimation has been considered as a factor influencing the adult human OPD
asymptote and SEE. Kerley (1965: 162; Fig. 2f–h), for example, originally chose to
analyze ―any or all of the major long bones of the leg [femur, tibia, and fibula],‖ since
they could be ―articulated with the axial skeleton through the hip joint to establish
continuity with the spine and skull.‖ When the difficulties of aging older individuals and
high standard error associated with his method were recognized, however, Singh and
Gunberg (1970) departed from Kerley’s original method and microscopically analyzed
mandibular in addition to tibial and femoral thin sections (Fig. 2b). Similarly, Thompson
(1979; Fig. 2d) sampled humeri and ulnae in addition to femurs and tibias, Cool and
colleagues (1995; Fig. 2a) occipital bones, Stout and colleagues (1996; Fig. 2c) the
clavicle, and Cho and colleagues (2002; Fig. 2e) ribs.

8
Figure 2. Skeletal elements histologically analyzed include: (a) occipital, (b) mandible,
(c) clavicle, (d) humerus, (e) sixth rib midshaft, (f) femur, (g) tibia, and (h) fibula.
Modified from Robling and Stout (2008) with permission from John Wiley and Sons.
Stout and colleagues (1996: 140) suggested clavicles are subjected to lower
biomechanical loading than long bones, and are thus more appropriate for analysis, and
Cool and colleagues (1995: 789) indicated no accurate method exists for aging the
isolated and edentulous adult cranium. Beyond these considerations, however, no
anatomical, biomechanical, or mechanobiological theory was typically provided for why
specific bones selected for analysis might produce better results than Kerley’s (1965)
method, and for the most part, they did not: analyzing new skeletal elements has not
provided a solution to the OPD asymptote. Cho et al. (2002: 17), for example, still state
―changes in bone remodeling rates in older adults are not well understood, and, therefore,
make histological age estimation less reliable for individuals over 60 years.‖ Analysis of
new skeletal elements has also not lowered the SEE (Table 1): rather, each technique
following Kerley’s (1965) contains greater or equivalent error excepting the Singh and
Gunberg (1970) method, which misleadingly appears quite accurate because its age

9
predicting equations are based on a small sample of males. Similarly, a mean absolute
difference between reported and predicted ages of 5.5 years extended by Stout et al.
(1996) is encouraging, but includes a maximum absolute age difference of 22.2 years.
Table 1. Chronological Changes to Histologically Analyzed Skeletal Elements for
Microscopic Age at Death Estimation.
Method Year New Elements SEE
Kerley 1965 Femur, Tibia, Fibula ± 5.27–13.85
Singh &
Gunberg
1970 Mandible ± 2.55–3.83
Thompson 1979 Humerus, Ulna ± 6.2–10.6
Cool et al. 1995 Cranium (Occipital) Unreported, but ―the amount of random
variation in the parameters
examined preclude [occipital] use for
accurate age estimation‖ (789)
Stout et al. 1996 Clavicle Mean absolute difference between
reported and predicted ages is 5.5 years
Cho et al. 2002 Rib Mean absolute difference between
reported and predicted ages is 11.8 years
A second factor that has been considered to relate to the problems of the OPD
asymptote and high SEE is the type of histological data collected. For example, Kerley
(1965) originally documented the four variables of osteon number (to be counted, an
osteon has 80 percent or more of its area easily distinguishable and canal intact; Fig. 3e),
number of old osteon fragments (Fig. 3g), percentage of circumferential lamellar bone
(Fig. 3c), and non-Haversian canal number (Fig. 3d). Once tabulated, the mean value for
each variable was plotted against known age. All variables in each bone significantly
correlated with age, but often with high standard error and increasing inaccuracy for older

10
adults. Ahlqvist and Damsten (1969), however, suggested it was difficult to distinguish
osteons from osteon fragments given the 80 percent definition and to estimate
circumferential lamellar bone in a circular visual field. Their follow-up method for
estimation of age at death therefore required estimating percent Haversian bone inside a
superimposed square reticule. Because osteon fragments are often cut obliquely,
however, Singh and Gunberg (1970) suggested documenting total number of osteons (for
their purposes, an osteon is defined as having a complete Haversian canal), average
number of lamellae per osteon (Fig. 3h), and average Haversian canal diameter (Fig. 3h).
Frustrated with largely incommensurable correlations of age with different
histological variables, Thompson (1979) collected 19 types of histomorphological data to
find the variable or combination of variables that would estimate age at death in skeletons
with the lowest SEE and highest coefficient of determination. Recognizing the existence
of skeletal incoherence, however, Drusini’s (1987) method required finding number of
osteons (where an osteon must be 80 percent or more complete) and average number of
secondary osteons across multiple fields of a bone surface. Taking a more metric
approach, Samson and Branigan’s (1987) method called for collecting data including
mean cortical thickness (Fig. 3f), mean Haversian canal diameter (tabulated from a set of
30 canals), number of Haversian canals, and morphological character, the product of the
number of Haversian canals and the mean Haversian canal diameter. Ericksen (1991)
documented the traditional variables of secondary osteons (for whom an osteon must
have 100 percent of its Haversian canal intact), osteonal fragments, non-Haversian
canals, and unremodeled circumferential bone, but also new variables such as numbers of
resorption spaces (Fig. 3a) and type II osteons (Fig. 3b), and average percentages of

11
osteonal and fragmental bone. Finally, in the newest method for histological age
estimation, Crowder and Dominguez (2012) collected osteon and fragmentary osteon
counts and densities (an osteon has an intact Haversian canal), OPD, mean osteonal
cross-sectional area, mean anterior cortical width, and surface area.
These researchers have eased some difficulties in collecting histological data and
provided new, creative histological variables: Samson and Branigan’s (1987) metric data
types, for example, are ideal when bone is not sufficiently preserved for structural counts.
Again, however, anatomical, biomechanical, or mechanobiological theory is not typically
incorporated into why newly proposed variables might perform better than simple counts
of remodeling events in accurately estimating age at death across all phases of adulthood,
and for the most part, they have not: this second approach of changing variable types has
also not allowed for age estimation over ~50 years or reduced the error associated with
all age estimates (Table 2). The Singh and Gunberg (1970) results are again misleading
as they are based on a small sample of males, and Drusini’s (1987) results stem from
analysis of only 20 young modern Italians.
Figure 3. Histological variables. (a) Resorptive bay, (b) type II osteon, (c) circumferential
lamellar bone, (d) primary osteon, (e) secondary osteon, (f) cortical thickness, (g) osteon
fragment, and (h) lamellae number per osteon [#s] and Haversian canal diameter [line].

12
Table 2. Chronological Changes in Histological Variables Collected for
Microscopic Age at Death Estimation.
Method Year Variables SEE
Kerley 1965 Osteons, osteon fragments, percent
circumferential bone, non-Haversian canals
± 5.27–
13.85
Ahlqvist &
Damsten
1969 Percent Haversian bone ± 6.71
Singh &
Gunberg
1970 Osteons, lamellae number per osteon, average
Haversian canal diameter
± 2.55–
5.01
Thompson 1979 Cortical thickness, core weight, cortical bone
density, mineral content, mineral index, aggregate
osteon lamellae area, aggregate Haversian canal
area percent, osteon area, secondary osteon
number, Haversian canal number, individual
osteon lamellae area percent, individual
Haversian canal area percent, aggregate osteon
perimeter, aggregate Haversian canal perimeter,
individual osteon perimeter, individual Haversian
canal perimeter, ratio I, ratio II, ratio III
± 6.2–10.6
Drusini 1987 Osteons, average number of secondary osteons
per mm2
± 3.93
Samson &
Branigan
1987 Mean cortical thickness, mean Haversian canal
diameter, Haversian canals per unit area
± 6.0 (m),
± 16.0 (f)
Ericksen 1991 Osteons, type II osteons, osteonal fragments,
resorption spaces, non-Haversian canals, percent
circumferential, osteonal, fragmental bone
± 10.1–
12.2
Crowder &
Dominguez
2012 Intact secondary osteons, intact secondary osteon
density, fragmentary secondary osteons,
fragmentary osteon density, OPD, mean osteonal
cross-sectional area, mean anterior cortical width,
surface area
± 12.87
(m),
± 10.49 (f)
Since sex, ancestry, and genetic and metabolic disorders have been shown to
affect histological age estimates (see Robling and Stout, 2008), a third factor that has
been considered to relate to the problems of the OPD asymptote and the SEE is influence
of sample composition (Table 3).

13
Table 3. Sample Demographics and Sizes Used in Femoral Microscopic Age at
Death Estimation Methods.
Method Year Sample Sample Demographics SEE
Drusini
1987
n = 20
19–50 years (Avg. is 28.7 years) ± 3.93
Unstated numbers of males/ females
Modern Italians
No pathological condition data
Ahlqvist &
Damsten
1969 n = 20 ―Of known age‖ (Avg. is 55 years) ± 6.71
Unstated numbers males/ females
Unstated ancestry Unstated ancestry
No pathological condition data
Singh &
Gunberg
1970 n = 33 39–87 years (Avg. is 62.3 years) ± 3.24–
5.01 All males
US cadavers, but no ancestry data
No pathological specimens used No pathological specimens used
Samson &
Branigan
1987 n = 58 16–91 years ± 6.0 (m),
± 16.0 (f) 31 males, 27 females
Caucasians Caucasians
No pathological condition data
Kerley 1965 n = 67 0–95 years (Avg. is 41.6 years) ± 9.4–
13.95
43 males, 17 females, 7 unknown
Unknown dist. of Whites and Blacks
No pathological specimens
No pathological specimens
Thompson 1979 n = 116 64 males (30–97, Avg. is 71.5 years) ± 7.1–8.6
52 females (43–94, Avg. is 71.9 years)
New England Whites
Healthy and pathological included
Crowder &
Dominguez
2012 n = 328 172 males (15–97, Avg. is 48.4 years) ± 12.87
(m),
± 10.49 (f) 156 females (19–96, Avg. is 54.2 years)
Ericksen, Kerley, and FAU collections
No pathological condition data No pathological condition data
Ericksen 1991 n = 328 174 males (16–97, Avg. is 61.2 years)
154 females (14–94, Avg. = 64.6 years)
± 10.1–
12.2 154 females (14–94, Avg. is 64.6 years)
1 US Asian, 251 US Whites, 12 US
Blacks, 5 Chilean Hispanics, and 58
Dominican blacks
Various pathologies included

14
Table 3 demonstrates how utilizing more defined samples that contain less of all
modern human variation, such as only males (e.g., Singh and Gunberg, 1970), individuals
less than 50 years of age (e.g., Drusini, 1987), individuals all belonging to one population
(e.g., Drusini, 1987), or only healthy individuals (e.g., Samson and Branigan, 1987)
generally reduces the SEE. Age predicting equations produced from population-specific
approaches, however, are often only accurate for the populations they were created from,
and again, do nothing to negate the OPD asymptote. Alternatively, techniques developed
from the largest, most diverse samples produce the most substantial error because they
contain greater modern human variation in the aging process, resulting in loss of value.
Finally, review of a last group of researchers who have focused specifically on
microscopic age estimation from the femur elucidates a fourth factor that has been
considered to influence the OPD asymptote and SEE: the ROI viewed during microscopic
analysis. To expand, Kerley (1965: 162) specifically chose midshafts of long bone
diaphyses because they were anatomically identifiable, survived most conditions of burial
or injury better than bone epiphyses, and because approximately three inches of their
midshafts were microscopically homogenous. He also found that structural changes in the
outer third of long bone cortices more closely reflected total life span of the individual
than the middle or inner third, setting the standard for analysis of microscopic fields
along the bone’s periosteal edge. Finally, he chose sampling locations from the anterior,
posterior, medial, and lateral anatomical axes of each cross section that were ―fairly
representative of the particular anatomic area of the section being examined,‖ (Kerley,
1965: 154; Fig. 4a) and analyzed each to ―minimize the likelihood of basing the age
estimate on a single atypical field‖ (Kerley, 1965: 162).

15
Figure 4. ROIs sampled by: (a) Kerley (1965), (b) Ahlqvist and Damsten (1969), (c)
Singh and Gunberg (1970), (d) Thompson (1979), (e) Drusini (1987), (f) Samson and
Branigan (1987), (g) Ericksen (1991), and (h) Crowder and Dominguez (2012). Modified
from Robling and Stout (2008) with permission from John Wiley and Sons.
Ahlqvist and Damsten (1969; Fig. 4b) also selected the outer third of the femoral
midshaft cortex for analysis. These authors, however, shifted the ROIs to avoid sampling
at the linea aspera. Singh and Gunberg (1970) similarly utilized the periosteal third of
femoral midshaft sections, but analyzed only two microscopic fields at random from each
anterior quadrant (Fig. 4c), as opposed to the four field techniques of Kerley (1965) and
Ahlqvist and Damsten (1969). Likewise, Thompson (1979; Fig. 4d) analyzed periosteal
surfaces of femoral midshafts, but a specifically constructed bone corer attached to a
high-powered Dremel tool was used to obtain four adjacent 0.4 centimeter cortical bone
samples from each femur’s anterior surface. Drusini (1987) also microscopically
analyzed fields found along the periosteal border of femoral midshafts. Unlike earlier

16
methods, however, 10 to 20 readings were taken at regular intervals along the entire
femoral circumference with the exclusion of the linea aspera (Fig. 4e). Samson and
Branigan (1987) alternatively removed one-centimeter squares of bone that extended
across entire anterolateral and anteromedial femoral midshaft cortices (Fig. 4f) for
microscopic analysis. Ericksen (1991) analyzed five adjacent periosteal fields from the
anterior wedge of midshaft femoral cortices (Fig. 4g), and most recently, Crowder and
Dominguez (2012; Fig. 4h) sampled alternating fields in 10 columns that extend from the
periosteal to endosteal surface of the anterior femoral midshaft cortex.
Overall, a trend towards selecting anterior regions of interest is apparent. This
practice reduces destructive sampling procedures (e.g., Thompson, 1979; Ericksen, 1991)
and prevents sampling the area around the linea aspera because ―in this part of the bone
there seems to be a somewhat greater variation in osteons and osteon fragments not
correlated to age than in other parts, possibly because of the powerful muscle insertions
on the femoral crest‖ (Ahlqvist and Damsten, 1969: 208). Beyond those considerations,
why specific locations chosen for analysis might produce better results than Kerley’s
(1965) is rarely addressed. One exception is Crowder and Dominguez (2012) who
explained, following the work of Iwaniec and colleagues (1998), that 10 columns
extending from periosteal to endosteal surfaces account for 95 percent of remodeling
variability within the femoral anterior cross-section. Another partial exception is Drusini
(1987: 170) who chose his 10 to 20 sampling locations ―in consideration of the notable
variability in the density of the bone microstructures along the circumference of a given
section.‖ No explanation is offered, however, for that noted variability in bone
microstructure density. Regardless, this approach, like the others, has not allowed for age

17
estimation of individuals over ~50 years or reduced the error of age estimates (Table 3).
In order to become a more robust approach, the microscopic age at death
estimation field must resolve the inaccuracy and imprecision associated with generated
age estimates. As demonstrated above, arbitrarily changing skeletal elements, histological
variables, sample compositions, and sampling locations without theoretical
considerations has been unsuccessful. This failure is likely due to collective use of
inductive research plans, which, by design, begin with specific observations (e.g., number
of remodeling events viewed in a femoral ROI) and lead to constructions of general,
probable hypotheses based on observed regularities [e.g., Age = 61.642 + (0.560 × OPD)
± 11.542 years]. Therefore, conclusions drawn with inductive reasoning involve a degree
of uncertainty and cannot explain why specific observations are present (Trochim and
Donnelly, 2007: 17).
Deductive approaches, however, have never been used to avoid the OPD and SEE
histological problems. This investigation therefore begins with substantiated theory. All
healthy, mobile femurs have in common: genetic programming to establish initial size
and shape; the developmental processes of endochondral ossification, appositional
growth, and modeling; biomechanical and periosteal adaptation; cortical thinning and
shape change during aging; mechanosensation and mechanotransduction; and bone
remodeling. Building from this theoretical knowledge base, it is first hypothesized that
topographical variation in remodeling exists around human femoral midshaft periosteal
cortices that reflects the constraints of normal anatomical development, customary
biomechanical usage, and standard mechanobiological functioning. Second, it is
hypothesized ROIs associated with the Imin second moment of area will exhibit the lowest

18
remodeling as a result of minimal biomechanical loading. Third, it is hypothesized
remodeling at biomechanical ROIs will be histomorphometrically more consistent than at
anatomical ROIs due to femoral functional constraints related to obligate striding
bipedalism. These hypotheses will be tested by counting remodeling events from eight
standardized periosteal ROIs [four anatomical —A (anterior), P (posterior), M (medial),
L (lateral)—and four biomechanical—ImaxAnt, ImaxPost, IminMed, and IminLat] of 200 adult
femoral midshaft cross-sections.
Since all reasoning employed for development of these hypotheses is valid, and
all premises are true, the conclusions produced will be sound (Trochim and Donnelly,
2007: 16–17). With conclusions that confirm the hypotheses, this investigation will
uncover ROIs that remodel consistently despite modern human variation in the aging
process so as to reduce the SEE, and ROIs that remodel slowly so that the OPD
asymptote is reached at an age above ~50 years. Discovery of such sampling locations
will allow for more accurate and precise age estimations from adult human skeletal
remains by bioarchaeologists and forensic anthropologists.

19
CHAPTER TWO: LITERATURE REVIEW
The adult femoral cortex ―comprises a collection of lamellae exhibiting an array
of different ages‖ (Robling and Stout, 2008: 150). To identify patterns in this cortex that
can be exploited for improved accuracy in histological aging, theoretical knowledge is
required of all processes and influences common to all healthy, mobile adults that
contribute to attainment, maintenance, and degeneration of femoral size and shape:
genetics, endochondral ossification, modeling, environmental factors, physiological and
periosteal loading, mechanosensation and mechanotransduction, periosteal and endosteal
apposition and resorption, and bone remodeling.
A. GROWTH AND DEVELOPMENT OF THE FEMUR
Growth and development of the femur result from both environmental factors,
such as nutrition, and the intertwined processes of genetic programming, endochondral
ossification, bone apposition, and bone modeling. Specific genes switching on and off
influence initial femoral size and shape. After initial formation, endochondral ossification
provides the mechanism for longitudinal bone growth, appositional growth the system for
diaphyseal diameter increase, and modeling the means for moving growing bone through
tissue space to its adult location. If the growth and development environment is poor,
however, those processes are downregulated until an adequate environment is restored.

20
I. Genetics of Femoral Development
In the developing fetus, a four-step process determines initial femoral
materialization, shape, and size: First, previously dispersed populations of cells migrate
to the site of future femoral skeletogenesis. Next, epithelial-mesenchymal interactions
occur. This then results in formation of condensations, or membranes that precede
cartilaginous and osseous elements. Finally, the condensations differentiate into
cartilaginous or osseous tissues (Hall and Miyake, 2000: 138).
Hall and Miyake (2000: 138) note that the third phase of skeletogenesis—
condensation—is the earliest stage during organ formation when tissue specific genes are
upregulated: specifically, ―extracellular matrix molecules, cell surface receptors, and cell
adhesion molecules, such as fibronectin, tenascin, syndecan, and N-CAM, initiate
condensation formation and set condensation boundaries. Hox genes (Hoxd-11-13) and
other transcription factors (CFKH-1, MFH-1, and osf-2) modulate the proliferation of
cells within condensations. Cell adhesion is ensured indirectly through Hox genes (Hoxa-
2, Hoxd-13) and directly via cell adhesion molecules (N-CAM and N-cadherin).
Subsequent growth of condensations is regulated by BMPs, which activate Pax-2, Hoxa-
2, and Hoxd-11 among other genes. Growth of a condensation ceases when Noggin
inhibits BMP signaling, setting the stage for the next stage of skeletal development,
namely overt cell differentiation‖ of chondroblasts and osteoblasts.
II. Intramembranous and Endochondral Ossification
In a few areas of the skeleton like the flat bones of the skull and portions of the
clavicle and scapula, condensations differentiate directly into bone-forming osteoblasts

21
though a process called intramembranous ossification. This straightforward process is
atypical, however, because most condensations in the rest of the body, including the
femoral condensations, form cartilaginous skeletons prior to calcified bones through a
less direct process known as endochondral ossification (Kronenberg, 2003; Fig. 5).
Endochondral ossification provides the mechanism for femoral growth in length
until its completion in adolescence, and occurs over three rough stages of transformation:
chondrogenesis, angiogenesis, and osteogenesis. In chondrogenesis, or the development
of bone precursors, the condensations at their embryonic locations differentiate into
chondrocytes, the primary cell type of cartilage, which begin synthesizing cartilage
matrix. Through secretion of angiogeneic factors, chondrocytes next induce peripheral
blood vessels to enter the synthesized cartilage (Colnot, 2005). Behind the vascularized
blood vessels are osteoblasts, osteoclasts, and hemopoietic bone marrow cells, forming an
ossification front. Using the cartilage matrix as a scaffold, osteoclasts remove obstructive
transverse struts of cartilage while osteoblasts begin laying down true bone matrix,
starting in the primary central spongiosa of the femur and expanding outwards. Without a
means of nutrient diffusion, the chondrocytes undergo cell death (Nuzzo et al., 2003).
While bone is being formed at the primary center of ossification, the distal ends of
the femur are undergoing continued cycles of chondrocyte proliferation, hypertrophy,
vascular invasion, and osteoblast activity to create the epiphyses, or secondary centers of
ossification (Kronenberg, 2003; Mackie et al., 2008). Not all cartilage, though, is
replaced by bone. Longer-lasting growth cartilage is found at two locations in each end of
a developing femur: the growth plates where longitudinal growth takes place, and the
articular-epiphyseal growth cartilages (AEGCs) where the epiphyses grow and take form.

22
At these two locations, related to distance from the encroaching ossification front,
chondrocytes are arranged in morphologically distinct zones reflecting their function. The
zone furthest from the ossification front consists of small and round resting chondrocytes.
Adjacent is the zone of proliferation where multiplying chondrocytes become flattened as
they are packed into multicellular clusters. Proliferating cells eventually hypertrophy,
increasing their volume dramatically, and excrete extracellular matrix, which when
mineralized, causes elongation of bone. This process of cartilage growth and bone
replacement continues through adolescence when proliferative potential of the
chondrocytes seems to become exhausted. At this point, the mineralization front
overtakes the growth plate and AEGC, obliterates them, and fuses metaphysis to
diaphysis and epiphysis. Only the permanent cartilage at each end of the femur is
maintained for proper knee and ankle joint functioning (Mackie et al., 2008).
Figure 5. Endochondral ossification process. Reprinted from Mackie and colleagues
(2008) with permission from Elsevier.

23
III. Appositional Growth
If the femur grew in length without increasing in width, it would become unstable
and break. An increase in femoral length via endochondral ossification must therefore be
closely matched by femoral appositional growth (Rauch, 2007: S138). During apposition,
osteoprogenitor cells on the periosteal surface differentiate directly into osteoblasts that
secrete collagen fibers and organic molecules to add to the bone‘s exterior. Organized
parallel sheets of primary lamellar bone are eventually deposited on the bone surface so
that the bone continues to increase in diameter. Where there are peripheral blood vessels,
mineralized tissue ridges enlarge to create deep pockets that eventually trap the vessels
inside bone, forming primary osteons (Gartner and Hiatt, 2007; Robling and Stout, 2008).
Radiographic studies of growing individuals show periosteal apposition rate ―is
rapid during early life but then continuously slows until it reaches a nadir during early
school age. This is followed by a pubertal peak, after which periosteal growth (almost)
comes to a standstill‖ (Rauch, 2007: S139). Orwoll (2003: 950), for example, documents
periosteal bone formation throughout adulthood, ―albeit at a slower rate than during
growth.‖ Rates are bone-specific, as wider bones must have greater periosteal apposition:
―during male puberty the estimated peak periosteal apposition rate of the metacarpal is
~0.5 µm/day, but it is close to 2 µm/day at the midshaft humerus‖ (Rauch, 2007: S139).
Appositional rates also reflect mechanical usage: ―in 3-month-old infants the humerus
grows in width one-third faster than the femur. At one year, the two bones expand at
approximately the same rate, whereas at 33 months, periosteal apposition is almost four
times as fast at the femur as it is at the humerus‖ (Rauch, 2007: S139).

24
IV. Modeling
Modeling is the dynamic process that ―regularly and rapidly alters the size, shape,
relative position, and age of bone tissue‖ appositionally deposited during femoral
development (Robling and Stout, 2008: 150). Modeling of accumulating osseous tissue is
necessary so that evolving mechanical loads of the lower limb can be effectively resisted
(Robling and Stout, 2008: 149–150). New bone layers are therefore laid down under
certain regions of the femoral periosteum through osteoblast-induced apposition with
concomitant osteoclast-induced resorption under other regions of the femoral periosteum.
Similarly, bone is deposited at certain regions of the femoral endosteal surface while
endosteal bone is simultaneously removed from other locations (Gartner and Hiatt, 2007:
149). This complementary relationship ensures a moderately constant ratio between bone
addition and bone loss (Scheuer and Black, 2000). As a result ―growing bones largely
retain their general architectural shape from the beginning of bone development in the
fetus to the end of bone growth in the adult‖ (Gartner and Hiatt, 2007: 149).
Robling and Stout (2008: 150; Fig. 6), for example, illustrate how modeling
occurring in the sixth rib removes bone from internally-facing periosteal and endosteal
surfaces and concurrently deposits bone on externally-facing periosteal and endosteal
surfaces so that it retains its general architecture. Because bone formation and resorption
are not tethered, however, as formation begins to outpace resorption and cross-sectional
area increases, the rib also moves through tissue space, or is modeled.

25
Figure 6. Bone modeling. Modified from Robling and Stout (2008: 150) with permission
from John Wiley and Sons.
V. Environmental Effects on Bone Growth and Development
Growth in femoral length and width are generally positively correlated with age
through adolescence, but when an individual is malnourished or ill, growth may be
downregulated to conserve nutrients for vital functions (Kayemba-Kay‘s and Hindmarsh,
2006). If downregulation occurs, the femur may not achieve full cortical thickness (Mays
et al., 2009), and the chondrocytes at growth plates essential for longitudinal expansion
are suppressed. When the growth-inhibiting condition is resolved (for example, when an
undernourished child has regained 85 percent of his or her weight for height), leptin, a

26
hormone that regulates size of adipose tissue masses, communicates general energy levels
to the GH-thyroid-IGF-1 axis to alter systemic hormone secretion levels. Leptin receptors
at local growth plates then resume chondrocyte proliferation and differentiation,
ultimately causing catch-up growth. Catch-up growth is limited, however, by genetically
predetermined growth plate potential. Further, if the growth-inhibiting condition is not
treated until later in skeletal maturation, a net loss in stature and cortical thickness may
occur (Kayemba-Kay's and Hindmarsh, 2006; Mays et al., 2009).
B. BIOMECHANICAL ADAPTATION OF THE FEMUR
During and following completion of femoral growth and development, external
physiological forces also act on the bone to influence its cortical area and distribution.
Ruff et al. (2006: 485) have extended the term ―bone functional adaptation‖ (BFA) to
clarify how bone is adapted to its mechanical environment during life. Specifically, bone
morphology reflects its mechanical usage because increased bone strain through an
increase in body size or muscle activity leads to deposition of more bone, while
decreased bone strain caused by inactivity leads to resorption of bone. Maintenance of
optimum customary strain levels is the goal, as bones must provide adequate strength
with the least material. Femurs are ―particularly subject to this constraint, since they have
to be strong enough to support body weight, but they have to be light enough that they are
not energetically too costly to move‖ (Drapeau and Streeter, 2006: 403).
Thus, to elucidate mechanical usage through analysis of morphology, femoral
diaphyses are treated like engineering beams, and their rigidity and strength are
estimated. Rigidity is bone‘s ability to resist deformation, and strength is bone‘s ability to

27
resist structural failure, or fracture. ―Both characteristics are important for bone—
remaining stiff for support of the body while not breaking under load‖ (Ruff, 2008: 185).
Bone rigidity and strength research has revealed several important bone characteristics.
First, as opposed to brittle material that breaks quickly, bone is ductile, meaning it
deforms considerably before failure or fracture occurs (Rogers, 2001). Second, bone is
viscoelastic, meaning it exhibits differences in deformity based on the rate at which
deforming force is applied: in general, bone can absorb more energy at higher rates of
application (Rogers, 2001). Last, bone reacts differently to various forces.
There are five main forces that act on bones to deform or fracture them (Fig. 7). In
tension, forces along the bone‘s long axis act to stretch it apart, and in compression, to
reduce it. In shearing, one portion of the bone slides over another, and in torsion,
diagonal stresses around the bone‘s long axis produce twisting. Last, bending places the
convex side of the bone in tension and the concave side in compression (Rogers, 2001:
17–18; Ruff et al., 2006: 184–185). Bone is typically strongest in compression; it is
generally stronger in tension than in shearing (Keaveny et al., 2001; but see Love and
Symes, 2004).

28
Figure 7. Forces acting on bones to deform or fracture them. Modified from Rogers
(2001) with permission from Elsevier.
When one of those five forces is applied to bone, it is termed a stress, which is
measured as load per unit area. In response to stress, bone first distorts because it is
ductile. The change or distortion is termed the strain, a dimensionless quantity that
expresses the ratio of change in bone length, width, or angulation relative to its original
dimensions. The relationship between stress and strain is best explained graphically
(Rogers, 2001: 17; Fig. 8):

29
Figure 8. The relationship between bone stress and strain. Modified from Rogers (2001)
with permission from Elsevier.
Initially the resultant strain is directly proportional to the stress applied; thus, the
initial portion of the stress/strain curve forms a straight line. ―This zone of proportionality
is the zone of elastic deformation. In this region, when the load is removed, both the
stress and the strain disappear and the object immediately returns to its original
dimension. The object is said to be elastic, and the strain is termed an elastic strain‖
(Rogers, 2001: 17). ―Beyond the straight portion the curve begins to bend. The point at
which the bending occurs is the yield stress and yield strain of the object. Beyond this
point the stress is no longer proportional to the resultant strain; a relatively small degree
of stress results in a larger degree of strain or deformity than was present previously.

30
Furthermore, in this portion of the curve, when the stress is removed the object is unable
to return to its initial shape, and there is a residual deformity or strain. This type is a
plastic strain, and this portion of the curve is termed the zone of plastic deformation‖
(Rogers, 2001: 17). ―With continued application of stress a point is reached beyond
which the object can withstand the effect of the resultant strain, and the object is
disrupted or fractured. This is termed the failure point. The point at which failure occurs
defines the ultimate stress to which the object can be subjected and the ultimate strain
that it can withstand‖ (Rogers, 2001: 17–18).
Utilizing a beam model, the cross-sectional geometric properties of cortical area
(CA), the second moments of area (SMAs) I and J, and the section modulus Z can be
used to estimate femoral midshaft rigidity and strength to applied biomechanical forces
(Ruff, 1999: 290; Table 4). To estimate the first variable, cortical area, we need to find
the total subperiosteal area (TA). TA = π (TAP/2) (TML/2) = .785(TAP * TML) where TAP =
anteroposterior subperiosteal breadth, and TML = mediolateral subperiosteal breadth.
Cortical area can then be determined by the equation CA = [π (TAP/2) (TML/2)] – [π
(MAP/2) (MML/2)] = .785 [(TAP * TML) – (MAP * MML )] where TAP = anteroposterior
subperiosteal breadth, TML = mediolateral subperiosteal breadth, MAP = anteroposterior
endosteal breadth, and MML = mediolateral endosteal breadth (Ruff and Jones, 1981: 72–
73). Finally, the medullary area (MA) can be found utilizing the equation [π (MAP/2)
(MML/2)], or by subtracting the cortical area from the total subperiosteal area.
Alternatively, an image processing program, such as ImageJ, can determine CA, TA, and
MA through the calculation of square pixels comprising a calibrated bone‘s cross-section.

31
Table 4. Definitions of Cross-Sectional Geometric Properties (Modified from Ruff,
2008: 185).
Property Abbrev. Unit Definition
Cortical Area
CA mm
2 Compressive/tensile rigidity/strength
Total Subperiosteal Area TA mm
2 Area within subperiosteal surface
Medullary Area MA mm2 Area within medullary cavity
Tendency to rotate about
a point/ total area in both
the x and y directions
Xbar mm2 Section centroid x coordinate
Tendency to rotate about
a point/ total area in both
the x and y directions
Ybar mm2 Section centroid y coordinate
SMA about M-L (x) axis Ix mm4 A-P bending rigidity
SMA about A-P (y) axis Iy mm4 M-L bending rigidity
Maximum SMA Imax mm4 Maximum bending rigidity
Minimum SMA Imin mm4 Minimum bending rigidity
Polar SMA J mm4
Torsional and (twice) average bending
rigidity
Cross-sectional shape Ix/Iy -----
Bending strength in the A-P plane
relative to the M-L plane
Cross-sectional shape Imax/Imin ----- Relative maximum bending strength
Theta
θ ° Orientation of maximum bending
rigidity relative to M-L anatomical axis
Section modulus about
M-L (x) axis
Zx
mm
3 A-P bending strength
Section modulus about
A-P (y) axis Zy mm
3 M-L bending strength
Maximum section
modulus ZMax mm
3 Maximum bending strength
Minimum section
modulus
ZMin
mm3
Minimum bending strength
Polar section modulus Zp mm3
Torsional and (twice) average bending
strength
Calculating TA and MA in addition to CA are useful for demonstrating whether
an increase in CA is due to endosteal contraction, periosteal expansion, or both (Ruff,

32
1999: 297). Further, once calculated, the CA value is proportional to the bone‘s rigidity
and strength in pure compression and tension, or in loadings applied perpendicularly to
the cross-section surface with the resultant force passing through the center of area of the
section. Therefore, the larger the CA value, the greater the bone‘s robusticity and
resistance to deformation and fracture in pure compression and tension.
Bones, however, are rarely subjected to pure tension or compression due to their
curvatures and effects of muscular forces applied off-center to bones‘ central axes
(Larsen, 1997: 200). Instead, the highest strains and most critical loadings in long bones
occur in bending and torsion (Ruff and Larsen, 2001: 134). SMAs, not areas, must be
used to measure bending and torsional rigidities and strengths, but first Xbar and Ybar,
the x and y coordinates of the cross-sectional center, are needed to find those SMAs. This
centroid point is found by dividing the total moments, or tendency to rotate about a point,
by total area in both the x and y directions (Ruff, 1999).
Once the centroid is found, the SMA, designated I, is a geometric property used to
determine bending rigidity. Its magnitude depends not only on area, but also areal
distribution of bone in the section (Ruff and Hayes, 1983: 360). Accordingly, Ix
specifically measures resistance to bending forces around the mediolateral axis or the A-P
plane bending rigidity, and Iy measures resistance to bending around the anteroposterior
axis or the M-L plane bending rigidity. These values are determined using the equation I
= ∑ad2 where a is the unit area, and d is the perpendicular distance from centroid to
neutral axis (Larsen, 1997: 201), which tends to move towards the side of the bone under
tension (Ruff et al., 2006: 490).
Imax and Imin are found using the same equation, but Imax measures the maximum

33
resistance of bone to bending and Imin the minimum resistance of bone to bending. Imax
and Imin values are indicated by the principal axes on a cross-section: the major axis is the
location of greatest bending rigidity and the minor axis the location of least bending
rigidity (Ruff and Hayes, 1983). The principal axes may be oriented at any angle but are
always perpendicular to one another. Overall, ―the optimal cross-sectional ‗shape‘ of a
bone subjected only to bending in one plane would be to place as much bone as far as
possible from the neutral axis of bending‖ (Ruff and Hayes, 1983: 371; Ruff et al., 2006:
184–186; Ruff et al., 1984: 126). Thus, bone distributed far from the neutral axis where
stress is zero indicates resistance to bending deformation, reflected in larger I values.
There are two I value ratios that are particularly good indicators of cross-sectional
shape since they reflect relative distribution of bone about perpendicular axes. The Ix/Iy
ratio measures bending strength in the A-P plane relative to the M-L plane, and the Imax
/Imin ratio measures the relative maximum bending strength of the bone at that cross-
section. For example, an Ix/Iy ratio of 1.0 indicates an equivalent distribution of bone
about x and y axes, and thus a cross-section close to circular, while ratios greater or less
than 1.0 indicate a direction of greater elongation in the A-P or M-L planes, respectively
(Ruff, 1987: 393). These ratios then, are especially helpful in elucidating specific types of
biomechanical loadings and lifetime behavioral patterns (Ruff and Larsen, 2001: 135).
For example, more bone distributed in the A-P plane indicates frequent A-P bending
loadings, a pattern that develops with great workload and mobility (Ruff, 1987: 411).
Similar to bending rigidity, the SMA designated J is a geometric property used to
determine torsional rigidity. J, also known as the polar SMA, is computed by finding the
product of bone unit area and the squared distances from the outermost fibers of that area

34
to the centroid (Ruff, 2008: 185–186). More simply, J is found by adding I values from
axes at right angles (e.g., Imax + Imin, = J, or Ix + Iy = J; Bridges et al., 2000: 220).
Therefore, ―J represents not only torsional rigidity but also an average bending rigidity
about all planes through the section. As such, it is a useful measure of overall
bending/torsional rigidity‖ (Ruff, 1999: 296). Regarding interpretation, since the greatest
tensile strains are found at the most distant cross-sectional fibers from the centroid (Ruff
and Hayes, 1983: 360), a more outwardly distributed cross-section indicates greater
resistance to torsional deformation, reflected in larger J values (Ruff et al., 1984: 126).
Finally, bending and torsional strengths—not rigidities—are estimated using
related but slightly different cross-sectional geometric properties known as section
moduli, commonly designated Z. Z values are calculated by dividing the various SMA I
and J values by the distance from bone surface to the appropriate neutral axis or centroid,
or half the appropriate diameter of the section (Ruff et al., 1984; Ruff et al., 2006: 186).
More simply, Z values are estimated by raising the appropriate I or J value to the power
of 0.73 (Maggiano et al., 2008). Thus, Zx and Zy measure bending strength in the
respective x and y axes, Zmax and Zmin measure bending strengths calculated in the same
planes as Imax and Imin, and Zp, the polar section modulus, approximates the section‘s
torsional strength or average bending strength. Again, high Z values indicate greater
robusticity, bending/torsional strengths, and resistance to fracture (Orwoll, 2003: 949).
Unfortunately, body mass and distribution of body mass constitute mechanical
loads and are related to other factors, such as muscle size, that also influence
biomechanical loading. Therefore, to compare bone structural properties between
individuals or populations, body size differences must be controlled for. This is

35
problematic for anthropologists studying skeletal materials without soft tissues because
the best body size-standardizing factor is bone length multiplied by body mass. Ix/Iy and
Imax /Imin ratios, however, avoid the complexities associated with standardizing raw data
for body size differences between sexes or population samples (Ruff, 1987: 393).
Overall, biomechanical forces, in addition to growth processes and environmental
factors, influence amount and distribution of femoral cortical bone, as more bone is
deposited in areas under greater stress. Therefore, if suitable precautions are taken to
control for body size, sample from similar skeletal locations, and eliminate pathological
conditions, behaviors can be reconstructed from femoral midshaft cross-sections (Ruff,
2008: 184). For example, if analysis shows CA is low but TA, I, J, and Z values are high,
these findings indicate that there is a relatively low amount of cortical bone, but the
present skeletal tissue is distributed far from the neutral axis and centroid, indicating
adaptation to lifetime activities that produce great bending and torsional stresses and
strains (Larsen, 1997: 203–204).
C. MECHANOBIOLOGY OF THE FEMUR
Mechanobiology, which includes the processes of mechanosensation and
mechanotransduction, provides the explanation for how femoral cortical thickness and
distribution become morphologically well adapted to mechanical environment during life.
To understand these biological processes, one must begin with the most basic bone cell,
the osteocyte. The origin of osteocytes lies in preosteoblasts, some of which differentiate
into active osteoblasts that synthesize osteoid through the process of osteogenesis (Franz-
Odendaal et al., 2006; Knothe Tate et al., 2004: 2). Osteoblasts can then transform into

36
bone lining cells, cells that deposit chondroid, undergo programmed cell death, or
become osteocytes. Therefore, while not all active osteoblasts become osteocytes, all
osteocytes can be understood to be transformed osteoblasts (Bell et al., 2008; Franz-
Odendaal et al., 2006). Figure 9 illustrates how osteoblast-to-osteocyte transformation is
a dynamic, continual process from (1) preosteoblasts, to (2) resting osteoblasts, to (3)
active osteoblasts that sit at the osteoid deposition front, to (4–6) preosteocytes in varying
stages of osteoid engulfment, to (7) young osteocytes near the mineralization front, to (8)
mature osteocytes deeply embedded in mineralized bone. It is evident some osteoblasts of
each cell generation slow their rate of bone deposition or stop laying down bone entirely
so that they are trapped by osteoid secretions of neighboring cells and become osteocytes
(Franz-Odendaal et al., 2006).
As osteoid continues to mineralize, a cell capsule known as a lacuna is formed
around the now embedded osteocyte. The cell sits within the lacuna with approximately
50 cell processes extending outwards into the matrix to other entombed osteocytes, the
active osteoblast layer, and marrow resident cells. The osteocyte‘s processes are also
surrounded by small bone tubular tunnels known as canaliculae, and are connected to
other cell processes via gap junctions at their most distal ends (Fig. 9, inset). Between the
cells and cell processes and their capsules is a microcirculatory system of periosteocytic
fluid that is distinct from blood plasma and lymph fluid in that it has much higher
concentrations of K+ (Knothe Tate et al., 2004: 5). This arrangement of cells, cell
processes, capsules, and pericellular fluid is the basis of the lacunocanalicular system, or
LCS, a dense 3D network of cell and pore connectivity (Bell et al., 2008: 449; Fig. 10).

37
Figure 9. From preosteoblast to osteocyte. Reprinted from Franz-Odendaal et al. (2006)
with permission from John Wiley and Sons.
Osteocyte appearance is related to its stage of maturation (see Fig. 9), but is also
heavily tied to its functions of intercellular communication, osteocytic osteolysis,
mechanosensation, and mechanotransduction. To expand, conducting experiments with
dyes, Yellowley and colleagues (2000) documented inter-osteocyte communication:
Lucifer yellow dye was injected into labeled osteocytes parachuted into connected
osteocytic cells. The dye transferred between adjacent osteocytes demonstrating that they
do have functionally-coupled gap junctions. Additionally, through the same process,
Calcein dye transferred from an injected osteocyte to osteoblasts showing osteocytes

38
remain connected to the active surface layer, even when trapped in mineral. Second,
osteocytes also prevent mineralization and constriction of their own lacunar spaces.
Through a process called osteocytic osteolysis, osteocytes excrete acid phosphatase and
other lysosomal hydrolic enzymes to digest proteins, and glycosaminoglycans to mobilize
calcium in the pericellular matrix (Knothe Tate et al., 2004: 5). Overall, osteocytic
osteolysis ensures continued proper functioning of the cellular transport pathway.
Finally, according the canalicular fluid flow hypothesis, ―the combination of
cellular network and lacunocanalicular porosity performs the functions of
mechanosensing and mechanotransduction in bone‖ (Burger and Klein-Nulend, 1999:
S102), or detecting and directing incoming biomechanical loading information to initiate
a bone response. Osteocytes within the LCS are particularly well suited to detect
mechanical loading because of their sheer numbers, distribution throughout bone matrix,
high degree of connectivity, and ability to absorb larger strains than external bone surface
cells (Bonewald, 2006; Yellowley et al., 2000). Thus, when mechanical stresses are
placed on bones during daily physiological movement, interstitial fluid is squeezed
through the LCS. The combination of narrow canaliculae and wide osteocyte processes
produces appreciable fluid shear stress that conveys mechanical messages to local
osteocytes through mechanosensation (Burger and Klein-Nulend, 1999: S103–S104;
Knothe Tate et al., 2004: 6).
Next, in mechanotransduction, stimulated local osteocytes relay that mechanical
loading energy, via changes in LCS fluid flow and chemical levels, through bone matrix
to endosteal (Islam et al., 1990) and periosteal cells (Burger and Klein-Nulend, 1999:
S101–S105; Yellowley et al., 2000; Knothe Tate et al., 2004: 6; Fig. 10, inset).

39
Figure 10. The structure of bone that allows for mechanosensation and mechano-
transduction. Reprinted from Taylor and colleagues (2007) with permission from
Macmillan Publishers Ltd, Elsevier, and Wiley.
When bone-lining cells receive mechanical overloading information, this triggers
point-specific osteoblasts at the affected bone surface to build an excess of bone, ―which
is the usual case on periosteal bone surfaces‖ (Frost, 1987a: 3). A series of such
increments over time results in a net bone gain and restoration of optimum strain levels.
Alternatively, when bone lining cells sense disuse, this triggers point-specific osteoclasts
at the affected marrow surface to resorb an excess of bone, which over time causes a net
loss of bone, and restoration of optimum strain levels (Burger and Klein-Nulend, 1999:
S105; Frost, 1987a: 3). In this way, loading produced by a repetitive mechanical action
such as running can eventually form a relatively thick, A-P elongated, femoral cross-
section well adapted to resisting associated stresses.

40
D. PERIOSTEAL ADAPTATION OF THE FEMUR
In addition to the physiological forces that act on the femur to influence its
cortical area and distribution, pressures from overlying structures are also exerted on the
femoral periosteal surface. These structures influence the femur‘s ultimate shape by
building up additional bone in periosteal areas under tension and removing additional
bone from periosteal areas experiencing compression.
I. Skin, Superficial Structures, and Fascias of the Thigh
Adult skin is composed of a thin surface epidermis that is supported and
nourished by the thicker and deeper dermis. The skin gives rise to hair follicles,
sebaceous and sweat glands, and nails, and as such, performs a wide range of sensory,
thermoregulatory, and biosynthetic functions. Altogether, the skin also presents an
elaborate and organized outer surface called the stratum corneum, a ―barrier between an
organism and its outer environment [that] acts to prevent desiccation, toxin entry, and
microbial infection‖ (Byrne et al., 2003: 113).
Immediately deep to the skin of the thigh is superficial fascia consisting of a loose
association of lipid-filled adipocytes, pre-adipocytes, fibroblastic connective tissue cells,
leukocytes, and macrophages held together by a reticular fiber framework. This fascia,
also known as unilocular or white adipose tissue, is an especially important heat
conductor in the body, where the degree of insulation is dependent on its thickness.
Additionally, it provides a buffer when energy intake is not equal to energy output: lipids
ingested beyond those needed for current energy use are hydrolyzed by the enzyme
lipoprotein lipase into fatty acids and glycerol. These diffuse into the white adipose tissue
where they are reesterified for storage, or lipogenesis. When needed, triglycerides stored

41
within adipocytes are hydrolyzed back into fatty acids and glycerol through lipolysis,
enter the connective tissue spaces of the white adipose tissue, and from there are
transported to the blood for energy distribution (Gartner and Hiatt, 2007).
Within this fat-rich layer are superficial veins that remove deoxygenated blood
from the lower extremity and cutaneous nerves that innervate the skin. Just below the
superficial fascia is the fat-free deep fascia, a thin layer of connective tissue fibers, which
hug the external surfaces of the underlying muscles (Fig. 11; NetAnatomy, 2001).
Figure 11. (a) Skin, superficial fascia, and cutaneous nerves of the thigh, and (b) the deep
fascia and most superficial muscles of the thigh. Modified from NetAnatomy (2001) with
permission from Dr. Raymond J. Walsh, GWU School of Medicine and Health Sciences.

42
II. Anterior Muscle Compartment
Connected to the deep fascia are sheets of connective tissue called intermuscular
septa that divide the thigh into functional anterior, medial, and posterior compartments
(Fig. 12). The anterior compartment is composed of sartorius, the four quadriceps heads,
pectineus, and iliopsoas (Fig. 13). They are innervated by the femoral nerve and work to
flex the thigh at the hip and extend the leg at the knee (NetAnatomy, 2001).
Figure 12. The anterior (a), medial (b), and posterior (c) compartments of the thigh
separated by the intermuscular septa. Modified from NetAnatomy (2001) with permission
from Dr. Raymond J. Walsh, GWU School of Medicine and Health Sciences.
Table 5 and Figure 14 show how anterior compartment muscles overlie nearly the
entire femoral midshaft surface. Although the courses of sartorius, pectineus, iliopsoas,
and rectus femoris muscles prohibit immediate contact, vastus lateralis, vastus medialis,
and vastus intermedius are in direct contact with the femoral cortex: vastus lateralis and
medialis attach directly to the linea aspera, and vastus intermedius overlies the entire
femoral midshaft anterior surface and also covers significant sections of the medial and
lateral surfaces (NetAnatomy, 2001; Moore and Agur, 2007).

43
Figure 13. Muscles of the anterior compartment of the thigh include (a) sartorius, (b, c)
quadriceps femoris, (d) pectineus, and (e) iliopsoas. Modified from NetAnatomy (2001)
with permission from Dr. Raymond J. Walsh, GWU School of Medicine and Health Sci.
Table 5. Anterior Compartment Muscles. Taken from Moore and Agur (2007).
Muscle Origin Insertion
Vastus lateralis m. Greater trochanter and lateral lip
of the linea aspera
Base of patella and tibial
tuberosity
Vastus intermedius m. Anterior/ lateral surfaces of
femoral diaphysis
Vastus medialis m. Intertrochanteric line and medial
lip of linea aspera
Rectus femoris m. Anterior inferior iliac spine and
ilium superior to acetabulum
Sartorius m. Anterior superior iliac spine and
superior part of inferior notch
Superior part of medial
surface of tibia
Pectineus m Superior pubic ramus Femoral pectineal line
under lesser trochanter
Iliopsoas m Sides of T12–L5, transverse
processes of all lumbar vertebrae,
iliac crest, iliac fossa, sacral ala
Lesser trochanter and
femur distal to it

44
Figure 14. Cross-section of the midshaft of the femur demonstrating vastus lateralis,
vastus medialis, vastus intermedius, the short head of biceps femoris, adductor longus,
and adductor magnus in direct contact with the femoral midshaft. Modified from
NetAnatomy (2001) with permission from Dr. Raymond J. Walsh, GWU School of
Medicine and Health Sci.
III. Medial Compartment Musculature
The medial compartment musculature consists of adductor longus, adductor
brevis, adductor magnus, gracilis, and obturator externus (Fig. 15). All are innervated by
the obturator nerve, and their spatial relationship to the hip joint results in adduction of
the thigh when these muscles are contracted. When operating from a fixed insertion (or
when the lower limb is planted firmly on the ground) the adductor group also stabilizes
the pelvis on the supporting limb (NetAnatomy, 2001).

45
Figure 15. Musculature of the medial compartment of the thigh includes (a) adductor
longus, (b) adductor brevis, (c) adductor magnus, (d) gracilis, and (e) obturator externus.
Modified from NetAnatomy (2001) with permission from Dr. Raymond J. Walsh, GWU
School of Medicine and Health Sciences.
Table 6 and Figure 14 show how gracilis, obturator externus, and adductor brevis
have no immediate contact with the midshaft femoral cortex. Of the medial compartment
muscles, adductor longus inserts at the middle third of the linea aspera, and adductor
magnus inserts on the gluteal tuberosity, linea aspera, medial supracondylar line, and
adductor tubercle of the femur (NetAnatomy, 2001; Moore and Agur, 2007).
Table 6. Medial Compartment Muscles. Taken from Moore and Agur (2007).
Muscle Origin Insertion
Adductor longus m. Body of pubis inferior to
pubic crest
Middle third of linea aspera
Adductor brevis m. Body and inferior ramus of
the pubis
Pectineal line and proximal
part of linea aspera
Adductor magnus m. Inferior pubic ramus, ischial
ramus, ischial tuberosity
Gluteal tuberosity, linea
aspera, medial supracondylar
line, femoral adductor tubercle
Gracilis m. Body and inferior ramus of
the pubis
Superior part of medial tibial
surface
Obturator externus m. Obturator foramen margins Trochanteric fossa of femur

46
IV. Posterior Compartment Musculature
The posterior compartment of the thigh (Fig. 16) contains the hamstring group of
muscles (biceps femoris long and short heads, semimembranosus, and semitendinosus).
With the exception of the short head of biceps femoris, which is innervated by the fibular
part of the sciatic nerve, these muscles are innervated by the tibial part of the sciatic
nerve. Passing posterior to both the hip and knee joints, all three serve to extend the thigh
at the hip and flex the leg at the knee (NetAnatomy, 2001).
Specifically, both semitendinosus and semimembranosus arise from the ischial
tuberosity and insert on the medial surface of the superior tibia. Similarly, the long head
of biceps femoris originates at the ischial tuberosity and inserts onto the lateral side of the
fibular head. In doing so, none of these muscles come into direct contact with the surface
of the femur. The short head of biceps femoris, however, originates at the midshaft of the
linea aspera and femoral lateral supracondylar line to insert on the lateral side of the
fibular head, and thus, comes into direct connect with the femoral midshaft (Fig. 14;
Table 7; NetAnatomy, 2001; Moore and Agur, 2007).
Table 7. Posterior Compartment Muscles. Taken from Moore and Agur (2007).
Muscle Origin Insertion
Biceps femoris m. Ischial tuberosity (long head), lower
half of linea aspera and lateral
supracondylar line of femur (short
head)
Lateral side of fibula
head
Semitendinosus m. Ischial tuberosity Medial surface of
superior tibia
Semimembranosus m. Ischial tuberosity Posterior part of tibial
medial condyle

47
Figure 16. Musculature of the posterior thigh compartment includes semimembranosus,
semitendinosus, and the long and short heads of biceps femoris. Modified from
NetAnatomy (2001) with permission from Dr. Raymond J. Walsh, GWU School of
Medicine and Health Sciences.
V. The Periosteum
Beneath the anterior, medial, and posterior thigh musculature compartments,
periosteum completely covers the femoral diaphysis, with the exception of articular

48
surfaces and tendon insertion sites. Specifically, the periosteum is divided into two
distinct layers: the internal cambium layer and the external periosteal fibrous layer. The
femoral surface is covered by the internal cambium layer, which consists of microvessels,
sympathetic nerves, fibroblasts, adult mesenchymal progenitor cells, differentiated
osteogenic progenitor cells, and osteoblasts capable of periosteal bone formation (Allen
et al., 2004; Orwoll, 2003). Also present are multinucleated polykaryons that may
differentiate into mature osteoclasts. These cells use lytic enzymes to erode bone, and are
therefore capable of surface-based bone resorption (Boyle et al., 2003; Orwoll, 2003).
The periosteal fibrous layer is composed of elastin fibers, collagen, fibroblasts, a nerve
and microvascular network (Allen et al., 2004: 1005), and Sharpey‘s fibers, which affix
the periosteum to the femur (Gartner and Hiatt, 2007).
VI. Effects of Periosteal Loads on Femoral Shape
Carpenter and Carter (2008) demonstrated the effects of adjacent muscles on long
bone shape by comparing normally functioning growing rat tibias to growing tibias from
rats that received full, 75 percent, and 50 percent sciatic neurectomies at four weeks of
age. For all rats, from experiment start to one week of age, active bone formation took
place at all points along the endosteal and periosteal surfaces. By two weeks, bone
resorption began to occur on the medial endosteal surface, while bone apposition
continued at all other locations. This pattern continued through four weeks of age. Once
loading patterns changed for control and neurectomized rats, however, their modeling
patterns and geometries begin to diverge. In control tibias, medial resorption and lateral
apposition on the endosteal surface continued throughout the remaining experiment.

49
After five months of growth, however, bone resorption began to occur in the regions
experiencing periosteal surface pressures, and this pattern continued until 17 months,
when control tibias developed distinctly triangular cross-sections with slightly concave
anterolateral and flattened posterolateral faces (Carpenter and Carter, 2008).
Conversely, in the full, 75, and 50 percent neurectomized tibias, by six weeks,
bone resorption was occurring around the entire endosteal surface, while bone apposition
continued on the periosteal surface. This pattern remained unaltered so that by two
months, the tibia obtained a nearly elliptical cross-section. Periosteal apposition and
endosteal resorption continued to produce a smooth, elliptical final shape by 17 months.
Further, the only difference found between full, 75, and 50 percent neurectomized tibias
was the size of the resulting cross-section (Carpenter and Carter, 2008; Fig. 17).
Based on this experiment, Carpenter and Carter (2008: 237) first state, ―the results
of the [neurectomy] simulations suggest that bone cross-sectional size is largely
determined by the magnitudes of far-field [physiological] loads and that bone cross-
sectional shape is strongly affected by local periosteal surface loads.‖ Second, the authors
find that compressive pressures applied directly to periosteal surfaces impede bone
formation or induce bone resorption by encouraging osteoclastic resorption, and tensile
strains applied perpendicularly to periosteal surfaces impede bone resorption or induce
bone formation by encouraging osteoblastic deposition (Carpenter and Carter, 2008:
229). Finally, the authors conclude bones ―do not always obtain an optimal cross-
sectional geometry for resisting applied far-field loads. Instead, the interaction between
the responses to intracortical stresses and periosteal surface loads leads to a ‗compromise‘

50
between the drive towards optimal mechanical support and need to accommodate
adjacent structures‖ (Carpenter and Carter, 2008: 238).
Therefore, compressive and tensile periosteal surface strains, in addition to
physiological forces, growth processes, and environmental factors, influence ultimate
femoral cortical shape through mechanobiological processes. Specifically in the human
thigh, vastus lateralis, vastus medialis, adductor longus, adductor magnus, and the short
head of biceps femoris attach directly to the posterior femoral diaphysis, and resulting
tensile forces cause development of the linea aspera. Alternatively, vastus intermedius
and other nearby muscle bellies apply differential compressive forces around the anterior,
medial, and lateral surfaces of the femoral diaphysis resulting in its characteristic shape.
Figure 17. Neurectomy effect on tibia shape. Modified from Carpenter and Carter (2008)
with permission from Springer.

51
E. CORTICAL AGING OF THE FEMUR
After the femur is fully developed, biomechanically adapted, and periosteally
adjusted, a net loss of cortical bone begins as the amount of bone deposited on the
periosteal surface lessens in comparison to the amount of bone removed from the
endosteal surface. Decreasing bone gain on one surface and increasing loss from another
slowly and steadily changes the size, shape, geometry, and strength of the femur
throughout adulthood (Szulc et al., 2006: 1859).
To document this bone loss and redistribution, Szulc and colleagues (2006)
collected bone mineral content, bone mineral density, cortical thickness and area, and
biomechanical data from the distal third of the radius of 821 healthy White women aged
30 to 89 years for 7.1 ± 2.5 years. The authors found that endocortical bone loss began in
younger premenopausal women, however, ―periosteal apposition compensated, but only
partly, so the cortices thinned‖ (0.29 ± 0.85 percent/year). Overall, ―there was no net
bone loss because the same amount of bone was distributed as thinner cortex around a
larger perimeter‖ (Szulc et al., 2006: 1859). During the perimenopausal period, however,
―endocortical resorption accelerated, whereas periosteal apposition decelerated. The
cortices thinned (0.66 ± 0.56 percent/year), but now periosteal apposition was insufficient
to maintain bone mass, which declined, but it still maintained estimates of bending
strength. Bone fragility emerged after menopause when further acceleration of
endocortical bone resorption and deceleration of periosteal apposition produced further
cortical thinning (1.10 ± 1.06 percent/year) and little displacement of the cortex. Now the
calculated cortical area and bending strength declined‖ (Szulc et al., 2006: 1859).
While there is no equivalent midlife event in males, Seeman (2002) found their

52
bones to expand similarly in size with resulting cortical bone loss, but not to the same
degree as females‘ bones: ―cortical bone loss is less in men than in women because
periosteal bone formation is greater, not because endosteal resorption is greater in women
than men. On the contrary, the absolute amount of bone lost from the endosteal surface is
greater in men than in women‖ because they have larger skeletons (Seeman, 2002: 1846).
Additionally, with increasing cortical thinning, femoral cross-sectional shape also
changes: young adults often display A-P elongated cortices indicating great workload and
mobility, but by mature adulthood, femoral cross-sections are most elongated in the M-L
plane indicating reduced mobility (Ruff, 1987).
F. INTRACORTICAL REMODELING OF THE FEMUR
The bone deposited during femoral development, biomechanical and periosteal
adaptation, and cortical redistribution provide the material upon which a final dynamic
process, intracortical remodeling, proceeds (Robling and Stout, 2008: 150). Intracortical
bone remodeling is achieved by the coordinated, equivalent actions of a complex
arrangement of osteoblasts and osteoclasts, collectively called a basic multicellular unit
(BMU). As such, intracortical remodeling does not generally affect bone area and
distribution, but rather maintains them (Harada and Rodan, 2003).
Remodeling is, ―at least to some degree, targeted towards the removal of damaged
[bone] areas‖ (Taylor et al., 2007: 263): repetitive mechanical loading of bones
eventually causes fatigue, or microcracks, that may develop parallel to the bone‘s
longitudinal axis or horizontally through its interstitial lamellae. Increased physiological
loading causes microcracks to propagate into more diffuse areas of microdamage. At the

53
microscopic level, this damage interrupts the connectivity of the LCS, and thus, nutrient
transport to osteocytes adjacent to the damage, causing cell death. Osteoclasts ―are
attracted to the apoptopic cells and so preferentially eat away the bone in this region‖
(Taylor et al., 2007: 266). Arrival of osteoclasts activates an intracortical remodeling
cycle (Scheuer and Black, 2000: 30; Henriksen et al., 2009: 1026; Fig. 18).
The activated osteoclasts begin to resorb bone at a rate of approximately 40–50
µm per day by secreting acids that demineralize adjacent bone and enzymes to dissolve
collagen. In this way, 9 to 10 osteoclasts, often referred to as the ―cutting cone,‖ remove a
microcrack, leaving a 2–6 millimeters long resorptive bay in its wake (Parfitt, 1994: 275;
Scheuer and Black, 2000: 31). The tunnel that is cut by the osteoclasts is more or less
longitudinal to the axis of the bone, and the diameter of the tunnel, which typically
reaches roughly 250–300 µm, defines the cross-sectional size of the secondary osteon
that will eventually fill it (Robling et al., 2006: 458; Henriksen et al., 2009: 1027–1029).
Between the leading osteoclastic cutting cone and the following osteoblastic
restoration of lost bone is a transitional, reversal phase. At this time, mononuclear bone
lining cells are recruited to clean the resorption pit and smooth off the scalloped
periphery of the resorptive bay with a thin, mineral-deficient, sulfur-rich layer of matrix
that separates an osteon from surrounding lamellae. This is the ―cement line‖ (Robling et
al., 2006: 458–459; Henriksen, 2009: 1029). Then, as a result of osteoclast signaling, the
bone lining cells either differentiate into or are replaced by several hundred osteoblasts
commonly called the ―closing cone‖ that adhere to the reversal zone and deposit layers of
osteoid that mineralize into concentric lamellae. The tunnel is not completely infilled,
however, as it is necessary to house a nutrient artery in the central Haversian canal of the

54
newly formed bone structural unit (BSU), or secondary osteon. This formation phase
takes approximately three months (Scheuer and Black, 2000: 31; Henriksen et al., 2009:
1027–1030). When bone formation is complete, osteocytes embedded during bone
formation secrete sclerostin leading to termination of the remodeling cycle (Henriksen,
2009: 1027). This bone remodeling process continues as needed until death, creating the
observed association between number of intracortical osteons and chronological age that
forms the primary basis for all histological age predicting methods (Stout, 1989: 44).
Figure 18. Remodeling process. Reprinted from Henriksen and colleagues (2009) with
permission from Elsevier.

55
CHAPTER THREE: HYPOTHESES
Building from this theoretical knowledge base, it is first hypothesized that since
all healthy, mobile femurs have in common: genetic programming to establish initial size
and shape; the developmental processes of endochondral ossification, appositional
growth, and modeling; biomechanical adaptation; periosteal adaptation; cortical thinning
and shape change during aging; and mechanosensation and mechanotransduction (Fig.
19), intracortical remodeling patterns exist around all human femoral periosteal cortices,
despite individual variation in these processes:
NULL HYPOTHESIS #1: There is no evidence for topographic variation in
remodeling around human femoral midshaft periosteal cortices. There are no
statistically significant differences between ROI OPD means.
ALTERNATIVE HYPOTHESIS #1: Topographical variation in remodeling exists
around human femoral midshaft periosteal cortices resulting from normal
anatomical development, customary biomechanical usage, and standard
mechanobiological functioning. There are statistically significant differences
between ROI OPD means.
Figure 19. The life cycle of the femur: (a) 2 years, (b) 5 years, (c) 9 years, (d) 14 years,
(e) 18 years, (f) middle age, and (g) mature adulthood. Modified from Goldman and
colleagues (2009) with permission from John Wiley and Sons.

56
Support for the first alternative hypothesis comes from Marotti (1976) and
Drusini (1987) who provide compelling evidence for topographic variation in
remodeling: studying complete long bone midshaft cross-sections of growing dogs
treated with tetracycline, Marotti (1976) illustrated how amount of newly formed bone
tissue differs considerably by location. This finding emphasized ―the topographic rather
than statistic distribution of the processes of bone reconstruction,‖ where ―reconstruction
may attain for several successive times a given area of bone, while a nearby or distant
area may persist unmodified for a very long time‖ (Marotti, 1976: 202).
Similarly, Drusini (1987) counted secondary osteons present in abutting adjacent
fields along the entire circumferences of three human femoral cross-sections and found
considerable variability in their spatial distribution: a 19-year-old individual had 13.36
osteons on average per field, but a minimum of 2 osteons and a maximum of 21 osteons
were found at different periosteal locations. Similarly, a 35-year-old individual had 16.09
osteons on average per field, but a minimum of 8 osteons and a maximum of 23 osteons
were found at different periosteal locations. A last 50-year-old individual had 22.31
osteons on average per field, but a minimum of 18 osteons and a maximum of 28 osteons
were found at different periosteal locations. Overall, this is excellent evidence for the
existence of topographic variation around the femoral midshaft periosteal surface
throughout much of the human lifespan. Neither Marotti (1976) nor Drusini (1976),
however, provide explanations for the documented histomorphometric variation, nor do
they explain how it can be utilized to improve microscopic age at death estimation.
Contrary to Marotti (1976) and Drusini (1976), Villa and Lynnerup (2010)
assessed microstructural variability in 28 femoral sections at the Institute of Forensic

57
Pathology, University of Copenhagen. The sampled femurs all belonged to Caucasian
males between 28 and 89 years of age at death and none showed evidence of disease
suggestive of altered bone turnover. Further all sections were procured from the midshaft
of the right femur, and all analyses took place as near as possible to the periosteum. To
ensure at least 100 histological structures were observed from each cross-section for
accurate inference of total number of histological elements, between four and seven
regions of interest were selected for microscopic analysis. ―ROI no. 1 was located at the
anterior periosteum, and ROI nos. 2 and 3 were located in the lateral and medial
positions, respectively. ROI nos. 4 and 6 were located in intermediate positions between
ROI no. 1 and ROI no. 2, and ROI nos. 5 and 7 were correspondingly located between
ROI no. 1 and ROI no. 3‖ (Villa and Lynnerup, 2010: 492).
Taking this approach, Villa and Lynnerup (2010: 495) found no significant
differences in remodeling among the ROIs considered, and consequently suggest ―there
are no particular ROIs to be preferred, at least as long as they are close to the periosteum‖
for use in microscopic age at death estimation. Instead, the authors suggested any slight
histomorphometric differences found around the anterior, lateral, and medial femoral
periosteum are attributable to individual variation, not underlying biomechanical,
anatomical, or mechanobiological differences.
Villa and Lynnerup’s (2010) approach, however, samples a small number of
remodeling events per individual, neglects investigation of the posterior femoral cortex,
and essentially standardizes arbitrary ROIs that do not take into account locations of the
principle axes of maximum and minimum bending rigidity, which vary by individual
(Goldman et al., 2009: 59): ―ROIs were selected by overlaying a grid with cells

58
measuring 1.9 mm × 1.4 mm on each cross-section. The grid was printed on a
transparency and fixed on each cross-section, positioning the upper grid line adjacent to
the anterior periosteal margin‖ (Villa and Lynnerup, 2010: 492). This method is therefore
unsatisfactory for detecting meaningful patterns in topographic histomorphometric
variation that may exist as a result of anatomical development, customary biomechanical
usage, and standard mechanobiological functioning.
Following the concept of bone functional adaptation, the locations of greatest
typical femoral midshaft cortical bone strains can be found by identifying the areas where
bone has been preferentially added as far as possible from the neutral axis of bending
(Ruff et al., 2006). These locations are indicated in ImageJ where the Imax axis crosses the
bone’s periosteal edges (Ruff and Hayes, 1983). Repetitive mechanical loading of bones
in these highest strain areas eventually causes fatigue microcracks, and intracortical
remodeling often targets that damaged bone with interrupted LCS connectivity (Taylor et
al., 2007: 263). It is therefore secondly hypothesized that there is increased evidence of
remodeling in locations consistently exposed to the greatest and most repetitive
mechanical loading strains that cause the most microdamage, or the ImaxAnt and ImaxPost
ROIs. Similarly, it is also hypothesized that there is decreased evidence of remodeling in
locations typically exposed to the smallest and least frequent mechanical loading strains
that cause the least microdamage, or the IminMed and IminLat ROIs:
NULL HYPOTHESIS #2: There is no evidence Imin ROI OPD means are statistically
significantly reduced compared to the other six ROI OPD means.
ALTERNATIVE HYPOTHESIS #2: Imin ROI OPD means are statistically
significantly reduced compared to the other six ROI OPD means as a result of
minimal biomechanical loading.

59
Support for the second alternative hypothesis that less mechanical strain results in
less intracortical bone remodeling is provided by Stout (1982) who collected secondary
osteon, secondary osteon fragment, and OPD information from two immobilized
individuals: one individual suffered from multiple sclerosis and was confined to a
wheelchair for 15 years before her death. During this time, she maintained some
mechanical bone loading through muscular contractions, although control of her limbs
was impaired and spastic. A second individual had been a quadriplegic for 26 years as a
result of poliomyelitis. She suffered from true mechanical disuse of her limbs excepting
her right arm, of which she had retained partial use. The remodeling data from the
individual with MS was not significantly different from age-matched values. The same
data from the quadriplegic, however, revealed significant differences from age-matched
samples where densities for each bone fell below the 95% confidence limits of the control
mean values. The only exception was again the right arm where values were found to be
normal. Overall, this study demonstrates mechanical stress stimulates normal intracortical
bone remodeling, and long-term disuse reduces activation frequency of BMUs.
Finally, it was hypothesized above that there should be increased evidence of
remodeling in locations consistently exposed to the greatest and most repetitive
mechanical loading strains that cause the most microdamage, or the two Imax locations.
Similarly, it was also hypothesized that there should be decreased evidence of remodeling
in locations typically exposed to the smallest and least frequent mechanical loading
strains that cause the least microdamage, or the two Imin locations. While Imax and Imin
ROI remodeling are therefore largely determined by their biomechanical functions
relating to obligate striding bipedalism, anatomical axis ROI remodeling is not subject to

60
the same constraints. It is therefore thirdly hypothesized A, P, M, and L ROIs will
demonstrate greater remodeling variation:
NULL HYPOTHESIS #3: There are no statistically significant differences between
biomechanical and anatomical ROI OPD SEEs.
ALTERNATIVE HYPOTHESIS #3: Biomechanical ROI (ImaxAnt, ImaxPost, IminMed,
and IminLat) OPD SEEs will be histomorphometrically more consistent than OPD
SEEs of anatomical ROIs (A, P, M, and L) due to femoral functional constraints.
Evidence in support of the third alternative hypothesis comes from several studies:
I. ANTERIOR ROIs: When Drusini (1987: 170) counted secondary osteons present in
abutting adjacent fields along three complete femoral circumferences, he found marked
spatial variability, but also that ―especially along the anterior surface of the femur, the
[secondary osteon] microstructures were very seldom or never visible‖ and therefore
opted in his own research to ―exclude this zone from the computation‖ for production of
a regression equation to predict age at death from histological structures.
Pfeiffer and colleagues (1995) also provided evidence in support of anterior ROIs
remodeling most variably. In questioning whether sampling location affects cortical
remodeling and thus age at death estimates, the authors collected percent remodeled bone
data at anatomically and mechanically derived points at four depth levels of periosteal
though endosteal bone. Using nine femoral cross-sections from four males and five
females, they histologically examined seven fields at each of the eight sampling locations
for a total of 56 fields per specimen and a total of 493 total fields observed. When percent
remodeled bone from the seven fields at each sampling location were averaged—and thus
include radial differences in endosteal remodeling—the authors found the anterior

61
anatomical locations exhibited the lowest mean levels of remodeling activity and the
highest levels of variability. They therefore suggested, ―future attempts to establish age
estimation methods from the femur might do well to focus on a different, less
heterogeneous sampling location‖ (Pfeiffer et al, 1995: 91).
II. POSTERIOR ROIs: Similarly, Ahlqvist and Damsten (1969: 208) provided anecdotal
evidence that in the part of the bone around the linea aspera ―there seems to be a
somewhat greater variation in osteons and osteon fragments not correlated to age than in
other parts, possibly because of the powerful muscle insertions on the femoral crest.‖
Since that observation was made, the researchers who have focused specifically on
microscopic age estimation from the femur have not viewed posterior ROIs for collection
of histomorphometric data (see Fig. 4).
III. ANATOMICAL vs. BIOMECHANICAL ROIs: After analyzing the variance in percent
remodeled bone within and between the eight fields, Pfeiffer and colleagues (1995: 90)
conducted a Fisher’s protected least significant difference test to further explore and
compare the mean of one group against the means of each of the other groups. These
results revealed the anatomical locations to be significantly different from one another
with regards to average percent remodeled bone. The mechanically defined locations,
however, did not differ among themselves with regards to mean percent remodeled bone,
but rather, were only significantly different from the anatomical locations. Overall, ―the
mean percent remodeled values exhibit greater consistency among the four mechanical
axes [coefficient of variation (CV) = 0.02] than among the anatomical axes (CV = 0.1)‖
(Pfeiffer et al., 1995: 90–91).

62
CHAPTER FOUR: MATERIALS AND METHODS
A. MATERIALS
M.F. Ericksen extracted 318 femoral midshaft blocks from George Washington
University Medical School dissecting room cadavers between 1972 and 1989 (Appendix
A). From these samples, 200 were chosen for this research (Appendix A, shaded boxes)
that met the following criteria: (1) the entire periosteal border was present for analysis,
(2) the medial cortex was distinguished from the lateral by presence of an inked black
line and specimen number as per Ericksen’s notes, and (3) the sample contained
individuals with ages at death extending from young to mature adults.
The research sample ultimately consisted of 98 males and 102 females (Fig. 20),
and 191 White and 9 Black individuals (Fig. 21). The age range extends from a minimum
of 30 years of age at death to a maximum of 97 (Fig. 22), with an average age at death of
71 years. More specifically, the sample contains one individual who died in his thirties,
eight who died in their forties, 26 in their fifties, 54 in their sixties, 56 in their seventies,
46 in their eighties, and nine individuals who died in their nineties. Regarding causes of
death, one individual committed suicide, 38 individuals died of cancer, 103 died of heart
related disease, three of liver related disease, two of kidney related disease, seven of
respiratory failure, three of gastric or gastrointestinal ulcer, one of pancreatic disease, six
of pulmonary disease, two of pneumonia, two of complications from diabetes, two from
sepsis, and 12 from cerebrovascular accident or intracranial clot. Additionally, six

63
individuals died from unique conditions and were thus placed in the ―Other‖ cause of
death category. Finally, 12 individuals had unknown causes of death (Fig. 23).
Figure 20. Bar chart illustrating the research sample female-to-male ratio.
Figure 21. Bar chart illustrating the research sample Black-to-White ratio.

64
Figure 22. Pie chart illustrating the age distribution of the research sample.
Figure 23. Pie chart illustrating the research sample cause of death distribution.
Decade of Death

65
B. METHODS
I. Removal of Bone Blocks from GWU Dissecting Room Cadavers
Ericksen extracted the femoral blocks at approximately midshaft (Fig. 24a). Slight
sampling location imprecision and inaccuracy are of little concern, however, because
between 35 and 65 percent of femoral length, negligible differences exist in medullary
and cortical areas (Stephenson and Seedhom, 1999). Only above 65 percent and below 35
percent does a rise in medullary area and reduction in cortical area occur. This finding
corroborates Kerley’s (1965: 162) statement that ―slides need not be made from the exact
middle of the shaft, since there is a block in the mid-shaft area that is about three inches
in length and is homogenous with regard to microscopic changes. Thus, badly fragmented
bones can be used as long as a cross-section can be obtained anywhere in the area of the
middle of the diaphysis‖ (see also Tersigni, 2005: 69).
Figure 24. (a) Removal of femoral midshaft blocks, (b) anatomical orientation and
scanning of prepared slides, (c) conversion of color scans to grayscale, (d) determination
of biomechanical and (e) anatomical axes, and (f) histological data collection from ROIs.

66
II. Slide Preparation Methodology at the NYC Office of Chief Medical Examiner
Histology Lab
Complete femoral midshaft bone wafers were cut from each of the 200 selected
bone blocks (Appendix A, shaded boxes) using a Buehler Isomet 1000 Precision
metallurgical saw. Once detached, the wafers were pressed, dried, and mounted to glass
slides with Permount Toluene Solution. The wafers were next reduced to approximately
75 μm using a Buehler Ecomet 4000 Grinder/Polisher affixed with Buehler Ultra-Prep
Diamond Grinding Discs. The slides were then sonic-cleansed to remove debris, cover-
slipped with Permount Toluene Solution, and dried in a Paramount-Labconco Ductless
Enclosure fume hood in preparation for analysis.
III. Determination of Anterior, Posterior, Medial, and Lateral Femoral Cortices
When viewing a femoral midshaft cross-section, anterior and posterior surfaces
are easily identified through the presence of the linea aspera. Medial and lateral surfaces,
however, are not easily distinguishable. Each prepared slide was therefore
morphologically aligned with the bone blocks from which it was cut. Using the black line
and specimen number printed on each block’s medial cortex, the 200 slides were oriented
into correct anatomical position. Once oriented, anterior, posterior, medial, and lateral
anatomical locations were marked on the glass slides in permanent ink (Fig. 24b).
IV. Determination of Biomechanical Axes and Collection of Biomechanical Data
A 1200 dpi resolution image of each of the 200 anatomically oriented slides was
obtained using an HP 4850 Scanner. Produced images were saved as jpegs to 200
individual digital folders. Each jpeg was then opened in Adobe Photoshop and the rotate

67
tool was utilized to orient each image as close to visual anatomical position as possible,
using the linea aspera as a guide. Next, ImageJ (v. 1.44), available as freeware at
http://rsb.info.nih.gov/ij/download.html, was opened and MomentMacroJ (v. 1.2) was
loaded. Each of the 200 femoral cross-sectional images oriented in visual anatomical
position was opened in ImageJ. Area outside the periosteal surface and trabecular bone
were removed using the drawing tools. The scanned color images of cortical bone only
were next converted to 8-bit grayscale images (Fig. 24c). The density threshold of each
image was then adjusted to provide an accurate estimation of cortical tissue. The wand
tool was used to select the external edge of the femoral cross-section. Finally, utilizing
the lower and upper threshold values previously determined, MomentMacroJ was run at
47.2 pixels per millimeter to draw the principle axes of maximum and minimum bending
rigidity on the image (Fig. 24d). This image was saved for each sample, as was the
associated output log, later imported into an Excel worksheet (Appendix B). This log
provides biomechanical data for each femoral cross-section including total subperiosteal
area (TA), cortical area (CA), medullary cavity area (MA), centroid coordinates Xbar and
Ybar, Ix, Iy, and J values, Imax and Imin values, Ix/Iy and Imax/Imin ratios, theta, Zx, Zy, and Zp
values, and MaxXrad and MaxYrad values.
V. Determination of Anatomical Axes
To determine exact, reproducible locations of anatomical axes in complete
femurs, Stephenson and Seedhom (1999: 160) defined the antero-posterior plane ―by
considering the femur lying dorsal side down on a flat surface, resting naturally on the
femoral condyles and the greater trochanter. Considering the shaft of the femur from

68
directly above, (i.e., the frontal plane), the anterior surface is in view. The antero-
posterior plane of the femur is perpendicular to the frontal plane and passes through the
mid-points of the shaft at a point approximately 15 cm proximal to the femoral condyles
and at a point slightly distal to the lesser trochanter. The medio-lateral plane is then
defined as being perpendicular to the antero-posterior plane passing through the mid-
points of the shaft. The longitudinal axis of the femur is then formed by the intersection
of these two planes.‖ Similarly, Ruff and Hayes (1983: 362–363) established the femoral
frontal plane ―by placing the bone, dorsal side down, on a flat surface and raising the
proximal end until the A-P midpoints of two locations on the shaft—just distal to the
lesser trochanter and just proximal to the distal condyles—are equidistant above the
supporting surface. In this position, the centers of articulation of the femoral condyles are
taken as the most distally projecting points on the condyle surfaces. The frontal plane is
then defined as a plane parallel to the supporting surface equidistant between the A-P
positions of the condylar centers. The sagittal plane of the femur is perpendicular to the
frontal plane, and contains the deepest point in the intercondylar notch and the M-L
midpoint of the shaft at the same proximal location used to establish the frontal plane.‖
A complete femur, though, is required to utilize the techniques presented by Ruff
and Hayes (1983) and Stephenson and Seedhom (1999). When working with fragmentary
remains and thin-sections removed from dissecting room cadavers, however, accurate and
precise determination of anatomical axes locations becomes problematic. No method for
anatomical axis standardization currently exists for disassociated sections; the various
femoral ROIs viewed for microscopic age at death estimation are therefore generally
imprecise (see Fig. 4). Given variation in femoral size and shape throughout the aging

69
process, standardized ROIs should be viewed to help improve repeatability and reduce
observer subjectivity. Therefore, to standardize anatomical axis locations from sample to
sample, both within and between observers so that useful remodeling patterns may be
uncovered, the A-P anatomical axis was geometrically determined by drawing a vertical
line, and the M-L axis by drawing a horizontal line, through the mathematically
determined section centroid (Fig. 24e).
VI. Collection of Cortical Thickness Data
Each femoral cross-sectional image with located biomechanical and anatomical
axes was once again opened in Adobe Photoshop and placed over a background that
standardizes measurement of every 22.5° of a circle (Appendix C). Using this technique,
ImageJ was used to measure cortical thickness at 16 places around each femoral cross-
section. Appendix D presents cortical thicknesses (in mm) obtained from the 200 femurs.
VII. Determination of Regions of Interest
Utilizing the A-P and M-L anatomical axes and the Imax and Imin biomechanical
axes drawn via Adobe Photoshop and ImageJ, respectively, eight exact and reproducible
histological sampling locations were determined wherever an axis crossed the bone’s
periosteal border: four anatomical—A (anterior), P (posterior), M (medial), L (lateral)—
and four biomechanical—ImaxAnt, ImaxPost, IminMed, and IminLat. To transfer the standardized
sampling locations from digital image to glass slide for histological analysis, each image
was printed at 100% of its actual size on white paper. This paper was placed beneath the
corresponding specimen’s clear slide so that the eight sampling locations could be
marked on the glass with ink. For each of the 200 glass slides with marked anatomical

70
and biomechanical axes, the eight locations where an axis crossed the bone’s periosteal
border were examined using an Olympus BX41 microscope with an Olympus DP72
mounted camera at 40x total (10x eyepiece × 4x) magnification. Overall, then, a total of
(200)(8) = 1600 3 mm2 regions of interest (ROIs) were observed (Fig. 24f).
Once this process was complete, each femoral sample had a digital file that
contained: (1) an original high-resolution color scan of the slide, (2) the image rotated
into visual anatomical position, (3) an image with drawn biomechanical axes, (4) the log
output of biomechanical data produced by ImageJ, and (5) a Photoshop image with A-P,
M-L, Imax, and Imin axes drawn over a background that standardizes cortical thickness
measurement. Additionally, three cumulative Excel files were created: one contained the
ImageJ outputs of all biomechanical data for each sample in the study (Appendix B),
another all cortical thickness measurements (Appendix D), and another all data collected
from histomorphometric analysis of each specimen’s standardized ROIs (Appendix E).
VIII. Collection of Histomorphometric Data at Standardized ROIs
To test the hypotheses that (1) topographical histomorphometric variation exists
around human femoral midshaft periosteal cortices, (2) ROIs associated with the Imin
second moment of area biomechanical axis exhibit the lowest remodeling rates, and (3)
bone remodeling at biomechanical ROIs (ImaxAnt, ImaxPost, IminMed, and IminLat) is
histomorphometrically more consistent than at anatomical ROIs (A, P, M, and L),
secondary osteons, fragmentary secondary osteons, and OPD were quantified at each
exact and reproducible femoral sampling location. Tests of intraobserver and
interobserver error were conducted (see Results).

71
A. Number of Secondary Osteons. Given how researchers differentially define basic
histomorphological structures, Heinrich and colleagues (2012) standardized the
definitions of intact and fragmentary secondary osteons for use in microscopic age at
death estimation in order to reduce observer error. These standardized definitions have
been utilized in this study for consistency.
An intact secondary osteon, in line with its biological function, is thus identified
as such when it has an intact Haversian canal and is bounded by a scalloped line
(Heinrich et al., 2012). Regarding when to count these structures, (1) where multiple
osteons are connected by a clearly defined Volkmann’s canal, each is counted separately,
(2) where two or more structures share a Haversian canal or scalloped reversal line, they
are counted as one osteon, (3) where it is impossible to determine whether a branching
event has occurred or whether they are connected by a Volkmann’s canal, one osteon is
counted, (4) hemiosteons specific to trabecular bone remodeling are not counted as
osteons, (5) secondary osteons found in trabecularized cortical bone are counted as
osteons, and (6) primary osteons are not counted as intact secondary osteons.
Within the category of secondary osteons, Type II, double zonal, and drifting
osteons pose challenges for the histomorphologist. Type II or embedded osteons form
when a portion of a preexisting Haversian canal remodels (intraosteonal remodeling),
possibly in response to the demands of mineral homeostasis. ―The completed type II
osteon appears as a small Haversian system—complete with a reversal line and
concentric lamellae—embedded completely within a larger, parent osteon‖ (Robling and
Stout, 2008: 154). When observed, Heinrich et al. (2012) suggest treating the peripheral
osteon as one fragment and the intact embedded structure as one secondary osteon.

72
Alternatively, double zonal osteons exhibit a ―hypercalcified ring within their
concentric lamellae, demarcating a point during the formation phase where matrix
elaboration temporarily ceased‖ possibly due to severe stress, similar to a Harris growth
arrest line or linear enamel hypoplasia (Stout, 1989: 48). These structures can be
distinguished from type II osteons by absence of scalloped reversal lines and presence of
concentric lamellae on either side of the arrest line. When observed, Heinrich and
colleagues (2012) suggest they be counted as only one intact secondary osteon.
Finally, ―drifting osteons form from BMUs that simultaneously travel
longitudinally and transversely through the cortex, a process that results in a transversely
elongated osteon exhibiting a hemicyclic lamellar tail‖ (Robling and Stout, 2008: 154).
Typically, Heinrich and colleagues (2012) suggest a drifting osteon be counted as one
intact secondary osteon, unless close observation reveals clear evidence of reversal lines
between an intact osteon and closely associated fragments that only give it the
appearance of a drifting osteon.
B. Number of Secondary Osteon Fragments. Similarly, a secondary osteon fragment is
identified when a secondary osteon with a partially visible Haversian canal has been
breached by a neighboring osteon or resorptive bay, or when a secondary osteon’s
Haversian canal is absent. Secondary osteon fragments are counted when (1) concentric
lamellae disassociated from a Haversian canal are surrounded by a scalloped edge, and
(2) when osteocytic lacunae are not parallel to those in surrounding structures.
C. Osteon Population Density. Finally, Stout has combined the density (number per
millimeter squared) of intact and fragmentary osteons to form the variable osteon

73
population density. Osteon population density ―represents all visible remains of past
cortical remodeling activity in a given cross-section of bone‖ (Stout, 1989: 48), and
minimizes ―errors due to different interpretations of what constitutes a complete or
fragmentary osteon‖ (Stout, 1989: 47). All secondary osteon, secondary osteon fragment,
and OPD data collected from the eight ROIs of each of the 200 femurs are summarized in
Appendix E and visualized in Appendix F.

74
CHAPTER FIVE: RESULTS
Although the data is cross-sectional and not longitudinal in nature, and thus,
cannot provide definitive information regarding cause and effect relationships, the
collected cortical thickness (Appendix D), biomechanical (Appendix B), and
histomorphometric data (Appendix E) were analyzed with SPSS Statistics 20.0 to identify
femoral periosteal ROIs best suited to reduce the standard error of microscopic age at
death estimates and prevent the OPD asymptote from being reached by ~50 years.
A. CORTICAL THICKNESS
Cortical thickness data was collected from 16 standardized locations [0°
(anterior), 22.5°, 45°, 67.5°, 90° (medial), 112.5°, 135°, 157.5°, 180° (posterior), 202.5°,
225°, 247.5°, 270° (lateral), 292.5°, 315°, and 337.5°] around each of the 200 analyzed
femoral cross-sections. Of the 3200 total cortical thickness measurements, five were
outliers, as evidenced by Figure 25. Nine of the 16 cortical thickness distributions were
abnormal as assessed by Shapiro-Wilk tests (p ≤ 0.05; Table 8), and the assumption of
homogeneity of variances was violated, as assessed by Levene’s test [(15, 3184) = 9.948,
p < 0.0005)]. Given the outliers, distribution abnormalities, and variance inequalities, an
independent samples Kruskal-Wallis test, the non-parametric alternative to the one-way
analysis of variance (ANOVA), was conducted to determine whether the 16 locations
differ with respect to average cortical thickness.

75
Figure 25. Boxplots of femoral cortical thicknesses (mm) at 16 standardized locations.
Table 8. Tests of Normality for the Cortical Thickness Measurements.
Group
Kolmogorov-Smirnova Shapiro-Wilk
Statistic df Sig. Statistic df Sig.
0° .050 200 .200* .983 200 .017
22.5° .057 200 .200* .981 200 .008
45° .070 200 .018 .988 200 .081
67.5° .037 200 .200* .996 200 .928
90° .041 200 .200* .992 200 .297
112.5° .033 200 .200* .995 200 .740
135° .052 200 .200* .987 200 .070
157.5° .072 200 .014 .980 200 .006
180° .083 200 .002 .980 200 .005
202.5° .053 200 .200* .986 200 .044
225° .052 200 .200* .985 200 .027
247.5° .055 200 .200* .991 200 .229
270°
292.5
.059 200 .086 .990 200 .166
292.5° .078 200 .005 .986 200 .050
315° .080 200 .003 .979 200 .004
337.5° .052 200 .200* .983 200 .014 a Lilliefors Significance Correction
* This is a lower bound of the true significance

76
Results of the Kruskal-Wallis test indicate median cortical thickness differs
significantly around the femoral midshaft [X2(15) = 609.567, p < 0.0005]. Specifically,
post-hoc pairwise comparisons discovered 71 statistically significant differences between
median cortical thicknesses (p ≤ 0.05; Fig. 26). From these results, a general pattern
emerges where cortical thickness increases from the 0° location (Median = 4.146 mm) to
the 22.5° location (Median = 4.362 mm) to the 225° location (Median = 4.724 mm) to the
337.5° location (Median = 4.940 mm) to the 202.5° location (Median = 5.096 mm) to the
45° location (Median = 5.200 mm) to the 247.5° location (Median = 5.245 mm) to the
135° location (Median = 5.308 mm) to the 112.5° location (Median = 5.791 mm) to the
157.5° location (Median = 5.857 mm) to the 67.5° location (Median = 5.887 mm) to the
90° location (Median = 6.203 mm) to the 315° location (Median = 6.212 mm) to the 270°
location (Median = 6.431 mm) to the 180° location (Median = 6.820 mm) to the 292.5°
location (Median = 7.001 mm).
This pattern makes clear that the smallest median cortical thicknesses generally
occur in the anteromedial and posterolateral quadrants of the femoral midshaft.
Alternatively, the anterolateral quadrant possesses all of the largest cortical thicknesses,
with the one exception of the posterior 180° location (linea aspera). The posteromedial
quadrant is characterized by median cortical thicknesses between the low
anteromedial/posterolateral and high anterolateral values. These findings substantiate
those of Goldman and colleagues (2009: 59) who identified the AL-PM plane as the
average location of the Imax axis in adult modern humans.

77
Figure 26. Insignificant (black) and significant (gray) pairwise comparisons between
cortical thickness locations. Top number: cortical thickness location by degree. Bottom
number: each node shows the sample average rank of the group.
Having established that the 16 locations differ with respect to average cortical
thickness, the assumption of a linear association between the 16 cortical thickness
locations and age was next tested. Figure 27 provides evidence to suggest the
relationships are all linear.

78
Figure 27. Scatterplots showing the linear associations between the 16 cortical thickness
(mm) locations and age.

79
The 45°, 67.5°, 90°, 112.5°, 135°, 247.5°, and 270° data are normally distributed
as assessed by Shapiro-Wilk tests (p > 0.050; Table 8). Therefore, Pearson correlations
were used to measure the strengths of association between age and these cortical
thickness locations: moderately negative statistically significant correlations were
generally found (Table 9).
Table 9. Correlations Between Cortical Thickness Locations and Age.
Correlation Test Correlation with Age n p-value
0° Spearman’s rho -0.410** (Moderate) 200 < 0.0005
22.5° Spearman’s rho -0.411** (Moderate) 200 < 0.0005
45° Pearson -0.411** (Moderate) 200 < 0.0005
67.5° Pearson -0.377** (Moderate) 200 < 0.0005
90° Pearson -0.281** (Slight) 200 < 0.0005
112.5° Pearson -0.314** (Moderate) 200 < 0.0005
135° Pearson -0.352** (Moderate) 200 < 0.0005
157.5° Spearman’s rho -0.419** (Moderate) 200 < 0.0005
180° Spearman’s rho -0.405** (Moderate) 200 < 0.0005
202.5° Spearman’s rho -0.438** (Moderate) 200 < 0.0005
225° Spearman’s rho -0.463** (Moderate) 200 < 0.0005
247.5° Pearson -0.407** (Moderate) 200 < 0.0005
270° Pearson -0.347** (Moderate) 200 < 0.0005
292.5° Spearman’s rho -0.306** (Moderate) 200 < 0.0005
315° Spearman’s rho -0.298** (Slight) 200 < 0.0005
337.5° Spearman’s rho -0.375** (Moderate) 200 < 0.0005
** = Correlation is significant at the 0.01 level (2-tailed)
The 0°, 22.5°, 157.5°, 180°, 202.5°, 225°, 292.5°, 315°, and 337.5° data, however,
are not normally distributed as assessed by Shapiro-Wilk tests (p ≤ 0.050; Table 8). Since
the data are monotonic, however, Spearman’s rank order correlations were chosen to
measure the strengths of association between age and these cortical thickness locations:
moderately negative statistically significant correlations were generally found (Table 9).

80
Overall, cortical thickness was found to decrease with age. This finding is in line
with the work of Szulc and colleagues (2006) who documented increasing cortical
thinning in premenopausal (0.29 ± 0.85 percent/year), perimenopausal (0.66 ± 0.56
percent/year), and postmenopausal women (1.10 ± 1.06 percent/year), and Seeman
(2002) who documented a similar pattern in aging males. The negative correlations found
are significant for all cortices, but are highest for the 0°, 22.5°, 45° locations (anterior and
anteromedial femoral cortices) and the 157.5°, 180°, 202.5°, 225°, 247.5° locations
(posterior and posterolateral femoral cortices), and lowest for the 90°, 112.5°, 292.5°,
315° locations (medial and lateral femoral cortices). Therefore, cortical thickness is not
lost uniformly with age: Figure 28 illustrates how the anterior and posterior femoral
midshaft cortices lose more thickness beginning earlier than the medial/ lateral cortices.
Figure 28. Scatterplots of (a) anterior, (b) medial, (c) posterior, and (d) lateral femoral
midshaft cortical thicknesses (mm) with age. Lines are locally weighted scatterplot
smoothing (LOESS) curves.
a b
c d

81
B. BIOMECHANICS
Biomechanical data collected from each of the 200 analyzed femoral cross-
sections demonstrate how the femur slowly and steadily changes in size and shape, and
therefore rigidity and strength throughout adulthood. The first biomechanical variable
assessed is cortical area (CA), which has a linear association with age (Fig. 29).
Figure 29. Scatterplot showing the linear association between CA (mm2) and age.
The CA data, however, is not normally distributed as assessed by a Shapiro-Wilk test (p
= 0.005; Table 10). Since it is monotonic, however, Spearman’s rank order correlation

82
was chosen to measure the strength of the association between age and CA. This test
indicates there is a moderately negative statistically significant correlation: rs (198) = -
0.371, p < 0.0005 (Table 11). Together, the statistics and graph suggest femoral midshaft
cross-sectional cortical area declines with age beginning in middle adulthood, indicating
decreased ability to resist deformation and fracture under pure tension and compression.
Table 10. Tests of Normality for the Biomechanical Variables.
Kolmogorov-Smirnov
a Shapiro-Wilk
Statistic df Sig. Statistic df Sig.
CA .093 200 .000 .979 200 .005
MA .066 200 .032 .949 200 .000
TA .034 200 .200* .989 200 .134
Ix/Iy .039 200 .200* .997 200 .971
Theta .121 200 .000 .910 200 .000
Zp .071 200 .016 .979 200 .004 a Lilliefors Significance Correction
* This is a lower bound of the true significance
CA = cortical area, MA = medullary area, TA = total subperiosteal area, Ix/Iy = femoral
cross-sectional shape, Theta = orientation of Imax, Zp = polar section modulus
Table 11. Correlations Between Biomechanical Variables and Age.
Correlation Test Correlation with Age n p-value
CA Spearman’s rho -0.371** (Moderate) 200 < 0.0005
MA Spearman’s rho +0.387** (Moderate) 200 < 0.0005
TA Pearson -0.125 (Insignificant) 200 0.078
Ix/Iy Pearson -0.236** (Slight) 200 0.001
Theta Spearman’s rho -0.264** (Slight) 200 < 0.0005
Zp
Spearman’s rho -0.265** (Slight) 200 < 0.0005
** = Correlation is significant at the 0.01 level (2-tailed)
CA = cortical area, MA = medullary area, TA = total subperiosteal area, Ix/Iy = femoral
cross-sectional shape, Theta = orientation of Imax, Zp = polar section modulus

83
The second biomechanical variable assessed is medullary area (MA), which, like
cortical area, has a linear association with age (Fig. 30).
Figure 30. Scatterplot showing the linear association between MA (mm2) and age.
The MA data, however, is not normally distributed as assessed by a Shapiro-Wilk test (p
< 0.0005; Table 10). Since it is monotonic, however, Spearman’s rank order correlation
was chosen to measure the strength of the association between age and MA. This test
indicates there is a moderately positive statistically significant correlation: rs (198) =
0.387, p < 0.0005 (Table 11). Together, the statistics and graph suggest the expansion of

84
the medullary cavity is concomitant with cortical area reduction, both beginning in
middle age and continuing through mature adulthood.
The third biomechanical variable assessed is total subperiosteal area (TA), which
has a linear association with age (Fig. 31).
Figure 31. Scatterplot showing a linear association between age and total subperiosteal
area (mm2).
In addition to being linear, the TA data is also normally distributed as assessed by a
Shapiro-Wilk test (p = 0.134; Table 10). Therefore, Pearson correlation was used to

85
measure the strength of association between age and TA. This test indicates there is no
statistically significant relationship: r (198) = -0.125, p = 0.078 (Table 11). Instead, TA
appears to slightly decrease insignificantly throughout adulthood.
Altogether, cortical area reduction, medullary cavity expansion, and slightly
decreasing total subperiosteal area—all beginning in middle age and continuing through
mature adulthood— mirror the findings of Szulc and colleagues (2006) and Seeman
(2002) who showed periosteal apposition partially maintains cross-sectional area in the
face of increasing endosteal surface resorption in early and middle adulthood so that
resistance to loading is preserved. In later adulthood, however, periosteal apposition was
found to decline compared to endosteal resorption, and net bone loss was sustained.
The fourth biomechanical variable assessed is the Ix/Iy ratio, a femoral cross-
sectional shape indicator, which has a linear association with age (Fig. 32).
Figure 32. Scatterplot showing the linear association between the Ix/Iy ratio and age.

86
In addition to being linear, the Ix/Iy ratio data is also normally distributed as assessed by a
Shapiro-Wilk test (p = 0.971; Table 10). Therefore, Pearson correlation was used to
measure the strength of association between age and the Ix/Iy ratio. This test indicates
there is a slight negative statistically significant correlation: r (198) = -0.236, p = 0.001
(Table 11). Together, the statistics and graph suggest that femoral cross-sectional cortical
shape transforms throughout adulthood: the youngest adults in the study sample have the
most A-P elongated cortices, indicating frequent A-P bending loadings, a pattern that
develops with great workload and mobility (Ruff, 1987: 411). This shape is slowly lost so
that by mature adulthood, femoral cross-sections are nearly circular. Eventually, the
femoral cross-section Ix/Iy ratios dip below 1.0, indicating greatest elongation in the M-L
plane and overall reduced mobility (Ruff, 1987).
A fifth biomechanical variable assessed is theta. Theta is the angle (0–90º) formed
between the Imax biomechanical axis and the M-L anatomical axis. Since theta can be
positive or negative depending on Imax orientation, the absolute value of all theta values
was determined and plotted against age (Fig. 33). The relationship was found to be linear
but not normally distributed (p < 0.0005; Table 10). Thus, Spearman’s rank order
correlation was used to measure the strength of the association between theta and age.
This test indicates there is a slight negative statistically significant correlation: rs (198) = -
0.264, p < 0.0005 (Table 11): corroborating the Ix/Iy femoral shape data, the location of
theta approaches 0º, or the M-L anatomical axis, with increasing age (Fig. 34).
A final biomechanical variable assessed is the femoral polar section modulus, Zp,
which has a linear association with age (Fig. 35).

87
Figure 33. Scatterplot showing the linear association between the theta (º) and age.
Figure 34. The locations of the Imax biomechanical axis over the lifecycle of the femur
from toddler through mature adulthood. Modified from Goldman and colleagues (2009)
with permission from John Wiley and Sons.

88
Figure 35. Scatterplot of linear association between age and Zp (mm3).
The Zp data is not normally distributed, however, as assessed by a Shapiro-Wilk test (p =
0.004; Table 10). Therefore, Spearman’s rank order correlation was chosen to measure
the strength of the association between age and Zp. This test suggests there is a slight
negative statistically significant correlation: rs (198) = -0.265, p < 0.0005 (Table 11). In
association with marked cortical bone loss and M-L redistribution of cortical area with
age, this negative correlation between Zp and age indicates additional loss of femoral
robusticity and torsional and average bending strengths, or overall reduced resistance to
fracture in mature adulthood (Orwoll, 2003).

89
C. HISTOMORPHOMETRICS
I. Observer Error
The author collected secondary osteon, secondary osteon fragment, and OPD data
from 1600 ROIs (Intraobserver I group). Sixteen of those 1600 ROIs were then randomly
selected to test intraobserver error (Intraobserver II group). Recounts were conducted
between one week and three months after the initial Intraobserver I group counts. Those
same 16 ROIs that were randomly selected for tests of intraobserver error were also given
to a second experienced histomorphologist who was instructed to quantify secondary
osteons, secondary osteon fragments, and OPD (Interobserver I group). The raw data
from the observer error tests is provided in Table 12.
INDIV # ROI Osteons Frags OPD Osteons Frags OPD Osteons Frags OPD
19 ImaxPost 39 0 13.000 39 1 13.333 38 7 15.000
107 ImaxAnt 52 0 17.333 54 0 18.000 50 8 19.333
121 Anterior 44 0 14.667 44 0 14.667 38 4 14.000
130 IminMed 51 0 17.000 51 1 17.333 45 8 17.667
219 IminMed 40 0 13.333 40 0 13.333 37 4 13.667
252 IminLat 52 3 18.333 53 3 18.667 50 9 19.667
822 IminLat 51 0 17.000 50 0 16.667 42 4 15.333
823 ImaxPost 39 0 13.000 39 0 13.000 38 3 13.667
1017 ImaxAnt 44 1 15.000 44 1 15.000 40 13 17.667
1017 IminMed 48 0 16.000 48 0 16.000 43 6 16.333
1021 Medial 67 0 22.333 68 0 22.667 62 8 23.333
1026 Lateral 67 2 23.000 65 3 22.667 60 8 22.667
1122 IminMed 73 0 24.333 72 0 24.000 53 5 19.333
1214 Medial 55 0 18.333 54 0 18.000 48 2 16.667
1313 IminLat 50 0 16.667 50 0 16.667 43 4 15.667
1313 Lateral 55 4 19.667 55 4 19.667 50 12 20.667
Interobserver ErrorIntraobserver Error
Table 12. Intraobserver and Interobserver Error Raw Data.

90
Focusing only on total remodeling events (OPD), zero of the 48 OPD data points were
outliers, as assessed by inspection of Figure 36.
Figure 36. Boxplots of intraobserver and interobserver error data.
All data was further found to be normally distributed as assessed by Shapiro-Wilk tests (p
> 0.05; Table 13).
Table 13. Tests of Normality for the Observer Error Data.
Kolmogorov-Smirnov
a Shapiro-Wilk
Statistic df Sig. Statistic df Sig.
Intraobserver Error Test I .149 16 .200* .931 16 .252
Intraobserver Error Test II .127 16 .200* .932 16 .266
Interobserver Error Test I .113 16 .200* .940 16 .351 a Lilliefors Significance Correction
* This is a lower bound of the true significance

91
Mauchly’s tests of sphericity, however, indicated the groups do not have equal variances
[X2(2) = 43.330, p < 0.0005; Table 14].
Table 14. Test of Sphericity for the Observer Error Dataa.
Measure: OPD
Within
Subjects
Effect
Mauchly’s
W
Approx.
Chi-
Square
df Sig. Epsilonb
Greenhouse-
Geiser
Huynh-
Feldt
Lower-
bound
Observer .045 43.330 2 .000 .512 .514 .500
Tests the null hypothesis that the error covariance matrix of the orthonormalized
transformed dependent variables is proportional to an identity matrix
a. Design: Intercept
Within Subjects Design: Observer
b. May be used to adjust the degrees of freedom for the averaged tests of
significance. Corrected tests are displayed in the Tests of Within-Subjects
Effects table.
Without homogeneity of variances (ε = 0.512) the Greenhouse-Geiser correction was
applied to correct the degrees of freedom for the F-distribution (Table 15).
Table 15. Tests of Within-Subjects Effects for the Observer Error Data.
Measure: OPD
Source Type III
Sum of
Squares
df Mean
Square
F Sig. Partial
Eta2
Observer Sphericity Assumed .088 2 .044 .042 .959 .003
Greenhouse-Geiser .088 1.023 .086 .042 .846 .003
Huynh-Feldt .088 1.028 .086 .042 .847 .003
Lower-bound .088 1.000 .088 .042 .841 .003
Error
(Observer)
Sphericity Assumed 31.616 30 1.054
Greenhouse-Geiser 31.616 15.347 2.060
Huynh-Feldt 31.616 15.423 2.050
Lower-bound 31.616 15.000 2.108

92
Once corrected, a repeated measures ANOVA was used to determine whether or not the
group means were equal. The results indicate the three groups’ OPD means are
statistically insignificantly different [F (1.023, 15.347) = 0.042, p = 0.846], although
mean OPD did increase slightly from Intraobserver I (17.438 ± 0.871) to Intraobserver II
(17.479 ± 0.854) to Interobserver I (17.542 ± 0.764; Table 16).
Table 16. Intraobserver and Interobserver Error Test Descriptives.
Measure: OPD
Observer Mean Std. Error 95% Confidence Interval
Lower Bound Upper Bound
Intraobserver I 17.438 .871 15.582 19.293
Intraobserver II 17.479 .854 15.659 19.300
Interobserver I 17.542 .764 15.913 19.171
II. Hypothesis Testing
NULL HYPOTHESIS #1: There are no statistically significant differences between
ROI OPD means.
ALTERNATIVE HYPOTHESIS #1: Topographical variation in remodeling exists
around human femoral midshaft periosteal cortices. There are statistically
significant differences between ROI OPD means.
To test this first hypothesis, all collected OPD data sets were analyzed. Twenty-
three of the 1600 data points are outliers, as assessed by inspection of Figure 37. Twenty-
one of those outliers lay more than 1.5 box-lengths from their associated box edges and
are illustrated as circular dots. Additionally, there are two extreme outliers more than 3
box-lengths away from their associated box edges illustrated by asterisks. More

93
specifically, the Anterior and IminLat ROIs each contain one outlier, the IminMed ROI
displays seven outliers, and the remaining ROIs all show between two and four outliers.
Figure 37. Boxplots of all OPD (mm2) data organized by region of interest.
In addition to possessing outliers, the OPD data was also not normally distributed
overall as assessed by Shapiro-Wilk tests (p ≤ 0.050; Table 17). Three of the eight ROIs
(Medial, ImaxPost, and IminMed) have significances greater than 0.050 indicating their OPD
values are normally distributed. The Anterior, Posterior, Lateral, ImaxAnt, and IminLat ROIs,
however, have p-values less than 0.050 indicating normality has been violated.

94
Table 17. Tests of Normality for the Original OPD Data by ROI.
Kolmogorov-Smirnov
a Shapiro-Wilk
Statistic df Sig. Statistic df Sig.
Anterior .061 200 .070 .983 200 .014
Posterior .071 200 .016 .974 200 .001
Medial .050 200 .200* .989 200 .116
Lateral .049 200 .200* .972 200 .001
ImaxAnt .062 200 .060 .981 200 .009
ImaxPost .059 200 .089 .991 200 .254
IminMed .053 200 .200* .988 200 .097
IminLat .069 200 .021 .983 200 .014 a Lilliefors Significance Correction
* This is a lower bound of the true significance
Transforming the data by taking the square root of the OPD values was attempted
and removed some non-normality issues, created some new non-normalities, and 18
outliers remained afterwards. Transforming the data by taking the log10 of the OPD
values was attempted and also removed some non-normality issues, created some new
non-normalities, and 22 outliers were still present afterwards. Finally, transforming the
data by taking the inverse of the OPD values only exacerbated the non-normality
problems and produced more outliers than the original data contained.
Overall, transformation was not successful at normalizing the OPD data set.
Therefore, in a different approach, the 23 outliers were excluded from the data and the
boxplots reassessed. Four new outliers were present. Once the four were removed, only a
single outlier persisted. Finally, after removing the single outlier [28 data sets total
(1.75% of the data); 1572 data sets retained], no outliers remained, as evidenced by
inspection of Figure 38.

95
Figure 38. Boxplots of OPD data (mm2; 28 outliers excluded) organized by region of
interest.
With outliers excluded, OPD data at each ROI was found to be normally distributed, as
assessed by Shapiro-Wilk tests (p > 0.05; Table 18).

96
Table 18. Tests of Normality for the OPD Data (Outliers Excluded) by ROI.
OPD Group Kolmogorov-Smirnov
a Shapiro-Wilk
Statistic df Sig. Statistic df Sig.
Anterior .054 198 .200* .993 198 .504
Posterior .051 194 .200* .990 194 .189
Medial .033 197 .200* .997 197 .954
Lateral .052 198 .200* .993 198 .489
ImaxAnt .056 195 .200* .994 195 .552
ImaxPost .052 198 .200* .989 198 .146
IminMed .043 193 .200* .993 193 .509
IminLat .067 199 .032 .990 199 .187 a Lilliefors Significance Correction
* This is a lower bound of the true significance
Levene’s tests [(7, 1564) = 1.403, p = 0.200] indicate that without outliers, the normally
distributed groups also have equal variances. With homogeneity of variances, the results
of the one-way ANOVA are valid: mean OPD is statistically significantly different
between ROIs [Welch’s F (7, 1564) = 18.069, p < 0.0005]. Specifically, Tukey’s post-
hoc pairwise comparisons revealed 15 statistically significant differences between ROI
OPD means (Table 19). From these results, a general pattern emerges (Fig. 39) where
mean OPD increases from the Anterior ROI group (17.209 ± 3.56) to the Posterior ROI
group (17.658 ± 3.780) to the IminMed ROI group (17.924 ± 3.627) to the ImaxAnt ROI group
(18.532 ± 4.084) to the ImaxPost ROI group (18.557 ± 3.778) to the Medial ROI group
(19.228 ± 3.857) to the IminLat ROI group (19.489 ± 4.118) to the Lateral ROI group
(20.865 ± 4.041). It is therefore evident from these results that topographical variation in
remodeling exists around adult human femoral midshaft periosteal cortices resulting from
normal anatomical development, customary biomechanical usage, and standard
mechanobiological functioning. The first null hypothesis is rejected.

97
Table 19. Statistically Significant Differences Between ROI OPD Means
(Outliers Excluded).
1 OPD increases from the Anterior ROI group (17.209 ± 3.56) to the Medial ROI
group (19.228 ± 3.857), an increase of 2.020 (95% CI, 0.840 to 3.199; p = 0.000).
2 OPD increases from the Posterior ROI group (17.658 ± 3.780) to the Medial ROI
group (19.228 ± 3.857), an increase of 1.576 (95% CI, 0.390 to 2.761; p = 0.001).
3 OPD increases from the IminMed ROI group (17.924 ± 3.627) to the Medial ROI
group (19.228 ± 3.857), an increase of 1.304 (95% CI, 0.118 to 2.491; p = 0.20).
4 OPD increases from the Anterior ROI group (17.209 ± 3.56) to the Lateral ROI
group (20.865 ± 4.041), an increase of 3.657 (95% CI, 2.479 to 4.834; p = 0.000).
5 OPD increases from the Posterior ROI group (17.658 ± 3.780) to the Lateral ROI
group (20.865 ± 4.041), an increase of 3.212 (95% CI, 2.029 to 4.396; p = 0.000).
6 OPD increases from the Medial ROI group (19.228 ± 3.857) to the Lateral ROI
group (20.865 ± 4.041), an increase of 1.637 (95% CI, 0.458 to 2.816; p = 0.001).
7 OPD increases from the ImaxAnt ROI group (18.532 ± 4.084) to the Lateral ROI
group (20.865 ± 4.041), an increase of 2.333 (95% CI, 1.151 to 3.516; p = 0.000).
8 OPD increases from the ImaxPost ROI group (18.557 ± 3.778) to the Lateral ROI
group (20.865 ± 4.041), an increase of 2.308 (95% CI, 1.130 to 3.486; p = 0.000).
9 OPD increases from the IminMed ROI group (17.924 ± 3.627) to the Lateral ROI
group (20.865 ± 4.041), an increase of 2.941 (95% CI, 1.760 to 4.127; p = 0.000).
10 OPD increases from the IminLat ROI group (19.489 ± 4.118) to the Lateral ROI
group (20.865 ± 4.041), an increase of 1.376 (95% CI, 0.199 to 2.553; p = 0.009).
11 OPD increases from the Anterior ROI group (17.209 ± 3.56) to the ImaxAnt ROI
group (18.532 ± 4.084), an increase of 1.323 (95% CI, 0.141 to 2.505; p = 0.016).
12 OPD increases from the Anterior ROI group (17.209 ± 3.56) to the ImaxPost ROI
group (18.557 ± 3.778), an increase of 1.348 (95% CI, 0.171 to 2.526; p = 0.012).
13 OPD increases from the Anterior ROI group (17.209 ± 3.56) to the IminLat ROI
group (19.489 ± 4.118), an increase of 2.280 (95% CI, 1.104 to 3.457; p = 0.000).
14 OPD increases from the Posterior ROI group (17.658 ± 3.780) to the IminLat ROI
group (19.489 ± 4.118), an increase of 1.836 (95% CI, 0.654 to 3.019; p = 0.000).
15 OPD increases from the IminMed ROI group (17.924 ± 3.627) to the IminLat ROI
group (19.489 ± 4.118), an increase of 1.565 (95% CI, 0.381 to 2.750; p = 0.002).

98
Figure 39. Bar chart demonstrating mean OPDs (mm2) by ROI (outliers excluded).
To test the effect of removing the outliers on the final results, the same test was
run with all outliers included. The OPD data was therefore not normally distributed
overall, as assessed by Shapiro-Wilk tests (p ≤ 0.050; Table 17). Three of the eight ROIs
(Medial, ImaxPost, and IminMed) have significances greater than 0.050 indicating their OPD
values are normally distributed. The Anterior, Posterior, Lateral, ImaxAnt, and IminLat ROIs,
however, have p-values less than 0.050 indicating the assumption of normality has been
violated. Levene’s Test of homogeneity of variance (7, 1592) = 1.100, p = 0.360),
though, indicates the eight groups have equal variances. Therefore, since the one-way

99
ANOVA is fairly robust to violations of normality—it requires only approximately
normal data with an equal number of cases in each group—no further modifications to
the one-way ANOVA were required and the results are valid: mean OPD is statistically
significantly different between ROIs [Welch’s F (7, 1592) = 15.035, p < 0.0005].
Specifically, Tukey’s post-hoc pairwise comparisons again discovered 15 statistically
significant differences between ROI OPD means (Table 20). While this was the same
result produced from the ANOVA conducted with outliers excluded, a slightly different
general pattern emerges when outliers are included (Fig. 40) where mean OPD increases
from the Anterior ROI group (17.340 ± 3.79) to the IminMed ROI group (17.945 ± 4.168) to
the Posterior ROI group (18.020 ± 4.275) to the ImaxPost ROI group (18.677 ± 3.943) to
the ImaxAnt ROI group (18.865 ± 4.548) to the Medial ROI group (19.305 ± 4.220) to the
IminLat ROI group (19.581 ± 4.311) to the Lateral ROI group (21.033 ± 4.378).
Regardless, running the ANOVA with outliers included again produces the same overall
results: the first null hypothesis is rejected, and topographical variation in remodeling
around adult human femoral midshaft periosteal cortices resulting from normal
anatomical development, customary biomechanical usage, and standard
mechanobiological functioning is accepted.

100
Table 20. Statistically Significant Differences Between ROI OPD Means
(Outliers Included).
1 OPD increases from the Anterior ROI group (17.340 ± 3.79) to the Medial ROI
group (19.305 ± 4.220), an increase of 1.965 (95% CI, 0.687 to 3.243; p = 0.000).
2 OPD increases from the Posterior ROI group (18.020 ± 4.275) to the Medial ROI
group (19.305 ± 4.220), an increase of 1.285 (95% CI, 0.007 to 2.563; p = 0.048).
3 OPD increases from the IminMed ROI group (17.945 ± 4.168) to the Medial ROI
group (19.305 ± 4.220), an increase of 1.360 (95% CI, 0.082 to 2.638; p = 0.028).
4 OPD increases from the Anterior ROI group (17.340 ± 3.79) to the Lateral ROI
group (21.033 ± 4.378), an increase of 3.693 (95% CI, 2.416 to 4.971; p = 0.000).
5 OPD increases from the Posterior ROI group (18.020 ± 4.275) to the Lateral ROI
group (21.033 ± 4.378), an increase of 3.013 (95% CI, 1.736 to 4.291; p = 0.000).
6 OPD increases from the Medial ROI group (19.305 ± 4.220) to the Lateral ROI
group (21.033 ± 4.378), an increase of 1.728 (95% CI, 0.451 to 3.006; p = 0.001).
7 OPD increases from the ImaxAnt ROI group (18.865 ± 4.548) to the Lateral ROI
group (21.033 ± 4.378), an increase of 2.168 (95% CI, 0.891 to 3.446; p = 0.000).
8 OPD increases from the ImaxPost ROI group (18.677 ± 3.943) to the Lateral ROI
group (21.033 ± 4.378), an increase of 2.357 (95% CI, 1.079 to 3.634; p = 0.000).
9 OPD increases from the IminMed ROI group (17.945 ± 4.168) to the Lateral ROI
group (21.033 ± 4.378), an increase of 3.088 (95% CI, 1.811 to 4.366; p = 0.000).
10 OPD increases from the IminLat ROI group (19.581 ± 4.311) to the Lateral ROI
group (21.033 ± 4.378), an increase of 1.452 (95% CI, 0.174 to 2.729; p = 0.013).
11 OPD increases from the Anterior ROI group (17.340 ± 3.79) to the ImaxAnt ROI
group (18.865 ± 4.548), an increase of 1.525 (95% CI, 0.247 to 2.803; p = 0.007).
12 OPD increases from the Anterior ROI group (17.340 ± 3.79) to the ImaxPost ROI
group (18.677 ± 3.943), an increase of 1.337 (95% CI, 0.059 to 2.614; p = 0.033).
13 OPD increases from the Anterior ROI group (17.340 ± 3.79) to the IminLat ROI
group (19.581 ± 4.311), an increase of 2.242 (95% CI, 0.964 to 3.519; p = 0.000).
14 OPD increases from the Posterior ROI group (18.020 ± 4.275) to the IminLat ROI
group (19.581 ± 4.311), an increase of 1.562 (95% CI, 0.284 to 2.839; p = 0.005).
15 OPD increases from the IminMed ROI group (17.945 ± 4.168) to the IminLat ROI
group (19.581 ± 4.311), an increase of 1.637 (95% CI, 0.359 to 2.914; p = 0.003).

101
Figure 40. Bar chart demonstrating mean OPDs (mm2) by ROI (outliers included).
Finally, to test the validity of the ANOVA test results (conducted with outliers
excluded and included), a Kruskal-Wallis test, the non-parametric alternative to the one-
way ANOVA, was conducted. Similar to the two ANOVAs, results from the Kruskal-
Wallis non-parametric test also indicate OPD differs significantly between ROIs [X2(7) =
99.366, p < 0.0005]. Specifically, post-hoc pairwise comparisons conducted using
Dunn’s (1964) procedure with a Bonferroni correction for multiple comparisons revealed
14 statistically significant differences between ROI OPD medians (Table 21). Figure 41
also indicates the statistically significant pairwise comparisons in light gray.

102
Table 21. Statistically Significant Differences Between ROI OPD Medians
(Kruskal-Wallis Test).
1 OPD increases from the Anterior ROI group (Median = 17.000) to the ImaxPost ROI
group (Median = 18.500) (p = 0.025).
2 OPD increases from the Anterior ROI group (Median = 17.000) to the ImaxAnt ROI
group (Median = 18.500) (p = 0.017).
3 OPD increases from the Anterior ROI group (Median = 17.000) to the Medial ROI
group (Median = 19.334) (p = 0.000).
4 OPD increases from the Anterior ROI group (Median = 17.000) to the IminLat ROI
group (Median = 19.000) (p = 0.000).
5 OPD increases from the Anterior ROI group (Median = 17.000) to the Lateral ROI
group (Median = 21.000) (p = 0.000).
6 OPD increases from the Posterior ROI group (Median = 17.667) to the Medial ROI
group (Median = 19.334) (p = 0.015).
7 OPD increases from the Posterior ROI group (Median = 17.667) to the IminLat ROI
group (Median = 19.000) (p = 0.003).
8 OPD increases from the Posterior ROI group (Median = 17.667) to the Lateral ROI
group (Median = 21.000) (p = 0.000).
9 OPD increases from the IminMed ROI group (Median = 18.000) to the IminLat ROI
group (Median = 19.000) (p = 0.012).
10 OPD increases from the IminMed ROI group (Median = 18.000) to the Lateral ROI
group (Median = 21.000) (p = 0.000).
11 OPD increases from the ImaxPost ROI group (Median = 18.500) to the Lateral ROI
group (Median = 21.000) (p = 0.000).
12 OPD increases from the ImaxAnt ROI group (Median = 18.500) to the Lateral ROI
group (Median = 21.000) (p = 0.000).
13 OPD increases from the Medial ROI group (Median = 19.334) to the Lateral ROI
group (Median = 21.000) (p = 0.009).
14 OPD increases from the IminLat ROI group (Median = 19.000) to the Lateral ROI
group (Median = 21.000) (p = 0.045).

103
Figure 41. Insignificant (black) and significant (gray) pairwise comparisons between ROI
OPD medians. Top row: Region of interest. Bottom row: each node shows the sample
average rank of the group.
Use of the Kruskal-Wallis test produced one less significant difference between
ROI OPDs than the ANOVA tests. Additionally, a slightly different general pattern
emerges (Fig. 42) where OPD increases from the Anterior ROI group (Median = 17.000)
to the Posterior ROI group (Median = 17.667) to the IminMed ROI group (Median =

104
18.000) to the ImaxPost and ImaxAnt ROI groups (Medians = 18.500) to the IminLat ROI group
(Median = 19.000) to the Medial ROI group (Median = 19.334) to the Lateral ROI group
(Median = 21.000). Regardless, the Kruskal-Wallis test again produces the same overall
result: the first null hypothesis is rejected and topographical variation in remodeling
around adult human femoral midshaft periosteal cortices resulting from normal
anatomical development, customary biomechanical usage, and standard
mechanobiological functioning is accepted.
Figure 42. Bar chart demonstrating statistically significantly different median OPDs
(mm2) by ROI (results of Kruskal-Wallis test).

105
NULL HYPOTHESIS #2: There is no evidence Imin ROI OPD means are statistically
significantly reduced compared to the other six ROI OPD means.
ALTERNATIVE HYPOTHESIS #2: Imin ROI OPD means are statistically
significantly reduced compared to the other six ROI OPD means as a result of
minimal biomechanical loading.
Results of the Kruskal-Wallis non-parametric test indicate OPD differs
significantly between ROIs, X2(7) = 99.366, p < 0.0005 and OPD increases from the
Anterior ROI (Median = 17.000) to the Posterior ROI (Median = 17.667) to the IminMed
ROI (Median = 18.000) to the ImaxAnt and ImaxPost ROIs (Medians = 18.500) to the IminLat
ROI (Median = 19.000) to the Medial ROI (Median = 19.334) to the Lateral ROI
(Median = 21.000). Based on the ordering of these results, the second null hypothesis of
no evidence for reduced remodeling at Imin ROIs is accepted. There is no evidence for
reduced remodeling at Imin locations as compared with the other ROIs. Similarly, there is
no evidence for enhanced remodeling at Imax ROIs, likely because the location of the Imax
biomechanical axis was found to shift throughout adulthood.
NULL HYPOTHESIS #3: There are no statistically significant differences between
biomechanical and anatomical ROI OPD SEEs.
ALTERNATIVE HYPOTHESIS #3: Biomechanical ROI (ImaxAnt, ImaxPost, IminMed,
and IminLat) OPD SEEs will be histomorphometrically more consistent than OPD
SEEs of anatomical ROIs (A, P, M, and L) due to femoral functional constraints.
To test this hypothesis, the assumption of a linear association between OPD and
age was first investigated. Figure 43 provides evidence to suggest the association is
approximately linear at all ROIs. The Medial, ImaxPost, and IminMed data are also normally
distributed as assessed by Shapiro-Wilk tests (p > 0.05; Table 17).

106
Figure 43. Scatterplots of the linear associations between OPD (mm2) and age by ROI.
Gray lines are locally weighted scatterplot smoothing (LOESS) curves.

107
Therefore, Pearson correlations were used to measure the strengths of association
between age and these OPDs. Spearman’s rank order correlations were chosen to
measure the strengths of association between age and the non-normally distributed
Anterior, Posterior, Lateral, ImaxAnt, and IminLat ROI OPD data (Table 17). These tests
revealed the Lateral, IminMed, and IminLat ROI OPD values to be insignificantly correlated
with age (Table 22). Further, LOESS curves plotted through all ROI OPD data (Fig. 43)
indicate OPD remains constant at the Anterior, ImaxAnt, Medial, IminMed, Lateral, and IminLat
ROIs after approximately 45 to 50 years of age. These findings resonate with the work of
Frost (1987b), Stout and colleagues (1994), and Robling and Stout (2000), who found
OPD ultimately increases in a quadratic nonlinear way: ―OPD increases with advancing
age until an asymptote is reached—a point at which subsequent osteon creations remove
all evidence of previous ones. When the cortex reaches asymptote, OPD cannot increase
anymore‖ (Robling and Stout, 2008: 153). The Posterior and ImaxPost ROI OPD values,
however, appear to continue to increase slightly throughout mature adulthood.
Table 22. Correlations Between ROI OPD Data and Age.
Correlation Test Correlation with Age n p-value
Anterior OPD Spearman’s rho 0.166* (Slight) 200 0.019
Posterior OPD Spearman’s rho 0.164* (Slight) 200 0.019
Medial OPD Pearson 0.205** (Slight) 200 0.004
Lateral OPD Spearman’s rho 0.014 (Insignificant) 200 0.849
ImaxAnt OPD Spearman’s rho 0.188 (Slight) 200 0.008
ImaxPost OPD Pearson 0.293** (Slight) 200 <0.0005
IminMed OPD Pearson 0.113 (Insignificant) 200 0.111
IminLat OPD Spearman’s rho -0.024 (Insignificant) 200 0.731
* = Correlation is significant at the 0.05 level (2-tailed)
** = Correlation is significant at the 0.01 level (2-tailed)

108
It was next questioned how well age could be predicted based on ROI OPD
values. Linear regression provides valid answers since the linearity of the age and OPD
relationship has been demonstrated (Fig. 43); the Durbin-Watson statistics indicate the
OPD data display little correlation between residuals (there is independence of errors);
there is homoscedasticity of residuals (variances of the errors are constant across
observations) as assessed by scatterplots; and the residuals are normally distributed as
assessed by histograms and Normal P-P plots.
Overall, the linear regression results presented in Tables 23 and 24 and the 95%
confidence and prediction intervals displayed in Figure 44 indicate OPD values can
statistically significantly predict age at the Anterior, Posterior, Medial, ImaxAnt, and ImaxPost
ROIs. For example, Posterior ROI OPD values statistically significantly predict age [F (1,
198) = 5.476, p = 0.020], and OPD accounts for 2.2% of the variability in age at that
location. Further, a regression equation is produced where Age = 63.044 + (0.453 ×
Post_OPD) ± 11.60 years (SEE).
Table 23. ROI OPD Linear Regression Data.
ROI Durbin
Watson
ANOVA Results p-value Adjusted R
Square
Anterior 1.502 F (1, 198) = 4.250 0.041 1.6%
Posterior 1.535 F (1, 198) = 5.476 0.020 2.2%
Medial 1.519 F (1, 198) = 8.699 0.004 3.7%
Lateral 1.565 F (1, 198) = 0.529 0.468 -0.2%
ImaxAnt 1.516 F (1, 198) = 9.072 0.003 3.9%
ImaxPost 1.513 F (1,198) = 18.588 <0.0005 8.1%
IminMed 1.550 F (1, 198) = 2.564 0.111 0.8%
IminLat 1.563 F (1, 198) = 0.115 0.735 -0.4%

109
Table 24. ROI OPD Linear Regression Data (Continued).
ROI Regression Equation: AGE = SEE 95% CI 95% PI
Anterior 62.851 + (0.468 × Ant_OPD) ±12.10 16.841–17.907 9.850–24.830
Posterior 63.044 + (0.453 × Post_OPD) ±11.60 17.456–18.647 9.568–26.472
Medial 59.690 + (0.587 × Med_OPD) ±11.84 18.717–19.893 10.962–27.648
Lateral 68.023 + (0.142 × Lat_OPD) ±12.08 20.423–21.644 12.379–29.688
ImaxAnt 60.539 + (0.555 × ImaxAnt_OPD) ±11.83 18.231–19.499 9.873–27.857
ImaxPost 54.269 + (0.897 × ImaxPost_OPD) ±11.60 18.127–19.226 10.882–26.471
IminMed 65.141 + (0.327 × IminMed_OPD) ±12.02 17.364–18.526 9.705–26.185
IminLat 72.336 + (-0.067 × IminLat_OPD) ±12.09 18.981–20.183 11.059–28.104
Of the five ROIs where OPD values can statistically significantly predict age, the
Posterior and ImaxPost ROIs have the smallest SEEs, followed by the ImaxAnt, Medial,
IminMed, Lateral, IminLat, and Anterior ROIs, in that order. This ordering indicates bone
remodeling at biomechanical ROIs (ImaxAnt, ImaxPost, IminMed, and IminLat) is
histomorphometrically neither more nor less consistent than at anatomical ROIs (A, P, M,
and L). The third null hypothesis is accepted. Again, this is likely because the location of
the Imax biomechanical axis was found to shift throughout adulthood.

110
Figure 44. Scatterplots with 95% confidence and prediction intervals for age by ROI.

111
CHAPTER SIX: DISCUSSION AND CONCLUSION
In development of the first microscopic age at death estimation technique, Ellis R.
Kerley chose sampling locations from the anterior, posterior, medial, and lateral
anatomical axes of each femoral cross section that were “fairly representative of the
particular anatomic area of the section being examined,” (Kerley, 1965: 154) and
analyzed each to “minimize the likelihood of basing the age estimate on a single atypical
field” (Kerley, 1965: 162). Four years later, however, Ahlqvist and Damsten (1969: 208)
extended a warning for histomorphologists to avoid sampling the posterior area around
the linea aspera because “in this part of the bone there seems to be a somewhat greater
variation in osteons and osteon fragments not correlated to age than in other parts,
possibly because of the powerful muscle insertions on the femoral crest.” This
unsubstantiated warning resulted in the posterior femoral cortex being disregarded and
the anterior femoral cortex becoming the standard sampling location utilized in most
subsequently published microscopic age at death estimation techniques (see Fig. 4).
The results of the femoral histomorphometric patterning research summarized
here, however, ultimately refute Ahlqvist and Damstesn’s (1969) claim and suggest
further research should be conducted on the posterior femoral cortex:
First, median cortical thickness differs significantly around the femoral midshaft.
Post-hoc pairwise comparisons discovered 71 statistically significant differences that
together reveal the thinnest median cortices occur in the anteromedial and posterolateral

112
quadrants of the femoral midshaft, and the thickest cortices occur in the anterolateral
quadrant, with the one exception of the posterior 180° linea aspera location.
Second, cortical thickness decreases with age. This negative correlation is
significant for all cortices, but is strongest for the anterior, anteromedial, posterior, and
posterolateral femoral cortices, and weakest for the medial and lateral femoral cortices.
Cortical thickness is therefore not lost uniformly with age. Rather, more thickness is lost
over a longer duration from the anterior and posterior femoral midshaft cortices, and the
medial and lateral cortices lose less thickness and only later in life.
Third, cross-sectional cortical area declines with age, concomitant with expansion
of the medullary cavity, beginning in middle age and continuing through mature
adulthood. Total subperiosteal area also decreases with increasing age, resulting in
reduced ability to resist deformation and fracture under pure tension and compression.
Fourth, Imax shifts and femoral cross-sectional cortical shape transforms
throughout adulthood from presenting A-P elongated cortices in young adults, to nearly
circular cross-sections in middle adults, to M-L elongated cortices in mature adults.
Fifth, Zp decreases with age indicating loss of femoral robusticity and torsional
and average bending strengths, or overall reduced resistance to fracture.
Sixth, 14 statistically significant differences were discovered between ROI OPD
medians indicating topographical variation in remodeling exists around adult human
femoral midshaft periosteal cortices. Specifically, the lowest OPD values occur at the
Anterior ROI, followed by the Posterior, IminMed, ImaxPost, ImaxAnt, IminLat, Medial, and
Lateral ROIs, in that order.

113
Seventh, no evidence was found for reduced remodeling at IminMed and IminLat or
enhanced remodeling at ImaxAnt and ImaxPost as compared with other ROIs, likely because
the locations of the biomechanical axes were found to shift throughout adulthood.
Eighth, OPD remains constant after approximately 45 to 50 years at the Anterior,
ImaxAnt, Medial, IminMed, Lateral, and IminLat ROIs. This finding suggests the anterior,
medial, and lateral femoral cortical regions simultaneously reach the OPD asymptote.
Only the posterior ROIs appear to continue to increase through mature adulthood.
Ninth, OPD values can statistically significantly predict age at the Anterior,
Posterior, Medial, ImaxAnt, and ImaxPost ROIs. The Posterior and ImaxPost ROIs are associated
with the smallest SEEs, however, followed by the ImaxAnt, Medial, IminMed, Lateral, IminLat,
and Anterior ROIs, in that order. This ordering indicates bone remodeling at
biomechanical ROIs is neither more nor less histomorphometrically consistent than bone
remodeling at anatomical ROIs, again, likely because the locations of the biomechanical
axes were found to shift throughout adulthood.
Finally, the SEEs associated with each of the eight standardized ROIs are, for all
practical purposes, comparable to the SEEs produced by studies of the anterior femoral
cortex with similarly large sample sizes (e.g., Ericksen, 1991; Crowder and Dominguez,
2012). Together, however, the results presented here specify the ROI best suited for
microscopic age at death estimation is not located on the traditionally sampled anterior
femoral cortex. In fact, the results present a strong argument for why the anterior cortex
is poorly suited for use in microscopic estimation of age at death. First, the anteromedial
quadrant displays some of the thinnest median cortices that occur around the femoral
midshaft. This is an undesirable trait in microscopic age at death estimation as the

114
thinnest cortices will likely reach the OPD asymptote first. Second, while cortical
thickness decreases with age at all cortices, the anterior cortex loses more thickness more
rapidly than the medial and lateral cortices. This is also an undesirable trait in
microscopic age at death estimation because a rapidly declining cortex increases the
likelihood of sampling the encroaching endosteal envelope and producing an elevated age
at death. Third, while the lowest OPD values are found at the Anterior ROI, evidence
suggests this may be due to formation of larger osteons as a result of low strain levels,
since the OPD asymptote is reached there at approximately 50 years of age. Again, this is
undesirable in microscopic age at death estimation as OPD then becomes a poor predictor
of older ages. Finally, the Anterior ROI possesses the highest SEE of any ROI, thus
producing the most imprecise age predictions.
Alternatively, although the posterior section of the femur has been avoided since
Ahlqvist and Damsten’s (1969) article, a strong argument can be made for why this area
of the femoral cortex is best suited for microscopic age at death estimation. First, the
posterior 180° linea aspera location possesses the second largest median cortical
thickness after the anterolateral 292.5º location. A thick cortex is a desirable trait in
microscopic age at death estimation as an increase in cortical area provides more space
for remodeling events before the OPD asymptote is reached, ultimately later in life than a
thin cortex. Second, although the posterior cortex loses more thickness more rapidly than
the medial and lateral cortices, meaning there should be a greater chance of sampling the
encroaching endosteal envelope and producing an elevated age at death estimate, review
of all Appendix C images suggests the linea aspera remains relatively well developed
through mature adulthood, protected by the tensile forces produced by the muscles

115
attaching there. Similarly, the posterior area around the linea aspera appears least affected
by cortical shape transformations with age. Third, the Posterior ROI displays the second
lowest OPD values after the Anterior ROI, except without any indication of having
reached the OPD asymptote. Sampling locations characterized by low remodeling are
desirable as less bone turnover allows age estimates to remain accurate over 50 years.
Finally, the Posterior ROI possesses the lowest SEE of any ROI, and as such, produces
the most precise age predictions.
To conclude, use of microscopic techniques to estimate adult age at death is well
established within physical anthropology’s subfields of bioarchaeology and forensic
anthropology. In order to become a more robust approach, however, the long-standing
problems of the OPD asymptote and high SEE must be overcome. Review of the
microscopic age at death estimation literature revealed that arbitrarily changing skeletal
elements, histological variables, sample demographics, and sampling locations has not
allowed for accurate age estimation of individuals over approximately 50 years or
reduced the standard error of age estimates. This investigation therefore began with
substantiated theory addressing femoral genetic programming, growth and development,
biomechanical and periosteal adaptation, aging, mechanobiology, and bone remodeling.
Building from this theoretical knowledge base, it was first hypothesized that
topographical variation in remodeling exists around femoral midshaft periosteal cortices
that reflects the constraints of normal anatomical development, customary biomechanical
usage, and standard mechanobiological functioning. Second, it was hypothesized ROIs
associated with the Imin second moment of area would exhibit the lowest remodeling due
to minimal biomechanical loading. Third, it was hypothesized remodeling at

116
biomechanical ROIs would be histomorphometrically more consistent than at anatomical
ROIs due to existing femoral functional constraints.
While no evidence was found for reduced remodeling at Imin ROIs or for more
consistent remodeling at biomechanical ROIs, 14 statistically significant differences were
found between ROI OPD medians indicating topographical variation in remodeling
exists. Additionally, although the anterior femoral cortex has traditionally been sampled
for microscopic age at death estimation, the Anterior ROI was found to reach the OPD
asymptote at approximately 50 years of age and was associated with the highest SEE.
Alternatively, the Posterior ROI was associated with the lowest SEE and showed no sign
of having reached the OPD asymptote. It is therefore suggested bioarchaeologists and
forensic anthropologists utilize the Posterior ROI for production of the most accurate and
precise microscopic age at death estimates from adult human skeletal remains.

117
BIBLIOGRAPHY
Ahlqvist J, and Damsten O (1969) A modification of Kerley's method for the microscopic
determination of age in human bone. J Forensic Sci 14:205–212.
Allen M, Hock J, and Burr D (2004) Periosteum: biology, regulation, and response to
osteoporosis therapies. Bone 35:1003–1012.
Amprino R, and Marotti G (1964) A topographic-quantitative study of bone formation
and reconstruction. In H Blackwood (ed.): Bone and Tooth, Proceedings of the 1st
European Symposium. Oxford: Pergamon Press, pp. 21–33.
Balthazard V, and Lebrun F (1911) Les canaux de Havers de l'os humain aux differents
ages. Ann Hyg Pub Med Leg 15:144–152.
Bell L, Kayser M, and Jones C (2008) The mineralized osteocyte: a living fossil. Am J
Phys Anthropol 137:449–546.
Bonewald L (2006) Mechanosensation and transduction in osteocytes. Int Bone Min Soc
3:7–15.
Boyle W, Simonet W, and Lacey D (2003) Osteoclast differentiation and activation.
Nature 423:337–342.
Bridges P, Blitz J, and Solano M (2000) Changes in long bone diaphyseal strength with
horticultural intensification in west-central Illinois. Am J Phys Anthropol
112:217–238.
Brooks S, and Suchey J (1990) Skeletal age determination based on the os pubis: a
comparison of the Acsadi-Nemeskeri and Suchey-Brooks methods. Hum Evol
5:227–238.
Burger E, and Klein-Nulend J (1999) Mechanotransduction in bone-role of the
lacunocanalicular network. FASEB J 13:S101–S112.
Byrne C, Hardman M, and Nield K (2003) Covering the limb--formation of the
integument. J Anat 202:113–124.
Carpenter R, and Carter D (2008) The mechanobiological effects of periosteal surface
loads. Biomech Model Mechanobiol 7:227–242.

118
Cho H, and Stout S (2003) Bone remodeling and age-associated bone loss in the past: a
histomorphometric analysis of the Imperial Roman skeletal population of Isola
Sacra. In S Agarwal and S Stout (eds.): Bone Loss and Osteoporosis: An
Anthropological Perspective. New York: Kluwer Academic/ Plenum Publishers,
pp. 207–228.
Cho H, Stout S, and Bishop T (2006) Cortical bone remodeling rates in a sample of
African American and European American descent groups from the American
midwest: comparisons of age and sex in ribs. Am J Phys Anthropol 130:214–226.
Cho H, Stout S, Madsen R, and Streeter M (2002) Population-specific histological age-
estimating method: a model for known African-American and European-
American skeletal remains. J Forensic Sci 47:12–18.
Colnot C (2005) Cellular and molecular interactions regulating skeletogenesis. J Cell
Biochem 95:688–697.
Cool S, Hendrikz J, and Wood W (1995) Microscopic age changes in the human occipital
bone. J Forensic Sci 40:789–796.
Crowder C, and Dominguez V (2012) A new method for histological estimation of the
femur. American Academy of Forensic Sciences Annual Meeting podium
presentation, Atlanta, Georgia.
Drapeau M, and Streeter M (2006) Modeling and remodeling responses to normal
loading in the human lower limb. Am J Phys Anthropol 129:403–409.
Drusini A (1987) Refinements of two methods for the histomorphometric determination
of age in human bone. Z Morphol Anthropol 77:167–176.
Dunn O (1964) Multiple contrasts using rank sums. Technometrics 5:241–252.
Ericksen M (1991) Histologic estimation of age at death using the anterior cortex of the
femur. Am J Phys Anthropol 84:171–179.
Franz-Odendaal T, Hall B, and Witten P (2006) Buried alive: how osteoblasts become
osteocytes. Develop Dynam 235:176–190.
Frost H (1987a) Bone "mass" and the "mechanostat': a proposal. Anat Rec 219:1–9.
Frost H (1987b) Secondary osteon population densities: an algorithm for estimating the
missing osteons. Yearb Phys Anthropol 30:239–254.
Frost H, Villanueva A, and Roth H (1960) Measurement of bone formation in a 57 year
old man by means of tetracyclines. Henry Ford Hosp Med Bull 8:239–254.

119
Gartner L, and Hiatt J (2007) Color Textbook of Histology. Philadelphia: Saunders
Elsevier.
Goldman H, McFarlin S, Cooper D, Thomas C, and Clement C (2009) Ontogenetic
patterning of cortical bone microstructure and geometry at the human mid-shaft
femur. Anat Rec 292:48–64.
Hall B, and Miyake T (2000) All for one and one for all: condensations and the initiation
of skeletal development. BioEssays 22:138–147.
Harada A, and Rodan G (2003) Control of osteoblast function and regulation of bone
mass. Nature 15 May 2003 (423):349–355.
Heinrich J, Crowder C, and Pinto D (2012) Proposal and validation of definitions for
intact and fragmented osteons. American Academy of Physical Anthropologists
Annual Meeting poster presentation, Portland, Oregon.
Henriksen K, Neutzsky-Wulff A, Bonewald L, and Karsdal M (2009) Local
communication on and within bone controls bone remodeling. Bone 44:1026–
1033.
Iscan M, and Loth S (1986) Estimation of age and determination of sex from the sternal
rib. In K Reichs (ed.): Forensic Osteology: Advances in the Identification of
Human Remains. Springfield: Charles C. Thomas, pp. 68–89.
Islam A, Glomski C, and Henderson E (1990) Bone lining (endosteal) cells and
hematopoiesis: a light microscopic study of normal and pathologic human bone
marrow in plastic-embedded sections. Anat Rec 227:300–306.
Iwaniec U, Crenshaw T, Schoeninger M, Stout S, and Ericksen M (1998) Methods for
improving the efficiency of estimating total osteon density in the human anterior
mid-diaphyseal femur. Am J Phys Anthropol 107:13–24.
Jowsey J (1960) Age changes in human bone. Clin Orthopaed 17:210–217.
Kayemba-Kay's S, and Hindmarsh P (2006) Catch-up growth: an overview. Pediatr
Endocrin Rev 3:365–378.
Keaveny T, Morgan E, Niebur G, and Yeh O (2001) Biomechanics of trabecular bone.
Annu Rev Biomed Eng 3:307–333.
Kemkes-Grottenhalter A (2002) Ageing through the ages: historical perspectives on age
indicator methods. In R Hoppa and J Vaupel (eds.): Paleodemography: Age
Distributions from Skeletal Samples. Cambridge: Cambridge University Press,
pp. 48–72.

120
Kerley E (1965) The microscopic determination of age in human bone. Am J Phys
Anthropol 23:149–164.
Knothe-Tate M, Adamson J, Tami A, and Bauer T (2004) The osteocyte. Int J Biochem
Cell Biol 36:1–8.
Kronenberg H (2003) Developmental regulation of the growth plate. Nature 423:332–
336.
Larsen C (1997) Bioarchaeology: Interpreting Behavior from the Human Skeleton.
Cambridge: University of Cambridge.
Love J, and Symes S (2004) Understanding rib fracture patterns: incomplete and buckle
fractures. J Forensic Sci 49:1–6.
Lovejoy C, Meindl R, Pryzbeck T, and Mensforth R (1985) Chronological
metamorphosis of the auricular surface of the ilium: a new method for the
determination of adult skeletal age at death. Am J Phys Anthropol 68:15–28.
Lynnerup N, Thomsen J, and Frolich B (1998) Intra- and inter-observer variation in
histological criteria used in age at death determination based on femoral cortical
bone. Forensic Sci Int 91:219–230.
Mackie E, Ahmed Y, Tatarczuch M, Chen K, and Mirams M (2008) Endochondral
ossification: how cartilage is converted into bone in the developing skeleton. Int J
Biochem Cell Biol 40:46–62.
Maggiano I, Schultz M, Kierdorf H, Sosa T, Maggiano C, and Blos V (2008) Cross-
sectional analysis of long bones, occupational activities, and long-distance trade
of the Classic Maya from Xcambo-archaeological and osteological evidence. Am
J Phys Anthropol 136:470–477.
Marotti G (1976) Map of bone formation rate values recorded throughout the skeleton of
the dog. In J Jaworski (ed.): Proceedings of the First Workshop on Bone
Morphology. Ottawa: University of Ottawa Press, pp. 202–207.
Mays S, Ives R, and Brickley M (2009) The effects of socioeconomic status on
endochondral and appositional bone growth, and acquisition of cortical bone in
children from 19th century Birmingham, England. Am J Phys Anthropol
140:410–416.
Moore K, and Agur A (2007) Essential Clinical Anatomy, 3rd edition. Baltimore and
Philadelphia: Lippincott Williams & Wilkins.

121
NetAnatomy (2001) Scholar Educational Systems Inc. February 15th, 2011.
http://www.netanatomy.com.proxy.lib.ohio-state.edu/default.asp.
Nuzzo S, Meneghini C, Braillon P, Bouvier R, Mobilio S, and Peyrin F (2003)
Microarchitectural and physical changes during fetal growth in human vertebral
bone. J Bone Mineral Res 18:760–768.
Orwoll E (2003) Towards an expanded understanding of the role of the periosteum in
skeletal health. J Bone Mineral Res 18:949–954.
Parfitt A (1994) Osteonal and hemi-osteonal remodeling: the spatial and temporal
framework for signal traffic in adult human bone. J Cell Biochem 55:273–286.
Pfeiffer S, Lazenby R, and Chiang J (1995) Brief communication: cortical remodeling
data are affected by sampling location. Am J Phys Anthropol 96:89–92.
Rauch F (2007) Bone accrual in children: adding substance to surfaces. Pediatrics
119:S137–S140.
Robling A, and Stout S (2008) Histomorphometry of human cortical bone: applications to
age estimation. In A Katzenberg and S Saunders (eds.): Biological Anthropology
of the Human Skeleton, 2nd ed. John Wiley and Sons, pp. 149–182.
Robling A, Castillo A, and Turner C (2006) Biomechanical and molecular regulation of
bone remodeling. Annu Rev Biomed Eng 8:455–459.
Rogers L (2001) Chapter 2: Skeletal biomechanics. In: Radiology of Skeletal Trauma,
3rd ed. Elsevier Health Sciences, pp. 17–25.
Ruff C (1987) Sexual dimorphism in human lower limb bone structure: relationship to
subsistence strategy and sexual division of labor. J Hum Evol 16:391–416.
Ruff C (1999) Skeletal structure and behavioral patterns in prehistoric Great Basin
populations. In B Hemphill and C Larsen (eds.): Prehistoric Lifeways in the Great
Basin Wetlands: Bioarchaeological Reconstruction and Interpretation. Salt Lake
City: University of Utah Press, pp. 290–320.
Ruff C (2008) Biomechanical analyses of archaeological human skeletons. In M
Katzenberg and S Saunders (eds.): Biological Anthropology of the Human
Skeleton. John Wiley and Sons, pp. 183–206.
Ruff C, and Hayes W (1983) Cross-sectional geometry of Pecos Pueblo femora and
tibiae-a biomechanical investigation: I. Method and general patterns of variation.
Am J Phys Anthropol 60:359–381.

122
Ruff C, and Jones H (1981) Bilateral asymmetry in cortical bone of the humerus and
tibia-sex and age factors. Hum Biol 53:69–86.
Ruff C, and Larsen C (2001) Reconstructing behavior in Spanish Florida. In C Larsen
(ed.): Bioarchaeology of Spanish Florida: Impact of Colonialism. Gainesville:
The University of Florida Press, pp. 113–145.
Ruff C, Holt B, and Trinkaus E (2006) Who's afraid of the big bad Wolff?: "Wolff's law"
and bone functional adaptation. Am J Phys Anthropol 129:484–498.
Ruff C, Larsen C, and Hayes W (1984) Structural changes in the femur with the
transition to agriculture on the Georgia coast. Am J Phys Anthropol 64:125–136.
Samson C, and Branigan K (1987) A new method of estimating age at death from
fragmentary and weathered bone. In A Boddington, A Garland and R Janaway
(eds.): Death, Decay, and Reconstruction. Manchester: Manchester University
Press, pp. 101–108.
Scheuer L, and Black S (2000) Developmental Juvenile Osteology. London and San
Diego: Academic Press.
Seeman E (2002) Pathogenesis of bone fragility in women and men. Lancet 359:1841–
1850.
Singh I, and Gunberg D (1970) Estimation of age at death in human males from
quantitative histology of bone fragments. Am J Phys Anthropol 33:373–382.
Stephenson P, and Seedhom B (1999) Cross-sectional geometry of the human femur in
the mid-third region. Proc Instn Mech Engrs 213:159–166.
Stout S (1982) The effects of long-term immobilization on the histomorphometry of
human cortical bone. Calcif Tissue Int 34:337–342.
Stout S (1986) The use of bone histomorphometry in skeletal identification: the case of
Francisco Pizarro. J Forensic Sci 31:296–300.
Stout S (1989) Histomorphometric analysis of human skeletal remains. In K Kennedy
and M Iscan (eds.): Reconstruction of Life from the Skeleton. New York: Alan R.
Liss, pp. 41–52.
Stout S, and Paine R (1994) Brief communication: bone remodeling rates: a test of an
algorithm for estimating missing osteons. Am J Phys Anthropol 93:123–129.

123
Stout S, Porro M, and Perotti B (1996) Brief communication: a test and correction of the
clavicle method of Stout and Paine for histological age estimation of skeletal
remains. Am J Phys Anthropol 100:139–142.
Szulc P, Seeman E, Duboeuf F, Sornay-Rendu E, and Delmas P (2006) Bone fragility:
failure of periosteal apposition to compensate for increased endocortical
resorption in postmenopausal women. J Bone Mineral Res 21:1856–1863.
Taylor D, Hazenberg J, and Lee T (2007) Living with cracks: damage and repair in living
bone. Nature Materials 6:263–268.
Tersigni M (2005) Serial long-bone histology: inter- and intra-bone age estimation.
Doctoral Dissertation: The University of Tennessee, Knoxville.
Thompson D (1979) The core technique in the determination of age at death in skeletons.
J Forensic Sci 24:902–915.
Trochim W, and Donnelly J (2007) The Research Methods Knowledge Base, 3rd ed.
Atomic Dog.
Ubelaker D (1974) Reconstruction of demographic profiles from ossuary skeletal
samples; a case study from the Tidewater Potomac: Smithsonian contributions to
anthropology: number 18. Washington DC: Smithsonian Institution Press.
Villa C, and Lynnerup N (2010) Technical note: a stereological analysis of the cross-
sectional variability of the femoral osteon population. Am J Phys Anthropol
142:491–496.
Wu K, Schubeck K, Frost H, and Villanueva A (1970) Haversian bone formation rates
determined by a new method in a Mastodon, and in human diabetes mellitus and
osteoporosis. Calcif Tissue Res 6:204–219.
Yellowley C, Li Z, Zhou Z, Jacobs C, and Donahue H (2000) Functional gap junctions
between osteocytic and osteoblastic cells. J Bone Mineral Res 15:209–217.

124
Appendix A: Total Ericksen Sample Data
Shaded boxes indicate the 200 Ericksen samples selected for this research project
ID # AGE SEX ANCESTRY CAUSE OF DEATH
1 47 M White Chronic brain syndrome. Trephination
2 44 F White GSW suicide following cancer diagnosis. Many signs
of premature aging in several organs
3 50 M Black Coronary arteriosclerotic heart disease
5 71 M White Renal failure. Arteriosclerotic heart disease
6 85 F White Coronary thrombosis
7 46 M White Unknown
8 91 F White Acute infarction. Right unhealed femoral neck
fracture with compression screw
9 77 M White Unknown
10 85 F White Bronchopneumonia
11 48 M White Acute myocardial infarction
13 81 F White Coronary arteriosclerosis
14 49 M Black Exposure and alcoholism
15 89 F White Unknown
17 76 M White Unknown
18 47 F White Hepatic coma
19 53 F White Heart
20 80 F White Congestive heart failure
21 71 M White Unknown
22 81 F White Natural causes
23 70 M White Carcinoma of pancreas
24 59 F White Sclerosis of liver
25 77 F White Cancer (?)
26 84 F White Cardiac arrest
27 68 M White Acute coronary insufficiency. Arteriosclerotic heart
disease
28 68 F White Pneumonia. Heart greatly enlarged
29 28 M White Hypoxemia. Had tracheotomy
101 75 M White Cardiorespiratory arrest
102 76 F White Generalized arteriosclerosis

125
103 81 M White Unknown
104 65 M White Respiratory arrest
105 65 M White Coronary artery disease
106 83 F White Unknown
107 58 M Black Hepatic, cirrhosis of liver
108 91 F White Unknown
109 65 M White Myocardial infarction. Diabetes mellitus
110 65 F White Congestive heart failure
111 49 M White Coronary artery disease
112 72 F White Heart attack. Had replaced abdominal aorta and
common iliacs with reaming of carotids
113 66 M White Heart attack
114 43 F White Unknown
115 77 M White Respiratory failure
116 79 M White Septic shock
117 65 M White Pulmonary embolism. Heart failure
118 66 F White Gangrene of right foot
119 71 M White Multiple cancer metastases
120 78 F White Heart attack
121 60 M White Coronary occlusion
122 63 F White Ovarian carcinoma
123 44 M White Cardiorespiratory arrest. Chronic brain syndrome
124 65 F White Cardiac arrest
125 30 M Black Diabetic acidosis and coma
126 74 F White Cancer
127 50 M White Alcoholic liver disease
128 56 M Black Intracerebral hemorrhage. Hypertensive
cardiovascular and chronic renal diseases
129 62 M White Bronchopneumonia
130 80 F White Congestive heart failure
132 47 M Black Hypertensive cardiovascular disease
133 76 F White Cancer of heart
134 61 F White Gastric hemorrhage from penetrating gastric ulcer
135 65 F White Respiratory arrest
136 48 M White Dropped dead without previous signs
201 80 F White Unknown
202 53 F White Renal failure. Chronic alcoholism
203 69 F White Unknown
204 68 M White Pulmonary infarction
205 50 F White Unknown

126
206 76 M White Metastatic cancer of colon to liver
207 20 M White Striated carcinoma
208 74 M White Respiratory and cardiac arrest
209 78 F White Liver and colon cancer (5 years), partial colectomy
210 72 F White Arteriosclerotic heart disease
211 86 F White Myocardial infarction
212 56 F White Cardiorespiratory failure. Encephalomalacia
213 52 M White Cardiac arrest
214 67 M White Cardiac arrest
215 78 F White Unknown
216 69 M White Cancer
217 64 M White Unknown
218 83 F White Unknown
219 77 M White Generalized arteriosclerosis
220 63 M White Acute myocardial infarction
221 67 F White Coma and seizures
222 79 M White Unknown
223 55 F White Respiratory arrest
224 63 F White Carcinoma
225 84 M White Cardiovascular accident
226 58 M White Occlusive coronary artery disease. Arteriosclerosis
227 79 F White Heart disease
228 65 M White Cardiogenic shock
233 88 F White Cerebrovascular accident
250 74 M White Cardiorespiratory arrest, long history of hypertension
251 75 F White Unknown
252 68 F White Occlusive coronary artery disease. Arteriosclerosis
253 87 F White Breast cancer
254 80 F White Bronchopneumonia. Hip prosthesis (b) intact side
255 80 F White Cardiac arrhythmia
256 82 F White Unknown. Left femur had subcapital neck fracture
with head fibrosed into acetabulum (a) intact side
257 69 F White Adenocarcinoma. Colostomy
258 79 F White Arteriosclerotic heart disease
259 69 M White Gram negative sepsis. Hip prosthesis (a) intact side
301 81 F White Left hip fracture with cardiac complications and
congestive heart failure. Specimen from intact side
302 65 M White Cardiovascular heart disease
303 77 M White Prostate cancer. Hypertension
304 69 F White Chronic lymphatic leukemia

127
305 62 F White Cancer of brain, lung
306 77 F White Cancer of breast. Cardiopulmonary failure
307 70 F White Respiratory failure
308 59 M White Lung cancer
309 71 M White Metastatic cerebellar tumor. Cancer of lower left lobe
310 74 F White Occlusive coronary artery disease
311 60 M White Cardiovascular heart disease
312 74 M White Myocardial infarction. Arteriosclerotic heart disease.
Ventricular fibrillation. Coronary insufficiency
313 78 F White Malnutrition presumably from cancer
314 84 M White Acute cerebral hemorrhage. Arteriosclerosis and
hypertension
315 67 M White Acute coronary occlusion
316 71 F White Lung cancer
317 54 M White Ventricular fibrillation. Coronary arteriosclerosis.
Bilateral hip prostheses
318 62 F White Acute myocardial disorder. Uremia. Angina,
congestive heart failure, and longstanding diabetes
319 71 M White Cardiovascular heart disease. Stroke
320 85 F White Acute myocardial infarction
321 65 F White Coronary arteriosclerosis with coronary
insufficiency. Stroke
322 52 F White Ovarian cancer
323 54 M White Pneumonia. Cerebral contusion and skull fracture
from a fall downstairs. Acute and chronic alcoholism
324 57 M Black Lung cancer
325 68 F White Acute myocardial disorder
326 70 F White Respiratory failure. Hip prosthesis (b) intact side
327 35 F White Cerebral herniation. Cancer. Five months pregnant
329 56 M Black Acute massive coronary infarction. Arteriosclerotic
cardiovascular disease
330 75 F White Cardiovascular accident. Pulmonary embolism
401 89 M White Cardiac arrest. Arteriosclerotic cardiovascular and
renal disease
402A 86 F White Generalized sepsis. Hip fracture (a) intact side
403 62 M White Cancer of lungs with brain metastases
404 64 F White Bilateral pneumonia
405 75 M White Myocardial infarction. Arteriosclerotic heart disease
406 53 F White Inanition. Cachexia. Gastric cancer
407 76 F White Chronic obstructive pulmonary disease. Congestive
heart failure

128
408 59 M White Acute myocardial infarction
409 60 F White Respiratory arrest. Intracranial hemorrhage
410 66 F White Cancer of esophagus
411 69 F White Bronchopneumonia. Acute myoleukemia
412 51 M White Meningitis due to pneumonia
413 61 M White Cardiopulmonary arrest
414 79 F White Coronary occlusion. Heart failure. Hip prosthesis (a)
intact
415 54 M White Metastatic cancer
416 66 F White Respiratory arrest. Lung cancer
417 79 F White Cardiovascular arrest. Pulmonary embolism
418 59 M White Cardiac arrest. Myocardial infarction due to coronary
artery disease
419 45 F White Advanced respiratory failure. Pancreatitis. Laennec's
cirrhosis of liver
420 75 F White Cerebrovascular thrombosis. Arteriosclerotic heart
disease
421 75 M White Subarachnoid hemorrhage. Arterial hypertension
422 68 F White Respiratory insufficiency
423 71 M White Cardiovascular heart disease. Stroke
424 84 F White Cerebral hemorrhage
425 92 M White Basilar artery insufficiency. Respiratory arrest
427 58 F White Cancer of esophagus
429 89 F White Cardiopulmonary arrest due to aspiration.
Pneumonitis. Hip prosthesis: no intact side
501 52 M Asian Respiratory failure (2 days). Widespread
bronchogenic cancer (2.5 years)
502 70 M White Arteriosclerotic heart disease
503 63 M White Acute myocardial infarction. Arteriosclerotic heart
disease. Diabetic
504 83 M White
Arteriosclerotic heart disease. Congestive heart
failure. Chronic pulmonary disease. Operated 10 days
before death for urinary retention
505 73 F White Cardiopulmonary arrest. Cancer of colon. Malignant
pulmonary effusions. Ill several weeks
506 66 F White Cardiorespiratory arrest. Cerebrovascular accident
507 28 M White Cardiorespiratory arrest. Recurrent brain astrocytoma
508 74 M White Ventricular fibrillation due to septicemia (1 month)
509 62 M White Acute myocardial infarction. Congestive heart failure
510 81 F White Cerebrovascular accident (7 months). Essential
hypertension (years). GI bleeding. Diverticulosis

129
511 72 M White Acute respiratory failure. Cardiovascular accident.
Diabetes. Arteriosclerotic disease
512 62 F White Respiratory failure. Pneumonia. Metastasis from
frontoparietal tumor
513 50 M White Metastatic cancer from malignant carcinoid
514 56 M White Cardiac arrhythmia. Arteriosclerotic heart disease
515 69 F White Myeloma
516 91 F White Acute myoplastic leukemia. Chronic
myeloproliferative leukemia
517 75 F White Pulmonary emphysema
518 79 F White Hypertensive arteriosclerotic heart disease (10 years)
519 52 F White Hypertensive cardiovascular disease
520 58 F White GI hemorrhage. Gastric ulcer (9 years)
521 77 M White
Acute cardiorespiratory failure. Coronary artery
disease. Old myocardial infarct. Hypertensive
cardiovascular disease. Diabetes mellitus
522 68 M Black Brainstem infarct. Cerebrovascular accident.
Arteriosclerosis. Salivary gland carcinoma
523 74 M White Fibrosarcoma
524 74 F Black Chronic pyelonephritis-uremia (8 years)
525 71 M White Acute myocardial infarct. Arteriosclerotic heart
disease (20 years)
604 52 M White Metastatic liver and intra-abdominal metastases (6
months) due to colon cancer (9 months)
610 56 F White Intracerebral hemorrhage (48 hours). Hip fracture
and pin (intact side)
612 58 M White Acute and chronic myocardial disease
615 57 F White Gastrointestinal hemorrhage. Liver cirrhosis. Chronic
alcoholism
616 57 F White CO asphyxia. Ran car in garage while inside it
618 59 M White Respiratory failure from chronic pulmonary disease.
Not related: inactive pulmonary TB
619 60 F White Cerebrovascular accident 2 days before
620 53 F White Congestive heart failure
621 50 F White Carcinomatosis (3 months). Lung cancer (8 months)
624 60 M White End stage renal failure. Metastatic colon cancer
701 33 M White Elavil overdose
704 48 M White Hepatic failure. Laennec's cirrhosis. Chronic
alcoholism
706 61 F White Cardiopulmonary arrest. Non-Hodgkin’s lymphoma
with bilateral pulmonary infiltration
710 63 F White Mesothelioma of abdomen

130
711 54 F Black Ischemic heart disease (4 years). Hypertensive
cardiovascular disease (5 years)
715 51 F White Carcinomatosis. Death sudden
717 63 F White
Diffuse bilateral bronchopneumonia. Metastatic
adenocarcinoma from pulmonary and cerebral
carcinoma
720 53 F White Respiratory failure. Metastatic breast cancer. Femoral
neck pin (a) intact
801 80 M White Ventricular fibrillation. Cardiomyopathy (7 years)
802 79 M White Cardiovascular arrest
803 95 F White
Chronic renal failure. Acute diverticulitis with
bacteremia and hemorrhage (3+ weeks). Hip
prosthesis (a) intact
804 82 M White Acute coronary insufficiency. Arteriosclerotic heart
disease
805 74 M White Acute cardiac arrest after massive cerebral infarct.
Hypertensive disease
806 80 M White Colon cancer with metastases (20 months)
807 68 M White Cardiac arrest from myocardial infarction
808 93 F White Cardiorespiratory arrest after 24 hour pneumonia.
Arteriosclerotic heart disease
809 83 M White Carcinoma of prostate
810 64 M White Hepatocellular cancer some months.
811 76 F White
Respiratory failure. Chronic obstructive pulmonary
disease. Lifelong respiratory disease including TB at
one time
812 93 F White Terminal myeloma
813 74 F White Bronchial pneumonia
814 88 F White Acute myocardial infarct. Breast cancer (15 years).
Diaphragmatic hiatal hernia
815 81 F White Cardiopulmonary arrest. Congestive heart failure
816 63 M White Coronary artery disease. Hypertensive heart disease
817 77 F White Cardiovascular accident from arteriosclerotic
vascular disease
818 63 F White Septic shock from chemotherapy for multiple
myeloma. Myeloma kidney
819A 80 F Black Chronic renal failure. Also congestive heart failure.
Anemia. Femoral subcapital fracture (a) intact
820 72 F White Acute respiratory failure from emphysema from
chronic bronchitis. Manic depressive psychosis
821 65 M White Cardiopulmonary arrest. Probable arrhythmia. Had
heart valve replacement

131
822 83 M White Generalized arteriosclerosis. Chronic obstructive
lung disease
823 48 M White Cardiorespiratory arrest from lung cancer (8 months)
824 82 F White Cerebral hemorrhage
825 89 M White Probable metastases from prostate cancer
826 56 F White Metastatic ovarian carcinoma
901 86 F White Intestinal obstruction. Colon cancer (months). Severe
rheumatoid arthritis. Femoral neck pin (b) intact
902 92 F White Acute congestive heart failure. Bronchopneumonia
903 80 F White Arteriosclerotic hypertensive heart disease
904 80 F White Cardiorespiratory arrest from coronary heart disease
905 84 F White Cardiac arrest. Chronic arteriosclerotic heart disease
906 85 M White Arteriosclerotic heart disease (5 years)
907 84 F White Left middle cerebral artery occlusion (2 weeks). Hip
prosthesis (a) intact
908B 84 F White
Cardiac arrest from congestive heart failure.
Arteriosclerotic heart disease. Diabetes mellitus. Hip
prosthesis (b) intact
909B 79 M White
Respiratory failure from chronic obstructive
pulmonary disease. Arteriosclerotic. Senility.
Femoral neck fracture, pinned (b) intact side
910 74 F White Cardiorespiratory failure. Subarachnoid hemorrhage
911 89 F White Cardiac arrest. Coronary heart disease (years)
912 84 M White
Pneumonitis from atelectatic collapsed lung lobe
from chronic obstructive lung disease (50 years).
Congestive heart failure
913 85 F White Bronchopneumonia after cerebrovascular thrombosis
914 61 M White Coronary occlusion from coronary heart disease.
Diabetes mellitus. Chronic congestive heart failure
915 90 F White Myocardial infarction from arteriosclerotic heart
disease. Subcapital hip fracture (b) intact side
916 78 F White Congestive heart failure
918 60 M White Arteriosclerotic cardiovascular disease
919 92 F White Cerebral thrombosis. Hypertensive arteriosclerotic
cardiovascular disease
920 68 M White Hepatic cirrhosis
921A 96 F White Cardiopulmonary arrest. Possible metabolic senility.
Femoral neck pin (a) intact
922 94 F White Myocardial failure. Arteriosclerosis. Coronary
disability
923B 80 F White Cerebral hemorrhage with brainstem dysfunction.
Femoral neck fracture not pinned (b) intact

132
924 80 F White Respiratory failure from chronic bronchitis. Seizures.
Femoral neck fracture and pin (a) intact
925 80 M White
Cardiopulmonary arrest. Myocardial infarct.
Arteriosclerosis and coronary heart disease (5 years).
Burst abdominal aortic aneurysm
926 58 M White Congestive heart failure from arteriosclerotic heart
disease. Renal failure
927 80 M White
Cardiac arrest. Myocardial infarction. Arterial heart
disease (27 years). Essential hypertension.
Congestive failure
1005 84 M White Arteriosclerotic heart disease
1006 73 M White Arteriosclerotic heart disease
1010 64 M White Acute coronary insufficiency from arteriosclerotic
heart disease. Contributory: essential hypertension
1014 71 M White Cardiopulmonary arrest due to heart failure.
Contributory: sepsis, kidney failure, seizures
1017 59 M White Arteriosclerotic cardiovascular disease
1019 79 M White Pneumonitis (24 hours). Contributory: paraplegia,
secondary cord compression
1021 63 M White Cardiorespiratory arrest. Contributory: chronic
alcoholism, cirrhosis, recurrent pancreatitis
1022 84 M White Generalized arteriosclerosis
1023 79 M White Arteriosclerotic heart disease
1026 52 M White Acute myocardial infarction
1103 69 M White Pneumonia after left cerebral infarct from
hypertension
1107 64 F White Cardiac arrest
1109 69 M White Respiratory arrest. Pneumonia. Chronic lymphocytic
leukemia
1111 62 M White Cardiac arrest. Cirrhosis (3 years)
1112 81 F White Pneumonia. Congestive heart failure. Contributory:
acute abdomen
1113 39 M White Metastatic melanoma (6.5 years)
1114 64 F White Myeloma (3 years). Contributory: pancytopenia,
internal bleeding
1115 92 F White Myocardial failure (days). Arteriosclerotic heart
disease (years)
1117 72 F Black Cardiac arrest. Arteriosclerotic heart disease. Renal
failure. Chronic pulmonary disease
1119 62 F White
Respiratory arrest after severe cerebral anoxic insult
from aspiration of meat. Prolonged (1+ months)
anoxia and coma

133
1121 55 M White Diabetic ketoacidosis with coma (weeks). Diabetes.
Contributory: alcoholism
1122 64 F White Increasing intracerebral pressure from subarachnoid
hemorrhage (1 week)
1123 83 M White Cardiac arrest after myocardial infarction
1124 84 M White
Cardiorespiratory arrest. Arteriosclerotic heart
disease. Generalized arteriosclerosis. Femoral neck
fracture with a pin (b) intact
1125 32 M White
Probable myocardial infarction. Arteriosclerotic heart
disease (5+ years). Chronic glomerulonephritis (10
years). Chronic renal failure.
1202 77 M White Respiratory failure from congestive heart failure.
Rheumatoid arthritis
1203 81 M White
Cardiac arrest and respiratory failure. Cardiac
arrhythmia and myocardial infarction. Coronary
artery disease. Cerebral hypoxia and coma
1205 37 M White Undetermined (but assumed natural causes)
1206 67 F White Ruptured abdominal aneurysm due to arteriosclerosis
1208 73 M White Acute renal failure. Chronic congestive heart failure
(7 months). Arteriosclerosis (4 years)
1213 70 M White
Chronic obstructive pulmonary disease (3 years).
Pulmonary emphysema (10 years). Cigarettes (40
years). Contributory: coronary heart disease,
coronary pulmonale
1214 76 M White Cardiac arrest from arteriosclerotic heart disease (5
years). Contributory: myocardial infarction
1215 75 M White Acute respiratory failure. Pneumonitis. Longstanding
cerebrovascular disease
1217 78 M White Cardiac arrest. Arteriosclerotic heart disease (8 years)
1218 97 M White Cardiorespiratory collapse after stroke and
pneumonia (1 week). Senility
1220 49 M White Cardiopulmonary arrest. Asphyxia
1222 75 M White Brainstem hemorrhage from hypertension. Right hip
prosthesis (b) intact side
1224 56 M White Acute myocardial infarction (1 day)
1301 80 M White Acute myocardial infarction due to chronic
myocardial disease
1305 83 F White
Acute myocardial infarction (48 hours) due to
coronary sclerosis. Other: essential hypertension,
diabetes mellitus
1306 68 M White
Cardiorespiratory failure (8 days) due to cardiac
arrhythmia (8 days) due to acute myocardial
infarction. Other: myasthenia gravis

134
1308 96 F White Cardiopulmonary arrest from hypotension.
Dehydration. Probable aspiration pneumonia
1311 73 M White Cardiac failure from cardiomyopathy from ischemic
heart disease and renal insufficiency
1312 60 M White Acute myocardial disease
1313 64 M White Cardiac arrest. Cardiomyopathy
1314 64 M White Pulmonary arrest from chronic obstructive
pulmonary disease. Peripheral neuropathy
1316 83 F Black Congestive heart failure from hypertensive
cardiovascular disease
1319 68 F White Respiratory arrest from emphysema
1323 42 M Black Cardiopulmonary arrest from right intracerebral
hemorrhage
1325 74 F White Asystole due to arteriosclerotic heart disease
1401 86 F White Cardiorespiratory failure from acute myocardial
infarction from coronary heart disease
1402 72 F White Cardiopulmonary arrest. Cardiomyopathy. Ischemic
heart disease. Arteriosclerosis
1403 74 M White
Cardiopulmonary arrest from severe congestive heart
failure from emphysema. Sick sinus syndrome with
pacemaker
1404 88 M White Hypovolemic shock from ruptured aortic aneurysm
1405 85 M White Cardiorespiratory arrest from congestive heart failure
1406 79 F White Gastrointestinal bleeding. Contributory: obstructive
pulmonary disease, hypothyroidism
1410 82 F White Ventricular arrhythmia from acute myocardial
infarction. Ischemic heart disease. Arteriosclerosis
1412 83 M White Bronchitis from chronic obstructive lung disease
1414 68 F White
Acute anterior myocardial infarction from
arteriosclerotic coronary heart disease. High blood
pressure. Diabetes mellitus. Old myocardial infarct
1416 83 F White Cardiac arrest from myocardial infarction. Coronary
artery disease
1418 56 F White Hypertensive cardiovascular disease
1419 73 M White Septicemia from liver failure from portal cirrhosis
1420 71 F White Acute myocardial heart disease
1421 85 F White Acute hemorrhagic pancreatitis
1423 88 F White Acute myocardial disease
1424 87 F White Cardiac arrest from myocardial infarction from
arteriosclerosis
1426 74 M White Arteriosclerotic cardiovascular disease

135
Appendix B: Research Sample Biomechanical Data

136
AG
EID
#S
cale
TAC
AM
AX
bar
Ybar
IxIy
JIx
/IyIm
axIm
inIm
x/Im
nTh
eta
ZxZy
ZpM
axX
rad
Max
Yrad
442
47.2
pxl/m
m40
7.19
431
2.95
694
.238
29.6
0322
.449
1415
7.18
711
446.
368
2560
3.55
51.
237
1423
0.29
011
373.
265
1.25
1205
-80.
796
1011
.848
982.
739
1652
.187
11.6
4740
13.9
9140
715
47.2
pxl/m
m63
4.63
839
6.02
023
8.61
822
.166
25.7
5228
660.
462
2743
0.19
856
090.
659
1.04
530
283.
415
2580
7.24
41.
1734
46-5
2.97
716
85.6
5017
77.8
5929
28.8
0315
.428
8017
.002
6085
647
.2px
l/mm
467.
206
203.
853
263.
354
23.7
6122
.007
1366
6.09
710
464.
960
2413
1.05
81.
306
1419
8.09
499
32.9
641.
4293
9169
.319
863.
215
876.
624
1582
.271
11.9
3780
15.8
3160
918
47.2
pxl/m
m37
9.39
818
4.14
719
5.25
121
.912
21.6
1876
90.9
2093
11.2
4517
002.
165
0.82
693
92.1
8676
09.9
791.
2341
9412
.305
639.
520
782.
334
1225
.372
11.9
0190
12.0
2610
779
47.2
pxl/m
m66
0.41
647
2.66
618
7.74
923
.351
25.0
0135
000.
230
3026
5.35
165
265.
581
1.15
635
137.
202
3012
8.37
91.
1662
4980
.482
1969
.166
2034
.501
3271
.293
14.8
7610
17.7
7410
4811
47.2
pxl/m
m64
9.53
847
5.99
817
3.54
021
.457
23.9
0336
882.
910
2701
4.44
763
897.
356
1.36
536
985.
982
2691
1.37
51.
3743
62-8
4.19
521
68.5
8019
57.8
9432
21.0
8713
.797
7017
.007
9049
1447
.2px
l/mm
679.
787
449.
129
230.
658
30.5
9422
.288
3330
2.74
731
605.
441
6490
8.18
71.
054
3333
0.50
731
577.
681
1.05
5508
82.7
7020
95.8
1621
77.6
3132
58.2
0714
.513
7015
.890
1089
1547
.2px
l/mm
508.
813
318.
860
189.
952
31.9
8023
.853
1774
7.73
618
190.
453
3593
8.18
90.
976
1819
1.00
617
747.
183
1.02
5008
-2.0
2412
84.4
8413
34.1
6921
16.1
9713
.634
3013
.817
0076
1747
.2px
l/mm
597.
334
468.
389
128.
945
28.9
6323
.544
3168
4.83
723
802.
098
5548
6.93
51.
331
3172
9.46
223
757.
473
1.33
5557
-85.
709
1849
.208
1766
.243
2905
.757
13.4
7610
17.1
3430
4718
47.2
pxl/m
m53
9.97
032
5.40
721
4.56
324
.038
24.7
6226
254.
969
1592
5.93
742
180.
905
1.64
926
563.
578
1561
7.32
71.
7009
0480
.334
1501
.712
1233
.100
2378
.672
12.9
1540
17.4
8340
5319
47.2
pxl/m
m50
5.44
337
3.26
213
2.18
122
.391
24.3
3920
823.
947
1780
8.93
238
632.
879
1.16
921
468.
282
1716
4.59
61.
2507
3067
.236
1357
.203
1369
.336
2230
.893
13.0
0550
15.3
4330
8122
47.2
pxl/m
m49
6.31
832
3.69
117
2.62
731
.597
24.6
6018
427.
641
1784
1.20
336
268.
844
1.03
320
753.
959
1551
4.88
61.
3376
80-4
8.21
311
70.5
6312
92.8
5021
30.3
9213
.799
9015
.742
5077
2547
.2px
l/mm
606.
292
332.
297
273.
995
22.2
4519
.547
1916
6.45
428
658.
817
4782
5.27
10.
669
2899
1.70
118
833.
570
1.53
9363
10.4
3011
08.1
0117
40.8
1326
07.0
5316
.462
9017
.296
7068
2747
.2px
l/mm
534.
973
410.
627
124.
346
26.5
3022
.558
2288
6.31
020
673.
385
4355
9.69
51.
107
2333
0.11
120
229.
584
1.15
3267
67.7
6915
12.3
2215
79.4
8724
35.1
8513
.088
7015
.133
2075
101
47.2
pxl/m
m60
6.40
138
8.75
421
7.64
728
.089
23.7
0028
002.
697
2408
0.82
152
083.
517
1.16
328
249.
111
2383
4.40
61.
1852
2476
.334
1631
.006
1716
.382
2774
.541
14.0
3000
17.1
6900
7610
247
.2px
l/mm
586.
447
239.
059
347.
388
24.0
8025
.839
1899
8.26
717
724.
628
3672
2.89
51.
072
2028
2.98
016
439.
915
1.23
3764
54.6
7711
96.5
7412
32.8
5321
49.8
2914
.376
9015
.877
2081
103
47.2
pxl/m
m65
0.67
543
3.68
821
6.98
732
.372
24.5
9328
089.
019
3184
4.99
959
934.
018
0.88
232
509.
343
2742
4.67
51.
1854
05-2
1.19
018
00.8
9721
23.1
6630
73.9
8414
.998
8015
.597
2065
104
47.2
pxl/m
m67
8.71
529
4.01
138
4.70
423
.503
23.7
2320
501.
857
2721
5.40
247
717.
259
0.75
327
272.
281
2044
4.97
81.
3339
35-5
.237
1253
.028
1777
.563
2602
.754
15.3
1050
16.3
6180
6510
547
.2px
l/mm
707.
081
424.
538
282.
543
22.7
2223
.183
3372
4.43
832
758.
389
6648
2.82
71.
029
3627
0.00
430
212.
823
1.20
0484
-49.
589
2018
.092
2173
.140
3315
.721
15.0
7420
16.7
1100
8310
647
.2px
l/mm
502.
251
301.
183
201.
067
25.3
1723
.184
1708
5.58
917
395.
356
3448
0.94
50.
982
1879
5.28
815
685.
658
1.19
8247
-42.
142
1118
.914
1292
.940
2053
.207
13.4
5410
15.2
6980
5810
747
.2px
l/mm
615.
046
479.
120
135.
927
26.8
4921
.143
2713
0.94
529
788.
951
5691
9.89
60.
911
3110
8.45
825
811.
438
1.20
5220
-29.
941
1880
.628
2023
.874
2960
.348
14.7
1880
14.4
2650
9110
847
.2px
l/mm
505.
508
306.
269
199.
239
28.6
1022
.245
1694
1.52
118
599.
063
3554
0.58
40.
911
1875
2.65
316
787.
931
1.11
7032
16.2
3610
53.4
8613
43.0
8220
99.0
8013
.848
0016
.081
4065
109
47.2
pxl/m
m58
0.68
743
1.89
914
8.78
829
.530
25.0
0224
644.
668
2544
6.97
550
091.
643
0.96
825
825.
353
2426
6.29
01.
0642
4829
.514
1728
.616
1784
.167
2696
.675
14.2
6270
14.2
5690
6511
047
.2px
l/mm
465.
892
331.
123
134.
770
30.3
9023
.126
1846
8.40
114
038.
662
3250
7.06
31.
316
1850
7.69
613
999.
367
1.32
2038
84.6
4312
46.2
7211
77.8
1319
66.7
2511
.919
3014
.818
9066
113
47.2
pxl/m
m66
4.82
148
2.21
118
2.61
030
.924
24.2
7635
621.
711
3030
9.52
065
931.
231
1.17
535
684.
954
3024
6.27
71.
1798
1383
.810
2072
.726
2096
.440
3295
.616
14.4
5760
17.1
8590
6511
747
.2px
l/mm
683.
035
489.
223
193.
812
30.4
4321
.874
4144
5.94
428
465.
168
6991
1.11
31.
456
4147
8.59
228
432.
521
1.45
8843
-87.
133
2330
.058
2048
.412
3439
.685
13.8
9620
17.7
8750
7111
947
.2px
l/mm
559.
978
374.
148
185.
830
31.9
4222
.807
2682
6.15
218
813.
572
4563
9.72
31.
426
2758
0.05
818
059.
666
1.52
7163
-73.
656
1632
.730
1454
.921
2519
.535
12.9
3100
16.4
3020
7812
047
.2px
l/mm
550.
870
328.
241
222.
629
29.1
9721
.404
2030
2.28
819
997.
983
4030
0.27
11.
015
2043
1.37
719
868.
894
1.02
8310
-61.
376
1219
.567
1472
.760
2300
.779
13.5
7860
16.6
4710
6012
147
.2px
l/mm
696.
816
428.
154
268.
663
34.6
6924
.678
3752
3.75
129
296.
647
6682
0.39
81.
281
3776
7.78
929
052.
609
1.29
9979
-80.
367
2172
.668
1959
.672
3328
.002
14.9
4980
17.2
7080
6512
447
.2px
l/mm
456.
675
313.
299
143.
376
34.2
8323
.159
1554
4.95
614
452.
020
2999
6.97
61.
076
1565
3.53
614
343.
440
1.09
1338
-73.
269
1146
.639
1148
.672
1854
.670
12.5
8150
13.5
5700
3012
547
.2px
l/mm
552.
915
411.
607
141.
307
32.5
1421
.723
2704
6.64
019
298.
410
4634
5.05
01.
401
2705
9.95
919
285.
091
1.40
3154
87.6
2817
86.2
6115
14.7
8825
47.9
0012
.740
0015
.141
5074
126
47.2
pxl/m
m51
9.29
131
3.86
720
5.42
530
.141
24.4
7617
277.
011
1865
8.97
435
935.
984
0.92
618
684.
174
1725
1.81
01.
0830
277.
622
1096
.463
1370
.379
2116
.102
13.6
1590
15.7
5700
5012
747
.2px
l/mm
646.
717
423.
832
222.
886
28.1
7023
.625
3616
9.87
725
186.
783
6135
6.66
11.
436
3753
7.45
423
819.
207
1.57
5932
71.5
9519
33.6
2516
99.2
0931
27.0
8014
.822
7018
.705
7056
128
47.2
pxl/m
m64
7.45
145
9.37
918
8.07
332
.621
21.9
0235
521.
611
2722
9.21
662
750.
827
1.30
535
862.
341
2688
8.48
61.
3337
43-7
8.76
420
17.0
4219
28.8
6431
78.7
9314
.116
7017
.610
7062
129
47.2
pxl/m
m66
5.42
146
6.36
519
9.05
732
.177
25.1
5036
552.
162
2811
0.33
264
662.
495
1.30
036
775.
632
2788
6.86
31.
3187
44-8
0.87
721
22.3
1619
26.3
2932
49.1
9914
.592
7017
.222
8080
130
47.2
pxl/m
m49
6.23
029
3.94
420
2.28
528
.822
23.1
3516
945.
216
1637
3.19
433
318.
410
1.03
519
065.
751
1425
2.65
91.
3376
9848
.413
1159
.099
1266
.136
2002
.440
12.9
3160
14.6
1930
4713
247
.2px
l/mm
673.
387
520.
889
152.
498
26.7
7724
.799
3474
3.99
734
232.
830
6897
6.82
71.
015
3504
6.40
033
930.
427
1.03
2890
58.6
3121
25.6
7922
34.3
8334
06.0
6815
.320
9016
.344
9076
133
47.2
pxl/m
m71
4.55
033
2.14
838
2.40
327
.594
21.9
7528
744.
449
3024
9.03
058
993.
479
0.95
031
847.
520
2714
5.95
91.
1731
9635
.668
1731
.014
1892
.102
3038
.694
15.9
8700
16.6
0560
4813
647
.2px
l/mm
600.
730
490.
559
110.
172
23.2
0523
.777
3142
7.03
326
178.
737
5760
5.77
01.
200
3419
7.26
223
408.
508
1.46
0890
59.5
5418
43.2
9818
54.6
0829
86.3
4614
.115
5017
.049
3069
203
47.2
pxl/m
m46
4.25
230
4.28
015
9.97
224
.280
21.2
5417
341.
519
1375
9.13
631
100.
654
1.26
018
079.
318
1302
1.33
61.
3884
38-6
7.54
711
53.1
4711
35.3
9219
04.2
4012
.118
4015
.038
4068
204
47.2
pxl/m
m55
3.78
841
8.94
213
4.84
529
.589
18.8
9725
862.
949
2122
1.25
147
084.
201
1.21
925
922.
505
2116
1.69
61.
2249
7383
.578
1560
.886
1588
.428
2577
.501
13.3
5990
16.5
6940
5020
547
.2px
l/mm
520.
563
373.
022
147.
541
26.9
3727
.296
2288
5.56
918
213.
448
4109
9.01
81.
257
2366
3.94
817
435.
069
1.35
7262
69.2
9814
64.4
5913
74.1
6423
33.9
7913
.254
2015
.627
3074
208
47.2
pxl/m
m69
5.71
849
8.13
019
7.58
831
.565
29.2
0245
916.
728
2896
4.12
074
880.
848
1.58
546
079.
771
2880
1.07
71.
5999
3284
.426
2395
.596
2027
.983
3616
.518
14.2
8220
19.1
6710
7820
947
.2px
l/mm
482.
877
268.
214
214.
663
28.1
1224
.818
1461
9.16
515
200.
589
2981
9.75
40.
962
1619
0.06
413
629.
690
1.18
7853
-38.
437
1111
.842
1135
.052
1846
.664
13.3
9200
13.1
4860
6721
447
.2px
l/mm
636.
104
497.
721
138.
383
22.7
4726
.949
3275
2.51
628
996.
062
6174
8.57
71.
130
3320
1.57
228
547.
005
1.16
3049
-71.
904
1971
.867
2046
.820
3141
.649
14.1
6640
16.6
0990
6921
647
.2px
l/mm
847.
439
327.
668
519.
771
29.5
9027
.002
3969
6.00
730
475.
998
7017
2.00
51.
303
3971
2.86
730
459.
138
1.30
3808
-87.
554
2053
.377
1806
.367
3449
.051
16.8
7140
19.3
3210
6421
747
.2px
l/mm
571.
028
405.
002
166.
026
28.9
4423
.260
2755
9.75
021
109.
869
4866
9.61
91.
306
2833
3.00
820
336.
611
1.39
3202
71.8
8316
86.9
5115
97.1
8726
40.5
7413
.216
9016
.337
0083
218
47.2
pxl/m
m46
7.16
524
8.84
321
8.32
224
.659
22.7
7713
940.
793
1368
1.39
327
622.
186
1.01
916
720.
193
1090
1.99
31.
5336
8246
.278
912.
709
1100
.261
1746
.298
12.4
3470
15.2
7410
7721
947
.2px
l/mm
620.
843
409.
721
211.
122
29.3
3023
.879
3239
9.06
124
250.
235
5664
9.29
51.
336
3306
7.65
923
581.
636
1.40
2263
-74.
604
1710
.703
1740
.466
2950
.068
13.9
3320
18.9
3900
6322
047
.2px
l/mm
595.
951
427.
698
168.
253
23.1
1922
.658
3026
6.77
022
851.
230
5311
8.00
01.
325
3110
4.61
922
013.
381
1.41
2987
72.3
2717
95.7
4116
78.0
3428
14.6
6313
.617
9016
.854
80

137
AG
EID
#S
cale
TAC
AM
AX
bar
Ybar
IxIy
JIx
/IyIm
axIm
inIm
x/Im
nTh
eta
ZxZy
ZpM
axX
rad
Max
Yrad
7922
247
.2px
l/mm
673.
427
454.
174
219.
253
32.5
9020
.998
3424
4.36
331
409.
632
6565
3.99
51.
090
3634
1.27
029
312.
725
1.23
9778
56.8
9319
76.1
9720
84.4
7632
85.4
9415
.068
4017
.328
4063
224
47.2
pxl/m
m52
8.96
025
0.83
527
8.12
519
.341
22.9
4516
173.
955
1516
5.97
931
339.
934
1.06
616
650.
848
1468
9.08
71.
1335
5260
.459
1117
.756
1106
.185
1914
.924
13.7
1020
14.4
7000
8422
547
.2px
l/mm
637.
021
420.
027
216.
994
32.3
9720
.981
3020
6.01
127
430.
956
5763
6.96
71.
101
3157
9.55
426
057.
413
1.21
1922
60.0
8416
50.6
9619
03.6
1329
87.5
2714
.409
9018
.299
0058
226
47.2
pxl/m
m65
1.71
251
6.99
013
4.72
226
.353
24.2
2927
218.
411
3894
3.02
066
161.
432
0.69
938
982.
615
2717
8.81
71.
4343
013.
320
1793
.282
2318
.330
3304
.012
16.7
9790
15.1
7800
7922
747
.2px
l/mm
474.
870
227.
630
247.
239
32.1
9327
.738
1524
0.30
012
501.
619
2774
1.91
81.
219
1731
9.16
410
422.
755
1.66
1669
-56.
699
1025
.053
969.
757
1751
.821
12.8
9150
14.8
6780
6522
847
.2px
l/mm
600.
206
446.
947
153.
259
30.1
0124
.051
2641
8.79
828
188.
992
5460
7.79
00.
937
3030
8.72
424
299.
066
1.24
7321
36.4
3516
24.0
6619
16.5
5728
72.0
7614
.708
1016
.267
1088
233
47.2
pxl/m
m53
7.52
516
0.43
037
7.09
531
.018
24.2
4914
147.
694
1034
6.74
124
494.
435
1.36
714
156.
908
1033
7.52
81.
3694
6787
.185
882.
754
752.
422
1599
.629
13.7
5130
16.0
2680
7425
047
.2px
l/mm
595.
496
463.
987
131.
510
35.3
3523
.881
3050
5.85
323
773.
690
5427
9.54
31.
283
3054
1.37
723
738.
165
1.28
6594
85.8
5618
99.9
7017
74.9
1928
59.4
6313
.394
2016
.056
0075
251
47.2
pxl/m
m61
1.14
142
1.58
418
9.55
734
.738
20.8
1622
385.
669
3262
0.85
355
006.
522
0.68
632
956.
076
2205
0.44
61.
4945
7610
.098
1460
.455
1940
.716
2887
.369
16.8
0870
15.3
2790
6825
247
.2px
l/mm
457.
413
317.
065
140.
347
24.5
4925
.347
1815
7.09
912
646.
672
3080
3.77
11.
436
1817
4.33
612
629.
435
1.43
9046
-86.
804
1240
.935
1117
.204
1890
.953
11.3
1990
14.6
3180
8725
347
.2px
l/mm
461.
659
158.
825
302.
835
26.6
3126
.283
8478
.557
1030
0.69
018
779.
247
0.82
310
619.
631
8159
.616
1.30
1487
-21.
105
541.
919
822.
620
1317
.604
12.5
2180
15.6
4540
8025
547
.2px
l/mm
589.
196
243.
924
345.
272
26.0
8522
.803
1334
3.39
023
488.
593
3683
1.98
30.
568
2377
9.79
913
052.
184
1.82
1902
-9.4
8392
3.89
214
61.0
8021
54.4
8916
.076
2014
.442
6069
257
47.2
pxl/m
m48
3.64
330
7.78
317
5.85
926
.630
23.4
1719
037.
566
1420
4.83
433
242.
400
1.34
019
067.
925
1417
4.47
61.
3452
30-8
5.48
212
21.3
7911
53.8
4419
99.1
0412
.310
9015
.586
9081
301
47.2
pxl/m
m56
4.21
818
8.01
137
6.20
832
.621
22.7
8514
108.
530
1366
9.45
827
777.
988
1.03
214
400.
486
1337
7.50
21.
0764
7057
.709
825.
664
1036
.820
1753
.483
13.1
8400
17.0
8750
6530
247
.2px
l/mm
602.
822
458.
165
144.
657
23.3
9523
.822
3148
9.24
125
788.
513
5727
7.75
41.
221
3391
7.47
923
360.
275
1.45
1930
61.3
4117
85.0
6717
25.9
4529
73.9
2314
.941
7017
.640
4077
303
47.2
pxl/m
m62
9.52
552
1.54
110
7.98
431
.411
24.3
7628
657.
007
3347
6.54
662
133.
553
0.85
634
533.
677
2759
9.87
61.
2512
2622
.983
1785
.753
2134
.049
3155
.935
15.6
8690
16.0
4760
6930
447
.2px
l/mm
645.
068
474.
116
170.
952
32.6
9624
.198
3322
9.15
830
124.
778
6335
3.93
71.
103
3696
9.87
526
384.
062
1.40
1220
53.5
2719
53.5
8719
71.3
6832
01.0
6715
.281
2017
.009
3062
305
47.2
pxl/m
m45
0.85
534
0.40
211
0.45
324
.950
24.2
1415
007.
306
1585
2.25
930
859.
565
0.94
716
267.
571
1459
1.99
41.
1148
2929
.858
1087
.945
1227
.306
1893
.453
12.9
1630
13.7
9420
7730
647
.2px
l/mm
563.
335
244.
280
319.
056
21.4
8323
.007
1893
4.46
415
829.
268
3476
3.73
11.
196
1925
8.17
715
505.
555
1.24
2018
-72.
920
1220
.762
1154
.738
2065
.486
13.7
0810
15.5
1040
7030
747
.2px
l/mm
360.
545
193.
098
167.
447
42.1
3621
.906
9470
.382
7237
.607
1670
7.98
91.
308
9530
.603
7177
.386
1.32
7865
-80.
795
661.
204
681.
634
1209
.859
10.6
1800
14.3
2290
5930
847
.2px
l/mm
654.
632
508.
718
145.
914
32.0
2329
.280
3808
5.00
929
082.
199
6716
7.20
81.
310
3890
5.64
728
261.
561
1.37
6628
-73.
879
2038
.170
1979
.299
3340
.603
14.6
9320
18.6
8590
7130
947
.2px
l/mm
667.
112
409.
490
257.
622
32.3
5724
.817
3345
0.73
128
172.
036
6162
2.76
71.
187
3477
9.45
326
843.
314
1.29
5647
65.8
4718
82.6
6119
40.4
5131
36.9
7514
.518
3017
.767
8060
311
47.2
pxl/m
m60
2.58
043
1.94
517
0.63
524
.567
22.8
3930
700.
979
2411
0.23
954
811.
218
1.27
330
785.
502
2402
5.71
51.
2813
56-8
3.58
017
97.8
3917
17.5
3928
79.8
8214
.037
7017
.076
6078
313
47.2
pxl/m
m53
3.68
420
9.85
832
3.82
528
.423
26.6
3212
839.
113
1514
8.14
427
987.
257
0.84
815
155.
205
1283
2.05
21.
1810
433.
160
823.
410
1137
.523
1763
.117
13.3
1680
15.5
9260
8431
447
.2px
l/mm
578.
569
464.
478
114.
090
15.5
0521
.340
2339
8.49
228
516.
074
5191
4.56
60.
821
2937
8.44
122
536.
125
1.30
3615
-20.
794
1608
.133
1934
.362
2767
.968
14.7
4190
14.5
5010
6731
547
.2px
l/mm
564.
301
458.
671
105.
630
32.8
9223
.226
2554
1.80
224
321.
735
4986
3.53
71.
050
2846
1.56
321
401.
974
1.32
9857
49.9
7616
68.0
1917
22.3
8426
87.7
0514
.121
0015
.312
7071
316
47.2
pxl/m
m51
6.84
739
7.42
311
9.42
523
.338
23.9
9717
303.
924
2373
7.59
141
041.
515
0.72
923
872.
563
1716
8.95
11.
3904
50-8
.158
1240
.565
1632
.230
2331
.595
14.5
4300
13.9
4840
7131
947
.2px
l/mm
667.
056
455.
086
211.
971
29.2
9225
.744
3380
0.54
730
433.
794
6423
4.34
11.
111
3382
3.02
530
411.
316
1.11
2186
85.3
4420
02.0
5520
71.5
4932
33.4
7914
.691
3016
.882
9085
320
47.2
pxl/m
m47
3.88
021
4.02
125
9.85
825
.550
25.1
1710
920.
309
1378
6.76
624
707.
075
0.79
214
004.
852
1070
2.22
31.
3085
93-1
4.89
082
9.34
810
46.2
5416
09.7
5413
.177
3013
.167
3065
321
47.2
pxl/m
m58
5.78
435
9.44
322
6.34
127
.691
23.6
3527
356.
266
2059
3.92
547
950.
191
1.32
827
472.
020
2047
8.17
11.
3415
27-8
2.60
815
85.4
6215
04.7
4326
12.0
2313
.686
0017
.254
4052
322
47.2
pxl/m
m39
2.55
128
6.52
410
6.02
626
.115
24.2
5513
891.
784
1001
1.77
823
903.
563
1.38
814
494.
408
9409
.155
1.54
0458
-69.
864
1017
.926
888.
878
1571
.367
11.2
6340
13.6
4720
5732
447
.2px
l/mm
648.
297
404.
454
243.
843
28.7
9325
.224
3505
1.18
623
468.
194
5851
9.38
01.
494
3511
1.53
523
407.
845
1.49
9990
85.8
8220
48.9
7617
83.8
6230
20.8
4713
.155
8017
.106
7056
329
47.2
pxl/m
m64
1.82
742
3.76
821
8.05
922
.558
23.0
7023
694.
911
3700
7.20
860
702.
120
0.64
038
950.
137
2175
1.98
21.
7906
4819
.640
1684
.049
2192
.345
3102
.693
16.8
8020
14.0
7020
8640
2A47
.2px
l/mm
510.
201
253.
680
256.
520
30.1
1722
.203
1530
6.99
517
536.
271
3284
3.26
60.
873
2186
6.52
810
976.
738
1.99
2079
-39.
094
914.
512
1272
.495
1981
.554
13.7
8100
16.7
3790
6240
347
.2px
l/mm
604.
676
449.
992
154.
685
34.8
8022
.794
2887
0.76
226
032.
456
5490
3.21
91.
109
3035
5.35
124
547.
867
1.23
6578
-59.
629
1760
.287
1816
.773
2883
.410
14.3
2900
16.4
0120
5940
847
.2px
l/mm
605.
373
435.
411
169.
963
28.0
4024
.958
2658
4.01
127
038.
805
5362
2.81
60.
983
2721
1.56
626
411.
250
1.03
0302
27.6
8516
91.0
8519
09.1
0228
34.1
6614
.163
1015
.720
1060
409
47.2
pxl/m
m61
7.86
140
7.04
621
0.81
524
.122
23.2
5426
939.
164
2901
6.60
955
955.
772
0.92
830
467.
517
2548
8.25
51.
1953
55-3
2.67
015
23.8
6118
69.8
6729
23.6
5915
.518
0017
.678
2066
410
47.2
pxl/m
m51
0.89
029
2.08
321
8.80
725
.672
42.8
8715
495.
719
1849
4.14
933
989.
868
0.83
818
613.
803
1537
6.06
51.
2105
7011
.084
1154
.114
1353
.994
2031
.819
13.6
5900
13.4
2650
6941
147
.2px
l/mm
515.
283
356.
901
158.
382
24.4
0822
.855
2062
8.22
318
111.
462
3873
9.68
61.
139
2070
7.14
018
032.
546
1.14
8320
-80.
109
1353
.731
1399
.022
2235
.393
12.9
4580
15.2
3810
6141
347
.2px
l/mm
660.
954
433.
069
227.
885
30.9
7626
.765
3380
6.94
128
268.
853
6207
5.79
41.
196
3396
2.03
128
113.
763
1.20
8022
-80.
628
2054
.426
1925
.569
3153
.794
14.6
8080
16.4
5570
5441
547
.2px
l/mm
608.
418
421.
994
186.
424
24.8
9627
.377
2582
3.96
428
606.
514
5443
0.47
80.
903
3120
8.02
823
222.
450
1.34
3873
-34.
804
1619
.146
1915
.031
2865
.265
14.9
3790
15.9
4910
6641
647
.2px
l/mm
460.
740
261.
152
199.
588
34.2
4622
.790
1209
8.53
615
337.
565
2743
6.10
10.
789
1534
2.27
512
093.
826
1.26
8604
2.18
295
4.39
811
89.8
4717
37.7
0212
.890
4012
.676
6045
419
47.2
pxl/m
m45
1.11
832
8.14
212
2.97
622
.118
26.0
8015
920.
444
1481
6.72
730
737.
171
1.07
416
347.
669
1438
9.50
21.
1360
8362
.154
1075
.016
1191
.323
1887
.968
12.4
3720
14.8
0950
7542
047
.2px
l/mm
521.
168
296.
169
224.
998
37.9
5320
.363
2198
2.82
315
209.
227
3719
2.05
01.
445
2351
1.80
313
680.
246
1.71
8668
66.7
7413
30.4
3012
20.0
9721
69.8
4412
.465
6016
.523
1075
421
47.2
pxl/m
m65
1.39
246
0.44
719
0.94
527
.135
27.1
7534
254.
994
2815
2.56
962
407.
563
1.21
734
992.
159
2741
5.40
31.
2763
6971
.825
1985
.504
1989
.979
3166
.089
14.1
4720
17.2
5250
6842
247
.2px
l/mm
525.
482
366.
638
158.
845
31.8
1726
.880
2224
3.83
618
390.
015
4063
3.85
11.
210
2257
8.54
418
055.
307
1.25
0521
-74.
215
1422
.146
1417
.767
2314
.665
12.9
7110
15.6
4100
8442
447
.2px
l/mm
528.
169
325.
589
202.
580
23.5
5119
.807
1765
3.98
020
716.
294
3837
0.27
40.
852
2238
6.10
115
984.
173
1.40
0517
30.7
1111
18.2
8914
86.9
1222
19.8
1213
.932
4015
.786
6089
429
47.2
pxl/m
m48
9.67
418
1.03
230
8.64
222
.007
22.1
9410
134.
521
1255
9.01
322
693.
534
0.80
712
831.
353
9862
.181
1.30
1066
-17.
629
686.
839
885.
717
1512
.894
14.1
7950
14.7
5530
7050
247
.2px
l/mm
619.
079
381.
880
237.
199
31.3
4022
.978
3130
2.66
422
490.
231
5379
2.89
51.
392
3140
3.68
222
389.
213
1.40
2626
83.9
2317
96.4
5216
68.4
0228
40.7
2513
.480
1017
.424
7083
504
47.2
pxl/m
m63
6.55
047
3.91
016
2.64
030
.199
24.9
7830
460.
483
2984
1.80
960
302.
292
1.02
130
752.
871
2954
9.42
11.
0407
2760
.468
1993
.994
2069
.586
3087
.761
14.4
1920
15.2
7610

138
AG
EID
#S
cale
TAC
AM
AX
bar
Ybar
IxIy
JIx
/IyIm
axIm
inIm
x/Im
nTh
eta
ZxZy
ZpM
axX
rad
Max
Yrad
7350
547
.2px
l/mm
459.
867
319.
931
139.
936
34.0
2326
.487
1583
0.50
315
188.
915
3101
9.41
81.
042
1605
0.76
814
968.
650
1.07
2292
63.1
8211
64.2
3212
05.1
7119
00.6
0812
.603
1013
.597
4066
506
47.2
pxl/m
m53
6.29
035
9.09
017
7.20
132
.094
24.4
2920
894.
218
1998
3.40
240
877.
620
1.04
620
911.
836
1996
5.78
51.
0473
84-8
2.15
713
51.0
1814
85.0
0723
24.7
9413
.456
8015
.465
5074
508
47.2
pxl/m
m69
1.02
343
5.33
725
5.68
531
.813
24.3
8734
980.
794
3207
7.39
667
058.
190
1.09
138
682.
921
2837
5.26
91.
3632
6253
.180
2053
.758
2063
.882
3336
.644
15.5
4230
17.0
3260
6250
947
.2px
l/mm
590.
996
502.
928
88.0
6924
.063
23.3
5932
244.
061
2353
3.08
455
777.
145
1.37
032
328.
317
2344
8.82
91.
3786
7584
.410
1896
.565
1776
.633
2916
.843
13.2
4590
17.0
0130
7251
147
.2px
l/mm
628.
110
479.
384
148.
726
32.9
4623
.300
2902
8.22
030
578.
141
5960
6.36
00.
949
3281
4.41
626
791.
944
1.22
4787
37.5
4319
48.2
7720
70.6
0930
61.7
0714
.767
7014
.899
4062
512
47.2
pxl/m
m49
6.25
123
0.09
326
6.15
828
.969
23.4
7115
788.
014
1238
4.10
028
172.
114
1.27
516
036.
595
1213
5.51
91.
3214
5975
.379
887.
999
1029
.697
1771
.610
12.0
2690
17.7
7930
5051
347
.2px
l/mm
573.
362
405.
367
167.
996
33.3
7524
.949
2529
9.32
722
742.
085
4804
1.41
11.
112
2543
5.10
722
606.
305
1.12
5133
77.3
4516
19.3
9516
71.2
5826
15.6
4913
.607
8015
.622
7056
514
47.2
pxl/m
m67
8.62
146
4.10
621
4.51
531
.899
23.6
5236
860.
305
3053
9.27
367
399.
578
1.20
739
753.
850
2764
5.72
81.
4379
74-6
0.73
521
14.9
7321
12.4
7133
49.0
3514
.456
7017
.428
3069
515
47.2
pxl/m
m60
7.91
530
2.36
330
5.55
330
.601
24.1
2716
621.
030
3029
0.35
446
911.
384
0.54
932
207.
782
1470
3.60
32.
1904
6919
.328
1133
.317
1775
.197
2570
.592
17.0
6310
14.6
6580
9151
647
.2px
l/mm
557.
971
305.
212
252.
758
33.5
9122
.411
2167
0.29
819
137.
142
4080
7.44
01.
132
2255
5.66
218
251.
778
1.23
5806
-63.
028
1286
.294
1369
.572
2321
.880
13.9
7310
16.8
4710
7551
747
.2px
l/mm
449.
325
264.
421
184.
903
33.6
8022
.231
1611
0.31
012
042.
753
2815
3.06
31.
338
1642
8.02
011
725.
043
1.40
1105
74.9
3510
14.2
5310
13.7
5717
70.7
3611
.879
3015
.883
9079
518
47.2
pxl/m
m56
3.41
732
9.22
723
4.19
033
.156
23.6
9523
089.
042
1880
8.99
541
898.
037
1.22
823
333.
112
1856
4.92
51.
2568
3876
.924
1390
.749
1448
.128
2367
.017
12.9
8850
16.6
0190
5251
947
.2px
l/mm
435.
166
316.
819
118.
346
24.0
7322
.781
1556
8.97
712
887.
424
2845
6.40
11.
208
1577
6.88
412
679.
517
1.24
4281
74.9
8410
92.3
2110
37.5
9617
84.6
4312
.420
5014
.253
1058
520
47.2
pxl/m
m48
2.63
130
2.96
617
9.66
531
.728
24.7
1015
871.
959
1608
3.54
531
955.
504
0.98
716
659.
254
1529
6.25
01.
0891
07-4
0.53
511
65.6
9312
43.6
2019
42.3
0912
.932
8013
.615
9077
521
47.2
pxl/m
m82
4.41
060
0.12
522
4.28
523
.976
23.7
9159
679.
209
4279
6.78
910
2475
.998
1.39
460
745.
252
4173
0.74
61.
4556
4776
.303
3018
.904
2802
.956
4547
.306
15.2
6850
19.7
6850
7452
347
.2px
l/mm
677.
048
472.
871
204.
177
31.5
2426
.353
3294
8.33
233
723.
488
6667
1.82
00.
977
3393
1.36
332
740.
457
1.03
6374
-24.
695
2019
.329
2244
.861
3322
.599
15.0
2250
16.3
1650
7452
447
.2px
l/mm
506.
338
226.
651
279.
687
32.6
7222
.575
1070
6.83
516
644.
584
2735
1.41
90.
643
1822
4.34
191
27.0
781.
9967
3324
.627
679.
762
1248
.771
1733
.785
13.3
2880
15.7
5090
7152
547
.2px
l/mm
816.
208
614.
726
201.
482
30.9
7225
.832
5510
5.64
246
573.
967
1016
79.6
081.
183
5819
0.76
143
488.
848
1.33
8062
62.7
3629
03.7
6928
55.2
9745
21.4
8116
.311
4018
.977
3052
604
47.2
pxl/m
m64
2.50
748
4.30
815
8.19
929
.907
23.8
1832
966.
188
3002
9.80
962
995.
997
1.09
834
872.
944
2812
3.05
31.
2400
13-5
7.89
418
93.3
9020
49.4
1431
87.8
5414
.652
9017
.411
2056
610
47.2
pxl/m
m48
1.94
431
0.53
017
1.41
432
.647
23.5
3216
662.
935
1572
4.26
532
387.
199
1.06
017
210.
603
1517
6.59
71.
1340
23-5
8.74
212
22.5
7412
18.8
2119
61.4
2912
.901
2013
.629
4057
615
47.2
pxl/m
m43
7.39
930
6.84
313
0.55
533
.671
24.8
8615
059.
485
1351
7.91
528
577.
400
1.11
415
718.
273
1285
9.12
71.
2223
44-6
1.31
410
74.7
0410
87.4
8417
90.1
8012
.430
4014
.012
7059
618
47.2
pxl/m
m63
4.00
139
5.42
623
8.57
531
.247
24.2
3826
254.
716
2890
6.75
955
161.
475
0.90
829
488.
594
2567
2.88
21.
1486
2822
.985
1686
.107
1899
.904
2893
.305
15.2
1490
15.5
7120
6061
947
.2px
l/mm
581.
343
419.
634
161.
709
30.4
3824
.902
3505
6.04
919
224.
855
5428
0.90
51.
823
3509
3.05
919
187.
845
1.82
8921
87.2
3519
65.9
8414
76.2
6128
59.5
1513
.022
7017
.831
3053
620
47.2
pxl/m
m48
0.38
131
0.72
416
9.65
732
.148
22.4
1017
063.
194
1573
5.01
232
798.
206
1.08
417
946.
637
1485
1.57
01.
2084
0057
.706
1225
.414
1187
.562
1979
.569
13.2
4980
13.9
2440
6170
647
.2px
l/mm
386.
650
285.
034
101.
615
27.5
6323
.051
1121
4.61
811
069.
546
2228
4.16
41.
013
1125
7.63
211
026.
532
1.02
0959
64.4
4289
2.65
796
4.01
414
92.9
2311
.482
8012
.563
2051
715
47.2
pxl/m
m54
7.45
035
0.18
619
7.26
514
.045
26.1
9024
194.
071
1816
1.14
542
355.
216
1.33
224
528.
704
1782
6.51
21.
3759
68-7
7.08
815
49.8
4714
03.1
2723
85.8
4412
.943
3015
.610
6063
717
47.2
pxl/m
m53
3.76
037
1.60
416
2.15
628
.518
26.2
1623
182.
177
1887
3.20
142
055.
377
1.22
823
722.
227
1833
3.15
11.
2939
53-7
1.54
514
31.1
0014
69.8
8523
73.5
0312
.839
9016
.198
9079
802
47.2
pxl/m
m57
3.61
042
9.14
114
4.47
044
.985
25.1
1729
431.
327
2093
0.86
550
362.
192
1.40
629
579.
299
2078
2.89
31.
4232
5282
.548
1750
.686
1576
.352
2707
.300
13.2
7800
16.8
1130
7480
547
.2px
l/mm
659.
240
438.
149
221.
091
15.1
1123
.002
3672
8.78
126
392.
679
6312
1.46
01.
392
3717
6.88
725
944.
573
1.43
2935
78.4
7920
33.9
5818
44.9
2331
92.4
8814
.305
6018
.057
8080
806
47.2
pxl/m
m49
4.94
438
2.87
111
2.07
231
.136
24.2
8021
969.
698
1627
3.07
938
242.
777
1.35
022
239.
179
1600
3.59
91.
3896
36-7
8.00
213
32.9
0712
96.6
3422
14.4
2612
.550
3016
.482
5076
811
47.2
pxl/m
m47
0.21
827
0.79
819
9.42
033
.070
24.9
4114
386.
973
1435
5.38
628
742.
359
1.00
214
389.
051
1435
3.30
81.
0024
9076
.047
919.
189
1116
.415
1797
.717
12.8
5850
15.6
5180
9381
247
.2px
l/mm
572.
492
220.
431
352.
061
29.7
9220
.870
1826
8.31
014
783.
898
3305
2.20
81.
236
1847
2.94
614
579.
262
1.26
7070
76.7
4711
22.8
5310
71.5
7219
90.7
4813
.796
5016
.269
5074
813
47.2
pxl/m
m40
9.08
621
1.86
619
7.22
026
.364
17.3
5810
323.
911
9968
.392
2029
2.30
31.
036
1058
2.65
097
09.6
531.
0899
10-5
7.01
674
0.90
184
9.89
413
94.2
8611
.729
0013
.934
3088
814
47.2
pxl/m
m52
2.60
628
0.97
424
1.63
124
.654
25.8
8618
932.
217
1598
3.49
734
915.
714
1.18
419
484.
350
1543
1.36
41.
2626
4668
.340
1178
.619
1240
.148
2072
.074
12.8
8840
16.0
6310
8181
547
.2px
l/mm
379.
078
221.
649
157.
429
19.6
1428
.509
9683
.565
9181
.045
1886
4.60
91.
055
9911
.593
8953
.016
1.10
7067
60.8
0877
4.18
683
2.13
913
21.9
7411
.033
1012
.508
1063
816
47.2
pxl/m
m79
7.10
451
6.51
928
0.58
426
.914
24.3
4249
528.
805
4069
2.18
590
220.
989
1.21
749
657.
392
4056
3.59
71.
2241
86-8
3.17
125
65.9
1525
86.1
7941
43.5
6915
.734
5019
.302
6063
818
47.2
pxl/m
m46
7.10
523
5.82
023
1.28
526
.089
27.2
0213
505.
330
1267
0.96
326
176.
293
1.06
614
228.
885
1194
7.40
91.
1909
6055
.726
967.
173
1055
.937
1679
.086
11.9
9970
13.9
6370
8081
9A47
.2px
l/mm
457.
286
199.
322
257.
964
26.9
8323
.379
1061
2.44
311
389.
472
2200
1.91
50.
932
1243
1.84
195
70.0
741.
2990
33-3
7.12
376
1.80
194
9.12
014
79.0
9512
.000
0013
.930
7072
820
47.2
pxl/m
m45
8.91
523
4.11
122
4.80
426
.064
26.7
5110
794.
345
1470
2.39
125
496.
736
0.73
415
443.
782
1005
2.95
41.
5362
43-2
1.76
879
3.16
811
17.8
4316
47.1
5213
.152
5013
.609
2083
822
47.2
pxl/m
m71
6.72
746
6.22
825
0.49
926
.706
24.9
0738
768.
321
3579
6.03
374
564.
354
1.08
345
854.
900
2870
9.45
31.
5972
0649
.992
2190
.488
2269
.336
3605
.353
15.7
7380
17.6
9850
4882
347
.2px
l/mm
586.
301
451.
036
135.
265
28.8
8425
.238
2683
6.40
525
736.
570
5257
2.97
51.
043
2735
0.75
225
222.
223
1.08
4391
60.5
5617
30.9
7817
92.6
0427
93.5
5114
.357
1015
.503
6082
824
47.2
pxl/m
m56
2.43
726
8.68
129
3.75
530
.898
24.0
0618
542.
719
1793
8.01
436
480.
734
1.03
418
545.
609
1793
5.12
41.
0340
39-8
6.05
512
08.9
7512
62.5
3121
39.4
7114
.208
0015
.337
6056
826
47.2
pxl/m
m45
5.52
235
2.99
610
2.52
726
.486
22.1
0220
043.
199
1331
0.57
133
353.
770
1.50
620
052.
047
1330
1.72
31.
5074
7787
.925
1213
.182
1121
.599
2003
.991
11.8
6750
16.5
2120
9290
247
.2px
l/mm
419.
397
255.
981
163.
416
35.7
0926
.036
1064
2.16
313
575.
376
2421
7.53
80.
784
1360
5.56
210
611.
976
1.28
2095
5.76
381
1.35
110
68.9
1015
86.4
0812
.700
2013
.116
6080
903
47.2
pxl/m
m52
6.14
429
7.65
122
8.49
429
.819
23.7
6023
752.
299
1499
4.79
138
747.
090
1.58
423
925.
401
1482
1.69
01.
6142
15-8
2.07
413
54.7
3711
96.4
1922
35.7
0512
.533
1017
.532
8080
904
47.2
pxl/m
m53
1.94
727
7.55
825
4.38
926
.211
23.0
8518
661.
609
1680
9.08
835
470.
697
1.11
019
761.
890
1570
8.80
71.
2580
13-5
8.59
911
96.1
7712
65.0
3620
96.0
6613
.287
4015
.601
0084
905
47.2
pxl/m
m53
2.92
322
5.80
930
7.11
523
.335
23.0
4513
416.
669
1608
9.66
129
506.
330
0.83
416
131.
877
1337
4.45
31.
2061
71-7
.108
845.
179
1200
.859
1832
.475
13.3
9850
15.8
7440
8590
647
.2px
l/mm
549.
816
392.
091
157.
724
28.1
6224
.352
2044
8.78
424
040.
807
4448
9.59
10.
851
2458
2.81
319
906.
778
1.23
4897
19.9
0514
24.4
0717
31.7
8524
73.0
2613
.882
1014
.356
0084
908B
47.2
pxl/m
m52
7.27
919
5.40
233
1.87
726
.635
22.1
0310
278.
271
1702
0.21
927
298.
490
0.60
417
537.
304
9761
.186
1.79
6637
-14.
944
716.
877
1120
.179
1731
.335
15.1
9420
14.3
3760
7990
9B47
.2px
l/mm
780.
433
398.
432
382.
001
23.0
7223
.638
3196
5.78
340
679.
907
7264
5.69
00.
786
4200
9.50
730
636.
183
1.37
1238
19.9
9416
87.1
4224
49.0
9135
37.3
9216
.610
2018
.946
70

139
AG
EID
#S
cale
TAC
AM
AX
bar
Ybar
IxIy
JIx
/IyIm
axIm
inIm
x/Im
nTh
eta
ZxZy
ZpM
axX
rad
Max
Yrad
7491
047
.2px
l/mm
547.
671
241.
589
306.
082
46.6
0024
.315
1832
2.94
215
133.
391
3345
6.33
31.
211
1931
4.02
114
142.
312
1.36
5691
64.0
3911
04.0
4411
89.5
0820
08.4
8812
.722
4016
.596
2085
913
47.2
pxl/m
m59
9.81
041
7.15
218
2.65
830
.595
19.9
7630
719.
037
2284
2.11
853
561.
156
1.34
531
663.
116
2189
8.03
91.
4459
34-7
1.88
516
64.4
6217
03.4
1928
31.7
8613
.409
6018
.455
8078
916
47.2
pxl/m
m55
1.24
730
1.71
124
9.53
732
.725
21.4
7322
421.
800
1787
3.79
940
295.
599
1.25
422
597.
030
1769
8.57
01.
2767
7279
.098
1227
.045
1281
.343
2300
.584
13.9
4930
18.2
7300
9692
1A47
.2px
l/mm
432.
758
200.
924
231.
834
28.5
2623
.045
1006
4.78
610
905.
234
2097
0.02
00.
923
1182
7.37
891
42.6
421.
2936
50-3
5.87
975
3.73
190
3.94
114
28.1
2812
.064
1013
.353
3094
922
47.2
pxl/m
m52
7.01
225
5.17
627
1.83
631
.409
21.1
1917
745.
673
1521
5.29
832
960.
971
1.16
619
785.
478
1317
5.49
31.
5016
88-5
6.25
410
76.3
1511
86.0
4719
86.7
3512
.828
6016
.487
4080
923B
47.2
pxl/m
m48
5.51
020
8.50
827
7.00
229
.085
20.1
3510
872.
801
1418
3.45
925
056.
260
0.76
714
341.
451
1071
4.80
91.
3384
7012
.047
788.
780
1086
.472
1626
.331
13.0
5460
13.7
8430
8092
547
.2px
l/mm
650.
690
453.
088
197.
602
32.7
8822
.456
3484
4.45
627
425.
121
6226
9.57
61.
271
3521
1.20
027
058.
376
1.30
1305
77.7
5519
98.1
6819
51.1
9531
60.9
7814
.055
6017
.438
2080
927
47.2
pxl/m
m55
1.76
840
9.88
814
1.88
030
.782
21.7
5924
686.
847
2234
0.86
047
027.
707
1.10
526
198.
408
2082
9.30
01.
2577
67-5
7.95
514
82.5
3916
02.2
9925
75.2
4313
.943
0016
.651
7084
1005
47.2
pxl/m
m63
8.02
741
6.11
022
1.91
729
.064
21.7
6332
439.
544
2602
1.89
858
461.
442
1.24
732
688.
607
2577
2.83
51.
2683
36-7
9.06
119
00.2
1718
43.7
0430
18.6
6414
.113
9017
.071
5073
1006
47.2
pxl/m
m61
7.91
545
4.16
516
3.75
030
.378
23.2
9133
392.
566
2542
2.27
758
814.
843
1.31
433
526.
760
2528
8.08
21.
3257
93-8
2.66
819
32.3
2118
28.7
0230
31.9
7413
.901
8017
.281
1064
1010
47.2
pxl/m
m62
5.28
344
8.00
017
7.28
331
.272
21.4
2632
019.
089
2662
4.54
058
643.
629
1.20
332
248.
672
2639
4.95
71.
2217
74-7
8.57
818
59.5
8119
18.4
2230
25.5
2813
.878
4017
.218
4059
1017
47.2
pxl/m
m53
7.90
443
6.69
410
1.21
020
.767
24.9
5622
159.
193
2259
5.97
844
755.
171
0.98
122
898.
638
2185
6.53
31.
0476
79-3
2.61
015
13.4
2316
09.1
1824
83.7
9414
.042
5014
.641
8063
1021
47.2
pxl/m
m62
0.95
548
3.96
413
6.99
130
.072
22.5
4535
963.
974
2459
4.42
460
558.
397
1.46
236
039.
671
2451
8.72
71.
4698
83-8
5.35
120
47.9
3818
20.7
0530
97.3
2913
.508
2017
.561
1079
1023
47.2
pxl/m
m55
8.54
038
3.39
317
5.14
727
.311
28.6
9622
338.
780
2273
1.77
045
070.
549
0.98
325
089.
031
1998
1.51
81.
2556
1242
.794
1511
.609
1650
.502
2496
.559
13.7
7260
14.7
7810
5210
2647
.2px
l/mm
583.
872
401.
010
182.
862
26.8
5322
.512
2506
9.07
725
091.
961
5016
1.03
70.
999
2973
0.54
320
430.
495
1.45
5204
44.9
3015
45.8
6017
02.7
4026
99.4
0214
.736
2016
.216
9069
1103
47.2
pxl/m
m64
2.54
440
9.10
723
3.43
830
.256
25.8
6532
475.
731
2532
3.24
157
798.
972
1.28
232
557.
262
2524
1.71
01.
2898
2083
.940
1875
.762
1841
.873
2993
.655
13.7
4860
17.3
1340
6911
0947
.2px
l/mm
682.
071
405.
513
276.
558
28.0
0423
.594
4021
6.38
224
872.
472
6508
8.85
41.
617
4085
1.44
224
237.
412
1.68
5470
78.7
2621
93.5
7318
08.2
7132
64.8
2413
.754
8018
.333
7062
1119
47.2
pxl/m
m57
9.77
640
4.85
017
4.92
632
.158
23.3
0523
483.
581
2537
7.63
948
861.
220
0.92
526
152.
054
2270
9.16
61.
1516
0828
.312
1601
.717
1771
.519
2648
.158
14.3
2540
14.6
6150
5511
2147
.2px
l/mm
612.
505
417.
879
194.
625
27.9
6624
.756
2696
4.35
226
901.
041
5386
5.39
31.
002
2814
2.45
225
722.
941
1.09
4060
-45.
750
1744
.627
1900
.738
2843
.519
14.1
5290
15.4
5570
6411
2247
.2px
l/mm
486.
587
338.
196
148.
390
27.7
5722
.791
2030
8.45
416
135.
471
3644
3.92
41.
259
2057
6.85
415
867.
070
1.29
6828
-76.
189
1194
.789
1246
.759
2137
.895
12.9
4190
16.9
9750
8311
2347
.2px
l/mm
545.
291
299.
527
245.
763
30.0
5622
.875
2407
5.20
115
664.
543
3973
9.74
41.
537
2410
6.30
815
633.
436
1.54
1971
86.5
2612
92.3
4812
07.4
4122
77.3
7412
.973
3018
.629
0084
1124
47.2
pxl/m
m57
8.34
831
4.40
226
3.94
629
.516
22.1
4424
207.
838
1932
6.91
043
534.
748
1.25
325
207.
896
1832
6.85
21.
3754
6267
.590
1469
.005
1411
.748
2434
.167
13.6
9010
16.4
7910
8112
0347
.2px
l/mm
669.
345
529.
025
140.
320
33.9
9426
.686
3257
7.21
036
281.
615
6885
8.82
50.
898
3884
8.40
730
010.
417
1.29
4497
-32.
610
2051
.815
2347
.494
3401
.814
15.4
5550
15.8
7730
7012
1347
.2px
l/mm
596.
689
472.
406
124.
283
29.1
0427
.407
2875
4.29
126
422.
881
5517
7.17
21.
088
2914
0.47
826
036.
695
1.11
9208
-69.
345
1687
.240
1857
.851
2893
.906
14.2
2230
17.0
4220
7612
1447
.2px
l/mm
701.
699
517.
766
183.
934
20.7
0324
.701
4433
5.80
831
938.
295
7627
4.10
31.
388
4470
9.12
731
564.
976
1.41
6416
-80.
298
2421
.705
2140
.772
3665
.517
14.9
1910
18.3
0770
7512
1547
.2px
l/mm
512.
427
341.
914
170.
513
30.5
5422
.261
2010
9.69
317
502.
559
3761
2.25
11.
149
2079
7.40
116
814.
850
1.23
6847
65.4
4613
51.5
7413
45.1
3021
87.7
1313
.011
8014
.878
7097
1218
47.2
pxl/m
m64
4.27
744
6.56
019
7.71
724
.303
23.8
2236
573.
211
2563
3.31
562
206.
525
1.42
738
751.
277
2345
5.24
81.
6521
37-6
7.83
022
08.5
4317
98.0
2331
58.6
4114
.256
4016
.559
9083
1305
47.2
pxl/m
m51
7.76
730
7.95
820
9.80
929
.635
22.2
2918
680.
071
1772
2.52
436
402.
596
1.05
419
566.
832
1683
5.76
31.
1622
18-5
5.26
212
31.8
1613
17.8
4121
36.1
2513
.448
1015
.164
7068
1306
47.2
pxl/m
m62
0.48
829
1.67
932
8.80
929
.249
23.1
7222
069.
742
2194
0.09
544
009.
837
1.00
622
288.
831
2172
1.00
51.
0261
4251
.599
1285
.557
1553
.626
2453
.530
14.1
2190
17.1
6750
9613
0847
.2px
l/mm
404.
668
143.
832
260.
836
33.7
7823
.083
6603
.538
8652
.115
1525
5.65
40.
763
9234
.021
6021
.633
1.53
3475
25.1
8946
2.11
571
7.31
311
32.1
5112
.061
8014
.289
8073
1311
47.2
pxl/m
m62
3.57
143
2.07
019
1.50
224
.685
22.9
1929
330.
608
2647
6.06
455
806.
672
1.10
829
470.
048
2633
6.62
31.
1189
7677
.822
1914
.258
1854
.529
2917
.970
14.2
7640
15.3
2220
6013
1247
.2px
l/mm
736.
026
508.
483
227.
543
23.0
4525
.761
3897
3.49
138
851.
314
7782
4.80
51.
003
4209
4.86
835
729.
937
1.17
8140
-45.
550
2310
.724
2462
.317
3719
.771
15.7
7840
16.8
6640
6413
1347
.2px
l/mm
790.
077
530.
341
259.
736
33.8
7525
.967
4388
5.98
145
193.
294
8907
9.27
50.
971
4833
4.29
640
744.
979
1.18
6264
40.0
4125
56.1
0327
24.6
8041
05.2
2516
.586
6017
.169
1064
1314
47.2
pxl/m
m52
0.69
037
4.88
714
5.80
323
.891
43.8
6819
058.
334
2057
0.47
139
628.
806
0.92
620
923.
310
1870
5.49
51.
1185
65-2
3.50
714
02.4
1214
61.4
7322
72.7
3114
.075
2013
.589
7068
1319
47.2
pxl/m
m54
0.52
829
3.58
524
6.94
331
.744
24.5
6319
543.
816
1812
8.12
337
671.
939
1.07
819
716.
896
1795
5.04
31.
0981
2671
.734
1169
.710
1319
.010
2190
.247
13.7
4370
16.7
0830
7413
2547
.2px
l/mm
603.
556
332.
185
271.
371
21.9
2721
.360
1519
4.22
332
089.
176
4728
3.39
90.
473
3240
9.70
914
873.
690
2.17
8996
7.77
011
48.9
8319
00.3
2925
85.4
5716
.886
1013
.224
1086
1401
47.2
pxl/m
m58
2.30
631
2.57
226
9.73
429
.150
22.7
2316
987.
139
2733
6.83
044
323.
968
0.62
127
679.
690
1664
4.27
81.
6630
1510
.152
1236
.407
1717
.790
2466
.302
15.9
1400
13.7
3910
7214
0247
.2px
l/mm
565.
562
364.
492
201.
070
22.2
8345
.834
2302
2.24
421
256.
734
4427
8.97
81.
083
2375
8.68
420
520.
294
1.15
7814
61.5
1914
97.4
7415
68.2
8524
64.4
7413
.554
1015
.374
1088
1404
47.2
pxl/m
m63
0.64
850
5.73
012
4.91
821
.553
21.9
1431
037.
465
3128
6.82
462
324.
289
0.99
233
009.
087
2931
5.20
21.
1260
0643
.065
1883
.818
2044
.495
3163
.005
15.3
0300
16.4
7580
8514
0547
.2px
l/mm
663.
699
431.
404
232.
295
21.7
5624
.517
2934
4.01
833
037.
415
6238
1.43
20.
888
3570
4.38
926
677.
044
1.33
8394
32.9
2518
57.1
3121
01.2
5031
65.1
2215
.722
7015
.800
7079
1406
47.2
pxl/m
m55
8.22
141
0.37
014
7.85
023
.990
23.4
6124
783.
750
2187
7.71
546
661.
465
1.13
325
031.
312
2163
0.15
21.
1572
4274
.348
1601
.051
1535
.100
2560
.587
14.2
5170
15.4
7970
8214
1047
.2px
l/mm
524.
757
229.
758
295.
000
24.6
3922
.493
1373
8.92
616
358.
021
3009
6.94
60.
840
1641
8.15
013
678.
796
1.20
0263
-8.5
2010
11.1
6310
92.1
3718
59.1
8014
.978
0013
.587
3083
1412
47.2
pxl/m
m55
9.60
526
1.42
329
8.18
224
.472
25.3
0617
901.
637
1790
2.60
435
804.
242
1.00
018
401.
115
1740
3.12
71.
0573
4544
.972
1221
.796
1306
.230
2110
.436
13.7
0560
14.6
5190
6814
1447
.2px
l/mm
502.
606
359.
632
142.
974
21.8
3520
.705
1845
4.77
918
947.
954
3740
2.73
30.
974
2093
3.44
516
469.
288
1.27
1060
41.8
2912
41.3
1213
98.7
4021
78.8
1013
.546
4014
.867
2083
1416
47.2
pxl/m
m48
2.98
432
9.73
315
3.25
118
.935
22.2
7518
000.
796
1556
0.35
833
561.
154
1.15
718
452.
867
1510
8.28
71.
2213
7468
.429
1242
.859
1281
.155
2013
.079
12.1
4560
14.4
8340
7314
1947
.2px
l/mm
718.
713
496.
992
221.
722
26.1
1824
.965
4222
7.95
832
728.
935
7495
6.89
21.
290
4277
7.37
332
179.
519
1.32
9335
-76.
839
2408
.245
2212
.510
3619
.199
14.7
9270
17.5
3470
7114
2047
.2px
l/mm
474.
607
335.
876
138.
732
23.7
8326
.030
1867
6.73
014
856.
325
3353
3.05
51.
257
1898
9.12
814
543.
927
1.30
5640
74.6
2712
60.4
5112
26.8
7220
11.8
4912
.109
1014
.817
5085
1421
47.2
pxl/m
m48
8.23
123
2.58
325
5.64
825
.045
21.2
8814
047.
837
1349
9.09
627
546.
933
1.04
115
319.
158
1222
7.77
51.
2528
16-5
0.11
288
3.83
410
09.9
4017
42.8
2413
.366
2015
.894
2087
1424
47.2
pxl/m
m43
5.14
231
9.38
211
5.76
031
.609
19.1
7713
512.
488
1470
9.93
528
222.
423
0.91
916
078.
185
1214
4.23
81.
3239
35-3
6.13
910
15.8
0312
07.3
3217
73.9
1912
.183
8013
.302
3074
1426
47.2
pxl/m
m64
3.49
641
3.82
322
9.67
325
.454
23.5
6135
358.
458
2468
7.91
860
046.
376
1.43
235
442.
351
2460
4.02
51.
4405
1084
.953
1925
.098
1715
.055
3078
.190
14.3
9480
18.3
6710

140
Appendix C: Research Sample Cross-Sectional Images

141

142
203

143

144

145

146

147

148

149

150

151
Appendix D: Research Sample Cortical Thickness Data

152
ID # AGE 0° 22.5° 45° 67.5° 90° 112.5° 135° 157.5° 180° 202.5° 225° 247.5° 270° 292.5° 315° 337.5°
2 44 4.303 4.489 5.532 6.339 6.337 5.362 5.477 6.000 8.684 5.362 5.366 5.928 6.024 6.554 6.197 5.188
5 71 3.521 3.472 3.983 5.188 6.572 4.798 5.644 6.349 10.092 5.362 5.201 4.973 5.790 6.494 5.588 4.766
6 85 2.034 2.034 1.384 3.647 4.146 3.710 3.319 3.472 2.973 2.209 2.323 2.065 3.442 5.147 5.366 2.630
8 91 2.034 2.661 3.098 3.996 3.677 3.154 2.379 3.154 5.398 3.196 2.547 2.907 4.381 4.387 1.881 1.366
9 77 5.476 2.928 5.864 6.657 7.041 6.410 5.919 6.451 9.388 6.392 6.196 6.482 7.980 7.613 7.192 6.277
11 48 5.398 6.596 7.192 7.222 6.885 6.800 6.362 8.209 9.310 6.668 6.196 6.061 7.041 7.890 7.192 5.724
14 49 4.472 5.158 6.970 4.468 6.963 6.205 6.030 6.465 7.198 5.681 5.975 6.093 6.493 6.379 6.030 5.681
15 89 3.139 3.214 3.663 5.557 6.333 4.911 4.204 6.314 6.500 7.211 4.292 4.221 4.889 5.441 4.557 4.005
17 76 6.493 7.222 7.303 7.222 7.510 7.090 6.694 6.945 8.371 6.524 6.860 6.831 8.136 8.547 8.741 7.613
18 47 3.442 4.039 5.366 5.958 4.147 3.956 3.486 5.158 6.963 4.838 3.540 3.894 5.399 5.928 5.532 4.664
19 53 5.163 5.651 6.197 7.047 6.650 5.640 5.034 6.102 7.432 6.000 6.141 6.514 7.041 7.078 6.030 5.332
22 81 3.521 3.472 3.596 5.609 6.493 5.290 4.426 5.609 7.510 3.996 3.821 3.924 5.242 7.324 6.971 5.013
25 77 1.302 1.714 4.626 6.426 6.313 4.125 4.397 3.874 3.500 2.430 3.175 5.213 7.927 7.511 5.812 3.832
27 68 5.007 5.724 6.362 6.800 7.198 6.698 6.306 6.117 7.980 6.205 5.421 6.843 8.136 8.341 8.187 6.421
101 75 3.677 4.366 5.333 6.176 6.115 6.185 5.178 5.991 7.979 5.043 4.354 4.979 5.938 7.524 5.561 3.938
102 76 1.799 2.005 2.711 2.979 5.242 3.750 2.987 2.921 5.163 2.979 2.269 2.528 3.208 4.489 3.707 2.661
103 81 5.163 5.201 5.421 5.783 6.180 7.047 8.022 6.175 6.650 4.707 4.980 4.869 6.416 6.975 7.302 5.971
104 65 1.896 2.511 3.256 5.742 6.927 4.986 5.179 3.107 1.938 2.503 3.565 4.068 5.323 4.927 3.734 1.625
105 65 3.286 3.792 5.753 6.975 7.041 6.307 6.030 5.477 6.024 6.421 6.085 5.815 6.885 4.869 5.421 3.966
106 83 3.833 3.647 4.426 6.061 5.946 4.131 3.928 3.792 6.102 3.894 4.039 5.188 5.007 5.434 4.538 3.996
107 58 4.146 6.349 7.746 7.992 8.606 7.499 6.473 7.162 7.510 7.818 8.022 8.865 9.701 9.461 7.856 4.983
108 91 3.010 3.378 4.567 5.990 4.854 3.852 3.669 4.842 3.156 3.538 2.578 3.837 7.281 8.772 6.364 4.503
109 65 4.889 5.617 5.893 7.476 8.917 8.475 7.287 6.904 6.472 6.667 5.696 6.607 7.181 6.970 6.521 5.107
110 65 4.303 4.520 5.698 5.743 5.555 5.712 4.869 5.753 8.762 5.971 4.536 5.147 5.476 6.760 5.809 4.664
113 66 6.180 6.102 6.861 8.095 7.433 7.253 7.136 6.668 7.510 6.073 5.477 6.061 7.354 7.613 8.077 6.639
117 65 5.320 6.898 6.805 5.847 6.728 6.554 5.976 7.396 9.623 7.409 6.694 6.792 7.432 7.715 7.192 6.596
119 71 4.850 5.128 4.868 5.085 5.555 5.815 6.417 6.915 7.745 8.826 4.757 5.188 5.633 6.307 5.644 4.954
120 78 4.068 4.243 5.089 6.268 5.163 4.623 4.094 5.158 1.565 2.702 3.983 5.147 7.432 7.294 6.362 4.562
121 60 5.476 4.315 5.919 6.061 5.555 4.664 5.421 5.826 7.119 5.971 4.924 5.434 5.085 6.688 6.251 5.158
124 65 3.912 3.545 4.204 5.753 6.102 4.489 5.034 6.421 6.572 4.736 6.196 6.585 6.963 6.410 5.034 4.592
125 30 5.868 5.651 6.362 5.783 5.789 5.918 5.809 7.830 8.239 7.409 6.638 5.783 6.806 7.396 7.136 6.843
126 74 3.111 3.216 4.056 6.219 6.597 5.106 4.744 5.986 3.251 3.660 3.486 5.021 7.681 7.104 5.195 3.131
127 50 5.476 4.387 5.809 6.554 5.663 5.290 4.757 5.724 7.823 4.838 4.813 6.164 7.667 8.372 7.634 6.451
128 56 4.616 5.826 6.749 5.886 5.320 6.379 6.030 6.524 8.606 6.030 5.532 5.681 7.432 9.000 8.188 6.175
129 62 5.320 5.506 5.526 7.777 8.293 7.222 6.638 7.860 8.527 5.651 6.251 6.688 7.745 6.945 5.919 4.736
130 80 3.051 2.949 3.872 5.394 5.555 5.815 4.315 5.230 4.929 3.545 3.321 3.956 4.616 6.307 6.306 4.387
132 47 7.417 7.214 7.150 8.312 7.417 6.152 6.659 6.876 7.139 7.051 7.032 7.490 8.417 9.573 8.623 7.830
133 76 3.208 3.051 3.154 4.171 5.476 5.290 3.928 4.707 5.007 4.315 2.655 3.011 4.146 5.219 4.924 3.792
136 48 6.337 7.192 7.745 7.920 7.589 8.064 8.132 8.993 9.936 6.524 5.865 6.334 7.510 9.516 9.516 8.005
203 69 3.599 3.750 7.757 5.085 5.320 5.537 5.256 6.349 7.198 4.766 4.039 4.140 4.850 6.307 5.975 4.707
204 68 5.555 5.561 6.085 6.596 6.180 5.290 5.754 6.741 9.623 6.814 5.698 6.133 7.823 8.198 7.523 6.668
205 50 4.068 3.821 4.868 6.205 6.728 5.918 5.865 8.252 9.388 5.506 5.366 5.856 6.102 6.873 7.274 5.332
208 74 6.180 6.247 6.418 6.093 5.946 5.743 5.421 7.541 10.092 6.554 5.312 5.290 7.276 8.413 8.821 7.685
209 78 2.425 2.836 3.264 4.798 6.103 4.941 5.034 7.032 4.459 3.647 3.651 2.877 3.833 4.766 4.813 3.095
214 67 5.320 6.800 8.187 9.677 9.075 8.485 7.690 8.296 9.232 6.698 5.919 6.554 7.667 8.198 7.468 5.579
216 69 1.878 1.891 3.375 4.060 4.929 3.924 4.039 6.102 7.980 4.809 3.043 2.979 3.209 2.869 3.486 2.281
217 64 5.242 5.158 5.200 6.061 6.416 5.514 5.030 5.712 9.545 6.494 5.422 5.290 6.259 6.863 6.306 5.506
218 83 3.051 2.630 2.877 4.235 5.242 5.465 3.432 3.123 2.816 2.383 3.264 3.678 5.085 5.076 5.256 3.545
219 77 2.895 2.558 5.089 5.783 6.806 7.222 4.757 4.941 10.327 5.230 4.924 4.983 6.493 8.095 8.022 6.247
220 63 4.772 4.911 5.200 5.477 6.415 6.626 7.136 7.962 11.813 7.294 5.975 5.332 6.728 6.379 6.585 6.175

153
ID # AGE 0° 22.5° 45° 67.5° 90° 112.5° 135° 157.5° 180° 202.5° 225° 247.5° 270° 292.5° 315° 337.5°
222 79 5.007 4.664 4.427 5.579 7.120 7.324 7.579 7.119 10.014 6.300 4.260 4.727 6.728 7.530 6.085 5.085
224 63 1.486 3.196 3.653 4.838 4.694 4.274 4.260 6.247 5.555 4.213 3.043 3.575 4.146 3.011 2.490 1.645
225 84 4.303 4.838 6.196 6.903 6.806 6.729 5.919 5.797 4.146 3.853 4.149 5.434 7.120 8.167 7.967 6.349
226 58 4.929 6.073 7.359 8.804 11.109 8.907 6.805 7.643 8.527 7.903 7.136 8.167 9.779 8.865 7.634 5.856
227 79 2.425 2.486 1.992 1.932 5.163 4.345 3.486 4.417 6.337 2.528 1.995 2.383 2.427 5.537 3.931 3.472
228 65 5.868 6.030 6.030 6.392 7.980 7.294 6.528 6.030 6.806 6.698 5.200 6.205 7.823 8.301 7.745 5.651
233 88 1.489 1.366 1.716 2.661 2.661 1.749 2.102 2.312 4.303 1.505 1.992 2.209 2.036 2.137 2.547 1.787
250 74 6.259 6.117 6.473 6.814 7.667 7.715 7.302 8.005 8.762 8.077 7.136 7.047 7.667 7.818 7.302 6.626
251 75 4.616 4.634 4.757 6.093 9.075 5.989 4.536 4.448 5.555 4.387 5.089 7.571 9.466 8.286 7.856 5.797
252 68 2.269 3.516 5.421 6.626 5.399 4.983 4.980 5.579 7.823 6.236 5.698 5.219 5.711 6.657 6.417 3.956
253 87 0.939 1.264 2.102 3.606 4.538 3.575 2.766 2.137 0.939 2.702 2.048 2.281 3.129 4.202 3.375 1.995
255 80 2.425 1.470 1.605 5.609 5.868 4.243 3.210 2.775 2.192 2.107 2.213 3.154 5.085 4.060 3.540 2.979
257 69 3.209 3.792 4.149 5.362 5.711 4.274 5.200 5.826 8.868 3.894 3.928 4.798 6.024 6.657 5.809 3.678
301 81 1.486 1.645 3.985 3.924 3.286 2.702 2.323 2.037 1.721 3.956 3.486 4.027 4.616 4.983 2.213 1.470
302 65 5.242 5.116 6.141 6.379 6.494 5.783 7.579 8.528 10.405 6.175 5.034 5.880 7.823 9.739 8.298 6.421
303 77 6.572 6.626 6.970 8.413 10.249 8.937 7.523 7.336 9.388 6.175 6.417 9.040 10.562 10.725 9.349 7.903
304 69 4.616 6.133 6.306 6.554 8.840 8.444 6.970 7.613 7.119 5.404 4.536 5.776 8.215 9.739 8.243 5.753
305 62 5.163 5.230 5.477 5.640 6.025 6.030 6.196 6.073 6.728 5.477 5.200 5.783 7.119 8.333 6.583 5.898
306 77 2.503 2.949 4.426 4.345 3.756 2.877 2.379 2.804 4.225 4.562 3.596 3.710 4.850 4.448 4.260 3.298
307 70 2.973 2.979 4.039 4.417 3.755 3.750 3.319 2.877 3.051 3.503 3.651 3.115 4.303 4.171 4.149 4.286
308 59 6.102 5.928 6.750 7.787 6.807 6.668 6.030 7.235 10.483 8.775 7.746 7.253 9.075 9.810 8.796 7.701
309 71 3.286 4.243 4.647 6.698 7.667 7.634 5.590 5.856 6.806 5.826 4.204 4.099 5.320 6.482 6.086 4.606
311 60 5.007 4.562 5.421 6.421 5.868 5.640 5.421 7.729 9.623 6.596 5.336 6.093 6.650 7.499 7.690 6.843
313 78 1.799 1.541 3.043 4.520 4.616 4.417 3.486 3.443 2.158 1.831 2.158 4.027 4.850 5.188 3.043 1.787
314 84 5.868 6.175 6.694 8.064 9.310 9.081 7.413 7.613 7.667 6.030 5.753 7.284 8.606 8.968 7.911 6.524
315 67 5.868 6.205 7.026 7.006 7.902 7.920 7.911 8.064 8.919 6.945 5.975 6.554 9.075 9.739 9.128 6.843
316 71 5.163 5.568 6.141 7.890 8.371 7.602 6.805 6.145 7.667 6.030 6.306 6.657 7.746 7.078 5.422 5.506
319 71 4.772 4.243 5.754 6.698 6.259 5.322 4.980 6.988 7.354 5.537 4.757 7.499 9.310 9.358 8.353 6.133
320 85 2.112 1.541 3.540 4.068 4.225 3.719 2.932 2.949 3.755 2.907 3.762 4.655 5.242 3.710 2.545 1.613
321 65 4.068 3.750 5.091 6.236 5.164 5.076 4.813 4.387 6.728 4.881 4.206 4.655 5.868 7.006 5.975 4.274
322 52 4.068 3.370 4.427 5.188 4.929 5.116 5.145 7.511 8.136 6.102 3.872 3.821 5.007 6.688 6.970 5.404
324 57 4.694 5.230 5.366 5.116 5.868 6.133 6.141 5.928 6.337 5.056 4.979 5.568 5.476 5.815 5.533 5.158
329 56 4.616 5.404 5.533 6.307 5.946 6.873 6.694 7.932 6.806 4.780 5.145 6.410 5.476 7.038 6.306 5.404
402A 86 1.330 2.281 4.481 5.085 4.929 4.592 4.039 5.230 3.521 2.528 2.269 3.226 5.085 6.379 5.864 2.281
403 62 6.259 6.421 7.192 7.294 7.041 6.935 7.136 7.511 9.310 5.898 4.536 6.935 7.354 7.038 5.698 5.651
408 59 5.242 5.753 7.136 7.674 8.449 7.222 6.251 5.928 5.868 5.826 6.473 7.006 7.667 7.890 6.749 5.550
409 60 4.381 4.562 5.366 7.951 9.388 7.119 5.312 5.085 7.119 4.315 3.707 4.489 6.337 7.571 5.532 4.243
410 66 3.755 3.617 3.707 4.243 5.633 6.379 4.647 4.140 4.850 3.647 4.094 4.027 5.320 5.434 3.707 3.924
411 69 4.146 4.039 5.256 5.579 6.181 5.958 5.865 5.753 7.041 5.477 4.979 5.537 6.572 7.222 6.307 5.230
413 61 4.147 3.966 5.533 6.800 6.493 6.410 5.809 7.787 6.650 5.332 5.311 5.783 7.041 6.873 6.583 4.634
415 54 4.303 4.809 5.809 6.277 7.667 7.356 6.086 5.943 7.041 5.404 5.034 5.712 7.510 9.000 6.917 5.188
416 66 3.442 3.154 3.430 4.417 4.850 4.838 3.872 3.617 3.912 3.678 3.596 4.973 6.024 5.394 3.707 3.545
419 45 4.694 5.201 5.366 6.268 6.493 5.712 4.979 5.230 7.119 3.956 3.817 5.497 6.259 7.809 6.749 5.506
420 75 3.208 3.924 4.481 4.623 4.695 4.830 4.260 4.881 6.024 3.328 2.932 3.400 4.146 5.394 6.030 2.286
421 75 6.024 6.102 6.749 6.482 7.276 6.554 5.533 7.235 6.102 6.218 6.030 6.831 8.058 7.920 7.302 6.626
422 68 4.303 4.592 5.643 6.379 6.415 5.743 5.809 7.426 6.337 5.303 4.647 5.530 6.337 7.253 6.805 5.158
424 84 3.364 3.924 4.315 5.886 6.416 6.236 5.037 3.996 4.929 2.979 4.204 4.759 6.180 7.530 5.975 3.821
429 89 2.036 2.528 2.658 3.051 3.833 3.853 3.707 2.775 1.645 1.050 2.269 1.194 2.348 3.710 2.048 1.820
502 70 3.677 4.417 5.588 5.609 5.712 5.044 4.204 4.941 4.773 5.753 4.869 5.188 6.963 7.396 6.638 4.941
504 83 6.042 5.813 6.364 7.262 8.097 7.661 6.934 7.119 7.208 6.474 6.374 6.861 7.764 7.961 7.180 6.167

154
ID # AGE 0° 22.5° 45° 67.5° 90° 112.5° 135° 157.5° 180° 202.5° 225° 247.5° 270° 292.5° 315° 337.5°
505 73 3.931 4.462 5.274 4.560 5.528 5.351 5.628 5.726 4.847 5.140 4.537 4.459 6.514 7.922 6.639 4.759
506 66 3.646 4.552 4.324 6.656 6.771 6.014 5.053 5.147 6.771 4.764 5.281 4.990 6.844 7.069 6.268 4.045
508 74 4.000 6.038 5.441 4.679 6.000 5.798 6.865 6.156 7.069 4.889 4.675 5.019 6.292 6.994 6.158 4.576
509 62 7.355 7.749 8.677 8.324 8.105 7.422 6.983 8.294 10.500 8.855 7.661 8.149 9.250 9.367 9.178 8.151
511 72 5.014 5.880 6.384 7.156 7.514 7.826 8.191 7.608 7.681 6.891 5.912 7.089 8.362 8.405 8.014 6.995
512 62 2.366 2.273 2.792 3.935 4.865 3.570 3.661 3.604 2.312 2.481 2.667 2.261 3.292 5.012 5.480 3.530
513 50 4.333 5.195 5.363 6.401 7.431 6.828 6.433 6.644 8.514 6.056 5.343 5.446 7.500 7.054 6.197 4.955
514 56 4.278 4.839 5.500 5.486 6.167 7.207 6.354 6.481 9.194 6.272 4.832 5.696 6.972 7.782 7.926 6.752
515 69 2.063 2.238 3.005 4.008 6.490 5.511 4.699 5.639 2.782 2.524 2.615 3.463 6.240 7.197 3.204 2.609
516 91 3.480 3.310 3.992 5.046 5.583 5.279 4.272 3.660 3.907 3.440 2.666 3.409 4.469 6.418 5.694 3.203
517 75 3.188 3.379 4.780 5.168 4.365 3.616 3.293 4.205 5.281 4.043 3.020 3.563 4.635 5.736 4.972 3.581
518 79 3.490 2.424 4.419 5.573 5.708 4.730 4.537 4.525 5.396 3.878 3.690 4.329 6.792 7.452 6.423 4.620
519 52 3.944 4.070 4.537 6.487 5.361 4.994 4.753 6.789 6.153 5.084 6.413 6.080 7.444 7.756 6.767 5.757
520 58 3.292 4.209 4.292 5.205 5.556 5.345 5.520 5.483 4.583 3.294 3.919 4.534 6.306 5.987 5.077 4.191
521 77 6.563 6.894 7.115 7.567 8.771 7.950 8.324 9.246 8.167 6.813 6.791 7.044 7.834 8.502 8.559 7.656
523 74 5.153 4.931 6.364 7.326 6.847 6.900 6.246 6.051 7.389 6.480 6.462 6.695 7.278 7.421 7.071 5.978
524 74 1.181 1.220 1.188 4.290 6.222 4.802 3.437 1.213 2.431 2.430 2.779 3.529 5.944 7.227 5.912 1.290
525 71 5.896 5.714 6.292 8.885 8.958 9.191 8.353 9.192 12.396 8.852 6.953 6.976 8.000 9.484 8.310 6.585
604 52 5.958 6.058 5.907 7.504 7.834 6.984 6.703 7.873 10.500 6.225 6.055 6.497 8.125 8.324 7.631 6.592
610 56 4.000 4.826 5.136 5.579 5.778 4.878 4.331 5.047 4.792 3.529 5.019 5.754 6.583 5.871 4.498 3.933
615 57 4.021 4.133 5.466 7.047 6.333 5.220 4.950 5.702 7.292 5.513 4.670 4.692 5.333 5.468 5.023 4.848
618 59 4.208 3.938 3.956 5.265 6.938 5.898 4.832 5.537 7.083 4.604 4.773 5.925 6.240 7.277 5.804 4.499
619 60 4.986 5.770 6.600 6.155 5.583 4.946 5.225 7.637 10.528 7.273 5.392 4.842 5.847 6.947 7.219 6.195
620 53 3.750 3.993 4.410 6.073 5.626 4.942 3.930 5.225 5.569 5.372 4.135 5.099 5.958 5.847 5.039 4.220
706 61 3.542 3.885 5.289 6.837 6.646 5.994 5.304 6.263 7.709 5.270 4.980 4.771 5.646 5.496 5.068 4.070
715 51 3.514 3.516 4.607 5.535 6.361 5.974 5.628 7.485 8.278 6.285 4.508 4.106 5.014 5.367 5.549 4.555
717 63 4.486 4.691 6.197 5.841 6.042 5.497 5.510 5.947 7.486 4.671 5.195 6.339 6.944 6.629 6.256 5.715
802 79 5.806 6.053 5.971 6.766 7.375 6.538 5.578 8.478 8.097 5.814 6.267 6.658 7.819 8.338 7.690 6.285
805 74 4.903 5.563 5.902 5.887 6.347 5.857 5.578 5.942 7.958 4.836 4.087 5.283 7.306 7.756 7.160 5.741
806 80 5.015 5.553 6.423 6.722 6.556 6.232 6.403 7.062 9.347 5.940 5.323 6.533 7.361 7.878 6.934 5.868
811 76 2.292 4.348 5.058 6.055 6.069 4.888 4.380 4.854 2.833 3.157 3.830 4.630 5.486 5.101 4.056 2.785
812 93 1.724 1.117 3.349 4.407 3.556 3.467 3.713 4.746 4.472 2.847 2.023 1.899 2.000 2.997 3.575 2.476
813 74 2.945 2.595 3.271 3.945 4.486 4.523 4.047 3.652 1.905 2.056 2.829 3.565 3.820 4.447 3.860 3.425
814 88 1.938 3.052 3.786 4.530 4.063 4.423 4.154 5.652 5.583 2.722 1.856 3.698 4.354 6.143 5.826 4.039
815 81 2.802 3.469 4.250 4.437 3.750 3.530 3.418 3.741 3.438 4.242 4.272 4.827 5.021 4.750 3.256 3.314
816 63 4.656 5.525 6.659 7.677 7.469 5.957 5.915 7.020 6.438 5.929 5.274 5.232 6.979 7.889 7.425 5.793
818 63 2.302 1.983 3.462 4.385 4.948 4.443 3.617 4.199 3.990 2.922 2.873 2.714 3.750 5.362 3.631 3.376
819A 80 1.472 1.371 1.571 4.880 5.215 4.258 4.051 2.904 2.458 1.870 2.249 2.788 3.389 4.270 4.311 2.155
820 72 2.844 3.271 2.740 4.180 5.500 4.845 3.389 2.600 2.448 1.813 2.939 4.008 5.812 5.208 3.226 2.470
822 83 3.986 4.452 5.795 5.705 7.069 6.947 7.110 7.479 7.153 4.666 4.950 4.174 6.639 7.654 6.423 5.403
823 48 6.052 6.749 6.438 7.876 7.385 6.351 6.541 7.267 8.031 6.379 5.856 6.813 8.094 7.824 6.997 6.167
824 82 2.778 3.070 3.840 4.670 5.986 4.276 3.364 4.129 5.611 3.580 3.894 2.646 3.000 3.625 2.878 2.449
826 56 4.514 4.630 5.402 6.514 5.764 6.057 5.510 7.142 11.486 6.445 5.657 5.517 6.125 7.510 7.248 5.140
902 92 2.760 3.219 3.705 5.393 5.948 5.191 4.117 3.349 6.313 3.842 3.020 4.038 4.854 6.201 2.873 2.468
903 80 3.056 3.108 4.164 4.682 5.292 3.642 3.418 4.503 7.917 4.176 2.466 2.688 3.847 5.484 6.089 4.230
904 80 3.511 3.254 3.374 3.413 3.844 4.009 3.366 4.238 5.448 3.637 3.286 3.722 4.406 5.241 4.729 3.486
905 84 2.000 3.059 3.516 4.667 4.250 3.622 2.809 1.997 1.473 2.580 2.023 3.449 4.736 4.416 3.192 2.455
906 85 5.021 5.072 5.613 5.950 6.708 6.423 5.775 5.970 7.708 5.687 5.805 6.295 7.063 6.918 6.364 5.536
908B 84 1.174 1.224 1.601 2.912 4.924 2.416 2.175 1.321 2.292 2.065 2.175 3.144 3.035 4.636 4.390 1.865
909B 79 3.927 4.147 4.869 5.079 7.052 6.305 4.169 2.519 2.854 3.647 2.026 5.395 7.073 7.929 6.069 2.979

155
ID # AGE 0° 22.5° 45° 67.5° 90° 112.5° 135° 157.5° 180° 202.5° 225° 247.5° 270° 292.5° 315° 337.5°
910 74 1.896 1.567 3.292 4.220 4.448 3.716 3.072 3.381 3.542 2.414 1.879 2.485 3.781 5.313 4.795 2.725
913 85 6.181 5.553 5.745 5.418 6.306 5.565 5.529 5.759 8.097 2.858 4.753 5.258 6.889 8.156 8.387 7.781
916 78 3.307 2.442 2.829 4.392 5.014 4.844 3.752 4.328 6.875 3.356 3.516 3.555 5.167 5.457 5.952 4.852
921A 96 1.563 1.646 2.379 3.474 4.073 3.391 3.292 3.544 3.094 2.882 2.615 2.794 3.585 4.741 4.943 3.867
922 94 1.688 1.155 3.992 4.714 5.344 4.626 3.197 4.493 4.406 2.213 2.262 2.552 4.625 6.158 6.180 2.172
923B 80 2.052 1.853 2.461 4.359 4.594 3.663 2.873 2.853 2.136 2.145 2.733 2.910 4.531 4.467 3.042 2.736
925 80 4.979 5.838 6.460 6.530 6.750 6.007 5.878 6.621 8.219 6.381 5.561 6.434 6.833 7.286 6.497 5.385
927 80 5.417 4.864 5.667 7.136 6.917 6.664 6.462 6.139 8.542 5.179 4.832 5.912 7.153 7.979 7.336 5.965
1005 84 4.306 4.449 5.687 5.329 6.208 6.354 6.688 7.851 7.056 6.028 4.479 4.694 5.917 7.321 6.943 5.406
1006 73 4.969 6.428 6.011 6.057 7.219 6.292 5.834 5.468 7.875 8.223 5.230 6.270 7.333 7.690 6.997 5.683
1010 64 5.084 4.601 6.590 7.716 7.306 6.947 6.335 5.965 8.472 6.236 5.294 5.778 6.931 7.822 7.061 5.803
1017 59 6.135 6.329 5.569 6.769 7.771 7.604 6.519 6.438 9.219 7.952 7.682 7.942 8.427 8.658 7.646 6.395
1021 63 6.042 7.118 8.436 6.726 5.639 5.938 6.285 7.740 10.181 7.366 6.217 6.460 7.514 8.535 8.908 7.340
1023 79 4.501 5.359 4.459 5.736 7.111 6.994 6.452 5.847 6.834 6.193 5.313 5.070 6.250 5.876 6.050 4.715
1026 52 4.528 3.626 3.870 4.811 6.514 6.498 6.129 6.195 7.653 5.530 4.606 5.526 7.320 8.776 7.454 6.231
1103 69 4.208 4.501 5.569 5.395 5.528 5.810 5.117 5.927 6.472 5.592 5.264 5.442 6.445 7.986 6.020 5.081
1109 69 3.719 4.664 4.604 4.817 5.646 5.526 4.869 6.335 6.844 5.254 3.882 3.753 5.042 6.690 7.351 4.938
1119 62 4.556 4.232 4.832 6.664 8.431 7.193 6.443 7.616 6.611 5.766 4.881 5.834 6.986 7.264 6.315 4.261
1121 55 5.281 5.261 5.237 6.067 6.875 6.579 6.291 5.633 6.844 5.151 5.370 5.841 6.750 6.605 6.490 6.066
1122 64 4.031 4.217 5.164 6.568 6.198 4.801 4.295 6.588 6.802 4.689 3.861 4.789 6.594 7.803 6.651 4.534
1123 83 2.531 4.358 4.722 5.229 4.594 3.838 3.764 5.246 3.022 2.799 3.904 4.158 4.500 5.325 5.451 4.368
1124 84 3.365 3.138 4.538 4.887 5.115 3.647 3.359 4.305 7.615 3.559 3.618 3.755 4.563 4.973 4.964 4.002
1203 81 5.708 6.399 6.762 7.686 8.646 8.089 8.809 7.815 7.229 6.882 7.329 8.012 9.396 9.283 8.515 7.846
1213 70 6.153 6.123 6.826 7.174 7.611 7.311 7.169 7.902 11.000 7.000 6.492 7.278 8.431 8.669 7.317 6.422
1214 76 6.278 6.138 6.767 7.574 7.278 7.038 6.796 7.632 10.528 7.232 5.686 5.634 6.458 7.517 8.132 7.317
1215 75 4.958 5.349 5.137 4.380 5.097 5.444 5.883 5.251 5.764 5.107 4.508 5.039 5.903 6.542 5.981 5.130
1218 97 4.570 4.903 5.146 4.926 5.097 5.996 7.150 8.555 8.667 6.897 4.773 5.263 6.042 7.968 7.523 6.513
1305 83 3.347 3.362 3.452 5.816 6.722 4.650 4.704 5.750 5.743 3.337 3.295 3.824 4.910 5.432 4.876 4.133
1306 68 1.875 2.311 4.144 4.844 5.833 4.272 4.105 4.013 2.820 3.232 3.585 3.148 4.306 4.691 4.773 3.711
1308 96 1.306 1.429 1.208 2.739 3.743 3.650 2.259 1.654 1.938 1.131 1.493 1.816 3.431 4.168 2.456 1.305
1311 73 5.542 5.774 5.650 5.897 6.021 5.825 5.789 5.413 4.479 6.178 7.042 8.718 9.063 7.418 6.121 5.815
1312 60 4.802 5.873 6.688 8.041 9.323 8.612 7.027 7.528 6.542 5.209 5.568 6.571 7.771 8.447 6.438 4.430
1313 64 6.583 6.306 5.500 6.688 7.181 7.220 7.493 7.317 7.181 4.769 5.383 6.620 7.792 7.572 6.826 6.267
1314 64 5.639 5.328 5.452 6.309 8.167 6.850 5.647 4.887 3.875 4.859 6.590 7.401 7.028 6.766 6.177 6.025
1319 68 2.302 2.491 3.529 5.667 6.271 4.843 3.344 3.981 4.969 3.154 2.932 3.861 5.073 6.675 4.972 3.511
1325 74 2.729 2.366 1.657 5.489 8.875 7.123 4.346 2.207 1.208 1.950 4.235 6.779 8.615 7.959 4.714 3.273
1401 86 2.552 2.905 4.044 6.211 7.219 5.397 3.101 3.774 5.354 5.198 4.044 4.110 5.708 3.844 3.300 2.215
1402 72 4.847 5.442 5.235 5.936 5.889 5.832 6.649 4.635 3.875 3.038 5.146 6.525 7.028 6.491 5.578 4.844
1404 88 4.219 5.820 7.837 8.743 9.115 8.329 7.719 8.474 10.306 7.688 5.490 5.827 8.125 10.319 9.242 7.356
1405 85 4.719 4.230 4.074 5.665 7.146 6.842 5.848 5.857 6.938 4.681 5.090 5.381 7.104 7.077 6.909 5.662
1406 79 4.820 5.965 6.089 6.844 6.181 6.173 6.551 7.448 6.792 5.439 5.657 7.424 9.389 8.362 6.226 4.996
1410 82 2.542 1.909 1.805 2.246 4.406 2.814 3.167 4.308 3.594 3.737 3.550 3.869 3.063 3.511 3.838 3.370
1412 83 2.347 2.569 3.565 3.856 4.708 3.999 3.300 3.967 4.736 4.173 2.495 2.935 4.195 3.576 3.438 2.551
1414 68 3.861 3.954 4.979 6.086 7.514 6.137 4.891 5.104 6.181 4.356 4.508 5.665 6.931 9.181 9.055 5.465
1416 83 3.514 3.026 4.773 6.259 6.958 6.261 5.421 5.202 6.361 4.908 4.439 6.071 6.125 5.696 6.953 4.521
1419 73 4.722 5.012 5.510 6.452 8.208 7.740 7.336 7.549 9.500 6.378 5.755 6.155 6.597 7.412 7.101 5.790
1420 71 4.611 4.186 4.558 5.064 5.278 5.683 5.608 5.803 7.875 5.318 4.587 4.984 6.056 6.872 7.169 5.411
1421 85 2.781 3.337 4.596 5.403 4.385 3.991 3.933 4.389 1.969 1.006 2.541 2.814 3.979 4.031 3.712 2.174
1424 87 4.014 4.661 6.177 7.331 7.319 5.861 4.213 4.544 5.181 4.000 5.902 6.962 7.250 6.996 6.109 4.217
1426 74 4.750 4.488 5.127 6.620 6.028 5.329 4.400 6.045 7.361 4.509 4.694 5.263 6.389 6.992 7.150 6.257

156
Appendix E: Research Sample Remodeling Data

157
INDI
V #
Ost
eons
Frag
sO
PD
Ost
eons
Frag
sO
PD
Ost
eons
Frag
sO
PD
Ost
eons
Frag
sO
PD
Ost
eons
Frag
sO
PD
Ost
eons
Frag
sO
PD
Ost
eons
Frag
sO
PD
Ost
eons
Frag
sO
PD
239
615
.000
505
18.3
3335
312
.667
553
19.3
3329
310
.667
432
15.0
0038
113
.000
543
19.0
005
434
15.6
6749
317
.333
483
17.0
0064
021
.333
620
20.6
6741
013
.667
490
16.3
3345
015
.000
636
413
.333
541
18.3
3353
017
.667
520
17.3
3338
012
.667
520
17.3
3355
018
.333
551
18.6
678
3313
15.3
3346
115
.667
690
23.0
0050
016
.667
680
22.6
6748
216
.667
610
20.3
3336
012
.000
960
120
.333
683
23.6
6751
117
.333
563
19.6
6759
120
.000
450
15.0
0049
016
.333
630
21.0
0011
460
15.3
3360
220
.667
591
20.0
0061
120
.667
400
13.3
3345
215
.667
542
18.6
6763
021
.000
1440
113
.667
451
15.3
3335
112
.000
470
15.6
6747
116
.000
444
16.0
0029
09.
667
360
12.0
0015
580
19.3
3357
019
.000
620
20.6
6782
328
.333
721
24.3
3389
230
.333
673
23.3
3362
020
.667
1766
022
.000
763
26.3
3381
127
.333
119
742
.000
731
24.6
6776
426
.667
741
25.0
0011
40
38.0
0018
513
18.0
0040
113
.667
570
19.0
0063
021
.000
520
17.3
3345
115
.333
510
17.0
0070
023
.333
1940
013
.333
333
12.0
0057
119
.333
570
19.0
0040
013
.333
390
13.0
0054
018
.000
571
19.3
3322
784
27.3
3392
030
.667
108
036
.000
982
33.3
3386
129
.000
751
25.3
3384
028
.000
731
24.6
6725
402
14.0
0060
120
.333
160
5.33
375
025
.000
730
24.3
3339
013
.000
402
14.0
0052
218
.000
2743
014
.333
521
17.6
6745
115
.333
520
17.3
3341
214
.333
472
16.3
3346
015
.333
560
18.6
6710
141
013
.667
541
18.3
3336
313
.000
441
15.0
0036
212
.667
400
13.3
3333
412
.333
420
14.0
0010
256
219
.333
451
15.3
3365
222
.333
632
21.6
6751
719
.333
675
24.0
0064
021
.333
551
18.6
6710
347
316
.667
520
17.3
3367
022
.333
790
26.3
3372
224
.667
700
23.3
3347
015
.667
510
17.0
0010
446
216
.000
282
10.0
0034
412
.667
431
14.6
6726
510
.333
310
10.3
3352
418
.667
293
10.6
6710
551
318
.000
641
21.6
6764
021
.333
720
24.0
0046
216
.000
730
24.3
3367
022
.333
630
21.0
0010
648
216
.667
360
12.0
0048
016
.000
470
15.6
6751
017
.000
421
14.3
3346
115
.667
442
15.3
3310
745
115
.333
501
17.0
0066
122
.333
730
24.3
3352
017
.333
700
23.3
3345
316
.000
560
18.6
6710
866
022
.000
592
20.3
3340
314
.333
674
23.6
6754
118
.333
454
16.3
3351
017
.000
560
18.6
6710
950
117
.000
361
12.3
3350
016
.667
502
17.3
3353
118
.000
504
18.0
0036
012
.000
500
16.6
6711
058
119
.667
643
22.3
3367
022
.333
730
24.3
3374
125
.000
770
25.6
6766
022
.000
680
22.6
6711
342
014
.000
441
15.0
0057
019
.000
502
17.3
3338
113
.000
600
20.0
0051
117
.333
513
18.0
0011
750
016
.667
491
16.6
6747
015
.667
640
21.3
3343
014
.333
480
16.0
0048
317
.000
620
20.6
6711
957
019
.000
651
22.0
0051
017
.000
520
17.3
3359
220
.333
610
20.3
3346
015
.333
510
17.0
0012
064
121
.667
771
26.0
0065
322
.667
840
28.0
0074
024
.667
640
21.3
3366
222
.667
850
28.3
3312
144
014
.667
540
18.0
0056
018
.667
380
12.6
6765
021
.667
471
16.0
0057
219
.667
463
16.3
3312
452
017
.333
475
17.3
3358
019
.333
594
21.0
0049
116
.667
591
20.0
0050
117
.000
586
21.3
3312
535
513
.333
323
11.6
6727
09.
000
481
16.3
3331
010
.333
350
11.6
673
01.
000
482
16.6
6712
664
121
.667
256
10.3
3352
017
.333
660
22.0
0076
125
.667
630
21.0
0058
019
.333
334
12.3
3312
760
120
.333
672
23.0
0038
012
.667
670
22.3
3354
218
.667
571
19.3
3349
116
.667
762
26.0
0012
843
014
.333
600
20.0
0064
121
.667
790
26.3
3346
015
.333
600
20.0
0070
023
.333
680
22.6
6712
950
016
.667
510
17.0
0053
017
.667
720
24.0
0056
018
.667
610
20.3
3357
019
.000
720
24.0
0013
062
020
.667
541
18.3
3355
118
.667
530
17.6
6745
115
.333
431
14.6
6751
017
.000
550
18.3
3313
253
017
.667
541
18.3
3363
021
.000
790
26.3
3369
023
.000
540
18.0
0062
020
.667
840
28.0
0013
363
121
.333
641
21.6
6750
117
.000
811
27.3
3384
028
.000
590
19.6
6759
120
.000
560
18.6
6713
642
014
.000
622
21.3
3337
413
.667
511
17.3
3356
219
.333
441
15.0
0046
216
.000
366
14.0
0020
351
418
.333
683
23.6
6763
021
.000
530
17.6
6771
124
.000
510
17.0
0062
020
.667
710
23.6
6720
470
123
.667
532
18.3
3373
024
.333
701
23.6
6762
020
.667
620
20.6
6760
020
.000
680
22.6
6720
538
113
.000
403
14.3
3374
024
.667
700
23.3
3358
119
.667
622
21.3
3358
019
.333
622
21.3
3320
869
023
.000
654
23.0
0061
120
.667
660
22.0
0065
021
.667
614
21.6
6761
020
.333
591
20.0
0020
942
515
.667
504
18.0
0049
1220
.333
513
18.0
0056
921
.667
573
20.0
0043
616
.333
443
15.6
6721
454
018
.000
540
18.0
0052
017
.333
590
19.6
6762
121
.000
500
16.6
6753
017
.667
490
16.3
3321
632
311
.667
397
15.3
3346
316
.333
294
11.0
0029
511
.333
353
12.6
6738
414
.000
330
11.0
0021
754
018
.000
520
17.3
3356
018
.667
681
23.0
0050
117
.000
521
17.6
6750
016
.667
611
20.6
6721
848
216
.667
680
22.6
6748
517
.667
531
18.0
0054
118
.333
511
17.3
3339
013
.000
460
15.3
3321
944
014
.667
670
22.3
3349
016
.333
620
20.6
6748
116
.333
400
13.3
3340
013
.333
520
17.3
3322
046
015
.333
600
20.0
0043
014
.333
451
15.3
3346
015
.333
480
16.0
0050
016
.667
460
15.3
33
Imax
Ant
Imax
Post
Imin
Med
Imin
Lat
ANTE
RIO
RPO
STER
IOR
MED
IAL
LATE
RAL

158
INDI
V #
Ost
eons
Frag
sO
PD
Ost
eons
Frag
sO
PD
Ost
eons
Frag
sO
PD
Ost
eons
Frag
sO
PD
Ost
eons
Frag
sO
PD
Ost
eons
Frag
sO
PD
Ost
eons
Frag
sO
PD
Ost
eons
Frag
sO
PD
222
660
22.0
0072
124
.333
630
21.0
0064
021
.333
580
19.3
3356
018
.667
620
20.6
6757
019
.000
224
280
9.33
337
012
.333
590
19.6
6755
018
.333
300
10.0
0032
010
.667
500
16.6
6748
016
.000
225
510
17.0
0060
220
.667
534
19.0
0060
020
.000
582
20.0
0055
118
.667
481
16.3
3357
219
.667
226
510
17.0
0071
023
.667
551
18.6
6767
223
.000
392
13.6
6769
023
.000
661
22.3
3354
018
.000
227
609
23.0
0050
418
.000
688
25.3
3352
218
.000
4011
17.0
0076
326
.333
695
24.6
6774
024
.667
228
413
14.6
6737
112
.667
380
12.6
6746
115
.667
461
15.6
6740
013
.333
462
16.0
0041
013
.667
233
480
16.0
0039
013
.000
5810
22.6
6740
013
.333
400
13.3
3362
221
.333
521
17.6
6744
416
.000
250
610
20.3
3371
425
.000
650
21.6
6767
022
.333
551
18.6
6769
023
.000
640
21.3
3364
121
.667
251
782
26.6
6768
223
.333
741
25.0
0089
531
.333
925
32.3
3371
023
.667
561
19.0
0068
323
.667
252
5311
21.3
3349
116
.667
550
18.3
3355
1021
.667
551
18.6
6744
416
.000
555
20.0
0053
318
.667
253
402
14.0
0033
412
.333
505
18.3
3357
019
.000
630
21.0
0067
624
.333
230
7.66
724
610
.000
255
605
21.6
6757
320
.000
697
25.3
3372
927
.000
628
23.3
3363
021
.000
5110
20.3
3339
815
.667
257
510
17.0
0055
419
.667
682
23.3
3373
225
.000
560
18.6
6754
218
.667
822
28.0
0077
326
.667
301
328
13.3
3346
115
.667
652
22.3
3360
020
.000
473
16.6
6752
218
.000
392
13.6
6752
218
.000
302
643
22.3
3366
323
.000
631
21.3
3373
124
.667
800
26.6
6753
017
.667
630
21.0
0061
120
.667
303
520
17.3
3351
318
.000
782
26.6
6767
022
.333
820
27.3
3364
021
.333
490
16.3
3365
122
.000
304
611
20.6
6745
015
.000
542
18.6
6766
122
.333
671
22.6
6750
217
.333
452
15.6
6759
019
.667
305
525
19.0
0056
018
.667
660
22.0
0070
023
.333
630
21.0
0061
221
.000
510
17.0
0049
016
.333
306
462
16.0
0042
315
.000
490
16.3
3350
016
.667
421
14.3
3351
217
.667
503
17.6
6751
017
.000
307
394
14.3
3363
121
.333
411
14.0
0051
518
.667
321
11.0
0050
217
.333
470
15.6
6749
317
.333
308
390
13.0
0033
111
.333
500
16.6
6764
422
.667
401
13.6
6737
012
.333
401
13.6
6771
023
.667
309
441
15.0
0058
019
.333
620
20.6
6753
017
.667
501
17.0
0046
015
.333
461
15.6
6748
016
.000
311
500
16.6
6758
019
.333
610
20.3
3368
022
.667
540
18.0
0068
123
.000
570
19.0
0070
023
.333
313
474
17.0
0036
012
.000
550
18.3
3351
117
.333
600
20.0
0054
018
.000
433
15.3
3340
013
.333
314
590
19.6
6766
122
.333
630
21.0
0065
021
.667
692
23.6
6777
025
.667
560
18.6
6768
022
.667
315
510
17.0
0062
020
.667
460
15.3
3354
018
.000
693
24.0
0052
017
.333
420
14.0
0066
022
.000
316
621
21.0
0053
118
.000
941
31.6
6794
031
.333
860
28.6
6792
030
.667
782
26.6
6767
022
.333
319
531
18.0
0042
616
.000
601
20.3
3369
023
.000
531
18.0
0047
116
.000
600
20.0
0072
024
.000
320
450
15.0
0058
019
.333
660
22.0
0056
018
.667
620
20.6
6756
018
.667
601
20.3
3337
012
.333
321
430
14.3
3348
216
.667
650
21.6
6775
025
.000
600
20.0
0057
019
.000
591
20.0
0077
025
.667
322
600
20.0
0046
015
.333
630
21.0
0050
016
.667
570
19.0
0063
021
.000
650
21.6
6752
017
.333
324
690
23.0
0051
017
.000
490
16.3
3353
118
.000
601
20.3
3358
420
.667
510
17.0
0052
017
.333
329
430
14.3
3354
018
.000
482
16.6
6759
220
.333
590
19.6
6753
017
.667
360
12.0
0054
018
.000
402A
400
13.3
3344
014
.667
580
19.3
3357
019
.000
410
13.6
6755
018
.333
331
11.3
3356
018
.667
403
350
11.6
6732
512
.333
300
10.0
0052
017
.333
222
8.00
028
09.
333
400
13.3
3345
015
.000
408
630
21.0
0049
116
.667
570
19.0
0071
023
.667
641
21.6
6757
019
.000
710
23.6
6771
023
.667
409
700
23.3
3363
021
.000
470
15.6
6779
026
.333
910
30.3
3365
021
.667
700
23.3
3356
018
.667
410
461
15.6
6754
018
.000
600
20.0
0042
014
.000
430
14.3
3362
020
.667
381
13.0
0043
014
.333
411
470
15.6
6747
015
.667
480
16.0
0051
117
.333
570
19.0
0054
018
.000
430
14.3
3349
016
.333
413
370
12.3
3343
014
.333
430
14.3
3360
020
.000
370
12.3
3345
015
.000
511
17.3
3364
021
.333
415
480
16.0
0027
29.
667
621
21.0
0061
020
.333
561
19.0
0050
016
.667
333
12.0
0047
015
.667
416
610
20.3
3354
118
.333
700
23.3
3381
027
.000
680
22.6
6771
023
.667
560
18.6
6751
017
.000
419
321
11.0
0034
312
.333
441
15.0
0051
418
.333
493
17.3
3335
011
.667
333
12.0
0044
215
.333
420
650
21.6
6763
021
.000
770
25.6
6769
023
.000
691
23.3
3370
023
.333
750
25.0
0074
125
.000
421
510
17.0
0051
117
.333
530
17.6
6764
021
.333
440
14.6
6757
119
.333
510
17.0
0067
022
.333
422
540
18.0
0041
013
.667
590
19.6
6756
018
.667
510
17.0
0047
015
.667
560
18.6
6758
019
.333
424
490
16.3
3365
021
.667
700
23.3
3372
024
.000
660
22.0
0072
024
.000
560
18.6
6758
019
.333
429
422
14.6
6745
215
.667
490
16.3
3347
015
.667
390
13.0
0047
015
.667
360
12.0
0046
115
.667
502
362
12.6
6757
019
.000
410
13.6
6762
020
.667
412
14.3
3353
118
.000
570
19.0
0061
020
.333
504
553
19.3
3350
016
.667
730
24.3
3354
018
.000
650
21.6
6756
119
.000
591
20.0
0071
224
.333
Imin
Med
Imin
Lat
ANTE
RIO
RPO
STER
IOR
MED
IAL
LATE
RAL
Imax
Ant
Imax
Post

159
INDI
V #
Ost
eons
Frag
sO
PD
Ost
eons
Frag
sO
PD
Ost
eons
Frag
sO
PD
Ost
eons
Frag
sO
PD
Ost
eons
Frag
sO
PD
Ost
eons
Frag
sO
PD
Ost
eons
Frag
sO
PD
Ost
eons
Frag
sO
PD
505
620
20.6
6751
117
.333
560
18.6
6771
023
.667
540
18.0
0061
020
.333
630
21.0
0071
124
.000
506
332
11.6
6736
212
.667
690
23.0
0079
026
.333
502
17.3
3331
110
.667
590
19.6
6771
023
.667
508
370
12.3
3342
014
.000
602
20.6
6763
021
.000
600
20.0
0061
020
.333
480
16.0
0055
118
.667
509
620
20.6
6755
018
.333
680
22.6
6771
023
.667
591
20.0
0046
015
.333
601
20.3
3384
228
.667
511
561
19.0
0076
025
.333
541
18.3
3350
016
.667
460
15.3
3357
019
.000
470
15.6
6773
024
.333
512
432
15.0
0036
313
.000
393
14.0
0043
415
.667
411
14.0
0045
015
.000
440
14.6
6734
212
.000
513
330
11.0
0033
211
.667
341
11.6
6746
216
.000
361
12.3
3339
213
.667
421
14.3
3345
115
.333
514
550
18.3
3348
116
.333
491
16.6
6759
019
.667
700
23.3
3358
521
.000
552
19.0
0051
017
.000
515
466
17.3
3348
216
.667
513
18.0
0044
315
.667
444
16.0
0058
019
.333
462
16.0
0048
216
.667
516
353
12.6
6744
014
.667
461
15.6
6743
014
.333
363
13.0
0054
118
.333
530
17.6
6751
017
.000
517
510
17.0
0059
120
.000
592
20.3
3370
224
.000
533
18.6
6743
114
.667
643
22.3
3375
025
.000
518
501
17.0
0056
119
.000
770
25.6
6756
119
.000
410
13.6
6745
015
.000
700
23.3
3368
022
.667
519
361
12.3
3344
014
.667
850
28.3
3374
024
.667
440
14.6
6737
213
.000
721
24.3
3367
022
.333
520
522
18.0
0062
321
.667
702
24.0
0079
026
.333
720
24.0
0057
019
.000
501
17.0
0066
222
.667
521
510
17.0
0059
120
.000
531
18.0
0048
016
.000
472
16.3
3357
019
.000
500
16.6
6749
016
.333
523
502
17.3
3353
017
.667
521
17.6
6763
021
.000
490
16.3
3351
017
.000
600
20.0
0058
019
.333
524
251
8.66
749
016
.333
531
18.0
0069
023
.000
710
23.6
6750
117
.000
243
9.00
036
112
.333
525
800
26.6
6785
329
.333
575
20.6
6763
021
.000
910
30.3
3366
122
.333
551
18.6
6770
023
.333
604
460
15.3
3346
115
.667
450
15.0
0050
016
.667
430
14.3
3332
010
.667
490
16.3
3347
015
.667
610
360
12.0
0040
414
.667
573
20.0
0047
116
.000
530
17.6
6768
022
.667
621
21.0
0054
319
.000
615
440
14.6
6728
09.
333
503
17.6
6753
118
.000
490
16.3
3336
012
.000
451
15.3
3346
115
.667
618
680
22.6
6773
024
.333
760
25.3
3380
026
.667
780
26.0
0076
025
.333
590
19.6
6769
023
.000
619
731
24.6
6762
020
.667
660
22.0
0081
127
.333
680
22.6
6749
016
.333
630
21.0
0088
029
.333
620
440
14.6
6748
016
.000
640
21.3
3362
020
.667
370
12.3
3374
024
.667
470
15.6
6766
022
.000
706
470
15.6
6749
016
.333
610
20.3
3358
019
.333
431
14.6
6743
014
.333
410
13.6
6754
018
.000
715
571
19.3
3365
021
.667
650
21.6
6759
019
.667
520
17.3
3358
019
.333
710
23.6
6765
021
.667
717
520
17.3
3356
119
.000
671
22.6
6773
024
.333
520
17.3
3353
017
.667
640
21.3
3363
021
.000
802
510
17.0
0037
213
.000
681
23.0
0072
626
.000
590
19.6
6759
120
.000
720
24.0
0071
023
.667
805
501
17.0
0070
123
.667
600
20.0
0084
028
.000
520
17.3
3348
016
.000
574
20.3
3376
025
.333
806
580
19.3
3341
013
.667
711
24.0
0070
123
.667
570
19.0
0055
018
.333
710
23.6
6762
121
.000
811
620
20.6
6743
014
.333
600
20.0
0058
019
.333
642
22.0
0048
016
.000
582
20.0
0061
020
.333
812
612
21.0
0058
019
.333
850
28.3
3371
023
.667
760
25.3
3363
121
.333
871
29.3
3373
124
.667
813
556
20.3
3348
016
.000
732
25.0
0068
022
.667
640
21.3
3374
024
.667
511
17.3
3369
123
.333
814
560
18.6
6765
222
.333
700
23.3
3375
025
.000
640
21.3
3360
521
.667
701
23.6
6770
023
.333
815
651
22.0
0034
011
.333
470
15.6
6757
019
.000
451
15.3
3354
018
.000
450
15.0
0046
015
.333
816
510
17.0
0051
017
.000
400
13.3
3363
021
.000
520
17.3
3352
218
.000
550
18.3
3369
223
.667
818
420
14.0
0053
318
.667
594
21.0
0061
020
.333
480
16.0
0058
019
.333
530
17.6
6754
018
.000
819A
242
8.66
743
014
.333
330
11.0
0044
014
.667
433
15.3
3342
014
.000
230
7.66
731
110
.667
820
281
9.66
743
114
.667
571
19.3
3343
114
.667
302
10.6
6755
219
.000
2713
13.3
3336
915
.000
822
540
18.0
0044
115
.000
440
14.6
6747
015
.667
522
18.0
0047
116
.000
420
14.0
0051
017
.000
823
350
11.6
6745
115
.333
355
13.3
3351
518
.667
340
11.3
3339
013
.000
430
14.3
3353
017
.667
824
543
19.0
0078
427
.333
843
29.0
0075
326
.000
580
19.3
3374
125
.000
764
26.6
6780
528
.333
826
450
15.0
0047
015
.667
550
18.3
3370
023
.333
540
18.0
0040
013
.333
532
18.3
3364
021
.333
902
590
19.6
6757
019
.000
670
22.3
3366
022
.000
610
20.3
3375
025
.000
440
14.6
6751
217
.667
903
623
21.6
6753
017
.667
540
18.0
0058
019
.333
590
19.6
6748
116
.333
551
18.6
6761
221
.000
904
3510
15.0
0037
213
.000
561
19.0
0069
524
.667
409
16.3
3356
420
.000
510
17.0
0069
023
.000
905
577
21.3
3357
119
.333
541
18.3
3364
222
.000
536
19.6
6758
019
.333
570
19.0
0067
122
.667
906
600
20.0
0073
225
.000
611
20.6
6762
121
.000
660
22.0
0071
023
.667
650
21.6
6750
117
.000
908B
340
11.3
3341
013
.667
590
19.6
6756
119
.000
460
15.3
3339
013
.000
400
13.3
3350
016
.667
909B
374
13.6
6739
013
.000
590
19.6
6762
020
.667
531
18.0
0055
018
.333
351
12.0
0045
115
.333
ANTE
RIO
RPO
STER
IOR
MED
IAL
LATE
RAL
Imax
Ant
Imax
Post
Imin
Med
Imin
Lat

160
INDI
V #
Ost
eons
Frag
sO
PD
Ost
eons
Frag
sO
PD
Ost
eons
Frag
sO
PD
Ost
eons
Frag
sO
PD
Ost
eons
Frag
sO
PD
Ost
eons
Frag
sO
PD
Ost
eons
Frag
sO
PD
Ost
eons
Frag
sO
PD
910
390
13.0
0043
114
.667
340
11.3
3334
011
.333
471
16.0
0040
013
.333
350
11.6
6739
213
.667
913
473
16.6
6738
012
.667
521
17.6
6758
320
.333
550
18.3
3352
017
.333
420
14.0
0058
019
.333
916
523
18.3
3358
220
.000
620
20.6
6776
125
.667
591
20.0
0053
017
.667
530
17.6
6780
127
.000
921A
421
14.3
3351
017
.000
480
16.0
0044
014
.667
481
16.3
3357
019
.000
341
11.6
6760
020
.000
922
478
18.3
3349
417
.667
529
20.3
3388
731
.667
742
25.3
3375
225
.667
498
19.0
0055
018
.333
923B
292
10.3
3344
215
.333
440
14.6
6742
014
.000
470
15.6
6752
017
.333
282
10.0
0030
010
.000
925
560
18.6
6756
119
.000
460
15.3
3375
225
.667
490
16.3
3352
017
.333
360
12.0
0067
022
.333
927
791
26.6
6780
127
.000
826
29.3
3369
223
.667
720
24.0
0077
025
.667
840
28.0
0081
027
.000
1005
670
22.3
3360
120
.333
580
19.3
3359
120
.000
741
25.0
0055
219
.000
550
18.3
3354
018
.000
1006
570
19.0
0058
019
.333
460
15.3
3359
019
.667
530
17.6
6774
024
.667
622
21.3
3364
021
.333
1010
540
18.0
0049
116
.667
571
19.3
3356
018
.667
693
24.0
0045
015
.000
610
20.3
3349
217
.000
1017
490
16.3
3346
115
.667
440
14.6
6748
016
.000
441
15.0
0048
116
.333
480
16.0
0043
917
.333
1021
570
19.0
0064
121
.667
670
22.3
3386
028
.667
570
19.0
0069
223
.667
561
19.0
0080
026
.667
1023
550
18.3
3358
420
.667
520
17.3
3369
123
.333
640
21.3
3349
016
.333
430
14.3
3340
013
.333
1026
964
33.3
3392
030
.667
670
22.3
3365
322
.667
931
31.3
3354
018
.000
522
18.0
0055
018
.333
1103
510
17.0
0055
118
.667
630
21.0
0069
023
.000
570
19.0
0070
023
.333
540
18.0
0066
122
.333
1109
500
16.6
6754
218
.667
460
15.3
3361
221
.000
470
15.6
6765
021
.667
530
17.6
6750
117
.000
1119
600
20.0
0039
013
.000
551
18.6
6755
018
.333
660
22.0
0043
014
.333
570
19.0
0054
018
.000
1121
522
18.0
0043
114
.667
572
19.6
6769
023
.000
560
18.6
6763
021
.000
540
18.0
0051
418
.333
1122
381
13.0
0048
417
.333
624
22.0
0081
328
.000
563
19.6
6750
719
.000
730
24.3
3382
027
.333
1123
450
15.0
0046
115
.667
470
15.6
6746
517
.000
445
16.3
3345
115
.333
376
14.3
3346
115
.667
1124
562
19.3
3359
019
.667
550
18.3
3361
221
.000
461
15.6
6746
015
.333
612
21.0
0073
024
.333
1203
510
17.0
0062
321
.667
601
20.3
3365
021
.667
522
18.0
0063
522
.667
521
17.6
6762
221
.333
1213
721
24.3
3381
528
.667
570
19.0
0087
029
.000
720
24.0
0069
023
.000
580
19.3
3385
128
.667
1214
630
21.0
0063
121
.333
540
18.0
0066
022
.000
520
17.3
3357
019
.000
610
20.3
3354
118
.333
1215
480
16.0
0039
013
.000
410
13.6
6755
018
.333
510
17.0
0044
115
.000
460
15.3
3362
321
.667
1218
650
21.6
6793
231
.667
751
25.3
3378
226
.667
760
25.3
3381
027
.000
781
26.3
3367
223
.000
1305
500
16.6
6759
120
.000
691
23.3
3379
026
.333
104
135
.000
694
24.3
3370
023
.333
690
23.0
0013
0645
015
.000
520
17.3
3348
116
.333
561
19.0
0045
115
.333
390
13.0
0052
218
.000
543
19.0
0013
0827
912
.000
420
14.0
0054
018
.000
561
19.0
0045
416
.333
602
20.6
6730
612
.000
343
12.3
3313
1137
012
.333
642
22.0
0057
019
.000
662
22.6
6743
014
.333
563
19.6
6754
018
.000
680
22.6
6713
1257
119
.333
440
14.6
6768
123
.000
670
22.3
3365
222
.333
624
22.0
0052
017
.333
560
18.6
6713
1342
214
.667
500
16.6
6744
014
.667
554
19.6
6748
216
.667
461
15.6
6752
820
.000
500
16.6
6713
1458
019
.333
600
20.0
0066
022
.000
640
21.3
3351
017
.000
671
22.6
6759
019
.667
621
21.0
0013
1960
220
.667
500
16.6
6773
024
.333
760
25.3
3360
020
.000
471
16.0
0070
023
.333
630
21.0
0013
2534
212
.000
392
13.6
6734
111
.667
345
13.0
0039
1116
.667
451
15.3
3332
010
.667
562
19.3
3314
0142
014
.000
391
13.3
3363
121
.333
480
16.0
0044
115
.000
544
19.3
3335
011
.667
422
14.6
6714
0244
014
.667
375
14.0
0054
018
.000
690
23.0
0064
021
.333
571
19.3
3360
120
.333
580
19.3
3314
0462
321
.667
744
26.0
0049
016
.333
630
21.0
0076
426
.667
540
18.0
0064
021
.333
692
23.6
6714
0552
418
.667
640
21.3
3357
019
.000
560
18.6
6761
120
.667
530
17.6
6754
118
.333
511
17.3
3314
0652
418
.667
7114
28.3
3370
023
.333
832
28.3
3353
318
.667
711
24.0
0061
020
.333
760
25.3
3314
1040
314
.333
398
15.6
6755
219
.000
520
17.3
3346
416
.667
582
20.0
0043
716
.667
423
15.0
0014
1248
417
.333
550
18.3
3372
325
.000
694
24.3
3363
121
.333
610
20.3
3365
222
.333
741
25.0
0014
1450
117
.000
412
14.3
3346
015
.333
520
17.3
3353
017
.667
583
20.3
3341
114
.000
471
16.0
0014
1667
223
.000
723
25.0
0067
022
.333
702
24.0
0072
124
.333
710
23.6
6762
723
.000
630
21.0
0014
1952
418
.667
611
20.6
6758
220
.000
602
20.6
6751
017
.000
580
19.3
3353
118
.000
601
20.3
3314
2045
115
.333
332
11.6
6769
123
.333
502
17.3
3361
120
.667
520
17.3
3358
220
.000
480
16.0
0014
2151
117
.333
514
18.3
3344
115
.000
413
14.6
6742
114
.333
462
16.0
0042
214
.667
500
16.6
6714
2459
220
.333
530
17.6
6777
126
.000
740
24.6
6762
020
.667
690
23.0
0067
022
.333
650
21.6
6714
2669
023
.000
490
16.3
3358
019
.333
720
24.0
0070
123
.667
570
19.0
0061
020
.333
751
25.3
33
Imin
Med
Imin
Lat
ANTE
RIO
RPO
STER
IOR
MED
IAL
LATE
RAL
Imax
Ant
Imax
Post

161
Appendix F: Research Sample Remodeling Data Images

162

163

164

165

166

167

168

169

170

171

172

173

174

175

176

177

178

179

180
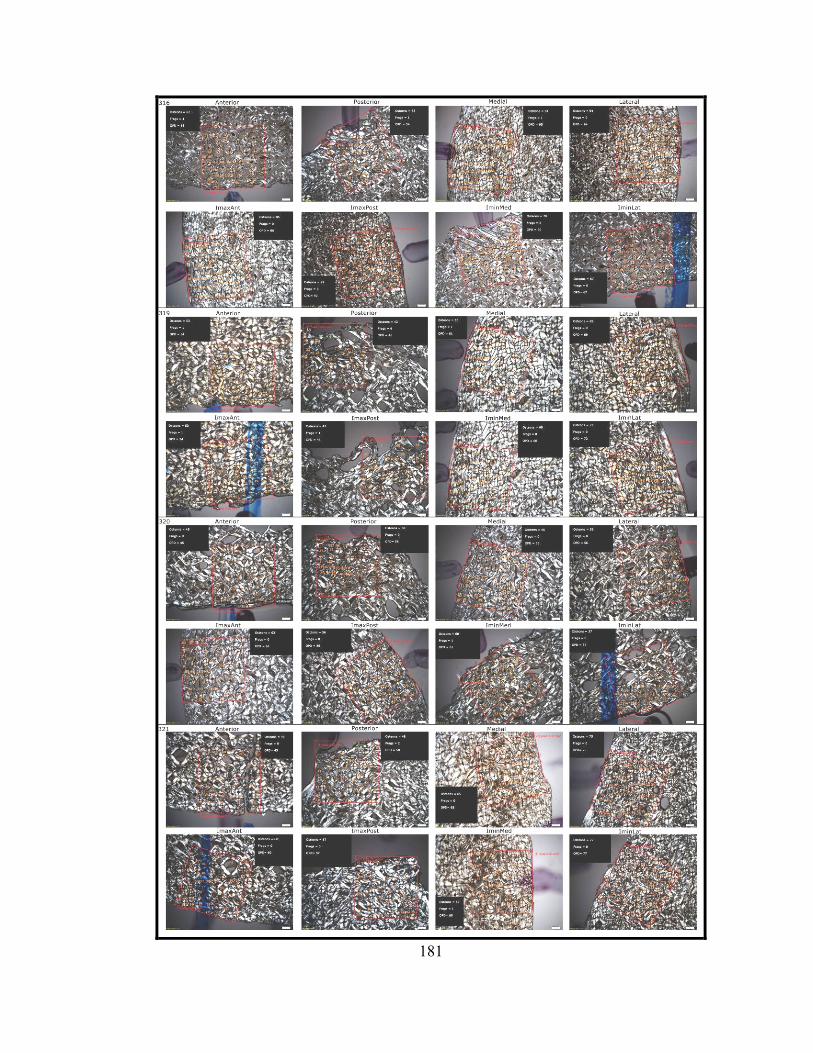
181

182

183

184

185

186

187

188

189

190

191

192

193

194

195

196

197

198

199

200

201

202

203

204

205

206

207

208

209

210

211