Lateral dendritic shunt inhibition can regularize mitral cell spike patterning
14
Lateral dendritic shunt inhibition can regularize mitral cell spike patterning François David & Christiane Linster & Thomas A. Cleland Received: 13 November 2006 / Revised: 30 October 2007 / Accepted: 30 October 2007 / Published online: 1 December 2007 # Springer Science + Business Media, LLC 2007 Abstract Mitral cells, the principal output neurons of the olfactory bulb, receive direct synaptic activation from primary sensory neurons. Shunting inhibitory inputs deliv- ered by granule cell interneurons onto mitral cell lateral dendrites, while poorly positioned to prevent spike initia- tion, are believed to influence spike timing and underlie coordinated field potential oscillations. We investigated this phenomenon in a reduced compartmental mitral cell model suitable for incorporation into network simulations. Lateral dendritic shunt conductances delayed spiking to a degree dependent on both their electrotonic distance and phase of onset. Moreover, when the afferent activation of mitral cells was loosely coordinated in time, recurrent inhibition significantly narrowed the distribution of mitral cell spike times, illustrating a tendency towards coordinated synchro- nous activity. However, if mitral cell activity was initially disorganized, recurrent inhibition actually increased the variance in spike timing. This result suggests an essential role for early mechanisms of temporal coordination in olfaction, such as sniffing and the initial synchronization of mitral cell intrinsic oscillations by periglomerular cell- mediated inhibition. Keywords GABA A . Granule cell . Synchronization . Olfactory bulb . Shunt inhibition 1 Introduction While inhibition in the glomerular layer of the olfactory bulb is thought to shape mitral cell responses to odorants locally and regulate spike initiation (Linster and Gervais 1996; Linster and Hasselmo 1997; Aungst et al. 2003; Cleland and Sethupathy 2006), dendrodendritic synaptic interactions between mitral and granule cells in the mammalian olfactory bulb (Jahr and Nicoll 1982) are credited with regulating spike synchronization among mitral cells (Schoppa 2006b), control of network local field potential (LFP) oscillations (Lagier et al. 2004), and changes in the dynamics of olfactory bulb responses to odorants (Eeckman and Freeman 1990; Nusser et al. 2001; Davison et al. 2003). However, it remains unclear how well these inhibitory synaptic interactions, distributed along the extensive lateral dendrites at locations up to hundreds of micrometers from mitral cells’ spike-initiating zones, could effectively shape the timing of mitral cell spikes and the synchronization of neural activity across the olfactory bulb. Previous models of olfactory bulb processing have shown that the feedback interactions among mitral and granule cells can underlie broad oscillations in the olfactory bulb comparable to those observed in electrophysiological studies (Rall and Shepherd 1968; Li and Hopfield 1989; Davison et al. 2003; Bathellier et al. 2006; Galan et al. 2006). While these models illustrate how the relevant dynamics can be created by these coupled oscillators, it is not clear how spike timing in individual mitral cells can be influenced by the inhibitory inputs on their lateral dendrites that are delivered by granule cells. We used a compartmental model J Comput Neurosci (2008) 25:25–38 DOI 10.1007/s10827-007-0063-5 Action Editor: James M. Bower F. David : C. Linster Department of Neurobiology and Behavior, Cornell University, Ithaca, NY 14853, USA F. David (*) Neurosciences Sensorielles Comportement Cognition, CNRS-Université Claude Bernard Lyon 1, 50, Avenue Tony Garnier, 69366 Lyon Cedex 07, France e-mail: [email protected] T. A. Cleland Department of Psychology, Cornell University, Ithaca, NY 14853, USA
Transcript of Lateral dendritic shunt inhibition can regularize mitral cell spike patterning

Lateral dendritic shunt inhibition can regularize mitralcell spike patterning
François David & Christiane Linster &
Thomas A. Cleland
Received: 13 November 2006 /Revised: 30 October 2007 /Accepted: 30 October 2007 / Published online: 1 December 2007# Springer Science + Business Media, LLC 2007
Abstract Mitral cells, the principal output neurons of theolfactory bulb, receive direct synaptic activation fromprimary sensory neurons. Shunting inhibitory inputs deliv-ered by granule cell interneurons onto mitral cell lateraldendrites, while poorly positioned to prevent spike initia-tion, are believed to influence spike timing and underliecoordinated field potential oscillations. We investigated thisphenomenon in a reduced compartmental mitral cell modelsuitable for incorporation into network simulations. Lateraldendritic shunt conductances delayed spiking to a degreedependent on both their electrotonic distance and phase ofonset. Moreover, when the afferent activation of mitral cellswas loosely coordinated in time, recurrent inhibitionsignificantly narrowed the distribution of mitral cell spiketimes, illustrating a tendency towards coordinated synchro-nous activity. However, if mitral cell activity was initiallydisorganized, recurrent inhibition actually increased thevariance in spike timing. This result suggests an essentialrole for early mechanisms of temporal coordination inolfaction, such as sniffing and the initial synchronization ofmitral cell intrinsic oscillations by periglomerular cell-mediated inhibition.
Keywords GABAA. Granule cell . Synchronization .
Olfactory bulb . Shunt inhibition
1 Introduction
While inhibition in the glomerular layer of the olfactorybulb is thought to shape mitral cell responses to odorantslocally and regulate spike initiation (Linster and Gervais1996; Linster and Hasselmo 1997; Aungst et al. 2003;Cleland and Sethupathy 2006), dendrodendritic synapticinteractions between mitral and granule cells in themammalian olfactory bulb (Jahr and Nicoll 1982) arecredited with regulating spike synchronization amongmitral cells (Schoppa 2006b), control of network local fieldpotential (LFP) oscillations (Lagier et al. 2004), andchanges in the dynamics of olfactory bulb responses toodorants (Eeckman and Freeman 1990; Nusser et al. 2001;Davison et al. 2003). However, it remains unclear how wellthese inhibitory synaptic interactions, distributed along theextensive lateral dendrites at locations up to hundreds ofmicrometers from mitral cells’ spike-initiating zones, couldeffectively shape the timing of mitral cell spikes and thesynchronization of neural activity across the olfactory bulb.
Previous models of olfactory bulb processing have shownthat the feedback interactions among mitral and granule cellscan underlie broad oscillations in the olfactory bulbcomparable to those observed in electrophysiological studies(Rall and Shepherd 1968; Li and Hopfield 1989; Davisonet al. 2003; Bathellier et al. 2006; Galan et al. 2006). Whilethese models illustrate how the relevant dynamics can becreated by these coupled oscillators, it is not clear howspike timing in individual mitral cells can be influenced bythe inhibitory inputs on their lateral dendrites that aredelivered by granule cells. We used a compartmental model
J Comput Neurosci (2008) 25:25–38DOI 10.1007/s10827-007-0063-5
Action Editor: James M. Bower
F. David :C. LinsterDepartment of Neurobiology and Behavior,Cornell University, Ithaca, NY 14853, USA
F. David (*)Neurosciences Sensorielles Comportement Cognition,CNRS-Université Claude Bernard Lyon 1,50, Avenue Tony Garnier, 69366 Lyon Cedex 07, Francee-mail: [email protected]
T. A. ClelandDepartment of Psychology,Cornell University, Ithaca, NY 14853, USA

of a mitral cell lateral dendrite, along with a reduced mitralcell model adapted from that of Davison and colleagues(Davison et al. 2000), to investigate whether and howGABAA-mediated inhibitory inputs on the lateral dendritescan regulate spike timing at the somatic spike-initiatingzone of mitral cells. We first show that the somatic effectsof dendritic hyperpolarizing inputs using a long, multi-compartmental lateral dendrite modeled after that describedby Bhalla and Bower (Bhalla and Bower 1993) can beadequately replicated by a simplified, single-compartmentlateral dendrite model. We then show that shunting inhibitorysynaptic inputs on each of these lateral dendrites arecomparably effective, able to modulate spike timing mea-sured at the soma, and that their efficacy depends on thestrengths and timing of the IPSCs. Finally, we show that theselateral dendritic inhibitory inputs can improve the replicabil-ity of stimulus-evoked spike timing at the mitral cell soma. Inparticular, recurrent (self-) inhibition, which occurs when amitral cell excites granule cell spines via its lateral dendritesand subsequently is inhibited by their activity (Egger et al.2003, 2005) can stabilize the interspike intervals of astimulus-evoked spike train in mitral cells.
2 Methods
2.1 Simulations
All simulations were performed using the NEURON 5.7simulator (http://www.neuron.yale.edu) under a Fedora CoreLinux operating system (http://www.redhat.com/fedora). Allsimulations employed a fixed time step of 0.01 ms.
2.2 Neurons
Our mitral cell model was based on that of Davison andcolleagues (Davison et al. 2000, 2003), which is distin-guished by its reduction to four isopotential compartments(glomerular tuft, primary dendrite, soma, lateral dendrite),linked by stub compartments acting as axial resistors, whileretaining the capacity to express the essential physiologicalproperties of mitral cells. Briefly, the membrane potentialsof the four compartments are governed by the followingequations:
CmV0s ¼ �Ileak � INa � IKfast � IKslow � IKA � IKCa
� ICa þ gsd=pð Þ Vd � Vsð Þþ gsp
�p
� �Vd � Vsð Þ þ Is=p ð1Þ
CmV0g ¼ �Ileak � IKslow � ICa þ gpg
�q
� �Vp � Vg
� �þ Ig
�q ð2Þ
CmV0p ¼ �Ileak � INa � IKfast � IKslow � ICa
þ gsp�r
� �Vs � Vp
� �þ gpg�r
� �Vg � Vp
� � ð3Þ
CmV0d ¼ �Ileak � INa � IKfast � gsd=sð Þ Vs � Vdð Þ ð4Þ
in which Vs, Vg, Vp and Vd represent the membranepotentials of the soma, the glomerulus, the primarydendrite and the lateral dendrite respectively. The mem-brane currents (Ix for each channel fluxing ion x, and theleak current Ileak) and other physiological parameters wereselected and fit by Davison and colleagues according tothe work of Bhalla and Bower (1993). The variables p, q,r, and s are the ratios of the surface areas of the fourcompartments, respectively, to the total surface area of thecell. The values gsd, gsp, and gpg represent the conductan-ces of the axial resistors joining the soma and lateraldendrite, soma and primary dendrite, and primary dendriteand glomerular compartments respectively. Active proper-ties in lateral dendrites were not important to synapticshunting effects per se but became relevant duringsimulations incorporating sustained spiking and recurrentinhibition. Mitral cell model parameters are summarized inTable 1.
In some simulations, we substituted a long, multi-compartmental lateral dendrite for the single-compartmentlateral dendrite of this model in order to assess how well thesimplified model dendrite replicated the relevant propertiesof a long dendrite with intact cable properties. The length(l) of the multi-compartmental lateral dendrite was1,000 μm (divided into 100 compartments of 10 μm) andits diameter (d) was set to 17.1 μm to maintain the sameproportion of surface area devoted to the lateral dendrite asin the simplified dendrite model. The biophysical propertiesof the long dendrite were the same as those of the single-compartment lateral dendrite (Eq. (4)); specifically, eachcompartment of the long lateral dendrite followed theequation
CmV0d ¼ �Ileak � INa � IKfast þ Idiff ð5Þ
where Idiff is the diffusive component
Idiff ¼ Vj�1 � Vj
Rj�1a �lp�d24
þ Vjþ1 � Vj
Rjþ1a �lp�d24
ð6Þ
and Vj+1 and Vj−1 correspond to the potentials of theneighboring compartments. Given the specified size con-straints and a specific membrane resistance of Rm=10
5 Ω.cm2 at rest, we selected a linking compartment resistivityRa=595 Ω.cm such that this model dendrite would exhibitthe same space constant 1 as a dendrite with an axialresistivity of 70 Ω.cm and a diameter of 2 μm (Bhalla and
26 J Comput Neurosci (2008) 25:25–38

Bower 1993; Lowe 2003). The axial resistivity Ra was thesame for all the compartments of the lateral dendrite.
l ¼ffiffiffiffiffiffiffiffiffiffiffiffiffid � Rm4 � Ra
rð7Þ
The granule cell was modeled by a single-compartmentspine, the parameters of which were adapted from the workof Anton and colleagues (Anton et al. 1993). As we wereinterested in the recurrent inhibition mediated by granulecells, and not lateral inhibition between mitral cells, a singlespine model was sufficient. The passive properties of thegranule cell spine were modeled as
Cm � V 0 ¼ �gpas � V � Epas
� �þ IAMPA ð8Þ
where gpas=0.25 mS/cm2, Cm=1 μF/cm2, Epas=−65 mV,Ra=80 Ω.cm, diameter=0.8 μm, and length=0.7 μm.IAMPA denotes the fast excitatory post-synaptic currentevoked via AMPA receptor activation by glutamate
released onto granule cell spines whenever a spike occurredin the mitral cell.
2.3 Synaptic inhibition
Single IPSCs. In the first set of simulations, we opened anartificial IPSC (conductance) into the lateral dendrite ofthe mitral cell to simulate synaptic inhibitory inputs. TheIPSC was triggered via the activation of an inhibitoryGABAA-like conductance with single-exponential decayand a time constant of τGABA=5 ms, a value consistent withexperimental measurements (e.g., 4±2 ms (Schoppa2006b); 6.3±0.2 ms (Margrie and Schaefer 2003)).
gGABA tð Þ ¼ gmax � et� tspikeþdelð Þ
tGABA ð9Þwhere gmax varied in realistic ranges and the quantity(tspike+del) was the time at which the IPSC was triggered(tspike is a reference time and del an arbitrary phase or
Table 1 Mitral cell model parameters
Compartment
All compartments Soma Glomerular tuft Primary dendrite Lateral dendrite sd/(absent) sp pg
General membrane parametersCm (μF/cm2) 1Rm (Ω.cm2) 100,000Eleak (mV) −65Total area (μm2) 100,000
Channel distributions (S/m2)Na 0.1532 0 0.00134 0.0226Kfast 0.1956 0 0.00123 0.0330CaL 0.0040 0.0095 0.0022 0Kslow 0.0028 0.02 0.00174 0KA 0.00587 0 0 0KCa 0.0142 0 0 0
Parameters of the linking compartmentsDiameter (μm) 1/– 1 1Length (μm) 1/– 1 1gxx (S/cm
2)a 1.94e-4b/– 5.47e-5 5.86e-5Ra (kΩ.cm) 0.405c/– 1.435 1.340
Morphological and cable parametersDiameter (μm) 16.2 26.7 104.4 170.9/17.03Length (μm) 100 100 100 100/1,000Ra (Ω.cm) 2.07e-5 5.61e-5 8.56e-4 0.0023/595Area ratio p=0.051 q=0.084 r=0.328 s=0.537
When the parameter values of the two types of lateral dendrite differ, the value for the simplified lateral dendrite is presented to the left of the slashmark and the value for the multicompartmental dendrite to the right. Except for the multicompartmental version of the lateral dendrite, resistivityvalues for isopotential compartments in “Morphological and cable parameters” are negligible.a Subscript xx refers to the linking compartment (sd: between soma and lateral dendrite; sp: between soma and primary dendrite; pg: betweenprimary dendrite and glomerular tuft). No linking compartment was used between the multicompartmental lateral dendrite and the soma.b The value of gsd was experimentally varied between 0.3 and 30 times this nominal value. See text, Fig. 1(c)–(g), and Fig. 2(b, d, f) fordetails.c The value of Ra varies from this nominal value because it is dependent on the value of gsd, according to the function Ra=(π*1e4)/(4*Atotal) *(1/gxx), in Ω.cm. Atotal is the total area.
J Comput Neurosci (2008) 25:25–38 27

time delay). The inhibitory current was thereby calcula-ted as:
IGABA tð Þ ¼ gGABA tð Þ � V tð Þ � EGABAð Þ ð10Þwhere EGABA=−70 mV.
Inhibition by bursts of IPSCs. Subsequently, instead ofevoking a single IPSC, we evoked a burst of IPSCscomposed of either 10 or 200 single IPSCs. Theirdistribution in time followed a gaussian distribution witha mean of 10 ms and a standard deviation between 0 and20 ms. The inhibitory conductance (gGABA) of each singleIPSC was randomly selected from a uniform distributionranging between 0 and 0.1 μS for bursts of 10 IPSCs orbetween 0 and 0.005 μS for bursts of 200 IPSCs.Individual conductances were summed over time asdepicted in Eq. (11), resulting in an aggregate gGABA termfrom which we derived the value of the resulting currentIGABA.
gGABA tð Þ ¼XnIPSCi¼1
gmax � e�t�ti
tGABA ð11Þ
Feedback inhibitory synapses between mitral cells andgranule cells. To model recurrent interactions betweenmitral and granule cells, excitatory synapses on granulecells (AMPA) as well as graded inhibitory synapses onmitral cell lateral dendrites (GABAA) were modeled. TheAMPA synapses were activated each time an actionpotential was triggered in the mitral cell soma, and theresulting excitatory synaptic conductance was modeledwith a single-exponential decay function:
gAMPA tð Þ ¼ gmax � e�t� delþtspikeð Þ
tAMPA ð12Þresulting in an excitatory synaptic current of
IAMPA tð Þ ¼ gAMPA tð Þ � V tð Þ � EAMPAð Þ ð13Þwhere the synaptic delay del=1.8 ms (Davison et al. 2003),gmax=0.01 nS, EAMPA=0 mV, and τAMPA=3 ms.
GABAergic synapses on the mitral cell lateral dendritewere graded and thus activated by a simple depolarizationof the membrane potential according to:
C Vpres
� � ¼ 1
1þ e4:S: Vth�Vpres tð Þð Þ ð14Þ
where C(Vpres) is a sigmoid function representing thedegree of activation of the synapse and Vpres is themembrane potential of the presynaptic compartment. Thisfunction ranges from 0 to 1 and can be considered as ananalog of the neurotransmitter concentration in the synapticcleft. The variable Vth is the presynaptic membranepotential for which the slope of the sigmoid is at maximum
and takes the value S. The synaptic conductance g(t) wasthen computed at each time step:
dg
dt¼ g1 � g tð Þ
tsynð15Þ
where g∞=gmax.C(t), representing the conductance at t=∞.Finally, the resulting current was calculated for each timestep as follows:
IGABA ¼ g tð Þ � Vpost � EGABA
� � ð16ÞIn these equations, EGABA=−70 mV, τsyn=5 ms, Vth=
−45 mV, S=0.2, and gmax was varied among realistic values(Anton et al. 1993) as described below.
Amplitude of simulated IPSCs and inhibitory conduc-tances. Measurements of inhibitory postsynaptic currentsunder in vitro conditions constrained the maximal conduc-tance values of model synapses. The net inhibitory synapticconductance evoked in single mitral cells by granule cellGABA release has been estimated to be on the order of20 nS (Schoppa et al. 1998; Schoppa 2006b), based onstudies in which patterned electrical stimulation wasdelivered to olfactory bulb glomeruli at a modest buteffective intensity sufficient to drive recurrent networkactivity and synchronize mitral cell spikes. In the simu-lations presented here, IPSC conductance values weregenerally varied between 0 and 2,000 nS, and in one studyup to 50 μS.
2.4 Mitral cell stimulation
Mitral cells were stimulated in the glomerular compartmentwith depolarizing current injection ranging between 0.5 and1.8 nA, respectively corresponding to evoked firingfrequencies ranging between 20 and 40 Hz, a rangecorresponding to mitral cell firing rates measured in awake,behaving mice (Rinberg et al. 2006). White noise, with aband-width from 0 to 4 kHz, a mean of 0, a standarddeviation of 0.9 nA and colored by convolution with asingle exponential function (1 ms time constant) was addedto the injected current. The different realizations of noisewere generated using the startsw() function of NEURON asa seed generator.
2.5 Data analysis
Interspike intervals (ISIs) were calculated based on spiketimes recorded at the soma. In all simulations, means andstandard deviations were calculated for ISI values basedon repeated simulations with different noise realizations.The means of sets of ISIs obtained with differentparameters were compared using t-tests, whereas the
28 J Comput Neurosci (2008) 25:25–38

variances of these sets were compared using Hartley’s testof homogeneity of variance (Fmax; variance ratio test).Criteria for significance were set at α=0.05. ISI densitydistributions were fitted with a normal distributionfunction computed with MATLAB 7.0 (The Mathworks,Natick, MA).
3 Results
3.1 Comparison of the single- and multi-compartmentlateral dendrite models
In order to assess the capacity of a simplified dendritemodel to replicate the properties of a spatially more realisticdendrite, we compared the functional properties of a longmulti-compartmental lateral dendrite model built accordingto experimentally estimated parameters with those of asimplified, single-compartment lateral dendrite (Fig. 1(a)).The passive properties of the multicompartmental dendritewere measured by opening a 0.05 μS inhibitory synapticconductance at different locations along its length (activedendritic properties remained quiescent in these simula-tions). As the conductance location progressed from aproximal (close to the soma) to a distal (far from the soma)location on the lateral dendrite, the inhibitory potentialmeasured in the soma decreased in amplitude and its peakwas further delayed (Fig. 1(b); Fig. 1(d, e), trianglesymbols). For comparison, in the simplified model dendrite(Fig. 1(a), within brackets), varying the resistivity of thelinking compartment between 0.01 and 1.35 kΩ.cm yieldedcomparable effects on the somatic inhibitory potentialamplitude and peak latency (Fig. 1(c)). To further ourcomparison, we opened a square 1 μS shunting conduc-tance (Erev=−65 mV) in each type of lateral dendrite modeland again varied either the location of this shuntingconductance or the linking compartment resistivity asappropriate for each model. These simulations showed thatthe input resistance and membrane time constant at thesoma (measured by injecting brief somatic hyperpolarizingcurrents during application of the shunting conductances)were, again, comparably influenced by the location in themulticompartmental dendrite and the linking compartmentresistivity in the simplified dendrite (Fig. 1(f, g)), althoughthe time constant was somewhat shorter in the latter.
We then compared the effect of lateral dendriticinhibitory inputs on spike initiation at the soma in bothmodels. While depolarizing the glomerular compartment soas to yield a stable, regular mitral cell firing frequency of20, 30 or 40 Hz, we measured how lateral dendriticshunting IPSCs (50 nS; Erev=−70 mV) influenced the
timing of these evoked spikes. Specifically, we measuredthese spike timing effects as functions of the phase of theIPSC relative to the interspike interval (ISI), and also withrespect to the location along the dendrite where theinhibitory conductance was inserted (in the multicompart-mental dendrite) or to the linking compartment resistivity(in the simplified dendrite). All IPSCs were initiated duringthe tenth ISI, at which point the baseline spike rate wasalways verifiably stationary.
In the multicompartmental dendrite model, the IPSCalways delayed the next spike, but the degree of this delaywas influenced by both location and phase. The phase ofthe IPSC had a powerful effect on the delay, exerting itsmaximal effect at roughly 3π/2 radians. Furthermore,IPSCs triggered in the proximal dendrite always delayedthe spike more than did distal IPSCs, but the effect ofdistance was also strongest when the IPSC was deliveredat around 3π/2 radians. These basic relationships persistedirrespective of baseline spike frequency (Fig. 2(a), (c), (e)).In the simplified dendrite model, varying the linkingcompartment resistivity produced a similar effect. Theranges of linking resistivities shown were selected tocorrespond to IPSCs delivered between 1 and 61 μm fromthe soma (compare Figs. 2(a) and (b), 2(c) and (d), and 2(e)and (f)). Given the similar responses and filtering propertiesof these two models, and the calibration of the simplifiedmodel dendritic parameters enabled by the above simula-tions, subsequent simulations were performed only with themitral cell model incorporating the simplified, single-compartment lateral dendrite.
3.2 Effects of IPSC phase and amplitude on spike timing
IPSC-induced delays in spike timing were also influencedby the net inhibitory synaptic conductance. In simulationsusing a linking compartment resistivity of 0.405 kΩ.cmbetween the lateral dendrite and soma, both the phase andamplitude of the lateral dendritic IPSC substantiallyinfluenced the delay imposed on spikes embedded in 20,30, and 40 Hz spike trains (Fig. 3). When the inhibitoryconductance was small enough (less than approximately200 nS), the IPSC had a maximal effect when it wasinitiated at roughly 3π/2 radians. When the inhibitoryconductance was over 200 nS, the most effective phaseapproached 2π radians and no longer constituted a localmaximum. As a ∼20 nS total inhibitory conductance,evoked in mitral cells by glomerular stimulation, has beenshown to be effective at modulating mitral cell spike timing(Schoppa et al. 1998; Schoppa 2006b), phase-delayfunctions with their local maxima at roughly 3π/2 areprobably the more physiologically relevant.
J Comput Neurosci (2008) 25:25–38 29

3.3 Effects of IPSC parameters on ISI distributionunder noisy conditions
In order to better understand the spike-timing effects oflateral dendritic inhibitory inputs under noisy conditions,
we injected current noise into the mitral cell soma duringglomerular stimulation so as to generate distributions ofISIs and measured how dendritic inhibitory inputs affectedthe resulting distributions. Measuring the variance of ISIdistributions is a convenient way of measuring spike timing
Glom.
1... ... 100
r
Prim.
Soma
Axon
Lateral Dendrite
0 50 100 150 200t (ms)
V (
mV
)
1
2550 75100
IPSClocation
0 50 100 150 200t (ms)
V (
mV
)
0.0130.0190.811.011.35
r (gΩ.cm)
0 20 40 60 80 1003.5
4
4.5
5
5.5
IPSC location
IPS
P m
ax (
mV
)
0 0.2 0.30.4 0.7 1 1.35r (g Ω.cm)
0 20 40 60 80 1000
5
10
15
20
IPSC location
Pea
k de
lay
(ms)
0 0.2 0.30.4 0.7 1 1.35r (g Ω.cm)
0 20 40 60 80 1000
5
10
15
20
25
30
Shunt Location
Rin
put (
kΩ)
0 0.20.30.4 0.7 1 1.35r (g Ω.cm)
0 20 40 60 80 1000
2
4
6
8
10
12
Shunt Location
τ m (
ms)
0 0.2 0.30.4 0.7 1 1.35r (g Ω.cm)
(a)
(b) (c)
(d) (e)
(f) (g)
Multi
Simplified DendriteSimplified Dendritecompartmental Dendrite
Multicompartmental DendriteMulticompartmental Dendrite
Multicompartmental Dendrite
Simplified Dendrite Simplified Dendrite
30 J Comput Neurosci (2008) 25:25–38

variability under noisy conditions; in vivo experiments haveshown that, during odor-evoked LFP gamma oscillations,mitral cell ISIs exhibit substantial variability, with standarddeviations varying from a few milliseconds to hundreds ofmilliseconds (Debarbieux et al. 2003). Moreover, intracel-lular recordings in mitral cells have shown that themembrane potential fluctuates intrinsically (Cang andIsaacson 2003; Margrie and Schaefer 2003), presumablydue to external synaptic activity as well as their intrinsicoscillatory properties as observed in slice preparations(Desmaisons et al. 1999).
Using a constant glomerular stimulus current yielding amean 30 Hz baseline spike rate (corresponding to a 33 msmean baseline ISI without noise), and retaining a 0.405 kΩ.cm linking compartment resistivity between lateral dendriteand soma, we injected current noise (see Section 2) into thesoma sufficient to generate an ISI standard deviation of∼12.5 ms. The interval distribution of the tenth ISI in eachset of simulations was recorded both in the absence ofinhibitory inputs and in the presence of 500 nS IPSCsdelivered at one of three selected “phases” – specifically, atconstant latencies of 5, 15, and 25 ms, correspondingroughly to phases of π/2, π and 3π/2 radians for purposesof comparison with Fig. 3(b). The ISI distributions for eachof these cases, obtained from 5,000 repetitions withdifferent realizations of noise, are illustrated in Fig. 4.
In these simulations, incoming lateral dendritic IPSCsgenerated significant reductions in the variability of mitralcell spike timing (i.e., in the variance of ISI distributions;Fig. 4(a)–(d); variance ratio test: F(4,993,3,678)=2.02>1.05; p<0.05). Moreover, the standard deviation of the ISIdistribution continued to decrease as the phase of the IPSCwas further delayed, reaching its maximum effect at thelongest delay tested (25 ms, corresponding to ∼3π/2radians). Specifically, the standard deviation σISI declinedfrom 12.5 ms at a 5 ms IPSC delay (Fig. 4(b)) to 8.8 ms at a25 ms IPSC delay (Fig. 4(d); F(4,914,3,678)=1.21>1.05;
p<0.05). That is, within the range of delays tested, the lateran IPSC was triggered with respect to the preceding spike,the stronger was the resulting decrease in ISI variability.
We then measured how the strength of the IPSCinteracted with its timing to influence the means andstandard deviations of ISI distributions. Inhibitory conduc-tances were opened at five different strengths (100, 200,500, 1,000, or 2,000 nS) and at six different time delays(5–30 ms) with respect to the preceding mitral cell spike. Atall timing delays, increasing the peak IPSC conductanceincreased the mean ISI (delaying the next spike) andreduced the ISI standard deviation (Fig. 4(e, f)). Thesesimulations demonstrate that synaptic inhibition locatedalong the mitral cell lateral dendrite can regulate thevariability of spike timing at the soma.
3.4 Effects of recurrent inhibition
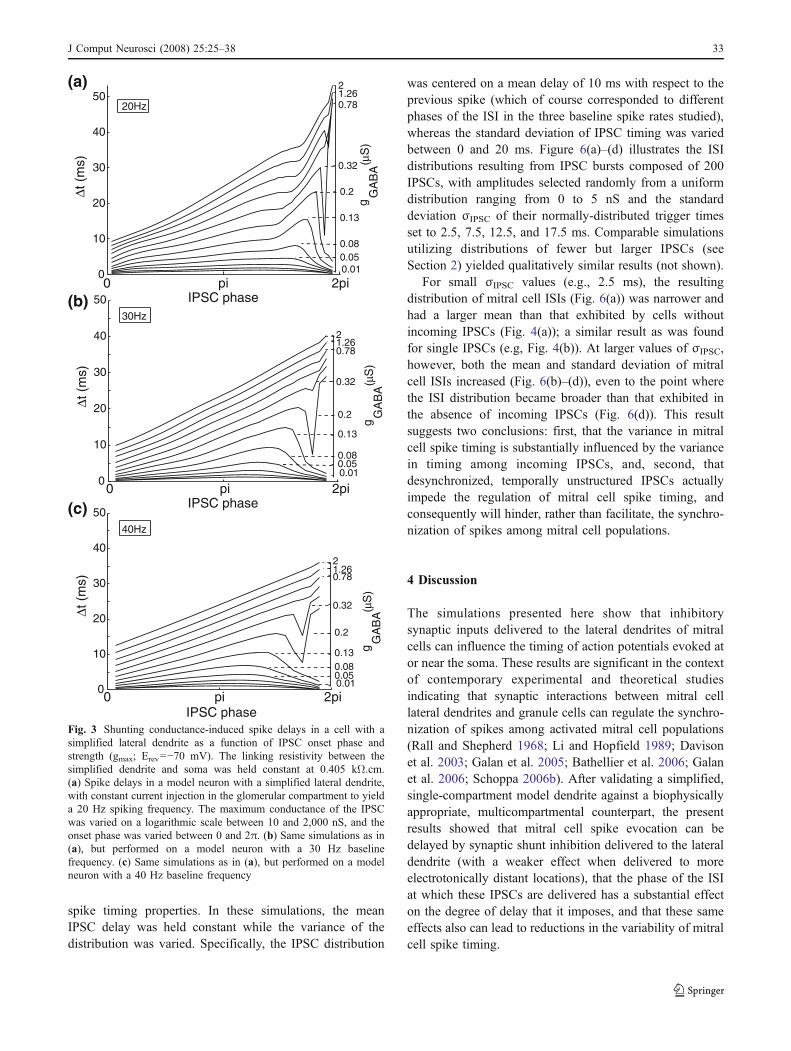
In the above simulations, the timing and amplitude ofexternally generated dendritic IPSCs were varied toinvestigate their influence on somatic spiking properties.We next implemented recurrent inhibition between themitral cell lateral dendrite and a granule cell spine. In thismodel, mitral cell spikes, generated in the soma, propagatedinto the lateral dendrite and activated glutamatergic AMPAsynapses in the granule cell spine. The spine in turn rapidlydepolarized, in turn activating the GABAergic synapse onthe mitral cell lateral dendrite. As in previous simulations,the conductance of the inhibitory synapse was set to 500 nSand the decay time constant of the inhibitory conductancewas set to 5 ms. For 100 realizations of noise and a meanbaseline spiking rate of 30 Hz, we measured the ISI meanand standard deviation over the entire spike train for 4 s(Fig. 5(a, b)). The inclusion of recurrent inhibitionsignificantly reduced the standard deviation of the ISI from12.6 to 9.7 ms (variance ratio test: F(12,584,8,732)=1.68>1.034; p<0.05), while also increasing the ISI mean.
Fig. 1 Comparison of the response and filtering properties of a simplified single-compartment dendrite with those of a long multi-compartmentaldendrite. (a) Schematic representation of a mitral cell consisting of a glomerular tuft (Glom), primary dendrite (Prim), soma, and one of two modellateral dendrites. The axon was not explicitly modeled. The first, multicompartmental lateral dendrite model was composed of 100 identicalcompartments, each 10 μm in length. The second, simplified model consisted of a single isopotential compartment linked to the soma through atiny linking compartment, which served as an axial resistor (r). (b) IPSP time courses recorded in the soma following IPSC activations (50 nS, Erev=−90 mV) at different locations (every 5 sections) along the long lateral dendrite. Location is depicted in numbers of 10 μm sections. (c) IPSPtimecourses recorded in the soma following the opening of IPSCs in the simplified, isopotential lateral dendrite as the resistivity of the linkingcompartment was varied from 0.013 to 1.35 kΩ.cm. This range of resistivities was selected to match the peak maxima measured in (a). (d) Plot ofIPSP peak amplitude in the soma as a function of the IPSC location on the multicompartmental dendrite (triangles) or the resistivity r of thelinking compartment adjoining the simplified dendrite (squares). (e) Latency from IPSC initiation to IPSP peak in the soma in cells with each ofthe two dendrite models (same symbols as in (d)). (f) Changes in somatic input resistance (as measured using a −100 pA square pulse injected intothe soma) after the opening of a 1 nS shunt conductance in the lateral dendrite (more closely representing the effects of a GABAA-ergic chlorideconductance), as a function of the location of the shunt (in the multicompartmental dendrite, triangles) or the resistivity r of the linkingcompartment (in the simplified dendrite, squares). (g) Changes in the somatic membrane time constant after the opening of a 1 nS chloride shuntconductance in the lateral dendrite (measured as the time constant of the voltage deflection generated by the same hyperpolarizing step current as usedin (f)), as a function of the location of the shunt (in the multicompartmental dendrite, triangles) or the resistivity r of the linking compartment (in thesimplified dendrite, squares). The somatic membrane time constant was similar for both neurons (80 ms in the absence of shunting conductances)
R
J Comput Neurosci (2008) 25:25–38 31

We then repeated these measurements over 50 differentrealizations of noise and varied the GABAergic IPSCconductance from 20 nS to 50 μS on a logarithmic scale(Fig. 5(c, d)). Three intensities of glomerular stimulationwere used to yield mean baseline firing rates of 20, 30 and40 Hz. Inhibitory conductance magnitude had strong effectson ISI mean and standard deviation; larger synapticconductances increased the latency to the next spike andnarrowed the distribution of its timing (variance ratio
test; 20 Hz: F(9,031,4,908)=2.17>1.042, p<0.05; 40 Hz:F(16,254,6,388)=1.28>1.035, p<0.05). These simulationsindicate that recurrent inhibition can enhance the regularityof a spike train as well as affect its mean frequency.
3.5 Effects of distributions of IPSCs
Finally, we asked how incoming bursts of IPSCs that aredistributed in time and amplitude can influence mitral cell
0 pi 2pi0
1
2
3
4
5
6
78
IPSC phase
Δt (
ms)
1
112131415161 IP
SC
loca
tion
20 Hz
1.351.00.80.7
0.2
r (g
Ω.c
m)
0 pi 2pi0
1
2
3
4
5
6
7
8
IPSC phase
Δt (
ms)
0 pi 2pi0
1
2
3
4
5
6
78
IPSC phase
Δt (
ms)
1
11
21
31415161
IPS
C lo
catio
n
1.351.0
0.80.7
0.2
0 pi 2pi0
1
2
3
4
5
6
7
8
IPSC phase
Δt (
ms) r
(gΩ
.cm
)
0 pi 2pi0
1
2
3
4
5
6
7
8
IPSC phase
Δt (
ms)
1
11
2131415161
IPS
C lo
catio
n
40 Hz
1.35
10.80.7
0.2
r (g
Ω.c
m)
0 pi 2pi0
1
2
3
4
5
6
7
8
IPSC phase
Δt (
ms)
40 Hz
30 Hz
20 Hz
(a) (b)
(c) (d)
(e) (f)
30 Hz
Fig. 2 Shunting conductance-induced delays of mitral cell spikes as afunction of IPSC location and phase with respect to the mitral cell ISI.IPSC phase is with respect to the times of the preceding and followingmitral cell spikes under baseline conditions, i.e., in the absence of anyeffect that would delay the latter. The IPSC was delivered with gmax=50 nS, Erev=−70 mV, and a duration of 5 ms in all cases. (a) Spikedelays in a model neuron with a multicompartmental lateral dendrite,with constant current injection in the glomerular compartment so as toyield a 20 Hz spiking frequency. The location of the IPSC pointprocess was varied between 1 and 61 sections (10 to 610 μm) distancefrom the soma, and the onset phase was varied between 0 and 2π.
(b) Analogous results as obtained from the model neuron with asimplified lateral dendrite, depolarized to a baseline 20 Hz firingfrequency. Rather than IPSC location, the resistivity of the linkingcompartment was varied between 0.2 and 1.35 kΩ.cm, leading to acomparable modulation of spike delay as a function of IPSC phase. (c)Same as (a), but in a model neuron depolarized to a 30 Hz baselinefrequency. (d) Same as (b), but in a model neuron depolarized to a30 Hz baseline frequency. (e) Same as (a), but in a model neurondepolarized to a 40 Hz baseline frequency. (f). Same as (b), but in amodel neuron depolarized to a 40 Hz baseline frequency
32 J Comput Neurosci (2008) 25:25–38
spike timing properties. In these simulations, the meanIPSC delay was held constant while the variance of thedistribution was varied. Specifically, the IPSC distribution
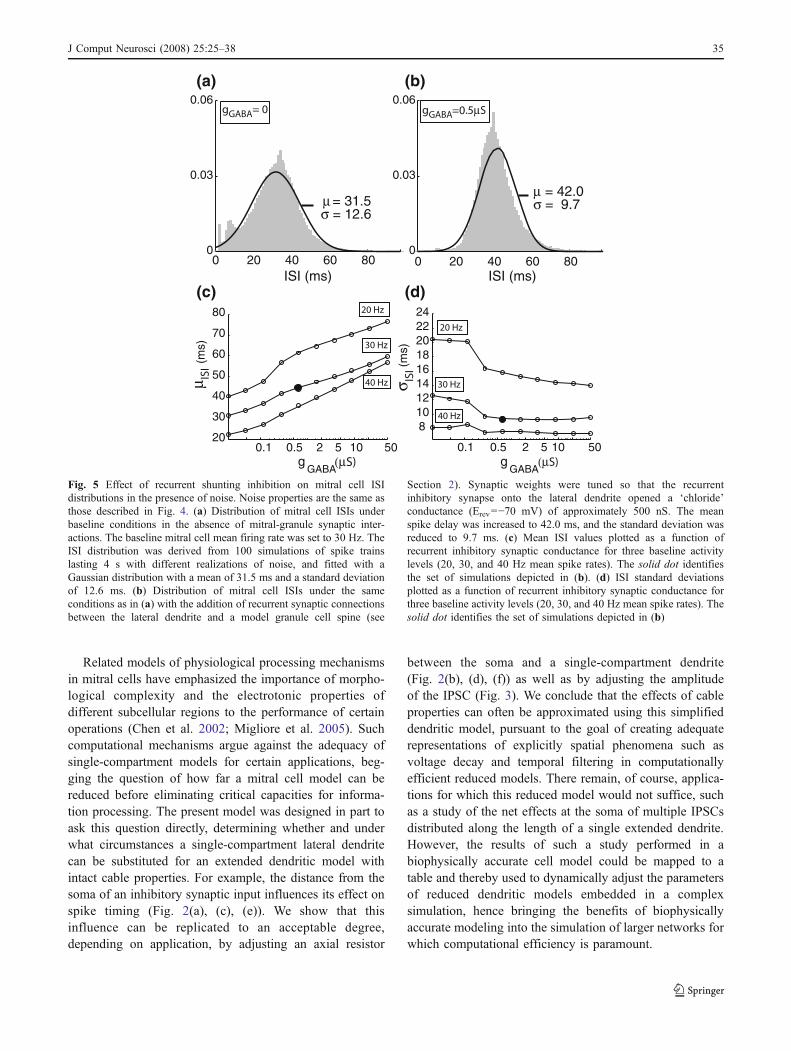
was centered on a mean delay of 10 ms with respect to theprevious spike (which of course corresponded to differentphases of the ISI in the three baseline spike rates studied),whereas the standard deviation of IPSC timing was variedbetween 0 and 20 ms. Figure 6(a)–(d) illustrates the ISIdistributions resulting from IPSC bursts composed of 200IPSCs, with amplitudes selected randomly from a uniformdistribution ranging from 0 to 5 nS and the standarddeviation σIPSC of their normally-distributed trigger timesset to 2.5, 7.5, 12.5, and 17.5 ms. Comparable simulationsutilizing distributions of fewer but larger IPSCs (seeSection 2) yielded qualitatively similar results (not shown).
For small σIPSC values (e.g., 2.5 ms), the resultingdistribution of mitral cell ISIs (Fig. 6(a)) was narrower andhad a larger mean than that exhibited by cells withoutincoming IPSCs (Fig. 4(a)); a similar result as was foundfor single IPSCs (e.g, Fig. 4(b)). At larger values of σIPSC,however, both the mean and standard deviation of mitralcell ISIs increased (Fig. 6(b)–(d)), even to the point wherethe ISI distribution became broader than that exhibited inthe absence of incoming IPSCs (Fig. 6(d)). This resultsuggests two conclusions: first, that the variance in mitralcell spike timing is substantially influenced by the variancein timing among incoming IPSCs, and, second, thatdesynchronized, temporally unstructured IPSCs actuallyimpede the regulation of mitral cell spike timing, andconsequently will hinder, rather than facilitate, the synchro-nization of spikes among mitral cell populations.
4 Discussion
The simulations presented here show that inhibitorysynaptic inputs delivered to the lateral dendrites of mitralcells can influence the timing of action potentials evoked ator near the soma. These results are significant in the contextof contemporary experimental and theoretical studiesindicating that synaptic interactions between mitral celllateral dendrites and granule cells can regulate the synchro-nization of spikes among activated mitral cell populations(Rall and Shepherd 1968; Li and Hopfield 1989; Davisonet al. 2003; Galan et al. 2005; Bathellier et al. 2006; Galanet al. 2006; Schoppa 2006b). After validating a simplified,single-compartment model dendrite against a biophysicallyappropriate, multicompartmental counterpart, the presentresults showed that mitral cell spike evocation can bedelayed by synaptic shunt inhibition delivered to the lateraldendrite (with a weaker effect when delivered to moreelectrotonically distant locations), that the phase of the ISIat which these IPSCs are delivered has a substantial effecton the degree of delay that it imposes, and that these sameeffects also can lead to reductions in the variability of mitralcell spike timing.
0 pi 2pi0
10
20
30
40
50
IPSC phase
Δt (
ms)
0.010.050.08
0.13
0.2
0.32
0.781.262
gG
AB
A(μ
S)
20Hz
(a)
(b)
(c)0 pi 2pi
0
10
20
30
40
50
IPSC phase
Δt (
ms)
30Hz
0.010.050.08
0.13
0.2
0.32
0.781.262
gG
AB
A(μ
S)
0 pi 2pi0
10
20
30
40
50
IPSC phase
Δt (
ms)
40Hz
0.010.050.080.13
0.2
0.32
0.781.262
gG
AB
A(μ
S)
Fig. 3 Shunting conductance-induced spike delays in a cell with asimplified lateral dendrite as a function of IPSC onset phase andstrength (gmax; Erev=−70 mV). The linking resistivity between thesimplified dendrite and soma was held constant at 0.405 kΩ.cm.(a) Spike delays in a model neuron with a simplified lateral dendrite,with constant current injection in the glomerular compartment to yielda 20 Hz spiking frequency. The maximum conductance of the IPSCwas varied on a logarithmic scale between 10 and 2,000 nS, and theonset phase was varied between 0 and 2π. (b) Same simulations as in(a), but performed on a model neuron with a 30 Hz baselinefrequency. (c) Same simulations as in (a), but performed on a modelneuron with a 40 Hz baseline frequency
J Comput Neurosci (2008) 25:25–38 33

0.1 0.2 0.5 1 230
35
40
45
50
55
60
65
70
μ ISI
(ms)
5 ms10 ms15 ms20 ms25 ms30 ms
5 ms10 ms15 ms20 ms25 ms30 ms
5101520
25
30
IPS
C d
elay
(m
s)
0 20 40 60 800
0.03
0.06
ISI (ms)
μ = 32.2 σ = 12.5
0 20 40 60 800
0.03
0.06
ISI (ms)
μ = 43.2 σ = 9.7
0 20 40 60 800
0.03
0.06
ISI (ms)
μ = 48.6 σ = 9.0
0 20 40 60 800
0.03
0.06
ISI (ms)
μ = 56.1 σ = 8.8
(b)(a)
(c) (d)
(e) (f)
no IPSC tIPSC=5ms
tIPSC=15ms tIPSC=25ms
0.1 0.2 0.5 1 28.5
9
9.9
10
10.5
11
σ ISI (
ms)
Fig. 4 Effects of the maximum conductance and onset phase of singleshunting IPSCs (Erev=−70 mV) on the distribution of ISIs amongrepeated trials under noisy conditions. Stationary, colored current noise(see Section 2) was injected into the soma during all simulations; thebaseline firing ratewas set to amean of 30Hz. (a) Distribution ofmitral cellISIs under baseline conditions in the absence of incoming IPSCs. The ISIdistribution was derived from 5,000 simulations with different realizationsof noise, and fitted with a Gaussian distribution with amean of 32.2 ms anda standard deviation of 12.5 ms. The secondary peak at ∼8 ms reflects theoccurrence of spike doublets (Lestienne et al. 1999); the small peak at∼2 ms results from somatic afterdepolarizations (Davison et al. 2000, theirFig. 6) that under noisy conditions occasionally evoke a double spikearising from two different, electrotonically segregated regions of the mitralcell (Chen et al. 2002). (b) A 500 nS shunting IPSCwas opened 5ms after amitral cell spike for the same 5,000 realizations of noise as in (a). As a
consequence, the mean spike delay increased to 43.2 ms and the standarddeviation declined to 9.7ms. (c) As in (b), except that the IPSCwas openedat a 15 ms latency. The mean spike delay increased further to 48.6 ms, andthe standard deviation was further reduced to 9.0 ms. (d) As in (c), exceptthat the IPSC was opened at a 25 ms latency. The mean spike delayincreased further to 56.1ms, and the standard deviationwas further reducedto 8.8ms. (e) The mean ISI (μISI) plotted as a function of IPSC maximumconductance (abscissa) and the latency of the IPSC onset with respect tothe prior mitral cell spike (six curves, 5–30 ms). Bold markers identifythose sets of simulations depicted in (b)–(d). (f) The ISI standarddeviation (σISI) plotted as a function of the same two variables. Higherinhibitory conductances consistently generated reduced σISI values; notethat the right-hand axis is inverted in comparison to (e). Bold markersidentify those sets of simulations depicted in (b)–(d)
34 J Comput Neurosci (2008) 25:25–38
Related models of physiological processing mechanismsin mitral cells have emphasized the importance of morpho-logical complexity and the electrotonic properties ofdifferent subcellular regions to the performance of certainoperations (Chen et al. 2002; Migliore et al. 2005). Suchcomputational mechanisms argue against the adequacy ofsingle-compartment models for certain applications, beg-ging the question of how far a mitral cell model can bereduced before eliminating critical capacities for informa-tion processing. The present model was designed in part toask this question directly, determining whether and underwhat circumstances a single-compartment lateral dendritecan be substituted for an extended dendritic model withintact cable properties. For example, the distance from thesoma of an inhibitory synaptic input influences its effect onspike timing (Fig. 2(a), (c), (e)). We show that thisinfluence can be replicated to an acceptable degree,depending on application, by adjusting an axial resistor
between the soma and a single-compartment dendrite(Fig. 2(b), (d), (f)) as well as by adjusting the amplitudeof the IPSC (Fig. 3). We conclude that the effects of cableproperties can often be approximated using this simplifieddendritic model, pursuant to the goal of creating adequaterepresentations of explicitly spatial phenomena such asvoltage decay and temporal filtering in computationallyefficient reduced models. There remain, of course, applica-tions for which this reduced model would not suffice, suchas a study of the net effects at the soma of multiple IPSCsdistributed along the length of a single extended dendrite.However, the results of such a study performed in abiophysically accurate cell model could be mapped to atable and thereby used to dynamically adjust the parametersof reduced dendritic models embedded in a complexsimulation, hence bringing the benefits of biophysicallyaccurate modeling into the simulation of larger networks forwhich computational efficiency is paramount.
0.1 0.5 2 5 10 5020
30
40
50
60
70
80
gGABA
0.1 0.5 2 5 10 50
81012141618202224
gGABA
0 20 40 60 800
0.03
0.06
ISI (ms)
μ = 31.5 σ = 12.6
(a) (b)
(c) (d)
0 20 40 60 800
0.03
0.06
ISI (ms)
μ = 42.0 σ = 9.7
20 Hz
30 Hz
40 Hz
20 Hz
30 Hz
40 Hz
gGABA gGABA= 0 =0
σ ISI (
ms)
μ ISI
(ms)
Fig. 5 Effect of recurrent shunting inhibition on mitral cell ISIdistributions in the presence of noise. Noise properties are the same asthose described in Fig. 4. (a) Distribution of mitral cell ISIs underbaseline conditions in the absence of mitral-granule synaptic inter-actions. The baseline mitral cell mean firing rate was set to 30 Hz. TheISI distribution was derived from 100 simulations of spike trainslasting 4 s with different realizations of noise, and fitted with aGaussian distribution with a mean of 31.5 ms and a standard deviationof 12.6 ms. (b) Distribution of mitral cell ISIs under the sameconditions as in (a) with the addition of recurrent synaptic connectionsbetween the lateral dendrite and a model granule cell spine (see
Section 2). Synaptic weights were tuned so that the recurrentinhibitory synapse onto the lateral dendrite opened a ‘chloride’conductance (Erev=−70 mV) of approximately 500 nS. The meanspike delay was increased to 42.0 ms, and the standard deviation wasreduced to 9.7 ms. (c) Mean ISI values plotted as a function ofrecurrent inhibitory synaptic conductance for three baseline activitylevels (20, 30, and 40 Hz mean spike rates). The solid dot identifiesthe set of simulations depicted in (b). (d) ISI standard deviationsplotted as a function of recurrent inhibitory synaptic conductance forthree baseline activity levels (20, 30, and 40 Hz mean spike rates). Thesolid dot identifies the set of simulations depicted in (b)
J Comput Neurosci (2008) 25:25–38 35
Synaptic inhibition on the lateral dendrite most effectivelyreduced the variance of the ISI distribution – increasing thereliability of spike timing – when the inhibitory input wasdelivered within a narrow time window: e.g., by a strongsingle IPSC (Fig. 4), by a recurrent inhibitory feedback
loop (Fig. 5), or via a burst of smaller IPSCs narrowlydistributed in time (Fig. 6). In contrast, temporallydisorganized IPSC inputs, or inputs broadly distributed intime, actually increased the variance in mitral cell spiketiming over that observed in the absence of any inhibitory
(a) (b)
(c) (d)
(f)(e)
μ = 44.4
μ = 48.0
μ = 45.7σ = 9.6
σ = 11.2μ = 49.6σ = 13.3
σ = 10.6
σ IPSC = 12.5 ms
20 Hz
σ IPSC = 2.5 ms
σ IPSC = 17.5 ms
σ IPSC = 7.5 ms
Fig. 6 Effect of distributions of multiple incoming shunting IPSCs onmitral cell ISI distributions in the presence of noise. Noise properties arethe same as described in Figs. 4 and 5. In all cases, a distribution of 200IPSCs was triggered with a mean latency of 10 ms after a mitral cellspike; individual IPSC ‘chloride’ conductances (Erev=−70 mV) wereselected from a uniform random distribution with a range of 0 to 5 nS.Standard deviations of the distribution of IPSCs in time around thismean were varied. ISI distributions were derived from 5,000simulations with different realizations of noise. (a) Effect of an IPSCburst with a standard deviation (σIPSC) of 2.5 ms. (b) Effect of an IPSCburst with a standard deviation (σIPSC) of 7.5 ms. (c) Effect of anIPSC burst with a standard deviation (σIPSC) of 12.5 ms. (d) Effect ofan IPSC burst with a standard deviation (σIPSC) of 17.5 ms. (e) Mitralcell mean spike delays plotted as a function of the breadth of the
distribution in time of incoming IPSCs. The relationship is depicted forthree baseline mitral cell mean firing rates (20, 30, and 40 Hz). Soliddots identify those sets of simulations depicted in (a)–(d). Forcomparison, mitral cell mean spike delays in the absence of incomingIPSCs are designated with arrows on the ordinate for each of the threebaseline mean firing rates. (f) The standard deviation of mitral cell ISIsplotted as a function of the breadth of the distribution in time ofincoming IPSCs. The relationship is depicted for three baseline mitralcell mean firing rates (20, 30, and 40 Hz). Solid dots identify those setsof simulations depicted in (a)–(d). For comparison, the standarddeviations of mitral cell ISI distributions in the absence of incomingIPSCs are designated with arrows on the ordinate for each of the threebaseline mean firing rates
36 J Comput Neurosci (2008) 25:25–38
inputs, hence impeding any processes that might attract themitral-granule network toward a regime of synchronousspiking. This finding is consistent with experimental resultsdemonstrating that mitral cell spike timing and synchroni-zation are strongly dependent on inhibitory synaptic inputsfrom granule cells, and that granule cells are often highlysynchronized with one another owing in part to synchro-nous barrages of inward current events evoked by olfactorynerve stimulation and mediated by mitral cells (Schoppa2006a, b). The emerging picture is that those mitral cellsthat respond to a given sensory input with excitationare likely to be loosely and transiently synchronized bytheir intrinsic membrane and glomerular circuit properties(Cleland and Sethupathy 2006; Rubin and Cleland 2006),thereby exciting granule cells in a temporally coordinatedmanner. This temporal coordination of granule cell activitycorresponds to a narrower distribution in time of IPSCsdelivered onto mitral cell lateral dendrites, which in turnwill favor a further narrowing of the distribution of mitralcell spike times as explored in the present report (Fig. 6).These recurrent interactions, on the network scale, are wellsuited to efficiently initiate and maintain mitral-granulenetwork oscillations. Indeed, recurrent inhibition in micro-cosm, between a single model mitral cell and one granulecell spine, was very effective at regularizing the timing ofmitral cell spike trains (Fig. 5). The coordinated regulationof these individual recurrent interactions is likely to bemediated by higher-order connectivity, such as the inter-actions among spines and the generation of action poten-tials in granule cells (Schoppa 2006a; Zelles et al. 2006;Balu et al. 2007) and the coordination of multiple granulecells via descending inputs or Blanes cells (Pressler andStrowbridge 2006).
It is increasingly accepted that synchronization amongolfactory neurons, particularly those responsive to a commonstimulus, is likely to be essential to an understanding of odorstimulus representation and processing (Li and Hopfield1989; Li 1990; Linster and Gervais 1996; Cleland andLinster 2002, 2005; Laurent 2002; Brody and Hopfield2003; Bathellier et al. 2006). Indeed, the potential effec-tiveness of spike synchrony is self-evident owing simply tothe limited synaptic integration windows of cortical neurons(e.g., 7 ms in visual pyramidal neurons; (Usrey et al. 2000)).Our results illustrate how recurrent mitral-granule den-dritic interactions can serve to regularize spike timing inmitral cells and consequently contribute to synchronizationwithin mitral cell ensembles. However, the observationthat temporally disorganized inhibitory inputs to modelmitral cells served to reduce the regularity of spike timing,rather than enhance it, further suggest that the efficiencyof this regularization process depends on a critical level ofprior synchronization among inputs, albeit on a slowertimescale than the ≤5 ms observed for the synchronized
spiking derived from mitral-granule dynamics (Schoppa2006b). This finding emphasizes the need to understandsensory representation and processing networks as inte-grated, interdependent systems.
References
Anton, P. S., Granger, R., & Lynch, G. (1993). Simulated dendriticspines influence reciprocal synaptic strengths and lateral inhibi-tion in the olfactory bulb. Brain Research, 628, 157–165.
Aungst, J. L., Heyward, P. M., Puche, A. C., Karnup, S. V., Hayar, A.,Szabo, G., et al. (2003). Centre-surround inhibition amongolfactory bulb glomeruli. Nature, 426, 623–629.
Balu, R., Pressler, R. T., & Strowbridge, B. W. (2007). Multiplemodes of synaptic excitation of olfactory bulb granule cells.Journal of Neuroscience, 27, 5621–5632.
Bathellier, B., Lagier, S., Faure, P., & Lledo, P. M. (2006). Circuitproperties generating gamma oscillations in a network model ofthe olfactory bulb. Journal of Neurophysiology, 95, 2678–2691.
Bhalla, U. S., & Bower, J. M. (1993). Exploring parameter space indetailed single neuron models: simulations of the mitral andgranule cells of the olfactory bulb. Journal of Neurophysiology,69, 1948–1965.
Brody, C. D., & Hopfield, J. J. (2003). Simple networks for spike-timing-based computation, with application to olfactory process-ing. Neuron, 37, 843–852.
Cang, J., & Isaacson, J. S. (2003). In vivo whole-cell recording ofodor-evoked synaptic transmission in the rat olfactory bulb.Journal of Neuroscience, 23, 4108–4116.
Chen, W. R., Shen, G. Y., Shepherd, G. M., Hines, M. L., &Midtgaard, J. (2002). Multiple modes of action potentialinitiation and propagation in mitral cell primary dendrite. Journalof Neurophysiology, 88, 2755–2764.
Cleland, T. A., & Linster, C. (2002). How synchronization propertiesamong second-order sensory neurons can mediate stimulussalience. Behavioral Neuroscience, 116, 212–221.
Cleland, T. A., & Linster, C. (2005). Computation in the olfactorysystem. Chemical Senses, 30, 801–813.
Cleland, T. A., & Sethupathy, P. (2006). Non-topographical contrastenhancement in the olfactory bulb. BMC Neuroscience, 7, 7.
Davison, A. P., Feng, J., & Brown, D. (2000). A reduced compart-mental model of the mitral cell for use in network models of theolfactory bulb. Brain Research Bulletin, 51, 393–399.
Davison, A. P., Feng, J., & Brown, D. (2003). Dendrodendriticinhibition and simulated odor responses in a detailed olfac-tory bulb network model. Journal of Neurophysiology, 90,1921–1935.
Debarbieux, F., Audinat, E., & Charpak, S. (2003). Action potentialpropagation in dendrites of rat mitral cells in vivo. Journal ofNeuroscience, 23, 5553–5560.
Desmaisons, D., Vincent, J. D., & Lledo, P. M. (1999). Control ofaction potential timing by intrinsic subthreshold oscillations inolfactory bulb output neurons. Journal of Neuroscience, 19,10727–10737.
Eeckman, F. H., & Freeman, W. J. (1990). Correlations between unitfiring and EEG in the rat olfactory system. Brain Research, 528,238–244.
Egger, V., Svoboda, K., & Mainen, Z. F. (2003). Mechanisms oflateral inhibition in the olfactory bulb: efficiency and modulationof spike-evoked calcium influx into granule cells. Journal ofNeuroscience, 23, 7551–7558.
Egger, V., Svoboda, K., & Mainen, Z. F. (2005). Dendrodendriticsynaptic signals in olfactory bulb granule cells: Local spine boost
J Comput Neurosci (2008) 25:25–38 37

and global low-threshold spike. Journal of Neuroscience, 25,3521–3530.
Galan, R. F., Ermentrout, G. B., & Urban, N. N. (2005). Efficientestimation of phase-resetting curves in real neurons and itssignificance for neural-network modeling. Physical ReviewLetter, 94, 158101.
Galan, R. F., Fourcaud-Trocme, N., Ermentrout, G. B., & Urban, N. N.(2006). Correlation-induced synchronization of oscillations inolfactory bulb neurons. Journal of Neuroscience, 26, 3646–3655.
Jahr, C. E., & Nicoll, R. A. (1982). An intracellular analysis ofdendrodendritic inhibition in the turtle in vitro olfactory bulb.Journal of Physiology, 326, 213–234.
Lagier, S., Carleton, A., & Lledo, P. M. (2004). Interplay betweenlocal GABAergic interneurons and relay neurons generatesgamma oscillations in the rat olfactory bulb. Journal ofNeuroscience, 24, 4382–4392.
Laurent, G. (2002). Olfactory network dynamics and the coding ofmultidimensional signals. Nature Reviews, Neuroscience, 3,884–895.
Lestienne, R., Tuckwell, H. C., Chalansonnet, M., & Chaput, M.(1999). Repeating triplets of spikes and oscillations in the mitralcell discharges of freely breathing rats. European Journal ofNeuroscience, 11, 3185–3193.
Li, Z. (1990). A model of olfactory adaptation and sensitivityenhancement in the olfactory bulb. Biological Cybernetics, 62,349–361.
Li, Z., & Hopfield, J. J. (1989). Modeling the olfactory bulb andits neural oscillatory processings. Biological Cybernetics, 61,379–392.
Linster, C., & Gervais, R. (1996). Investigation of the role ofinterneurons and their modulation by centrifugal fibers in aneural model of the olfactory bulb. Journal of ComputationalNeuroscience, 3, 225–246.
Linster, C., & Hasselmo, M. (1997). Modulation of inhibition in amodel of olfactory bulb reduces overlap in the neural represen-tation of olfactory stimuli. Behavioral Brain Research, 84,117–127.
Lowe, G. (2003). Flash photolysis reveals a diversity of ionotropicglutamate receptors on the mitral cell somatodendritic membrane.Journal of Neurophysiology, 90, 1737–1746.
Margrie, T. W., & Schaefer, A. T. (2003). Theta oscillation coupledspike latencies yield computational vigour in a mammaliansensory system. Journal of Physiology, 546, 363–374.
Migliore, M., Hines, M. L., & Shepherd, G. M. (2005). The role ofdistal dendritic gap junctions in synchronization of mitral cellaxonal output. Journal of Computational Neuroscience, 18,151–161.
Nusser, Z., Kay, L. M., Laurent, G., Homanics, G. E., & Mody, I.(2001). Disruption of GABA(A) receptors on GABAergicinterneurons leads to increased oscillatory power in theolfactory bulb network. Journal of Neurophysiology, 86,2823–2833.
Pressler, R. T., & Strowbridge, B. W. (2006). Blanes cells mediatepersistent feedforward inhibition onto granule cells in theolfactory bulb. Neuron, 49, 889–904.
Rall, W., & Shepherd, G. M. (1968). Theoretical reconstruction offield potentials and dendrodendritic synaptic interactions inolfactory bulb. Journal of Neurophysiology, 31, 884–915.
Rinberg, D., Koulakov, A., & Gelperin, A. (2006). Sparse odorcoding in awake behaving mice. Journal of Neuroscience, 26,8857–8865.
Rubin, D. B., & Cleland, T. A. (2006). Dynamical mechanisms of odorprocessing in olfactory bulbmitral cells. Journal of Neurophysiology,96, 555–568.
Schoppa, N. E. (2006a). AMPA/kainate receptors drive rapid outputand precise synchrony in olfactory bulb granule cells. Journal ofNeuroscience, 26, 12996–13006.
Schoppa, N. E. (2006b). Synchronization of olfactory bulb mitral cellsby precisely timed inhibitory inputs. Neuron, 49, 271–283.
Schoppa, N. E., Kinzie, J. M., Sahara, Y., Segerson, T. P., &Westbrook, G. L. (1998). Dendrodendritic inhibition in theolfactory bulb is driven by NMDA receptors. Journal ofNeuroscience, 18, 6790–6802.
Usrey, W. M., Alonso, J. M., & Reid, R. C. (2000). Synapticinteractions between thalamic inputs to simple cells in cat visualcortex. Journal of Neuroscience, 20, 5461–5467.
Zelles, T., Boyd, J. D., Hardy, A. B., & Delaney, K. R. (2006).Branch-specific Ca2+ influx from Na+-dependent dendriticspikes in olfactory granule cells. Journal of Neuroscience, 26,30–40.
38 J Comput Neurosci (2008) 25:25–38