
diTFPP, a Phenoxyphenol, Sensitizes Hepatocellular ... - MDPI
LETTERdoi:10.1038/nature14122
EZH2 inhibition sensitizes BRG1 and EGFR mutantlung tumours to TopoII inhibitorsChristine M. Fillmore1,2,3, Chunxiao Xu4,5, Pooja T. Desai1, Joanne M. Berry1, Samuel P. Rowbotham1,2,3, Yi-Jang Lin2,Haikuo Zhang4,5, Victor E. Marquez6, Peter S. Hammerman4, Kwok-Kin Wong4,5 & Carla F. Kim1,2,3
Non-small-cell lung cancer is the leading cause of cancer-related deathworldwide1. Chemotherapies such as the topoisomerase II (TopoII)inhibitor etoposide effectively reduce disease in a minority of patientswith this cancer2,3; therefore, alternative drug targets, includingepigenetic enzymes, are under consideration for therapeutic inter-vention4. A promising potential epigenetic target is the methyltrans-ferase EZH2, which in the context of the polycomb repressivecomplex 2 (PRC2) is well known to tri-methylate histone H3 at lysine27 (H3K27me3) and elicit gene silencing5. Here we demonstrate thatEZH2 inhibition has differential effects on the TopoII inhibitor re-sponse of non-small-cell lung cancers in vitro and in vivo. EGFR andBRG1 mutations are genetic biomarkers that predict enhanced sen-sitivity to TopoII inhibitor in response to EZH2 inhibition. BRG1loss-of-function mutant tumours respond to EZH2 inhibition withincreased S phase, anaphase bridging, apoptosis and TopoII inhib-itor sensitivity. Conversely, EGFR and BRG1 wild-type tumours upreg-ulate BRG1 in response to EZH2 inhibition and ultimately becomemore resistant to TopoII inhibitor. EGFR gain-of-function mutanttumours are also sensitive to dual EZH2 inhibition and TopoII in-hibitor, because of genetic antagonism between EGFR and BRG1.These findings suggest an opportunity for precision medicine in thegenetically complex disease of non-small-cell lung cancer.
To validate that EZH2 is an important target for non-small-cell lungcancer (NSCLC), we generated a 116-gene lung cancer EZH2 co-expression gene signature (Supplementary Table 1). This signature hadpredictive power for cancer progression using the Director’s Challengedata set of 416 human lung adenocarcinomas6, partly because of strati-fication of later-stage tumours to the EZH2 high group (Extended DataFig. 1a). To control for this covariate, exclusively stage 1 and moderatelydifferentiated tumours were examined, confirming that the signaturecould robustly further stratify patients into risk groups (Fig. 1a). Geneontology analysis revealed that the EZH2 co-expression signature washighly enriched for cell cycle, DNA synthesis and DNA repair genes(Supplementary Table 2). One of the genes highly co-expressed withEZH2 in primary tumours was topoisomerase 2A (TOP2A), which en-codes the TopoII helicase targeted by etoposide.
To test EZH2 inhibition as a therapy for NSCLC, EZH2 expressionwas stably knocked down with one of two different small hairpins in apanel of NSCLC cell lines. Western blot confirmed that EZH2 proteinand catalytic mark, H3K27me3, were decreased in each transduced cellline and could be rescued by EZH2 expression from a second lentivirus(Fig. 1b and Extended Data Fig. 1b). We then determined etoposidehalf-maximum inhibitory concentration (IC50) at 4 days. Of the sevenlines, HCC15, A549, H157 and PC9, termed ‘sensitized’ lines, had loweretoposide IC50 when EZH2 was knocked down. Conversely, H460, H23and Sw1573 cell lines, termed ‘protected’ lines, had higher etoposideIC50 as shEZH2 lines (Fig. 1c). Rescue of EZH2 levels completely ab-rogated the change in etoposide IC50 driven by the 39 untranslated region(UTR) targeting hairpin (A549 and Sw1573; Fig. 1c, grey bars). The
sensitized and protected phenotypes were not due to differential de-grees of EZH2 knockdown (Extended Data Fig. 1b, c).
Next, we used pharmacological EZH2 inhibition via theS-adenosylhomocystein hydrolase inhibitor, DZNep, which causes pro-teosomal degradation of PRC2 components including EZH2 (refs 7, 8)and the specific EZH2 methyltransferase inhibitor, GSK126 (ref. 9).Western blot confirmed that 4 days of 1mM DZNep effectively reducedEZH2 protein and H3K27me3, and 10mM GSK126 for 4 days or 2mMGSK126 for 9 days caused a decrease in H3K27me3 levels yet EZH2 re-mained unchanged (Fig. 1d and Extended Data Fig. 2a). Fourteen of 26NSCLC cell lines were more sensitive to 4-day etoposide in the pres-ence of 1mM DZNep, while the other lines were less sensitive to thechemotherapy in the presence of DZNep (Fig. 1e and Extended DataFig. 2b). For the sensitized lines, pretreatment with 2mM GSK126 for9 days sensitized the lines to 4-day etoposide with continued GSK126treatment (14 days total). For the protected lines, 10mM of GSK126 for4 days best recapitulated the etoposide protection caused by DZNepand shEZH2 (Fig. 1e and Extended Data Fig. 2c). IC50 shift results werevalidated with the Chou–Talalay combination index10, demonstratingstrong synergism (combination index , 0.48) between DZNep andetoposide as well as synergism (combination index , 0.64) betweenGSK126 and etoposide (Fig. 1f and Supplementary Table 3). The com-bination index assay also confirmed drug antagonism (combinationindex . 1) in the protected lines.
We examined the mutational annotation available for the NSCLClines and found that 12 of 14 sensitized cell lines harboured inactivatingmutations in BRG1 (SMARCA4) or activating mutations in EGFR, while10 of 12 protected cell lines were wild type (WT) for the two genes(Supplementary Table 4 and Extended Data Fig. 2c; Fisher’s exact test,P 5 0.001). Cell lines segregated into the same genotype-specific pro-tected and sensitized classes when a different TopoII inhibitor, doxo-rubicin11, was combined with DZNep (Extended Data Fig. 2d).
To determine whether the protected and sensitized phenotypes couldbe observed in vivo, we treated xenograft-bearing mice with etoposideand EZH2 inhibition (EZH2i). For the sensitized BRG1 mutant cell lineH157, early treatment with dual etoposide and DZNep therapy pre-vented tumours from forming in four out of six mice, proving moreefficacious than etoposide or DZNep alone (Fig. 2a and Extended DataFig. 3a, b). In contrast, the protected H23 xenografts that received earlydual therapy grew significantly larger than those treated with eitherDZNep or etoposide alone (Fig. 2b and Extended Data Fig. 3b). Further-more, in mice with established EGFR-driven PC9 xenografts, the com-bination of GSK126 and etoposide prevented tumour growth (Fig. 2c).
Next, mouse models of lung cancer predicted to be sensitized(EGFRT790M;L858R transgenic; EGFR hereafter12) or protected (KrasG12D/1;p53D/D; Kras/p53 hereafter13) tumour types were treated with DZNepand etoposide. The Kras/p53 model, WT for Brg1 and Egfr, representsa predicted ‘protected’ cancer, whereas the EGFR model, driven byoncogenic EGFR, represents a predicted ‘sensitized’ cancer. Etoposide,
1Stem Cell Program, Boston Children’s Hospital, Boston, Massachusetts 02115, USA. 2Department of Genetics, Harvard Medical School, Boston, Massachusetts 02115, USA. 3Harvard Stem Cell Institute,Cambridge, Massachusetts 02138, USA. 4Department of Medical Oncology, Dana-Farber Cancer Institute, Boston, Massachusetts 02115, USA. 5Belfer Institute for Applied Cancer Science, Dana-FarberCancer Institute, Boston, Massachusetts 02115, USA. 6Chemical Biology Laboratory, National Cancer Institute, National Institutes of Health, Frederick, Maryland 21702, USA.
0 0 M O N T H 2 0 1 5 | V O L 0 0 0 | N A T U R E | 1
Macmillan Publishers Limited. All rights reserved©2015

DZNep, or combination therapy was then administered to randomizedcohorts of mice with radiographically documented lung masses for4 weeks (Fig. 2d). Marked tumour regression in the EGFR model wasobserved in response to 4 weeks of dual etoposide and DZNep treatment,while mice in the other treatment arms showed continued tumour growth(Fig. 2e and Extended Data Fig. 4a). In striking contrast, the Kras/p53tumours proceeded to grow despite dual treatment (Fig. 2f). DZNepefficacy was confirmed by EZH2 immunohistochemistry for both mod-els (Extended Data Fig. 4b, c).
To address the mechanism through which EZH2i changed sensitiv-ity to TopoII inhibitor (TopoIIi), we considered the physical interactionbetween BRG1 and TopoII that allows for increased TopoII function14.Because BRG1 and EZH2 are known to be genetically antagonistic15,we hypothesized that protected cell lines upregulated BRG1 in responseto EZH2i and thereby had increased TopoII function. BRG1 transcriptmeasured by quantitative PCR with reverse transcription (RT-qPCR)was reproducibly increased by DZNep treatment, although BRG1 levelswere not significantly different when the cells were treated with GSK126(Fig. 3a). To assess the function of BRG1-containing BAF complexes wequantified anaphase bridges, which are known to indicate a failure of
TopoII to decatenate DNA before mitosis and can be attributable toBAF complex dysfunction (Extended Data Fig. 5a). DZNep or GSK126treatment increased anaphase bridges in BRG1 mutant cell lines anddecreased anaphase bridges in WT cells (Fig. 3b and Extended DataFig. 5b). EGFR mutant cells, despite BRG1 upregulation, also had in-creased anaphase bridging with DZNep or GSK126 treatment and showedhigh levels of EGFR in dividing cells (Extended Data Fig. 5c).
We next examined cell cycle and apoptosis dynamics of the lines.While the protected lines showed no difference in apoptotic levels inetoposide compared with dual-treated cultures, the sensitized lines hadsignificantly higher apoptotic fractions in dual-treated cultures than incultures treated with etoposide as a single agent (Fig. 3c). Furthermore,protected etoposide-treated lines had an average of 13.5% fewer cells in
a b
dc
fe
0
100
200
300
400
10 15 20 25 30 35
Vehicle
DZNep alone
Etop alone
Etop + DZNep
n = 19/5
n = 20/5
n = 20/5
n = 24/6
0
50
100
150
200
250
300
350
10 20 30 40
Vehicle
DZNep alone
Etop alone
DZNep + Etop
n = 19/8
n = 16/6
n = 23/10
n = 19/8
H23-protected line H157-sensitized line
0
200
400
22 24 26 28 30 32 34 36
Vehicle
Etop alone
GSK alone
GSK + Etop
Geftinib
Week 0
Week 4
EGFRT790M; L858R
n = 8
n = 7
n = 6
n = 6
n = 8
HH HH
HHHH
–80
–40
0 0
40
80
120
40
80
120
KrasG12D/+; p53Δ/Δ
KrasG12D/+; p53Δ/Δ
Ch
an
ge in
tu
mo
ur
vo
lum
e (m
m3)
Ch
an
ge in
tu
mo
ur
vo
lum
e (m
m3)
PC9-sensitized line
Week 4
Week 2
Etop
DZNep
Mean
+ + +– – –
+ + +– – –
–0.85 (40%)* 0.24 0.35 0.75 0.82 0.87
SD 0.69 0.20 0.14
† † †
EGFRT790M; L858R
Etop
DZNep
Etop
DZNep
Time (days) Time (days)
Time (days)
*
*
**
Tu
mo
ur
vo
lum
e (m
m3)
Tu
mo
ur
vo
lum
e (m
m3)
Tu
mo
ur
vo
lum
e (m
m3)
Figure 2 | In vitro sensitivities to EZH2i plus TopoIIi predict in vivoresponses. Either the H157 (a) or the H23 (b) cell line was injected into theflanks of Nude mice and tumours were allowed to form. On day 12, mice wererandomly segregated into cohorts that received either placebo, DZNep,etoposide or dual therapy for 2 weeks, and average tumour size 6 s.e.m. wereplotted (n for tumours/mice in each arm indicated on graphs; *P 5 0.002,**P 5 0.0005 dual versus etoposide). c, The PC9 cell line was injected into theflanks of Nude mice and tumours were allowed to grow to 70 mm3. Mice werethen treated with etoposide, GSK126, dual therapy or gefitinib (as a positivecontrol) for 2 weeks, and average tumour size 6 s.e.m. were plotted (n indicatedon legend, mice with one tumour each; P , 0.008 for dual versus etoposide orGSK126 alone). d, Representative magnetic resonance images of mice ofindicated genotypes on combination etoposide plus DZNep treatment at 0 and4 weeks after treatment initiation. H, heart area. e, Waterfall plot depictingtumour growth 6 s.e.m. of EGFRT790M;L858R tumours after 2 weeks and 4 weeksof treatment with vehicle (blue), etoposide (green), DZNep (red) and etoposideplus DZNep (purple). The y axis indicates percentage tumour growth versusday 0. Each bar represents an individual mouse ({the mouse died before themagnetic resonance imaging time point). Statistical analyses were performedon the 4-week log2-transformed data (P 5 0.008 dual versus DZNep andP 5 0.004 dual versus etoposide). f, Waterfall plot depicting tumourgrowth 6 s.e.m. of KrasG12D/1;p53D/D tumours after 2 weeks and 4 weeks oftreatment with vehicle (blue) and etoposide plus DZNep (purple).
a Stage 1
EZH2 High EZH2 Low
P = 0.003
Moderately differentiated
Su
rviv
ing
patien
ts (%
)
100
80
60
40
20
0 % S
urv
ivin
g p
atien
ts
c
e
d
f
P = 0.00002
0 1 2 3 4 5 6
Years after diagnosis
–6
–4
–2
0
2
4
Sensitized Protected
Fo
ld c
han
ge in
eto
po
sid
e IC
50
(lo
g ×
10
)
shEZH2 CR
shEZH2 3′ UTR
EZH2 rescue
–6
–4
–2
0
2
4
6
Fo
ld c
hang
e in e
top
osid
e IC
50
(lo
g ×
10)
Sensitized Protected
GSK126
DZNep
Co
mb
inatio
n ind
ex IC
25 t
o IC
75
Sensitized Protected
A5
49
EZH2
Histone H3
H3K27me3
EZH2
Histone H3
H3K27me3
Sw
15
73
S
w1
57
3
A5
49
EZH2
Histone H3
H3K27me3
EZH2
Histone H3
H3K27me3
100
80
60
40
20
0 0 1 2 3 4 5 6
Years after diagnosis
b
** **
** *
*
** ** **
*
*
**
*
** **
**
** * *
*
*
** **
**
** **
*
0.1
1
10
GSK126
DZNep
H15
7
HCC15
A549
PC9
H23
Sw15
73
H46
0
H15
7
HCC15
A549
PC9
H23
Sw15
73
H46
0
H15
7
HCC15
A549
PC9
H23
Sw15
73
H46
0
Vehicle
1 μM
DZN
ep, 4
d
10 μM
GSK12
6, 4
d
2 μM
GSK12
6, 9
d
shGFP
shEZH
2 3′ U
TR
shEZH
2 CR
shEZH
2 3′ U
TR
+EZH2
Figure 1 | EZH2i sensitizes BRG1 or EGFR mutants to TopoIIi. a, Director’sChallenge samples were hierarchically clustered into two risk groups using theEZH2 co-expression signature (Supplementary Table 1). The Kaplan–Meiercurves only for stage 1 (n 5 94) or only for moderately differentiated tumours(n 5 142) to 6 years after diagnosis are shown. b, Western blot for EZH2 andH3K27me3 on indicated transduced lines; total histone H3 is shown as loadingcontrol. CR indicates a coding region targeting hairpin. c, Fold change 6 s.e.m.in etoposide IC50 between transduced lines (n 5 3 biological replicates forHCC15, A549, PC9, H23 and Sw1573, n 5 4 biological replicates for HCC15and H460, rescues n 5 3 biological replicates; *P , 0.04, **P , 0.01).d, Western blot for EZH2 and H3K27me3 on lines treated with indicated drugs.e, Fold change 6 s.e.m. in etoposide IC50 between vehicle-treated and drug-treated lines (n 5 3 biological replicates for all except n 5 4 biological replicatesfor H157 1 DZNep; *P , 0.04, **P , 0.01). f, Average Chou–Talalaycombination index values 6 s.e.m. (also see Supplementary Table 3) forfractions affected equivalent to IC25–IC75 (n 5 3 biological replicates).
RESEARCH LETTER
2 | N A T U R E | V O L 0 0 0 | 0 0 M O N T H 2 0 1 5
Macmillan Publishers Limited. All rights reserved©2015

S phase in response to DZNep or shEZH2 compared with treatmentwith etoposide alone, suggesting these lines undergo cell cycle arrest spar-ing them from apoptosis. In contrast, sensitized etoposide-treated lineshad an average of 16.5% more cells in S phase in response to DZNep orshEZH2 (Fig. 3d and Extended Data Fig. 6a), suggesting that apoptosisof G2/M cells that could not repair anaphase bridges contributed toenrichment for S phase.
While the links between EZH2, BRG1 and TopoII explained increasedsensitivity of BRG1 mutants to TopoIIi, it was still unclear why EGFRmutants behaved similarly. In our panel of cell lines, 30% had a BRG1mutation and 23% had an EGFR mutation; however, none had bothBRG1 and EGFR mutations (Supplementary Table 4 and Extended DataFig. 7a; Fisher’s exact test P 5 0.005). Similarly, in a panel of 412 se-quenced primary adenocarcinomas16,17, 65 (15.7%) had mutation inEGFR, while 33 (8%) had mutations in BRG1. With these allele frequen-cies, 1.25% of the tumour samples were expected to have both BRG1 andEGFR mutations; however, only 1 (0.2%) was observed (Fisher’s exacttest, P 5 0.019, EGFR R574L). The negative correlation of BRG1 andEGFR mutations suggests that they may be functionally redundant—BRG1 loss may be permissive for high EGFR expression. Supportingthis idea, a strong negative correlation was found between EGFR andBRG1 expression in the Director’s Challenge data set (Fig. 4a). Whencomparing gene expression of EGFR and BRG1 mutant cell lines to WTlines, EGFR was the first of 21 shared upregulated genes, overexpressed
3.1-fold in BRG1 mutant cell lines and 3.25-fold in EGFR mutant celllines (Extended Data Fig. 7b, c and Supplementary Table 5).
To understand their genetic relationship better, EGFR and BRG1 ex-pressions were manipulated (Fig. 4b and Extended Data Fig. 8a). BRG1re-expression in the HCC15 lines converted the line from a sensitizedto protected phenotype, and the HCC15 shEGFR line was no longer sen-sitized to etoposide by DZNep (Fig. 4c). Similarly, DZNep had no effecton etoposide IC50 when EGFR was overexpressed or BRG1 was knockeddown in H460 cells (Fig. 4c). These changes in etoposide sensitivity were
0
5
10
15
20
0
1
2
3
4
5
PC9 Sw1573 H460 H23
a b
d
An
ap
hase b
rid
ges (%
)
BR
G1
mR
NA
exp
ressio
n
0
10
20
30
40
50
60
70
PC9 A549 H157 H23 Sw1573
An
nexin
V+/7
AA
D–
cells
(%
)
Etoposide Etoposide + DZNepDZNepVehicle GSK126
Sw1573 H23H157
Etoposide + GSK126
PC90
5
10
15
20
0
5
10
15
20
0
5
10
15
20
0
5
10
15
20
c
S p
hase (%
)
0
10
20
30
40
0
10
20
30
40
**** **
**
0
10
20
30
40
0
10
20
30
40** *
0
10
20
30
40
0
10
20
30
40
* ***
**
0
10
20
30
40
****
Etoposide Etoposide + DZNep Etoposide + GSK126
A549
Sw1573 H23H157PC9 A549 H460HCC15
WTBRG1 mutantEGFR
mutantWTEGFR
mutant
Vehicle
DZNep
GSK126*
**
****
**
**
* ***
*
Vehicle
DZNep
GSK126
** ****
*
**
**
**
*
*
*
*
*
****
Figure 3 | Dual EZH2i and TopoIIi differentially affects cell cycle, apoptosisand anaphase bridging. a, RT-qPCR for average expression of BRG1 6 s.e.m.in indicated cell lines in response to 4 days of 1mM DZNep or 10mM GSK126(n 5 6 biological replicates for DZNep, n 5 3 biological replicates for GSK126;*P , 0.05, **P , 0.008). b, Average percentage of anaphase structureswith bridges 6 s.e.m. in vehicle-, DZNep- or GSK126-treated cell lines (n $ 3biological replicates and indicated in Methods; *P , 0.04, **P , 0.02).c, Average percentage annexin V1/7AAD2 cells 6 s.e.m. quantified by flowcytometry on cell lines cultured with indicated treatments for 3 days (n 5 4biological replicates; *P , 0.03, **P , 0.001 for etoposide versus dual-treatedor DZNep versus dual treatment for PC9). d, 7AAD cell cycle flow cytometrywas performed on cell lines with or without 5mM etoposide or 1mM DZNepfor 4 days. The average percentage S phase 6 s.e.m. of each culture isplotted (n 5 3 biological replicates for HCC15, A549, PC9 and H23, n 5 4biological replicates for H157 and Sw1573; *P , 0.05 **P , 0.009).
–2
0
2
4
6
8
10
–10
–5
0
5
10
a b
e
c
0
4,000
8,000
0 500 1,000
P = 0.0002
Spearman’s coefficient = –0.64
EG
FR-n
orm
aliz
ed
exp
ressio
n
BRG1-normalized expression
d
HCC15 shGFP HCC15 BRG1 overexpression
DAPIEGFRBRG1
EGFR10 kb
Human chromosome 7p11.2
H3K27ac
BRG1
0
100
0
20R
ela
tive e
xp
ressio
n (lo
g2)
Rela
tive e
xp
ressio
n (lo
g2)
H460
shGFP
shEG
FR
BRG1
over
expre
ssio
n
shGFP
shEG
FR
BRG1
over
expre
ssio
n
Empty
vec
tor
shBRG1
EGFR
over
expre
ssio
n
Empty
vec
tor
shBRG1
EGFR
over
expre
ssio
n
shGFP
shEG
FR
BRG1
over
expre
ssio
n
Empty
vec
tor
shBRG1
EGFR
over
expre
ssio
n
protected line
HCC15
sensitized line
BRG1 EGFR
*
*
–4
–2
0
2
4
6
**
**
HCC15 shGFP HCC15 BRG1 overexpression
Fo
ld e
nrichm
ent
β-ACTIN promoter
50 kb upstream
of EGFR regulatory element
EGFR regulatory element
*
*
g
0
40
80
0
40
80
**
0
4
8
0
1
2
** *
*
Eto
po
sid
e IC
50
Eto
po
sid
e IC
50
Etoposide Etoposide + DZNep
Anap
hase b
rid
ges (%
)
Anap
hase b
rid
ges (%
)
f
BRG1
EGFREZH2
TopoII
Etop
DZNep, GSK126, shEZH2
h
GFP BRG1 Flag GFP BRG1 Flag
**
**
Etoposide Etoposide + DZNep
Figure 4 | BRG1 and EGFR are genetically antagonistic and control thesensitized phenotype. a, EGFR and BRG1 expression in tumours from theDirector’s Challenge were plotted and correlation was assessed (n 5 36). b, RT-qPCR for average expression of BRG1 and EGFR 6 s.e.m. in indicatedtransduced HCC15 and H460 cell lines (*P , 0.04, **P , 0.0001; n 5 5biological replicates for H460, n 5 4 biological replicates for HCC15).c, Average etoposide IC50 6 s.e.m. in the indicated vehicle- and DZNep-treatedcells (n 5 3 biological replicates; *P , 0.04, **P , 0.0001). d, Averagepercentage of anaphase structures with bridges 6 s.e.m. in indicated vehicle- orDZNep-treated cell lines (n 5 3 biological replicates; *P , 0.04, **P , 0.02).e, Depiction of EGFR regulatory element including H3K27ac and BRG1binding peaks and from ENCODE database. f, Immunofluorescence for EGFRand BRG1 on HCC15 cells transduced with short hairpin targeting greenfluorescent protein (shGFP, control) and BRG1-overexpressing HCC15 cells;scale bar, 30mm. g, Chromatin immunoprecipitation for GFP (control), BRG1or the Flag-tag on the exogenously expressed BRG1 in the HCC15 shGFP(control) and BRG1-expressing cell lines. qPCR was performed with primersfor indicated genomic sites and average enrichment over GFP 6 s.e.m. wasplotted (n 5 4 biological replicates, one-way analysis of variance; *P 5 0.02).h, In response to EZH2i: WT cells show increased BAF complex functionand subsequent decrease in etoposide sensitivity; BRG1 mutant cells haveincreased etoposide sensitivity; and EGFR mutant cells act like BRG1 mutantcells owing to genetic antagonism of EGFR by BRG1.
LETTER RESEARCH
0 0 M O N T H 2 0 1 5 | V O L 0 0 0 | N A T U R E | 3
Macmillan Publishers Limited. All rights reserved©2015

consistent with changes in anaphase bridging, apoptosis and S phaseaccumulation (Fig. 4d and Extended Data Fig. 8b, c).
The ENCODE database18 shows a chromatin immunoprecipitationpeak for BRG1 upstream of EGFR (Fig. 4e). HCC15 cells re-expressingBRG1 had lower levels of EGFR by RT-qPCR and immunofluorescence(Fig. 4b, f). We hypothesized that BRG1-containing BAF complexesbind to the EGFR regulatory element to disrupt EGFR transcription, asobserved in other systems19. We confirmed the exogenously expressedBRG1 was being incorporated into BAF complexes (Extended Data Fig. 9a),and then performed chromatin immunoprecipitation assays. BRG1,immunoprecipitated with an antibody recognizing the protein itself orthe Flag-tag, was significantly associated with the EGFR regulatory ele-ment (Fig. 4g). This genetic antagonism explains why dividing cells inEGFR-driven cultures may not sufficiently upregulate BRG1, and respondto combined etoposide and EZH2i with increased anaphase bridgingas BRG1 mutant cells do (Fig. 4h).
Our results suggest that dual EZH2i plus TopoIIi represents a treat-ment option for EGFR mutant tumours, even those that invariablydevelop resistance to EGFR tyrosine-kinase inhibitors12. Furthermore,combination EZH2i plus TopoIIi offers the first specific therapeutic forBRG1 mutant lung cancers. Importantly, the strong antagonism of eto-poside and EZH2i warns against using this drug combination for EGFRand BRG1 WT tumours. Also notable is the fact that EZH2i eithersensitized to etoposide (synergism) or protected from it (antagonism),but very rarely was additivity observed. We and others20,21 have foundthat BRG1 and EGFR mutations are significantly anti-correlated inNSCLC. Moreover, BRG1 mutant NSCLCs had elevated EGFR levels,raising the possibility that BRG1 mutant tumours represent a subset ofpatients with WT EGFR that respond to EGFR tyrosine-kinase inhib-itor20,21. Unlike Brg1-deficient MEFs14, BRG1 mutant lung cancer cellsdid not exhibit TopoII dysfunction unless EZH2 was inhibited, sug-gesting a novel connection between EZH2 and TopoII function.
Online Content Methods, along with any additional Extended Data display itemsandSourceData, are available in the online version of the paper; references uniqueto these sections appear only in the online paper.
Received 13 November 2013; accepted 26 November 2014.
Published online 28 January 2015.
1. Jemal, A. et al. Global cancer statistics. CA Cancer J. Clin. 61, 69–90 (2011).2. Zornosa, C. et al. First-line systemic therapy practice patterns and concordance
with NCCN guidelines for patients diagnosed with metastatic NSCLC treated atNCCN institutions. J. Natl. Compr. Canc. Netw. 10, 847–856 (2012).
3. Wang, L. et al. Randomized phase II study of concurrent cisplatin/etoposide orpaclitaxel/carboplatin and thoracic radiotherapy in patients with stage III non-small cell lung cancer. Lung Cancer 77, 89–96 (2012).
4. Baylin, S. B. & Jones, P. A. A decade of exploring the cancer epigenome – biologicaland translational implications. Nature Rev. Cancer 11, 726–734 (2011).
5. Simon, J. A. & Lange, C. A. Roles of the EZH2 histone methyltransferase in cancerepigenetics. Mutat. Res. 647, 21–29 (2008).
6. Shedden, K. et al. Gene expression-based survival prediction in lungadenocarcinoma: a multi-site, blinded validation study. Nature Med. 14, 822–827(2008).
7. Tan, J. et al. Pharmacologic disruption of Polycomb-repressive complex2-mediated gene repression selectively induces apoptosis in cancer cells. GenesDev. 21, 1050–1063 (2007).
8. Choudhury, S. R. et al. (-)-Epigallocatechin-3-gallate and DZNep reduce polycombprotein level via a proteasome-dependent mechanism in skin cancer cells.Carcinogenesis 32, 1525–1532 (2011).
9. McCabe, M. T. et al. EZH2 inhibition as a therapeutic strategy for lymphoma withEZH2-activating mutations. Nature 492, 108–112 (2012).
10. Chou, T. & Talalay, P. Quantitative analysis of dose-effect relationships: thecombined effects of multiple drugs of enzyme inhibitors. Adv. Enzyme Regul. 22,27–55 (1984).
11. Deweese, J. E.& Osheroff,N.TheDNA cleavage reaction of topoisomerase II: wolf insheep’s clothing. Nucleic Acids Res. 37, 738–748 (2009).
12. Ji, H. et al. The impact of human EGFR kinase domain mutations on lungtumorigenesis and in vivo sensitivity to EGFR-targeted therapies. Cancer Cell 9,485–495 (2006).
13. Jackson, E. L. et al. The differential effects of mutant p53 alleles on advancedmurine lung cancer. Cancer Res. 65, 10280–10288 (2005).
14. Dykhuizen, E. C. et al. BAF complexes facilitate decatenation of DNA bytopoisomerase II. Nature 497, 624–627 (2013).
15. Wilson, B. G. et al. Epigenetic antagonism between Polycomb and SWI/SNFcomplexes during oncogenic transformation. Cancer Cell 18, 316–328 (2010).
16. Imielinski, M. et al. Mapping the hallmarks of lung adenocarcinoma with massivelyparallel sequencing. Cell 150, 1107–1120 (2012).
17. TCGA. Comprehensive molecular profiling of lung adenocarcinoma. Nature 511,543–550 (2014).
18. ENCODE. An integrated encyclopedia of DNA elements in the human genome.Nature 489, 57–74 (2013).
19. Hargreaves, D. C. & Crabtree, G. R. ATP-dependent chromatin remodeling:genetics, genomics and mechanisms. Cell Res. 21, 396–420 (2011).
20. Oike, T. et al. A synthetic lethality-based strategy to treat cancers harboring agenetic deficiency in the chromatin remodeling factor BRG1. Cancer Res. 73,5508–5518 (2013).
21. Matsubara, D. et al. Lung cancer with loss of BRG1/BRM, shows epithelialmesenchymal transition phenotype and distinct histologic and genetic features.Cancer Sci. 104, 266–273 (2013).
Supplementary Information is available in the online version of the paper.
Acknowledgements We thank the Kim laboratory, F. Luo, P. Louis, K. Harrington,X. Wang and J. Brainson for technical assistance and discussions, and J. Crabtree,D. Hargreaves, C. Kadoch, L. Zon, K. Cichowski, M. Enos, S. Orkin, A. Gutierrez andC. Roberts for discussions. This work was supported in part by the Ladies Auxiliary tothe Veterans of Foreign Wars, PF-12-151-01-DMC from the American Cancer Society,and the Uniting Against Lung Cancer Young Investigator Award supported by MerylBralower (C.M.F.), Boston University Undergraduate Research Opportunities Program(P.T.D.), RO1 HL090136, U01 HL100402 RFA-HL-09-004, American Cancer SocietyResearch Scholar Grant RSG-08-082-01-MGO, the V Foundation for Cancer Research,aBasilO’ConnerMarchofDimesStarterAward, theHarvardStemCell Institute, and theLung Cancer Research Foundation (C.F.K.), the National Institutes of Health (NIH)grants CA122794, CA140594, CA163896, CA166480, CA154303 and CA120964(K.K.W.), the Intramural Research Program of the NIH, National Cancer Institute, Centerfor Cancer Research (V.E.M.), and the NIH grant K08 CA163677 (P.S.H.).
Author Contributions C.M.F., C.X., K.K.W. and C.F.K. designed the study; C.M.F., C.X.,P.T.J., J.M.B. and Y.J.L. performed the experiments; S.P.R. cloned the EZH2complementary DNA (cDNA) vector; H.Z. performed EZH2 immunohistochemistry,V.E.M. provided DZNep, P.S.H. analysed primary tumour sequencing data; K.K.W.allowedautochthonousmousemodels studies inhis laboratory; C.M.F. andC.F.K.wrotethe manuscript with comments from all authors.
Author Information Reprints and permissions information is available atwww.nature.com/reprints. The authors declare no competing financial interests.Readers are welcome to comment on the online version of the paper.Correspondence and requests for materials should be addressed toC.F.K. ([email protected]).
RESEARCH LETTER
4 | N A T U R E | V O L 0 0 0 | 0 0 M O N T H 2 0 1 5
Macmillan Publishers Limited. All rights reserved©2015

METHODSCell lines. Cell lines used are listed in Supplementary Table 4. All cell lines weremaintained in RPMI 1640 media with 10% fetal bovine serum, 4 mM L-glutamineand penicillin/streptomycin at 37 uC, 5% CO2. Cell lines were obtained from theMeyerson laboratory at Dana-Farber Cancer Institute. No mycoplasma was detectedin cultures by either routine mycoplasma PCR or perinuclear 49,6-diamidino-2-phenylindole (DAPI) staining. Cell line genotypes (Supplementary Table 4) wereobtained from published studies22,23, COSMIC database24 and CCLE database25.Vectors. The pLKO.1 EZH2 shRNA construct clones TRCN0000040076 andTRCN0000040073 were purchased from Sigma and the shGFP plasmid 12273 isavailable on Addgene26. Both shBRG1 and the matched empty vector were providedby the Smale laboratory27 and are available on Addgene, the BRG1 overexpressionplasmid 19148 from the Massague laboratory28 was purchased through Addgene,and the shEGFR and EGFR WT overexpression constructs were provided by theJanne laboratory29. The EZH2 overexpression construct was derived by cloninghuman EZH2 cDNA into pLenti7.3/V5-DEST (Invitrogen). Lentivirus was pack-aged in HEK293T cells using established protocols30, and retrovirus was packagedin PlatE cells again using established protocols31. Cell lines were infected with viral-containing supernatant containing 6mg ml21 polybrene (Sigma) for a period of10–18 h. Infected cultures were selected with 1mg ml21 puromycin (all sh con-structs and EGFR overexpression, SIMGA), 200mg ml21 hygromycin (BRG1 over-expression, Invitrogen), or by flow cytometry for GFP (EZH2 overexpression)5 days after infection.
Small hairpin sequences: GFP: GCCC(GCAAGCTGACCCTGAAGTTCAT)TCAAGAG(ATGAACTTCAGGGTCAGCTTGC)TTTT; EZH2 coding region: CCGG(CGGAAATCTTAAACCAAGAAT)CTCGAG(ATTCTTGGTTTAAGATTTCCG)TTTTT; EZH2 39 UTR: CCGG(TATTGCCTTCTCACCAGCTGC)CTCGAG(GCAGCTGGTGAGAAGGCAATA)TTTTT; EGFR: CCGG(GCTGAGAATGTGGAATACCTA)CTCGAG(TAGGTATTCCACATTCTCAGC)TTTTT;BRG1: TTTG(TGGATAAGCAGCACAAGATT)TCAAGAG(AATCTTCTGCTGCTTCTCCA)TTTTT.Drugs. Etoposide and doxorubicin (Sigma) were diluted to a stock of 100 mM indimethyl sulphoxide (DMSO) for all cell culture experiments. DZNep was a giftfrom V.E.M. and was diluted in DMSO to a stock of 10 mM. GSK126 was purchasedfrom Xcess Bio as a 10 mM stock in DMSO. All stocks were diluted in DMSO to1,0003 concentration before addition into media at 23 concentration and finaldilution onto plated cells 1:1.Cytotox assays. Cell lines were dissociated, counted and plated at 5,000 cells perwell in flat-bottomed opaque tissue-culture-treated 96-well plates (CytoOne). Edgewells were filled with PBS. The following day, 23 drug diluted in media was addedto each well such that the well then contained 100ml media with 13 drug concen-tration at the following doses: etoposide, 0, 0.1, 1, 3, 5, 7, 10, 50, 100, 500mM; ordoxorubicin, 0, 0.01, 0.1, 0.5, 1, 3, 5, 7, 10, 50mM; with or without additional 1mMDZNep, 10mM GSK126 or a continuation of 2mM GSK126 from a 9-day 2mMGSK126 pretreated culture. After 4 days, CellTiter-Glo (Promega) was added andluminescence was read on a BioTec plate reader to determine relative cell numberin each well. Data were averaged for triplicate or quadruplicate technical replicatesand normalized to the untreated wells, and whole runs (vehicle and EZH2i) wereexcluded if vehicle-treated wells did not reach the threshold luminescence of 3,000.Results from independent biological replicate experiments were input into Graph-Pad Prism software to extrapolate the IC50 and s.e.m. of IC50 for a given cell lineusing the nonlinear regression analysis of log(inhibitor) versus normalized responsewith a variable slope. For 1 mM DZNep for 4 days with etoposide, n 5 3 biologicalreplicates for H1975, H2030, HCC4006, A549, HCC2450, Calu1, H1650, H522,H2126, H1299, HCC15, H322, H2009, HCC95, H520, H460, Calu3, H2122, H23and H3255; n 5 4 biological replicates for PC9, H157, HCC827, Sw1573, Calu6and H441. For both 2mM GSK126 pretreated for 9 days and continued for 4 dayswith etoposide, and 10mM GSK126 treated for 4 days with etoposide, n 5 3 bio-logical replicates. The log(IC50) values were compared using GraphPad Prism soft-ware, and P values reported are the sum-of-squares F statistics. For graphs, log(IC50)of vehicle control cells was subtracted from log(IC50) of EZH2i-treated cells andmultiplied by ten to be depicted as log fold change 3 10. Errors were estimated bycalculating possible upper and lower bounds of log fold changes based on GraphPadreported s.e.m. for each log(IC50) calculated.
For Chou–Talalay combination index assays10, doses for etoposide, DZNep orGSK126 were 0, 0.1, 0.5, 1, 3, 5, 7, 10, 30, 50 mM and 1:1 combinations of etoposideand DZNep or etoposide and GSK126. Survival percentages for three independentbiological replicate experiments were averaged and input into CompuSyn softwareto extrapolate combination index values. Any drug dose with mean survival over100% was excluded because the CompuSyn software did not allow for values over 1.In addition, visual inspection led us to remove the highest doses of GSK126 fromthe analysis for every cell line, as suggested in refs 32 and 33, leading to much bet-ter matching of the data points to the median effect plot. Notably, removal of these
data points both increased synergy seen in the sensitized lines and increased an-tagonism seen in H460 and Sw1573 lines.Flow cytometry. For 7AAD-cell cycle analysis, cell lines were plated at 1.5 3 106
cells per 10 cm plate and treated with drug for 4 days. Cells were then dissociated,fixed with 100% ice cold ethanol for at least 2 h, incubated for 30 min with 1 mg ml21
DNase-free RNase A (Thermo) and resuspended in 20mg ml21 7-aminoactinomycinD (7AAD; Invitrogen). Thirty thousand events were collected on the BD Fortessa,analysed with ModFit LT software and the results were averaged for three or fourbiological replicates (n indicated in legend).
For Annexin V/7AAD apoptosis analysis, cell lines were plated at 5 3 104 cellsper well of a six-well plate and treated with drug for 3 days. Supernatant was re-tained and added to trypsinized suspensions of adherent cells. Cells were stainedwith Annexin V-FITC (BD Biosciences) according to the manufacturer’s instruc-tions, and resuspended with 1mg ml21 7AAD before analysis on BD Fortessa. Forsensitized lines 2mM GSK126 pretreated for 9 days and continued for 3 days withetoposide was used, while for protected line 10mM GSK126 treated for 3 days withetoposide was used. Data were analysed with FlowJo (Treestar) software and thepercentages of Annexin V1/7AAD2 cells were averaged for four biological replic-ate experiments.Quantitative RT–PCR. RNA from treated cell lines was extracted using AbsolutelyRNA kits (Agilent) and cDNA was made using the SuperScript III kit (Invitrogen).Relative gene expression was assayed with Sybr green on the StepOnePlus real-time PCR system (Applied Biosystems). Relative expression was calculated byusing threshold cycle (Ct) values: gene of interest(Ct, reference 2 Ct, experimental) 2
CYPA(Ct, reference 2 Ct, experimental) and graphs potted on the log2 scale or convertedto linear scale. Statistics were performed on log2 data. For all experiments, the re-ference sample was a matched vehicle-treated or control transduced cell line.
Primer sequences: CYPA: F TCATCTGCACTGCCAAGACTG R CATGCCTTCTTTCACTTTGCC; EZH2: F AGGAGTTTGCTGCTGCTCTC R CCGAGAATTTGCTTCAGAGG; BRG1: F AGCGATGACGTCTCTGAGGT R GTACAGGGACACCAGCCACT; EGFR: F TAACAAGCTCACGCAGTTGG R GTTGAGGGCAATGAGGACAT.Xenograft experiments. For DZNep experiments, H157 or H23 cells were dis-sociated into single cells, counted and resuspended at 1 3 106 cells per 250ml of 1:1media/matrigel (BD). Eight- to 16-week-old female Foxn1nu/Foxn1nu (Nude) mice(Harlan) were injected subcutaneously with 1 3 106 cells in two to four spots onflanks. Etoposide and DZNep were administered from day 12 to day 17 after in-jections; etoposide: 20 mg/kg/d intraperitoneally in corn oil once per day for 5 con-secutive days; DZNep 2 mg/kg/d intraperitoneally in corn oil twice per week for1 week, or 1 mg/kg/d intraperitoneally in corn oil twice per week for 2 weeks. Tumourgrowth was measured every other day by calliper in a non-blinded fashion. ForGSK126 experiments, PC9 cells were dissociated into single cells, counted and re-suspended at 1 3 106 cells per 250ml of 1:1 media/matrigel (BD). Eight- to 16-week-old female Foxn1nu/Foxn1nu mice (Harlan) were injected subcutaneously with 1 3
106 cells in one spot on left flank. Tumours were allowed to grow for 23 days to amean size of 70 mm3. Mice were then randomized into groups that received etopo-side, GSK126, both etoposide and GSK126, gefitinib or vehicle: etoposide 10 mg/kg/dintraperitoneally in corn oil three times a week, GSK126 300 mg/kg/d intraper-itoneally in 1:1 v/v GSK126/Captisol mixture resuspended in sterile water withacetic acid to pH 4.8, gefitinib (LC Laboratories) 150mg/kg/d in 1% Tween-80 (Sigma).All mouse experiments were approved by the BCH Animal Care and Use Com-mittee and by the Dana-Farber Cancer Institute Institutional Animal Care and UseCommittee, both accredited by the Association for Assessment and Accreditation ofLaboratory Animal Care, and were performed in accordance with relevant insti-tutional and national guidelines and regulations.Generation of the EZH2 co-expression gene signature. We used Oncomine34 toquery the top 20 genes co-expressed with EZH2 in all data sets containing humannon-small-cell lung cancer samples and co-expression data6,35–41. We chose 20 pro-bes for examination from each study, to yield a list between 100 and 200 genes,which allowed for robust hierarchal clustering of samples similar to that in previousstudies. Of the 180 probes, 64 were redundant, leading to a list of 116 genes highlyco-expressed with EZH2 (Supplementary Table 1). Because these data sets werefrom various microarray platforms, the gene list was then used to generate a probelist for the 116 genes corresponding to probes on the U133A Affymetrix arrayusing the batch query function on the NetAffx website (http://www.affymetrix.com/analysis/index.affx). Gene ontology analysis was performed on the EZH2co-expression signature with dChip software (http://www.hsph.harvard.edu/cli/complab/dchip/).Microarray analysis. All array data are publically available on Gene ExpressionOmnibus (http://www.ncbi.nlm.nih.gov/geo/) and correspond to array files avail-able from GSE4824 (ref. 42) for all lines except A549, H522 and PC9, GSE5457 forA549 (two replicates), GSE5720 (ref. 43) for H522 and an additional A549, GSE7670(ref. 44) for an additional H1299, GSE10089 (ref. 45) for PC9 and H1650, and
LETTER RESEARCH
Macmillan Publishers Limited. All rights reserved©2015

GSE31625 (ref. 46) for an additional PC9. Arrays were chosen based on availabilityin September 2012. Arrays were analysed using R/Bioconductor (http://www.bioconductor.org/). Raw CEL files from U133A Affymetrix arrays were processed usingthe robust multiarray average algorithm47. To identify genes correlating with thephenotypic groups, we used limma48 to fit a statistical linear model to the data andthen tested for differential gene expression in the three groups using the vennSelectpackage—WT: H460, H441, H2122, H2009, Calu6, HCC95; EGFR mutant: H1650,HCC827, HCC4006, H1975, H3255, PC9; BRG1 mutant: A549, H1299, H157, H2126,H522, HCC15. Results were adjusted for multiple testing using the Benjamini andHochberg method49, and significance was determined using a false-discovery-ratecutoff of less than 5%. For correlation between EGFR and BRG1 expression in theDirector’s Challenge data set, the arrays were processed using RMA and limma asdescribed above. Tumours with a robust multiarray average normalized expressionof more than 2,000 for EGFR or 575 for BRG1 were plotted and correlation wasassessed—because these data were nonparametric, Spearman’s correlation coef-ficient was used. Using this same method of selecting for highest-expressing tumours,we could visualize positive correlations between EZH2 and other EZH2 co-expressiongene signature members (data not shown).Kaplan–Meier analysis. Raw gene expression data from the Director’s Challengehuman lung adenocarcinoma samples6 were obtained (https://caintegrator.nci.nih.gov/caintegrator/). Probe intensities from the Affymetrix U133A platform usedin these studies were normalized and modelled using dChip software50 (http://www.hsph.harvard.edu/cli/complab/dchip/). Kaplan–Meier survival analyses were im-plemented after the samples were hierarchically clustered using centroid linkage,rank correlation and gene peaking time into two risk groups using the EZH2 co-expression gene signature. Survival differences between the two risk groups wereassessed using the Mantel–Haenszel log-rank test. The large area between the tworisk groups and its associated small P value from the Mantel–Haenszel log-rank testimplicate a robust survival classification model.Statistical analysis. No statistical methods were used to predetermine sample size.Except where indicated, a two-tailed Student’s t-test with equal variance was usedto compare measurements between two conditions with at least three biologicalreplicates per condition. Normal distribution was checked with the Kolmogorov–Smirnov test; data that failed the test at a 5 0.05 were considered normally dis-tributed. If the data were non-parametric, then a two-tailed Mann–Whitney U-testwas used instead of a t-test to assess the P value. Unless noted otherwise, pooled dataare represented by the mean and standard error. P values are indicated in figurelegends, and P values less than 0.05 were considered significant.Western blot. Whole-cell extracts were made in RIPA buffer (0.5% Deoxycholate,1% IGEPAL-CA630, 0.1% sodium dodecyl sulphate, 150 mM NaCl, 50 mM Tris-8.1), lysates were cleared by centrifugation, and protein concentrations were quan-tified with the Pierce BCA Protein Assay Kit (Thermo). For western blotting, 25mgof protein extract per sample was denatured with heat and reducing agents, sepa-rated on a 4–12% acrylamide gel (BioRad) and transferred to nitrocellulose (GEHealthcare). Antibodies used for western blotting were as follows: EZH2 (cloneD2C9; Cell Signaling; 1:200), Histone H3 (polyclonal; AbCAM ab1791; 1:2,000)and H3K27me3 (polyclonal; Millipore 07-449; 1:1,000), all incubated overnight at4 uC. All antibodies have detailed species validation available online from vendors.Secondary antibody, anti-rabbit-HRP (Santa Cruz sc-2313; 1:10,000), was incubatedfor 1 h at room temperature. After washing, chemiluminescence was visualized withWestern Lightning Plus-ECL (PerkinElmer) and exposure onto KODAK BioMaxXAR film.Immunoprecipitation. Cultured cells (10 3 106 per line) were collected by tryp-sinization and pelleting, followed by PBS wash and pelleting. On ice, cell pelletswere resuspended in 750ml hypotonic buffer (10 mM Tris-HCl, pH 7.4, 10 mMNaCl, 3 mM MgCl2) and incubated for 15 min. NP-40 (10%, 37.5ml) was added toeach tube followed by vortexing for 10 s and centrifugation for 10 min at 650g at4 uC. Nuclear pellets were then resuspended in RIPA buffer for 30 min on ice withvortexing, lysates were cleared by centrifugation and protein concentrations werequantified with the Pierce BCA Protein Assay Kit (Thermo). Antibodies directedagainst Flag (M2; Sigma; 1:50), BAF155 (R-18; Santa Cruz; 1:50) or ARID1a (PSG3;Santa Cruz; 1:10) were incubated with 300mg of each nuclear extract with 1:1 Pro-tein A and Protein G agarose beads (GE Healthcare) rotating at 4 uC overnight. Allantibodies had detailed species validation available online from vendors. Beadswere washed three times in 1 ml RIPA buffer with the second wash being rotated at4 uC for 30 min, then resuspended in approximately 35 ml 13 reducing buffer andboiled for 5 min before loading 10ml per lane. Proteins were separated on a 4–12%acrylamide gel (BioRad) and transferred to nitrocellulose (GE Healthcare). Anti-bodies for western blotting were as follows: Flag (M2; Sigma; 1:1,000), BAF155 (R-18; Santa Cruz; 1:1,000) and ARID1a (polyclonal; Bethyl Laboratories A310-040A;1:1,000). Secondary antibody, anti-rabbit-HRP (Santa Cruz sc-2313; 1:10,000), anti-mouse-HRP (Santa Cruz sc-2314; 1:10,000) or anti-goat-HRP (Santa Cruz sc-2020;1:10,000) were incubated for 1 h at room temperature. After washing, chemilumin-
escence was visualized with Western Lightning Plus-ECL (PerkinElmer) and expo-sure onto KODAK BioMax XAR film.Anaphase bridge analysis. To quantify anaphase bridges, cells were grown on four-well cultures slides (Lab Tek II). Adherent cells were fixed with 4% paraformalde-hyde for 20 min, washed and stained with Vectashield with DAPI (Vector Labs).Images were taken of each anaphase structure, and the number of anaphases withbridges over the total number of anaphases (between 11 and 34 total anaphases perwell of a four-well chamber slide) was recorded for each of three or more indepen-dent biological replicate experiments in a blinded fashion. Exact biological repli-cates n for Fig. 3b were as follows: PC9 vehicle 5 7, DZNep 5 4, GSK126 5 4; A549vehicle 5 3, DZNep 5 3, GSK126 5 3; H157 vehicle 5 7, DZNep 5 5, GSK126 5 3;H23 vehicle 5 6, DZNep 5 4, GSK126 5 3; Sw1573 vehicle 5 4, DZNep 5 4,GSK126 5 3; and for Extended Data Fig. 5b were H441 vehicle 5 3 DZNep 5 3;H2009 vehicle 5 3, DZNep 5 3; H522 vehicle 5 3, DZNep 5 3; and H1650vehicle 5 4, DZNep 5 4. Imaging was performed with a Nikon 90i camera with3100 objective and oil emersion and NIS-Elements software, and processed withNIS-Elements and Adobe Photoshop.Immunofluorescence. Cells were fixed in 4% paraformaldehyde and permeabilizedwith 10% Normal Donkey Serum (Jackson Immunoresearch), 0.25% Triton-X(Sigma), both in PBS. Primary antibodies, Brg1 (clone G-7, Santa Cruz) and EGFR(polyclonal; Cell Signaling 2232) were incubated overnight at 1:100 dilution in PBS,10% Normal Donkey Serum. All antibodies had detailed species validation avail-able online from vendors. Slides were washed three times and secondary antibod-ies, anti-mouse-AlexaFluor594 and anti-rabbit-AlexaFluor488 (Invitrogen) wereincubated at 1:500 for 1 h. After washing, cover slips were mounted with Vectashieldwith DAPI (Vector Labs). Imaging was performed with a Nikon 90i camera and NIS-Elements software, and processed with NIS-Elements and Adobe Photoshop. Alltreatment groups were imaged with the same exposure time and equivalent pro-cessing. Images were chosen to highlight the difference between BRG1high inter-phase cells and EGFRhigh dividing cells in EZH2i-treated PC9 cultures.Treatment and magnetic resonance imaging of endogenous mouse models.Doxycycline-inducible EGFRT790M;L858R transgenic mice12 and Lox-Stop-Lox-KrasG12D/1;p53fl/fl (KrasG12D/1;p53D/D)13,51 mice were maintained on a mixed back-ground, housed in a pathogen-free environment at the Harvard School of PublicHealth and handled in strict accordance with Good Animal Practice as defined bythe Office of Laboratory Animal Welfare. All animal work was done with Dana-Farber Cancer Institute Institutional Animal Care and Use Committee approval.Cohorts of male and female EGFRT790M;L858R;CCSP-rtTA were put on a doxycy-cline diet at 6 weeks of age to induce the expression of mutant EGFR, while maleand female KrasG12D/1;p53D/D mice received intranasal adeno-Cre between 6 and8 weeks of age. Mice were evaluated by magnetic resonance imaging 12–16 weeksafter doxycycline diet or adeno-Cre infection to document and quantify the lungcancer burden before being randomized to various treatment study cohorts. Treatedmice in all cohorts had similar initial tumour burden. Tumour-bearing mice wererandomized into cohorts treated either with vehicle (corn oil), etoposide 10 mg/kgintraperitoneally three times a week for 4 weeks, DZNep 4 mg/kg intraperitoneallytwice a week for 4 weeks or both etoposide and DZNep. The mice were imaged bymagnetic resonance imaging every 2 weeks to determine the reduction in tumourvolume during the respective treatments as described previously in a non-blindedfashion12. The tumour burden volume and quantification were reconstructed onthree-dimensional slicer software (http://www.slicer.org). Immunohistochemistrywas performed as described with anti-EZH2 (clone D2C9; Cell Signaling) or anti-pEGFR (Y1068; clone D7A5; Cell Signaling) and developed using Vectastain EliteABC kit (Vector Labs). Imaging was performed with a Nikon 90i camera and NIS-Elements software, and processed with NIS-Elements and Adobe Photoshop.Chromatin immunoprecipitation. Five million cells were fixed in 1% formalde-hyde for 10 min before addition of glycine to a concentration of 1 mM. Cells werepelleted, washed and resuspended in chromatin immunoprecipitation sonicationbuffer (1% Triton X-100, 0.1% deoxycholate, 50 mM Tris 8.1, 150 mM NaCl, 5 mMEDTA) containing protease and phosphastase inhibitors (Roche). Samples weresonicated for a total of 3 min in 30 s cycles with 1 min breaks. Sonicated sampleswere centrifuged for 15 min to clear the lysates, and resulting whole-cell extracts wereused for pull-downs. Antibodies directed against GFP (Ab-1; Neomarkers), BRG1(G-7; Santa Cruz) and Flag (M2; Sigma) were incubated with equal proportions ofwhole-cell extracts at 1:30 dilution overnight, rotating at 4 uC. Protein A and Pro-tein G agarose beads (1:1; GE Healthcare) were added and incubated for 2 h at 4 uC.Beads were then pelleted and washed with high salt wash buffer (1% Triton X-100,0.1% deoxycholate, 50 mM Tris-8.1, 500 mM NaCl, 5 mM EDTA), followed by LiClimmune complex buffer (250 mM LiCl, 0.5% IGEPAL-CA630, 0.5% deoxycholate,10 mM Tris-8.1, 1 mM EDTA) and TE (10 mM Tris-8.1, 1 mM EDTA) before sus-pension in elution buffer (1% SDS, 0.1 M NaHCO2, 0.01 mg ml21 salmon sperm DNA(GE Healthcare)). Crosslinks were reversed at 65 uC overnight, beads were pelleted,and resulting supernatant was incubated with 0.4 mg ml21 Proteinase K (Sigma) for
RESEARCH LETTER
Macmillan Publishers Limited. All rights reserved©2015

2 h at 37 uC. DNA from each sample was purified using Qiagen PCR purificationcolumns following the manufacturer’s instructions. Samples were resuspended in100ml 10 mM Tris-8.1 and 2ml were used for each Sybr green PCR reaction (AppliedBiosystems). Enrichment was calculated by average (Ct, reference – Ct, experimental) andconverted to the linear scale for each genomic region of interest. Reference sampleswere the GFP; both BRG1 and Flag samples were experimental. Statistical analyses(one-way analysis of variance) were performed on log2-transformed data for threeindependent biological replicates.
Primer sequences: b-actin: F TCGAGCCATAAAAGGCAACT R TCTCCCTCCTCCTCTTCCTC; EGFR regulatory element: F CCTTGTAGATTGGGGCTGAG R AGTTTGGGGGTGGAAGAAAG; 50kb upstream of regulatory element: FGGCTGAGACAGAGGGAACAC R CCATCTCAGCCTCCCAAGTA.
22. Medina, P. P. et al. Frequent BRG1/SMARCA4-inactivating mutations in humanlung cancer cell lines. Hum. Mutat. 29, 617–622 (2008).
23. Yamamoto, H. et al. PIK3CA mutations and copy number gains in human lungcancers. Cancer Res. 68, 6913–6921 (2008).
24. Bamford, S. et al. The COSMIC (Catalogue of Somatic Mutations in Cancer)database and website. Br. J. Cancer 91, 355–358 (2004).
25. Barretina, J. et al. The Cancer Cell Line Encyclopedia enables predictive modellingof anticancer drug sensitivity. Nature 483, 603–607 (2012).
26. Orimo, A. et al. Stromal fibroblasts present in invasive human breast carcinomaspromote tumor growth and angiogenesis through elevated SDF-1/CXCL12Secretion. Cell 121, 335–348 (2005).
27. Ramirez-Carrozzi, V. R. et al. Selective and antagonistic functions of SWI/SNF andMi-2 nucleosome remodeling complexes during an inflammatory response.Genes Dev. 20, 282–296 (2006).
28. Xi, Q., He, W., Zhang, X. H.-F., Le, H.-V. & Massague, J. Genome-wide impact of theBRG1 SWI/SNF chromatin remodeler on the transforming growth factor btranscriptional program. J. Biol. Chem. 283, 1146–1155 (2008).
29. Engelman, J. A. et al. Allelic dilution obscures detection of a biologically significantresistance mutation in EGFR-amplified lung cancer. J. Clin. Invest. 116,2695–2706 (2006).
30. Fillmore, C. M. et al. Estrogen expands breast cancer stem-like cells throughparacrine FGF/Tbx3 signaling. Proc. Natl Acad. Sci. USA 107, 21737–21742(2010).
31. Zacharek, S. J. et al. Lung stem cell self-renewal relies on bmi1-dependent controlof expression at imprinted loci. Cell Stem Cell 9, 272–281 (2010).
32. Chou, T.-C. Drug combination studies and their synergy quantification using theChou-Talalay method. Cancer Res. 70, 440–446 (2010).
33. Chou, T.-C. Theoretical basis, experimental design, and computerized simulationof synergism and antagonism in drug combination studies. Pharmacol. Rev. 58,621–681 (2006).
34. Rhodes, D. R. et al. Oncomine 3.0: genes, pathways, and networks in a collection of18,000 cancer gene expression profiles. Neoplasia 9, 166–180 (2007).
35. Beer, D. G. et al. Gene-expression profiles predict survival of patients with lungadenocarcinoma. Nature Med. 8, 816–824 (2002).
36. Garber, M. E. et al. Diversity of gene expression in adenocarcinoma of the lung.Proc. Natl Acad. Sci. USA 98, 13784–13789 (2001).
37. Gordon, G. J. et al. Translation of microarray data into clinically relevant cancerdiagnostic tests using gene expression ratios in lung cancer and mesothelioma.Cancer Res. 62, 4963–4967 (2002).
38. Landi, M. T. et al. Gene expression signature of cigarette smoking and its role inlung adenocarcinoma development and survival. PLoS ONE 3, e1651 (2008).
39. Rohrbeck, A. et al. Gene expression profiling for molecular distinction andcharacterization of laser captured primary lung cancers. J. Transl. Med. 6, 69(2008).
40. Su, A. I. et al. Molecular classification of human carcinomas by use of geneexpression signatures. Cancer Res. 61, 7388–7393 (2001).
41. Yu, K. et al. A precisely regulated gene expression cassette potently modulatesmetastasis and survival in multiple solid cancers. PLoS Genet. 4, e1000129(2008).
42. Lockwood, W. W. et al. DNA amplification is a ubiquitous mechanism of oncogeneactivation in lung and other cancers. Oncogene 27, 4615–4624 (2008).
43. Shankavaram, U. T. et al. Transcript and protein expression profiles of the NCI-60cancer cell panel: an integromic microarray study. Mol. Cancer Ther. 6, 820–832(2007).
44. Su, L.-J. et al. Selection of DDX5 as a novel internal control for Q-RT-PCR frommicroarray data using a block bootstrap re-sampling scheme. BMC Genomics 8,140 (2007).
45. Miyanaga, A. et al. Antitumor activity of histone deacetylase inhibitors in non-smallcell lung cancer cells: development of a molecular predictive model. Mol. CancerTher. 7, 1923–1930 (2008).
46. Balko, J.et al.Geneexpressionpatterns thatpredict sensitivity toepidermal growthfactor receptor tyrosine kinase inhibitors in lung cancer cell lines and human lungtumors. BMC Genomics 7, 289 (2006).
47. Irizarry, R. A. et al. Exploration, normalization, and summaries of high densityoligonucleotide array probe level data. Biostatistics 4, 249–264 (2003).
48. Smyth, G. K., Michaud, J., l. & Scott, H. S. Use of within-array replicate spots forassessing differential expression in microarray experiments. Bioinformatics 21,2067–2075 (2005).
49. Hochberg, Y. & Benjamini, Y. More powerful procedures for multiple hypothesistesting. Stat. Med. 9, 811–818 (1990).
50. Li, C. & Wong, W. H. Model-based analysis of oligonucleotide arrays: Expressionindex computation and outlier detection. Proc. Natl Acad. Sci. USA 98, 31–36(2001).
51. Curtis, S. J. et al. Primary tumor genotype is an important determinant inidentification of lung cancer propagating cells. Cell Stem Cell 7, 127–133(2010).
LETTER RESEARCH
Macmillan Publishers Limited. All rights reserved©2015

Extended Data Figure 1 | Verification of EZH2 as a potential target forNSCLC. a, Survival of patients with lung adenocarcinoma in the Director’sChallenge data set. Samples were hierarchically clustered using the primary-tumour-generated EZH2 co-expression signature (Supplementary Table 1) intotwo risk groups. The Kaplan–Meier curve for the whole data set is shown(n 5 416, P , 0.00001). b, Western blot was performed on whole-cell extracts
from indicated lines for EZH2 and its catalytic mark H3K27me3; total histoneH3 is shown as loading control. CR indicates a coding region targeting hairpin.c, RT-qPCR for average expression of EZH2 in the indicated cell lines afterplating at equal density and treating for 4 days with indicated treatments. Eachcell line is normalized to its shGFP control (n 5 2 biological replicates).
RESEARCH LETTER
Macmillan Publishers Limited. All rights reserved©2015
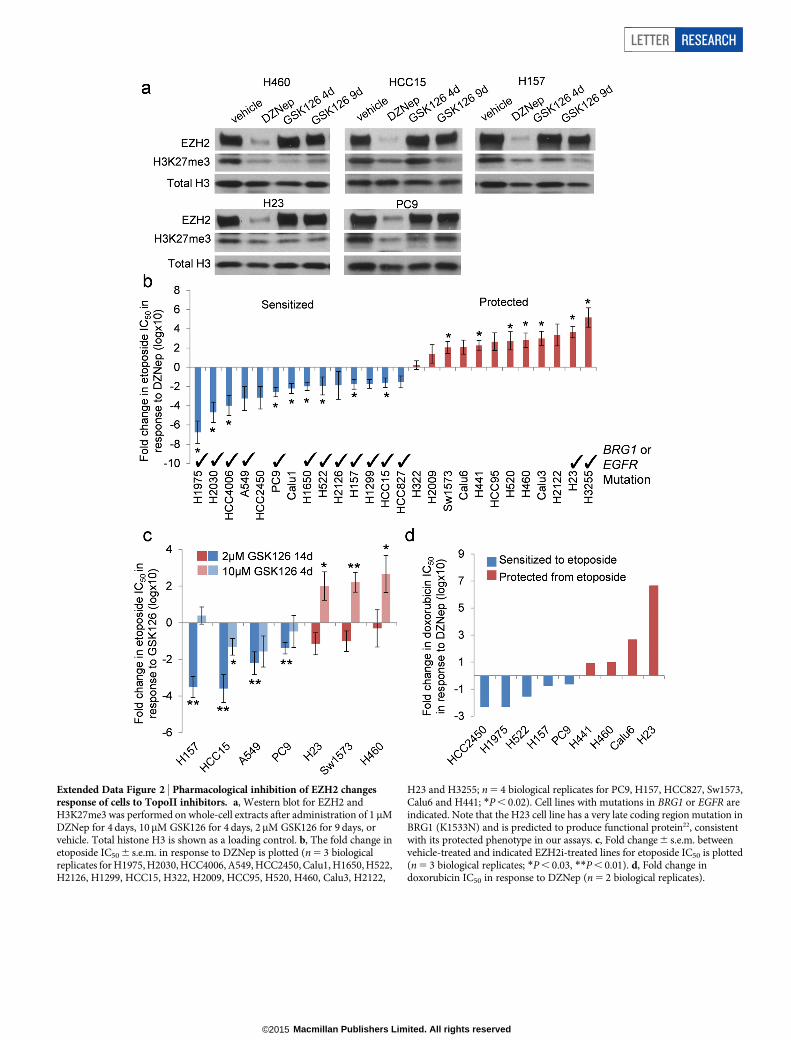
Extended Data Figure 2 | Pharmacological inhibition of EZH2 changesresponse of cells to TopoII inhibitors. a, Western blot for EZH2 andH3K27me3 was performed on whole-cell extracts after administration of 1 mMDZNep for 4 days, 10mM GSK126 for 4 days, 2mM GSK126 for 9 days, orvehicle. Total histone H3 is shown as a loading control. b, The fold change inetoposide IC50 6 s.e.m. in response to DZNep is plotted (n 5 3 biologicalreplicates for H1975, H2030, HCC4006, A549, HCC2450, Calu1, H1650, H522,H2126, H1299, HCC15, H322, H2009, HCC95, H520, H460, Calu3, H2122,
H23 and H3255; n 5 4 biological replicates for PC9, H157, HCC827, Sw1573,Calu6 and H441; *P , 0.02). Cell lines with mutations in BRG1 or EGFR areindicated. Note that the H23 cell line has a very late coding region mutation inBRG1 (K1533N) and is predicted to produce functional protein22, consistentwith its protected phenotype in our assays. c, Fold change 6 s.e.m. betweenvehicle-treated and indicated EZH2i-treated lines for etoposide IC50 is plotted(n 5 3 biological replicates; *P , 0.03, **P , 0.01). d, Fold change indoxorubicin IC50 in response to DZNep (n 5 2 biological replicates).
LETTER RESEARCH
Macmillan Publishers Limited. All rights reserved©2015

Extended Data Figure 3 | Xenograft experiments confirm sensitized andprotected phenotypes. a, Representative image of mouse injected at four sites(arrows) with H23 tumour cells 12 days after cell injection. b, Representative
images of mice injected at four sites with either H23 or H157 cells, and treatedwith indicated drugs, 35 days after cell injection. Palpable tumours that remainare indicated with arrows.
RESEARCH LETTER
Macmillan Publishers Limited. All rights reserved©2015

Extended Data Figure 4 | Autochthonous mouse models confirm genotypespecificity of dual EZH2i and TopoIIi. a, Representative images ofhaematoxylin and eosin stained lung from EGFRT790M;L858R mice treated withindicated therapies for 4 weeks. Areas with tumours of similar sizes were chosenfor comparison; scale bar, 200mm. b, Histology from KrasG12D/1/p53D/D
mouse lung tumours after 1 week of indicated treatments; top image is
haematoxylin and eosin, bottom image is EZH2 immunohistochemistry; scalebar, 100mm. c, Histology from EGFRT790M;L858R mouse lung tumours after4 weeks of indicated treatments; top image is haematoxylin and eosin, centreimage is phospho-EGFR immunohistochemistry and bottom image is EZH2immunohistochemistry; scale bar, 100mm.
LETTER RESEARCH
Macmillan Publishers Limited. All rights reserved©2015

Extended Data Figure 5 | EZH2i modulates anaphase bridgingdifferentially by genotype. a, Representative images of nuclei undergoing anormal anaphase and of nuclei that scored positively for the presence ofanaphase bridges. b, Average percentage of anaphase bridging 6 s.e.m. inadditional BRG1 WT H2009 and H441, BRG1 mutant H522, and EGFR mutant
H1650 cell lines (n 5 3 biological replicates for all except H1650 (n 5 4);*P , 0.05). c, Immunofluorescence on PC9 cultures showing increase in BRG1staining in interphase nuclei in response to EZH2i while anaphase nuclei retainstrong EGFR stain, representative of three biological replicates; scale bar,30mm.
RESEARCH LETTER
Macmillan Publishers Limited. All rights reserved©2015

Extended Data Figure 6 | Cell cycle and apoptosis analysis of dual EZH2i-and TopoIIi-treated lines. a, 7AAD cell cycle flow cytometry on culturescorresponding to each experiment shown in Fig. 3d. The average percentage
S phase 6 s.e.m. of each culture is plotted (n 5 3 biological replicates for H460,H23, Calu6, PC9, HCC15, A549 and H522; n 5 4 biological replicates forSw1573, H441 and H157).
LETTER RESEARCH
Macmillan Publishers Limited. All rights reserved©2015

Extended Data Figure 7 | EGFR and BRG1 negatively correlate in NSCLC.a, Additional NSCLC cell lines with known EGFR and BRG1 mutations used toestimate mutually exclusivity of the two mutations. b, Venn diagram ofdifferential gene expression overlap between cell lines of various genotypes.
c, Average probe intensity 6 s.e.m. of EGFR probe (201983_s_at) and EZH2probe (203358_s_at) on the U133A Affymetrix array for cell lines with variousEGFR and BRG1 mutational statuses (n 5 6 per genotype, see Methods;*P 5 0.014).
RESEARCH LETTER
Macmillan Publishers Limited. All rights reserved©2015

Extended Data Figure 8 | Modulation of EGFR and BRG1 influencessensitized and protected phenotypes. a, RT-qPCR for average expression ofBRG1, EGFR and EZH2 6 s.e.m. in the various indicated treated transducedcell lines (n 5 3 biological replicates). b, For the indicated HCC15 and H460stably transduced etoposide-treated cell lines, 7AAD flow cytometry was usedto assess average changes in percentage S phase 6 s.e.m. in response to DZNep
(n 5 3 biological replicates; *P 5 0.02, **P , 0.001). c, Average percentagesub-G1 fractions 6 s.e.m. of the indicated 4-day cultures were assessed during7AAD cell cycle flow cytometry analysis. Critically, for these assays, thesupernatant of each culture was retained and combined with the trypsinizedadherent cells to reflect the total amount of apoptosis/necrosis in each cultureaccurately (n 5 3 biological replicates; **P 5 0.03).
LETTER RESEARCH
Macmillan Publishers Limited. All rights reserved©2015

Extended Data Figure 9 | Confirmation that BRG1 re-expression leads toformation of BAF complex. a, Immunoprecipitation of BAF complexmembers from nuclear lysates of the (left) BRG1 mutant HCC15 shGFP control
cell line and (right) the HCC15 line with BRG1 re-expressed shows thatexogenously expressed Flag-tagged BRG1 does result in BRG1-containing BAFcomplex formation. The blot is representative of three biological replicates.
RESEARCH LETTER
Macmillan Publishers Limited. All rights reserved©2015
Copyright © 2022 FDOKUMEN