The Polycomb group gene Ezh2 prevents hematopoietic stem cell exhaustion
38
doi:10.1182/blood-2005-09-3585 Prepublished online November 17, 2005; Dontje and Gerald de Haan Leonie M Kamminga, Leonid V Bystrykh, Aletta de Boer, Sita Houwer, Jose Douma, Ellen Weersing, Bert Exhaustion The Polycomb Group Gene Ezh2 Prevents Hematopoietic Stem Cell (166 articles) Stem Cells in Hematology (3131 articles) Hematopoiesis and Stem Cells Articles on similar topics can be found in the following Blood collections http://bloodjournal.hematologylibrary.org/site/misc/rights.xhtml#repub_requests Information about reproducing this article in parts or in its entirety may be found online at: http://bloodjournal.hematologylibrary.org/site/misc/rights.xhtml#reprints Information about ordering reprints may be found online at: http://bloodjournal.hematologylibrary.org/site/subscriptions/index.xhtml Information about subscriptions and ASH membership may be found online at: digital object identifier (DOIs) and date of initial publication. the indexed by PubMed from initial publication. Citations to Advance online articles must include final publication). Advance online articles are citable and establish publication priority; they are appeared in the paper journal (edited, typeset versions may be posted when available prior to Advance online articles have been peer reviewed and accepted for publication but have not yet Copyright 2011 by The American Society of Hematology; all rights reserved. 20036. the American Society of Hematology, 2021 L St, NW, Suite 900, Washington DC Blood (print ISSN 0006-4971, online ISSN 1528-0020), is published weekly by For personal use only. by guest on June 5, 2013. bloodjournal.hematologylibrary.org From
Transcript of The Polycomb group gene Ezh2 prevents hematopoietic stem cell exhaustion

doi:10.1182/blood-2005-09-3585Prepublished online November 17, 2005;
Dontje and Gerald de HaanLeonie M Kamminga, Leonid V Bystrykh, Aletta de Boer, Sita Houwer, Jose Douma, Ellen Weersing, Bert ExhaustionThe Polycomb Group Gene Ezh2 Prevents Hematopoietic Stem Cell
(166 articles)Stem Cells in Hematology � (3131 articles)Hematopoiesis and Stem Cells �
Articles on similar topics can be found in the following Blood collections
http://bloodjournal.hematologylibrary.org/site/misc/rights.xhtml#repub_requestsInformation about reproducing this article in parts or in its entirety may be found online at:
http://bloodjournal.hematologylibrary.org/site/misc/rights.xhtml#reprintsInformation about ordering reprints may be found online at:
http://bloodjournal.hematologylibrary.org/site/subscriptions/index.xhtmlInformation about subscriptions and ASH membership may be found online at:
digital object identifier (DOIs) and date of initial publication. theindexed by PubMed from initial publication. Citations to Advance online articles must include
final publication). Advance online articles are citable and establish publication priority; they areappeared in the paper journal (edited, typeset versions may be posted when available prior to Advance online articles have been peer reviewed and accepted for publication but have not yet
Copyright 2011 by The American Society of Hematology; all rights reserved.20036.the American Society of Hematology, 2021 L St, NW, Suite 900, Washington DC Blood (print ISSN 0006-4971, online ISSN 1528-0020), is published weekly by
For personal use only. by guest on June 5, 2013. bloodjournal.hematologylibrary.orgFrom

1
The Polycomb Group Gene Ezh2 Prevents Hematopoietic
Stem Cell Exhaustion Leonie M. Kamminga*, Leonid V. Bystrykh, Aletta de Boer, Sita Houwer, José
Douma, Ellen Weersing, Bert Dontje, and Gerald de Haan
Department of Cell Biology, Section Stem Cell Biology, University Medical Center
Groningen, University of Groningen, Antonius Deusinglaan 1, 9713 AV Groningen,
the Netherlands
*Present address: Dept. of RNA silencing, Hubrecht Laboratory, Uppsalalaan 8, 3584
CT Utrecht, the Netherlands
Specific author contribution:
LMK: designed research, performed research, analyzed data, wrote the paper
LVB: performed research, contributed vital new analytical tools, analyzed data, wrote
the paper
AdB, SH, JD, and EW: performed research, analyzed data
BD: performed research
GdH: designed research, contributed vital new analytical tools, wrote the paper
Running head: Ezh2 prevents HSC exhaustion
Corresponding author: Gerald de Haan, A. Deusinglaan 1, 9713 AV
Groningen, Phone: +31 503632722, Fax: +31
503637477, [email protected]
The work was supported by a grant of the Dutch Organization of Scientific Research
(NWO, grant 901-08-339) and the National Institutes of Health (NIH, grant RO1
HL073710).
Blood First Edition Paper, prepublished online November 17, 2005; DOI 10.1182/blood-2005-09-3585
Copyright © 2005 American Society of Hematology
For personal use only. by guest on June 5, 2013. bloodjournal.hematologylibrary.orgFrom

2
ABSTRACT
The molecular mechanism responsible for a decline of stem cell functioning after
replicative stress remains unknown. We used mouse embryonic fibroblasts (MEFs)
and hematopoietic stem cells (HSCs) to identify genes involved in the process of
cellular aging. In proliferating and senescent MEFs one of the most differentially
expressed transcripts was Enhancer of zeste homolog 2 (Ezh2), a Polycomb group
protein (PcG) involved in histone methylation and deacetylation. Retroviral
overexpression of Ezh2 in MEFs resulted in bypassing of the senescence program.
More importantly, whereas normal HSCs were rapidly exhausted after serial
transplantations, overexpression of Ezh2 completely conserved long-term
repopulating potential. Animals that were reconstituted with three times serially
transplanted control bone marrow cells all succumbed due to hematopoietic failure. In
contrast, similarly transplanted Ezh2-overexpressing stem cells restored stem cell
quality to normal levels. In a ‘genetical genomics’ screen we identify novel putative
Ezh2 target or partner stem cell genes that are associated with chromatin modification.
Our data suggest that stabilization of the chromatin structure preserves HSC potential
after replicative stress.
For personal use only. by guest on June 5, 2013. bloodjournal.hematologylibrary.orgFrom

3
INTRODUCTION
Hematopoietic stem cell (HSC) self-renewal is driven by both intrinsic and extrinsic
factors, but the molecular mechanism specifying whether developmental potential is
lost or retained during asymmetric cell divisions is unknown. Serial transplantation
studies have clearly indicated that self-renewal potential of HSCs is impaired after
replicative stress1,2. HSC activity may be irreversibly lost in a single cell division3,4,
indicating that the epigenetic regulation of gene expression, largely dictated by the
histone code, may play an important role. Recently, substantial attention has focused
on the role of Polycomb group (PcG) proteins in stem cell self-renewal. To date, two
distinct Polycomb repressive complexes, (PRC) 1 and 2, have been identified.
Mammalian PRC1 contains Cbx, Mph, Ring, Bmi1, and Mel185 and is thought to be
important in the maintenance of gene repression. The second complex, PRC2,
contains Ezh2, Eed, and Su(z)125 and is thought to be involved in initiation of gene
repression. PcG complexes are targeted to cis-regulatory Polycomb response elements
(PREs) by DNA-binding transcription factors.
The role of only few PcG proteins in murine hematopoiesis has been established. Mel-
18 negatively regulates self-renewal of HSCs since its loss leads to an increase of
HSCs in G0, and to enhanced HSC self-renewal6. Mph1/Rae-28 mutant mice are
embryonic lethal as HSC activity in these animals is not sufficient to maintain
hematopoiesis during embryonic development7. Bmi-1-/- HSCs derived from fetal liver
were not able to contribute to long-term hematopoiesis in competitive repopulation
experiments, demonstrating cell autonomous impairment of their self-renewal
potential8. In contrast, overexpression of Bmi-1 extends replicative life span of mouse
and human fibroblasts and causes lymphomas in transgenic mice9. Heterozygosity for
a null allele of Eed caused marked myelo- and lymphoproliferative defects, indicating
a negative regulation of cell cycle activity of both lymphoid and myeloid progenitor
cells10. Eed, which is contained in the PRC2 complex, seems to have an opposite
effect on hematopoiesis than proteins that are present in PRC1.
Deficiency of Ezh2, also present in the PRC2 complex, resulted in lethality at early
stages of mouse development. Mutant blastocysts either ceased developing after
implantation or failed to complete gastrulation11. Conditional deletion of Ezh2 in
HSCs resulted in impaired T-cell generation after transplantation12. Expression levels
For personal use only. by guest on June 5, 2013. bloodjournal.hematologylibrary.orgFrom

4
of EZH2 increased with differentiation of bone marrow cells13. In contrast, EZH2 was
downregulated upon differentiation of HL-60 cells to mature granulocytes14. In
humans EZH2 is commonly upregulated in different cancer types15-20. Inhibition of
Ezh2 levels by antisense oligonucleotides or siRNA experiments lead to cell cycle
arrest14,15,21. Recently, it has been shown that EZH2 is downregulated in senescent
human fibroblasts22, implying a role for EZH2 during cellular senescence.
During development, PcG protein complexes are thought to maintain long-term and
heritable gene silencing through local alterations of the chromatin structure23.
Methylation of the N-terminal tail of histone H3 causes stable conformational changes
in chromatin that define the status of gene expression24,25. The Drosophila Enhancer
of zeste [E(z)] protein contains histone methyltransferase (HMT) activity in its SET
domain which is specific for lysines 9 and 27 of H326. It has been suggested that E(z)
plays an important role not only in the establishment of PcG-specific methylation
marks but also in their maintenance during replication, as well as after recruiting
PRC127. E(z) null Drosophila showed general decondensation of chromatin28,
reflected by increased chromosome breakage and a low mitotic index29. In
mammalian cells, histone deacetylases (HDAC) 1 and 2 are also present in the Eed-
Ezh2 complex30, suggesting that transcriptional repression of this complex is also
mediated via histone deacetylation. In addition, PcG genes are known to play an
important role in maintaining the silent state of Hox gene expression31.
Overexpression of specific Hox genes resulted in increased HSC pool size32.
Although an important function for several PcG genes in hematopoiesis has been
established, the role of Ezh2 has not yet been elucidated. In the current study, Ezh2
was identified as a senescence-preventing gene in a genetic screen using young and
senescent mouse embryonic fibroblasts. Moreover, Ezh2 was abundantly expressed in
highly purified HSCs and was rapidly downregulated upon differentiation. We
established that overexpression of Ezh2 in HSCs fully preserves stem cell potential
and prevents HSC exhaustion even after multiple rounds of serial transplantation.
Finally, we identified putative novel partner and/or target genes of Ezh2 in stem cells.
For personal use only. by guest on June 5, 2013. bloodjournal.hematologylibrary.orgFrom

5
METHODS
Animals
Timed pregnant female C57BL/6 mice were used to obtain d14 post-coitus (p.c.)
embryos from which mouse embryonic fibroblasts (MEFs) were isolated. Eight- to
twelve-week-old female B6.SJL-PtprcaPep3b/BoyJ (CD45.1) mice were used as
donors for transplantation and were bred at the Central Animal Facility of the
University of Groningen. Eight- to twelve-week-old female C57BL/6 (CD45.2) mice
were purchased from Harlan, Horst, The Netherlands and were used as recipients.
Mouse embryonic fibroblasts (MEFs)
Day-14 p.c. embryos were mechanically dissociated into single cells and cultured in
DMEM with 10% FCS and penicillin and streptomycin (Invitrogen, Breda, The
Netherlands). MEFs were passaged every three to four days and viable cells were
counted by trypan blue exclusion. Population doublings were calculated as by Todaro
and Green33.
Gene Array Analysis
Total RNA was isolated from passage 1 (young p1) and passage 5 (aged p5) MEFs
with a RNeasy mini kit (Qiagen, Venlo, The Netherlands). During cDNA synthesis,
samples were labeled with [33P]-dCTP (deoxycytidine triphosphate, MP
Biochemicals, Irvine, CA, USA). Mouse filter gene arrays (GF400a, Research
Genetics, Invitrogen, Breda, the Netherlands) were hybridized and analysis was
performed as described previously34. Expression patterns were verified by RT-PCR.
Retroviral vectors
The MIEV vector (a kind gift of Prof. Dr. C. Jordan, University of Rochester) contains
an internal ribosomal entry site (IRES) sequence and the gene for enhanced green
fluorescent protein (eGFP). This MIEV vector served as a control and backbone for
cloning of an Ezh2 cDNA upstream of the IRES, to create MIEV-Ezh2 vector (Figure
1D).
Ecotropic Phoenix packaging cells (Nolan Lab, Stanford, CA, USA) were transfected
with 2 μg plasmid DNA and Fugene 6 (Roche, Basel, Switzerland), 24 hours after
plating 3 × 10⁵ cells per well in a 6-wells plate. Virus-containing supernatants from
For personal use only. by guest on June 5, 2013. bloodjournal.hematologylibrary.orgFrom

6
transfected ecotropic Phoenix packaging cells were used to infect MEFs and
hemtatopoietic stem cells (HSCs).
Retroviral overexpression of Ezh2 in MEFs
MEFs were plated at a density of 105 cells per well in a 6-wells plate 24 hours prior to
transduction. Viral supernatant was harvested 48 and 72 hours after transfection and
added to the MEFs with addition of 8 μg polybrene (Sigma, St. Louis, MO, USA).
Three days later GFP+ cells were selected using a MoFlo flow cytometer
(DakoCytomation, Fort Collins, CO). The experiment was performed three times in
triplicate.
Retroviral overexpression of Ezh2 in hematopoietic stem cells
Primary bone marrow cells were transduced as previously described with some
adjustments35. Shortly, bone marrow cells were extracted from mice (CD45.1)
injected i.p. with 150 mg/kg 5-fluorouracil (5-FU, Pharmachemie Haarlem, The
Netherlands) 4 days earlier. Cells were cultured for 48 hours in StemSpan (Stem Cell
Technologies, Vancouver, BC, Canada) supplemented with 10% FCS, 300 ng/ml
PEG-rrSCF (Amgen, Thousand Oaks, CA, USA), 20 ng/ml rmIL-11 (R&D Systems,
Minneapolis, MN, USA), 10 ng/ml Flt3ligand (Amgen), penicillin, and streptomycin.
Viral supernatant was harvested 24 and 48 hours after transfection of ecotrophic
Phoenix cells and inoculated in 6-wells plates that were coated with 50 μg retronectin
(Takara, Kyoto, Japan). Plates containing the viral supernatant were spun for 1h at
2200 rpm at room temperature. Four hours later viral supernatant was removed, and
7.5 × 10⁵ cultured BM cells were inoculated per well together with 4 μg polybrene
(Sigma). At the second transduction 2 μg polybrene was added. Four days later
transduction efficiency was determined by flow cytometry (FACSCalibur, Becton
Dickinson, Palo Alto, CA).
Transplantation
After transduction, 3 × 10⁶ CD45.1 BM cells were transplanted in lethally irradiated
(9.5Gy, IBL 637 Cesium-137 γ source, CIS Biointernational, Gif-sur-Yvette, France)
recipients (CD45.2). GFP+ cells were not selected after the transduction protocol, so
transplants consisted of a mixture of transduced and non-transduced cells. At several
time points after transplantation blood was drawn from the retro-orbital plexus, white
For personal use only. by guest on June 5, 2013. bloodjournal.hematologylibrary.orgFrom

7
blood cell numbers were counted using a Coulter Counter (Beckman Coulter,
Fullerton, CA, USA). The percentage GFP+CD45.1+ leukocytes was assessed by flow
cytometry (FACSCalibur, Becton Dickinson). Two independent experiments were
carried out. The total number of primary recipients was 11 in control and 11 for Ezh2.
Serial transplantation
Four months after primary transplantation, recipients of the control and Ezh2 group
were sacrificed and BM cells were isolated by flushing two hind legs. Unfractionated
BM cells were transplanted in lethally irradiated (9.5 Gy) secondary recipients
(CD45.2) in limiting dilution with 106 freshly isolated C57BL/6 competitor BM cells
(CD45.2). Reconstitution by the transduced HSCs was assessed for each recipient 3
months after serial transplantation by analysis of peripheral blood cell chimerism.
Animals showing > 1% GFP+ engraftment in myeloid and lymphoid lineages, were
considered to be reconstituted by the transduced HSCs. Competitive repopulating
index (CRI) and the frequency of long-term repopulating cells present in primary
recipients (LTRA) were calculated. The formula to calculated the CRI was: CRI =
[(% CD45.1+GFP+ cells / % CD45.1+GFP- cells)/(ratio of CD45.1+GFP+/
CD45.1+GFP- cells transplanted)]. The entire experiment was repeated twice. In total
35 secondary recipients were transplanted with Ezh2-overexpressing cells, and 35
recipients with control cells. In addition, a secondary transplantation without co-
transplantation of competitors was performed. A total of 2 × 10⁶ BM cells were
transplanted in 10 lethally irradiated (9.5 Gy) recipients.
Four months after secondary transplantation, a tertiary transplantation was performed,
identical to the secondary transplantation. For both control and Ezh2-overexpressing
cells, a total of 28 recipients was used for competitive repopulation assays and 12
animals received transplantation without additional support of competitor BM cells.
Sorting hematopoietic cell populations
Different populations of hematopoietic cells were sorted using flow cytometry as
described before34. The four different populations (Lin-Sca-1-c-kit-, Lin-Sca-1+c-kit-,
Lin-Sca-1-c-kit+, Lin-Sca-1+c-kit+) were directly sorted in RNA lysis buffer of the
RNeasy mini kit (Qiagen), using a MoFlo flow cytometer (DakoCytomation) for gene
expression analysis. In additon, Lin-Sca-1+c-kit+ cells were sorted for further
culturing.
For personal use only. by guest on June 5, 2013. bloodjournal.hematologylibrary.orgFrom

8
To assess clonogenic activity in purified stem cell fractions after primary
transplantation, the cobblestone area-forming cell (CAFC) assay was performed as
described previously36. Early appearing CAFC day-7 correspond to relatively
committed progenitor cells, whereas late appearing CAFC day-35 reflect more
primitive cell subsets.
In vitro differentiation of purified HSCs
Purified Lin-Sca-1+c-kit+ (LSK) cells were cultured in IMDM (Invitrogen, Breda, the
Netherlands) containing 100 ng/ml pegylated-rrSCF (Amgen) and 10 ng/ml GM-CSF
(Behringwerke, Marburg, Germany) to stimulate rapid in vitro differentiation. Total
cell number was assessed using trypan blue exclusion. At different time points during
culturing RNA was isolated for gene expression analysis.
Western blotting
Cells were resuspended in PBS, lysed by addition of SDS-PAGE sample buffer and
sonicated. Proteins were separated by 10% SDS-PAGE and transferred to
nitrocellulose. After blocking in 3% skim milk, membranes were probed with a 1:100
dilution of mouse anti-Ezh2 mAb (M18EZH2, kindly provided by Prof. Dr. A.P. Otte,
Swammerdam Institute for Life Science, University of Amsterdam37,38), washed and
incubated with anti-mouse horseradish peroxidase-conjugated secondary antibody
(Amersham Biosciences, Buckinghamshire, UK). Membranes were developed using
ECL reagents (Amersham Biosciences). Equal loading of membranes was verified
with rabbit anti-γ-tubulin (Sigma).
Quantitative PCR
Total RNA was isolated using the RNeasy Mini kit (Qiagen) and standard cDNA
synthesis was performed. Quantitative PCRs were performed in triplicate. PCR
amplification, using SYBR Green, was performed in 96-well microtiter plates in an
iCycler thermal cycler (Bio-rad, Hercules, CA, USA). Sample cDNAs were compared
with expression of housekeeping genes Gapdh and Actin using the relative
quantification ΔΔCT technique39. Relative expression levels in the different LSK
populations were estimated by first calculating the number of molecules formed at
reaching the CT. By correcting this value for the initial number of cells used, relative
expression was determined.
For personal use only. by guest on June 5, 2013. bloodjournal.hematologylibrary.orgFrom

9
Search for putative targets or partners of Ezh2
In order to find putative targets or partners of Ezh2, the on-line available stem cell
database was used (www.genenetwork.org). We have recently described the
establishment of this database40. The GNF Hematopoietic Cells U74Av2 (Mar04)
RMA database was chosen and information on Ezh2 expression levels in different
BXD strains was retrieved. Subsequently, linkage analysis as implemented in
www.genenetwork.org was performed to determine by which locus differences in
expression levels of Ezh2 were regulated. Furthermore, it is feasible to identify which
stem cell transcripts show similar or opposite expression profiles as Ezh2 across the
30 BXD strains. These transcripts are potential partners or targets of Ezh2. The top-
100 best correlating transcripts were selected and imported in WebGestalt
(http://genereg.ornl.gov/webgestalt/, a web-based Gene Set Analysis Toolkit
implemented in www.genenetwork.org).
Statistical analysis
Statistical differences between means were assessed using the two-tailed t-test
assuming unequal variances and ANOVA with two factors. Kaplan-Meier survival
analysis was performed of mice that received a tertiary transplantation of control or
Ezh2 transduced HSCs. Differences in survival were tested for significance using a
log-rank test. Statistical analysis was performed using the SPSS statistical package.
For personal use only. by guest on June 5, 2013. bloodjournal.hematologylibrary.orgFrom

10
RESULTS
Ezh2 and cellular senescence in mouse embryonic fibroblasts
An established in vitro model to study cellular senescence involves the serial
passaging of mouse embryonic fibroblasts (MEFs)41. MEFs were cultured from 14-
day-old C57BL/6 embryos. As expected, MEFs were able to undergo a limited
number (eight) of population doublings before they senesced (Figure 1A). To screen
for genes that were differently expressed in young versus senescent MEFs,
expression-profiling experiments were conducted. One of the most differentially
expressed transcripts was Enhancer of zeste homolog 2 (Ezh2) (see Supplementary
Table 1 for all differentially expressed genes). Differences in expression levels of
Ezh2 in young and senescent MEFs were confirmed by RT-PCR (Figure 1B). Protein
levels of Ezh2 in MEFs correlated with RNA levels; Ezh2 was more abundant at early
passage (p1) compared to senescent MEFs (p9) (Figure 1C). We next established the
growth kinetics of MEFs in which Ezh2 was ectopically overexpressed using
retroviral transductions. The retroviral vectors used to induce overexpression of Ezh2
are schematically shown in figure 1D. As control we used a vector that only expresses
eGFP (MIEV). The MIEV-Ezh2 vector (Ezh2) contains Ezh2 and eGFP sequences,
separated by an IRES. Western blotting failed to detect expression of Ezh2 in MEFs
transduced with the control vector, whereas protein levels were clearly increased in
cells transduced with the Ezh2 vector (Figure 1E). At different passages after
retroviral transduction expression levels of Ezh2 were assessed by qPCR (Figure 1F).
We confirmed that Ezh2 was readily overexpressed in MEFs transduced with the Ezh2
vector relative to cells transduced with the control vector. Levels of overexpression
gradually increased from 40-fold to 70-fold at different time points after transduction.
MEFs transduced with the control vector senesced rapidly after transduction (Figure
1G). In contrast, MEFs in which Ezh2 was overexpressed were able to escape
senescence and showed continuous growth several passages after transduction (Figure
1G).
For personal use only. by guest on June 5, 2013. bloodjournal.hematologylibrary.orgFrom

11
Ezh2 expresssion in hematopoietic stem cells
Different members of the PcG gene family have recently been implicated to play a
role in hematopoietic stem cell self-renewal6-8. In contrast, the potential function of
Ezh2 in long-term repopulating HSCs has not been investigated. To quantify Ezh2
expression in different hematopoietic cell populations, bone marrow (BM) cells were
isolated and stained with a cocktail of lineage (Lin) specific antibodies and for the
stem cell markers Sca-1 and c-kit. The 5% most lineage negative fraction (Figure 2A)
was further subfractionated in four different populations based on Sca-1 and c-kit
expression (Figure 2B), and levels of Ezh2 were determined for all four fractions by
qPCR (Figure 2C). In two separate experiments, highest expression levels were found
in the Lin-Sca-1-c-kit+ population, which is known to be enriched for progenitors42.
The Lin-Sca-1+c-kit+ (LSK) population is highly enriched for the most primitive
hematopoietic stem cells43-46.
Next, LSK cells were purified and differentiation was induced by culture in the
presence of GM-CSF and SCF. As expected, LSK cells showed rapid growth during
the first few days in culture and stopped proliferating at day 7 (Figure 2D) with
accompanying changes in morphology (data not shown). At several time points after
initiation of differentiation the relative expression of Ezh2 was assessed by qPCR.
Ezh2 expression was rapidly downregulated upon differentiation (Figure 2E).
Overexpression of Ezh2 in HSCs
Primary transplantation
As Ezh2 was expressed in freshly isolated HSCs, but downregulated during
differentiation-inducing cultures, we wished to assess the functional consequences of
enforced overexpression of Ezh2 in HSCs. Post 5-FU BM cells (CD45.1) were
transduced with the control or Ezh2 vector and 3 × 10⁶ cells were transplanted without
sorting for GFP+ cells, in lethally irradiated CD45.2 recipients. In this way, the
relative contribution of Ezh2-overexpressing (CD45.1+GFP+) stem cells compared to
identically treated, but non-transduced stem cells (CD45.1+GFP-) could be
determined. Shortly after transplant peripheral white blood cell counts were somewhat
higher (p = .15) in mice transplanted with Ezh2 BM cells, but returned to normal
For personal use only. by guest on June 5, 2013. bloodjournal.hematologylibrary.orgFrom

12
levels and remained similar to control values as from 100 days after transplant (Figure
3A). After transplantation, chimerism was assessed by quantifying the percentage of
GFP+ cells within the donor CD45.1+ cell fraction (Figure 3B). No significant
skewing in contribution of transduced (CD45.1+GFP+) cells was observed.
Secondary transplantation
Primary recipients were sacrificed four months after transplant (at a time point when
no skewing of CD45.1+GFP+ contribution was observed). At this time point protein
levels of Ezh2 were analyzed in the spleen. As expected, Ezh2 was present at a higher
level in mice transplanted with Ezh2-overexpressing cells compared to control (Figure
3C). LSK GFP+ cells were isolated from primary recipients and assayed for
cobblestone area-forming cell (CAFC) activity. Overexpression of Ezh2 resulted in a
marked increase in CAFC day 7 and 14 frequencies, and a more subtle effect for later
appearing subsets (Figure 3D).
Secondary recipients were transplanted with harvested donor BM cells alone, or in
competitive repopulation with different ratios of freshly isolated CD45.2+ BM cells.
At multiple time points after transplant the recipients were analyzed for presence of
CD45.1+GFP+ cells. In the two independent experiments serially passaged retrovirally
transduced control cells (CD45.1+GFP+) showed little to no contribution to the
peripheral blood in these secondary recipients, whereas Ezh2-overexpressing stem
cells contributed to significant higher (p < .001) levels (Figure 3E). The competitive
repopulation index (CRI), comparing stem cell activity of transduced cells
(CD45.1+GFP+) with non-transduced cells (CD45.1+GFP-), was calculated three
months after secondary transplantation. The CRI is a measurement of the quality of
reconstitution of the transplanted cells, where a CRI of 1 by definition indicates equal
stem cell potential of the two populations. The CRI was ~12-fold higher (p < .02) in
Ezh2-overexpressing stem cells, when these were compared with serially passaged,
but non-transduced (CD45.1+GFP-) cells (Figure 3F). The CRI was also calculated for
transduced cells (CD45.1+GFP+) compared to freshly isolated CD45.2+ BM cells
(Figure 3G). A 10-fold decrease of stem cell quality (i.e. a CRI of 0.1) can usually be
expected after a single serial transplantation1 and was indeed observed for control
cells. Strikingly, overexpression of Ezh2 in HSCs completely prevented loss of stem
For personal use only. by guest on June 5, 2013. bloodjournal.hematologylibrary.orgFrom

13
cell quality after serial transplantation, as the CRI levels were maintained at a value of
1 (Figure 3G). CRI measurements do not necessarily correlate with actual stem cell
frequency. To quantify stem cell numbers, we used limiting dilution analysis of
chimerism data of all secondary recipients. Animals that showed >1% donor cell
contribution in both myeloid and lymphoid compartments were considered engrafted.
The BM of secondary recipients transplanted with Ezh2-overexpressing stem cells
contained an 8 to 14-fold higher number of stem cells with long-term repopulating
ability, showing that overexpression of Ezh2 results in an increase of the stem cell
pool (Figure 3H).
Tertiary transplantation
Four months after secondary transplantation, recipients were sacrificed and BM cells
were once more serially transplanted in a third cohort of lethally irradiated recipients
with addition of different ratios of freshly isolated CD45.2+ competitor BM cells.
Figure 4A shows that virtually all myeloid cells in the peripheral blood were derived
from Ezh2-overexpressing HSCs, whereas approximately half of the lymphoid lineage
was donor-derived. Similar as primary and secondary recipients, peripheral blood cell
values were normal in tertiary recipients of Ezh2-overexpressing stem cells (data not
shown). The chimerism levels of all individual recipients of control and Ezh2-
overexpressing stem cells three months after transplantation are shown in Figure 4B.
Virtually no donor contribution was detected in recipients receiving control cells,
whereas very high chimerism levels originated from Ezh2-overexpressing stem cells.
In agreement, recipients that received serially transplanted control cells without
competitor cells all died within 40 days after transplantation, whereas Ezh2-
overexpressing stem cells provided radioprotection and long-term repopulation to
tertiary recipients (Figure 4C). Similarly as after the secondary transplantation, the
CRI was calculated for CD45.1+GFP+ cells over CD45.1+GFP- cells. Figure 4D shows
these values for both secondary and tertiary recipients, and documents that stem cells
transduced with Ezh2 show a 10- and 25-fold increase in stem cell quality,
respectively. Remarkably, when the quality of stem cells that were transduced with
Ezh2 were compared with freshly isolated BM cells, no loss of stem cell quality could
be demonstrated (Figure 4E).
For personal use only. by guest on June 5, 2013. bloodjournal.hematologylibrary.orgFrom

14
Stem cell gene networks involving Ezh2
We have previously shown that different inbred strains of mice vary substantially with
respect to numerous stem cell traits, including variation in stem cell frequency47. In a
panel of 30 BXD recombinant inbred strains, offspring of DBA/2J mice (containing
high numbers of stem cells) and C57BL/6 mice (containing low numbers of stem
cells), genomic loci that contribute to these traits were mapped. We identified a
quantitative trait locus (QTL) on chromosome 18 that was associated with variation in
stem cell pool size (Figure 5A)47. Recently, we have also measured genome-wide
variation in gene expression levels in HSCs isolated from these BXD strains40. This
genetical genomic analysis has enabled us to identify clusters of genes that are
transcriptionally controlled by a common locus. These data have been made
accessible at www.genenetwork.org, an on-line genetic database that allows the query
of co-regulated transcripts for stem cell genes of interest. In the present study we
determined that Ezh2 was highly, but differentially, expressed in HSCs of the various
BXD strains (Figure 5B). Strikingly, variation in Ezh2 levels was largely accounted
for by the exact chromosome 18 locus that we had previously associated with
variation in stem cell frequency (Figure 5C). The gene encoding Ezh2 is located on
chromosome 6 in mice, so variation in Ezh2 expression is regulated in trans by an as
yet unidentified gene on chromosome 18. Further analysis showed that mice that had
inherited a C57BL/6 allele at D18Mit83 (the marker most strongly associated with
variation in Ezh2 levels) had significantly higher expression of Ezh2 (p < .003) than
mice carrying a DBA/2J allele (Figure 5D). The limited genetic resolution precludes
direct identification of the chromosome 18 gene that is responsible for the variation in
Ezh2 gene expression. However, Ezh2 co-regulated transcripts in stem cells can easily
be retrieved from www.genenetwork.org. The 100 genes of which the transcript levels
correlated best with variation in Ezh2 expression were identified. These genes were
classified according to their functional annotation using Webgestalt
(http://genereg.ornl.gov/webgestalt). We identified 3 functional categories for which
transcripts correlating with variation in Ezh2 levels were significantly enriched
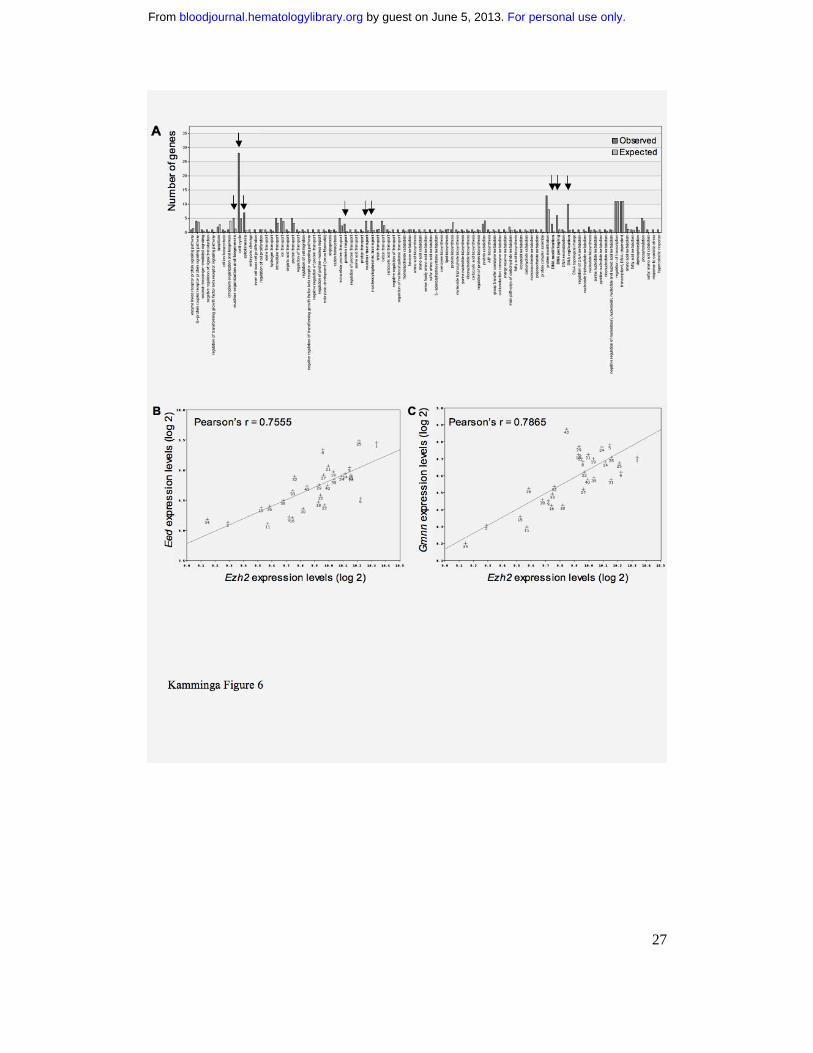
(Figure 6A). A high number of co-regulated stem cell genes was involved in DNA
modification, DNA packaging, and DNA replication (Table 1). Two other categories
For personal use only. by guest on June 5, 2013. bloodjournal.hematologylibrary.orgFrom

15
of transcripts that were significantly more often observed than expected were
associated with cell cycle/cytokinesis and, surprisingly, nucleo-cytoplasmic transport
(Table 1).
Interestingly, one of the stem cell transcripts whose levels correlated with variable
Ezh2 expression was Eed, its well-known partner (Figure 6B). Other interesting novel
putative Ezh2 partners or targets included Mcm 2, 3, and 4, Aurka and Aurkb, Gmnn
(Figure 6C), Prim1, topoisomerases, and polymerases. A substantial number of these
transcripts was also controlled by the chromosome 18 locus (Table 1).
For personal use only. by guest on June 5, 2013. bloodjournal.hematologylibrary.orgFrom

16
DISCUSSION
In this study we show that Ezh2 is downregulated upon serial passaging of MEFs, and
during differentiation of primitive, highly proliferative HSCs to committed myeloid
cells. These two complementary models suggest a general suppressive role for Ezh2
during cellular differentiation and senescence. Indeed, we show that overexpression of
Ezh2 leads to bypassing of the senescence program in MEFs. More strikingly,
enforced expression of Ezh2 in HSCs completely prevents stem cell exhaustion and
stabilizes normal stem cell functioning, even after three serial transplantations.
It has been previously shown by others and us, that exhaustion of the HSC pool is
apparent following serial transplantation2,48,49, chemotherapy50,51, and also during
normal aging 36,48. The aging of HSCs is genetically regulated, since different inbred
mouse strains show distinct patterns36,52, which are maintained when HSCs of
different mouse strains are present in the same microenvironment53,54. However, the
underlying molecular mechanism responsible for a decline of HSC functioning during
aging and serial transplant remains to be elucidated. Several groups have identified
genes that directly influence HSC self-renewal potential and their differentiation
program, such as Hoxb435, Notch155, and Bmi-18. Our present data document that
Ezh2 is able to completely preserve stem cell functioning after repeated serial
transplantation, notably without resulting in malignant transformation. Interestingly, a
recent gene profiling study in which expression patterns in young and aged HSCs
were compared, documented that Ezh2 levels decrease during normal aging56.
The natural variation in Ezh2 transcript levels that can be observed in stem cells of
recombinant inbred mouse strains (BXDs), allows two approaches40. Firstly, the
genomic locus that regulates Ezh2 expression can be mapped and secondly, co-
regulated transcripts can be identified. Using the first approach we show that variation
in expression of Ezh2 is regulated by a locus on chromosome 18. Strikingly, exactly
the same locus is also associated with HSC frequency47. As many transcripts are
located in the critical interval, the Ezh2 regulating gene on chromosome 18 remains
unknown at present. Using the second approach, genetic networks associated with
variation in Ezh2 expression can be elucidated. We found that Eed expression levels
were positively correlated with Ezh2 gene expression. As Eed is a well-known partner
of Ezh2 31, this finding proves the potential power of this approach. Furthermore,
For personal use only. by guest on June 5, 2013. bloodjournal.hematologylibrary.orgFrom

17
expression levels of Gmnn, a DNA replication inhibitor with which PRC1 members
are associated57, were also positively correlated with Ezh2 expression. We identified
many Ezh2 co-regulated stem cell genes that qualify as chromatin remodeling factors
and DNA binding proteins. Interestingly, the interval on chromosome 18 that was
associated with variation in Ezh2 expression levels also regulated the expression
levels of 12 out of 42 co-regulated genes. As this locus is involved in regulating HSC
pool size47, this strongly suggests that chromatin remodeling gene networks affecting
epigenetic transcription programs are critically involved in stem cell self-renewal.
Ezh2 can act as a transcriptional repressor as a result of its HMTase activity, which
ultimately results in DNA condensation and a more compact chromatin structure.
Overexpression of Ezh2 is therefore expected to change global chromatin structure
and consequently alter gene expression profiles. Moreover, as methylation is
considered to be relatively irreversible, these epigenetic changes of gene expression
are stable. In stem cell homeostasis a delicate balance exists between self-renewal and
terminal differentiation. It is likely that during replicative stress (resulting from serial
transplantation, but also from normal aging) this balance weighs in favor of terminal
differentiation, resulting in exhaustion of the HSC pool. Emerging evidence suggests
that this balance is partly regulated by the histone code, which specifies gene
transcription and provides cellular memory. It has been suggested that during normal
aging methylation patterns are less strictly maintained, resulting in loss of
heterochromatin and deregulated gene transcription58. It is becoming evident that PcG
genes play an important role here, since aberrant expression of different PcG genes
has been shown to change the program of stem cell self-renewal.
In this study we show that stem cell exhaustion is readily induced, but can be
prevented in HSCs by overexpressing Ezh2. This data suggests that after replicative
stress of HSCs chromatin alterations occur, which impede stem cell functioning. In
contrast, in HSCs that overexpress Ezh2 the chromatin structure is stabilized, which
provides maintenance of HSC quality. Chemical modifiers of higher order chromatin
structure may have a functional role in clinical ex vivo stem cell expansion protocols.
For personal use only. by guest on June 5, 2013. bloodjournal.hematologylibrary.orgFrom

18
ACKNOWLEDGMENTS
The authors would like to thank G. Harms and A. van den Berg for their assistance
with the mouse filter gene arrays; C. Jordan for providing us with the MIEV vector; A.
Otte for providing us with the Ezh2 antibody; G. Mesander and H. Moes for flow
cytometry support; R. van Os for critically reading the manuscript and for advise on
CRI calculations.
For personal use only. by guest on June 5, 2013. bloodjournal.hematologylibrary.orgFrom

19
FIGURE LEGENDS
Figure 1. Expression of Ezh2 in MEFs. A. At first MEFs showed rapid proliferation,
but senesced after eight population doublings. B. RT-PCR analysis of young (p1) and
aged (p5) MEFs. C. Protein levels of Ezh2 in untreated MEFs at passage 1 and 9. D.
Schematic representation of retroviral vectors used to overexpress Ezh2. E. Detection
of Ezh2 protein in MEFs transduced with control and Ezh2 vector at different
passages after transduction. F. Relative expression of Ezh2 mRNA in MEFs
transduced with the control vector (black bars) or with the vector containing Ezh2
(grey bars) at different passages after transduction. Expression levels of Ezh2 were
determined by qPCR and calculated relative to MEFs transduced with control at
passage 1 after transduction. G. Growth of MEFs after retroviral transduction
(control, black squares; Ezh2, grey circles).
Figure 2. Expression of Ezh2 in hematopoietic cells. A. To isolate the different
Lineage- (Lin-) populations from BM, the 5% most Lin- cells were selected. B. Cells
in the Lin- population were sorted based on Sca-1 and c-kit surface markers. C.
Expression of Ezh2 as measured by qPCR in the different Sca-1 and c-kit populations
relative to Sca-1-c-kit- BM cells. D. Growth of Lin-Sca-1+c-kit+ cells cultured in the
presence of GM-CSF and SCF. E. Relative expression of Ezh2 was monitored by
qPCR at different time points after initiation of differentiation with GM-CSF and
SCF. Day 0 was set at 1. Insert shows gel analysis of amplified RT-PCR products.
Figure 3. Overexpression of Ezh2 in HSCs. A. White blood cell (WBC) counts of
mice transplanted with BM cells transduced with control (black squares) or Ezh2
(grey circles) vectors (n=11 recipients per group, two independent experiments).
Mean values ± 1 SEM are shown. B. Chimerism at different time points after
transplantation. The percentage of donor-derived transduced CD45.1+GFP+ white
blood cells is shown. Average values ± 1 SEM of two independent experiments are
shown. C. Ezh2 protein expression in the spleen ~120 days after primary
tranplantation of control or Ezh2 CD45.1 BM cells. D. CAFC frequencies of sorted
LSK GFP+ cells 120 days after primary transplantation (control, black bars; Ezh2,
grey bars). E. Chimerism levels of recipients, competitively transplanted with various
For personal use only. by guest on June 5, 2013. bloodjournal.hematologylibrary.orgFrom

20
ratios (2:1, diamonds; 1:1 circles; 1:2, squares; 1:5, triangles) of transduced/non-
transduced and freshly isolated BM cells, analyzed three months after transplantation.
Values show data from individual recipients in two independent experiments (n = 35
per group). F. Competitive repopulation index (CRI) calculated for CD45.1+GFP+
(transduced) versus CD45.1+GFP- (non-transduced) cells (see insert). Values (+ 1
SEM) are averages three months after secondary transplantation, based on 11 and 24
individual mice in the first and second experiment respectively (control, black bars;
Ezh2, grey bars). G. CRI calculated for transduced cells (CD45.1+GFP+) compared to
freshly isolated BM cells (CD45.2+) (see insert). Averages values (+ 1 SEM) of 11
and 24 individual mice of the first and second experiment respectively are shown
(control, black bars; Ezh2, grey bars). H. LTRA frequencies in CD45.1+GFP+
(transduced) cell fractions calculated from limiting dilution analyses three months
after secondary transplantation in two independent experiments (control, black bars;
Ezh2, grey bars).
Figure 4. Effects of overexpression of Ezh2 in HSCs in tertiary recipients. A.
Representative FACS plot showing donor contribution in a recipient transplanted with
2.5 × 10⁶ twice serially transplanted Ezh2-overexpressing cells in competition with 5
× 105 freshly isolated CD45.2+ BM cells. Left panel shows contribution when gated
on myeloid cells, right panel shows donor contribution for lymphoid cells. B. The
percentage of CD45.1+GFP+ cells in the peripheral blood in all recipients (n = 28)
three months after tertiary transplantation. Cells were co-transplanted in different
ratios (5:1, triangles; 2:1, diamonds; 1:1, circles) with freshly isolated BM cells. C.
Survival curve of tertiary recipients that were transplanted with serially transplanted
BM cells without co-transplantation of freshly isolated BM cells (control, black
squares; Ezh2, grey circles). D. CRI comparing transduced CD45.1+GFP+ stem cells
versus non-transduced CD45.1+GFP- stem cells in primary, secondary, and tertiary
recipients (control, black squares; Ezh2, grey circles). E. CRI comparing transduced
CD45.1+GFP+ stem cells with freshly isolated BM cells after one, two, and three serial
transplantations (control, black squares; Ezh2, grey circles).
For personal use only. by guest on June 5, 2013. bloodjournal.hematologylibrary.orgFrom

21
Figure 5. Variation in CAFC d35 frequency and Ezh2 expression levels in BXD
strains. A. Variation in HSC frequency (CAFC d35/105 BM cells) in BXD
recombinant inbred mice is associated with a quantitative trait locus (QTL) mapping
to chromosome 18. Data can be retrieved from www.genenetwork.org40,47. B. Ezh2
transcript levels were measured in LSK cells isolated from the BM of 30 BXD strains,
using Affymetrix gene chips. C. Variation in Ezh2 expression in LSK cells isolated
from BXD mice is regulated by a QTL mapping to chromosome 18. D. Average Ezh2
expression levels (+ 1 SEM) in BXD recombinant inbred mice segregated according
to the presence of the B6 (black bar) or D2 (grey bar) allele for marker D18Mit83.
Figure 6. Putative new stem cell targets or partners of Ezh2. A. The top-100 stem
cell genes whose expression correlated with Ezh2 expression in BXD mice were
classified according to function by webGestalt (http://genereg.ornl.gov/webgestalt/).
Light gray bars show the expected number of genes with a certain function to be
found if 100 transcripts were randomly selected, dark gray bars depict the actually
retrieved numbers. Detailed information on genes present in the three significantly (p
< .01) enriched clusters (arrows) is provided in Table 1. B. Correlation of relative
expression of Ezh2 and Eed in the 30 BXD strains. Each data point in the figure refers
to an individual BXD strain C. Correlation of relative expression of Ezh2 and
Geminin (Gmnn) in the 30 BXD strains. Each data point in the figure refers to an
individual BXD strain.
For personal use only. by guest on June 5, 2013. bloodjournal.hematologylibrary.orgFrom

22
For personal use only. by guest on June 5, 2013. bloodjournal.hematologylibrary.orgFrom

23
For personal use only. by guest on June 5, 2013. bloodjournal.hematologylibrary.orgFrom

24
For personal use only. by guest on June 5, 2013. bloodjournal.hematologylibrary.orgFrom

25
For personal use only. by guest on June 5, 2013. bloodjournal.hematologylibrary.orgFrom

26
For personal use only. by guest on June 5, 2013. bloodjournal.hematologylibrary.orgFrom
27
For personal use only. by guest on June 5, 2013. bloodjournal.hematologylibrary.orgFrom

28
References
(1) Harrison DE, Astle CM. Loss of stem cell repopulating ability upon
transplantation. Effects of donor age, cell number, and transplantation
procedure. J Exp Med. 1982;156:1767-1779.
(2) Mauch P, Hellman S. Loss of hematopoietic stem cell self-renewal after bone
marrow transplantation. Blood. 1989;74:872-875.
(3) Nakauchi H, Sudo K, Ema H. Quantitative assessment of the stem cell self-
renewal capacity. Ann N Y Acad Sci. 2001;938:18-24.
(4) Takano H, Ema H, Sudo K, Nakauchi H. Asymmetric division and lineage
commitment at the level of hematopoietic stem cells: inference from
differentiation in daughter cell and granddaughter cell pairs. J Exp Med.
2004;199:295-302.
(5) Lund AH, van Lohuizen M. Polycomb complexes and silencing mechanisms.
Curr Opin Cell Biol. 2004;16:239-246.
(6) Kajiume T, Ninomiya Y, Ishihara H, Kanno R, Kanno M. Polycomb group
gene mel-18 modulates the self-renewal activity and cell cycle status of
hematopoietic stem cells. Exp Hematol. 2004;32:571-578.
(7) Ohta H, Sawada A, Kim JY et al. Polycomb group gene rae28 is required for
sustaining activity of hematopoietic stem cells. J Exp Med. 2002;195:759-770.
(8) Park IK, Qian D, Kiel M et al. Bmi-1 is required for maintenance of adult self-
renewing haematopoietic stem cells. Nature. 2003;423:302-305.
For personal use only. by guest on June 5, 2013. bloodjournal.hematologylibrary.orgFrom

29
(9) Jacobs JJ, Kieboom K, Marino S, DePinho RA, van Lohuizen M. The
oncogene and Polycomb-group gene bmi-1 regulates cell proliferation and
senescence through the ink4a locus. Nature. 1999;397:164-168.
(10) Lessard J, Schumacher A, Thorsteinsdottir U et al. Functional antagonism of
the Polycomb-Group genes eed and Bmi1 in hemopoietic cell proliferation.
Genes Dev. 1999;13:2691-2703.
(11) O'Carroll D, Erhardt S, Pagani M et al. The polycomb-group gene Ezh2 is
required for early mouse development. Mol Cell Biol. 2001;21:4330-4336.
(12) Su IH, Dobenecker MW, Dickinson E et al. Polycomb group protein ezh2
controls actin polymerization and cell signaling. Cell. 2005;121:425-436.
(13) Lessard J, Baban S, Sauvageau G. Stage-specific expression of polycomb
group genes in human bone marrow cells. Blood. 1998;91:1216-1224.
(14) Fukuyama T, Otsuka T, Shigematsu H et al. Proliferative involvement of
ENX-1, a putative human polycomb group gene, in haematopoietic cells. Br J
Haematol. 2000;108:842-847.
(15) Varambally S, Dhanasekaran SM, Zhou M et al. The polycomb group protein
EZH2 is involved in progression of prostate cancer. Nature. 2002;419:624-
629.
(16) Kleer C, Cao Q, Varambally S et al. EZH2 is a marker of aggressive breast
cancer and promotes neoplastic transformation of breast epithelial cells.
Proceedings-of-the-National-Academy-of-Sciences-of-the-United-States-of-
America. 2003;100:11606-11611.
(17) Visser HP, Gunster MJ, Kluin-Nelemans HC et al. The Polycomb group
protein EZH2 is upregulated in proliferating, cultured human mantle cell
lymphoma. Br J Haematol. 2001;112:950-958.
For personal use only. by guest on June 5, 2013. bloodjournal.hematologylibrary.orgFrom

30
(18) Raaphorst FM, van Kemenade FJ, Blokzijl T et al. Coexpression of BMI-1 and
EZH2 polycomb group genes in Reed-Sternberg cells of Hodgkin's disease.
Am J Pathol. 2000;157:709-715.
(19) van Kemenade FJ, Raaphorst FM, Blokzijl T et al. Coexpression of BMI-1 and
EZH2 polycomb-group proteins is associated with cycling cells and degree of
malignancy in B-cell non-Hodgkin lymphoma. Blood. 2001;97:3896-3901.
(20) Rhodes DR, Yu J, Shanker K et al. Large-scale meta-analysis of cancer
microarray data identifies common transcriptional profiles of neoplastic
transformation and progression. Proc Natl Acad Sci U S A. 2004;101:9309-
9314.
(21) Jacobs JJ, van Lohuizen M. Polycomb repression: from cellular memory to
cellular proliferation and cancer. Biochim Biophys Acta. 2002;1602:151-161.
(22) Tang X, Milyavsky M, Shats I et al. Activated p53 suppresses the histone
methyltransferase EZH2 gene. Oncogene. 2004;23:5759-5769.
(23) Pirrotta V. Chromatin complexes regulating gene expression in Drosophila.
Curr Opin Genet Dev. 1995;5:466-472.
(24) Strahl BD, Allis CD. The language of covalent histone modifications. Nature.
2000;403:41-45.
(25) Kouzarides T. Histone methylation in transcriptional control. Curr Opin Genet
Dev. 2002;12:198-209.
(26) Cao R, Wang L, Wang H et al. Role of histone H3 lysine 27 methylation in
Polycomb-group silencing. Science. 2002;298:1039-1043.
For personal use only. by guest on June 5, 2013. bloodjournal.hematologylibrary.orgFrom

31
(27) Breiling A, O'Neill LP, D'Eliseo D, Turner BM, Orlando V. Epigenome
changes in active and inactive polycomb-group-controlled regions. EMBO
Rep. 2004;5:976-982.
(28) Rastelli L, Chan CS, Pirrotta V. Related chromosome binding sites for zeste,
suppressors of zeste and Polycomb group proteins in Drosophila and their
dependence on Enhancer of zeste function. EMBO J. 1993;12:1513-1522.
(29) Gatti M, Baker BS. Genes controlling essential cell-cycle functions in
Drosophila melanogaster. Genes Dev. 1989;3:438-453.
(30) van der Vlag J, Otte AP. Transcriptional repression mediated by the human
polycomb-group protein EED involves histone deacetylation. Nat Genet.
1999;23:474-478.
(31) Cao R, Zhang Y. The functions of E(Z)/EZH2-mediated methylation of lysine
27 in histone H3. Curr Opin Genet Dev. 2004;14:155-164.
(32) Owens BM, Hawley RG. HOX and non-HOX homeobox genes in leukemic
hematopoiesis. Stem Cells. 2002;20:364-379.
(33) Todaro GJ, Green H. Quantitative studies of the growth of mouse embryo cells
in culture and their development into established lines. The Journal of Cell
Biology. 1963;17:299-313.
(34) de Haan G, Bystrykh LV, Weersing E et al. A genetic and genomic analysis
identifies a cluster of genes associated with hematopoietic cell turnover.
Blood. 2002;100:2056-2062.
(35) Sauvageau G, Thorsteinsdottir U, Eaves CJ et al. Overexpression of HOXB4
in hematopoietic cells causes the selective expansion of more primitive
populations in vitro and in vivo. Genes Dev. 1995;9:1753-1765.
For personal use only. by guest on June 5, 2013. bloodjournal.hematologylibrary.orgFrom
32
(36) de Haan G, Nijhof W, Van Zant G. Mouse strain-dependent changes in
frequency and proliferation of hematopoietic stem cells during aging:
Correlation between lifespan and cycling activity. Blood. 1997;89:1543-1550.
(37) Hamer K, Sewalt R, den Blaauwen J et al. A panel of monoclonal antibodies
against human polycomb group proteins. Hybridoma and Hybridomics.
2002;21:245-252.
(38) Sewalt RG, van der Vlag J, Gunster MJ et al. Characterization of interactions
between the mammalian polycomb-group proteins Enx1/EZH2 and EED
suggests the existence of different mammalian polycomb-group protein
complexes. Mol Cell Biol. 1998;18:3586-3595.
(39) Livak KJ, Schmittgen TD. Analysis of relative gene expression data using
real-time quantitative PCR and the 2(-Delta Delta C(T)) Method. Methods.
2001;25:402-408.
(40) Bystrykh L, Weersing E, Dontje B et al. Uncovering regulatory pathways that
affect hematopoietic stem cell function using 'genetical genomics'. Nat Genet.
2005;37:225-232.
(41) Hayflick L. The limited in vitro lifetime of human diploid cell strains. Exp
Cell Res. 1965;37:614-636.
(42) Ogawa M, Matsuzaki Y, Nishikawa S et al. Expression and function of c-kit in
hematopoietic progenitor cells. J Exp Med. 1991;174:63-71.
(43) Morrison SJ, Uchida N, Weissman IL. The biology of hematopoietic stem
cells. Annu Rev Cell Dev Biol. 1995;11:35-71.
(44) Spangrude GJ, Heimfeld S, Weissman IL. Purification and characterization of
mouse hematopoietic stem cells. Science. 1988;241:58-62.
For personal use only. by guest on June 5, 2013. bloodjournal.hematologylibrary.orgFrom

33
(45) Trevisan M, Iscove NN. Phenotypic analysis of murine long-term
hemopoietic reconstituting cells quantitated
competitively in vivo and comparison with more
advanced colony-forming progeny. J Exp Med. 1995;181:93-103.
(46) Okada S, Nakauchi H, Nagayoshi K et al. Enrichment and characterization of
murine hematopoietic stem cells
that express c-kit molecule. Blood. 1991;78:1706-1712.
(47) de Haan G, Van Zant G. Intrinsic and extrinsic control of hemopoietic stem
cell numbers: Mapping of a stem cell gene. J Exp Med. 1997;186:529-536.
(48) Kamminga LM, van Os R, Ausema A et al. Impaired hematopoietic stem cell
functioning after serial transplantation and during normal aging. Stem Cells.
2005;23:82-92.
(49) Morrison SJ, Wandycz AM, Akashi K, Globerson A, Weissman IL. The aging
of hematopoietic stem cells. Nat Med. 1996;2:1011-1016.
(50) Gardner RV, Astle CM, Harrison DE. Hematopoietic precursor cell exhaustion
is a cause of proliferative defect in primitive hematopoietic stem cells (PHSC)
after chemotherapy. Exp Hematol. 1997;25:495-501.
(51) Van Zant G, Liang Y. The role of stem cells in aging. Exp Hematol.
2003;31:659-672.
(52) Chen JC, Astle CM, Harrison DE. Genetic regulation of primitive
hematopoietic stem cell senescence. Experimental Hematology. 2000;28:442-
450.
(53) Kamminga LM, Akkerman I, Weersing E et al. Autonomous behavior of
hematopoietic stem cells. Exp Hematol. 2000;28:1451-1459.
For personal use only. by guest on June 5, 2013. bloodjournal.hematologylibrary.orgFrom

34
(54) Van Zant G, Scott-Micus K, THOMPSON BP, FLEISCHMAN RA,
PERKINS S. Stem cell quiescence/activation is reversible by serial
transplantation and is independent of stromal cell genotype in mouse
aggregation chimeras. Exp Hematol. 1992;20:470-475.
(55) Stier S, Cheng T, Dombkowski D, Carlesso N, Scadden DT. Notch1 activation
increases hematopoietic stem cell self-renewal in vivo and favors lymphoid
over myeloid lineage outcome. Blood. 2002;99:2369-2378.
(56) Rossi DJ, Bryder D, Zahn JM et al. Cell intrinsic alterations underlie
hematopoietic stem cell aging. Proc Natl Acad Sci U S A. 2005;102:9194-
9199.
(57) Luo L, Yang X, Takihara Y, Knoetgen H, Kessel M. The cell-cycle regulator
geminin inhibits Hox function through direct and polycomb-mediated
interactions. Nature. 2004;427:749-753.
(58) Villeponteau B. The heterochromatin loss model of aging. Exp Gerontol.
1997;32:383-394.
For personal use only. by guest on June 5, 2013. bloodjournal.hematologylibrary.orgFrom

35
TABLES
Table 1. Putative targets or partners of Ezh2 in HSCs.
Symbol Name
QTL
chromosome
Mb
(if on chr 18) Correlation
DNA modification, packaging, or replication
Mcm4 minichromosome maintenance deficient 4 homolog (S. cerevisiae)
14, 18 20-23 0.7545
Mcm3 minichromosome maintenance deficient 3 (S. cerevisiae)
9, 18 20-23 0.7284
Pcna proliferating cell nuclear antigen 18 20-23 0.8141 Prim1 DNA primase, p49 subunit 18 12-14, 20-25 0.7986 Hat1 histone aminotransferase 1 11 0.7973
Recc1 replication factor C 1 2 0.7911
Eed embryonic ectoderm development 18 47-50 0.7555
Pole2 polymerase (DNA directed), epsilon 2 (p59 subunit)
18 20-23 0.751
Mcm2 minichromosome maintenance deficient 2 mitotin (S. cerevisiae)
14, 18 20-23 0.739
Rrm1 ribonucleotide reductase M1 4 0.7359
Nap1l1 nucleosome assembly protein 1-like 1 18 47-50 0.7294
Rpa3 replication protein A3 18 17-20, 35-38 0.7239
H2afz H2A histone family, member Z 18 12-14 0.7115
Setdb1 SET domain, bifurcated 1 6, 17 0.7102
Ahcy S-adenosylhomocysteine hydrolase 11 0.6855
Dntt deoxynucleotidyltransferase, terminal 15 0.6851
Aurkb aurora kinase B 0.718
Nuclear organization and biogenesis, cell cycle, and cytokinesis
Top2a topoisomerase (DNA) II alpha 18 20-23 0.8733 Smc2l1 SMC2 structural maintenance of
chromosomes 2-like 1 (yeast)
0.8507
Topbp1 topoisomerase (DNA) II beta binding protein
18 20-25 0.8497
Mki67 antigen identified by monoclonal antibody Ki 67
2, 18 20-23 0.837
Tfdp1 transcription factor Dp 1 7 0.8299
Pole2 polymerase (DNA directed), epsilon 2 18 20-23 0.7986
For personal use only. by guest on June 5, 2013. bloodjournal.hematologylibrary.orgFrom

36
(p59 subunit) Ccnb2 cyclin B2 13 0.7949
Recc1 replication factor C 1 2 0.7911
Ect2 ect2 oncogene 4 0.7879
Gmnn geminin 18 14-23 0.7865 Cdca5 cell division cycle associated 5 2 0.764
Prc1 protein regulator of cytokinesis 1 5, 7 0.7584
Nusap1 nucleolar and spindle associated protein 1 14, 18 35-38, 71-73 0.7584
Mcm4 minichromosome maintenance deficient 4 homolog (S. cerevisiae)
14, 18 20-23 0.7545
Table 1, continued
Symbol Name
QTL
chromosome
Mb
(if on chr 18) Correlation
Nuclear organization and biogenesis, cell cycle, and cytokinesis
Ppp1cc protein phosphatase 1, catalytic subunit,
gamma isoform
18 50-53 0.751
Nek2 NIMA (never in mitosis gene a)-related
expressed kinase 2
7 0.751
Mad2l1 MAD2 (mitotic arrest deficient, homolog)-
like 1 (yeast)
18 12-13, 35-38 0.7428
Mcm2 minichromosome maintenance deficient 2 mitotin (S. cerevisiae)
14, 18 20-23 0.739
Rrm1 ribonucleotide reductase M1 4 0.7359
Tacc3 transforming, acidic coiled-coil containing
protein 3
18 12-14 0.7335
Prim1 DNA primase, p49 subunit 18 12-14, 20-25 0.7321 Pcna proliferating cell nuclear antigen 18 20-23 0.7321 Nap1l1 nucleosome assembly protein 1-like 1 18 47-50 0.7294
Mcm3 minichromosome maintenance deficient 3 (S. cerevisiae)
9, 18 20-23 0.7284
Rbl1 retinoblastoma-like 1 (p107) 14 0.7268
Rpa3 replication protein A3 18 17-20, 35-38 0.7239
Aurkb aurora kinase B 0.718
H2afz H2A histone family, member Z 18 12-14 0.7115
Setdb1 SET domain, bifurcated 1 6, 17 0.7102
Stk6 serine/threonine kinase 6 (Aurka) 9 0.7062
For personal use only. by guest on June 5, 2013. bloodjournal.hematologylibrary.orgFrom

37
Dntt deoxynucleotidyltransferase, terminal 15 0.6851
Cdca7 Cell division cycle associated 7 9, 18 14-23 0.6843 Cul2 cullin 2 18 50-54 0.682
Smc4l1 SMC4 structural maintenance of chromosomes 4-like 1 (yeast)
3, 18 12-14, 25-27
AA545217 expressed sequence AA545217 16
Protein import, nuclear transport, and nucleocytoplasmic transport
Kpna2 karyopherin (importin) alpha 2 18 51-53 0.78
Tacc3 transforming, acidic coiled-coil containing
protein 3 18 12-14 0.7335
Kpnb3 karyopherin (importin) beta 3 5, 8, 13 0.7277
Xpo1 exportin 1, CRM1 homolog (yeast) 14 0.7581
Ezh2 co-regulated transcripts in stem cells were retrieved from
www.genenetwork.org. The 100 genes of which the transcript levels correlated best
with variation in Ezh2 expression were identified. These genes were classified
according to their functional annotation using Webgestalt. Three functional categories
were identified. Transcripts that are regulated by the quantitative trait locus (QTL) on
chromosome 18 (20-23 Mb) that affects variation in Ezh2 levels are shown in bold.
Correlation values refer to Pearson’s correlation coefficients between variation in the
gene of interest and Ezh2 levels (see Figure 6B and C).
For personal use only. by guest on June 5, 2013. bloodjournal.hematologylibrary.orgFrom