Mediation of Work Engagement between Emotional Exhaustion and Cynicism
Upload
khangminh22Category
view
0download
0
22/02/2012
1
Global Exhaustion
Redefining the relationship between energy and the economy
By Andrew Lees

22/02/2012
2
1. Introduction. Page 3
2. The Rising Cost of Oil Production. Page 7
3. Coal’s last hurrah. Page 16
4. Unconventional Gas and Thorium Fission. Game Changers or Unsubstantiated Hype? Page 22
5. Alternative Energy is no alternative. Page 27
6. Energy Density. Page 35
7. Area Efficiency. Page 42
8. Inter-temporal Accounting Page 55
9. Why the Fuss? Page 65
10. The Terms of Trade. Page 72
11. Networks. Page 81
12. Going Critical. Page 95
13. Checkmate. Page 104
Andrew Lees (44 207 568 4350)

22/02/2012
3
Chapter 1
Introduction
Energy has become so cheap over the last 100 years that its relationship with the economy has been
forgotten. Dig back a little further and the true value of energy becomes all too apparent.
I was recently told by an oil analyst; “You are mad. Peak oil is totally balmy”. I’m often told I am mad
so that wasn’t a surprise. It was rather the inference that oil is continually being created faster than it
is being consumed that riled me. More worrying still is the implication, from just how vociferous the
denial has become, that oil is the best source of energy we will ever find. If this were the case it would
be incredibly depressing. Imagine the world economy never expanding beyond its present levels, or
your grand children having a lower standard of living than we presently do. All the dreams of space
travel and increasing life expectancy would be just that; dreams. Future generations would never enjoy
the big economic and social advances associated with accessing more concentrated forms of energy
that drove the Industrial Revolution. Peak oil is undoubtedly happening and it is going to be extremely
painful. A lot of us will lose our jobs and see our standards of living fall, but it is a bridge to potential
economic growth on a scale never seen before. The length and depth of that bridge will be determined
by how effectively we allocate capital to solving the problem, which initially means accepting what is
blatantly obvious for all to see.
I am not going to spend much time discussing peak oil. The facts are very simple. Onshore oil
production peaked in 1978. Conventional oil production appears to have peaked in 2005 with the
exception of one month in 2008. “Liquids” production, which encompasses unconventional oils,
peaked in 2008. Middle Eastern production continues to grow but increased domestic usage has
resulted in a small decline in exports since 2005. Global oil discoveries peaked in 1965 and
production has exceeded discoveries every year since 1984. The International Energy Agency (IEA)
reports that the decline rate of production from existing fields is 6.7% per annum. This will accelerate
as producers have to turn to smaller and smaller fields to meet demand; the average size of new
discoveries has fallen from 527m barrels back in the 1960’s and 1970’s to just 20m barrels today,
sufficient to meet just 5.5 hours of current world oil demand. Perhaps more telling is that since I
started getting interested in peak oil back in the mid 1990’s, new discoveries have undershot the
optimists forecasts by about by 170bn barrels, theoretically bringing back the timing of their forecast
peak production by about 5 1/2 years to 2014/15, however despite these changes they have doggedly
stuck to their previous estimates of when peak oil will happen.
The conventional view against peak production is that advances in technology will open up more oil
reserves. The logic is sound, although to a large extent the gains in technology have simply allowed us
to extract existing supplies at a faster pace, postponing peak production but accelerating the eventual
pace of decline. Putting this to one side however, the argument actually undermines itself. If we have
to develop more technology to access the same amount of oil, then there is less “net” energy available
for the rest of the economy. Mother Nature is effectively charging a higher tax on the fuel. The
network of oil rigs, pump jacks and deep sea drilling rigs, plus pipelines and floating platforms etc are
becoming a larger and larger proportion of the economy, leaving less energy for other industries.
Figuring out how these limitations will affect both gross and net energy output will determine the size
and composition of the world economy.
At the present relative rate of growth, coal will once again become the world’s dominant fuel by about
2012/2013, a position it has not held since the early 1960’s. After 200 years of decline, renewable
energy is also starting to rise within the world fuel mix, accounting for almost 2% of non-transport
fuels. The initial switch from renewable fuels to coal and then to oil was however driven by the
economics and huge efficiency gains associated with more concentrated forms of energy, freeing up
labour and capital to do other work. Shifting back to these lesser forms of energy means diverting
more land, labour, capital, and other raw materials, to both accessing energy and then turning that
energy into useful work. With fewer resources available beyond the energy network, the scope for
productivity and efficiency gains for the wider economy will deteriorate and possibly even reverse.

22/02/2012
4
As far back as the mid 1800’s when Britain’s coal was starting to become more expensive it was
recognised that returning to bio fuels or wind and water power was simply not an option. Without
fossil fuel, the amount of resources needed to provide sufficient energy for industrial needs was
prohibitive. The whole country would have to be covered in forests to meet its needs. Water’s energy
would vary with seasonality, and those relying on wind to provide energy to pump out mines or to
drive industry could only work according to when the wind was blowing. Despite significantly larger
energy consumption today and supposedly better education, we seem to lack the common sense to
realise that alternative energy is a non-starter, and without a proper replacement for fossil fuels we are
in a mess. Repeatedly I hear people saying that they can adopt their lifestyles very easily to
accommodate a big decline in energy consumption. Quite frankly they don’t know what they are
talking about.
Gross domestic product (GDP) is “the total value of goods produced and services provided within a
country during one year” according to the Oxford English Dictionary. Put simply, it is the value that
we attribute to work done. Measured by calories, 50 times more work is done by fuels than by labour,
and of the calories burned by labour; most of them are dependent on fossil fuel-based inputs such as
fertilizers and irrigation, without which it is estimated that the carrying capacity of the Earth is just
15% of its present level. Fossil fuels are used in every aspect of the production chain from mining,
research and development, design, manufacture, operation and finally disposal. Put simply, the
economy is almost totally dependent on fossil fuel inputs, and it is 100% dependent on energy inputs;
if there was no Sun, then there would be no life on Earth.
An economy is generally thought to be made up of land, labour and capital, but today these are
basically derivatives of fossil fuels. The effective size of the agricultural land for example is about
85% bigger with fossil fuel based inputs such as fertilizer and irrigation than without, and so too
therefore, is the labour force which is freed from working on the land by fuel driven machines. Capital
equipment is also derived from directing energy into the formation of tools rather than end
consumption. Even education is only afforded to us at its present level by fossil fuels lifting us out of
the poverty trap, and freeing us from a self-sufficiency lifestyle. Scientific advancements come from
communication, imagination, and trial and error all of which are aided by fuel inputs. Calculations
that would take thousands of man hours can now be done in a matter of seconds by computers,
allowing new sciences that could previously never have been dreamed of such as gene technology, to
develop and become reality.
The cost of energy and the value of energy are two totally different things. The cost is the proportion
consumed in extracting the fuel from the ground, whilst the value is the economic output derived from
the energy. The two are linked by the efficiency of energy extraction. As this efficiency decreases, so
the network of capital and technology required accessing the fuel increases. This relationship is
crucial to understanding the economy and how it will change.
The energy network is becoming a larger and larger proportion of the global economy. It is not just
apparent at the gasoline station, but rather in our standard of living as a whole. As the credit crunch
so admirably demonstrated, the West has maintained the illusion of wealth by taking on more and
more debt. It sold its capital to maintain existing consumption. We were told by economists that cheap
Chinese labour meant cheap exports to the West, but as it turned out these goods were not cheap at
all. They were in fact extremely expensive as they meant losing jobs and skills and taking on huge
amounts of debt that will weigh on our economies for years to come. The reason China was able to
export these goods “so cheaply” was because over the preceding 20 years, the energy network had
dramatically changed shape to encompass China’s vast coal reserves. China now accounts for almost
50% of the world coal production. Combined with domestic oil production it is the equivalent to about
38m bpd of oil or around 45% of the world oil output. Not only has the energy network shifted
increasingly towards China, but it has increasingly kept the “value added” within the country,
creating hundreds of millions of jobs and sucking in capital from the rest of the world.
The global fuel mix is gradually deteriorating. The energy network is becoming a larger and larger
proportion of the global economy, and consequently our standard of living is falling. It is no good
people dismissing peak oil, or talking the virtues of renewable fuels. We have to recognise the

22/02/2012
5
implications of the declining fuel efficiency, and what that means for the economy. There are a lot of
doomsayers, who highlight that without energy the global economy will soon collapse. That is
undoubtedly correct, but the premise that there is little energy is wrong. What’s more there is plenty
of much higher density energy that makes oil itself look irrelevant. It is learning how to access it that
is important, but unfortunately a misallocation of capital has meant that these sciences and
technologies have had almost no funding in recent years. Nuclear fusion - the source of the Sun’s
energy or the power source in a hydrogen bomb - is one such energy source that the world will have to
develop if we are to avoid a terminal decline.
Over the last 30 years, the global economy has become much more horizontal. Technological progress
has not kept pace with economic output, resulting in the depletion of resources. The costs of scientific
advancement, which ultimately drives economic growth, are too big for the private sector to bear. The
economic gains often do not accrue for decades and the benefits frequently fall away from the original
inventor. “Big” scientific investment has to be undertaken by the public sector, and yet US Federal
Research & Development spending has fallen from 2.5% GDP in 1960’s to just 0.5% GDP today, and
presumably former Soviet spending has fallen even further. The end of the Cold War was not just the
end of an Arms Race, but it was also the end of a Technology Race, in which the two world powers
were competing. The reallocation of capital from scientific advancement to immediate consumption
obviously did lift the global standard of living, but it was at the cost of sustainability. We have been
consuming down resources rather than investing in sustainable growth.
Without scientific advancement, Malthusianism is correct. The weakest demand is gradually being
priced out of the global economy. First the U.S. sub-prime borrowers, and then more recently, the
indebted Greeks. As the dynamics change between the cost and the value of energy, so the relative
price, or terms of trade, will change between different goods and industries, knocking down the
marginal consumer dominoes one by one. The global economy is held together by a financial network,
whose asymmetric risk profile means the demand destruction and dismantling of the economy can
happen in a sudden manner, particularly if the system is working within tight tolerance levels. Whilst
the market is pricing out the marginal consumer, the government has a responsibility to fight this and
transfer money back from productive assets to unproductive ones, ie the unemployed. This slows down
the necessary adjustment process, reducing that country’s ability to compete for the remaining
resources, and thereby making the country poorer; a vicious circle.
To break this circle, capital needs to be shifted from final consumption into scientific advancement.
This is a process which often is associated with a war; consumption is rationed to free up resources to
be directed into a technology race. A war re-sets technology to a new higher level, tearing us away
from the restrictions previously imposed by natural resources. Whilst a war is the ultimate cleansing
process of all the problems associated with misallocation of capital, the adjustment process should be
able to be achieved far less expensively by strong leadership directing resources more efficiently. We
know what the problem is, and we also know what the solution is; nuclear fusion. Unfortunately
leadership is weak, and democracy rarely votes for the medicine it needs - turkey’s don’t vote for
Christmas - which means that the cost of the achieving the necessary scientific progress will be far
higher and more painful than it needs to be.
That pain will be felt by the changing shape of the global economy as the cost of energy rises relative
to its value. The network of land, labour, capital and technology necessary to extract and process
energy will increase. Certain industries and geographies will simply be priced out. Some countries
will have natural advantages such that they can use the resources much more efficiently than others,
and therefore can pay much higher prices. Timing the transition will be vital. Those countries that
adopt lesser quality sources of energy too early will undermine their own economic competiveness,
and therefore their ability to access the most efficient sources of fuel, whilst those that adopt them too
late will not be able to afford the necessary investment.
We know what the solution is. We have known for 50 years. Nuclear fusion offers us the chance to
access an almost unlimited source of very high density energy. As our understanding of how to control
fusion grows, so our ability to access a far higher percentage of the available energy will also grow; a
virtuous circle. Most people have probably heard of Moore’s Law which describes how we have
managed to double the power of microprocessors every two years. Lawson’s criterion describes how

22/02/2012
6
long, and at what temperature, plasma can be contained. This has also doubled every couple of years
for the last 50 years. The hotter and longer a plasma can be contained, the more atoms will be fused,
releasing more energy. This has already increased about a million fold, resulting in energy break-
even. Imagine it increasing another million-fold. This is a complicated science, and therefore
expensive, but even if it were to cost 50% of the global economic output for the next 10 years, it would
be dwarfed by the cost of not achieving it and yet for the last 20 years governments globally have
quibbled over a USD10bn budget. Nuclear fusion can quite literally lift the entire world population out
of poverty.
This book is a plea to Western leaders to wake up and do what you are paid to do, and to the Western
public, to give the government the mandate necessary to ensure the survival and advancement of our
way of life.

22/02/2012
7
Chapter 2
The Rising Cost of Oil Production When it takes more energy to extract the resources than they yield, then to all intents and purposes
the reserves have been exhausted.
In the introduction I said that I did not want to discuss peak oil as such. There have been plenty of
books written on the subject, but optimists simply argue that black is white. Instead I want to approach
the problem from the opposite angle. I want to assume that there is significantly more oil, more coal
and more gas available, and that better technology will make it accessible.
In the 1970’s, as forecast by Shell geophysicist Dr Marion King Hubbert, oil production in the lower
48 US states peaked, spreading fear that the world faced a similar problem. Forty years later, the fact
that world oil consumption has continued to grow is viewed as evidence of the folly of the argument.
If people forecast peak oil in the 1970’s, and yet 40 years later world production has continued to
grow, why should we believe those same naysayers now? The reality is that with hindsight, we can say
with a great degree of certainty that global conventional onshore oil production did peak in 1978 and
has fallen marginally ever since. Growth has therefore had to come from offshore production which
now accounts for about 50% of the total. It is widely accepted that any new large finds will also be
offshore, but they will be deeper and will be further out-to-sea, requiring more technology,
engineering, capital and infrastructure to access the oil. As we have seen with the BP Deep Water
Horizon disaster in the Gulf of Mexico, the cost of getting it wrong is huge, making deep water oil
production prohibitively expensive for all but a few of the very biggest and most well capitalised oil
companies. The level of redundancy in the system has to be increased to allow for these accidents
whilst still generating sufficient revenue to sustain the investment growth necessary to support output.
Prices must rise.
Drilling in the North Sea was seen as ground-breaking technology in the 1970’s and 1980’s.
Unfortunately along with the advances came setbacks such as Occidental’s Piper Alpha disaster that
cost 167 people their lives. North Sea oil production was relatively shallow and within a helicopter’s
distance from land. Divers could operate at the sea-bed, and changes of staff and new supplies could
reach the platforms fairly quickly. Nevertheless the cost of the technology was measured at about 20%
of the value of the fuel recovered; very expensive by onshore comparisons but necessary to meet world
demand. For every one unit of energy that went into accessing the oil in terms of the capital input and
the operational costs, just 4 additional units of energy were released from the fields. This Energy
Return on Invested Energy (EROIE) was significantly lower than had been obtained onshore,
particularly in the Middle East where historically it had been almost a case of sticking a straw in the
ground and collecting the oil.
Brazil’s new Santos Basin by comparison, which is the big new hope for oil, is about 300km out to
sea. Either new helicopters will have to be designed that have a greater range, or a refuelling platform
will be needed half way, adding to the dangers. The oil is at a depth of around 7 - 10 kilometres.
Beneath 2 to 3 km of ocean is a layer of rock 2 - 3km thick, which itself sits above a layer of salt of
similar depth below which is the reservoir of hydrocarbons. In the North Sea, the oil rigs stand on the
sea-floor, but here it is a case of specially designed floating platforms secured to the ocean floor by
massive vacuum anchors. Submersibles have to take care of any work at the ocean floor. The
technology to drill through the salt will have to be developed. At these depths, under immense
pressure and warmed by the planet’s internal heat, the salt behaves more like a fluid than a rock. At
the depths involved the oil will be around 100 degrees Celsius when it reaches the ocean floor, at
which point the cooling from the water will make the oil solidify causing high density bulbs that block

22/02/2012
8
the flow to the surface. The pipes will therefore have to be heated, making them heavy and
problematic. Rather than pumping the oil onshore, a floating harbour will be built from which the oil
will be loaded directly onto tankers. Whilst production will be highly complex and require new
technology, the problems should not be insurmountable. As long as the EROIE remains positive, the
oil should pay for itself, but growing exponentially with depth, the cost of production will set the price
for the marginal barrel of world production.
Brazil’s oil faces a second hurdle. In order to maintain as much of the value from the fields
domestically as possible, the national oil company Petrobras will control all future development of the
Santos Basin, potentially shutting the door to the much better equipped and more experienced
companies such as Exxon Mobil or Royal Dutch Shell. Oil concessions will be replaced by production
sharing agreements with a new state oil company overseeing development and having a veto over all
operational matters. Petrobras, in which the government will increase its stake, will take at least 30%
of any consortia formed, and will be the lead operating company in all of them. It will also be granted
licences on its own for any field the government so wishes. Frequently other countries that have taken
production “in house” to help fund social programs have seen production stagnate or decline. With no
competition and as the sole operator having to use domestic industry for equipment and supplies, costs
are likely to get out of control as is already being seen on the human resource front. When the Gulf of
Mexico was first developed, all the oil companies could participate. The competition and
communication between different companies meant new technology necessary for drilling was soon
developed, allowing the fields to come on stream rapidly. Brazil now risks slow and costly
development whereas simply opening the doors to all interested parties and levying a higher tax
would have accelerated production and left the risks with private capital.
In 1978 world onshore oil production peaked. There is a growing belief that despite the big fields
mentioned above, total oil production may also have peaked in 2005. With a collapse in offshore oil
discoveries following the giant Brazil finds in 2006, and with the extended time required to develop
and bring new production on-stream post discovery combined with the accelerated production decline
from offshore fields necessary to recoup the capital in a timely manner, it is now thought that offshore
production may peak as early as 2012 resulting in an accelerated decline in overall production. Even
the International Energy Agency (IEA) now concedes that conventional oil production probably did
peak in 2006. Reinforcing the view, over the last ten years the growth of oil production has moved
away from these fuels to a mixture of unconventional sources; gas liquids, bitumen, tar sands and bio
fuels such that the industry now uses the term “liquids” rather than oil to describe the whole complex.
In 2008 natural gas liquids accounted for 11% of the total or 7.94m barrels per day. Heavy crude or
bitumen accounted for 3.4% (2.68m bpd), of which tar sands were 1.27m bpd. Bio fuels were 1.8% or
1.45m bpd. These fuel sources have an extremely low EROIE, but they are increasingly needed to
meet our energy needs. Historically gas liquids were simply flared off, seen as a waste product or too
expensive to recover, but now they are cooled down and put through a centrifuge to catch tiny oil
droplets. Tar sands need cleaning in giant industrial washing machines, consuming vast amounts of
energy and water. It then needs hydrogen adding to increase the combustibility. The EROIE is about
1.7 – (for every 1 unit of energy you put into the ground, you recover 1.7 units out, or a net 0.7 units) -
but if you wanted to increase the flow-rate, then major water transfer technologies and other power
sources would lower the EROIE still further. As far as bio-fuels are concerned, it is debatable whether
some of them have a positive EROIE or not.
Optimists argue that liquids production won’t peak until 2020 although by admitting that the rate of
growth will stagnate from 2011 onwards, they are accepting an inevitable slowdown of economic
growth. In a declining EROIE environment, net energy production can only be maintained by
reallocating resources away from end consumption to maintaining energy production. The economy
will not necessarily slow but it must rebalance. Only if the decline in EROIE is sufficiently deep that
enough capital cannot be made available from other parts of the economy to compensate will the
energy production actually stagnate, and with it the economy as a whole.
The decline rate of global oil production from existing fields is 6.7% per annum according to the
International Energy Association (the IEA). Assuming that rate is static, it would mean that over the
next 5 years, replacement production has to be found for just over a third of all existing output. That is
like finding a new Saudi Arabia every two years, just to stand still. If this were not bad enough, the

22/02/2012
9
decline rate will accelerate as aging giant fields, which provide the bulk of production, are replaced
with significantly smaller satellite fields. Not only have new discoveries failed to keep pace with
output every year since 1984, but with the average new field size less than 4% of what it was 40 years
ago and sufficient to meet just 23% of one day’s global consumption, a lot more capital is required to
maintain output. Even Saudi Arabia suffered a 25% decline in well productivity between 2005 &
2008, from just over 6,000 barrels per well per day to 4,500, which is an acceleration of the 2.3% pa
decline rate between 1980 and 2005. Worse still, this is despite enhanced recovery techniques such as
water and gas injection which adds to the energy cost of production and thereby reduces the effective
net reserves.
Mexico offers a good example. Its Cantrell field, once the third largest field in the world, has seen
output completely collapse over recent years, down 66% between 2005 and 2009. When the oil
specialist David Shields initially forecast this decline, people dismissed it as hopelessly pessimistic.
Their mistake was assuming a normal distribution of production, ignoring the consequences of using
nitrogen injection techniques since 2000 to enhance recovery. This technology had enabled production
to be sustained beyond the natural level, but at the expense of a much sharper pace of decline when it
eventually happened. Of interest, the scale of injection required the world’s largest nitrogen
production plant, consisting of five production lines each with their own air separation units powered
by turbine generators. The natural gas used to fuel the generators would have lowered still further the
EROIE of the field.
Mexico had hoped that it could offset the decline with the new Chicontepec field; however this has
proved a complete disaster and an expensive embarrassment. The oil is tightly locked in isolated
geological formations, such that the Mexican state oil company PEMEX had figured that it would
need to drill 1000 wells a year to offset the Cantrell decline. By mid 2009, having already invested
$3.4bn in the field, production was running 60% below target at just 30,800 bpd, and with tax
revenues under pressure future investment is likely to be curtailed. With the cost of extraction
prohibitive, auditors have advised Mexico that it should reduce its stated reserves by 7.5bn barrels,
however it so far chosen not to follow their advice, instead saying that it will carry out tests and
studies over the next two years to see if there is any way production can be improved. PEMEX has
therefore had to turn to Plan B; smaller satellite deposits and an accelerated production program from
its Ku Maloob Zaap (KMZ) field to compensate. Aggressive flaring associated with the accelerated
KMZ recovery is resulting in the field pressure dropping quickly, making future recovery more
expensive and energy intensive. In the longer term the government has estimated that 29.5bn barrels
of oil equivalent lies beneath the seabed in its part of the Gulf of Mexico, however after 7 years of
searching it has found only 2 fields worth developing, whilst 6 wells were either dry or the quantities
were not commercial, leading the oil industry to dub it “the Dead Sea”.
Moving back to the tar sands for one moment, whilst there are huge reserves, as of 2008 they were
providing us with just 1.27m barrels per day of oil. To clean the oil, water is being sucked from a 200
mile radius, meaning that there is a potential opportunity cost associated with the transfer. If the flow
rate was to increase further, then it seems likely that water would have to come from still further-
afield, or alternatively more capital and technology would be required to recycle the water from
settling ponds, lowering the net recovery rate. It is calculated that to reach a production rate of 3m
bpd, it would consume 20% of Canada’s entire natural gas production, which is used for the heating,
cleaning and refining process. Using natural gas with an EROIE of around 10 as the energy source to
process the tar sands with an EROIE of 1.7, means that the whole through-process has used 1 unit of
original energy to access 17 units of tar sand energy, ie a combined EROIE of 17.

22/02/2012
10
Only about 20% of the tar sands can be surface mined. The rest are deep underground and would have
to be recovered via steam injection technology; essentially drilling two holes in close proximity to
each other and injecting steam under high pressure into one of the holes to melt the tar and return it to
the surface through the second pipe. As yet there are no commercial ventures recovering these deep
reserves. With steam being used under pressure, there are risks of explosions similar to those seen in
the early days of the Industrial Revolution when a boiler failed, and indeed there have been several
such incidents causing big craters in the ground as the steam pressure has suddenly escaped. I would
suggest however that technology has not been the limiting factor on production, but rather the low
EROIE which makes the net energy reserves negligible. Whilst companies are exploring the feasibility
of building nuclear reactors on site to provide the energy and steam required, it is clearly apparent
that the tar sands themselves should not be viewed as a fuel source, but rather a storage medium for
energy in the same way as a battery. Because the world’s transport system runs on gasoline, there is a
sufficient premium on gasoline to make it economic to use natural gas or even nuclear fuel to turn the
tar sands into gasoline.
Imagine if instead of using the gas as the initial energy source, we were forced to use the tar sands
themselves. The return energy would fall from 17 units for every unit we put into the ground to just
1.7 units. Adjusting for this, the net effective reserves would fall by 58.8% and similarly the cost to
value ratio would soar from 5.88% to 58.8% at which stage it may simply be deemed too expensive to
bother about. Whilst this is the extreme, there will be a sharp decay curve to get there. Canada’s
natural gas production has seen its EROIE decline along a linear path from about 45 in 1995 to 10 in
2010. Assuming gas output is not simply diverted from other uses, but is stepped up to meet the tar
sands production goals, then the EROIE will decline at an accelerated rate. When this is multiplied by
the lower EROIE associated with mining at deeper depths and eventually switching to steam injection
recovery, plus the need to bring in water from further afield, the combined EROIE will fall rapidly.
The tar sands are already suffering declining ore grades as the clay and sand content becomes a higher
percentage of the mix, and with regulators imposing more environmental controls over such things as
the scale and number of tailing ponds, the tar sands are going to become more and more expensive.
Eventually questions have to be asked about the opportunity cost. Is the amount of water being used
detrimentally affecting agricultural production? Using the tar sands as the primary energy source in
the extraction process would cause a sea-change in the pollution and environmental damage which
should also be accounted for.
Vendors present the low quality energy that we are gradually migrating to in a much more favourable
light than is genuinely the case. Like the tar sands which rely on high EROIE natural gas as the
feedstock, a lot of the alternative energy is only economic if combined with a much higher quality
fossil fuel. As I will show later, US corn based ethanol for example has an EROIE of just 1.01. For the
moment the fuel appears viable, however without fossil fuel based fertilizers and irrigation, and
without tractors powered independently of the ethanol, it could not possibly be justified. The concern
therefore is that by relying on high quality feedstock and multiplying two or more EROIE’s together,
we are kidding ourselves to just how practical these energy sources will be as a genuine replacement.
The very best that can be said of low quality energy is that it can extend the useful reserves of fossil
fuels, but most of them cannot, and should not be seen as ever being able to substitute or replace them.
Reserves should only include such fuel in so far as it is matched by high quality reserves, and even
then only as a reflection of the incremental energy it can offer rather than the gross energy.
Tar sands and other heavy oils also need hydrogen to be added to boost the combustibility and to
reduce viscosity to make them suitable for refineries, most of which were designed years ago when the
lighter oil at the top of wells was being produced rather than the heavy lower quality oil that tend to
accumulate at the bottom of fields. The deeper the well goes the heavier and more viscous the oil
generally becomes, requiring enhanced recovery technology to extract it. The most economical way to
make hydrogen is to steam strip hydrogen atoms from natural gas, but when that is exhausted
electrolysis will have to be used adding to the energy intensity of production, although advances in
Nano technology are increasing the efficiency of the process.
U.S. oil giant Chevron has been undertaking field trials to pump out heavy crude from the shared
Saudi Arabian and Kuwait Wafra field that was previously considered unrecoverable. It is injecting
steam to loosen and thin the sludge which is then pumped to the surface. Unlike earlier fields where
22/02/2012
11
steam injection has successfully been deployed, most of the Middle East’s heavy oil is locked inside
carbonate formations where steam injection has never been tested on a large scale. As the steam leaks
out through fissures in the softer rock, more steam has to be deployed to build up the temperatures
needed to melt the heavy oil, making the process more costly in terms of both water and natural gas or
oil to create the steam. It is hoped the steam injection will lift the recovery of the fields 1bn barrels of
reserves from just 3% to 40%. Heavy oil suffers from a second problem; it has too much carbon and
not enough hydrogen so the refining process has to compensate by either stripping carbon from the
mix or adding hydrogen, either of which incurs a further energy penalty. The very fact that the Middle
East is turning to these expensive heavy crudes illustrates the tight nature of the oil market at the
moment.
According to The Canadian Association of Petroleum Producers, conventional Canadian oil
production is increasingly turning to horizontal drilling combined with fracturing stimulation to
maintain output. Despite these new techniques, surface mined tar sand production has exceeded
conventional oil output since 2006, reaching 55% of the total in 2009. In its June 2010 report it
forecast that in-situ - (tar sands recovered using steam injection techniques) – will exceed surface
mined production by 2016. This gradual progression from conventional oils using simple recovery
techniques, to the same oil with enhanced recovery, then to surface mined tar sands and finally to
steam injection, maps out a sharp decline from high to low EROIE energy, as the reserves are
depleted with time.
Another potential medium to carry energy is Shale or Kerogen. It is not oil, although if you come back
in a few million years time, then subject to the right pressures and temperatures, it would turn into oil.
Human ingenuity can speed up the process, but again it is hugely energy and water intensive. The
giant European oil company Royal Dutch Shell has been working on technology which would require
the insertion of electric heaters hundreds of feet into the ground to heat the shale to between 650 and
700 degrees Celsius for more than 2 years. At the same stage, to prevent seepage and environmental
contamination, it would create an underground wall around its site by freezing ground water to a
depth of 2000 feet. It seems unlikely that there would be much, if any residual net energy left once
these processes have been completed. Not only is it doubtful whether any net energy would be
produced, but for the amount of work that can be done by the energy, the environmental damage
would be colossal. A tiny proportion of shale reserves have turned into oil with the Eagle Ford Shale
field in South Texas the best example, but it is estimated that peak production will be no more than
250,000bpd - 3,000,000 bpd by 2015 before falling.
Gas liquids, which have been another area of growth in recent years, are themselves an indication of
an ageing oil field. As reservoir pressure declines, the gas within the field begins to separate from the
oil. This wet gas has to be processed by putting it through a centrifuge to collect all the tiny oil
droplets. Not only is this expensive, losing about 40% of the gross energy in the process, but it is also
indicative of ageing fields. Imagine a bottle of fizzy drink. When you release the lid, the drink will
explode out of the bottle driven by gases. By the time the bottle is only about half full, most of the gas
has separated from the drink leaving the rest flat. Some gas does still come out of the bottle, but it is
insufficient to lift the rest of the drink with it. Within an oil field as the pressure falls, the remaining
gas separates and floats to the top of the oil field, forming a gap or cap between the well and the oil.
Either the well needs to be put further down into the field and pumps used to lift the remaining oil, or
water needs to be pumped into the field on which to float the oil to the surface, processes which add to
the cost of production and lower the EROIE. The scale can be huge, with as much as 40 times more
water pumped into the field than oil recovered. The water comes out with the oil and then has to be
separated in special tanks.
Whilst there is a 40% loss of energy in extracting gas liquids, it is gas that would otherwise have
simply been flared off or wasted. By removing this inefficiency it enhances production and lifts the
EROIE of the field, but because it is just a derivative of conventional production it will suffer a similar
decline. Gas liquids have come from nowhere to accounting for 11% or 7.94 million barrels per day of
oil production. This elimination of waste has allowed production to grow, but it is not from finding
any new discoveries and there are no similar efficiency gains that will boost output going forward
other than rolling out the technology to the smaller fields where it is presently uneconomic to capture
and process the gas. In fact the increasing need to turn to enhanced recovery techniques for ageing oil

22/02/2012
12
fields whereby pressure has to be injected into the well would suggest that gas liquids production will
have a much sharper decline rate and will be exhausted long before the actual oil is. Gas liquids
should in no way be viewed as an alternative fuel but rather as a short-term by-product that has
boosted output in recent years but will add to the overall decline rate going forward.
The International Energy Agency forecasts that more than 50% of the volumetric growth in world
liquid energy supplies will come from natural gas liquids over the next 25 years; from wet or
condensate gas. The wetness or moisture content of the gas however, which is a measure of the liquids
that can be recovered in the gas oil separators, is already starting to decline. Condensates or wet gas
fields are drying out. The energy and industrial equipment cost of extracting the liquids is rising
reducing the net available reserves. The owners of gas fields will usually develop the wetter fields first
as these generate additional income from the natural gas liquids and so production will follow a
“normal” bell-shaped curve. This – (http://www.theoildrum.com/node/7385#more) - highlights that
the wetness factor for Saudi fields has already declined, and most concerning, the Iranian and Qatar
fields which account for 60% of OPEC’s proven natural gas reserves, have also started to dry.
The Gulf States are struggling to maintain oil production. As the fields age, the region has been
forced to use gas injection technology to enhance the recovery rate. In 2009 the UAE injected 1.7bn
cubic feet per day (cfpd) of natural gas into its oil fields to maintain production, which is expected to
reach 4.2bn cfpd by 2020 according to FACTS global energy. If Qatar had not pledged most of its gas
output to supply Asian customers under long-term liquid natural gas (LNG) contracts, the issue would
not be too serious, but as it stands the UAE, along with Saudi Arabia, Kuwait and Oman is “out of
gas”, leaving it with a shortage for power generation and industry. Gas injection has worked well for
Middle East reservoirs lifting recovery from 50% of reserves to between 60% & 80%, but for the large
fields the amount of gas needed is enormous. Saudi Arabia is injecting more than 3bn cfpd of gas into
its fields, a figure that is likely to increase 3-fold by 2015. Last year Iran started the world’s largest
gas injection programme, planning to inject 3.6bn cfpd into its Aghajari oil field. Whilst Mexico uses
nitrogen and others use carbon dioxide, they are actually more expensive to use than natural gas
which is more soluble than nitrogen in oil and is therefore better at coaxing oil to flow by thinning it.
Carbon dioxide is soluble in oil but has the disadvantage of having to be collected from a power plant
and piped some distance to the oil field at considerable expense. If there were global charges for
carbon emissions, then perhaps the cost of the carbon to the oil producer could be reduced by sharing
the expense with the power stations.
The biggest oil field in the world, Saudi Arabia’s Ghawar, was discovered in 1948. It is debatable
whether this field has gone past peak production or not. As of now, Saudi Arabia’s oil production
peaked in 2005 at 11.1m barrels per day. It averaged 10.4 million in 2007, briefly recovering for a few
months in 2008 before subsequently falling to 9.7 million as of 2009. The initial fall came when
prices were making new all time highs in both nominal and real terms, which suggests that if it was a
voluntary cut as officials intimate, then it was no less political than the so-called “oil sword” that
Saudi Arabia swung over the world in the first oil shock in 1973/74, particularly given the
contributory factor to the biggest recession since the 1930’s Depression. Reduced production in 2009
was for economic reasons to support prices post the 2008 global economic slowdown, and so avoid the
budget running into deficit which would happen if oil fell below USD71 a barrel. Between 2005 and
2008 OPEC’s response as a whole to the doubling of oil prices was a temporary increase in output of
720,000 bpd, but with domestic consumption rising by 1.0m bpd over the period exports actually fell.
Traditionally it would have taken advantage of the steep rise in prices to get as much revenue in as
possible, yet for either political or geological reasons price rationing was clearly taking place.
Saudi’s well productivity is thought to have fallen from about 15,000 barrels per well per day in the
early 1980’s to around 7,000 in 1990. The rapid decline was due to over-working fields which helped
accommodate the Iranian withdrawal from world markets after its revolution. Over the subsequent 10
years or so well productivity declined at a much slower pace, however between 2005 and early 2008,
as I have already mentioned, it is thought to have fallen by a further 25%, presumably indicating that
the fields were working near capacity once again. http://canada.theoildrum.com/tag/ghawar suggests
that the Haradh III development at the southern tip of the Ghawar field, which was portrayed in 2006
by the national oil company Saudi Aramco as the turning point in the battle between geological
adversity and engineering prowess, has since seen well productivity fall 60%. One specific problem

22/02/2012
13
arising from water and gas recovery techniques is that the oil is lifted into small pockets within the
field, requiring more wells to be drilled to access it. In March 2011 Saudi surprised the markets by
expanding its oil rig order book by 28% over the subsequent two years simply to maintain existing
production, and in a report entitled “Saudi Economy and the Future of Energy” the kingdom
disappointed most analysts by stating that its oil output would average just 8.7m bpd between 2011
and 2015, only rising to 10.8m bpd average by 2030. It also advised the West that it was only able to
respond to the Libyan outage with heavy crude for which there was insufficient refinery capacity,
hence the IEA’s release of strategic reserves.
Putting the question of Ghawar’s peaking production to one side, there is no debate that the 2nd, 3rd
and 4th largest fields ever found – Kuwait’s Burgan field, Mexico’s Cantrell and China’s Daqing -
are all now beyond peak production. Twenty years ago, 14 fields worldwide produced more than 1
million barrels per day. Now it is down to just 2, Ghawar and Burgan. Over that same period world
needs have risen 22%. Since 1980, only one field has been discovered globally that can produce
upwards of 500,000 barrels per day. The average new discovery worldwide is just 20m barrels, only
sufficient for 5 ½ hours of world demand. It nevertheless needs drilling and operational equipment
and personnel, such that the overall productivity will be dragged down. Despite being of such small
size, the production profile will follow a normal shaped curve just as with any other field, and so
again enhanced recovery techniques will eventually be necessary. Fields that had previously been
abandoned as uneconomic are now being brought back to life because the efficiency of production has
fallen sufficiently far that they are now seen as competitive.
Saudi Arabia’s domestic oil consumption rose 9.8% in 2009, and similar annual gains are expected in
the future, leaving reduced capacity for exports. Overall, Arab growth is expected to account for
11.7% of the global growth in oil consumption in 2010, second only to China. OPEC’s production has
risen by about 2.5million barrels per day or just over 8% since 2000, but rising domestic consumption
has meant that exports have been flat, initially rising until 2005 but falling ever since. This is likely to
be a continuing trend due to strong population dynamics and the greater domestic capital formation
resulting from higher oil prices. Over that period gas liquids and condensates have risen from 10.3%
of total OPEC liquids production to 15.6%. In some cases, reduced pressure above the ground allows
oil to be separated from wet gas in simple separation containers, not adding dramatically to the cost.
In most cases however specialised equipment is necessary to extract the oil. Heat exchangers are used
to lower the temperature and pressure whilst at the same stage using a centrifuge. As liquid natural
gas and condensates become an ever larger share of OPEC’s, and indeed the global oil mix, so this
will add to the energy cost of extraction.
One of the areas that differentiate views on peak oil is the Arctic where reserves are estimated as high
as 30% of the world’s undiscovered gas and 13% of its undiscovered oil, according to the United
States Geological Survey (USGS) which is based on a combination of public and private sector
research. Given that equipment and workers will have to cope with temperatures falling below minus
40 degrees Celsius, dangerous levels of ice build-up on ships and rigs, and darkness through months
of the year putting workers under extreme psychological conditions, as well as moving ice that can
crush and capsize normal rigs, the very fact that exploration is being considered highlights the lack of
opportunities elsewhere. Even the USGS concludes that these estimates do not account for economic
or technological risks, “so a substantial fraction of the estimated undiscovered resources might never
be produced”. A Financial Times Article at the end of 2006 highlighted the international energy
consultants Wood Mackenzie believe that technological constraints means that remote gas will not be
tapped until 2050 and that the Arctic should not be viewed as a strategic energy source.
As I have already mentioned, the decline rate of production from existing fields is 6.7% per annum
according to the International Energy Agency. Every 21 months, new production the equivalent of
Saudi Arabia needs to be found and brought on stream. Over 4 ½ years, production equivalent to the
whole of the Middle East’s output will need to be replaced. As big efficient fields are replaced with
smaller less productive ones, the decline rate will accelerate, and more wells and equipment will be
required. As the EROIE falls, so gross production has to rise to maintain the same net supply. If as I
suggest, the global EROIE falls from 20 today to 5 over the next 10 years, then to maintain the same
net supply of oil, the gross supply has to rise by 18.75%. In other words, simply to adjust for the
decline in efficiency of energy extraction, new production equivalent to 108% of the United States and

22/02/2012
14
Canada’s combined annual oil output will need to be found. Estimates of global reserve-to-production
ratios will need lowering accordingly. Experience from Mexico indicates that following enhanced
recovery techniques, when peak production does eventually come to a field, the subsequent decline
can be significantly more aggressive than would otherwise be the case such that even the IEA forecast
decline rate may be optimistic.
Twenty four percent of all the oil ever produced was consumed between 2000 and 2009. If you add in
substitutes such as gas liquids which accounted for 11% of the total in 2008, the percentage is even
higher. It is being consumed at an unprecedented rate. At the average rate of growth of consumption
of the last 10 years, bearing in mind that period suffered a deep recession, by 2015 the net liquids
market will be 10% higher than it is today. Assuming the EROIE has fallen from 20 to 10 over that
period, gross energy production will have to rise by 16.1% to meet those needs. With a constant 6.7%
per annum decay rate, new production equivalent to 54.4% of today’s output needs to be found
between 2010 and 2015, or an annual increase of 9.07%. With production exceeding discoveries every
year since 1984, and by an increasing margin, it seems most likely this can only be achieved through
applying new technology to existing fields and throwing ever more capital at the problem. As with the
Soviet Union, the order of magnitude of investment required risks starving other industries of capital,
gradually eroding productivity and undermining their ability to support the oil industry.
The scale of the investment required to achieve this will be monumental, and will therefore require
prices to be significantly higher than they are today. The United States of America was the first major
oil producer to go through peak production in December 1970 when oil was fluctuating between $1
and $2bbl. The first oil shock lifted the price to $12bbl in 1973. It then continued on upwards to $17
bbl in 1978 and $40bbl after the Iranian revolution and the start of the Iran/Iraq war. This price rise
was necessary to allow such projects as Alaskan oil and North Sea oil to become viable and to offset
the declines from the “Lower 48 States” and from Iran. Thirty years later, production from both the
North Sea and Alaska are now in terminal decline. Falling output from Alaska’s primary field
Prudhoe Bay cannot be offset with increases in the surrounding fields. The British half of the North
Sea production has declined by 50.2% from its 1999 high of 2.9m bpd despite a surge in spending
back to the highs of the 1980’s. The Norwegian half of the North Sea experienced peak production in
2001 at 3.4mbpd and is now down 28%. Combined North Sea output is down by 2.5mbpd from its
peak whilst domestic consumption is down just 112,000bpd leaving exports down 2.4m bpd. Oil
prices clearly need to rise sufficiently to make the necessary capital spending viable, making nonsense
of the idea of speculators inflating a bubble.
Since 2005 when conventional oil production appears to have peaked, the main increase offsetting the
declines in Saudi Arabia, Norway, the USA, Mexico and Nigeria etc have come from Russia and the
former Soviet Union, bringing back production that was uncompetitive in Soviet times requiring
higher prices and new capital to support it. Whilst production is very high, reserve to production
ratios are very low suggesting that the fields would be completely exhausted within 20 years at the
present run rate. Both the vice president of LUKOIL and the former head of TNK-BP have warned to
expect a steady decline in output. The government had to grant tax breaks to producers to encourage
development in remote areas to try and offset the declines from the aging giant fields as the marginal
return on investment was collapsing. Third generation fields have to be drilled to maintain output, but
with the average field size just 15 million barrels, the marginal well productivity has collapsed.
American wells that had previously been abandoned have also been brought back to life. Almost nine
hundred thousand barrels per day, or 15% of US oil production now comes from 400,000 “stripper”
wells deploying pump jacks or nodding donkeys to produce an average of just 2.2 barrels per day. Of
these 35.1% produce no more than 1bpd and 78.7% produce less than 10 bpd –
(http://www.theoildrum.com/node/7947). The fact that a well producing less than 1bpd is viable
speaks volumes about the rising cost of world production.

22/02/2012
15
At this point I don’t want to go into any detail on ethanol other than to suggest that it is very
questionable whether corn based ethanol returns any net energy, in which case I would simply ask if
peak oil is not a problem, why have marginal fuels like tar sands, natural gas liquids and ethanol
become such a large proportion of supply? Why are fields that have previously been abandoned as
uneconomic, now giving us most of our growth in supplies? Why is there any consideration being
given to turning shale into oil which consumes as much, if not more energy than it produces, and why
is the inhospitable Arctic oil seen as the main area of optimism? Why is oil being replaced by coal, a
far inferior and more polluting energy source, as our primary fuel, a position it has not occupied since
the early 1960’s? Whilst there is a general campaign of denial of peak oil, can sufficient capital really
be created to continue offsetting the decline in the geological productivity?

22/02/2012
16
Chapter 3
Coal’s last hurrah. Having looked forward to a long and peaceful retirement, coal is outliving its offspring and being
dragged back, coughing and spluttering, to do the heavy lifting
Despite its superior qualities, oil production has fallen as a percentage of the world energy mix since
peaking in the mid 1970’s. The relative cost has exceeded its benefit for most applications other than
transport, where no other fuel can presently act as a substitute. Whilst this in no way indicates peak
production, it does suggest that inferior fuels now have a better cost to value ratio than oil. As we will
find out later in the book, the value of any fuel is a measure of the work it can do, so by accepting
lesser fuels more has to be burned to do the same work. The productivity of our energy supply is
decreasing and with that the overall cost is rising. Total energy production has continued to increase
but the mix has been deteriorating. Despite all the concerns expressed by environmentalists about
dirty fuels, at the present relative rate of growth King Coal will regain its throne as the primary
energy source in 2012/2013, a position it lost in the early 1960’s.
This does not mean a return to steam engines as unfortunately coal is facing similar problems to oil.
In 2006 US President George W Bush made one of his characteristic blunders. Touting US energy
independence he boasted “Do you realise we have 250 million years’ worth of coal”. Of course he
meant 250 years, but the reality is more like 25 years. The US Energy Information Administration
data he was referring to was based off a 1974 survey by just 1 person, Paul Averitt, which itself was
based off data provided in a 1909 survey by two geologists. Much more recent (mid 1980’s) and
detailed surveys by the United States Geological Survey (USGS) have concluded that only about 30%
of the reserve base is potentially mineable. A 1989 survey by the US Bureau of Mines warned that
only 5% - 20% of the original coal reserves are available economically. Between 2002 and 2009 the
USGS downgraded the coal reserves of the Gillette fields in Wyoming, accounting for 37% of total US
production, from 20.87bn metric tons to just 9.16bn. Nevertheless the US is expected to become the
world’s largest coal exporter over the next few years.
Coal reserves have to adjust for land-use restrictions, technological restrictions and economic
restrictions. It is virtually impossible to recover every available ton of coal particularly if the reserves

22/02/2012
17
are beneath cities that cannot be moved or under areas of natural beauty that the government won’t
allow disturbed. Perhaps the seams are too thin to mine, or are in areas close to fault lines or subject to
subsidence, or simply that the quality of the coal and the costs associated with its extraction means it
is no longer a source of energy but rather a sink. Underground mining can have high processing
losses of 25% or more as pillars of coal have to be left behind to support the mine. Similarly treating
coal to remove rocks, partings and other impurities, dilute the net energy from the coal as does the
extensive washing necessary to lower the sulphur content. “The single most important result to note
from the CARS (coal availability and recovery studies) evaluations is the fact that the amount of
economically recoverable resources for all the areas evaluated represents only a relatively small
fraction (4 percent to 22 percent) of the original resources. This result stresses the need to use coal
resource terminology carefully, avoiding the use of the terms “resources” and “economically
recoverable resources” interchangeably.
Bringing back previously abandoned mines is extremely expensive. All the supports, infrastructure
and capital equipment need to be replaced to ensure sufficient margins of safety. When the mine was
new this cost would have been distributed over the much larger and presumably higher quality
reserves that have since been extracted, whereas now it has to be paid for by the residual coal. If it was
not economic to extract when it was in full operational order, it can only be economic today if other
competing mines have deteriorated even further.
The sad reality is that the United States went through peak coal production in terms of energy back in
1998 at 598.4 million tonnes of oil equivalent (Mtoe) according to
http://www.energywatchgroup.org/fileadmin/global/pdf/EWG_Report_Coal_10-07-2007ms.pdf -
(603.2 Mtoe according to BP World Energy Statistics). Whilst total coal production has been steadily
rising by about 20 million tons per annum since 1960, the higher energy content Anthracite and
Bituminous coals peaked in 1950 and 1990 respectively. The high grade coals have increasingly had
to be compensated for with lower quality Subbituminous and low quality Lignite coals. The volumes
that need to be burned to generate the same heat value are 20% and 120% more respectively. That
means more needs to be mined and transported. When adjusting for the costs of making and running
the trains, the net energy subsidy from the coal falls still further. Whilst US coal exports have been
fairly consistent on a tonnage basis, on a net energy basis they are down almost 90% from 1980 with
the exception of 2008 and 2009 when weak domestic demand due to the recession freed up some
production for export. Increased safety measures in response to recent disasters will also reduce the
productivity and negatively affect output.

22/02/2012
18
Coal: Resources and Future Production
Energy Watch Group
The average heat value of Bituminous Coal is 12,750 Btu’s per pound,
some 21% higher than Sub-Bituminous (10500 Btu/llb), which is itself,
75% higher energy content than Lignite (6,000 Btu/llb). Anthracite
has by far the most energy content, similar to oil at around 21,000 Btu/lb.
According to the USGS, since 1970 the Appalachian and Illinois Basin’s production has fallen from
85% - 90% of US coal annually to about 43% today. Over the last 2 centuries a large proportion of the
coal has come from relatively few counties in south western Pennsylvania, northern and southern
West Virginia, eastern Kentucky and Virginia. Many of these counties are now decades past their
years of peak production, and several are almost depleted of economic deposits of coal. Central
Appalachian production fell 20% between 1997 and 2007 and further aggressive falls are expected as
high grade surface coals are gradually exhausted, only to be replaced by lower quality and deeper
seams that need more workers and capital to extract.
As a mine goes deeper, disproportionately more rock and earth needs to be removed to safely access
the seams. Greater amounts of fixed capital are required to secure the mine, needing oversight from
more engineers and monitoring systems. Operationally, the deeper it goes the higher the temperature
rises, requiring more ventilation. More pumps or more powerful pumps will be needed to extract the
same amount of water from the mine. More operational staff are required. Overall, expenditure grows
in excess of depth.
Illinois Basin coal production is down because regulations priced out the high sulphur coal, some of
which is now exported, however with 40 new coal power plants coming on stream in the next few
years, the likelihood is that the US will have to relax its clean air rules and accept higher sulphur
coals, perhaps forcing power generators to install scrubbers on existing power plants, reducing
efficiency. Alternatively it can burn low sulphur coals from the Powder River Basin, but these are also
low energy coals and therefore involve burning greater volumes to get the same heat. The idea

22/02/2012
19
therefore that the US could divert 40% of its coal output to coal-to-liquid technology to produce just
10% of its oil needs is quite frankly laughable.
It is very clear that the US has already suffered peak production of high quality coal, and will have to
accept either lower energy, or higher sulphur coal to meet its needs. Either way, as the EROIE falls
and more coal has to be burned to access the same net energy, the estimates of coal reserves will have
to be lowered accordingly.
Whilst the US has the largest coal reserves in the world, China is by far the largest producer,
depleting its reserves at an aggressive pace. Chinese domestic coal production is expected to have
peaked by 2015. The chart below from the Energy Watch Group, using US EIA data, suggested that
production would peak at about 2.5bn tonnes around 2015 before falling. This has proved too
pessimistic, however in early 2009 the Chinese Ministry of Land and Resources said that production
would peak at about 3.3 billion tonnes in 2015.
Coal: Resources and Future Production
Energy Watch Group
At the time, the forecast equated to production growth halving to about 4.8% per annum before
stagnating. The only way it would be possible to maintain 9% or 10% economic growth in that
environment was for imports to soar, which is exactly what happened. From exporting 4.6m tonnes in
2008 China imported 104.25m tonnes in 2009. Eight months into 2010, its imports are annualising at
141m tonnes, equivalent of 4.7% of domestic production, which combined with domestic growth
should enable the economy to expand at target. At 5.0% pa domestic production growth, it is now
estimated that China’s stated coal reserves will be exhausted in just 21 years. The latest 5 year plan
for the period 2011-2015 is slightly more optimistic suggesting production will peak at between 3.5bn
and 3.8bn tonnes by 2015, leaving a shortfall of 400m to 700m tonnes against the planned
consumption of 4.2bn tonnes. Even China’s National Development Reform Commission (NDRC) has

22/02/2012
20
told provincial governments to lower their growth targets as there is no longer the land, water or
energy resources available to support double digit economic growth.
Haizhou Mine, the largest open-cast coal mine in Asia was declared resource bankrupt in 2005. Some
of China’s mines are in excess of 800 metres deep and its reserves are estimated down to 1500 metres
deep, which for a bulk commodity such as coal adds heavily to the expense, not least in human cost as
7 miners die every day on average down its mines. With traditional resources being depleted, Inner
Mongolia and Xinjiang are increasingly seen as the key domestic areas such that in July 2010 the
National Development Reform Commission announced a CNY682bn (USD100.8bn) stimulus plan to
develop their reserves. Despite it being very low energy coal at around 4500 calories per tonne and
having to be transported over desert, the Inner Mongolian coal is expected to reach 25% of the
country’s total output by 2015. With insufficient local water supplies, desalination plants will be
required according to the regional Xilingol government, lowering the net energy available from the
coal still further. Xinjiang coal is much better quality, but at a distance of 3000 kilometres from
Beijing, transporting the land-locked coal will significantly reduce the net energy reserves; power
transmission for example loses about 10% of the energy every 1000 kilometres. The third area to
benefit from the stimulus plan is Tibet which will provide the resources necessary for extracting and
transporting the coal.
Despite being the world’s largest producer of coal, China now imports more than 2% of world
production, equivalent to over 20% of all coal traded internationally. India, the world’s 4th largest
producer anticipates the need to import 100m tonnes in 2010/11, up 22% y/y according to the coal
industry regulator. It estimates that coal-fired power capacity being added over the next 5 years
amounts to 62.68GW requiring an additional 313m tonnes of coal against the 100m tonnes Coal India
says it can produce domestically. That could result in 42GW of stranded power capacity equivalent to
17.8% of India’s total. Adding this 213m tonnes of annual coal imports over the next five years
together with China’s 400m to 700m tonnes laid out in its 5 year plan requires a jump in world coal
production of between 8.4% and 12.5%, or a near doubling of internationally traded coal. This leaves
the United States and Australia as the only two of the top 4 producers globally that are also exporters.
The top 4 producers accounting for 74.3% of global production will collectively be a small net
importer by 2011, competing with other big economies such as Germany, Japan, South Korea and
Britain for coal imports.
South Africa, Indonesia and Australia have all launched heavy rail and port infrastructure
programmes to enable production to be stepped up, but even China recognises that there is no way
that these countries will be able to meet its needs. In return for a USD6bn loan, Russia has agreed to
boost supplies from 12m tonnes to 15m by 2015 and 20m thereafter, but again the huge distances
involved will reduce the net energy to a minimum. Both China and India also need to invest heavily
in infrastructure to allow imports to be unloaded and transported inland, opening up clogged arteries,
whether they are road, rail or power transmission lines. China’s Ministry of Railways notes that
“While the country has witnessed double digit economic growth since the opening policy, its railways
grew only about 1% between 1978 and 2004”. Although there are major plans to expand the nation’s
network, which already stretches to 86,000 kilometres, most of the work involves high speed rail links
which can only be used for passengers. “The extra cargo capacity only comes when existing resources
become redundant due to upgraded passenger services”.
In a new study published in the international journal Energy, two American professors Tadeusz
Patzek and Gregory Croft suggest that like the United States of America, the energy content of South
African coal peaked in 2007 although volumes continue to rise. This is supported by the utility Eskom
which briefed parliament early in 2010 that it was losing 1GW of power each day because of the poor
quality coal it was being supplied. David Rutledge, a professor at the California Institute of
Technology forecasts production to peak in 2011 at 253m tonnes vs 242m in 2010, whilst geologist
Chris Hartnady, in a paper to be published in the South African Journal of Science forecasts peak
production not until 2020 at 285m tons. These later two forecasts are just talking tonnage and
therefore may still be consistent with the energy content falling. In February 2011 the South African
Mining Minister said action would be taken to ensure domestic coal needs are prioritised over exports
as Eskom faces serious challenges securing long term coal supplies as domestic consumers cannot
compete in a free market with the prices paid for exports.

22/02/2012
21
Mongolia is starting to open up its reserves, however large investment in road and rail, as well as the
establishment of an industrial park to process the resources and keep as much of the value added
domestically, driving an expected 8-fold increase in its economy over the next 10 years, will leave
little coal for export. Again the fact that it is landlocked, covered in desert and has vast distances to
cover means the cost of transport will take a large bite out of the net energy reserves. Money is also
being poured into Mozambique by both India and Australia to develop its small reserves, but once
again the need to build the infrastructure necessary to extract the coal means that a large proportion of
the value added will remain within the country itself leaving less energy for export.
Vietnam has said that its exports will slow from 25m tonnes in 2009 to 18m in 2010 as domestic
production falls. It expects to turn a net importer by 2012. Its top mining company Vinacomin has
started to mine coal in east Siberia, and is carrying out exploration in Laos and Cambodia.
Indonesia’s production has risen by 14% per annum since 2000, however its reserve to production
ratio has fallen from 68 years to just 17 years over that period. As it builds 10 GW of new power
plants, domestic consumption is expected to double over the next couple of years, reducing the amount
available for exports. In 2008 the Indonesian energy ministry even suggested that it would ask for
royalty payments from the coal mines in coal rather than cash as a way of ensuring that production
remains available for domestic use. Similarly Indonesian producers have demanded equity stakes in
Indian power producers for long term supply contracts, thus transferring more of the value added back
to Indonesia.
Since 1868underground coal gasification (UCG) has been experimented with. Rather than mining
deep seams, wells are drilled and oxygen or air injected to burn the coal underground and convert it
into gas which is then brought to the surface through a second well. The gas is then used in a power
plant. High pressure combustion decomposes the coal and generates carbon dioxide, hydrogen, carbon
monoxide and small quantities of methane and hydrogen sulphide. The pace of the burn and
extraction is controlled by the injection of oxidants. Initial hydro-fracturing is necessary to open up
internal pathways in the coal to allow the oxidants and residual gases to flow. Underground coal
gasification allows access to coal resources that are not economically recoverable by other
technologies; seams that are too deep, too thin or too low grade. Some studies do suggest efficiency of
UCG and combined gas cycle turbine of up to 43% which would be better than pulverised-coal-fired
stations, although there are environmental costs. The size of the cavity left behind cannot be
controlled in the same way as with traditional mining, opening up the risk of much greater
subsidence. Similarly the high pressure combustion can force contaminants including the carcinogen
benzene into potable groundwater. Whatever the efficiency and the cost, this technology does offer an
extension to available fossil fuel. http://www.energybulletin.net/node/11901 suggests that there are 3
trillion tons of coal under the North Sea off the Norwegian coast, more than 3 times today’s proven
and recoverable world reserves. This would have to be exploited using UCG technology but for the
moment it is not available for under water exploitation, and the concerns over the scale of carbon
dioxide release are simply too high to make it politically viable. Similar obstacles were eventually
overcome with North Sea oil laying the ground work for drilling at vastly greater depths and in more
inhospitable waters around the world.
As becomes more obvious later in the book, it was Western demand for energy that drove China’s
growth over the last 20 years, not the other way around. With China now reliant on imports of coal to
sustain its economy, it will pass the baton of economic growth elsewhere to places like Mongolia,
Australia and Indonesia. Capital seeks out the highest return, but with higher quality coals exhausted,
it has to keep chasing the EROIE lower, shifting growth to wherever the marginal coal is. Looking
back at the history of coal, this was highlighted as far back as 1863 by the British industrialist Sir
William Armstrong who predicted that Britain would lose its dominant position in the world because
her coal seams were getting deeper and more expensive to exploit than those in the United States. “It
is clear that long before exhaustion, as coal has to be lifted greater and greater depths that the US will
be working more accessible beds at a smaller cost and will be able to displace the English from every
market….The question is not how long our coal will endure before absolute exhaustion is effected, but
how long will those particular coal seams last which yield coal of quality and at a price to enable this
country to maintain her present supremacy in manufacturing industry”. (The coal question by W
Stanley Jevons. Dodo Press).

22/02/2012
22
Over the following years Britain maintained its standard of living by selling technology to the United
States. Once that was exhausted, it ran up large debts, eventually taxing the British Empire to
breaking point. Similar aspects are clearly visible today with the US selling technology to China,
building up large debts, and having the dollar standard gradually challenged.
http://www.energybulletin.net/stories/2010-10-21/cost-energy-imports-uk-trade-balance
British coal production didn’t peak until 1913, a long time after it had become economically inferior
to the high quality US coal. Despite miners being paid much lower wages in China, energy for energy,
domestic coal prices now trade at about a 30% premium to Australian coal before adjusting for
transport costs. Whilst domestic production may continue to grow, it seems likely that the premium to
international prices will continue to widen. Chinese demand will undoubtedly lift international coal
prices, but the scale of the market is simply not big enough to meet its growing needs. International
trade in coal has remained relatively small due to the high costs of transporting bulky low quality
energy, and as that quality deteriorates still further, so this will put big importers at an increasing
disadvantage to domestic industry. With China’s poor quality domestic coal effectively setting the
price of international coal, its competitiveness will gradually suffer in the same way that Britain’s did
100 years before. Its cost of energy will rise relative to the rest of the world and the energy network
will gradually migrate to those countries enjoying the cost advantage of their own coal supplies. In
order to offset the deteriorating quality of domestic coal production and maintain the same net supply
of energy, the gross production will have to increase still further making its economy more energy
intensive and therefore less competitive. China will have no choice but to sell down the capital it has
accumulated over the last few years in order to maintain its standard of living.
Both detailed field analysis and fitting curves to production profile data suggests that global
production will peak around 2015 and then plateau to 2040 before declining. It should not however be
volume that interests us. It shouldn’t even be gross energy, which has already peaked in the United
States case at 598.4 million tonnes of oil equivalent (12.1m barrels per day), but rather the net energy
after adjusting for higher extraction and transport costs. Having said at the start of the chapter that
coal is set to regain its position as the dominant energy source by 2012/2013, it is not the fact that it is
a dirtier and inferior fuel that should be our main concern, but rather that the cost of extraction and
turning it into useful work is rising, and the net supply of energy may also be peaking.
Chapter 4

22/02/2012
23
Unconventional Gas and Thorium Fission. Game Changers or
Unsubstantiated Hype? One hundred years of gas supplies and 100 years of nuclear fission……according to the fairy at the
bottom of the garden.
The third primary fuel that has to be examined is natural gas. Conventional production was suffering
similar fate to both oil and coal, only perhaps more so. Anyone who has opened a bottle of champagne
knows that gas moves of its own accord to the area of least pressure. Drill a hole in the ground and the
gas will escape very quickly until the pressure in the well is similar to the atmospheric pressure
outside. Valves obviously control the supply, but economics mean that it is preferable to recover the
gas, and therefore get a return on capital, as quickly as possible. This is particularly the case at the
moment given the need to service large amounts of debt on the producer’s books. The race to the
lower EROIE reserves has therefore been faster than with other fuels.
In the United States well productivity fell nearly 75% from 1991 to 2007. The production per foot
drilled fell even faster, such that the EROIE of conventional gas reserves was expected to fall below
one in the near future. Technology that allowed shale gas reserves to be developed halted and reversed
some of the decline in 2008, although by August 2010 slightly more than half of that improvement in
well productivity had been given back. Just as the method of extraction is somewhat different to
conventional gas, so too are the economics. A process known as hydraulic fracturing is required to
free the gas from the non-porous shale. Several million gallons of water, in combination with various
pollutants, is pumped into the well under high pressure from one central drilling point, causing the
rock to crack or fracture. The water then needs to be disposed of in retention ponds. Once the gas has
been collected, the process is repeated penetrating deeper and deeper into the field through previously
made fractures. With each successive attempt, the cavern into which the water is pumped will increase
in size and therefore, with the pressure spread out over a larger surface area, the amount of shale that
will be fractured will deteriorate. The gas also vacates into an area which now has a similar pressure
to the external atmosphere such that the yield falls rapidly with each new fracture. By year 2
production rates have normally fallen by around 80% and continue to tail off. Each successive fracture
yields lower and lower returns, rapidly depressing the EROIE and the economics of the field. For the
gas company, the initial production and return on capital makes a lot of sense, but as the yield falls
the operational expense becomes harder to justify, often becoming negative cash flow after only 4 or 5
years. Both the economic and net energy lifespan of the field is reduced, and most of the reserves are
left uneconomic to recover. Without some mechanism to offset this decline in EROIE, the net reserves
will only be a fraction of the gross figures officials are touting. As with all commodities, the best
reserves are exploited first. Lower permeability and porosity means more fracturing required per unit
of output, and consequently significantly lower returns.
The annual decline rate of all US gas wells has been estimated at 32% according to the report Will
Natural Gas Fuel America in the 21st century? – (http://www.postcarbon.org/report/331901-will-
natural-gas-fuel-america-in). Every year, just to stand still, new production equivalent to 1/3rd of
outstanding production has to be brought on stream. Chesapeake Energy has estimated that as of the
year end 2007 nearly half of US production came from wells drilled in the preceding three years.
There are now more than half a million producing gas wells in the United States. The decline rate of
production of shale gas is around three times that of conventional gas and with wells spaced no more
than 40 to 80 acres apart compared with 160 for conventional gas, the rig count will rise
exponentially. Defending the shale gas industry, Chesapeake themselves said in June 2011 the
industry had created more than half a million new jobs in the preceding 7 years, which although
presented as a positive is indicative of the declining well productivity of the industry. Hydraulic
fracturing is thirsty work requiring between 2 million and 8 million gallons per well, both draining
available supplies of water and requiring safe storage and disposal. Requiring “hundreds of truck trips
for each well to move the drilling rig, storage tanks, water proppant, chemicals, compressors, and
other equipment”, the operational costs soon mount up, and with each successive fracture the EROIE
declines.

22/02/2012
24
In the mid 1990’s well productivity also spiked higher before collapsing back to the established
downward trend. The centuries old mining-hazard of Coal Bed Methane (CBM) was seen as a
significant new clean energy source. With 800 trillion cubic feet of reserves and tax credits given by
the US government, this was seen as the fuel of the future although today only 300 tcf are seen as
technically recoverable and 100 tcf are considered economically recoverable. As with shale, fresh
water is used to fracture the coal, whilst underground aquifers are pumped away from the well bore to
relieve the pressure that is keeping the gas contained within the coal, allowing it to flow via the well
to the surface. The aquifer has to be continually pumped to avoid recharge and the pressure
rebuilding, sealing in the gas. The scale of the water discharge is significant, and suffering heavy
concentrations of sodium chloride, magnesium, sulphate and boron, it cannot be used safely on the
land or allowed to get into the water table, and therefore must either be treated, stored in holding
ponds or pumped back underground, making it an expensive process. Whilst the British canals dug at
the start of the industrial revolution allowed coal to be transported, they also performed a second role
of disposing of the vast quantities of saline water. The barges were effectively floated on the mined
water. Just like shale gas which owes a lot of its technology to coal bed methane, the production rate
collapses by around 80% within the first year, and continues to fall thereafter. Using sand and other
chemicals to wedge the fractures open does increase the initial production and therefore deliver a
higher cumulative output, however that increase all happens within the first two to three months and
within 10 months or so, the flow rate is no better than without the chemicals. Shale technology has its
grounding in coal bed methane, and there is nothing at the moment that would suggest any different
outcome. In 2008 CBM accounted for 8.6% of US natural gas output, but with production typically
peaking at around 300,000 cubic feet per day and suffering this large decline, well productivity is
extremely low and costs are therefore high.
US gas production has been fairly static since the mid 1990’s and remains below the levels of the early
1970’s. Rapid acceleration in shale gas production has offset declines in conventional natural gas
extraction. The EIA forecasts show US domestic gas production as “stagnant through 2010 and barely
meeting tepid growth in demand through 2035”. Shale gas will increase from 23% of US natural gas
production in 2010 to 46% by 2035 but that will only be sufficient to support a 0.8% growth in total
gas output over that period - (http://resourceinsights.blogspot.com/2011/02/when-believers-stop-
believing.html). Production has remained at the high end of its range despite low prices and poor
profitability as producers have needed to service their debts, however with the EROIE declining with
each successive fracture, operational costs are soaring and cash flow declining such that production
will gradually be scaled back until prices rise. A case study of the Haynesville shale in Texas shows
actual drilling costs have been 40% - 50% higher than initial expectations with cash flow significantly
below forecasts even after adjusting for the low prices. Only 10% of wells are economic at prices of
around USD4.00 Mcf. Early entrants into the shale gas arena are selling their reserves at discounts to
the price paid to reduce their debt, whilst the buyers are the giants of the energy industry with the
balance sheet and cash flow to stay in the game until the prices rise.
The second main source of gas is liquid natural gas or LNG. This is conventional natural gas, but it is
sufficient distance from its potential market that the economics of transporting it via a special tanker
is better than through pipes. The gas is first cleaned of water, carbon dioxide and other impurities that
would freeze in the process. It is then taken down to a temperature of about -260 degrees Fahrenheit
or -162 degrees Celsius to reduce its volume to around 1/600th of its normal level to turn it into a
liquid. It can then be transported by special tankers in its liquid form before being unloaded and
allowed to return to its gaseous state. About 25% of the energy is lost in the freezing and transporting
process, increasing the cost and reducing the net reserves. LNG now constitutes around 30% of all
internationally traded gas, highlighting just how stressed the systems must be if this is the most
economic supply available. FLNG or floating liquid natural gas, where the LNG is drilled and
processed offshore, is also now required to most efficiently meet our energy needs. The US is
exploring the possibility of liquefying shale gas for export whilst Australia is considering the
economics of doing the same with coal bed methane. As described later in the book, this requires ever
larger amounts of technology and capital to be deployed, requiring large amounts of energy in the
initial construction and then operational phase.

22/02/2012
25
These unconventional methods of gas extraction and delivery are now main stream, opening up
production from all corners of the world. The fact that we need to use them confirms that the
traditional sources are unable to meet our needs, or at least are unable to meet them as economically
as these very resource intensive reserves. Most worrying of all is that whilst Shale, CBM and LNG
account for increasing proportions of our gas and total energy production portfolio, by their very
nature the net reserves will fall at an accelerated rate and the capital intensity of production will rise
accordingly. The production profile will see a rapid rise, offsetting the decay in conventional gas
production and giving the false impression of security of supply, followed by an early peak and rapid
decline.
Gas liquids technology described in the previous chapter is commonly known as Condensates as it is
just separating oil from a “humid” gas. It is also possible to turn clean natural gas into a liquid – Gas
to Liquid or GTL) - via a route known as the Fischer-Tropsch process. At a temperature between 150
& 300 degrees Celsius and at pressures between 1 and 10 atmospheres, cobalt can be used as a catalyst
for a chemical reaction which combines methane from natural gas with oxygen to form a combination
of carbon dioxide, hydrogen and carbon monoxide. This can then be refined into gasoline. The
process of upgrading the energy density consumes around 55% of the energy available. This is
somewhat better than coal-to-liquids where the gradient of the upgrade is slightly steeper, but it is still
a high price to pay. The resultant fuel also has 27.5% less BTU per barrel than oil so to arrive at the
same net energy content as gasoline, just over 67% of the energy has to be used in the upgrade. Until
now the high energy cost has meant production has been limited with the largest such plant, the Petro
SA GTL plant in South Africa producing 22,000 barrels per day (bpd) followed by Shell’s Bintulu
facility in Malaysia producing 14,700 bpd, however with desperate times calling for desperate
measures, Qatar is investing in the Pearl GTL facility with a capacity of 140,000 bpd. With high
EROIE gas reserves and a transport fuel trading at a premium, this 67% loss can be justified however
as the EROIE of the gas production falls the economics of the conversion will become prohibitively
expensive as South Africa is already finding out. Its GTL plant is fed from a gas platform 100
kilometres out to sea but this is expected to be exhausted by 2013 leaving deep water exploration
beyond the continental shelf around the Southern Cape the only potential source of supply.
As far as nuclear fission goes it is a similar story. Only one isotope, U235 is fissile such that at
sufficient concentrations, the natural slow neutron fission can start a chain reaction. U235 only
accounts for about 0.72% of all natural or crude uranium, and at the present consumption rate, the ore
grades will be depleted sufficiently that the EROIE falls below 1 in the next 20 to 30 years. At the
moment only Canada can boast reserves where the ore grade is greater than 1%. This means having to
dig, crush and extract through various processes 100 tonnes of rock to get just 1 tonne of natural
uranium. More than 2/3rds of the uranium stock has ore grades less than 0.1%. This will result in a
declining net energy return to fission up to about 2030 when the remaining ore grades fall below
0.02% and the EROIE falls below breakeven. U235 isotopes are concentrated in enriched uranium in
a centrifuge, but there are hopes that laser technology will allow the process to happen more
efficiently and therefore allow lower grade ores to be recovered sufficiently to generate a positive net
energy. The technology is expected to lead to a 20% efficiency gain; however it is also recognised as
getting close to the theoretical limit and therefore the end of the game.
The fissile quality of U235 makes it naturally rare and only found in small concentrations or low ore
grades, so the idea that there are large deposits waiting to be discovered makes little sense. Since
1993, under the Highly Enriched Uranium Agreement (HEU) Russia has been selling uranium from
decommissioned weapons through a consortium of companies which help convert the weapons grade
uranium to a lower grade suitable for power generation. This supply deal of 24 million pounds of
reactor quality uranium, which expires in 2013 has accounted for around 16% of the total, bridging a
gap between supply and demand and keeping prices restrained. Whilst it does still have further
stocks, much of it is contaminated and requires additional processing, the capacity for which is simply
not available. Without these supplies the market is likely to tighten very quickly, and swing to a
deficit of 7% by 2014.
Already in 2009 India’s Atomic Energy Commission said that the plant load factor of Nuclear Power
Corporation of India had fallen below 50% due to a shortage of uranium. The government owned
Uranium Corporation of India was operating 5 underground mines and 1 open cast mine as well as
22/02/2012
26
two processing plants. It was optimistic that opening a further 5 mines would enable it to lift the load
factor to 55% by 2010 and 65% by 2012, however it said that any new reactors would have to come
with a guaranteed life time supply of enriched uranium from the country of import.
Every so often one of the newspapers will run a story that Thorium or Uranium 238 are the magic
bullets and that there are sufficient reserves to make nuclear power for a hundred years. There is only
one problem with this however; they are not fissile. They are fissionable, but not fissile. They need to
be put into a U235 breeder reactor to breed into fissile Uranium 233 and Plutonium 239. Fast neutrons
from the U235 reactor core partially convert the non-fissile isotopes in a surrounding blanket of pipes
into fissile U233 or Pu239, adding to the chain reaction and creating a fuel that can be used in a
second reactor. The reactors are both more expensive to build and to operate. They require a higher
enrichment of U235, and they create weapons grade plutonium and have therefore been frowned upon.
Despite first being built in the early 1950’s, less than 1% of the 439 reactors in existence worldwide
are breeders. Certainly they could extend the useful life of our U235 supplies; however there is no way
that the numbers of reactors could now be scaled up to a sufficient size to make any difference in the
time remaining before our U235 supplies are exhausted.
The conversion or breeding ratio is the ratio of the new fissile nuclei formed over those consumed. It
is highly dependent on the energy of the incident neutrons. Breeder reactors therefore need to be run
at higher temperatures compared with normal reactors, so have to be cooled by liquid metal with its
better conductivity and lower neutron absorption rate. It needs a suitable melting and boiling point to
suit the operating temperature of the reactor, such that the risk of boiling and losing coolant is
reduced. Similarly it must not be corrosive to the structure of the reactor. Sodium best suits all these
criteria, but given that it ignites spontaneously with air and reacts violently with water producing
hydrogen gas, it also adds to the dangers and costs of a breeder reactor. Because of these dangers the
sodium in the primary circuit is not used directly to make steam to power the generators, instead
favouring intermediate heat exchangers to a secondary circuit which obviously acts to reduce the
efficiency of the power plant. To-date the technology is not economically competitive to normal water
cooled reactors although that will change as uranium supplies tighten and of course if the technology
is developed. The breeding ratio achieved has been about 1.2 – (2.4 neutrons are produced per U235
fission of which 1 is used to sustain the reaction, 1.2 is used to turn the U238 into Pu239 and the
balance is lost due to inefficiencies) – producing enough excess fissile fuel over about 20 years to fuel
a second similar reactor.
Natural uranium consists of 0.72% U235 and 99.27% U238. In the enrichment process, each kilogram
of natural uranium is typically converted to 0.15kg of enriched uranium and 0.85kg of depleted
uranium. Around 73% of the U235 is captured in the enriched uranium, lifting its concentration to
3.5%, whilst reducing it in the depleted uranium to about 0.2%. The depleted uranium is typically
used in armour piercing shells for military purposes due to its dense nature. The enriched fuel has a
useful life in a reactor of about 5 years during which time only about 5% of all the atoms fission. To
get a higher conversion rate, the hotter temperatures of a breeder reactor are required, either from the
outset or to fission the removed waste fuel from water cooled reactors more completely.
For 30 years US government policy has banned the reprocessing of nuclear waste as both too costly
and too risky as it creates weapons grade plutonium although France, Britain and Russia reprocess a
small proportion of their waste. Spent fuel is dissolved in hot nitric acid which separates the waste
into 96% uranium, 1% plutonium and 3% highly radioactive waste. As you would expect far more of
the fissile U235 has been consumed in the reactor leaving the composition of the waste uranium
mainly U238. Only about 0.4% - 0.5% is U235. It also has small amounts of U232 which, being a
high gamma emitter makes it difficult to handle, as well as U236 which is a neutron absorber
meaning that to be used in a conventional reactor, the fuel has to be enriched from this lower base to a
level some 10% - 20% more than is required for natural uranium, making it about 3 to 4 times more
costly and unfortunately therefore, uneconomic. The presence of U232 requires radioactive shielding
and dedicated enrichment facilities. Alternatively the reprocessed low enriched uranium can be
blended with the plutonium to create Mixed Oxide or MOX, however the processes involved create
radioactive dust. Some people also fear the use of plutonium would lead to a higher proliferation risk.
The use of MOX changes the operation characteristics of a reactor, running hotter due to lower
thermal conductivity and therefore making it more suitable for Fast breeder reactors with their liquid

22/02/2012
27
metal coolant. Nevertheless about 30 thermal reactors in Europe have been modified and can use
MOX for about 30% of their fuel core at any one time. Of the total nuclear fuel used today MOX
provides just 2%.
There are proposals to use the greater energy from a fusion reactor (see Chapter 12 Going Critical) to
turn the waste fuel into useful energy. Whilst we have not yet achieved self-sustaining fusion whereby
net energy is generated, the scale of neutrons being released would be sufficient to cause further
fission in the nuclear waste, however scientists are not certain whether such a hybrid fusion fission
reactor would create net energy and therefore be a bridge until we do eventually have fusion energy or
whether it would simply be an energy intensive way of disposing of nuclear waste.
All reactors breed fuel; however the breeding ratios are low compared with machines typically
considered breeders. By increasing the U235 percentage enrichment, the fuel can last longer in the
reactor and therefore increase its efficiency. Current commercial power reactors have achieved
breeding ratios of roughly 0.55 however next generation designs should have breeding ratios of 0.7 to
0.8, improving their fuel economy by about 15%. Up to 1/3rd of all electricity produced in our current
reactor fleet comes from bred fuel, and the industry is working steadily to increase that percentage -
http://www.3rd1000.com/nuclear/nuke101g.htm. Of course the energy required to initially increase
the U235 enrichment percentage will weigh on the efficiency gain.
The success of fission has been limited due to insufficient investment and development, partly because
of the anti-nuclear movement and also because the high costs and inefficient nature of the existing
under-developed technology compared with oil. Had government the foresight, the science would have
been significantly further advanced by now and the costs lower. As you will find out later in the book,
this is an on-going theme of both government and the financial markets pandering to short term
profitability rather than long term productivity, hence the present situation of resource constraint and
the low level of scientific and economic advancement we have become accustomed to.
As traditional fossil fuel resources are depleted, utilities worldwide are investing heavily in nuclear
fission, drawing down on the limited uranium reserves that much faster. China for example plans to
lift its nuclear production from 2% of its power generation to 7% by 2020. Even the tiny oil emirate
Kuwait is said to be planning to build, or purchase 4 nuclear reactors as it suffers severe summer
power shortages. Every available fuel source is being utilised, and as the efficiency of extraction falls
so the energy and resource intensity of GDP rises. Both the increased logistics needed to extract the
resources and turn them into useful work, and the higher marginal propensity of energy intensive
consumption from bringing the resource intensive emerging markets’ workforce out of poverty, all
add to a vicious circle.

22/02/2012
28
Chapter 5
Alternative Energy is no alternative. Having consumed 100 million years of fossilised sunshine growing our economy to its present size, we
will now attempt to sustain and expand it further on nothing more than the annual stream of solar
power. God help us.
Green or alternative energy is widely seen as the future. It is not. It is the past. The world abandoned
biofuels, wind and solar power several hundred years ago, replacing it with greater quantities of much
better quality fossil fuels. China exhausted its supplies of timber 500 years ago and Britain suffered
shortages before the Industrial Revolution when our economies were a mere fraction of where they are
today. We are expected to believe that feeding grass to a tractor rather than a horse will allow us to
maintain our present living standard, and the diversion of land won’t affect food supplies which are
already stressed. We are being taken for fools.
http://www.theoildrum.com/node/6954 highlights two studies on small wind turbines. The first tested
12 machines in the very windy flat Dutch coastal province of Zeeland. Forty seven one diameter
machines or two five diameter machines were required to meet the average Dutch person’s annual
power consumption. For the average American the numbers would be three times bigger. In the
second study, twenty six turbines were tested in urban areas throughout the United Kingdom. Half
were attached to the façade or to the roof of single family dwellings and the others were attached to
the roofs of apartment buildings. On average, the turbines achieved an annual output of 78 kWh per
machine, just 0.85% of the capacity stated by the manufacturers. Stripping out the down time due to
technical problems, damage and maintenance, the efficiency jumped to 4.15%, but of course that is a
genuine cost that needs to be taken account of as does the energy consumed in the process of repairing
the machines which the survey did not adjust for and which would surely have lowered the efficiency
still further. The best performing machines had to be shut down because of noise pollution which was
an unexpected problem. The study also revealed that the clever electronics in the machines consumed
29 kWh of electricity per annum, reducing the efficiency down to just 0.53%, and turning some of the
smaller wind turbines into energy sinks even before accounting for the energy cost in the initial
building of the machine and its installation. The article points to a third report by the UK Carbon
Trust; Small-scale wind energy:Policy insights and practical guidance which was prepared for
government policy makers, which says that the energy payback for small wind turbines in an urban
environment is always more than 20 years compared to the warranty of between 2 and 5 years.
Moving away from the Mickey Mouse to the large scale turbines and wind farms that are being rolled
out around the world, the efficiency is generally thought to run at around 20% to 30% of stated name
plate capacity, although data suggests even these numbers are optimistic, with for example Germany’s
wind farms delivering just 17.5% of capacity in 2009. Unfortunately these numbers need to be
adjusted dramatically. Our energy consumption follows a regular pattern through the day whilst the
wind power doesn’t discriminate between peak and off-peak demand. There may be as much power
generated during the night when there is little demand, as there is during the day. It needs to be stored
and then fed back into the system when the demand is there. Wind also varies minute by minute
which is no good to anyone. It varies through the seasons and over time there may be large cumulative
variability.
Nameplate or rated capacity measures the maximum output of the turbine and is typically based off
wind speeds around 15 metres per second or Force 7 on the Beaufort scale (“high wind, moderate
gale, near gale), which covers the range 13.9 – 17.1 metres per second or 31 – 38 miles per hour. The

22/02/2012
29
power available in the wind is proportional to the cube of the wind speed, so halve the wind speed to
what would be Force 4 / Force 5 (“moderate breeze” to “fresh breeze”) and the output will fall by
87.5%. Of the 20% - 30% of rated capacity actually produced, around half of that is generated in just
15% of the time, making variability and intermittency of power output a huge problem. To ensure
safety of equipment the turbines have variable pitch blades to feather the wind energy and restrict
output to the rated capacity, with complete cut-out at speeds around 20 - 25 metres per second, giving
only a very narrow window of efficient operation.
In this excellent piece of research – (http://www.theoildrum.com/node/6641) - Hannes Kunz of the
Institute for Integrated Economic Research (IIER) highlights that that averages of wind energy can be
made up of extended periods of above or below normal levels. Using 2009 wind data for the UK and
assuming a 20% market share for wind and an optimal geographic mix of the turbines in 50 locations
to collect the wind, the result was a cumulative power deficit as per the chart below. The storage
capacity needed to compensate would be huge. Hannes pulls apart the idea that we could use the
batteries in electric cars to act as the storage, calculating that to bridge the largest supply gap in 2009
would have required 96.5m battery operated cars with 40kWh batteries each fully available for
storage. Not only is that 3.4 times the size of the existing UK car fleet of 28.5m private vehicles, but
the implication is that none of those cars could be used for driving whilst they are acting as storage.
http://www.theoildrum.com/node/6641
How do you therefore equate a variable supply with a steady demand? We simply could not be flexible
enough to adapt our lifestyles and economies to match the supply so we need to modify the supply to
meet the demand. Our water system does exactly that. Variable rainfall is smoothed by being collected
across the land as a whole, gradually transferred to rivers, underground aquifers and reservoirs. It is
then distributed and stored in the network of pipes and in our own hot and cold water tanks. The
waste water is then treated and cleaned and in some cases fed back into the system. As long as there is
energy, water can also be pumped across counties and states and lifted from underground storage. It
can also be cleaned, and if necessary sea water can be desalinated. Even when water was being used as
an energy source, in for example textile manufacturing, sluice gates and reservoirs were necessary to

22/02/2012
30
turn what would otherwise be a variable supply into a constant source of power necessary for the
looms and other equipment to operate efficiently.
Storage for wind power would have to follow a similar route. The wind energy would have to be
converted into electricity, and that stored via hydro if there is sufficient capacity, but otherwise
through one of several options, the most likely of which is through electrolysis to split hydrogen and
oxygen from water. The hydrogen could either be used to power fuel cells, run internal combustion
engines or power generators. Each of these processes is extremely energy intensive, such that the
round trip process would lose around 80% of the energy. Simply smoothing the flow of energy into a
useable stream reduces the efficiency from 20% - 30% down to 4% - 6% of nameplate capacity.
Maintenance, cleaning and general wear and tear will cause downtime and reduce output even further.
At the moment the percentage of our energy portfolio coming from wind is so small that the
variability does not need to be accounted for as any shortfalls can be brought on stream immediately
from fossil fuels, but the reduced efficiency associated with this variability will be a genuine hurdle
that needs to be overcome.
Denmark gets nearly 20% of its electric power from wind turbines, but due to the intermittency it sells
excess wind energy to Sweden and Norway at EUR0.35MWh and buys back hydro energy at EUR120
– EUR150MWh, making its electricity the most expensive in the developed world. Clearly this should
put the economy at a huge disadvantage to countries not using wind, however its dominance of the
international wind turbine market means that other countries are effectively subsidising its power
industry. For a few weeks during the winter of 2010, Norway’s hydro production slowed due to
freezing rivers, forcing both it and Denmark to turn to Germany’s nuclear and coal power stations to
meet its energy needs.
A modern turbine has a lifespan of around 20 years. Annual maintenance costs around 1.5% to 2% of
the original turbine cost, so 30% to 40% in total throughout its life. Offshore wind farms are more
expensive than onshore, requiring slightly more than double the initial investment, although the yield
is somewhat higher than somewhere of similar height inland where the wind is distorted by obstacles.
Offshore turbines suffer less fatigue from turbulence, but the corrosive nature of salt water and the
location means that the cost of maintenance is higher. At nameplate capacity, manufacturers suggest
energy breakeven in about 3 to 4 months which sounds incredibly attractive, however adjusting for the
maintenance cost and the fact that a lot of turbines will be out at sea, that would be closer to 9.5
months. Given that the turbines operate at around 20% to 30% of capacity, that reduces the effective
life to between 4 & 6 years, giving an EROIE of about 7.5 which is the generally accepted figure, and
not to be sniggered at. If however we adjust for the need to smooth the flow, then EROIE falls to about
1.26 which is pitiful, and when we further adjust for the “tail energy” inputs such as the food required
by the construction workers, the EROIE falls even further. In a fossil fuel constrained world, wind
energy can be a small part of an overall portfolio, but it can never be anything more than a bit-part.
Nevertheless it seems sensible to direct some of the existing fossil fuel output to the production of
turbines whilst their EROIE is still relatively high rather than simply using the fuel for yet another
useless consumer good.
The energy payback time of photovoltaic cells (PV) has been a very contentious issue for more than a
decade. Some studies claim that the energy used in the process of making the PV cell, will be equalled
by the energy content of the electric output within a few years of operation. Other studies claim they
will never return 100% of the energy input of the manufacturing, installation and maintenance of the
cell. This study - http://www.energybulletin.net/node/17219 - undertook a literature review to
determine the key assumptions and considerations included in the PV Life Cycle Analysis and
Embodied Energy analysis. It suggests the energy payback on a typical domestic sized rooftop grid is
approximately 4 years. “In addition, it was estimated that larger utility PV cell power stations would
have a much longer energy payback period” for the simple reason that modules mounted on existing
roofs do not need frames and other structures built to house and position them. The article summarises
16 different studies. Each gives a low estimate, which averages at 2.2 years and a high estimate of
7.653 years – (overall average 4.92 years). Several of the studies make obvious mistakes such as only
considering the electrical energy input and ignoring the losses in the generation, conversion and
transmission. They also fail to account for the silicon purification and crystallisation process as the
majority of silicon cells are made from off-spec material rejected by the microelectronics industry,

22/02/2012
31
rather than including the process steps that make the pure silicon in the first place. If the scale of
production was increased significantly, then certain materials such as gallium arsenide used for
doping the silicon would need to be mined specifically for the production process rather than as a
residual of aluminium mining and purification, therefore increasing energy costs dramatically.
The real problem however are that the studies make the same mistake as economists and most of the
rest of us. They ignore the “tail energies” required in the process such as the energy to build the road
on which the silicon was transported, or the energy required to feed the workers who built the
machinery for the manufacture of the PV cells. Rather than infinitely regressing the hidden energy
inputs, the easiest way to calculate the total energy embodied in a product is to use its price, and on
this basis solar cells never break even. When we adjust for the need for storage, which is exactly the
same problems as with wind, it is very clear that solar is simply not up to the job. As with tar sands
and other alternative energy, the very best that can be said is that multiplying their EROIE’s with a
fossil fuel feedstock can in some cases extend the lifespan of the fossil fuel; in no way however can it
stand on its own.
Contrary to popular opinion, there has not been much improvement in solar power efficiency since the
1950’s. Their history goes back to 1839 when the French physicist Antoine-Cesar Becquerel first
discovered the photovoltaic effect, with the first genuine solar cell built around 1883 by Charles Fritts
however it wasn’t until 1954 when three American researchers designed a solar cell capable of 6%
energy conversion efficiency that it became a feasible way of turning solar energy into electricity.
Today the efficiency levels have reached around 22% which is approaching the maximum theoretical
efficiency it will ever reach. The ratio of electric power to the light incident on the cell is governed by
the laws of physics, which give a theoretical maximum of around 26% for single spectrum cells. Solar
cells are effectively just LED’s (light emitting diodes) run in reverse. Just as an LED will only emit
one colour of visible light when exposed to an electric charge depending on the material used in the
semiconductor, so a solar cell will only collect energy from one particular part of the light spectrum
depending on the material used. Most cells are based on Silicon which only reacts with a limited part
of the spectrum, hence the efficiency limit of 26%. Efficiency improvements have instead been in the
production process rather than in the actual conversion of solar energy.
A common misconception seems to be the assumption that Moore’s Law can be applied to
photovoltaic cells. This is not the case; the laws of thermodynamics are not so generous. In fact from
the energy perspective we should view Moore’s Law as a problem as the doubling of the processing
power of new semiconductors every 18 months is not accompanied by a similar improvement in
energy efficiency.
More complex solar cells that effectively sandwich together semiconductors made of silicon, gallium
arsenide, zinc manganese and other materials, do give access to a greater proportion of the spectrum,
giving about 40% efficiency. They are extremely costly to produce which until now had limited their
use to spaceflight applications, where outside the Earth’s atmosphere the solar density is around 8
times that on the planet’s surface making the economics that much better. Solar arrays are starting to
be used to concentrate the Sun’s energy onto these cells, increasing their effective size although heat
pumps are required to keep the cell from burning up. In the 1970’s and again now, NASA and others
studied the prospects of putting solar arrays into space and then beaming the higher energy content
down to Earth either by microwaves or via lasers, however the cost is seen as multiples higher than
Earth based solutions.
Solar operates at around 12% of stated capacity. The efficiency is affected by cloud cover, the intensity
of the light which varies with the time of day and the time of year, the actual temperature which can
negatively affect resistance, rainfall and humidity and dust in the atmosphere and on the cells
themselves, and of course the position of the cells relative to the sun. One of the most revealing
anecdotes in my mind of just how far fetched solar energy is came from a book praising its virtues. It
highlighted that 15% of all the solar cells presently in existence are on calculators and some road
signs. Do we really think that we can scale it up to the extent that the solar cells are providing the
light for our offices rather than using that light to run a calculator? Do we think it can actually power
our road fleet rather than just illuminate a sign telling us to slow down? Solar and wind cannot be

22/02/2012
32
used as complementary energy sources; sometimes there is both wind and sun and sometimes there is
neither.
In October 2010 the New York Times had a special report on Energy in which it highlighted that a
thin layer of dust of just 4 grams per square metre reduces the efficiency of solar cells by 40%. In the
Negev desert, dust accumulates at 0.4 grams per square metre per day on average, whilst in popular
solar sites across the Middle East, Australia and India dust levels are even higher. Without regular
cleaning the efficiency falls rapidly. The proposed solution is a new coating which, when energised,
sends an alternating current over the surface repelling both positively and negatively charged particles
to the edges of the panel. The process draws a small amount of electricity from the solar cells, but is
seen as an acceptable cost to pay for the improved efficiency. It is about 90% efficient at removing the
dust, however unless there are going to be large gaps between each solar panel, it will accumulate at
the edge of the panel, gradually blowing back and lowering the efficiency once again. Photovoltaic
cells rapidly lose efficiency at high temperatures. Not only do they have to contend with heat from the
Sun but also that caused by inefficiencies within the cell itself making the ideal location somewhere
with bright sunlight but cold temperatures such as on the top of a mountain rather than in a desert.
Putting these doubts to one side and taking the 4.92 year energy payback period mentioned above, and
assuming a lifespan of 20 years and ignoring any need for storage, would it be possible to build and
sustain a power grid based on solar that could meet our present needs? The initial building out process
would have to use fossil fuels to generate a meaningful scale to begin with. If 5% of all our fossil fuel
production annually was diverted to building out a solar platform, then after 20 years we would have a
system that could generate 20% of our energy needs. However at that stage, the first of those cells
would need replacing. In year 21 and subsequent years more cells would need replacing. Given an
EROIE of 4 - (20 year lifespan / 5 years to reach energy breakeven), 25% of the PV’s grid would have
to be directed towards replacing ageing cells, reducing the power output to 15% of the economy’s
needs.
This is not what we are used to but on the surface it sounds a reasonably attractive figure until some
simple scenarios are examined. Assume by year 20, our fossil fuel production has started to peak and
decline which encompasses most optimists estimates. At that stage the solar grid doesn’t just need to
replace itself every 20 years, but it also needs to grow to replace loss of fossil fuels. If we therefore
used just 10% of the energy for consumption and used the 5% balance to invest in more solar cells,
then it would take a further 121 years (ie year 141) for the solar grid to meet our present energy needs,
long after our fossil fuels have been completely exhausted. By reducing our immediate consumption,
this could be brought forward, but either way it would mean significantly reducing the carrying
capacity of the Earth. Remember these numbers are simply turning the optimists’ figures on
themselves, whereas using a true EROIE, or adjusting for the storage necessary to turn an intermittent
energy source into a useable flow, the figures would be significantly worse.
The problem with all forms of green energy is that when we measure the EROIE, the supply of that
energy is delivered over a long period of time. If we are digging fossil fuels, we can scale up the
energy extraction very quickly by investing it straight back in the ground whereas with biofuels or
wind or solar we effectively harvesting a much slower, or less dense stream of energy which cannot be
compounded as quickly. Fossil fuels have been formed over many millions of years. The energy is now
in-situ, and extracting it is limited only by the energy cost of extraction. We simply cannot get green
energy at a faster pace than it is being delivered, so either we collect it over a long period of time or
over a very large area but this causes other problems as I describe in a later chapter. Inefficiencies in
collecting over a larger area reduces the very low EROIE still further, limiting the ability to
compensate for the low quality energy with more land.

22/02/2012
33
Before and After.
Carrizo Plain Solar Plant – Southern California
http://webecoist.com/2009/05/04/10-abandoned-renewable-energy-plants/

22/02/2012
34
Carrizo Plain solar plant, by far the largest in the world at the time consisting of 100,000 1 foot by 4
foot photovoltaic arrays located in one of the sunniest places in the state and built in 1983 was
abandoned in 1994 having never produced power competitively. In 2008 Spain invested more in solar
than the rest of the world put together. The consumer pays market prices but the government has
guaranteed significantly higher prices to the utilities. The difference was reported on Bloomberg
newswires to have risen by EUR4bn in 2009 to EUR16bn, forcing the government to backtrack on its
clean energy rates “to avoid damaging the competitiveness of industry”, however this has raised a
legal dispute whether it can cut the rates on existing solar power or whether the government
guaranteed the price for 25 years. Either way, whether it is the government, the utilities or the solar
companies, it looks like the above pictures may be repeated. As the New York Times says, “Spanish
officials came to realise that they would have to subsidise many of them indefinitely and that the
industry they had created might never produce efficient green energy on its own”.
http://www.nytimes.com/2010/03/09/business/energy-environment/09solar.html?hp.

22/02/2012
35
http://webecoist.com/2009/05/04/10-abandoned-renewable-energy-plants/
There are dozens of wind farms scattered around the western rim of the Mojave Desert near Tehachpi
pass. Many companies have come and gone, been bought or gone belly-up. Some of the turbines not
spinning have been derelict for decades. There is no law in Kern County that requires the removal of
broken or abandoned wind turbines, and as a result, the Tehachapi Pass area is an eerie mix of
healthy, active wind farms and a wind turbine graveyard.
Given that once the initial investment has been made and the turbine or solar panel built, then it is a
sunk cost and irrelevant to the continued operation of the turbine where the energy is free. The fact
that they are subsequently abandoned suggests that they can’t cover operational costs of maintenance
and cleaning, let alone the initial capital costs.

22/02/2012
36
Chapter 6
Energy Density As First Lord of the Admiralty, Winston Churchill hastened the conversion of British battleships from
coal to oil making them faster, reducing the time they need to be in-port for re-fuelling and reducing
crew numbers. With naturally available high density fuels running out, how will our new navy look,
and will we have an air force at all?
So far we have looked at the cost of energy, but we have yet to look at its value and the kind of work it
can do. Is it released at a high temperature very quickly or is it released over a longer period of time at
lower temperatures? Is the energy in a concentrated form and easy to transport, or is it diluted and
needs costly storage? How much capital equipment is required to release and control the energy? Can
one kind of energy be upgraded to change its profile, and what is the cost of doing so?
Most forms of energy are derived from the sun. If it is harvested immediately, it has relatively little
energy so large volumes are required to mount to anything significant. A herbivore for example
spends most of its time eating grass because of the low concentration of energy in its food. A
carnivore by contrast is able to get the energy in a much more concentrated form by eating the
herbivore, leaving itself time to relax in the sun. The amount of energy lost in the process of
upgrading the grass to meat is, I estimate around 91% judging by the fact that it takes 1,350 litres of
water to grow 1kg of wheat whereas it takes 16,000 litres of water to produce 1kg of beef. Cattle eat
grass rather than wheat and therefore suffer from a lower conversion efficiency of cellulose, but this

22/02/2012
37
demonstrates the general idea. The efficiency by which horses turn feed energy into horsepower or
useful work is generally recognised at just 4%, and yet this was our main motive power until the
Industrial Revolution and was still a major source of power until the 1930’s. It is however only the
final part of the food chain. The grass itself is already a relatively concentrated form of energy;
needing to return around 90% of its matter back to the soils to keep it sufficiently fertile and nutrient
rich to support further plant life. Accounting for the inefficiencies in photosynthesis and the
precipitation cycle, large amounts of energy have already been used in turning the energy of the sun
into a more usable and dense form. Energy always decays; hot goes to cold and high pressure goes to
low pressure, so to counter this process work must be done which means burning some of the energy.
Gasoline has a high energy density. It can release large quantities of energy relatively instantaneously
which gives it a great deal of flexibility that lesser density energy does not have. Coal releases energy
more slowly and at a lower heat. To turn that into motive power the chemical energy has to be turned
into heat energy and accumulated in a boiler before releasing as steam to move a piston or drive a
turbine. A car starts at the flick of a switch or turn of a key whereas an old fashioned steam engine
required a fire to burn for several hours before it could start to be operated. Even then, the power
released could never be as much as with a similar sized gasoline engine. Unfortunately, in order to be
able to call upon the power of a gasoline engine instantaneously, it has to be running, and this idling
of the engine when your foot is taken off the accelerator or when the car is stationary at traffic lights,
reduces the engine’s efficiency by about 16.5%, however it is still vastly more efficient than a steam
engine. An electric motor offers even more flexibility due to the still greater energy density of
electricity, doing away with the need for engines to idle at all and thereby waste fuel. The high density
energy adds to the efficiency of use as it can be provided on demand rather than as a continuous, and
therefore wasted supply, which is necessary for lesser forms of energy operating such things as belts
and line shafts. High density energy also allows miniaturisati
on which would otherwise be impossible. Electric appliances like vacuum cleaners, washing machines
and food mixers that revolutionised household chores and freed up women to enter the broader
workforce are just one example, but so too are computers which could never have happened with low
density energy.
Low pressure beam engines operate at just 5llb per square inch, and therefore need huge cylinders to
convert the energy into useful work. At such a low energy density, the machines could never be
suitable for transport; they were simply too big and too heavy. The efficiency of a heat engine is
determined by the temperature (or pressure) gradient between the combustion and the exhaust; the
steeper the gradient the more work will be done by the energy and the more efficient the engine will
be. High pressure steam engines, which normally operate at around 200 to 250 psi enable the energy,
transferred to the steam, to be released much more quickly and therefore much more effectively.
Nevertheless it requires more coal to be burned, and a large amount of heavy equipment to contain
and control the heat energy, such that whilst it is possible to power a ship or train, it is very unlikely
that the energy could ever be dense enough to power an aeroplane.
Coal burns relatively slowly because the air needed for combustion is only in contact with the surface
of the coal, and is further impeded by the build-up of ash. In modern power plants coal is pulverised to
a dust which can then burn much more quickly, although this preparation is energy intensive.
Different coals burn at different temperatures and cannot simply be substituted for one another.
Lignite coals used in power generators need much larger furnaces for the equivalent heat output as
they yield lower temperatures and require large fans to force the burn. As the quality of coal
deteriorates, the power utilities have to balance increased capital expenditure of modifying plant to
suit the different coal needs, against a lower thermal efficiency of not doing so. Blending coal can
offer a half-way house. Lower density energy has a second draw back which is that the increased
weight per unit of energy means that it can be very expensive to transport, so the very fact that coal
and gas is becoming increasingly internationally traded is yet another sign of the decreasing efficiency
of the energy market.
Clearly it makes more sense to power the generators with higher density energy, however risings costs
relative to the benefit means that oil has largely been priced out of US power generation since the
early 1980’s, falling by around 70% from 1980 to 2000 and being replaced by near doubling in coal
and gas consumption although the scale of coal growth can partly be explained by the deteriorating

22/02/2012
38
energy content. The efficiency achieved by gas, thanks to its higher density measured in terms of
joules per kilogram rather than by volume, which is less relevant for static uses, means it can achieve
50% conversion efficiency compared with only around 30% for coal plants. It is rather disturbing
therefore that coal is not just outstripping oil, but as a percentage of the world fuel mix, it has
outgrown gas by 5.6% since the year 2000 – (gas has remained fairly constant at around 24% and coal
has risen to just over 30%).
Economists leap to the simple observation that from the early 1970’s through the turn of the century
GDP outgrew primary energy consumption by about 2/3rds, a trend that they thought would continue
to improve. Unfortunately this measure of energy is purely based on the heat value, but when adjusted
for the quality and density of the energy, we find that the efficiency gains have only been about half
those stated and that much of the historic evidence for the decoupling of the economy from energy
consumption disappears. According to the Centre for Energy and Environmental Studies at the Boston
University, economic analysis “confirms a strong connection between energy use and GDP when
energy quality is accounted for”. Kaufmann finds that shifting away from coal more than explains the
decline in energy intensity of GDP over the entire period 1929 – 1999, however his studies used
original GDP data rather than the upward biases that have been a feature of GDP since 1984 as
explained by Shadow statistics – (http://www.shadowstats.com/article/gross_domestic_product). – and
used in the chart below.
US GDP & Primary Energy Use and Quality Adjusted Final Energy
http://stochastictrend.blogspot.com/2010/04/energy-mix-and-energy-intensity.html
From 1965 until 1978 oil, natural gas and nuclear power rose from 56.2% of the global fuel portfolio
to 68.0% where it remained until 2001. Oil peaked in 1973 at 49.2% of the mix but its gradual decline
since was almost perfectly offset by increased nuclear and gas production, replacing one high density
energy with another. By 2009 these dense fuels had fallen to just 63.8% of the mix leaving a gap to
be filled by low quality Chinese coal. This shift towards lower density fuel combined with the heavy
industrial usage in China has been sufficient to increase the global energy intensity of GDP. Unless
these trends reverse, or more fuel is upgraded into a sufficiently higher density form to compensate,
the economy’s efficiency will deteriorate. Any upgrading of low density fuels has to be to a level over
and above the primary fuel it is replacing such that the efficiency gain is sufficient to offset the work
done in that upgrade.

22/02/2012
39
World Fuel Mix 1965 – 2009 (BP Statistical Review of World Energy)
As we shift to these lower quality fuels, our capital equipment has to be adjusted accordingly. Just as
coal can’t be put directly into a car, neither can it be substituted for gas in a specific power plant, or
even for other classes of coal, although some power plants will try to delay the inevitable by blending
different coals and accepting a lower performance as is happening in India rather than investing in
new capital equipment. The more rapidly the energy portfolio deteriorates, the more capital spending
will be required to adjust the economy accordingly, again adding to the gross energy consumption.
Equipment can become obsolete either because the resources are no longer available to support the
technology, or due to location as resources in a particular area quickly become exhausted; capital will
pile in and then exit equally as quickly. In Europe for example it is estimated that we need to spend
EUR1trn on new and replacement power stations over the next ten years although a lot of this is due
to age rather than the changing fuel mix. Similarly as the location of the resources change, accessing
them needs totally new infrastructure to be built, perhaps new kinds of ships as with LNG, and often
new staff to be trained.
Just as a horse can turn grass into much higher density muscle energy, so by applying work, we can
lift the density of other forms of energy to suit our needs. Wood can be purified into charcoal and coal
into coke to allow much higher burning temperatures necessary for iron and steel furnaces.
Unfortunately the work done or energy lost in this upgrade can be substantial. Coal-to-liquids (CTL)
technology uses high temperatures and high pressures to extract gases from coal which is then
condensed back into liquid fuels. Further refining processes are then required to achieve high grade
fuel characteristics. The scale of energy loss is high at around 60%, even before carbon capture and
sequestration. To put this into perspective, if the fuel was then burned in a normal car’s internal
combustion engine, the efficiency from coal input to useful end work would only be around 4%, which
is not much better than the very first steam engines used to pump water from mines in the early
1700’s. Unless the EROIE of mining the coal is in excess of 25, there would be no net energy
produced, however the much greater flexibility and superior power distribution may still make it
appropriate. This could only be achieved by increasing gross energy production still further relative to
the net supplies. The energy content of shale oil or kerogen is less than 10% of conventional oil and
only about 40% of lignite and therefore not even suitable for power generation. If it was to be
upgraded into a higher density fuel comparable to gasoline, the process would have to be almost 100%
efficient for it not to be an energy sink.

22/02/2012
40
The CTL process was invented by Germany to power its war effort, but whilst it was better than
nothing, it was expensive and supplies were limited by how scalable coal production could become.
Some historians even suggest that the lack of cheap oil was the reason behind its Blitzkrieg tactics to
avoid getting bogged down in long drawn out battles it didn’t have the fuel to win. The technology
was continued by South Africa under Apartheid when it didn’t have access to oil, but it is now being
looked at by both America and China. The U.S. National Coal Council has been pushing for
government incentives to help build plants to generate 2.6 million barrels per day by 2025, the
equivalent of 10% of its oil needs. To meet 10% of the U.S. present oil consumption from the
technology would require 40% of existing U.S. coal production. The plans are to exploit the high
sulphur coals that are no longer used in power stations due to environmental regulations, instead
using clean technology to get over this hurdle. This would further increase the energy loss from the
process and therefore may be seen as very expensive, but it is a way of circumventing regulations and
making use of the coal reserves. Given the economics of the process, and the pollution that is caused,
the fact that it is even being considered suggests that oil is not as freely available as we are led to
believe. Historically it has only been used in wars or in apartheid when access to the international oil
market was unavailable, and yet TransGas Development Systems has confirmed that it will start
constructing the world’s largest CTL plant, to be called Adams Fork Energy in the Q2 2011 in Mingo
County West Virginia, China’s Shenhua Group has announced it will lift its CTL production in Inner
Mongolia from 500,000 tonnes of liquids today to 11m tonnes by 2020 as well as applying for a
second plant to be opened at Ningxia, and Coal India is seeking government approval to build India’s
third CTL plant.
Coal is widely used for electricity or power generation. About 70% of the energy is lost in the process,
which is known as rejected energy, but the greater flexibility that electrical equipment can offer over
and above gasoline, and the much better conversion efficiency of turning electrical energy into useful
work – (see chart below), means that it has been far more sensible to use coal in this manner than
either as a direct drive or as a gasoline feedstock. Whilst there is huge relative conversion efficiency
between electric power generation and other mechanical work, a large part of this benefit is lost for
transport if the electricity needs to be stored in a battery.
Accounting for Growth: The Role of Physical Work
http://www.iea.org/work/2004/eewp/Ayres-paper1.pdf

22/02/2012
41
Other alternatives to gasoline for transport fuel suffer similar disadvantages. Gas liquids have about
27.5% less BTU - (British thermal units which is a measure of energy) - per barrel than oil, whilst
ethanol has 45% less than oil – (3.2m Btu vs 5.8m Btu), and 35% less than gasoline. Conversion to
Btu shows that the liquid energy available worldwide was 3.3% lower in January 2010 than simple
volume statistics would suggest. To get the same mileage from a vehicle, more fuel would therefore
need to be carried. A similar problem is apparent with using liquid hydrogen. At room temperature
hydrogen gas contains less than one three-hundredth the energy of an equivalent volume of gasoline.
To make it into a liquid and therefore make it a much denser energy, it needs to be chilled to near
absolute zero to reduce the volume, a process that consumes the equivalent of about 1/3rd of the
energy of the gas. To keep it liquid at room temperature requires the tanks to be able to withstand
pressures of up to 10,000 psi, which means very heavy containers. Even then, liquid hydrogen takes
3.4 times as much space per unit of energy as gasoline. Transporting the fuel becomes very expensive,
requiring large gains in the conversion efficiency to compensate.
Whilst food energy is suitable for us, it’s not much good for electricity generation or modern
transport. Sugar has a relatively high energy density, hence why it can make us fat unless we burn off
the calories. Body fat has an even higher energy density, which means it takes a lot of low density
food to accumulate, but once it has built up then it takes an awful lot of exercise to burn it off again.
Corn has a much lower energy density than sugar making the uplift to a useable transport fuel more
energy intensive. Sugar’s higher density is explained by the climate in which it grows, the long days
of warm sunshine, the length of its growing period and the efficiency of the plant at harnessing the
sun light. Its better conversion efficiency into ethanol is also helped by using the cane itself as the fuel
to power the distillation process, without which its EROIE would fall dramatically.
The energy derived from wind or water passing through a turbine is directly related to the density of
the gas or liquid. At sea level, water has a density 784 times that of air meaning that at the same
speed or flow rate 784 more wind turbines of a similar size are required to harness the same amount
of energy as their hydro equivalent, making it that much more land and capital intensive. Using
pump-storage to smooth the flow of wind power would highlight exactly this issue, requiring only a
relatively small elevation differential between the reservoir and the hydro-station to balance a large
number of wind turbines. Unfortunately with around 16% of world power generation already coming
from hydro, it is a near fully utilised resource. With the exception of a few virgin rivers, capturing the
remaining energy from an already dammed up river system means accepting a much lower flow rate,
again increasing the capital intensity of the energy extraction.
If the combined EROIE from extracting the resource, upgrading it and then converting it into useful
work is less than 1 for an individual process or specific task like the coal-to-liquids mentioned earlier,
such that there is less work able to be done with the fuel than was involved in the extraction and
refining process, then that can be acceptable and be financed by the overall net supply of energy. It
may be expensive and is therefore usually limited to very specific tasks like for example rocket fuel,
but it is simply a case of prioritising the work done by the available net pool of energy. If however the
throughput EROIE for the entire market’s supply falls below 1 then there is simply no net energy
available. As more of our fuel has to be upgraded from lower classes of energy, so there will be an
increasing number of individual supply chains that will become energy sinks, such that our energy
needs will not be fully met. In this environment, market pricing is likely to be overruled by
government, and possibly by force in optimally allocating the resources.

22/02/2012
42
Traditionally we used energy in its simple low density form. We used sails, horses and mules to turn
wind and grass into motive power, and we used wind and water mills for mechanical energy. The low
density nature meant that little work could be done, and it was extremely resource intensive. The
famous Cutty Sark tea clipper for example, that was used to ship coal from Australia to China and
then tea from China to England, needed a crew of about 30 to control 32,000 square feet of canvas
sails. Its cargo was limited to just 600 tons and took about 100 days to sail from China to England –
(different sources give slightly different figures). By comparison the Xin Los Angeles ship is capable
of carrying 9,200 twenty foot containers in a fraction of the time and with a crew of just 19. Other
than in Third World countries, museums and cottage industries, and sailing yachts for pleasure, direct
use of low density energy simply cannot compete in the modern economy. Wind, grass and water or
hydro energy are now expected to be uplifted to much higher density energy, which will offer far
superior conversion efficiencies into useful work, but at the cost of a much bigger gross energy
consumption.
At this point I should note that specific energy is defined as the energy per unit mass whereas energy
density is the term used for the amount of useful energy stored in a given system or region of space
per unit volume, but for our purposes the terms are used interchangeably; the higher the energy
density the more energy available per unit of size or per unit of mass. It is a measure of the amount of
mechanical work that could be done per unit of volume or mass, assuming there were no inefficiencies
in equipment; no loss of heat or friction etc. Lifting energy to a higher density is achieved by simply
applying more work or more energy, however because of the inefficiencies, large amounts of energy is
lost in the process. The larger the gradient to be scaled the more energy intensive the process. In
nature, the upgrading of organic matter into oil, gas and coal took millions of years of applying
massive pressure and heat. The fact that we intend to upgrade the energy in a much shorter period of
time means that we have to bear a similar energy cost without the luxury of spreading it over such a
long period of time.
One consideration is that peat bogs and shale etc are in the early natural stages of being formed into
high density fossil energy, and yet we are already exploiting them. We have not just been consuming
down the high density fuels that were formed 100 million years ago, but we have been consuming
down all the fuels formed over the whole 100m year period in whatever stage of fossilisation they are
in. Not only are the fossil fuels being rapidly depleted, but so too are some of the much shorter stores
of energy such as top soils that take thousands of years to form, or even aquifers which indirectly act
as a store of energy. When you consider the amount of energy nature would have lost through the
inefficiencies of the uplift, can we really replicate this ourselves?
Throughout this book I have talked about energy being wasted or lost which will have wound up
people with a basic understanding of physics as energy can neither be created nor destroyed, but only
changed from one form to another. Without work being done, it deteriorates to a lesser order or
concentration. In nature, those lesser forms of energy are still exploited, eg the formation of fertile
soils through physical, chemical and biological or bacterial processes such as decaying plant matter,
the weathering of rocks, the work done by insect life processing and burrowing plant matter etc.
Clearly the Earth and Mother Nature is not a completely self contained system relying on the sun’s
energy, and its efficiencies in specific processes may be inferior to man-made technology, but as a
collective unit are its inefficiencies really so bad that we can hope to achieve a similar magnitude of
high density energy on a continual basis that it took the Earth millions of years to accumulate? Just
consider that whilst we may have triple expansion engines or the like to turn some of the waste energy
into useful work, Mother Nature has millions of different mechanisms also recycling that waste. To
reach or exceed these efficiencies, the replication of the micro organisms or machines that do large
amounts of unnoticed work seems necessary, which means Nano technology, however that also means
increasing the net energy consumption even further to initially produce and manufacture the Nano
machines.
It seems far fetched to believe that we can increase the conversion efficiency of turning final energy
into useful work sufficiently fast to offset the step-change we face in rejected energy. Do the benefits
from upgrading the energy outweigh the cost of doing so, or is it better to use the energy in its lower
density form with all the inefficiencies that entails? Either way, without significantly scaling up the

22/02/2012
43
gross energy market there will be a massive hit to our standard of living due to the reduced amount of
work that can be done.
Human advancement is closely associated with both increasing the net supply of available energy and
increasing its density. The security and better health associated with harnessing and controlling fire
and the greater time afforded to us when we moved from hunter gatherer to farmer are just two early
examples of higher density energy and higher EROIE. Even life itself is dependent on harnessing the
higher density energy of food that we cannot get directly from the sun. Whether it has been wind
energy or hydro energy in its early forms, or whether it has been low pressure steam, high pressure
steam, internal combustion engines, electricity or explosives used in warfare and mining, progress has
been driven by increased energy density. For the first time in history the energy density of our overall
fuel mix is starting to decline, and the cost of extracting more energy is starting to rise relative to the
work it can do.
Chapter 7
Area Efficiency Environmentalists might have their heart in the right place, but they don’t appear to have engaged
their brains. Replacing today’s high density energy with so called green energy will have devastating
effects on the environment.
To maintain the same net energy in a declining EROIE environment, the gross energy extraction has
to increase. Given the amount of energy being produced by the sun every minute of the day, some
people think this should not be a problem; however the decline in efficiency of extraction can only be
offset with more capital and technology, more labour, more land and more resources. Bringing in
marginal oil fields or other sources of energy means greater geographical diversification, and
therefore losing some of the economies of scale associated with production from one giant field. The
network of equipment required to tie it all together increases. This is termed Area Efficiency or
Energy Sprawl. As energy is the primary input into all manufacturing and services, a decline in its
productivity will adversely affect the economy as a whole, tying up more of its resources for energy
production and leaving less available for other channels of economic output.
This would be a hard enough challenge by itself, but as energy density falls, we either revert to
running the economy on these lower forms of energy or we lift the energy density to the levels
commensurate with our present expectations. As yet I have heard no discussion from politicians on
changing the shape of the economy to one of lower energy density. No one is talking about switching

22/02/2012
44
heating systems back to burning coal in our homes, or moving industry back to steam engines, belts
and line shafts, or using sailing ships which are limited in size and speed and require vastly larger
crews than modern turbine driven ships. Wind power is not being used in its low density form to grind
grains but is being stepped up into much higher density electricity, and no one is seriously considering
returning to horsepower in its true sense. The greater the differential in energy density between the
prime energy source and the end fuel, the greater the energy loss in the upgrading process, and
therefore the greater the amount of land, labour, capital and other resources that need to be deployed
to offset this.
Declining EROIE and lower density energy reinforce each other. Each needs a higher gross amount of
energy to compensate. As if that were not enough of a problem, the factor inputs themselves are also
becoming less productive. Even before this increased call on resources, ore grades are falling,
agricultural productivity growth is slowing and water reserves are being depleted. When marginal
lands are used, or mining industries have to turn to ore grades that were previously seen as not viable,
or some of the basic industries can only access fresh water via desalination, then we can expect the
output per unit of input to fall even further. http://anz.theoildrum.com/node/6974#more highlights
that the tendency to use substitute resources can disguise the nature of a problem, particularly when
there is a network of interdependencies. As I will describe later however, the substitution is not just of
one resource to another, but rather of all factor inputs. It is therefore not just the production of the
network of resources that appears to peak all at once, but rather the production of capital as a whole.
The oil, gas and coal industries are built on steel. Coal needs to be dug, lifted and transported. With
marginal lignite coals becoming an ever higher percentage of the mix, up to 3 times as much volume
needs to be burned to release the same energy. The only way to mine lignite economically is with vast
opencast mines that leave huge scars on the Earth. To reduce the moisture content to a level that can
be mined, the surrounding water table has to be evacuated, making the land less useful. The
economics of transport are obviously very poor, but so too are the economics of combustion. The
generators are more capital intensive and suffer from higher maintenance costs. High moisture levels,
lower burning temperature and increased volume of ash decreases boiler efficiency. Carbon dioxide
emissions per kilowatt hour are around 50% higher than with denser forms of coal, lifting the energy
cost of any carbon sequestration programme from around 25% to 40% of the energy burned.
Previously unexploited coals are often located in areas that lack infrastructure or are vast distances
from where the coal is needed. China is exploiting coal in Inner Mongolia and has its eyes on
Mongolian reserves, but the costs of transporting heavy loads over the Gobi desert make this
infrastructure, and therefore energy intensive. To meet its growing needs it has also committed to
transporting coal some 3,000 km from its most western province Xinjiang to Beijing. As it turns to
international reserves, rail and ports have to be expanded in Australia, Indonesia, Russia and South
Africa. The increased volumes require logistics to house and support bigger workforces. China also
plans to mine coal in Mozambique and Mongolia which are in need of basic infrastructure. Despite
China’s huge construction programmes over recent years it still lacks the ability to transport coal from
the ports inland. For this very reason the State Grid Corp has announced plans to build 4 ultra high
voltage (UHV) power lines by 2012 with a transmission capacity of 50GW to carry power from coal
fired power stations in Shanxi, Shaanxi and the western part of Inner Mongolia, and wind from
Hebei, to Beijing, Tianjin and the neighbouring regions. The UHV lines will also bring power from
the hydropower-rich south-western China to east and central China. As the efficiency of energy
extraction falls, so the gross energy production has to rise to compensate, explaining why China’s
energy intensity of GDP has steadily risen over the last decade with the exception of 2008. In 2009 its
power consumption did lag GDP growth however the coal consumed in cement and steel manufacture
grew significantly faster, lifting overall energy intensity of GDP.
As oil and gas fields become smaller and deeper, so the output per foot drilled declines. The figures
are quite dramatic as is visible in the chart below of North American gas production. The number of
rotary rigs in the United States and Canada, used for drilling new wells rose 65% between 2000 and
2010, requiring more steel, more labour, and of course more energy to operate. Enhanced recovery
techniques such as water and gas injection, and Pump Jacks or Nodding Donkeys increase the capital
and energy intensity. Most of this extra equipment will be powered by electricity, meaning further
energy loss in its generation. It is not just basic materials that are in greater demand, but also a lot of

22/02/2012
45
clever technology and engineering, particularly in offshore production whether this is oilfields or
floating LNG (FLNG) plants. A consortium of Shell, Chevron and ExonMobil for example has started
construction on the first three LNG production plants or “trains” at Gorgon in Australia to cool gas to
a liquid for shipping, a single project that is likely to cost in excess of USD50bn, whilst Shell is
hoping for environmental approval to start the first FLNG plant at Browse Basin off the north west
coast of Australia to develop the Prelude and Concerto gas fields.
http://www.theoildrum.com/node/3673
The lower the EROIE and quality of energy, the more resources need to be deployed. If we start
looking at the so-called green energies, the figures start to multiply up significantly.
Because plant matter is a low density energy and vast volumes have to be processed to make relatively
small volumes of ethanol, bio-refineries have to locate in close proximity to the farms, limiting both
their size and efficiency, and adding to the cost of production. The US Department of Agriculture
estimates bio-refineries will be limited to around 40 million gallons a year or 110,000 gallons a day,
and that to meet the Renewable Fuels Standard Mandate, 527 refineries will need to be built at a cost
of USD168bn. The world’s largest oil refinery at Jamnagar, which cost around USD12bn, has
capacity to process 50.4m gallons of oil per day, equivalent to 87% of the combined 527 bio-
refineries. A single 42 gallon barrel of oil will refine into 44 gallons – (it gets bigger as it is refined) -
of petroleum products such as diesel, kerosene, heating oil, various other products and 19.35 gallons
of gasoline. Ignoring the value of these other fuels and just attributing the capital cost of the refinery
to the amount of gasoline produced, energy for energy the cost of the bio-refinery is slightly more than
9 times that of the Indian refinery, and clearly operational costs will be dramatically higher again.
The maximum theoretical efficiency of a turbine to turn kinetic wind energy into mechanical energy
(before the loss of turning that into electricity) is 59%. If 100% of the energy was extracted from the
wind, then the mass of air would stop at the turbine, acting as a barrier to subsequent flow. This
inability to operate at 100% efficiency is common to all engines and is described by the Second Law of
Thermodynamics. For the same reason turbines have to be positioned no closer than 5 diameters apart
in any distance without losing significant power. A lot of commentary highlights that doubling the

22/02/2012
46
size of a wind turbine increases the “swept” area and therefore the efficiency 4-fold. Unfortunately
because the spacing still has to be 5 diameters apart in all directions, the amount of land required also
rises 4-fold so the only additional conversion efficiency from a larger turbine, per unit of land, is
limited to capturing faster wind speeds at increased height, however even that has a draw-back as it
adds to the stresses the blades endure during rotation.
The world’s largest wind farm is presently being built off the Kent coast in southern England and
consisting of 341 turbines with a name-plated capacity of 1 GW. The offshore site measures 233
square kilometres or 90 square miles which equates to just 0.09% of total UK land area. Adjusting for
a typical 30% efficiency rate and UK energy demand of 205GW – (data from the Digest of UK Energy
Statistics although Professor MacKay’s Sustainable Energy Without Hot Air estimates the figure at
nearer 490 GW) – then 65.4% of all UK land, equivalent to 122% of England’s land area, would need
to be devoted to wind farms to meet today’s energy needs.
Compensating for minute by minute intermittency and cumulative credits and deficits with some sort
of storage medium as described earlier would increase the area of land required 3-fold. To meet
present energy needs using wind the UK would have to cover an area of land just shy of twice its total
land mass. Massive plants would have to be built to turn the intermittent energy into hydrogen, which
would then likely be combined with carbon dioxide and turned back to a steady stream of electricity
via a number of power generating plants, a capital-intensive round trip process.
One major problem with this analysis is that it takes no account of buildings or trees that will act to
absorb and deflect the wind energy, and therefore lower the efficiency. Whilst the UK is “wind rich”,
the relatively high population density will take priority, reducing the amount of land that can be
devoted to wind farms, explaining why new capacity is increasingly being added offshore.
Unfortunately because of the extra materials involved, the corrosive environment, the increased
difficulty initially installing, connecting and then servicing and maintaining the turbines, the cost of
the electricity is about 2.2 times the price of onshore wind assuming the land was freely available. A
second omission is that by scaling up wind farms to a meaningful level, the reservoir of wind will be
severely depleted. Using a model of planetary entropy Axel Kleidon of the Max Plank Institute says
“Large scale exploitation of wind energy will inevitably leave an imprint in the atmosphere”,
changing precipitation and reducing the amount of energy we can expect to harness by a factor of 100.
Gains expected from massive wind facilities won’t pan out as each turbine reduces the remaining
“free energy” – (energy in a system that can be converted into work) – thereby lowering the yield on
subsequent turbines.
Wind energy is not just land intensive; it is also copper intensive. Every MW of electricity from a
wind turbine requires substantial amounts of copper. Aurubis, the largest European copper smelter
forecast European copper demand in 2010 returning to 2008 levels, up 30% to 3.9m tonnes. It said
demand was driven by various areas, but predominantly from electricity production, both conventional
and unconventional. It said that major offshore wind farms would generate a jump in demand, with
every wind generation platform having about 8.2 tonnes of copper. The 2006 report, Life Cycle
Assessment of a Wind Turbine , suggests that the amount of copper used in the generator, the gear and
the shell of a 3MW turbine is 4.785 tonnes, but given the turbine operates at an average of 30%
capacity that equates to 5.3 tonnes per MW.
Renewable Energy Systems Ltd says its Sweetwater investment will comprise of 61 1.5MW General
Electric turbines for a total capacity of 91.5MW. Each turbine will be mounted atop a 130 foot mast,
with a copper wound transformer located 41 foot from its base. For the 575-V power connections
alone, this phase of the Sweetwater project will require 47,500 linear feet of 777-kcmil copper cable.
There will also be a significant quantity of copper supply cable on site. In addition each tower will be
protected by a large grounding system. At Sweetwater, six conductors bonded to the tower connect to
a 250 kcmil copper ring within the base that is in turn, bonded to rebar in the towers foundation.
Copper leads extending outward from that inner ring connect to four 5/8 inch * 8 foot copper clad
grounding electrodes, which in turn are bonded to a copper ground ring that completely encircles the
pad. Ground rings at all turbines are connected to all others to form a single, networked grounding
system for the entire facility. The grounding system and neutral conductors use 30,000 linear feet of
250 kcmil copper cable. (Kcmil is the cross sectional area of a wire on the US scale. According to
Wikipedia a 212 kcmil wire has a diameter of 11.684 millimetres and one of 168kcmil has a diameter

22/02/2012
47
of 10.404 mm. It does not give a reading for 250 or 777 kcmil but as 1 metre of 212 kcmil weighs
0.95kg, we are talking upwards of 1kg per metre).
That is not all however. The report continues "The groups of turbines feed two substations located on
the facility. Two all-copper transformers at each substation step up the voltage in stages from 34.5 kV
to 138 kV and from 138 kV to 345 kV, respectively, to connect to the utility grid. The high-voltage
cables include 229,000 linear feet of AWG 3/0, 50,000 feet of 350 kcmil, 18,000 feet of 750 kcmil,
30,000-feet of 1000 kcmil and 29,000 feet of 1,250 kcmil. In this particular location, the high-voltage
cables have aluminium phase conductors, but their concentric neutral conductors are copper." Not
counting the turbines, transformers and control wires, the Sweetwater II wind farm contains more
than 35 miles of copper low-voltage and grounding cable and more than 67 miles of copper in the
neutral conductors of high voltage power cable. I must apologise for throwing so many figures at you,
but I think it admirably highlights the kind of quantities of copper involved in this new world.
Adding this all together we can easily come to 10 tonnes of copper per MW of capacity. Ore grades of
copper have steadily declined along a linear path from about 1.5% in the early 1990’s to their present
1% level, increasing the energy, water and capital intensity of lifting, crushing and refining the ore.
The world’s largest copper producers are warning of looming supply limits. Codelco says that higher
costs and lower ore grades mean new global supply “is coming very slowly”. New finds are “extremely
rare” and “it is a very constrained market from a supply standpoint”. “The portfolio left to be
developed has a lower quality than we have been used to for many years”. Freeport, the world’s
second biggest copper miner, says that copper producers will have to develop new supplies even if
demand stagnates. Deutsche Bank estimate that average ore grades are down 26% in the last 2
decades. Macquarie Bank forecasts that the 2011 shortage will be the biggest since 2004. Rio Tinto,
the GBP75bn mining giant says that a greater proportion of discoveries over the last 10 years would
need deep mining methods where the costs are that much higher. Polish copper miner Lubin says the
surplus will shrink in 2011 because of “declining ore grades in mines, infrastructure problems and
postponing planned mine projects due to problems with mine financing”. Not only are ore grades
deteriorating within the active mines, but the need for more mines means more infrastructure and
capital equipment, all of which means more energy consumption.
At the present average ore grade of just less than 1%, it takes about 15,000kWh of electricity, the
equivalent energy of about 8.8 barrels or 370 gallons of oil, to mine and process 1 ton of copper. At
the time of writing, if oil was the feedstock it would equate to around 10% of the price of the copper.
The energy consumed in the smelting and refining process is static at around half of that, whilst the
mining, milling and separation process, which accounts for the balance, rises exponentially with the
declining ore grade. To remove it of all its impurities and make it a high quality conductor of
electricity, it is left in an acid bath with an electric current running continuously through steel
electrodes for 10 days to attract the pure copper to the steel plates. As the EROIE falls and the gross
energy market rises to compensate, so the demand for copper and other resources will increase,
negatively affecting the quality of the ore and adding to the energy required in extraction. Each
decline in efficiency reinforces itself, depleting the net reserves. These numbers only account for the
energy used directly in the processes and ignore the much more substantial figures used indirectly,
known as the tail energy.
So-called Rare Earths, essential for wind turbines and photovoltaic cells amongst other things, are not
actually that rare, but they are found in very small concentrations in the Earth’s surface and the
refining process is highly pollutant making them extremely energy intensive to extract and process in
a clean and sustainable manner. By ignoring the environmental and health damage and allowing
ruinous competition China has undercut other producers by around 75%, but the consequence has
been some of the most polluted areas on the planet as well as reduced life expectancy in those regions.
Just as with copper and other materials, the interdependency between energy and resources explains
why substitution is not as easy as we are led to believe. Resources are always exploited according to
the ease of extraction and the value added they can offer so the growth in technology required to
compensate for declining ore grades and declining EROIE’s will not only rise, but will rise
exponentially as the reduced availability of each resource reinforces the reduced availability and
increased demand of another. The same feed-back loop explains why the Industrial Revolution led to
22/02/2012
48
accelerated economic growth, and why somewhere like China has been able to develop so rapidly in
recent years by applying existing Western technology to open up the power of its resources. It also
suggests that without some sort of massive leap-forward in the supply of high quality energy,
technological advancement will no longer be able to square the circle between the geological decline
in resources and the increased demand for them.
Moving further down the EROIE ladder to bio-fuels, the land intensity rises even further. In the
United States of America, corn ethanol has an EROIE of 1.01 according to
http://netenergy.theoildrum.com/node/6760 which applies statistical vigour to the 5 main studies on
corn ethanol; Wang et al (1997), Shapouri et al (2002), Pimentel (2003), Patzek (2004), and Farrell et
al (2006). For every 1 unit of energy put into the ground, the through process returns us an additional
0.01 units. The EROIE in the best growing counties is slightly higher at between 1.11 & 1.18, whilst
those with the worst soil or climatic conditions are 0 – 0.7. The figures have already included the 70%
- 80% energy loss in the distilling process from corn to ethanol necessary to increase the energy
density, but they have not included that required to transport the fuel to its final destination which will
almost certainly make ethanol an energy sink. In a closed system (ie using ethanol to power tractors
and to produce fertilizers etc), it would be necessary to produce 101 gross litres of ethanol to get just 1
net litre. Rather than producing ethanol to then manufacture fertilizer, the plant material will simply
be ploughed back into the land, but the conversion efficiency is only about 25%, still leaving the crops
needing to be rotated with nitrogen-fixing plants to maintain their yield rather than accessing the
nitrogen from petrochemical fertilizers as they do at the moment. Grain is only harvested once or
twice a year so storage will be required for the gross production, either for the grain or for the ethanol,
and sufficient spare capacity will be required to cover the variability of harvests.
Ethanol has just 62% of the energy per litre of gasoline – (21.46MJ/L vs 34.56MJ/L) – so to replace 1
net litre of gasoline with ethanol would require producing 161 gross litres of ethanol. To contemplate
this would be sheer lunacy. The sums simply don’t add up. The world consumes 50 times as many
calories through fossil fuels than through food, so to try and replicate the energy supplied in the
higher density form would be a non-starter; there is simply not enough land or water. It is often said
that the world has 300bn energy slaves working for us. Given that just over 15% (or 1.02bn) of the
6.5bn population already suffers from malnutrition, the idea that we can create sufficient food for
another 300bn is preposterous. The only justification for ethanol is as a political tool. Under the
Energy Independence and Security Act, US legislation mandates for ethanol production to rise from
7.5bn gallons by 2012 to 20.5bn by 2015 and 36bn by 2022. Whilst this will drain US land and water
resources, with refineries alone costing it at least USD168bn according to the United States
Department of Agriculture (USDA) and water transfer programs estimated around USD1trn according
to Earth Track, it elevates global food prices and therefore gives the United States, accounting for
around 42% of world grain exports, the currency to continue buying oil.
The limit of alcohol purity achieved from distillation is 95.6%. At this level of purity, its boiling or
evaporation point has fallen to 78.2 degrees Celsius, below that of its constituents, so further simple
distillation cannot achieve increased concentration or purity. To get around this Benzene must be
added before a final distillation. As a carcinogen it makes pure ethanol unsuitable for consumption;
however as a constituent of oil it also makes ethanol to some extent dependent on fossil fuel.
I have noticed that some green enthusiasts talk of superior performance from ethanol than gasoline.
Ethanol has a higher octane rating which means it takes more energy to ignite the fuel, and
consequently can be used in higher compression ratio or performance engines. At the higher
temperature more of the fuel is burned releasing a greater proportion of energy, and as the laws of
thermodynamics will tell you, the increased temperature differential between power and exhaust will
increase the output of the engine, however even with a larger engine at the higher compression ratio,
ethanol cannot match gasoline for power output per gallon. The higher octane rating is insufficient to
offset the lower energy density. Achieving similar performance comes at the expense of increased fuel
consumption.

22/02/2012
49
When the world’s first iron bridge was built in Coalbrookdale in 1779, the furnaces of the time
required 10 acres of forest to produce the charcoal required to make just 1 ton of steel. Based on a
similar efficiency rate today and an average 25 years to grow the timber, China would be able to meet
just over 1% of its present steel needs if it covered 100% of its land with forests. Given the need for
space to live and land and water to grow crops, it presently supports forest cover of just 18.2% which
would be sufficient to produce a poultry 1.6m tons vs its present capacity of well over 700m tons. This
may sound unrealistic due to efficiency gains, but China’s recent history offers us a glimpse of what
this could mean. During the Great Leap Forward in 1958 – 1960, there was a push to increase
China’s steel production which was fuelled by the felling of trees. This caused irreparable damage.
Forest cover in western Sichuan fell from 40% to 12%, with similar destruction throughout the
country. Without forests to act as a sponge, top-soil was simply washed away by rainfall, destroying
agricultural capacity and helping cause the Great Famine which killed between 14 and 40 million
people. This is a very real and recent example of just how dependent the existing carrying capacity of
the Earth is on the availability of high quality fossil fuels.
In the 1860’s when British engineers were contemplating the EROIE of domestic coal falling below
that of the US, and the net energy from coal production eventually peaking and declining, they
realised that even back then, reverting to timber would be a non-starter as iron production alone
would have required nearly the entire surface of the Kingdom to be converted to forests. One hundred
and fifty years on, with energy consumption many multiples larger, for some reason we have lost site
of this reality despite Britain having to rely on imports for nearly half its food.
A more salient and immediate point to consider is the dependency of modern-day agriculture on fossil
fuel inputs, and how the declining efficiency of energy extraction could have major consequences for
food output requiring more land to compensate. This may sound far-fetched but in 2007 and 2008 this
is exactly what happened. The Philippine’s Agricultural Minister said it no longer made sense to buy
food from the world market, but instead would grow it itself. It announced that it could not afford
fertilizers and would therefore have to divert more land to its production. The International Food
Policy Research Institute similarly commented that Free Trade policies were losing favour in Asia,
Africa and Latin America as global food prices had risen too far for these countries to afford imports.
They had to set more land aside, grow it themselves and restrict exports. Pakistan could not afford the
energy to harvest and dry its crops. In February 2010 Bloomberg newswire reported that Japanese
farmers were forced to turn to Latin America for some of their corn imports as the protein content of
some US corn had fallen below the minimum level of 18.5% required by Japan for chicken feed,
because US farmers had tried to save money by reducing their fertilizer inputs. In the previous 10
years, US food production and preparation had accounted for over 65% of the increase in US energy
usage; the energy cost of putting food on the plate for the average American had grown by 0.42barels
or 17.6 gallons of oil equivalent. There is no getting around the linkage between energy in and energy
out. If you can’t afford the concentrated forms of energy that fertilizers provide, then you have to
resort to more land removing both it, and labour from other activities. At the margin, history shows
this can be achieved by increased gardening as happened in Britain in WWII, the Soviet Union in the
1980’s, and of course Cuba today but with modern population densities so much higher, the difficulty
of the task is increased.
Without energy input beyond what is naturally provided by the Sun, large tracts of land and indeed
individual countries will become infertile or useless to our needs. Whilst it is easy to imagine
countries such as Saudi Arabia or Australia being inhospitable without the work done by fossil fuels,
it is perhaps less obvious that places we imagine as fertile such as California or India could only
support a fraction of present agricultural output without the vast amounts of energy needed to extract
water from aquifers, and pump it across different counties to irrigate fields and support the local
population and industry. As with other “alternative” energy, corn based ethanol is dependent on fossil
fuel inputs and therefore offers no solution, however the much harsher reality we have to face up to is
that food production on its present scale is a derivative of fossil fuel rather than being independent of
it. Corn yields in Iowa for example, the most fertile area of North America, would fall by around 47%
from 180 bushels per acre to just 80 without the application of nitrogen based fertilizers, the most
common feedstock for which is natural gas requiring around 33,000 cubic feet of gas per ton of
fertilizer.
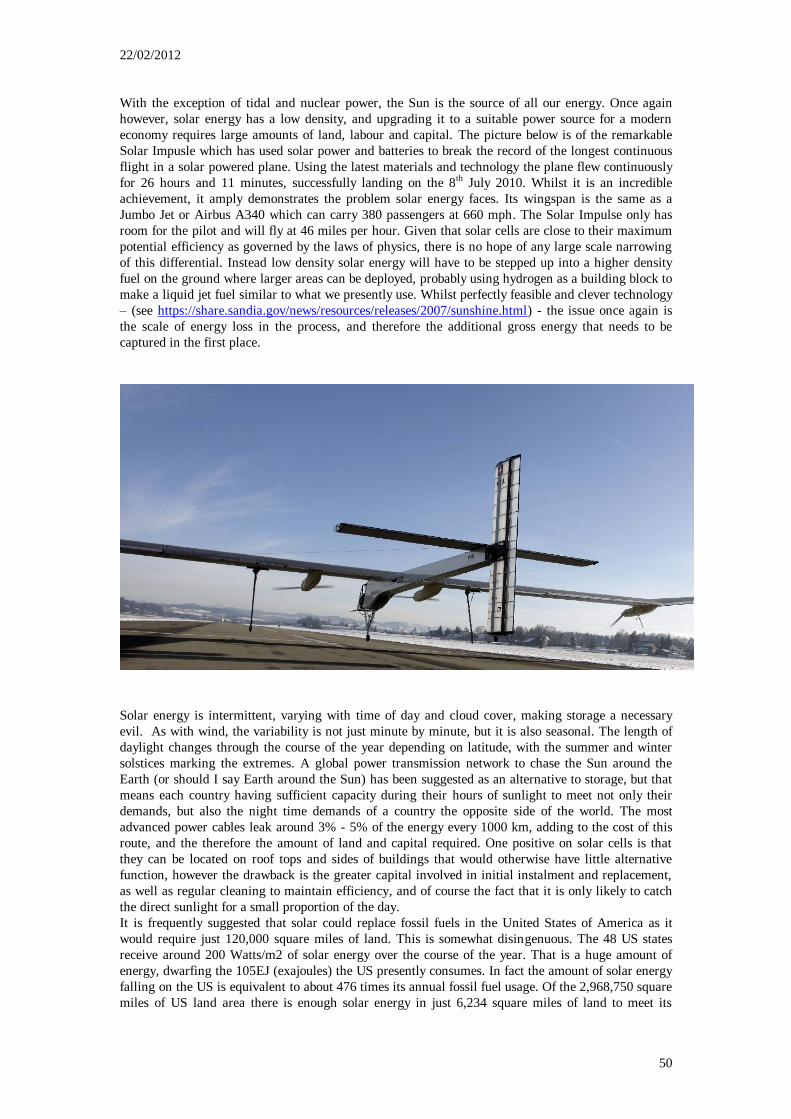
22/02/2012
50
With the exception of tidal and nuclear power, the Sun is the source of all our energy. Once again
however, solar energy has a low density, and upgrading it to a suitable power source for a modern
economy requires large amounts of land, labour and capital. The picture below is of the remarkable
Solar Impusle which has used solar power and batteries to break the record of the longest continuous
flight in a solar powered plane. Using the latest materials and technology the plane flew continuously
for 26 hours and 11 minutes, successfully landing on the 8th July 2010. Whilst it is an incredible
achievement, it amply demonstrates the problem solar energy faces. Its wingspan is the same as a
Jumbo Jet or Airbus A340 which can carry 380 passengers at 660 mph. The Solar Impulse only has
room for the pilot and will fly at 46 miles per hour. Given that solar cells are close to their maximum
potential efficiency as governed by the laws of physics, there is no hope of any large scale narrowing
of this differential. Instead low density solar energy will have to be stepped up into a higher density
fuel on the ground where larger areas can be deployed, probably using hydrogen as a building block to
make a liquid jet fuel similar to what we presently use. Whilst perfectly feasible and clever technology
– (see https://share.sandia.gov/news/resources/releases/2007/sunshine.html) - the issue once again is
the scale of energy loss in the process, and therefore the additional gross energy that needs to be
captured in the first place.
Solar energy is intermittent, varying with time of day and cloud cover, making storage a necessary
evil. As with wind, the variability is not just minute by minute, but it is also seasonal. The length of
daylight changes through the course of the year depending on latitude, with the summer and winter
solstices marking the extremes. A global power transmission network to chase the Sun around the
Earth (or should I say Earth around the Sun) has been suggested as an alternative to storage, but that
means each country having sufficient capacity during their hours of sunlight to meet not only their
demands, but also the night time demands of a country the opposite side of the world. The most
advanced power cables leak around 3% - 5% of the energy every 1000 km, adding to the cost of this
route, and the therefore the amount of land and capital required. One positive on solar cells is that
they can be located on roof tops and sides of buildings that would otherwise have little alternative
function, however the drawback is the greater capital involved in initial instalment and replacement,
as well as regular cleaning to maintain efficiency, and of course the fact that it is only likely to catch
the direct sunlight for a small proportion of the day.
It is frequently suggested that solar could replace fossil fuels in the United States of America as it
would require just 120,000 square miles of land. This is somewhat disingenuous. The 48 US states
receive around 200 Watts/m2 of solar energy over the course of the year. That is a huge amount of
energy, dwarfing the 105EJ (exajoules) the US presently consumes. In fact the amount of solar energy
falling on the US is equivalent to about 476 times its annual fossil fuel usage. Of the 2,968,750 square
miles of US land area there is enough solar energy in just 6,234 square miles of land to meet its

22/02/2012
51
energy needs. That is just 0.21% of the US land mass or 8.08% of US urban land. Unfortunately
systems are not 100% efficient. You cannot cover an area that large without gaps between the solar
panels for ease of access and cleaning. This will increase the land required by about 1/3rd to a still
very low and very achievable 8,291 square miles. A top of the range photovoltaic cell might achieve
24% efficiency when it’s totally new and clean. Adjusting for loss of efficiency from dust build-up and
therefore the need for frequent cleaning will mean 20% efficiency is probably the very best that could
be achieved, lifting the land needed to be set aside to 41,455 square miles. Our usage of energy
changes through the course of the day and through the course of the year. It does not mimic the Sun’s
delivery of energy which alters as the Earth rotates through the course of a day from sunrise to sunset.
As the distance and angle of the photovoltaic cell relative to the Sun changes, and the column of
atmosphere through which the Sun has to penetrate varies with the rotation, so the energy available
follows a normal shaped curve. To compensate for this, and at the extreme provide energy for lighting
during the night and heating during the winter, some sort of storage or smoothing process is required.
With a round-trip energy loss in storage of about 80%, if we fed half of the photovoltaic cell electricity
directly into the grid and half via storage, this would increase the land required to 124,365 square
miles, very similar to the figures often quoted. Assuming an energy payback period of 5 years and a
lifespan of 20 years, i.e. an EROIE of 4 would mean increasing the land required by a further 1/3rd to
create sufficient excess power to build new replacement cells when the existing ones expire. This lifts
the land required to 165,820 square miles. Whilst this is only 5.58% of the total US land mass it is
over twice the size of US urban land space, and after stripping out agricultural and forest land which
are required for food and timber for housing, it equivalent to 21.6% of all other land available. This
space is presently used for wildlife, parks, miscellaneous and urban. At this sort of land penetration
solar power would be extremely expensive in terms of resources required and the opportunity cost of
how the land might otherwise be used, including the cost to biodiversity. These figures are extremely
generous, applying efficiencies which are not really available and energy payback periods, or EROIEs,
that do not adjust for the tail energies which make it very questionable whether there is any net energy
generated by the solar cells or not. Thin film solar sheets, which are less expensive to manufacture
than solar panels suffer significantly lower levels of efficiency and so require additional land to be set
aside, making the true cost even higher.
To offset the declining efficiency of high density energy production, not only is more land required,
but so too is more water. To some extent there is a symbiotic relationship between water and energy
production. For bio-fuels the link is self-evident, but even oil and gas drilling is becoming more water
intensive, often taking up to 40 gallons of water to extract just 1 gallon of oil. To clean the tar sands,
water is taken from a 200 mile radius. Whilst the water is recycled as many as 18 times, the industry
still takes 3.2bn barrels of freshwater from the Athabasca River, Alberta’s longest undammed
waterway, accounting for 76% of water allocations, and plans to expand that to 4.2bn barrels or
99.75% of allocations. Already it is thought that the effect of droughts on agricultural production has
been intensified due to this water withdrawal. Mining generally is water intensive which is fine when
the water is freely available, but when it has to be pumped from aquifers or worse still desalinated,
then the energy cost of that mining starts to rise.
In the United States the Oscar nominated film GasLand criticises the shale industry for its hydraulic
fracturing and the pollution and toxins that are seeping into the water table. Whilst the film panders
to people’s environmental concerns, the reality is it inadvertently highlights the competing demands
for water as the reserves of fossil fuels decline and the production of energy becomes more land,
labour and resource intensive. Over the last 20 years the West was isolated to a large extent from this
reality as the marginal fuel came from China, where the pollution and loss of natural resources was on
an unprecedented scale. Had China not been willing to sacrifice its environment and imposed clean
technology such as carbon capture and sequestration on its power industry then its energy intensity of
GDP would have been that much higher, depleting its coal reserves even more quickly.
Power generation with steam turbines is water intensive. Steam from the boiler (coal, oil or nuclear)
drives a turbine. The efficiency is driven by the temperature and therefore pressure differential either
side the turbine. The bigger the drop, the more energy is released. If the temperatures and pressures
are the same, there is no movement from hot to cold or high pressure to low pressure, and therefore no
work is done. The sink therefore needs to be as cold as possible, which usually means venting the
steam into a cool river or into the atmosphere through specially designed chimneys. Of course systems

22/02/2012
52
can be designed to re-circulate and cool the water on site, but this will lower the efficiency of the
turbine. For this very reason thermal solar farms have become mired in conflict, with licences being
turned down. To capture the most solar energy, the farms are usually located in deserts, but
unfortunately deserts suffer from a lack of water. A planned farm by Solar Millennium for example in
California’s Armargosa Valley would consume 1.3bn barrels of water a year, equivalent to about 20%
of the entire valley’s available water as both a coolant and cleaner.
Rather than condensing the steam into the atmosphere and therefore losing the water, radiators can be
used however these need cooling by electric fans to maintain the temperature differential and therefore
the efficiency of the turbine, but that means using large quantities of the power generated in this
process. Solar thermal power plants that use mirrors to concentrate the sun’s energy at a collecting
point are significantly less efficient than photovoltaic cells at turning solar energy into electricity,
however the cheaper production costs can make the economics look more attractive, but only if the
cost of land and water is sufficiently cheap. As 20% of California’s power is consumed pumping water
from the north to the south of the State, using it for solar cooling would have been a form of subsidy,
giving the appearance of a more competitive energy source than it really is. Even though less than
1/10th of 1% of world power production comes from solar energy, the competition for the water and
land is already pricing the technology out. It should be noted that water disputes have forced Solar
Millennium and others to abandon wet cooling in California.
The plant was decommissioned in 1999 and replaced by a telescope
http://www.trec-uk.org.uk/resources/pictures/stills3.html
Even before lifting the water intensity of GDP, the cost of extraction is rising. The Gulf States in the
Middle East consume significantly more water than their annual renewable supplies, depleting
aquifers and relying heavily on desalinated water. Away from the Gulf States, Israel consumes 120%
of its supplies, then Iraq and Iran 44% and 53% respectively. Pakistan consumes 71% and India 34%.
Countries are rapidly consuming down their reserves of fossil water – (ground water that has
remained sealed in an aquifer for a long period of time). Precipitation is just another energy cycle, as
is the carving out of these underground aquifers by erosion, so the water in storage is the result of
historic energy cycles. Nevertheless accessing it is energy intensive, taking 9,800 Joules to lift 1 ton –

22/02/2012
53
(or 1000 litres) - by 1 metre. Beijing is reliant on pumping water from aquifers for between 2/3rds and
¾’s of its water needs depending on which source you refer to, with some of the aquifers now 1,000
metres or 1 kilometre deep. India pumps 250bn cubic metres or 250 cubic kilometres of water from
underground aquifers that are said to average 400 metres in depth. Assuming the power generators
are 33% efficient at turning the coal into electricity and the electric pumps are 100% efficient, then
India is consuming about 0.6% of world primary energy production in this particular task. In order to
visualise just how much energy is being used, the annual flow of water over the Niagara Falls in
North America is about 59 cubic kilometres and its height is just 52 metres, so India is effectively
running 32 Niagara Falls in reverse. As the aquifers deplete, so the water has to be lifted further,
consuming more energy. Eventually either the aquifer becomes exhausted or the depth exceeds about
1500 metres at which stage the economics of desalination become preferable, even though 70% of the
cost of desalination is energy.
One of India’s particular problems is that up to 80% of the rainfall in certain regions falls in the
monsoon season, but capturing and storing that would either mean the loss of land to huge reservoirs
– (the reservoir behind China’s Three Gorges Dam for instance, measures 600 km in length and
contains 22 cubic km of water when full) – or the direction of the water into aquifers which would
then require pumping out again, as and when the water is needed. Storage above ground can increase
the country’s hydro power; however this depends on the elevation of the ground it is stored on. It is
also likely to be in the wrong location which then may require reconfiguring of the country’s
plumbing as well as the possible need for pumping stations. Without water land becomes much less
productive, but storing it above ground elsewhere and transporting it means other areas of land have
to be put aside for this purpose, removing them from other uses.
The Chinese government has given the go-ahead to the power generation company Huadian to build a
cascade of 13 dams on the Nu River, overturning a suspension ordered by the premier since 2004. The
dams will have a combined capacity of 21.3GW, similar to the Three Gorges Dam. The National
Development Reform Commission has stated that the country will build 140GW of hydro power over
the next 5 years, and will lift its total hydro power capacity to 380GW by 2020, equivalent to an
incredible 95% of the country’s potential hydro power. Small and medium sized rivers will have to be
used – (http://www.eeo.com.cn/ens/Industry/2011/01/24/192214.shtml). If you halve a river speed, the
power falls by 87.5% so with each successive power station on a single river the capital, resource and
land intensity of energy extraction will rise exponentially. The cost of the energy will be extremely
high, not least in terms of the loss of land.
As the centre of the world energy market, the Middle East and North Africa (known collectively as
the Arab League) is experiencing rapid economic growth. The natural hostility of the climate means
that economic output is extremely energy intensive, and it is becoming more so as the population
grows and as resources are depleted. Most of the world’s desalination plants for example are in the
region, meeting 40% of the Persian Gulf’s water needs. Despite adopting a policy of 100% reliance on
food imports by 2016 in order to save water, Saudi Arabia is still expected to need to spend USD50bn
on desalination plants over the next 10 years.
Water is extensively used in the mining industry. According to the United States Geological Survey
(USGS), in the year 2000 the US mining industry used 3,490 million gallons of water per day, or just
under 1% of the country’s total water withdrawal to separate valuable minerals from bare rock. With
the expanding energy network, the demand for these metals will grow, whilst the declining ore grades
means the process of extraction will become increasingly water and energy intensive. The global
industry will increasingly have to turn to desalination. Water scarcity and increasing demand from the
mining has forced Chile’s water authority DGA to refuse any more fresh water rights in northern
Chile for the mining industry. In 2009 the world’s largest copper mine Escondida was granted
approval to build a USD3.5bn desalination plant that will produce approximately 3200 litres of water
every second. It will then be pumped through 2 parallel pipes 180 kilometres inland, and then lifted to
the mine some 3,100 metres above sea level. All of this requires energy in construction, installation
and in operation. The day I wrote this, Freeport McMoRan Copper & Gold Inc submitted an
environmental impact study to the Chilean authorities to build a desalination plant for its Candelaria
copper mine. Peru’s Mines and Energy Minister has said that Southern Copper will have to build a
desalination plant if it wants to go ahead with its USD1bn Tia Maria copper project; “The
22/02/2012
54
desalination plant is their only option”. Chinese industry similarly has to turn to desalination to meet
its needs. A 1 million ton ethylene cracker in the Marine Petrochemical Plant in Tianjin for example
is building a plant with daily capacity of 150,000 tons. By the end of 2010 total Chinese capacity will
be between 800,000 to 1m cubic metres a day, but according to http://www.tj-
summerdavos.cn/system/2010/01/15/004436479.shtml, by 2015 the global sea water desalination
industry will have an income of over USD95bn. Water withdrawal for mining is relatively small scale
compared to that for agriculture, so any large scale adoption of bio-fuels would not only be
constrained by land but by the availability of cheap natural supplies of water.
Water consumption usually grows twice as fast as GDP. If that growth is sustained by accessing virgin
rainfall, it gives the economy the appearance of reduced energy intensity, however as soon as the
water needs to be moved around or we need to turn to more unsustainable, recycled and desalinated
supplies then the energy cost starts to rise. Three per cent of US energy consumption is used simply in
treating incoming water and remediating outgoing water according to Scientific American. The
increasing competition for land to meet our energy needs will result in a decline in cheap water
supplies as alternative uses lead to a far greater run-off and reduced natural aquifer re-charge. As with
the other factor inputs, as the availability of cheap high quality energy deteriorates and the gross
energy market has to expand to compensate, so the energy intensity of water extraction will rise,
causing a negative compounding effect. The security of water supply will become increasingly
important to the location of industry. Countries such as Western Europe, Japan, North America and
Brazil will see their competitive advantage increase compared to the water deficit countries such as
the Middle East, sub-Saharan Africa and central Asia.
One final consideration for lower quality energy is environmental damage. Conventional wisdom is
that coal energy is dirty, causing atmospheric concentration of carbon dioxide to increase to a level
that may be causing global warming. It should be noted however that its usage has allowed the global
population to soar. Having reached 1bn in 1804, it is expected to grow to 7bn in 2011. Cheap fuel
brought with it cheap food and cheap sanitation, lifting life expectancy and the carrying capacity of
the Earth. Adopting lower quality fuels would reverse this trend. It would also be more damaging to
the Earth itself. Extracting kinetic energy from water in terms of hydro power is now recognised as
environmentally destructive. Without rivers being able to disperse nutrients, soil fertility downstream
falls making fertilizers essential to offset declining agricultural yields and maintain top soil. Similarly
less oxygen downstream reduces the river’s ability to support marine life, lowering the fish harvest. A
slower flowing river also means less energy to disperse pollutants. Irrigation often results in
salinization – (the accumulation of salts in top soil) - requiring ever larger amounts of fresh water to
compensate. Upstream land is lost as a store for the water whilst downstream land is lost to sea water
intrusion which can have a major effect on the river delta. Hydropower does not generate energy; it
redeploys it and when adjusting for these costs, the net energy produced can be significantly lower
than official statistics would suggest, and in some cases it can be negative.
Extracting wind or solar energy on a large scale could potentially have similar effect. Imagine the UK
example mentioned earlier. Extracting 59% of wind energy across the entire UK could presumably
affect the temperature and therefore the evaporation of moisture from soils, and even the rainfall. Air
pollutants would become far more problematic. It could even act to reduce or alter air circulation
around the Earth and therefore affect climate. Adopting biofuels on a vast scale would remove land
and water from all other uses, destroying environments for other natural habitat etc. Nature is a
carefully balanced ecosystem, with each organism in a food chain, either directly or indirectly turning
the Sun’s energy into useful work. By transferring the energy to other activities, there is a real chance
that whole systems and cycles could be destroyed with untold consequences, and because of the scales
involved in meeting today’s economic needs with low density energy, the environmental damage
would be far more real and pressing than global warming.
In the 1930’s excessive farming of marginal land resulted in the US Dust Bowl, leaving the land
barren and 2.5m Americans forced to relocate as they were unable to pay bills and their homes were
foreclosed. The redeployment of two rivers, the Amu Darya and the Syr Darya to grow cotton in the
former Soviet Union resulted in the death of the Aral Sea and the salinization of the farmland.
Excessive farming and grazing in western China has turned 400,000 square kilometres of Chinese

22/02/2012
55
cropland and lush prairie into desert, forcing tens of millions of people to abandon the land. In
February 2010 China’s Agricultural University warned that the heavy use of nitrogen based fertilizers
– necessary to support crop yields - had resulted in severe acidification of its soil, such that cropland
in the south of the country could no longer support meaningful food production. The acidity or pH had
fallen to between 3 and 4 – (the acidity scale runs from 0 as the most extreme to 7 is neutral and 14
most alkaline) – comparable to that of commercial white vinegar and unable to support most plants.
Further south Vietnam has expressed concern that China’s damming up of the Mekong River to
extract hydro-power has resulted in less dispersion of nutrients through seasonal flooding and reduced
prospects for rice production. Environmental issues are already threatening to become destabilising,
acting to accelerate the expansion of the gross energy network.
It seems that the higher the quality of energy, the lower the health risk. The worst nuclear disaster to-
date was the Chernobyl accident in 1986 which killed 2 people on the day of the explosion and
another 28 people in the weeks immediately following. Overall it is thought it may have contributed to
2,500 deaths but this compares with about 2,500 annually in Chinese coal mines, and significantly
more respiratory related deaths. The Gulf of Mexico oil disaster highlights the increased risks, and
therefore increased costs of maintaining our net supply of oil in a declining EROIE environment. The
potential direct risk to life from hydro power is amply demonstrated by the Chinese act of blowing up
a dam on the Yellow River to try and stop the advance of the Japanese, killing as many as 1m of its
own people in the largest single loss of life of WWII, according to Wikipedia.
The cost of the EROIE falling is measured in terms of the increased resource intensity of extraction.
Whilst it may not appear in company accounts, one of those resources is the environment, so by
definition if the EROIE is falling, environmental damage is increasing. Whilst the quality of energy is
relatively high as we have at the moment, the scale of this externality can generally be ignored as the
impact on the environment is relatively tiny in comparison to its size. If you are concerned about
Global Warming, which I am not, then imagine how the carbon concentration would rise if we were
obtaining the same net supply of energy from coal with an EROIE of 2 rather than an EROIE of 10.
Another more immediate example might be the increased water pollution that would come from shale
gas as each successive fracture results in a declining yield. In a declining EROIE environment there is
no way to successfully accommodate this externality as it would further increase resource intensity.
As you can see there is a vicious circle. As the quality of energy falls, more land and resources are
required to compensate. The network of equipment required to sustain production becomes both larger
but also more complex, resulting in its own inefficiencies. Lower ore grades, marginal land or
insufficient natural supplies of water increase the energy intensity of extraction. Even at a human
level, as people are taxed into manual labour, calorie consumption rises. As the gross energy market
expands, resources are depleted that much quicker, requiring the location and shape of the energy
network to change accordingly. So far the most obvious consequence has been the redistribution of
wealth to a much wider population, driving the outperformance of China and other emerging markets
over the last 20 years. More subtly however it has resulted in reduced productivity growth and a
declining accumulation of capital.
We are generally told that in a number of years time the cost of alternative energy will have become
sufficiently cheap relative to fossil fuel to make it competitive. Unfortunately this is not likely to be
the case as the wind turbine or solar cell is reliant on large amounts of fossil fuel input in both
manufacturing and maintenance. Until we can use the alternative energy as the feed-source, wind or
solar energy is likely to remain at a premium to fossil fuel. As the EROIE of the fossil fuel declines, so
the cost of the alternative energy will rise. Even if manufacturing advances were to continue to
improve, this is unlikely to offset the increased cost associated with removing more and more land and
resources from alternative uses, particularly as that land becomes less marginal and the resources
suffer from declining ore grades. It seems highly unlikely that with such low EROIEs alternative
energy could ever become anything more than a marginal source of energy in a large modern
economy. It could only ever become a dominant source of power in much smaller less sophisticated
societies such as the pre-industrial age when they previously dominated the energy mix.

22/02/2012
56
Whilst green or alternative energy is a lovely idea I’m sure we would all be in favour of, the simple
reality is that the world cannot possibly afford it. We do not have the land, labour, capital or resources
necessary to meet existing net energy needs with low density energy, and therefore it will remain
nothing more than an expensive distraction.
Chapter 8
Inter Temporal Accounting
22/02/2012
57
Politicking rather than leadership has turned the declining EROIE into a tax on the science and
technology necessary for our survival. Government and opposition must act in their countries’ best
interests rather than for re-election and personal gain.
As soon as anyone mentions peak oil, the response is usually that we shouldn’t worry as efficiency
gains will negate it. Electric cars and more efficient light bulbs are offered up as the solution to all our
problems. For these people the laws of thermodynamics are either irrelevant or are sufficiently far
away that they don’t apply to today’s economy. Even if this were the case, technology and productivity
gains are facilitated by excess capital. Unfortunately as we discovered in the previous chapter,
declining energy quality acts not only as a tax on land and resources, but also on labour, capital and
perhaps most importantly the research and development necessary for these efficiency gains. With
100% certainty, Peak Energy would result in Peak Capital.
Looking back at recent history, total primary energy consumption per unit of GDP improved from
1973 until 2000 since when it has been relatively flat. The gains did not happen in a continual
manner. Instead they happened in 4 specific periods, 1973, 1979, 1990 and 1996, the first 3 of which
coincide with US recessions. During these periods, investment spending slowed down giving the
impression of efficiency gains but at the expense of deteriorating capital equipment and infrastructure.
Between 1995 and 2004 for example the number of roads having an “acceptable” ride quality fell
from 86.6% to 84.9%, with urbanised roads significantly lower according to the Federal Highway
Administration. The American Society of Civil Engineers 2009 scorecard highlights that US
infrastructure is acting as a drag on the rest of the economy. It ranks 15 different industries, giving
infrastructure an overall grade of D. The US needs to spend USD2.2trn over the next 5 years to lift the
infrastructure to a reasonable condition, equivalent to 15.4% of 2009 GDP. Without the investment,
sustaining present economic output will become increasingly difficult and energy intensive. The US
already wastes 4.2bn hours in traffic jams each year, the equivalent of reducing the workforce by just
over 2m people. In 2007 41,059 people were killed in motor vehicle accidents and another 2.491m
were injured. Motor vehicle crashes cost the United States a massive USD230bn a year in medical
costs, lost productivity, travel delays and legal costs. The longer it delays the necessary investment,
the more the impact will be on the productivity and efficiency of the economy as a whole; without
quality infrastructure or the energy to use it, the transfer of wealth and productivity from one area to
another becomes impossible. As it is the US economic strength is largely a factor mobilisation story,
using 56% more energy per unit of GDP than Europe and 68% more than Japan which is fine, if it has
the resources.
Some of the efficiency gains are therefore more apparent than real. Without heavy investment,
depreciating infrastructure will no longer be able to support the existing level of output. Imagine if a
bridge fails, it could force thousands of journeys each day to be extended by 20 or 30 miles, effectively
reducing the hours someone can work. It would also increase fuel consumption in getting to work.
Even between 1995 and 2005 fuel wasted as a result of increased congestion rose from 1.7bn gallons
to 2.9bn. The score card divides infrastructure into 4 separate categories; Transportation covering
aviation, bridges, inland waterways, rail, roads and transit; Water and Environment looking at dams,
drinking water, hazardous waste, levees, solid waste and wastewater; Energy which really only looks
at electric power generation and transmission, and finally Public Facilities which concentrates on
schools and public parks and recreation. Independently of this report, the US oil industry
infrastructure is also creaking with for example the average pipeline more than 50 years old. The US
spends just 2.4% GDP on infrastructure compared to 5% in Europe and 9% in China. It’s economy
has been living on borrowed time as the 2003 collapse of the Interstate 35 bridge in Minneapolis, the
August 2003 blackout across the North Eastern states, or the failure of more than 50 levees and
floodwalls in New Orleans testify to.
The asset price bubble of the last 20 years or so helps explain the shortfall of US domestic capital
formation, especially in the private sector. By divorcing asset prices from the data used to determine
monetary policy, Greenspan drove stock markets and property prices aggressively higher, sucking
capital out of the real economy and into paper assets. The electorate was collectively fooled by the
illusion of monetary wealth rather than real wealth. When offered the choice of near guaranteed

22/02/2012
58
double digit returns from asset prices or risk investing in domestic industrial capacity or technology
where the return was almost certain to be lower, the stock market won every time. So long as the rest
of the world was willing to finance the current account deficit, this disconnect and the hollowing out
of the US economy, was allowed to continue. With investors chasing daily performance, companies
were rewarded with a cheaper cost of capital for stripping out costs by outsourcing, and for investing
in their own equities through share buy-backs, whilst they were punished with higher costs of funding
if they failed to deliver, frequently because they were investing in the real economy rather than just
asset price inflation. For this very reason managers of companies such as GE, which had become
hedge funds with industrial assets on the side, were given rock star status. This was a failure of
enormous proportions, and should be laid squarely at the doors of government, central bankers and
regulators who by changing definitions of data to suit their needs, and by acting as cheerleaders with
ever lower interest rates to keep the illusion alive and therefore buy political support, effectively
undermined the financial market’s mechanism for the efficient allocation of capital. Whilst there are
time delays between making investment decisions and seeing the return, the simple fact that US debt
has risen continually, relative to GDP over the last 30 or 40 years, should have been evidence enough
that resources were being inefficiently allocated.
Under a properly functioning Gold Standard capital has to be allocated productively, meaning that
whilst debt could rise in nominal terms, it could not rise as a percentage of GDP. It should be no
surprise therefore that since the US left the Gold Standard, or at least the Gold-backed standard of
Bretton Woods in August 1971, its debt to GDP ratio has grown exponentially. The reality was that
with its own peak oil production in 1970 and substantial subsequent decline, the US could no longer
afford the scale of investment necessary to support both its existing standard of living and maintain a
productive allocation of capital. Something had to give. By abandoning the backing of the dollar with
gold, the US effectively started taxing its “empire” through ever larger current account deficits and
bond issuance just as the British and Roman Empires had done previously. The growth in the
financial system with its new innovative products was necessary to act as the conduit and attract the
inflow of capital needed to finance domestic consumption. As the manufacturing industry declined
from 26% GDP to just 10%, so the financial industry grew from 10% to 20%, filling the gap by
functioning as an international taxman. The Triffin Dilemma stipulates that for the world to trade on
the Dollar Standard – (i.e. for international trade to be conducted in the US dollar) - the US must run
a current account deficit. If it ran a surplus it would suck dollars out of the international system
leaving it without a currency on which to trade. In other words the US “taxes” the rest of the world for
the use of the dollar through an ever larger international borrowing programme or current account
deficit. As the most advanced nation, that tax should be invested in the scientific advancement needed
to maintain sustainable global growth. Instead it has been wasted on excessive consumption, resulting
in global resource depletion, also known as Malthusianism. As with the Roman Empire this panem et
circenses or bread and circuses – (a lot of public sector jobs are effectively just ways of keeping people
entertained and off the street) - approach to avoid social unrest once the economy had gone through
peak oil production, can only ever have a limited lifespan before the resources are depleted.
Since 2000 when the Chinese economy became sufficiently large to be one of the main drivers to
global growth there has been no further improvement in the energy intensity of global GDP. China’s
growth is capital rather than consumer intensive, and would normally therefore be seen as an
investment in future energy efficiency. Like the US however, the sustainability of its output is very
much in question. Independent research suggests the cost to China of environmental degradation and
resource depletion has wiped out its entire economic growth over the last 20 years. Whilst this may
sound somewhat extreme, pollution alone would have wiped out 3.05% of 2004 GDP with a further
1.8% treatment cost according to a Chinese National Bureau of Statistics report published in 2006,
which didn’t even address resource depletion or soil and water degradation which are on a massive
scale. The following year the government suppressed the 2005 report and withdrew its support for this
Green GDP methodology.
Whilst at first glance it is hard to reconcile the incredible growth we all associate with China with this
Green GDP calculation, it becomes easier to understand when you consider that up until 2000 China
was losing over 10,000 square kilometres of land every year to desertification through wind and water
erosion (44.1% and 45.7% respectively) as well as salinization 8.3% and construction 1.9%. That has
since been brought under some sort of control with just 3,400 square kilometres of land lost annually
22/02/2012
59
in recent years leaving 27% of the country as desert. In the north eastern provinces the replacement of
forests with agricultural lands have provided the country with over 100m tons of grain each year, but
has resulted in the loss of over 2m hectares of wetlands and a 75% decline in top soil over the last 40
years. At the present rate of decay it will be bare rock within 10 years. Between 1996 and 2008
cultivatable land across the country fell by 6.8% from 130.04m hectares to 121.2m due to rapid
urbanisation and desertification. Current per capita farmland is 0.092 hectares; just 40% of the global
average with no spare capacity or reserve farmland. Its ability to feed itself is in rapid decline. Due to
double and triple cropping its wheat yield is 4.61 tons per hectare vs the world average of 2.76 tons,
with rice and corn yields 88% and 54% higher than the rest of the world but that is achieved by using
more than 4 times the fertilizer per hectare than the world on average, turning the soil acidic and
adding to its erosion. Water resources per capita are just 25% of the world average, and are decreasing
rapidly. Beijing consumes 75% more water than can be taken from the surrounding areas on a
sustainable basis and has a cone of depression or depleted aquifer beneath the city and stretching into
northern Henman and western Shangdon that measures over 40,000 square kilometres, causing
subsidence across parts of Beijing of up to 8 inches or 20 centimetres a year. Similar cones of
depression are building beneath the agricultural plains north of Shanghai and subsidence is prevalent
across the country as a whole. Water experts now estimate that groundwater reserves in the big
industrial cities south of Beijing will be exhausted within 5 to 10 years despite the various transfer
projects. Agriculture accounted for 81% of the total water use back in 1997 with 51.9% of the total
cultivated area reliant on irrigation. With coal production expected to be exhausted in the next 20
years, the inefficiencies will multiply together; the ability to access and distribute declining water
reserves or to enhance the fertility of soil will disappear. China’s large population density has resulted
in resources being worked too heavily. The country has certainly changed the shape of its ledger, but
it does seem the research suggesting its overall balance sheet has not grown at all over the last 20
years does deserve some merit. This is reinforced by China’s own aggressive international resource
grab programme of securing future supplies and removing them from the wider market.
Over the last decade China’s energy intensity of GDP increased every year but 2008, when the global
economy went into meltdown. This should not be surprising as China has spent heavily building
infrastructure and capital goods where the initial costs of industrialisation are much greater than the
subsequent operational and maintenance costs. Unfortunately with the resource side of the balance
sheet in deterioration, maintaining economic output is likely to become both more energy intensive
and increasingly dependent on imports. Contrary to general expectations capital spending will become
a larger percentage of GDP, and to finance this, household consumption, which has already been
squeezed from 46% GDP in 2000 to just 35.6% in 2009, will continue to decline. In any economy
based on factor mobilisation, consumer spending must gradually decline as a percentage of output; as
the factors of production are gradually depleted and exhausted, they become less efficient and unable
to support existing levels of consumption, as was the case in the former USSR.
One particular area where this is coming to a head at the moment, and is causing debate amongst
economists, is in what’s known as the Lewis Point whereby the productivity of its rural economy is
insufficient to release more workers from the land. This is resulting in labour shortages in Chinese
industry and rapid wage inflation, which unless it can be compensated for with industrial productivity
growth will eventually mean capital starts to leave the country. China still plans to urbanise 400
million people over the next 15 to 20 years. For the moment this is justified by the higher urban
wages, inferring higher productivity, but it is a policy that is dependent on the productivity
improvements of international agriculture and mining. At what price can they make up the shortfall?
Will other countries ban agricultural exports if it is causing domestic inflation? The terms of trade are
likely to move aggressively against China leading to rampant inflation and a loss of competitiveness,
effectively taxing people back to the land.
The Lewis Point is effectively a sub-category of Area Efficiency which is taxing people back into
resource industries generally. Wage growth in the energy and mining industries has been rampant in
recent years, explaining to a large degree the relative growth of the emerging markets, and the
narrowing of their sovereign debt spreads to US Treasury’s. As more capital is diverted to energy
extraction and conversion, less is available for the rest of the economy. Depending on the pace of this
transfer, productivity growth and efficiency gains for the economy as a whole will either slow or
reverse.
22/02/2012
60
Historically we saw this play out in the former Soviet Union, which had to divert an ever greater
proportion of economic output into sustaining its oil and gas industry. Combined with the large
military budget and an ageing population, it starved the rest of the productive sector of capital.
Productivity declined and the Soviet Union collapsed. A side effect was deteriorating health and a
rapid fall in life expectancy from 64 in 1987 to just 57 by 1994. A similar pattern is happening at a
global level today, however because it is not isolated to one country it is not so obvious at first sight.
Wealth is being transferred to the resource rich countries to try and maintain output, but the
consequence is a loss of productivity in the industrial and particularly service economies of the West.
Mobility of labour can help smooth the process at the margin, with for example Brazilian immigrants
in the United States moving back home, City of London bankers travelling to the Far East to help
manage the flow of capital, and highly skilled oil engineers going wherever the money takes them.
Reduced labour productivity can be offset with a greater number of workers. China’s manufacturing
workforce for example is now more than twice that of the whole G7 manufacturing workforce. Once
again however this is an area of balance sheet contraction. One of the big concerns in the developed
economies is the ageing population, and the cost of providing pensions. The rising dependency ratio –
(the number of people of non-working age divided by those of working age) – acts to reduce
productivity. Transferring ever greater amounts of economic output to these non-producing people
acts as a growing weight around the rest of the economy. Capital is eroded and productivity falls.
Even if retirement ages are increased, the reality is that the productivity of a worker normally starts to
fall beyond the age of about 40. The Soviet Union didn’t actively default on its commitment to its
retired population, however the hyper-inflation associated with its decline in productivity achieved the
same end. Whilst we in the West fret about our pension deficits, they pail into insignificance
compared to the problems China faces. Western fertility rates have moved gradually lower over a long
period of time depending on economic and social circumstances, whereas the one-child policy adopted
in China and other parts of Asia aggressively managed down their dependency ratios, driving a
multiple expansion in the workforce compared with the rest of the population. Unfortunately this is
starting to reverse as the 1 child now enters the workforce replacing the 4 retiring grandparents.
Shanghai has increased the retirement age from 60 to 65, but the estimated cost savings of CNY20bn
is dwarfed by the social security fund deficit of CNY6.71trn. The very fact that it has been forced to
increase the retirement age suggests that it is unable to fill the gap with urbanisation, undermining
those remaining economists who say the Lewis point has not yet been reached. The relative
demographic dividend that China has enjoyed over the West is set to go bust. At a balance sheet level
therefore the human asset side is about to move from the credit to the debit column, both in absolute
terms and relative to the West.
The increase in gross energy production needed to meet the same net energy needs not only effects
productivity directly from taxing capital and workers, but also from shifting production to inefficient
countries and workforces. For obvious reasons the resource rich economies want to maintain a greater
proportion of the value from the fuel at home, however most of these countries suffer other natural
disadvantages that makes them inefficient. The Middle East for example suffers from the hostility of
the climate, whilst China suffers the consequences of over-exploitation and degradation of its land and
water due to population density. Shifting manufacturing production to these countries is therefore a
sub-optimum allocation of capital, and requires capital controls such as an artificially low currency,
lower wages, or laxer environmental controls, to compensate. Whichever way we turn, productivity is
set to decline and energy intensity increase.
It is not just in the supply of new labour that the US and the rest of the developed world have
underinvested. It is also the supply of educated labour. Over the last 20 years the US has fallen from
1st to 9th for the percentage of its population aged 25 to 34 having at least a high school degree, and
from 1st to 7th for those having a college degree according to the Organisation for Economic
Cooperation and Development. The US ranking for mathematical and scientific literacy is 19th and
14th respectively in an OECD/PISA study, and according to the US National Science Foundation, it is
slipping in the global science and technology league, which is backed up by its gradual fall in ranking
of patent applications. Obviously the education standards of the emerging economies are improving
as capital flows into these countries, but it still has a long way to catch up, and unlike the elite
European and US universities, the Chinese, Japanese and South Korean education systems are based
22/02/2012
61
on regular repetition learning in line with their more socialist background. This trait is very apparent
in their workforce, which lacks the independent critical thinking necessary to drive big advances in
technology.
Efficiency and productivity gains are achieved through research and development that expands the
capital stock of the economy as a whole, opening doors to new ideas. New technology makes existing
resources that much more valuable. Whether achieved through evolution and turning over the capital
stock or by scientific study, experiments and simulation, economic advancement is energy intensive.
One of the best analogies is that of an aircraft; to get to a higher altitude – (or economic plane) - you
have to open the throttles, however once you get there maintaining that level of output is slightly less
energy intensive. If you start to slow the engines beyond a certain amount, the aircraft or economy
will gradually lose momentum and start to descend to a lower level. At the economic level, decay or
depreciation performs the same roll as gravity. Prior to the industrial revolution GDP growth was
mainly a function of population growth, itself determined by land and resource availability.
Productivity per capita grew by around 1.7% every 100 years. Without fossil fuel inputs, the industrial
revolution would never have happened and technological advancements would have carried on at a
snail’s pace. Given that a lot of people’s vision of the world sees it relying increasingly on wind
turbines, it would be intriguing to consider how they would have developed over the last 300 years
without the excess capital that fossil fuels afforded us. I would venture that they would still be wooden
and cloth structures rather than much stronger and lighter composite materials they are today, and
would therefore be limited by size and weight. Engineering quality and accuracy would not have
improved as there wouldn’t be the supplies of energy to move beyond the simple black-smith, so the
windmill would still only be able to drive badly fitting gears and grinding wheels rather than giant
modern turbines. Without large supplies of cheap high quality energy, the cost of productivity gains
and economic advancement is prohibitive. Although you can argue over cause and effect, the simple
reality is that judging by the period 1980 – 2000, any country which suffers a decline in energy
consumption per capita rapidly becomes a failed state.
Once again it is not just the availability of cheap energy that is essential to productivity growth, but
the supply of high density energy which gives a better conversion efficiency of energy into useful
work. Even Henry Ford said of his assembly line, the blueprint for modern mass production, that it
was not feasible without electricity. A line shaft system would be far too heavy and cumbersome to
supply energy on the scale needed on a modern factory floor. The stresses involved would have meant
a line shaft would have to be extremely strong and therefore heavy and wasteful of power. It would not
be able to supply energy in a flexible manner at the flick of a switch that electric motors can, again
adding to the cost. He noted that the mechanical work from a steam powered engine could not
generate the tool speed necessary to create finer steels and the quality of manufacture necessary for
modern industry- (The Big Switch by Nicholas Carr). It would also be impossible to miniaturise steam
or internal combustion engines and to regulate the power as efficiently as can be done with electric
motors.
Analysing productivity of each of the factors of production over the last 100 years in the United States,
the big advance has not come from labour, but from turning energy into useful work, and from capital
equipment. Unfortunately both seem to have run out of steam. The marginal productivity of turning
energy into useful work soared in the first 30 or 40 years of the twentieth century as higher density
energy was adopted. It then had another advance in the 1970’s when natural gas was deployed, but
has since been static and is now set to decline as more work has to be done lifting the lower density
energy to a level commensurate with our modern economies’ needs. As for capital, there was a big
advance driven by the widespread adoption of labour saving electrical equipment and cars in the
middle of the century, but since the early 1970’s when US oil production peaked and Bretton Woods
was abandoned, underinvestment has resulted in a decline in the marginal productivity of capital. A
modern car for example may be more efficient than an older car, but because infrastructure has
deteriorated and it spends more time in traffic jams or in and out of the garage because of damage
from driving over pot-holes, its marginal productivity has not improved. Neither mechanical work nor
electrical power-generation and distribution, have seen any meaningful improvement in energy
conversion efficiencies over the last 30 or 40 years as the easy gains have already been achieved,
however there are still gains being made in the energy conversion efficiencies for industrial high and
medium temperature heat as per the chart on page 34. Over this period it is clear that the US has

22/02/2012
62
badly misallocated capital with the exception of its investment in high density energy in the form of
natural gas in the 1970’s and 1980’s, however with the quality of energy now deteriorating it seems
inevitable that the marginal productivity of all three factor inputs is set to decline. If we are unlucky
enough to suffer from peak energy as seems highly likely, not only will the productivity of the factor
inputs fall, but so too will their availability.
Applying modern technology to a less developed economy does give an initial boost to marginal
productivity, but that rapidly deteriorates as has been the case since the early 1990’s in China as its
technology deficit is gradually eliminated and growth becomes increasingly reliant on factor
mobilisation. The fact that corporate America has outsourced production to China, and therefore has
been able to service its current account deficit with overseas earnings is seen in some quarters as
vindication of its investment policy. This is not the case. The improved earnings are driven by simple
cost savings based on regulatory, social and environmental arbitrage supported by massive currency
manipulation, ie factor mobilisation or balance sheet drawdown rather than investment in sustainable
output. It is no wonder that these same US firms that outsourced production to China have been
lobbying against proposals to label it a currency manipulator because it would mean realising the huge
losses associated with their misallocation of capital. Outsourcing of industry due to cost rather than
efficiency must be matched by scientific advancement if it is to enhance the balance sheet.
Marginal Productivities (elasticity) of each factor of production.
USA 1900 – 1998
Accounting for Growth: The Role of Physical Work
http://www.iea.org/work/2004/eewp/Ayres-paper1.pdf
Whilst I am well aware of seeing links that are not there, I would venture that fertility rates and the
baby boom also correlates to the surge in wealth associated with improved marginal productivity,
itself driven by the wholesale adoption of electricity, and the peak discovery of oil reserves in the
1950’s and 1960’s. As it has fallen people simply have not had the time or energy to invest in their

22/02/2012
63
families. Only from the mid 1930’s through to the early 1970’s when the marginal productivity of
capital nearly doubled on the back of oil discoveries and average earnings tripled did the fertility rate
rise aggressively before declining again in the early 1960’s in what became known as the baby boom.
Either side, when average earnings were flat, fertility rates fell. Coincidence perhaps, but doesn’t
history tell us that populations of humans, and indeed of all animals, tend to expand rapidly when
their resource base is also expanding.
Understanding that wages are really just transfer payments from these other factor inputs not only
puts the pension deficit that we are all worried about in a totally new light, but it also explains why
capital spending and research and development are vital to economic growth, and therefore to getting
ourselves out of our present mess. That means sacrificing present consumption, increasing the capital
to labour ratio and reinvesting some of the work done in the kind of science that will allow the
marginal productivity of both capital, and of turning energy into useful work, to resume their uptrend.
At the moment government austerity programmes are not adequately distinguishing between
consumption and the necessary investment required to halt and reverse the decline in EROIE. Waiting
for government balance sheets to be sufficiently repaired before undertaking the necessary investment
is no longer an option; without the correct allocation of resources, government revenue will decline
and budget deficits will continue to climb.
US Federal R&D spending has fallen from 2% GDP in 1963 to about 0.5% today. Almost no money is
being directed into the big science programmes that are too big for the private sector, but are essential
to find the next generation fuel that can lift the marginal productivity of capital once again. Prior to
WWII the marginal productivity of capital was flat for about 30 years, falling fairly sharply in the
early 1930’s. A lot of economists suggest that the Great Depression only really ended with WWII.
Wars force a reallocation of capital on a massive scale. Most is destructive consumption in terms of
fighting and bombs, effectively the ultimate Keynesian stimulus of smashing windows to repair them
which ultimately destroys capital and living standards. A small percentage of military spending
however is directed into major technological advancements that are often the key to future economic
growth. Computers, satellite communications, air travel, nuclear energy and all of its medical spin-
offs, the Internet, and even nitrogen fertilizers which were the key to the Green Revolution, all had
their origins in military technologies. After WWII, the Cold War continued the technology race,
although it was referred to as the Arms Race. Both sides had to keep directing capital into staying
ahead of the game, leading to private sector spin-offs that drove productivity gains. Whilst economists
saw the end of the Cold War and the collapse of the Soviet Union as economically positive with the
so-called Peace Dividend lowering the cost of labour, what they failed to realise was that with little
investment in big science projects the capital base or balance sheet was no longer expanding. As with
demographics, economic growth was borrowed from the future. Money has to be directed away from
end consumption and back into the science necessary to lead us out of this mess; the capital to labour
ratio must be increased.
A war gives governments the legitimacy to reallocate capital on the kind of scale needed to achieve
immediate results. In no way am I advocating war, but government and opposition must start being
honest with us if society is collectively going to make the necessary decisions. The longer they delay,
the worse the problem will become. The free market is trying to make this reallocation of capital. It is
shifting money from the marginal consumer into energy production, wherever and however that may
be, but government is actively over-ruling it. With economists incorrectly interpreting market signals,
governments are making wrong decisions and allocating capital inefficiently, making the adjustment
process even more dangerous. Democracy’s strength comes from weighing the success or otherwise of
policy over time, something that has been lost in the modern world of 24 hour news reporting,
particularly in the Anglo Saxon countries. Politicians must get back to representing the country’s best
interest rather than electioneering.
There is a natural asymmetry of risk in an economy. If someone loses their job, then most democracies
will make transfer payments to that unproductive asset, but by doing so they are adopting one of the
main socialist characteristics that is seen in normal circumstances as economically destructive. In
hard times, the transfer payment is morally correct, and from an economic perspective a huge amount
of capital has already been invested in that person which hopefully can be made use of in the not too
distant future if they can find themselves a new job. If however they remain unemployed, or they are

22/02/2012
64
simply given non-jobs in government, then it amounts to a tax on the rest of the economy. This is
exactly what happened under Labour in Great Britain over the last 10 years where unemployment was
kept artificially low by public sector jobs. The fact that tax rates went up meant by definition that the
jobs were unproductive, undermining the UK’s competitiveness, and leaving even less capital for the
investment necessary to get us out of this mess. Instead the government should have implemented
major investment programmes that start to address some of the problems we face. Investing GBP20bn
building a 10 mile tidal barrage across the River Severn which has the second highest tidal range of
any river in the world, and would provide England and Wales with around 6% of electricity needs for
the next 200 years would seem a much better way of deploying unemployed construction workers and
engineers than just giving them a transfer payment to sit on their bums or to dig up roads to then
rebuild them. Whilst such an allocation of capital would put Britain in a more competitive position to
compete for the remaining fossil fuels, it is only investment in new high energy density fuels that will
give us a secure long term future, so employing the so-called “rocket scientists”, that lost their
investment banking jobs in nuclear research maybe the best allocation of capital that could be made.
Without it, Thomas Malthus’s dilemma of the population outstripping the Earth’s ability to support it
will be proved correct. For this very reason, scientific advancement is necessary just to stand still.
As the quality of energy has deteriorated, the global economy has become flatter. Wealth is shifting
away from the developed economies to the emerging markets as the network of equipment and labour
has had to reach further and further afield. This horizontal expansion has been at the expense of
economic advancement. Whilst the US is still on top of the economic pyramid, as already described
Federal Research and Development (R&D) spending has fallen continually since 1963, declining from
around 2.0% GDP to about 0.5%. In a 1945 report to US President Harry Truman, the science adviser
Vannevar Bush said that although basic science is ultimately the basis for industrial technology,
because of the time scales involved and the benefits not necessarily accruing to the original investor,
private companies don’t have the incentive or the balance sheet to make the necessary investment. It
has to be down to government. Unfortunately this investment is not being made. It is also no good
looking to countries lower down the pecking order, as they are simply trying to catch up with existing
technology; there is no point China trying to reinvent the wheel. If the richest economies are not
making the investment, no-one is. Only 5% of China’s R&D budget for example is aimed at basic
research. The US runs a large current account deficit, which acts as a huge subsidy to its economy. It
is a cost the rest of the world is willing to pay as it seen as the charge for its role as global policeman
and also global scientist. To be fair to the US, the wars in Iraq and Afghanistan have amounted to
more than one trillion dollars, but nevertheless there has been a huge underinvestment in scientific
discovery particularly in the energy field, for the last 30 years.
US R&D spending should have risen, not fallen, as it is investing for the world as a whole. Growth
without innovation is unsustainable. The more horizontal the global economy becomes, the faster
resources will be depleted and therefore the more investment in science is necessary to get us back on
a stable track. At the same time, it is well understood that with every advance in science the difficulty
of the task increases; the marginal productivity of capital declines and therefore additional investment
is required. Historically this was achieved through wars and land grabs, but ultimately it can only be
provided with a leap forward in the supply of high quality energy, necessary to make up for the labour
shortage with “energy slaves” or machinery, and increasingly intelligent machinery at that. Projects
such as the USD3bn human genome sequencing programme could only ever have been achieved with
the vast computer power that high density energy can provide. A declining marginal productivity of
capital means the only way the global balance sheet can expand is if a higher percentage of output is
allocated to economic advancement. The economy must swing back to a more vertical structure,
directing more of the available resources into high level education and science that can make new
high density energy a reality. Wars show us that population will support huge hardships allowing the
scale of investment necessary, but only if government are open and honest with us.
The marginal productivity of capital in the US has been falling since the early 1970’s. The ability to
achieve economic growth has become more difficult. Achieving the scientific advancements that
would reverse this trend requires throwing ever more resources at the problem; the energy intensity of
achieving productivity growth is increasing. The marginal productivity of labour has collapsed since
1900, although at a decelerating rate until about 1970, since when it has been fairly stable but at a
level of less than 25% of that of capital. With no new supply of labour and declining marginal

22/02/2012
65
productivity of capital, growth is increasingly reliant on using more energy. Marrying up Western
technology with underemployed labour in the emerging markets has boosted global growth, but at the
expense of a big increase in energy demand. The higher wages that come from lifting productivity
with Western technology has driven major advances in their personal consumption, and therefore
increased the overall demand for energy, a phenomenon known as the Jevons Paradox. Unless China
is now prepared to accept the slowing and then declining growth associated with its peaking energy
production, it increasingly has to sell its technology to resource rich emerging markets to finance it,
boosting their standard of living and consumption and accelerating the pace of high quality energy
depletion. Too much money is spent on consumption and existing technology, and not enough on
scientific advancement.
There is a vicious circle. Productivity growth is dependent on increasing supplies of high quality
energy, but without productivity growth, supplies of resources are depleted and capital deteriorates.
Whilst the linkage between energy and productivity advancement is not well understood, the history
of human life is effectively described by this reality; if you are spending 100% of your time accessing
food, there is no time to invest in tools that might help you advance. The world is presently stuck in
this feedback loop, and without a conscious reallocation of capital the medium term outlook is very
bleak. The resource rich emerging markets will have a solid boost as we sell them our technology, but
the world’s resources will just deplete that much faster. Less capital is being created causing the
global balance sheet to shrink, productivity to fall and less money to be invested in the balance sheet.
The Soviet Union was not rich enough to divert more resources from immediate consumption or from
its military budget into the technology necessary to break the circle. We are, but we need leadership.
Government must direct whatever allocation of capital is necessary to achieve this, and the public
must give its backing to fund the investment.
If the cost and value of energy were one-in-the-same, no work would be done. There could be no
research and development, and there would be no economic advancement. As EROIE falls and we
approach that reality, productivity and efficiency gains for the economy as a whole will fall as energy
is the primary factor input on which everything else is dependent. Unless we can reverse this decline,
we face a miserable future.
----------------------------------------------------
So what of the electric cars? Can these save the world? In terms of the efficiency gains there are some
myths that need debunking. A hybrid electric vehicle combining an internal combustion engine with
regenerative braking technology, allows a vehicle’s kinetic energy to be turned into electricity when
braking, which can then be used to drive electric motors and boost performance. The idea is similar to
using the braking energy to spin a flywheel and using that energy to boost the car. The extra weight of
the generator and batteries or flywheel, as well as the round-trip energy loss in turning the braking
energy into electricity and then back into motive power, will by definition, reduce – not increase - the
efficiency of the vehicle although the technology may compensate for the aggressive stop-start nature
of some drivers. To a large extent this could be better achieved by simply adopting a smoother driving
style that does not expend so much energy in needless braking and accelerating.
In terms of the electric car itself, the battery costs a similar amount to a normal family car and with an
anticipated lifespan of only 6 or 7 years, it is dramatically more expensive over the life of the vehicle.
Combining the 60% - 70% energy loss from generating electricity together with a further 5% loss
every 1000km of transmission, 14% loss in the charging process, and an optimal efficiency of the
electric motors themselves of around 90% - 95%, the operational efficiency is also not much better
than that of internal combustion engines even before considering the limitations to the vehicle. The
energy saved in vehicle operation is insufficient to compensate for the additional energy sacrificed in
the manufacturing process, although over time the supporters of the technology hope this will change.
Increasing the depth of battery discharge beyond about 30% severely reduces the life expectancy of the
battery, which coupled with a natural energy leak or self-discharge of around 10% - 20% per month
for lithium-ion batteries and 30% for nickel metal hydride batteries means the electric cars’ useful
role is limited to regular short journeys around town rather than occasional use or for longer trips.

22/02/2012
66
Batteries are also limited by a fixed rate charge capability. If the limit is pushed, it severely impairs
the life of the battery. Unfortunately chemistry means that batteries trickle charge the last 20% or so
of the capacity, making them even more problematic as that is the useable part of the battery.
http://www.theoildrum.com/node/6480#more looks at some of the manufacturers claims on range,
highlighting that the stated figures of vehicles using the most modern lithium iron batteries, where the
energy density is 6 times that of lead-acid batteries and 2 – 3 times that of nickel-metal hydride
batteries, are accomplished on rollers in a test that supposes a 22 minute drive at an average speed of
19.59mph, breaking 40 mph once for about 100 seconds and never exceeding 58 mph, ie. city driving.
The article suggests that under more realistic conditions the range is probably halved.
As the 12th US Secretary of Energy (assumed office January 21st 2009) and physics Nobel Prize
winner Steven Chu said of batteries; “And what will it take to be competitive? It will take a battery,
first that can last for 15 years of deep discharges. You need about five as a minimum, but really six or
seven times higher storage capacity and you need to bring the price down by about a factor of three.
And then all of a sudden you have a comparably performing car; let’s say a mid-sized car which has a
comparable acceleration and a comparable range”.
Electric cars should not be dismissed out of hand, but similarly they should not be held up as game-
changing event.

22/02/2012
67
Chapter 9
Why the fuss? At the end of the 1800’s when the global population was around 1 billion, it is said that little boys
were made of snips and snails and puppy dog tails, and little girls of sugar and spice and all things
nice. With a population now of 6.8bn, the recipe has changed with fossil fuel now the main
ingredient!
It is probably fair to say that most of us do not realise the scale of energy we consume. Filling our
petrol tanks is the nearest direct contact we have with a primary fuel other than food. Electricity is
one-step removed as we do not have to pay for it at the point of consumption, and what is out of sight
is out of mind. In either case however, I am sure very few of us think of our relationship with energy
beyond its price, perhaps with the exception of understanding the relationship between fuel
consumption and time when we put our foot down in the car and see the petrol gauge rapidly move to
empty.
I am of such an age that during the winter months as a child, it was not unusual having to push my
mum’s car to jump-start it in the morning in order to go to school. Luckily with 3 brothers and a
sister, and a hill to push the car down, it was manageable most of the time if exhausting. If however
the car failed to start, then it was abandoned at the bottom of the hill until the evening when my dad
would use another car to tow it back up. If pushing a car 25 or 50 metres at not much more than a
walking pace is enough to put most people out of breath, imagine how much energy it takes for the car
to travel 10 miles at speeds of say 50 mph. A single gallon of gasoline contains similar energy to the
amount of food an average adult would consume in 2 – 3 weeks, a large proportion of which is
essential just to maintain life without even considering the task of doing work such as moving a car.
Our energy use goes far beyond cars however. During the August 2003 blackouts in the United States
of America almost every industry along the Eastern Seaboard went down. Unless it had its own
backup generator, it could not function and even if it did, it could not do business with another
company unless it also had an alternative energy supply. Water could not be pumped across counties,
and traffic lights couldn’t operate. Perhaps the most telling aspect of just how reliant the modern
economy is on fossil fuels was that gasoline stations could neither work their pumps nor their tills, so
even cars and trucks were limited by the fuel they had in their tanks.
According to the USDA, 15.7% of the entire energy used by the United States in 2007 was in the
“food system”. That encompassed the manufacture and use of fertilizers, irrigation, planting,
harvesting and animal rearing and slaughtering. It also took account of preparation and process,
storage, packaging, transport, cooking and cleaning, and then of course the disposal of waste
including sewage. All of this however, is the energy used in the operation of existing equipment and
infrastructure. What about that required to manufacture the tractors or the trucks used to transport the
goods, or the energy used in building the petrochemical plant that produced the nitrogen fertilizers, or
that used to lay and maintain the roads and rails necessary for those trucks to operate on. Did it
include the energy required to mine the iron-ore to make the steel to build the shops where the food is
sold, or to make and then lay the concrete pipes necessary for the sewage system. What about the
energy involved in building the dams to store the water for irrigation, processing and cleaning. Most
importantly of all, what about that required to house and feed the workers needed to design, build,
operate, control and coordinate all of the above, and the energy required to get them to their place of

22/02/2012
68
work. Adjusting for these “tail energies” is extremely complex and results in different conclusions. A
2008 report by Cornell University for example, calculates the energy consumed in the food chain is
19% of the total used by the United States.
Using prices as the better measure of the energy input of food also causes problems. If I collect my
shopping in my car, then I have to include a percentage of the price of the car, not just the fuel.
Assuming the farmer is generating sufficient income beyond a subsistence lifestyle, do we include that
extra income? Surely he would abandon farming and only produce for himself if he was getting no
additional benefit, so it must be part of energy cost of producing the food. Where does this progression
end? It doesn’t take long before you start to realise that it is all dependent on definitions and how we
attribute different end uses, but what we can say is that energy is used in every aspect of economic life.
Whether it is a construction, manufacturing or service industry, all are to a greater or lesser extent
dependent on fossil fuel energy. Mining and farming, research and development, design and
manufacture, transport and operation, recycle and disposal are all reliant on energy input. Slicing the
economy vertically or horizontally, energy is at the centre of everything we do.
It is not just mechanical work that is done by fossil fuels. Chemical work will also frequently involve
energy input in one form or another. Even the work done to turn fossil fuel feedstock into plastics and
other petrochemicals is reliant on fossil fuel energy. Without heat energy from these fuels we wouldn’t
have steel, glass, cement or many of the other building blocks of a modern economy, nor the more
complex materials necessary for modern flight or to cope with extreme environments. Even modern
sciences rely on computers, which owe both their construction and operation to fossil fuels, for
modelling or for carrying out complex calculations. In fact almost all of the tools we use to shape the
world to our needs are themselves dependent on fossil fuels in one form or another.
In total, fifty times more calories are burned and work done through the use of fossil fuels than via
human labour, and whilst it is understandable to think the value of the human labour is somehow
more important and higher quality than the more “mechanical” work done by fossil fuels, the reality is
that without those fossil fuels the carrying capacity of the Earth is said to be just 15% of its present
level. The vast majority of human labour is therefore just a derivative of fossil fuels, and so therefore
is the productivity and inventiveness of that labour. Without fertilizers, irrigation, water transfer and
the warmth and security that fossil fuels offer us, the majority of us would simply not be here. Vast
swathes of land would have remained inhospitable to all but the most specialist life forms, whilst
agricultural production would have remained dependent on the local rainfall and climate. We all
understand that without the Sun’s energy, we would all die. The reality is that without the scale of
energy inputs we presently enjoy that are independent of the Sun, modern day life would similarly
cease to exist.
The earlier chart on page 54 showing the marginal productivity of labour, being a mere fraction of
that of capital or of turning energy into useful work, overstates the relative value of labour as it
ignores this dependence on fossil fuels for its very existence. That said it is an interdependence in the
sense that it is that human labour and imagination that acts as the conduit to release the fossil fuel in
the first place.
Economists suggest that energy is irrelevant, accounting for no more than 4 or 5 per cent of the
economy. Instead they prefer to focus on the productivity of land, labour and capital, which receive
much higher distributions of national income, with labour receiving about 70%. They view these as
independent variables which of course they are not. In the modern world, all three are derived from
energy. Whether it is the Green Revolution, the Sanitary Revolution, or the Industrial Revolution, all
owe their success to the ability to turn energy into useful work. The use of fertilizers and irrigation
lifted agricultural yields and therefore increased the carrying capacity of the Earth, whilst the clean
supply of water, the sterilisation of bacteria and the removal of waste helped extend the longevity of
the population and therefore the workforce, and of course the use of machinery has created the
equivalent of 300bn virtual workers or “energy slaves” pandering to our every need, all of which is
dependent on high quality energy.
The confusion comes from assuming that cost and value of energy are one in the same. They are not.
From the resource perspective, EROIE measures the amount of energy we can extract from the ground

22/02/2012
69
for every unit of energy we initially invest; it measures the calorific value compared with the calorific
cost. Given that almost all other factor inputs in the modern economy are derivatives of energy input,
we can say with a large degree of certainty that EROIE can equally describe the relationship between
the cost and value of energy. It should be no surprise therefore that, with an EROIE of 20, energy
costs around 5% of GDP whereas the value of energy equates to nearer 100% of GDP. Economic
research totally fails to grasp this reality.
The argument frequently offered by economists is that the modern economy has isolated itself from
the connection with energy because of its dominant service industry. This is incorrect. It is not that the
service industry uses large amounts of energy through computers or lighting and transport &
communication etc that is important, but rather that it owes its entire existence to the work done by
fossil fuels. As we mentioned in the previous chapter, we are only afforded such a large service sector
by the work done by energy in the more basic industries. If the availability of cheap high quality
energy was to fall, then we would be taxed back to working in these industries or on to the land, and
ultimately if there was insufficient energy, into a much smaller population with a significantly shorter
lifespan. Whilst an economy that has moved up the value chain into the service sector may consume
less energy per unit of GDP than an industrial economy, it will always consume more energy in
totality, even if this is embedded energy in imported manufactured goods. A little reflection makes
you realise just how totally dependent we are on fossil fuel energy.
Mother Nature’s generosity of only taxing us 5% of national income means that the remainder is up
for grabs. Debate has intensified whether an inequitable distribution of the rest of the pie was behind
the financial collapse. The median real income in the US had been fairly static since the early 1970’s,
with the exception of a bounce at the end of the 1990’s. It had therefore fallen relative to GDP. By
contrast the wealthiest 1% of earners saw their income surge from around 10% to nearly 25% of the
total. Unless the wealthy few consumed 25% of the economic output, then there was only one way to
square the circle. The average earner had to consume more than his income could finance, with the
excess being borrowed from the rich. At the end of the day however, this could only ever be a
temporary solution as there is no way for the average earner to indefinitely finance spending beyond
his or her earnings. Eventually the debt had to be defaulted on, redistributing income cumulated over
those years back to whoever had actually spent it. Whilst normal cyclicality should have prevented
this ever becoming a problem, Greenspan’s easy monetary policy continually postponed the day of
reckoning until the scale of the transfer was too big for simple monetary policy alone to defer. You
could say Greenspan made a mountain out of what would otherwise have been a series of mole hills.
Even today only a small proportion of the default or rebalance of wealth has been made, however
counterparty risk has changed from individual members of the public to society as a whole in the form
of the government. The eventual default is likely to come from a combination of higher inflation,
higher taxes and reduced government spending.
This line of reasoning would advocate that workers in the basic industries are underpaid. They are
not. If there was a higher distribution to them, then the logical conclusion is that we would all become
farmers for more money. Other industries and technologies would collapse, and with them the output
of the land, i.e. the Communist model. If society as a whole is to survive and advance, then it is right
that the best and brightest are paid the most, but only if they invest that money in technology that will
expand the balance sheet of the economy for all to enjoy. For some reason this has not been
happening. Companies are rightly rewarded for efficiency gains associated with better logistics and
cost arbitrage, but sweating existing assets harder is no match for increasing the asset base which we
are failing to do. Removing inefficiencies also means that we are more vulnerable to cascading
collapse as was clearly evident in 2007 and 2008. This unwillingness to take risks and invest beyond
the immediate time horizon is likely to get worse as our balance sheets become more constrained and
as the wealth is distributed amongst more countries, but it also means the cost of not investing is that
much bigger. Government and population have to get out of the mentality of the cost of achieving
something, and instead adopt the war-time approach of the cost of not achieving it.
Similar logic helps explain why energy is not rewarded according to the percentage of work it does. If
for example 100% of the value created was simply returned to the energy producers, no wealth would
ever be created and fossil fuels would simply be left underground. A producer’s wealth is measured in
terms of what he can buy, but if he is receiving 100% of the value created from the work that is being

22/02/2012
70
done, then no one else would work and therefore there would be no mechanism through which to turn
the energy into useful work. The theoretical maximum overall wealth that can be created is therefore
when the EROIE is highest and the energy producers require no additional payment beyond the cost
of production. This adds an additional area of concern as private capital only controls about 20% of
world oil reserves today, down from 80% in the early 1970’s, and yet it provides the bulk of
production. Prices are increasingly being determined by high cost Tar sands that really should not be
competitive whilst much cheaper to produce Middle Eastern reserves are being kept under ground.
Between 1990 and 2010 it is estimated that the global EROIE fell from 40 to 20, such that the cost of
energy went from 2.5% to 5% GDP. The higher cost meant low quality Chinese coal and high cost
Russian oil was now able to play a significant role. Low wages and the willingness to ignore pollution
and environmental damage meant that China accounted for a massive 42.4% of the increase in world
energy production between 1990 and 2009. Similarly, following the complete collapse in Russian
wages after the 1998 sovereign debt default, high cost Russian oil was also able to compete on the
world markets, accounting for 59% of the growth in world oil production over the subsequent 10
years. Today China is by far the world’s largest producer of coal accounting for around 46% of world
production, whilst Russia has overtaken Saudi Arabia as the world’s largest supplier of oil and is
second only to the US in terms of gas production.
The increased production brought about an incredible growth and transformation of the Chinese
economy and the reversal of fortunes in Russia. It has driven huge investment and elevated living
standards. Roads, rail and port infrastructure had to be developed, which required steel, cement,
trucks, trains and ships, and of course lots of labour, which itself required food and housing. As
described by the Jevons paradox mentioned earlier, the utilisation of the resources drove productivity,
and therefore lifted wages, creating demand for other products and for more energy. There was a
positive feedback loop, of which the supply of cheap energy was the lynchpin. As long as the calorific
value of the energy is greater than its calorific cost, it will be used as a substitute for labour, with the
benefit of higher economic output being distributed to the workers and to capital. Chinese political
and regulatory changes were necessary to allow the resources to be used, and for foreign capital to
come into the country, but it is the differential between the cost and value of energy that has driven
Chinese growth and lifted wages.
Whilst Chinese energy production is huge, it is not big enough. In 2009 it had to rely on imports for
nearly 12% of its needs, importing not just oil but base-load coal as well. As this increases, growth
will gradually diversify to wherever the energy is coming from. From China’s perspective, its current
account surplus is likely to fall initially and then it will have to sell capital to meet its needs, following
a similar path to what happened to the United States. It is buying up energy resources around the
world, frequently out-bidding Western majors and committing capital in countries not open to the
West. In 2008/2009 in the midst of the recession China offered credit lines to various countries in
trouble in return for rights over their energy supplies. It is also frequently accused of selling its United
Nations Security Council veto to Iran in return for future oil and gas supplies. It is not just China
doing this, after all it is hard to argue that the Iraq war wasn’t about opening up oil reserves, and even
if it was initially unsuccessful in bringing more Iraq oil to the market, it did open up Libya’s oil to the
outside world and only recently Iraq and Kuwait have agreed to share and open up the border oilfields
which were disputed in the 1st Gulf War. Putting ethics to one side there is an increasing transfer of
capital into resource rich economies in order to secure supplies, with the consequence that their own
resource consumption is soaring.
The energy network is dynamic. It will change shape and location to encompass whatever is the
cheapest marginal fuel or source of energy at the time. Over the last twenty years this has come
predominantly from China, but domestic fuel production is unable to meet the world’s needs and the
network is already evolving. At the moment the Chinese domestic energy network is still expanding,
but as its supplies become increasingly expensive to that available elsewhere, its relative growth will
fall. Whilst there is a very consensual view that China will overtake the West over the next 10 or 20
years and return to the position of economic pre-eminence that it enjoyed 400 or 500 years ago,
perhaps it is worth considering why it slipped from that position in the first place. Like the UK China
exhausted its timber resources, but the reason it didn’t turn to coal beyond meeting domestic needs
until relatively recently was that the quality of coal was low and was in areas isolated from the main

22/02/2012
71
cities, making it very expensive. Rapids along the Yellow River meant it could not easily be
transported by boat, and even if it could, there was no way of returning the ships up river for a second
trip, leaving transport over large distances to be done by animals. The high cost meant that it simply
could not compete with somewhere like Britain, or later the United States which could get their main
factor input significantly cheaper. We have to understand that China’s growth over the last twenty
years was because the global EROIE had fallen sufficiently that its coal became the marginal fuel,
attracting capital from the rest of the world to develop and exploit those reserves. The fact that China
is now having to import ever greater amounts of its fuel suggests that the window during which it was
the most competitive energy source is gradually moving away from it. Its future will therefore depend
on just how rapidly its own EROIE declines relative to that of the broader market.
As the energy network morphed into China, in order to maintain the net supply of energy to the rest of
the world, the gross supply had to increase. China’s consumption of energy soared both in terms of
the steel and capital goods, and the labour and natural resources necessary to extract the coal and turn
it into useful work, and also in terms of the value-add maintained domestically from the coal which
lifted it out of poverty. Given that it was the marginal fuel it should have been inflationary however,
by opening up the enormous quantity of cheap Chinese labour to the rest of the world, the combined
result was disinflation. Similarly being a dirty, environmentally unacceptable fuel, the cost of
exploiting it in the West would have been prohibitively high however China’s willingness to ignore
these externalities meant that the West could enjoy the work done by coal through cheap
manufactured imports without directly suffering the environmental costs. Outsourcing Western
technology and industry to China was more cost-effective than importing the coal however the
benefits were simply due to environmental and social arbitrage rather than relative productivity. As
the energy network starts to move away from China as its resources deplete, it seems likely that the
next marginal energy source will be inflationary rather than disinflationary as there is unlikely to be
the accompanying supply of a huge new unexploited workforce. Indeed we are already seeing this
from the inflation emanating from China itself as it has already, to a large extent, exhausted its own
factors of production.
The Middle East and North Africa’s energy consumption is growing as fast as China’s, albeit from a
lower base. Saudi Arabia is adding 3GW of new power capacity each year, which alone will increase
its annual oil consumption incrementally by 100,000 bpd. Its monetary agency plans to spend
USD400bn between 2010 and 2015 upgrading infrastructure. It has a 2 million housing shortfall
which is growing by 150,000 units each year due to demographics. Kuwait is to spend USD104.2bn
on building new ports and cities. The Gulf Cooperation Council is investing USD100bn in high speed
rail. Egypt and the UAE both plan nuclear power plants , and there is talk that Saudi Arabia will need
to spend USD50bn over the next 10 years on building desalination plants alone. This is all icing on
the cake. The real spending or investment will be on resource extraction as the EROIE or well
productivity continues to fall and as more wells rely on enhanced recovery techniques to maintain
production.
In the past Saudi Arabia had sufficiently large capacity and small population to support that it could
afford to act as swing producer and set world oil prices. If it put supply on the market, it would lower
the marginal cost of production and therefore price out higher cost producers. Alternatively if it chose
to limit supplies, then it would enjoy extremely large margins relative to its competition. In a small
desert kingdom such as Saudi Arabia which suffers a lot of natural barriers to industry, the extremely
high return on capital for the oil industry meant that other industries could not compete for funds,
skilled workers or government support. It was far better to sell oil abroad at a price somewhere
between the cost and value of the oil than it was to try and extract the value domestically. This was
particularly the case when other hidden benefits such as the security that the US military afforded it
were included, which for such a rich but small country was extremely important. Today, with a much
larger educated population, and a rising cost of production, Saudi Arabia needs to extract more of the
value of the oil itself. Its budget for example requires USD75bbl to balance. Consequently, both it and
the Arab nations in general are gradually building up domestic industry, mainly in petrochemicals,
which is reducing the amount of oil available for export.
As swing producer, Saudi Arabia had a major political role over the last 40 years. This was initially
seen in 1973 when it wielded the “oil sword”, cutting production by 10% and sending prices sky high

22/02/2012
72
despite the Shah of Iran upping production to try and compensate. Following the revolution Iran cut
production from 6m bpd in 1978 to 1.9m bpd by 1980. Initially Saudi Arabia tried to compensate
although even it could not bring those sorts of supplies on stream, leaving the US to face its worst
recession since the Great Depression. By 1983 it started to bring production down, needing high
prices to allow Iran and Iraq to finance their war of mutual destruction. In 1986 when the war was
coming to an end and the two countries were effectively bankrupt, it ramped up production pushing
prices down to stop the two countries rebuilding their economies. By pushing prices down it also
helped bring an end to the Soviet Union which had relied on oil exports for international currency.
Setting prices relatively low transferred the bulk of the value created by oil to the industrial
economies, whereas setting the price higher kept more of the value in the oil producing countries. Of
course price signals are what eventually brings more fuel production, allowing North Sea and Alaskan
oil to be exploited in the 1980’s, the Chinese coal in the 1990’s and the Canadian Tar Sands today,
but with rising costs due to a lower EROIE and reduced value due to a lower energy density, the
global economy is being squeezed from both sides. Unfortunately because big basic science is
generally controlled by government, layers of bureaucracy and spin, as well as the ability to run
extremely large budget deficits, mean that price signals do not have the same immediate effect.
If there was a free market in oil and gas, and if we believed the Middle East reserve estimates, then
capital would fly into the region to exploit the oil. As it is production and investment is restricted by
OPEC to support prices. This form of capital control is necessary to maintain domestically the lion’s
share of the value of the oil rather than just the cost. Other businesses in the region cannot compete
for either skilled labour or for capital with the oil industry because of their super-normal profits, and
therefore have to rely on government transfer payments, or in some cases intimidation, to keep the
population under control. To some extent therefore the Middle East’s political problems can be
blamed on its resource endowment.
Over the next 10 years, I estimate that, other things being equal, the EROIE will fall from 20 to just 5.
The cost of getting energy out of the ground will rise from 5% of economic output to 20%. On an
annualised basis, it equates to a 14.8% per annum increase in the energy network, and a 1.7% per
annum contraction in the rest of the economy, ie a 16.5% per annum relative switch. Over the last 20
years by comparison, the fall in EROIE from 40 to 20 would have resulted in a 3.8% per annum
switch, so it is on a different scale altogether. If this happens under the cover of an increase in the
overall net energy market, then it would certainly make the rotation significantly easier to stomach. If
the supplies of energy rose by 3% per annum for example the energy network would expand by 18.3%
per annum and the rest of the economy would grow by1.2% per annum. If however the scale of this
transfer is simply too big for the economies to manage, then the energy network will be starved of the
capital necessary to maintain net output, resulting in the peak energy that so many commentators
deny. If politics and friction slow the transfer, the global economy would contract along with the
energy supply, making the necessary future capital transfer that much bigger relative to the size of the
economy, and therefore that much less likely to happen. Production would never be recovered and
capital would also peak.
Whilst I have been dismissive of such sources of energy as wind, solar, tar sands and shale gas, these
will all feature as part of the dynamically evolving energy network, as will oil, coal and gas reserves
in remote, inhospitable and perhaps politically sensitive parts of the world. The point is that they are
inefficient in comparison to what we have today, and they need a huge capital transfer from the rest of
the economy to accommodate this to maintain net energy production at existing levels. This 16.5%
per annum relative switch will be driven by price rises, but that is necessary to; for example, increase
the well count, the number of wind turbines, the number of floating LNG plants needed to offset the
declining EROIE. The 16.5% price rise is not profit. It is needed to pay for the extra oil rigs, the
copper required in the wind turbines, the increased technology and capital equipment required to
upgrade the energy density to suit our needs, the increased agricultural yields necessary to offset any
decline in agricultural land, and of course in increased wages necessary to attract sufficient workers
into these industries to make this all possible.
The story actually gets worse. As is very evidently already happening, the resource rich nations rightly
want to keep a larger proportion of the value added domestically. Brazil for example has said that it
will not sell any crude oil to the outside world, only refined product or manufactured goods. It also

22/02/2012
73
intends to manufacture the steel and production platforms for its oil industry at home, keeping more
of the wealth created. Australia is discussing a resource tax and even suggesting that China moves its
steel mills to Australia. Russia will raise the mineral extraction tax on gas by 61% from January 2011
onwards, such that more of the value added remains internal to the country. Mongolia is setting up
industrial parks to process iron ore, copper, coal and crude oil including a coke plant, a copper
smelter and an oil refinery to keep more of the wealth generated from its resources internally. South
Africa has imposed a 6 month moratorium on mining prospective bids whilst it considers whether to
set up a state-owned mining company. Even Chile’s move to refuse any more fresh water rights to the
mining industry – (effectively a subsidy) - and force them to use desalinated water instead, will have a
similar consequence. Not only is the global energy network going to grow relative to the rest of the
economy, but the location of these other industries may also change for political rather than economic
reasons.
By forcing a larger capital transfer than that necessary to maintain or grow the existing net energy
supply, these countries are similarly risking peak production. Such misallocation of capital will raise
the cost of extracting the resources and therefore limit the pace of recovery. As I mentioned in the
previous chapter, all the factors of production are interdependent and so whether Peak Capital causes
Peak Oil or the other way about, is to some extent irrelevant. In Soviet times, fighting the geological
decline with additional capital transfers starved the broader economy of the resources necessary to
compete in the Arms Race. In order to maximise the efficiency of the economy, putting all emotions to
one side, we realize that the social and economic systems are not always one in the same, and that
certain social costs are simply a tax on the economy that we may no longer be able to afford.
The scale of capital transfer is huge. There is no way it can happen smoothly unless it is accompanied
by growth in the supply of energy, and the only way that seems likely to happen is if the markets have
full information, there are no inefficiencies in the transmission process such as taxes and bureaucracy,
and there is no debt or obligations overhanging the market, none of which is remotely realistic.
Breaking down these barriers and increasing the flexibility of the workforce is vital to positioning
economies to adapt to these changes and to stay in the game the longest. Remember that this
reallocation of capital is happening simply to maintain existing energy output, so anything that
reduces this switch will negatively affect the global economy as a whole. If the switch slowed such
that the relative loss of wealth in the rest of the economy was reduced, the absolute loss of wealth
would be that much bigger. It is a very dim picture indeed.
Recent history shows that between 1980 and 2000 any country that saw the net energy consumption
per capita fall became a failed state. At an EROIE of 1 no work will be done. As we approach that
limit, the amount of resources required to compensate for the declining geological efficiency will rise.
At some point before the EROIE reaches 1 the opportunity cost measured in terms of externalities
such as the amount of land required, will become too expensive and existing net supplies of energy
will fall. For the moment, whilst the EROIE is still relatively high, the cost of that reduction in net
energy is a reduced standard of living; doing without that latest gadget, not having a holiday abroad
and being unable to service outstanding debt. As the EROIE falls further and the cost to value ratio
rises into the double digits and then into the teens, that cost will become much more serious,
eventually affecting the size of the population itself.
The picture I describe offers nothing more than a managed collapse. To find a solution, we have to
make an adjustment over and beyond that forced on us by the decline in EROIE. More of the value
from the energy has to be directed towards the new sciences that may eventually halt and reverse this
trend, and less towards end consumption. Simply bringing in more and more inefficient energy
supplies is no solution. We must recognise that all it does is give us breathing time and the
opportunity to develop the necessary science to advance to a new economic plane, but only if we so
chose. Governments have to take the lead and encourage this switch.

22/02/2012
74
Chapter 10
The Terms of Trade.
The network of interdependency that we call the economy is based on, and helps determine the
relative price of goods. All those relationships are about to change!
The broad picture is very clear. As the EROIE falls due to geological decline, the cost of energy will
rise relative to the work it can do. So far we have only looked at the direct relationship between energy
and the economy, but to understand how these changes might affect us we also need to consider the
financial systems through which these changes will take place, the balance sheet of individual
countries and of individuals within those countries as well as the social and economic infrastructure.
Is it sufficiently flexible to adapt to new circumstances and compete for the resources available or will
pre-conceived ideas and values relegate it to a much lower standard of living?
If there is to be a restructuring of the economy as I have described, pricing seems to be the mechanism
through which this will happen. Prices of resources will rise in absolute and real terms, whilst those of
other industries unrelated will suffer. The great debate over whether the world faces inflation or
deflation is to some extent erroneous. It faces both. There will be inflation and employment growth in
those economies and industries constituting the energy network or energy producers and deflation and
unemployment in the rest of the world. I should clarify that. There will be an increase in the standard
of living in the resource rich countries and a decrease in the standard of living elsewhere; however
with no easy mechanism for cutting wages other than through job losses, this reduction is likely to be
in real rather than nominal incomes as it is politically more acceptable. At the moment, by dismissing
these price signals as one-off or cyclical events, and basing monetary policy off the “core” or
disinflationary side of this equation, central bankers are adding to the misallocation of capital.
The shape and location of the energy network is dynamic and in constant change. It evolves as capital
seeks new supplies of fuel. The “resource grab” story that economists frequently talk about is simply a
reflection of this changing shape. Over the last twenty years the growth of the energy network was
predominantly inside China. Today the same network is morphing to add different sources of coal and
hydro power within China, but this is no longer sufficient to meet world, or indeed Chinese demand.
Capital flows will gradually dismantle the old network as it becomes exhausted or inefficient and

22/02/2012
75
build a new network. The same dynamic breakdown of the rest of the economy will happen as this
increasingly becomes the source of capital for this change; however this is unlikely to be evenly
spread, either around the world or across different industries.
Over the last twenty years the marginal fuel required to meet world demand was predominantly
Chinese coal and then later Russian oil. As the marginal fuel it should have been inflationary,
however the mobilisation of cheap Chinese and former Soviet labour, together with much lower
environmental regulations, allowed this to be offset with an even greater disinflationary force. As the
marginal fuel moves away from China and encompasses FLNG around Australia and shale gas in the
United States, deep offshore and Arctic oil, and gas to liquids technology in the Middle East, or even
wind and solar energy on our own precious land over the next few years, there is unlikely to be a
similar offsetting disinflationary force.
The CPI (consumer price index) of food and energy will rise until it causes demand destruction. To
maintain the net supply of energy, the gross supply has to increase. The amount of equipment,
technology and labour required to extract the fuel will soar, lifting industry wages. The new found
wealth within some of the countries will drive major infrastructure and social programmes such as
schools and hospitals, as well as increased spending on security and arms manufacture. The energy
importing countries have to position themselves to benefit from this transfer of wealth. Engineering
expertise will be in great demand, benefitting economies such as Germany’s and South Korea’s.
Increased wealth will drive the Middle East’s and North Africa’s food consumption, which can only
be met from the West, Latin America, Europe or perhaps bits of Africa as Asia already suffers from its
own deficit. Rapidly expanding wealth in the resource rich economies will create demand for other
consumer goods such as cars and other manufactured and luxury goods, which will be the main source
of growth for some of the Western companies, possibly resulting in a divergence between corporate
earnings and domestic output.
The rising food prices that are causing governments to topple across the Middle East and North Africa
are likely to be met with higher oil prices, bringing domestic finances and politics back into balance,
but transferring the pain of demand destruction elsewhere. Those countries most dependent on
imports for resources – (food, energy and industrial metals) – and, most sensitive to the changing
terms of trade between those resources and manufactured goods, will be knocked over one by one.
Demand destruction will not be evenly spread, either across different industry or around the world. It
will be determined by which country has the resources and which countries can pay the most for those
resources.
Those of us facing higher resource prices without a commensurate rise in incomes will have to make
sacrifices. The market prices out the marginal consumer rather than sharing the pain across society as
a whole, however government then makes its own transfer payments to try and compensate. Taxing
productive assets and subsidising unproductive ones will negatively affect a country’s efficiency and
its ability to compete in the world. A country that best allocates its resources will see the relative cost
of capital fall; whereas those that badly manage this loss of wealth will see capital leave the country
and the process happen more rapidly. Again this is very apparent within Western Europe where the
countries running large public or private sector deficits have suffered massive withdrawal of funds
whilst those that have allocated capital more productively are seeing strong relative growth. Banks
and financial intermediaries that can divorce themselves from domestic weakness and manage the
global transfer of funds stand to benefit enormously whereas those that can’t will be the biggest losers.
The politics of the situation will be the hardest thing to overcome. The changing terms of trade will
redistribute income both internally and externally, causing large resentment, anger and hostility over
losses of wealth. How the government deals with this will be vital. Simply using fiscal policy to
maintain the status quo will not help; it will make the situation worse causing a capital flight.
Flexibility to adapt individual economies to serve the changing energy network is vital. That means
flexibility in jobs and wages including the minimum wage. It also means having the right
infrastructure, educated workforce and the right tax policies to attract capital. Large debt levels,
particularly when combined with weak bank balance sheets reduce that flexibility so it is essential to
work through outstanding debt as quickly as possible even if this does mean austerity and pain. Whilst
the electorate may not like policy, and turnover of government may therefore become more rapid, the

22/02/2012
76
reality is that the adjustment has been taken out of politicians hands by the capital markets and
government control is now limited to the minutiae of policy within the broader direction set by the
financial markets. The only way government can take back that control is to get ahead of the curve
and allocate capital more productively despite the pain and objection this causes to parts of the
electorate.
Under a system of democracy resources are allocated according to social and political, rather than
economic interests. Governments are simply not given the mandate to take the tough decisions
necessary to drive competition and growth. Like the financial markets, politicians allocate resources
according to profitability, or in their case votes, rather than productivity. The major science and
investment programmes necessary to drive sustainable advancement, but with pay-out profiles longer
than the 4 or 5 year parliamentary election cycles, are given lip-service only. The tough love necessary
for economic advancement is not a vote winner so often it requires financial failure to transfer the
tools of power to an independent body such as the IMF that can force a country to deploy its assets
more productively. Under the Gold Standard, which was a creditor based system; countries were again
obliged to allocate their capital in a productive manner so they could compete with others in the
international markets. It was only when the rules of the Gold Standard were overruled that inefficient
production was kept operative through borrowing from a creditor nation. Unfortunately the rules of
the Gold Standard proved too tough for politicians to adhere to so it was dropped in favour of a fiat
system known as the Dollar Standard which has allowed monetary profitability and economic
productivity to become separated. Ultimately however that separation – (effectively factor
mobilisation) - can only ever be temporary because it is Malthusianism, and resource prices will rise
until capital is deployed in a sufficiently productive manner commensurate with the resource base,
itself determined by the level of scientific understanding.
The monetary but not fiscal union of the euro should be similar to the Gold Standard. The German
electorate is unlikely to support inter government loans of their earnings to less efficient countries
such as Greece. They will only lend money to bail out Greece’s recent excessive consumption if the
Greeks agree to restructure or reallocate their resources along lines determined by the Germans. The
system has temporarily removed power from the Greek politicians, and ultimately from the Greek
public, to an independent source that should only be influenced by ensuring an adequate return on its
loan. Corporate Germany will have some exposure to Greece so there are some conflicts of interest,
but nevertheless it is easier to force the restructuring necessary for productivity gains by making it a
condition of any financial support. Those German companies with exposure will themselves have to
restructure to offset any loss of business. If the Greek public are not willing to accept the terms of the
loan, their only recourse is to leave the euro, hitting their standard of living but not necessarily
imposing the restructuring necessary to lift productivity and ultimately output. Once again it is a
choice between sustainable productivity and decline through factor mobilisation and eventual
exhaustion.
Different systems fail at different rates. The financial markets can price in failure almost overnight,
but underlying industries may take months or even years to adjust. Disruptions to production of
semiconductors, from for example an earthquake in Taiwan, will not affect US industry immediately
as supplies take several weeks to be shipped across the Pacific, but the shortfall eventually catches up
leaving assembly lines to be idled, shops with empty shelves and disappointed consumers as happened
in 1999. Other systems can take years before failure happens. US underinvestment in infrastructure
has been a form of borrowing from the future, and although it negatively affects productivity today,
the real day of reckoning may still be years away. Countries and industries can therefore maintain a
poor allocation of capital without necessarily affecting the economy immediately, but over time these
inefficiencies will catch up, negatively affecting the ability to compete with the outside world for the
available resources.
The consumption of energy can also be front-loaded. Most of us are under the impression that
aeroplanes are far less efficient than trains; however research suggests that when all the costs of
initially digging embankments and laying the track are included, then trains and planes are equally
efficient. The difference is that the train has taken the cost up-front and therefore its operation can
give a competitive edge depending on how the country reliant on planes invested that initial saving.

22/02/2012
77
Similarly, with energy sources such as nuclear, hydro, wind and solar, most of the cost comes in the
initial construction phase. Those countries that have already made the investment will have a different
economic profile to those that haven’t. Like Formula One cars pitting for wet tyres, if they make the
shift to these more expensive forms of energy too soon, they will lose track position rapidly and by the
time it does start raining, their tyres may already have eroded. The fact that Western Europe is head
and shoulders above the rest of the world in terms of adopting these alternative energies does not
necessarily put it at an economic advantage, although it seems to be maintaining its competitive edge
despite this handicap. It also does not necessarily mean that it has reduced its exposure to fossil fuels
as the data would suggest, as the fossil fuels may simply be deployed in the production of the
alternative equipment rather than for end use. Outsourcing or offshoring production can also distort
figures giving the false impression of energy efficiency. In Europe’s case however the figures appear
genuine; a history of stubbornly high fuel taxes has forced industry to be the most energy efficient in
the world.
Banks, pension funds and insurance companies are exposed to the wrong part of the economy, as
indeed are most of us for the simple reason that it is by far the larger part, accounting for about 95%
of existing output. With minimal excess capital the ability to absorb any fall in assets is limited. Asset
sales become necessary to meet liabilities and cover cash flow, forcing prices lower and reinforcing
the negative feedback loop. Suddenly a few over-indebted sub-prime mortgage borrowers can bring
the whole house of cards tumbling down, forcing the financial markets to withdraw funding from
companies that would otherwise be perfectly profitable and putting millions of people needlessly on
the scrapheap. Central banks’ monetary policy must act as a firebreak to stop a small adjustment
turning into a collapse. On the other hand too loose a policy will result in the misallocation of
resources, supporting inefficient industry and consumption that should be priced out. Policy that
allows asset prices to diverge from the real economy will drain resources from productivity and
accelerate the loss of capital from the country. Reducing debt or accepting where the pain of past
excesses will fall, whether through austerity or monetisation, must be the priority.
Modern day economies and industries are interconnected, making them vulnerable to failure. The
reduction of inventories, just-in-time production, and computerised control of logistics has resulted in
vast supply chains susceptible to interruption. Both financial and operational leverage add to cascade
and contagion risk. Financial sector debt, i.e. debt between banks which economists have historically
ignored as double counting, is yet another of these vulnerabilities as it ties what might otherwise be
unrelated streams of earnings together. Just as someone suffering a communicable disease is isolated
from the rest of the community, so we must break the systems that presently allow failure to be
transmitted from one industry to another. That means reducing leverage, although not at the expense
of efficiency as firms will have to compete even more aggressively for the available resources.
Eliminating waste such as non-jobs in government and reduced bureaucracy are essential to achieving
this aim, however this does not mean paying people to sit on the dole but rather retraining them and
employing them to do something productive for the economy. This is why Germany appears to have
come out of the recession in a strong position. Instead of laying-off staff and paying unemployment
benefit, the government offered funds to support industry retraining staff with the latest ideas and
technology. We have to accept that we can no longer afford the inefficient distribution of wealth that a
lot of us have got used to.
Perhaps the biggest area of cascade risk stems from the so-called Dollar Standard. Because
international trade is mainly settled in dollars, the US must run a current account deficit. It is a debtor
system whereas the Gold Standard was a creditor system. Given that it is the only country that can
issue dollars, if it ran a surplus, it would gradually suck the international market dry, leaving no
currency with which to trade. For the system to function properly, the US must borrow, but either
those borrowed funds must be invested in productivity and scientific advancement, or if it is invested
in consumption then the international lenders have to accept a gradual default on their loans. For the
last 10 years or so the US has run large deficits, but has consumed rather than invested the money.
Unfortunately the lender, China, has been unwilling to accept the necessary default by allowing its
currency to appreciate against the dollar. Clearly this is an unsustainable position, and something had
to give. In 2008 the system snapped as soaring resource prices gradually took the decision out of
China’s hands, forcing the US subprime mortgage holders to default. As US asset prices plunged, so
money supply also collapsed sucking dollars out of the world system and causing trade to grind to a

22/02/2012
78
halt. With a sudden shrinkage in the monetary base, the price of the dollar (dollar index) jumped
almost 25% in 4 months. International assets had to be sold to meet dollar commitments, causing
dominos to fall across the world and massive wealth to be destroyed. Eventually the US Federal
Reserve did pump sufficient dollars back into the system by expanding its own balance sheet and
issuing swap lines to other central banks, but by then the damage had been done. Until the US
restructures its economy sufficiently that it can start to pay down its huge outstanding debt, or China
accepts the inevitable default on its US dollar loans and allows its currency to appreciate, the
international system is at risk of another major collapse in US asset prices, whether nominal or real
depending on whether the Federal Reserve monetises that default or not. Resource prices will
inevitably rise until capital is allocated productively.
Breaking this single system and replacing it with several currencies that can be used internationally
will act to lower the risk of contagion, but it will introduce a layer of inefficiency and extra cost. It
will also result in the world dividing into several competing economic blocs. We already have the
European bloc and China is trying to initiate an Asian bloc by getting the Renminbi accepted as the
currency of choice in intra-Asian trade. If it is successful it will increasingly tie other Asian
economies to China, aligning their industries to meet its needs. In the short term this is attractive, but
by doing so it makes them extremely vulnerable if the Chinese juggernaut were to fail. As the Cold
War experience tells us, dividing the world into blocs puts those regions in competition with each
other, both economically and ultimately from a security perspective. On the other hand if the US
wants the dollar to remain the world reserve currency with all the benefits of cheap capital that go
with that position, it must accept its responsibility of ensuring a smooth functioning of the
international monetary system by investing that benefit in economic advancement rather than simple
consumption.
For the moment it is China that is still on the dollar standard and therefore potentially vulnerable to
US monetary policy. If the US decides to flood the world with dollars, driving up commodity prices
and transferring purchasing power and therefore debt to the rest of the world, then without capital
controls there is little other countries can do to resist the flow of money. In the 1970’s this policy was
used to good effect, depending on your point of view. The supply of dollars drove commodity prices
aggressively higher encouraging the resource rich economies to enjoy their new found wealth in what
became known as the New International Economic Order, only to be saddled with huge debts when
the Fed eventually tightened monetary policy in the early 1980’s drawing dollars back home. Between
the end of 1979 and the high in March 1985 the Fed’s broad trade weighted dollar index rose an
incredible 93% leaving the emerging market borrowers in a financial mess that took them decades to
recover from and also coincidentally, resulted in them having to flood the world with commodities for
the next 20 years in order to try and service that debt. If my thesis is correct, the transfer of
purchasing power to the resource rich commodity exporters is going to happen anyway, so this time it
is more about transferring debt to the inefficient countries competing for the resources. Whilst this
may seem unfair, China’s accumulation of nearly USD2.5trn of foreign exchange reserves reflects a
poor domestic allocation of capital as the US simply does not have the productive capacity to pay for
those goods along with everything else it consumes. China has invested in capacity the world simply
cannot afford and their politicians crying foul when the Federal Reserve is monetising that debt is just
jobbing backwards.
Often the response to the energy story is the elimination of waste, but what is waste? Getting 4 people
to travel in a single car to work for example is often cited as one way to reduce fuel consumption, but
this is not waste; it is choice. Each of those 4 people wants their own car and the freedom it offers. At
some price they will decide that freedom is not worth it and choose to eliminate 3 of the cars, with the
consequence of a much reduced auto industry. Not only would the manufacturers and dealers have to
scale down, but there would also be less need for mechanics, gasoline stations, roads or speed
cameras, signs and cleaning equipment. Even the service industry would suffer as there would be less
need for road tax & registration records, or for car insurance. Unless the cars are replaced with better
technology – (not necessarily in transport) - the decision to eliminate 3 out of every 4 vehicles is
simply an acceptance of a lower standard of living. Rather than stopping producing cars, the saving
comes from accepting a lower wage and exporting the 3 cars that you can no longer afford,
positioning yourself to better compete for the remaining fuel. “Efficiency gains” of this sort are not
about eliminating waste, but rather about accepting a lower standard of living and prioritising which

22/02/2012
79
part of the economy takes the hit. Waste comes from not using our factor inputs in the most
productive manner to best achieve the objective. On this basis there are huge savings that can be made
as illustrated by rationing and other redirection of resources in WWII. It is essential that government
stands back from the noise of the markets and from individual wishes and determines the best path to
secure our long term future, focussing education, grants and tax policy on supporting maths, sciences
and engineering and reducing the arts and services. If however we cannot achieve a technical
efficiency gain, at the very least we have to achieve an apparent economic gain by sacrificing domestic
consumption.
Demand destruction will not be evenly distributed around the world. It is a relative game and
countries must compete for the resources that are available. Efficiency should be the key variable
determining which countries win and which countries lose, although politics will undoubtedly be part
of the equation. Even if one country is technically far more energy efficient than another, it also has to
be socially more efficient, accepting a proportionately lower income per capita than its output would
imply. China for example consumes twice the energy per unit of Purchasing Power Parity GDP than
does the US, but by accepting a lower standard of living than this ratio would suggest, it runs a
current account surplus with the outside world whereas the US runs a deficit. A much higher overall
level of wealth in the US gives it far greater flexibility in adjusting its economy to win out in the end.
If it can make the adjustment, there is no reason why it can’t run a trade surplus, draining dollars out
of the world system and taking jobs back from China and the rest of the world.
Markets allocate capital according to profitability rather than either productivity or efficiency,
however this is a limited game as inefficient output or factor mobilisation will eventually suffer from
resource constraint. Investment decisions that have been based on short term profitability will be
found out over time by prices moving to reflect the optimal use of the different factor inputs. Given
the scale of capital misallocation over recent years visible from such measures as the growth of debt
relative to GDP – (if capital had been allocated efficiently, debt might have risen to higher levels but
would have fallen relative to GDP) - the price moves will be substantial. The huge environmental
impact of China’s growth on its natural balance sheet has similarly meant that its productivity has
been more apparent than real, and as this collapses over time, its ability to compete for resources with
the outside world will disappear. A lot of industry globally is based on relative prices that will no
longer hold.
The utility derived from consumption means that low productivity workers spend a higher percentage
of their income on resource intensive products such as food, shelter, clothing and transport than their
more productive counterparts, and will therefore be the ones who suffer the largest relative price
change. Unfortunately the misallocation of capital means that low wages and low productivity don’t
always go hand in hand with for example public sector workers frequently subsidised by the more
productive private sector, raising the resource intensity of that economy. These misallocations of
capital will be rectified with both carrot and stick price movements, however increased government
borrowing and taxes will mean the adjustment process is not smooth. Inefficiencies will accumulate
until the financial markets force adjustment on overly-indebted government.
The present global network of interdependencies was built to maximise energy production with an
EROIE of 20. It is not be suitable for an EROIE of 15 and one that is will not be suitable for an
EROIE of 10. The network tying energy production together will become more complex as storage
systems, smart grids and energy conversion facilities become ever more essential to maintain net
output, whilst that describing the rest of the economy will have to become both smaller, simpler, more
efficient and increasingly relevant to the energy producers to best position itself in this new world.
The terms of trade describing relationships, both internal to an economy and external to other
countries will continually be torn down and rebuilt to maximise efficiency. How smoothly economies
adapt to this dynamically changing network will determine how long they stay in the game.
Bureaucracy and other inefficient uses of resources must be eliminated.
Weak balance sheets from more expensive energy and underfunded public and private sector pension
funds result in an inability to take risk and secure efficiency gains. Equity multiples contract whilst
Treasury yields fall, both reflecting and simultaneously causing lower growth. Markets allocate capital
appropriate to economic conditions. As balance sheets deteriorate, the cost of funding for basic utility

22/02/2012
80
consumption will fall whilst the cost of achieving productivity gains and expanding the overall
balance sheet will rise. Policy must be put in place to offset this and allow appropriate investment to
happen. Pension liabilities have to be defaulted on, perhaps by removing any linkage to inflation;
whilst government must redirect funding from social spending programmes to the kind of technology
that will allow domestic industry to best compete with the outside world. Targeting specific industries
may be appropriate, perhaps through government sponsored programmes with the aim of destroying
international competition. Government priority has to be the improvement of the country’s total
balance sheet and the maximisation of both corporate and intellectual capital. US stimulus spending
that adds to its trade deficit and creates jobs in China, its main competitor for tradable resources,
whilst adding to the stock of domestic debt is most certainly not appropriate unless the two countries
act as one closed system, which to some extent is a consequence of the dollar standard. Rather than
taxing US productive assets to subsidise Chinese competition, the US must direct its capital far more
intelligently.
Existing surpluses are based off today’s terms of trade. It seems highly likely that if the price of
energy rises, the relative price of other goods will also change, perhaps dramatically. Our whole chain
of priorities will move altering our finances and our ability to service outstanding debt. Even the
increased volatility in the terms of trade will be reflected in higher funding costs. The changes will
not only affect household preferences directly, but will also affect relative component prices within
manufactured goods, and the prices of services and infrastructure that are provided by government.
Investment that was once profitable may quickly become obsolete as rising shipping costs turn the
outsourcing model on its head. One way to lessen the immediate effect is to invest in solar panels,
wind farms and nuclear fission. Whilst I don’t believe they can ever stand on their own two feet, they
will at least lock in today’s fossil fuel price and EROIE for the lifespan of the alternative energy
equipment.
In the first quarter of 2009 the terms of trade improvement purely from a lower oil price, was
sufficient to boost South Korea’s GDP by 4.27%. This was the most exposed of the major energy
importing economies at the time, but rapid expansion of India’s and China’s energy needs combined
with their technical inefficiency means that they will soon be the most susceptible of the energy
importers to these changes. With Asia being the only continent that is a net importer of food, it is also
likely to suffer from the close relationship between food and energy.

22/02/2012
81
World Bank.
Terms of trade improvement for oil between early 2009 and average of
2008 expressed as a percentage of GDP
Iran -26.78 Albania 0.86
Saudi Arabia -25.36 Netherlands 0.96
Algeria -22.04 Italy 1.02
Angola -21.42 Spain 1.03
Kuwait -21.36 Greece 1.08
Kazakhstan -16.89 Hong Kong 1.16
Bahrain -11.13 Ireland 1.18
Venezuela -10.07 Poland 1.18
Norway -9.34 Belgium 1.26
Russia -6.93 Switzerland 1.28
Argentina -4.79 Czech Republic 1.45
Australia -3.38 Belarus 1.48
South Africa -1.95 Japan 1.54
Mexico -1.12 Bangladesh 1.68
Canada -1.06 Croatia 1.70
Brazil -0.61 Bulgaria 1.83
Denmark -0.39 China 1.97
Indonesia -0.14 Israel 2.27
UK 0.03 Pakistan 2.37
Singapore 0.11 Antigua & Barbuda 2.63
Iceland 0.32 Philippines 2.78
Malaysia 0.42 India 2.85
United States 0.52 Taiwan 2.89
Sweden 0.66 Dominican Republic 2.92
Austria 0.67 Thailand 3.07
Germany 0.78 South Korea 4.27
France 0.84 Cambodia 4.96
Lebanon 5.28
Mexico, the UK, China and India will become increasingly dependent
on imports in the near term, whilst Brazil will be more self-sufficient.
(Add in coal and food and the movement will be even larger).
Changes to the terms of trade may also change the location of debt. This could be on a huge scale
turning creditor nations into debtors or the other way around. Whether by accident or design, the US
ethanol policy will help move the terms of trade in its favour, thereby transferring its debt abroad.
Whilst corn based ethanol makes no sense as a source of fuel, by targeting domestic production to rise
from 7.5bn gallons in 2012 to 20.5bn by 2015 and 36bn by 2022, it will lift food prices dramatically.
As the world’s largest exporter of grains, accounting for between 40% and 50% of total exports, the
terms of trade should move heavily in the US favour. A resource tax on grains would achieve similar
results and be far cheaper to administer, but would be seen as political and open to retaliation from
abroad. 1970’s experience highlights that if food prices do rise aggressively the energy producing
Middle East can turn to growing crops with desalinated water, effectively playing the US at its own
game. The scope for manipulating prices will therefore be limited, and must be aimed at the
competing energy importing nations rather than those producing it. Similar policies have been
adopted by other countries limiting food exports under the pretext of keeping domestic inflation under
control, but the really big changes in terms of trade are not driven by policy but rather by economics.
Given the numbers involved, knocking out some of the marginal consuming countries will have little
effect. One of the giants, or a whole economic bloc, needs to be removed. History tells us that will not
happen in one go, but by a series of failures. A currency bloc gets its strength from the sum of
individual member states, but it is only as strong as its weakest link. Neither of the superpowers
fought each other directly in the Cold War, but they fought by proxy in places like Vietnam, Korea
and Afghanistan. They also fought each other economically and technically, with the Arms Race an
obvious example, forcing an allocation of resources that the USSR simply could not sustain. The
formation of political coalitions may also be designed to pressure vulnerabilities and break the weak

22/02/2012
82
links. Whether intentional or not, to some extent this is already happening between the US and China
with for example China using its UN veto to support Iran, and using dollar loans to support other
resource producers during the height of the financial collapse. Such political chess is likely to
intensify, trying to exploit inefficiencies and help stack the cards one way or another.
Capital equipment and technology used in the energy consuming economies will benefit from higher
prices, but so too will certain consumer goods as global wealth is distributed over a larger work force.
Industries will have to be sufficiently flexible to meet the preferences of the energy producing
economies. To some extent the US may be at a disadvantage as far as this is concerned as its own
economy is so large that output is very much geared for its own tastes. Its cars for example do not
travel well as they are far too big for most countries’ roads. On the other hand its vast land area and
productive agricultural industry is perfectly suited to meeting the Middle East’s and North Africa’s
food and embedded water needs, but only if it invests in massive water transfer programmes to offset
its rapidly depleting Ogallala Aquifer. Similarly its security has historically been viewed with awe,
and in general US culture is widely aspired to around the world, helped by some of the biggest brands
and the image that Hollywood portrays, although it will have to work heavily on repairing the damage
of 2 long-drawn out and costly wars, poor politicians and the weak economy.
Companies must be flexible enough to benefit from the transfer of wealth to the resource rich
economies. Whilst the US auto industry may not be able to export giant American cars, they can
export the factories and equipment necessary for the locals to produce much smaller and cheaper cars
to suit their needs. Exporting manufacturing technology brings profits back home but unfortunately
leaves revenue growth in the newly expanding economies. Multinational corporations may therefore
appear in better health than the domestic economy. In an environment when the EROIE is falling,
productivity growth will also decline, leaving wages as the primary adjustment mechanism to support
employment.
Industries that are heavily exposed to the countries that fail and see no offsetting demand increase
elsewhere will suffer dramatically. The domestic service sector is an obvious casualty in those
countries on the wrong side of the equation. Medical care and social security is already starting to be
priced out by some of the lowest annuity rates on record, particularly when adjusted for tax. This can
only get worse as the public sector must also default on healthcare commitments. Long duration assets
exposed to the wrong part of the economy also seem most likely to be at risk, with for example low
quality office space or shopping malls suffering from poor occupancy rates and very low yields.
Banks, pension and life assurance funds exposed to the wrong part of the economy, and suffering from
low revenue growth will not be able to meet their liabilities. Just as with the private sector,
government social security and medical care commitments will have to be defaulted on. Soviet
experience teaches us that longevity or life expectancy is likely to collapse. On the other hand these
same industries are likely to be beneficiaries in the resource rich economies.
There is clearly going to be a shift in the global balance of power. The world economy is going to
change shape dramatically. It is essential that leaders steer and control this change as much as
possible rather than just adapting to the outcome. Market development is effectively governed by the
Jevons’ Paradox. When energy is cheap it allocates capital to finding new ways to utilise the extra
work that can be done. It drives a virtuous circle of technology and cheap energy. Unfortunately as we
are starting to see, it works equally as well in reverse. As the true cost of energy rises, simply
maintaining existing capital becomes more expensive and so less of it is demanded. Relying on the
market to find a solution therefore is not necessarily going to work as it will increasingly allocate
capital to meeting immediate consumption needs and less into the technology that may break this
reinforcing loop. To some extent the financial markets are already reflecting this change. Fund
managers are governed by day-to-day performance rather than being allowed to invest in the future.
Companies are rewarded with higher share prices and lower costs of capital for pursuing cost
arbitrage in what is effectively a fight to the bottom, rather than investing in technology that may
expand the overall balance sheet. Whilst I do not advocate big government, it must break this circle by
prioritising new energy technologies. This should be done by setting goals that are contracted out to
the private sector to fulfil.

22/02/2012
83
The decline in the efficiency of global energy extraction over the last 20 years enabled Chinese coal,
and therefore Chinese work to compete in the outside world. Whilst economists and the public at large
are in awe of what China has achieved, the decline in EROIE that drove it has been relatively modest
compared with what we now face. The scale of capital transfer to the new energy network will be of
unprecedented scale. Countries may experience massive growth and then be discarded equally as
quickly. They must use that growth to expand their balance sheet to allow them to best compete for
the remaining resources, and therefore extend their time in the sun. Flexibility from the energy
consuming economies to meet the needs of this changing network of energy suppliers will be
essential. Not only will fortunes be made and lost, but the whole world order is now up for grabs.

22/02/2012
84
Chapter 11
Networks
The main lesson of WWI was that a country cut off from raw materials was bound to lose. The lesson
of WWII was that a war machine powered by coal could not compete with one run on oil whilst the
Cold War taught us that if you have nuclear power, you cannot be challenged militarily!
The problems I describe are very real and are happening as we speak. The terms of trade are moving,
causing food riots, political turmoil and the overthrow of governments in the Middle East and North
Africa. Capital is flooding the resource rich economies and the industries they rely on threatening
capital controls, whilst other countries and industries are being starved of funds. Economic issues are
starting to cause political divisions and splintering. It is obvious that without a new supply of high
density energy, the global economy will eventually collapse, however determining where the stress
points are, in which order things will break down and what we can do to mitigate the problem, will
help to decide how long we can keep our heads above the water until hopefully, safety comes in the
way of a major scientific breakthrough.
Conventional wisdom is that the western world has entered a period of contraction, that the US is
falling from its pedestal and that China is regaining the position it lost 500 odd years ago as the
dominant power in the world. This kind of superficial picture is worse than that spouted in the 1950’s
and 1960’s involving the extrapolation of former Soviet growth to the point where Khrushchev
famously declared to the West “We will bury you”. Like the Soviet Union, China’s economic strength
has mainly been driven by factor mobilisation rather than efficiency and productivity gains,
explaining why Green GDP is said to be flat over the last 20 years. It uses more energy than the US
economy which is about twice the size, and nearly five times as much as Japan’s economy which is of
similar size. It clearly uses more labour and according to The World’s Water 2008 – 2009, it uses ten
times the water per unit of industrial output than developed countries in general. As with the Soviet
Union, state direction of capital means that imbalances can be sustained for a long period of time,
limited only by the exhaustion of resources or by social unrest if the economy slows. For this reason
China will keep its foot on the accelerator all the way into the brick wall.
The story as I have described so far is that as the quality of energy deteriorates, so the energy network
grows from about 5% GDP today to nearer 20% in 10 years time, with the energy producing
countries increasing their weighting accordingly. Those countries that are exporters or are self-
sufficient should perform relatively well whilst those that import energy and are susceptible to a big
change in the terms of trade will suffer. The US imports about 24% of its fuel needs, it has huge
external debts and runs a current account deficit, and whilst the value of its grain exports has been
narrowing the differential with oil, it still has a long way to go. China on the other hand has large
foreign exchange reserves and it only imports about 12.5% of its energy needs, however that is
growing rapidly and with the demand for manufactured exports likely to slow, a sharp deterioration in
its terms of trade seem inevitable. The starting point therefore is that US cash flow is initially in a
weaker position than the Chinese and, in the near term any adjustment must be driven by the US
restructuring to bring this back into balance, either through higher productivity or reducing its relative
consumption. In the longer term however, the simple fact that the US is far wealthier means it should
be better able to adapt and make change whilst still maintaining full productive capacity. Its
dominance of the international grain market together with its relative energy and resource efficiency
also means that it is less sensitive than China to the changing terms of trade, positioning it to win out
in the end. The question therefore is how we progress to that point.

22/02/2012
85
The picture that most economists are familiar with is that of a major imbalance between the US and
Chinese economy. The US is running a big current account deficit and therefore borrowing from
abroad, whilst China is running a big surplus. In a freely floating exchange rate system the dollar
would fall and the renminbi rise until the two balanced each other out, however Chinese foreign
exchange intervention, or the sterilisation of the dollar surplus, means this is not being allowed to
happen and so the imbalances continue to accumulate. The US is left to adjust its competitiveness.
This should be done via investment in technological advancement, but is all too frequently done via
cost cutting and the shedding of staff which politicians understandably fight all the way, misallocating
capital and accumulating enormous budget deficits. To be fair to China it is adjusting imbalances by
lifting domestic wages. It has proposed, for example to lift the minimum wage by 20% per annum for
the next 5 years. Nevertheless by China intervening, and Greenspan and more recently Bernanke
keeping interest rates very low for an extended period, supporting consumption and the build-up of
US debt, the same mistakes have been made as the 1920’s and the 1960’s, leaving huge imbalances
that need to be cleared. In the 1970’s the adjustment process happened through stagflation, which I
would suggest is the likely route now; commodity price inflation and industrial and particularly
service sector stagnation. The relative productivity of the US, and the specific industries in which it
dominates, means that it is less sensitive to rising commodity prices than China. It will keep printing
dollars and inflating commodity prices until inflationary pressures make China uncompetitive. This is
already visible at the margin, with for example Zhu Baoliang, the chief economist of the State
Information Centre think tank suggesting that China may have to allow inflation to rise by 5% per
annum in its 2011 – 2016 five year plan if it is to achieve 8% economic growth.
If the present crisis is simply the result of imbalances, themselves due to governments overruling the
markets, then it should be a relatively straight forward, if painful adjustment process. Initially policy
response would be similar whether the EROIE story I describe is correct or this consensual structural
story. Central banks would flood the markets with cheap money, inflating commodity prices and
lifting present standards of living and future expectations in the resource rich emerging markets. The
difference is that if it is just a temporary imbalance then once rectified through US restructuring, the
improved competitiveness of America would suck dollars out of the international system leaving
commodity prices significantly lower and the emerging market economies broken with huge debts,
exactly the same as in the 1970’s and early 1980’s.
Asset markets are likely to show similar initial characteristics whether we have a structural energy
problem or a debt problem. Resource rich emerging markets will perform very well, sucking capital
from the rest of the world. If I am correct however then the scale of capital transfer is likely to be
much larger and any snapback of commodity prices on the back of demand destruction, is likely to be
just a temporary phenomenon. Sticking to the structural theme, what should we expect?
Oil Production - Imports and Exports

22/02/2012
86
Red = Imports >50m tonnes Green = Imports <50m tonnes
Blue = Exports >50m tonnes Yellow = Exports <50m tonnes
The chart above shows the big oil exporters are Russia and the former Soviet Union, the Middle East
and North Africa, and on the American continent Canada, Mexico and Venezuela. Central Africa is
also a small exporter, but the numbers are relatively tiny and even if they could be scaled up it would
certainly require heavy investment in infrastructure to free the oil for export. Brazil and Iraq are the
big unknowns. Brazil is presently a small importer but the world is betting heavily that its Santos
Basin sub-salt deposits will turn it into a large producer, and although Brazil has said it won’t export
any crude oil, the market is hoping it will export refined product. Iraq does have large reserves, and if
politics and security can be sorted out the government aims to increase production (not exports) to
4.5m bpd by 2014, way short of market hopes of 12m bpd “in coming years”. Even these figures may
prove optimistic as there is a shortage of skilled personnel in the country, the wells are in a dreadful
condition and vast amounts of capital is required to upgrade infrastructure.
The United States is the largest oil importer, dwarfing production from Canada and Mexico combined
such that as a whole North and Central America is a net importer of nearly 400m tonnes, a very
similar figure to Western Europe. Asia as a whole imported a net 823m tonnes in 2009, with only
Brunei, Malaysia and Vietnam small net exporters. Dividing Asia into 4 blocs, Japan imports just
short of 200m tonnes, India 113m tonnes, China 229m and South Korea, Taiwan and Singapore
203m tonnes. We therefore have the United States, Western Europe and Asia all competing for
reduced oil exports, with 4 blocs within Asia competing not only with the West but also amongst
themselves. In terms of energy intensity of GDP, Japan is the most efficient followed by Europe and
then the States, with Asia heavily down from those levels.
The picture for gas is slightly different. North America runs a balanced position with the United
States again importing from Canada despite its supposed game-changing shale production. The
European Union is a large importer, mainly by pipeline whilst Asia is a slightly smaller importer, but
principally by LNG tanker which puts it at a slight economic disadvantage compared to those
countries that can rely on pipelines. Again Russia, the Middle East and Africa are exporters. On the
coal front North America is balanced, Latin America is a small exporter, Western Europe a small
importer and Asia balanced, but with China and India extremely large importers from the rest of Asia
and particularly Australia, Indonesia and Vietnam. Outside these few South Africa, Russia and
Colombia are the main exporters with Mongolia expected to become a big player.

22/02/2012
87
Politics permitting, the main beneficiaries of resource constraint should be the Middle East, and then
outwards from there the former Soviet Union, North Africa and bits of Western and central Africa.
Canadian tar sands should be scaled up and the hope of big returns will drive flows into Brazil in the
short term but it will need to start delivering on its promises on oil in the not too distant future.
Production infrastructure across all these regions will need to be increased as well productivity
declines and smaller fields have to be brought on stream. Most of the countries have port
infrastructure to transport the fuel, however Brazil will need to develop this, and if it is going to keep
the value added domestically as it stipulates then it will also have to fund a large petrochemical
industry and presumably other manufacturing industries. The Middle East is similarly increasing its
domestic consumption for both end use and for industry, which will drive a big increase in orders for
power plants, power grids and investment in utilities generally. In terms of gas, capital has already
been invested in pipelines or LNG tankers which will tie producers with existing consumers to a large
extent. As the flow of gas comes from further afield and therefore in the form of LNG rather than
pipeline, so more storage capacity is likely to be needed to compensate for the seasonal consumption
needs. As with oil most of the investment will need to be in replacement production such as LNG and
FLNG plants in Australia, and the platforms from which to load this into tankers. As far as coal is
concerned, having the lowest density of all the fossil fuels, a lot of investment will be required in basic
transport, both in terms of trains and ports. With the quality of coal deteriorating power plants will
need to be adapted to burn the poorer quality fuel. Any growth in production of fuel supplies from
central Africa will need huge investments in basic infrastructure including simple things like water.
One thing to bear in mind with countries such as Brazil and the Middle East that plan to capture more
of the value of the energy domestically, is that the so-called Dutch Disease will complicate the issue.
As oil exports become more valuable driving the currency higher, the competitiveness of other
domestic industries will deteriorate causing imports to rise and exports to fall. Within the country
itself, the high returns available from the oil industry will act as a magnet to capital and labour,
increasing the cost of funding for other industries. As with China some sort of capital control or
internal subsidy may therefore be necessary to keep the value added internal to the country. These
controls will act to hollow out the energy importers and cause large international imbalances to
continue accumulating between creditor and debtor nations, with the consequence of large periodic
adjustments when the debt loads become too heavy to bear. The redistribution of wealth is likely to be
much more aggressive than would be the case in a free market. Perhaps it is worth considering
whether China’s use of capital controls to maintain its competitiveness is also a reflection of the
Dutch Disease as it is by far the world’s largest energy producer and without the restrictions its
natural inefficiencies would mean it is unlikely to be able to compete on the world markets or even
domestically against foreign imports. Brazil has already started to impose capital controls although for
the moment they are relatively limited in size.
With the Middle East, Africa and some of the areas in central Asia, industry will have a natural
handicap simply due to the hostility of the climate and lack of other important factor inputs such as
freely available water, making it very difficult to compete with the outside world. As their wealth
develops, they will need to invest heavily in food production which almost certainly will have to be
done externally, either in the West or Latin America or through development of some African land.
Investment in the infrastructure and technology associated with food production and water storage and
irrigation will have to accelerate. Just as wealth is transferred to the countries that are energy and
metals rich, so it will also be transferred to those that are rich in good quality agricultural land and
water. It is important to remember that the Middle East did experiment with using desalinated water
to grow grains in the 1970’s, which whilst almost as stupid as the US growing corn for ethanol, does
highlight that there is a limit to how far the US can bridge the gap between grain and energy prices
before the Middle East will close the door to this opportunity. Any moves therefore to adjust the terms
of trade must be aimed squarely at food importers that compete for the oil rather than at the oil
exporters themselves. This means Asia. China will increasingly have to compete with the main global
energy supplier, the Middle East for food leaving it in a very precarious position.
A trade war seems inevitable between the West and Asia as they compete for the same end resources;
however it is perhaps internal competition within Asia that we should be more worried about. China,
India, Japan and South Korea are all heavy importers of energy. There are already signs of economic
competition turning into something more political in terms of territorial rights over disputed islands,

22/02/2012
88
waters and resources in the South China Sea, and over control and access of the Indian Ocean through
which 70% of the total seaborne traffic in petroleum products and coal passes. China is reported to
have told the oil giants BP and Exxon to halt exploration in areas that Vietnam considers part of its
territory according to US government agencies. Vietnam, Malaysia, the Philippines, Brunei and
Taiwan all claim islands that may have oil and gas reserves that China wants. It sees these disputes as
regional issues and does not want external interference in the same way that the United States’
Monroe Doctrine determines that the Americas is off-limits to the rest of the world. Chinese influence
in the Mekong Delta – (Cambodia, Laos, Myanmar, Thailand and Vietnam) – is growing as it builds
infrastructure to access their resources putting it in direct conflict with Japan which has been the
biggest source of aid in the region for many years but is being totally outmanoeuvred.
China is subtly undermining some of its neighbours through vital resource grabs. Its investment in
hydro power stations along the upper Mekong River and further downstream is altering the waterway
that directly sustains 60 million people through fishing and agriculture. It says that it is releasing the
water and just taking the energy; however by doing so it is reducing the nutrient distribution and
lowering oxygen levels in the water reducing the number of fish it can support. Greater irrigation and
fertilizer use to compensate will result in salinisation and increased farming costs. Agricultural
production is missing targets and fish stocks are falling. A third consequence has been a fall in the
level of sand deposited in the river delta, negatively affecting Vietnam’s construction industry and the
exports of sand to Singapore. For the moment the region is happy to oblige. Laos has even boasted
that it will be “the battery of Southeast Asia” and Vietnam and Thailand are experiencing rapid
growth, but as they gradually wake up to the fact that they have been selling their long term food
security for China’s immediate gratification, their smiles are likely to disappear. The border conflict
between Thailand and Cambodia and the Red Shirt insurgency in Thailand may not have a direct link
to this resource grab, however the stresses it puts on the system are undoubtedly a contributory factor.
The potential consequences from the damming in Tibet of the Brahmaputra River before it flows into
India are huge. The river is second only to the Ganges in India and therefore immensely important to
agricultural production. The fact that China says it will only take the power from the river rather than
extract the water as historic plans had suggested, is to some extent irrelevant as its impact on
agricultural output will still be huge. Is this an unintended consequence of China’s hunger for energy
or is it a clever policy to undermine its biggest rival in the region for the resources? In the longer term
it seems inevitable that if China is to continue to grow it will have to take the water as it has done in
the North West where it is redirecting both the Ili and Irtysh Rivers which flowed into Kazakhstan,
condemning the world’s 15th largest lake, Lake Balkash to a similar fate as the Aral Sea and
negatively affecting agricultural production. This will leave China and India on a collision course.
Following the spotting of 2 Chinese submarines and 8 warships just 90 miles off Okinawa, a Japanese
Defence White Paper stated that “The lack of transparency of its national defence policies, and its
military activities are a matter of concern for the region and the international community including
Japan”. India’s Foreign Minister expressed concerns to parliament over China’s encroachment on the
Indian Ocean, seen by most commentators as the strategic waterway over the next 25 years. “The
government in India has come to realise that China has been showing more than normal interest in
Indian Ocean affairs. We are closely monitoring the Chinese intentions. We are closely monitoring
the developments in the Indian Ocean”. The US Marine Corps Vision and Strategy 2025 conclude
that the Indian Ocean will be the central theatre of global conflict and economic competition this
century. It encompasses 70% of the total seaborne traffic in fossil fuels, which makes India’s 155
warship navy and its large population a strategic ally in the region. It also helps explain why in
October 2008 the US ended the 3 decade moratorium on nuclear trade with India, providing
assistance to its civilian nuclear industry as well as expanding cooperation in satellite technology.
Such political deals were necessary to attract the Western capital that allows India to run a large
current account deficit and fund the economic growth essential to counterbalance China’s regional
ambitions.
China’s push for resources into central Asia involves oil and gas pipelines thousands of kilometres
long to Beijing and roads and rail through Afghanistan and Pakistan to the Indian Ocean, putting it in
direct completion with India. Both countries want control over Burmese or Myanmar resources. China
also needs access to Mongolian and Russian coal, as well as grasslands. Russian Prime Minister Putin
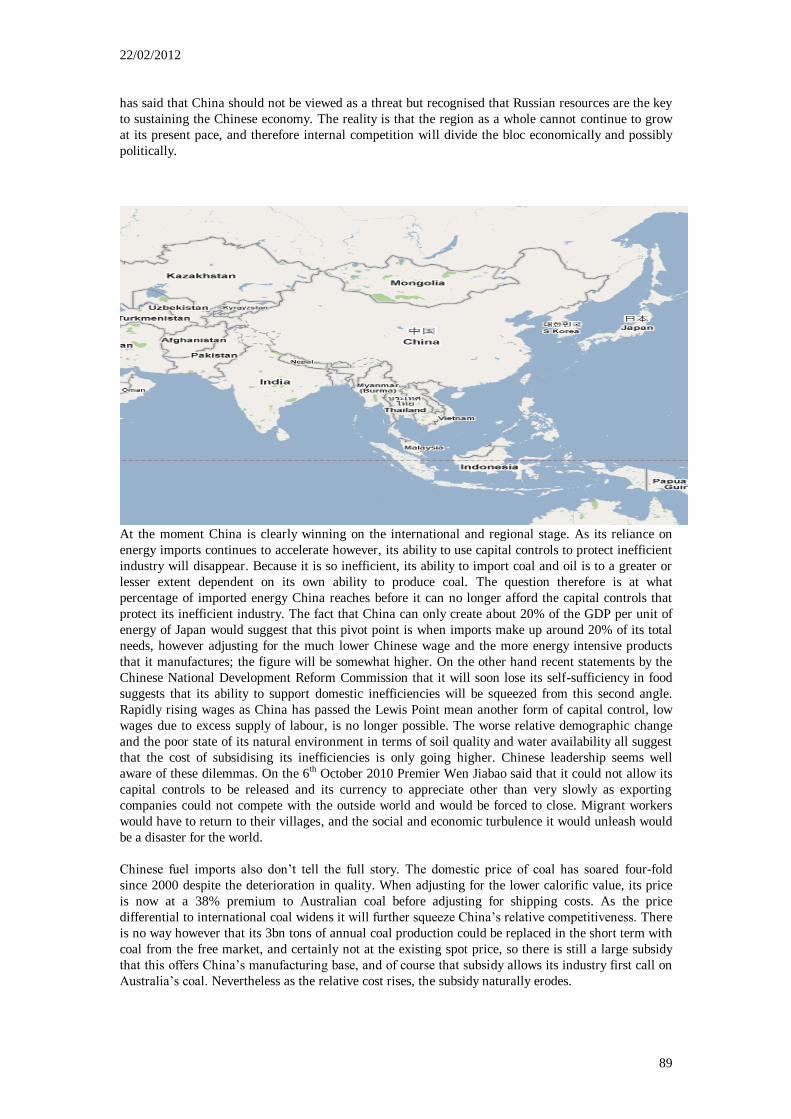
22/02/2012
89
has said that China should not be viewed as a threat but recognised that Russian resources are the key
to sustaining the Chinese economy. The reality is that the region as a whole cannot continue to grow
at its present pace, and therefore internal competition will divide the bloc economically and possibly
politically.
At the moment China is clearly winning on the international and regional stage. As its reliance on
energy imports continues to accelerate however, its ability to use capital controls to protect inefficient
industry will disappear. Because it is so inefficient, its ability to import coal and oil is to a greater or
lesser extent dependent on its own ability to produce coal. The question therefore is at what
percentage of imported energy China reaches before it can no longer afford the capital controls that
protect its inefficient industry. The fact that China can only create about 20% of the GDP per unit of
energy of Japan would suggest that this pivot point is when imports make up around 20% of its total
needs, however adjusting for the much lower Chinese wage and the more energy intensive products
that it manufactures; the figure will be somewhat higher. On the other hand recent statements by the
Chinese National Development Reform Commission that it will soon lose its self-sufficiency in food
suggests that its ability to support domestic inefficiencies will be squeezed from this second angle.
Rapidly rising wages as China has passed the Lewis Point mean another form of capital control, low
wages due to excess supply of labour, is no longer possible. The worse relative demographic change
and the poor state of its natural environment in terms of soil quality and water availability all suggest
that the cost of subsidising its inefficiencies is only going higher. Chinese leadership seems well
aware of these dilemmas. On the 6th October 2010 Premier Wen Jiabao said that it could not allow its
capital controls to be released and its currency to appreciate other than very slowly as exporting
companies could not compete with the outside world and would be forced to close. Migrant workers
would have to return to their villages, and the social and economic turbulence it would unleash would
be a disaster for the world.
Chinese fuel imports also don’t tell the full story. The domestic price of coal has soared four-fold
since 2000 despite the deterioration in quality. When adjusting for the lower calorific value, its price
is now at a 38% premium to Australian coal before adjusting for shipping costs. As the price
differential to international coal widens it will further squeeze China’s relative competitiveness. There
is no way however that its 3bn tons of annual coal production could be replaced in the short term with
coal from the free market, and certainly not at the existing spot price, so there is still a large subsidy
that this offers China’s manufacturing base, and of course that subsidy allows its industry first call on
Australia’s coal. Nevertheless as the relative cost rises, the subsidy naturally erodes.

22/02/2012
90
Despite the benefits, Japan has already narrowed its trade deficit with China and is now running a
near balanced position. It is out-competing China even with the capital controls in place. It is one of
the most energy efficient economies in the world but over the last 20 years it has suffered relatively
slow growth and the build-up of government debt due to the rising demographic dependency ratio,
and effective trade barriers imposed on it by the US through the Plaza Accord which devalued the
dollar by 50% against the yen, the Structural Impediments Initiative which required Japan to
restructure its economy in favour of domestic consumption rather than exports, and NAFTA or the
North American Free Trade Agreement requiring 60% of any goods to be produced in North America
to benefit from zero tariffs, forcing Europe and Japan to shift their production plants to the States,
Canada and Mexico. By granting China the Most Favoured Nation status, it was able to get around
these implicit trade barriers. The huge growth in China’s energy production lowered the price of fuel
nullifying Japan’s relative benefit from its energy efficiency and leaving it no chance to compete
against these headwinds, however with China now a growing energy importer, Japan is increasingly
able to compete on the international stage. For the moment it has large government debts, but this is
likely to gradually narrow as long as it continues to regain export momentum. Initially those increased
exports are to China benefitting from its rapid growth, but over time they will regain a prominent
position in the international markets, for example exporting more cars to the Middle East.
China has resorted to using its trade surplus with the US, where it still outcompetes due to its capital
controls, to buy the Yen and push the currency higher. By directing some of the overseas earnings to
driving the Yen higher rather than the supporting the US dollar, its own currency will strengthen a
little against the US allowing some narrowing of that deficit and reducing its ability to juggle so many
balls. With Japan also reliant on resource imports, a higher Yen does not necessarily negatively affect
it. In fact there is no reason why it can’t play China at its own game and use the Yen strength to buy
resources around the world rather than just holding US Treasuries. As China’s energy imports grow
and its trade surplus narrows, it will become increasingly expensive to continue subsidising inefficient
domestic industry and starving international competition of capital. Its ability to offset its own
productivity deficit with its fuel subsidy will disappear, at which stage capital will take flight out of
the country. In fact China’s exports to the US are already being squeezed by Mexico whose share of
US imports has started to rise at China’s expense as wage differentials between the two narrow.
Some people talk of China’s progress and demand for resources eventually causing military conflict. It
has become such a large economy so quickly and elevated domestic expectations that its hunger for
resources can only be satisfied at someone else’s expense. China admits that moral progress in
international affairs is not a consideration, hence its involvement with states that the West chooses not
to do business with. I personally don’t see this turning into a military conflict, but rather see an
economic divide happening as China drives some of these countries increasingly into the economic
arms of the United States, gradually splitting the world into two economic blocs once again, one made
up of the efficient energy consuming economies and the second China and a few rogue states that are
willing to accept its business practices. With China’s lack of progress in stamping out software piracy
and its lack of progress in human rights issues causing some of the big tech giants such as Microsoft
and Google to reconsider how they do business in China, we already appear to be seeing the first signs
of an economic divide happening. If the West is serious about stopping Iran’s nuclear ambitions, then
governments have little choice but to penalise international companies doing business in Iran, as they
will be lobbied by their own corporations to level the playing field. I would suspect that the biggest
security problems will be internal to China as its future increasingly depends on accessing resources
from Tibet and Xinjiang where the people do not support the government, as well as managing its
food and water security and inflation.
China is building an ever larger international network to access the resources required to maintain
output, whether in Asia, Africa, the Middle East or Latin America. Empires and currency unions
usually fall because of over-reach. The cost of the network becomes more than the benefit it delivers.
The British and Roman Empires collapsed for precisely this reason, and at the moment the US
hegemony is being drawn into question, not least because of the huge cost of the Afghanistan and Iraq
wars. In 2010 and 2011 the financial markets also questioned whether the economic cost of
maintaining the European Union was more than the political benefit. As China has to go further and
further afield to access an ever increasing percentage of its resource needs, and more importantly has

22/02/2012
91
to do so outside of the conventional market supporting corrupt and inefficient regimes, and principally
with US dollars rather than Chinese renminbi, the costs to it will rise enormously, reducing if not
eliminating its competitive edge. The West does not need to fight militarily with China. Instead any
battles will be economic, with the victor the country or network that can allocate capital more
productively. Relying on Venezuelan or Iranian oil production for example, when local government is
forced to over-tax and starve those industries of capital to maintain political or military support, will
feed back into higher input prices in China in the long term.
We are told that China has been the main driver of global growth in recent years as indeed it has. We
shouldn’t forget however that by using its massive production of fossil fuels to impose capital controls
on the rest of us, this growth has to a large extent simply been transferred from abroad, and in
particular it has been taken from investment in productivity advancement. Though quite stunning,
China’s growth has been at the expense of global economic advancement as it has used its fuel to
support inefficient domestic industry rather than export the fuel to countries that could produce more
with the energy. To be fair to China, not many countries wanted their coal as it didn’t necessarily suit
our greener credentials; it was preferential to see China pollute its own environment and sell us the
goods. It is here where the US could quite easily turn the table back on China by imposing an
equalising tax on the embedded carbon within all manufactured goods. This would likely get wide
public support and would go down extremely well in Japan and Europe as energy efficient
manufacturers, helping to tie them more closely to a US centric bloc, the scale of which would dwarf
China and therefore gradually isolate it. Whilst I would generally not support taxes as an efficient
method of allocating capital, in this circumstance it’s actually quite clever, effectively taxing
inefficiency. Whether such measures are imposed or not, the fact that capital is being allocated badly
will eventually result in an economic bust for China in just the same way that it did for the USSR.
The United States has all the natural advantages. As well as being the world’s largest exporter of
grains, it is still self-sufficient in coal and to a large extent in natural gas, and despite being the
world’s largest importer of crude oil the National Petroleum Council estimates that it may have as
much as 60 billion barrels of undiscovered but “technically recoverable” oil resources in the lower 48
states in what is termed the Outer Continental Shelf. Only about 19 billion barrels of these oil
resources are in areas of moratoria precluded by law or public policy from leasing and developing, so
the fact that the other 41 billion barrels has not been discovered suggests that the figures are
somewhat optimistic. Nevertheless it is clearly in a very good position and with fertilizers normally
accounting for about 40% of the costs of growing corn, the presently cheap US shale gas from which
nitrogen fertilizers are produced, should stand US farmers in good stead to further boost their global
market share and thereby support the dollar.
Like other resource rich countries, the US economic strength is not explained by efficiency but rather
by just how much energy it consumes. The European Union for example, which is actually 15%
bigger than the US economy as of 2009, derives 55% more GDP per unit of energy than does the US.
Like China, its own internal supplies of fuel subsidise both inefficient industry, and with the US, very
high levels of household consumption. The fact that US infrastructure is so poor for example will
result in a higher energy intensity of GDP as it reduces the effective size of the workforce. What is
important however is that unlike China whose inefficiency is structural and directly related to its
population density and the resultant excessive call on resources the US suffers no such problems.
Instead its inefficiency is really just a result of bad policy and a poor allocation of resources, and can
therefore be changed relatively easily, and dare I say it relatively painlessly.
I have always been told that it is not necessarily the cards you are dealt that’s important, but rather
how you play your hand. The natural fertile resources of the US, its low population density, its
superior demographic to rest of the industrialised world, and the dollar standard that ties the majority
of all international trade to the US puts it in a great position. It is inherently rich. Unfortunately over
recent years the quality of government appears to have deteriorated. By trying to please too many
groups, it has failed to deliver at the overall level. Like with so many institutions that are profitable in
spite of management rather than because of it, the same can be said of the US economy and
government. Obama’s massive budget deficit for example has been extremely successful in creating
jobs, unfortunately in China rather than the United States. It would have been far better to use tax
incentives to bring business back home. Change from within government looks unlikely. Hopes that

22/02/2012
92
President Obama’s oratory skills would have allowed him public support for the harsh restructuring
necessary have been let down by the man himself; he is clearly out of his depth. The grass-roots Tea
Party movement and state level discontent however suggests that restructuring may yet happen. In the
United Kingdom it does seem that the Conservative Liberal coalition is acting in the best interests of
the country, and does have general public support for the very tough decisions it has to take despite
the vested interests of the press to suggest otherwise. If the UK can do it I am quite sure the US can.
Like weak management that resort to surrounding themselves with yes men rather than those that will
compete and challenge them and therefore advance the business, the US policies at the end of the
1980’s and the early 1990’s that forced Europe and Japan to shift production to North America to
benefit from zero tariffs, meant that it was no longer forced to compete and invest in efficiency gains
and productivity advancements. Rather than continuing the economic policies that had won it the
Cold War, the US decided to sit on its laurels and by implementing this form of capital control, the
US forced European and Japanese companies wishing to sell into its market to carry a handicap
around with them. Whether this was done for economic or as some people believe security reasons –
(Germany was reunifying and Japan had become the world’s manufacturing base) - by taxing rather
than embracing competition, the unforeseen consequences of US policies undermined investment and
economic advancement, exactly the opposite of what the US has historically stood for. It needs to
restructure. Government needs to level the playing field and allow the economy to stand or fall on its
own rather than by imposing barriers to competition otherwise the predictions of the end of US
hegemony will prove correct.
The world is competing for resources. If the US is going to be one of the last men standing, it needs to
restructure to prevent China’s export subsidy undermining its industry and taking its jobs. US
industry needs to be able to compete for the Middle East’s oil, and that can only happen if both the
public and private sector invest more and consume less. One of the obvious areas of expense that the
US could reduce is its healthcare bill where it spends nearly 17% of GDP compared to around 8% in
Germany and Japan which have better life expectancies. It is not that the US healthcare is inferior, but
rather it is the administration of that system whereby huge amounts of money are wasted on
bureaucracy and legal challenges. Stripping out the administration and looking at the actual
performance of the healthcare service, it is one of the best in the world, but again the low life
expectancy and high cost is due to inefficiencies elsewhere such as poor diets and lifestyles that result
in an increased need for medical treatment. These areas of inefficiency, waste and low productivity
could be sorted out relatively painlessly however government policy seems determined to continue
misallocating capital.
The expanding energy network will be the main engine of industrial growth. Aligning industry and
economies to best capture this will be essential to offsetting the broader decline. China will
undoubtedly provide the initial investment and equipment in the countries which are politically closed
to the West, whilst in the more open markets its state capital will compete against the balance sheets
of the major oil and mining companies whose ability to win will depend on their access to finance
from the banks and capital markets, and their engineering superiority, all of which will be dependent
on how countries restructure and take their medicine. US, Japanese, South Korean, Norwegian,
French and German multinationals are likely to win the deeper offshore and more complex projects
where specialist technology is required, but to get a better idea of the winners and losers we first need
to know what exactly the energy network will look like.
Contrary to environmentalists’ wishes, coal will continue to take market share as the higher quality
fuels see production peak and decline. Wind and solar will remain an expensive side-show, possibly
seeing their market share actually decline as they become a luxury the world economy can no longer
afford. Australia, Mongolia and South Africa should benefit from the increased coal demand, as
should China and the US which are by far the largest coal producers today. Ever more capital will
have to be directed at extracting reserves. Clean air legislation will have to be skirted around. In order
to keep the environmentalists quiet the coal will be used in slightly different ways that existing rules
don’t cater for. The US coal to liquids proposal for example involves using high sulphur coal that in
normal circumstances would be deemed too polluting for power stations. Old retired mines that have
been closed due to the economics of extraction may be re-opened by independents although the capital
cost of making such a mine safe will be huge. There is a lack of rail infrastructure across the whole

22/02/2012
93
mining industry. In 2008 Russia suffered from a massive shortage of railcars such that the state rail
monopoly cut the availability of cars for the export of coal by 50% so they could be freed up for
domestic use. China seems to prefer to use heavy trucks, which also need rubber, and as it
industrialises inland it will also use more power transmission lines to distribute electricity from the
coast rather than shipping coal inland. Heavy industry and capital goods will be in big demand. A lot
of these industries will be domestic plays, however Australia, Indonesia, South Africa, Mongolia and
Russia are likely to buying from the outside world.
Oil and gas is becoming more technically challenging to extract even on land. China can certainly
throw money at the problems, but realistically it is the Western companies and South Korea that have
the technical and engineering capabilities, although even here a lot of the skilled technicians are of
retirement age. Development drilling will increase exponentially, and with depth comes problems
requiring specialist torsion steels, although the Soviets got around this by simply putting a motor
above the drill bit (known as turbo drilling) rather than turning the whole drill. LNG and FLNG
plants are hugely expensive and technically demanding, requiring engineering companies with vast
balance sheets. Exploiting small reserves should be done from central drilling platforms with
steerable drills.
The most important area is the development of the Middle Eastern fields, central Asia and Russian
fields, where politics will be a big factor. Food, security and much higher energy efficiency levels
should steer Saudi Arabia and the other Gulf cooperation council states towards the Western
manufacturers. Iraq and Libya will also likely come down in favour of the West, but under its present
leadership, only China will do business with Iran. The big swing potential is Russia and central Asia
where Russia wants to re-establish its sphere of influence, but is being undermined by the new found
wealth the former Soviet countries are getting from gas pipeline deals with China. If the West allows
Russia to re-establish its area of influence then it becomes a major force once again and counter-
weight to China, however it also potentially becomes a problem for the West. Russia has shown that it
needs western technology, but at the same time, its legal system has been too unstable for individual
western companies to bear the risk of investment such that capital has mainly come from the Chinese
government. Putin has recognised the need for Western capital and has committed to stepping back
from the economy and letting private enterprise take the lead. The opening up of the international
bond markets also means it no-longer has to turn to China for financing securitised against long term
oil and coal contracts. From a political perspective is Russia going to feel more or less safe with an
all-powerful, resource hungry China on its doorstep? The Chinese provinces that border with Russia
have a population density some 62 times higher than the Russian states, and its hunger for Central
Asian resources means, at the very least, it will have an economic influence in the region that pits it
against Russia’s desired political influence.
Like with Russia, the lack of clarity of law in other countries will also affect whether private capital
can afford to invest. Foreign oil executives have for example expressed concern that Kazakhstan’s
plans to boost its oil output by 60% over the next 10 years to 130m tonnes will be inhibited by
government discretion in changing taxes and the terms of contracts. Even with Australia, the threat of
a significant additional mining tax threatened the viability of projects and caused some capital flight.
Without a stable rule of law, resource prices will have to go even higher to justify private sector
investment, whereas state controlled companies such as the China’s are much more able to take the
risk, and therefore take advantage of the situation. Nigeria’s government has promised sweeping
legislation that will attract foreign capital but the oil industry is sceptical as deadlines for the
legislation have come and gone numerous times without any action.
Venezuela is the other big swing factor. Under Chavez oil production has collapsed as the industry
has been starved of capital to pay for social programmes, whilst international companies have pulled
out for fear of expropriation of assets. Chavez has turned to Russia and China for investment, but
being on its doorsteps, the US is unlikely to allow Venezuela’s oil reserves to be left unexploited
whilst the US economy suffers from a shortage. I would not expect any direct military action; however
I cannot see the long hand of America not getting involved in the political leadership of the country
through other means, putting the US and China in indirect conflict just as the US and the Soviet
Union frequently were. These kinds of political battles will help to shape the economic landscape
between the competing resource importers right across the globe.

22/02/2012
94
We have already had the US undersecretary of state for economic, energy and agricultural affairs
suggesting that China is not adhering to international standards in that its resource investments are
for nationalistic purposes, but this seems likely to be just the start. China’s State Council Development
Centre published a report by Sun Bigan, the former envoy to the Middle East saying “The US has
always sought to control the faucet of global oil supplies. There is cooperation between China and the
US, but there is also a struggle, and the US has always seen us as a potential foe….Bilateral quarrels
and clashes are unavoidable. We cannot lower vigilance against hostility in the Middle East over
energy interests and security….Obama’s new Middle East policy is merely a tactical adjustment, and
the United States will not and cannot alter its global goals and dominance”.
http://www.energybulletin.net/stories/2010-10-12/china%E2%80%99s-pipelineistan-
%E2%80%9Cwar%E2%80%9D suggests that political games are already happening between the
United States and China over resources in the Middle East and central Asia. China has spent a
staggering USD120bn on developing Iran’s energy sector over the last 5 years, and has committed
further funds supporting its economy, putting it in direct conflict with US and UN policy of trying to
undermine Iran’s leadership, and thereby halt its nuclear ambitions by imposing economic sanctions.
China views Iran as a crucial strategic partner, accounting for 14% of its oil imports; however the
question is whether Chinese investment is sufficient to counter the negative effects of this isolation, or
whether it ends up an expensive mistake. As yet it has not allowed Iran to join the Shanghai
Cooperation Organisation, Asia’s equivalent of NATO.
The politics between the energy importing nations will be equally as important if not more so.
Building an area of influence and tying certain countries together such that the sum of the parts is
greater than any individual country, is likely to be the policy that wins out in the end. Countries will
keep their options open as long as possible so it is unlikely to be obvious that divisions are happening.
They will not tie their economies exclusively to one or other region until the cost of doing business
becomes prohibitive, at which stage it will then become more obvious who the winners and losers are,
and because of the self-reinforcing nature, the final adjustment will be relatively quick as was the case
with the Soviet Union despite it being held together by political and military force. Political hotspots
such as Iran will act to align certain economies and divide others, for example Japan has been very
vocal about ensuring sanctions are enforced against Iran’s nuclear policy, putting it on the opposite
side of the table to China. Even North Korea’s continued belligerence can be viewed as important to
maintaining an integrated security policy between the US and both Japan and South Korea.
As China uses its vast trade surplus and FX reserves to secure energy supplies and take them out of
the wider market, other countries have little choice but to increase their efficiency to compensate and
compete. At the corporate level this can be increased investment and R&D as well as cost cutting. At
a sovereign level it is primarily austerity and redirecting of capital away from consumption to
investment, but it can also be through increased investment in international trade. Japan is exploring
the possibilities of free trade agreements with Europe, India, Vietnam, Australia and the Trans Pacific
Partnership of countries bordering the Pacific. By making these tie-ups and increasing efficiency,
these countries effectively create a purchasing union of more dynamic and therefore more efficient
economies better able to compete for the resources. Over time the world will gradually divide back
into two economic blocs but it will happen through these bilateral agreements and free markets
splitting the world back into those areas that are efficient and able to compete in a free market, and
those that are reliant on controlling and securing supplies by other means.
Of the world’s major economies, Germany is the most energy efficient with the European Union as a
whole not far behind. Whilst the EU needs to import a lot of its fossil fuels, it is head and shoulders
ahead of the rest of the world in investing in alternative sources of energy such that the European
Union’s reliance on fossil fuels is far smaller than the world on average and a mere fraction of that of
China. Western Europe is even better, getting just 51.3% of its electricity from fossil fuels compared
to China’s 83.5%. France gets 88.3% of its electricity from nuclear and hydro, Sweden 89.4%,
Switzerland 94.9% and Norway 97.8% all from hydro. This combination of alternative supplies and
efficiency of use, plus the transport savings from its geographical location, should put Europe in a
very favourable position to compete for the Middle East, North African, central Asian and West
Russian resources. Clearly restructuring is necessary, although even here it is only immediately

22/02/2012
95
necessary in a few countries such as Greece and Ireland as collectively the EU runs a current account
balance. It can produce more goods with the Middle East’s energy than anywhere else. It is also leader
in a lot of the heavy goods industries and specialist engineering technologies that will be needed to
extract the resources, as well as meeting the luxury goods and engineering demand that is likely to
come from the new-found wealth in these regions.
The one problem Europe has is being a collection of individual member states rather than one group,
policy is determined by what is acceptable to all rather than beneficial for the group as a whole, and
therefore it suffers from the age-old problem of the Tragedy of the Commons. The recent European
crisis should act as a catalyst to change. The German public will not stand continually bailing out the
Greeks and Irish and so grass routes political pressure will force change; either Greece will have to
restructure, implement proper rule of law and eliminate corruption or they will be kicked out of the
Union leaving a stronger and more efficient central core. Norway and Sweden, and to a lesser extent
Finland use very little fossil fuel in their power generation, whilst France gets just 9.9% of its power
from fossil fuel and Switzerland 1.5% so combining this with Germany’s industrial efficiency makes
a very powerful grouping. Germany is right to demand a “competitiveness pact” across the European
Union, which if implemented would elevate Europe to an even more powerful position to compete for
the world’s resources. If the medicine is too much for some of the periphery to take then they only
have themselves to blame.
Turkey’s application for entry into the European Union needs very careful consideration as to whether
its efforts to be a regional power in the Middle East acts as a bridge or a gate for the EU. Its exports
to the region have soared since entering into a free trade pact with Egypt, Israel, Morocco and
Tunisia, and it is seeking a similar deal with the Gulf Cooperation Council. The most notable link is
the Nabucco pipeline that will carry gas across Turkey to Europe, possibly from the Caspian region,
the Middle East and Egypt. On the other hand, its internal freedoms have fallen heavily in recent
years and its apparent support for Iran and Damascus may put it in conflict with other parts of the
region. Its control over water supplies for the Euphrates and Tigris will also have a serious impact on
Syria’s and Iraq’s agricultural output, and therefore regional politics. The South-East Anatolia
Development Project or GAP involves the construction of 21 dams and hydropower plants on the two
rivers to supply 19% of the country’s irrigation and 20.5% of its hydropower. Projections have the
flow to Syria almost halved from 30 cubic kilometres a year to just 16, whilst the onward flow to Iraq
would be cut from 16 cubic kilometres to just 5. Whilst Turkey’s policies undermine the
Mesopotamian agricultural production and water supplies, and therefore tie these countries to the
West, it is not necessarily sensible for Europe to be seen condoning what is a clear breach of The
Watercourses Convention, which Turkey, China and Burundi are the only 3 countries to reject.
The one area where Europe lacks is security and particularly the ability to project its power, which
will be essential to guaranteed energy supplies. Lets not kid ourselves; Saudi Arabia will not sell
Europe oil just because it can get twice as many goods in return if China or the US has parked their
aircraft carriers offshore. Europe like Japan needs to buy security from the US by running a current
account surplus and therefore gradually buying China’s Treasury position off them. As a group,
Europe and the States can meet the Middle East’s food and water needs, its engineering and
technology needs and its security needs whereas China comes up short on at least one front; food and
water. Once a core group has been established such as Europe and the States, it becomes an easier
choice of which way Japan and South Korea will move, and then which way works best in the end for
other players.
Japan has announced that it will build 6 new submarines, taking the number to 22 with the aim of
monitoring nearby waters especially in the East China Sea. This will be the first time since its post
war defence programme was initiated in 1976 that it will have more than 20 submarines, and is a
clear signal in my opinion, that it could back up its economic might with military force if needed. I
would venture this is being done with the full support of the US as part of a broader policy to help
counterbalance China’s ambitions. It is also to develop Rare Earth’s, and will help construct both
nuclear power plants and a high speed rail system in Vietnam, trying to regain the initiative in the
region, or at least show that China is not going to have it all its own way in terms of accessing the
region’s resources. The government has also granted Japan Bank for International Cooperation (JBIC)
JPY1.5trn (USD18.44bn) of its foreign exchange reserves to support energy and infrastructure

22/02/2012
96
projects overseas. JBIC can use the credit line to provide loans to Japanese firms investing in
renewable energy, nuclear power and high speed trains in the emerging markets, thus developing
economic links.
Energy Efficiency
Power Generation – Fuel Mix
Worldwide Electricity Production 2008 (Observ’ER and EDF)

22/02/2012
97
Fossil Nuclear Hydro Waste Solar Biomass Wind Geothermal
Middle East 96.8 3.2 0 0 0 0 0 0
Australia 91.4 0 6.7 0 0 0.7 1.1 0
Ireland 89.4 0 3.6 0 0 0.5 6.6 0
Indonesia 88.3 0 6.9 0 0 0 0 4.8
Netherlands 86.9 4.3 0.1 1.4 0 3.8 3.4 0
China 83.5 2 14.2 0 0 0.1 0.2 0
Italy 82.1 0 12.5 0.6 0 1.7 1.3 1.8
Mexico 81.7 3.8 10.6 0 0 1 0.1 2.9
India 80.4 2.6 15.2 0 0 0.2 1.6 0
South Asia 78.7 2.4 17.4 0 0 0.2 1.3 0
East & Southeast Asia 78.3 9.3 11.2 0.1 0 0.5 0.2 0.4
Taiwan 78 17.1 3.4 0.6 0 0.8 0.2 0
United Kingdom 76.8 15.6 2.3 1.2 0 2.8 1.3 0
United States 71.7 19.1 6.3 0.3 0 1.3 0.7 0.4
Denmark 71 0 0.1 1.1 0 9.6 18.3 0
Central Europe 69.7 17.5 11 0.2 0 1.4 0.2 0
World 67.8 13.8 15.9 0.2 0 1.1 0.9 0.3
North America 65.9 18.5 12.9 0.3 0 1.3 0.7 0.3
Japan 65.6 24.2 7.5 0.2 0.2 1.5 0.2 0.3
South Korea 65.5 33.2 1.2 0 0 0.1 0.1 0
Germany 62.3 21.9 4.3 0.7 0.5 4.1 6.2 0
Argentina 61.9 6.3 30.5 0 0 1.3 0.1 0
Spain 61.7 17.8 9.6 0.5 0 1.2 8.8 0
European Union 55.7 27.7 10.1 0.6 0.1 2.7 3.1 0.2
West Europe 51.3 26.2 15.7 0.6 0.1 2.5 3.1 0.3
Finland 40.6 28.8 17.4 0.2 0 12.7 0.2 0
New Zealand 34.2 0 54.4 0 0 1.3 2.2 8
Austria 33.6 0 57.9 0.9 0 4.4 3.2 0
Canada 25.7 14.5 57.9 0 0 1.5 0.5 0
South America 23.4 2.2 72.1 0 0 2.3 0.1 0
France 9.9 77 11.3 0.3 0 0.7 0.7 0
Brazil 9.3 2.8 83.9 0 0 3.9 0.1 0
Sweden 3.9 44.7 44.7 0.6 0 5.1 1 0
Switzerland 1.5 41 53.9 1.8 0 1.7 0 0
Norway 1.2 0 97.8 0 0 0.3 0.7 0
Iceland 0 0 69.2 0 0 0 0 30.8
Britain is not in a particularly good position as domestic supplies of oil and gas are rapidly depleting.
Whereas the pain of Margaret Thatcher’s financial and labour market reforms in the 1980’s were
subsidised by the vast wealth created by North Sea oil and gas, David Cameron’s reforms have to be
far deeper to accommodate its demise. Britain’s energy balance has swung from reducing the trade
deficit by 6% GDP in 2000 to increasing it by 16% in 2009, with most of that change happening since
2004 – (http://www.energybulletin.net/stories/2010-10-21/cost-energy-imports-uk-trade-balance).
Whilst Britain is seen as a free market and its industry has to pay the same price as the outside world
for oil, the country as a whole is subsidised through royalty receipts from the North Sea. As
production declines, the loss of tax revenue will have to be found elsewhere, or government
expenditure will have to fall. Because North Sea output is declining faster than global production,
Britain’s efficiency drive will have to be deeper than other countries. Britain still gets 76.8% of its
power from fossil fuels, 25.5% more than Western Europe. Rather than investing its oil dividend in
alternative sources of energy as Norway has done, it has consumed the benefit, adding even further to
the relative scale of restructuring it must now face.
It is this relative decline that is the real nail in China’s coffin. Some people estimate that China will
overtake the US as the world’s largest importer of oil between 2014 and 2020. At USD120bbl this
would cost it an extra USD230bn. This is not going to happen. With domestic coal production
expected to peak around 2015 and decline rapidly thereafter, and with the EROIE already in rapid
retreat as it increasingly has to turn to poorer grades of coal in more distant and inaccessible places,
its ability to subsidise inefficient domestic industry will collapse, pricing it out of the world market.
The relative decline applies equally to demographics, agricultural and water resources, such that when
combined, the fall in its factor productivity could be very severe, undermining its ability to support the
external resource network it is trying to establish. Unfortunately what made China great in the last 20
years will also be what undermines it in the next 20 years.
As a group gradually comes together and restructures, it will start to price China out. How can it
realistically expect to compete in a free market with Germany that gets 7 times more work per unit of

22/02/2012
98
energy than does China, particularly given that it is now running out of fuel, workers, food and water,
and even the most common of elements such as iron ore where China is now reliant on imports for
70% of its needs. Green GDP shows it does not have the balance sheet to compete with the West. It is
unlikely to withdraw from the world market for some time, instead using its declining trade surplus
and its large foreign exchange reserves to buy and secure resources, but these will never be sufficient
to offset domestic supplies when they start to decline. The terms of trade will move dramatically
against it, forcing a slowdown in domestic capital spending with the consequent fall in productivity. It
will have no choice but to sell its international assets and face the domestic social consequences of a
collapsing economy.
What is clear however is that whilst the West has by far the better cards, it has to start playing them
better, lining up its star players into one proper coordinated team. At the moment it doesn’t even
understand what game it is playing. Just as a government must have legitimacy to carry the support of
its public and to function efficiently, so too must it if it wants the economic and political support of
the wider capital markets essential to remain in the game. It is paramount the US ensures the political
success of both Iraq and Afghanistan. The West must restructure and get their finances back on an
even keel no matter what pain it means taking in the short term such that the wider world once again
aspires to its leadership.
One potential policy measure that the US should deploy to build an all-powerful grouping would be to
unwind the inefficiencies that NAFTA imposed. By charging an equalising carbon tax on all imports
and domestic production, it would transfer capital back to the efficient economies of Europe and
Japan, and away from China. The market would be able to function properly once again, chasing
virtuous investment returns rather than negative cost arbitrage. Whilst it is not what many people
want to hear, the reality is that the value from the energy needs to be concentrated in fewer hands
such that it can drive the economic advancement that will get us out of this mess; the capital to labour
ratio must rise to eventually lift all our living standards.
Barriers to trade and the alignment of countries to best cope with the changes they face will not be
exclusive to the big currency blocs. Brazil for example, which should benefit from its resource
endowment and all the capital that attracts, is considering imposing controls that ensure the value
added remains domestic to the country right from the start. The first of those measures is a minimum
import price on steel products, which if implemented would charge a 12% tariff on imports over and
above the domestic cost of production, thus pricing imports out and effectively accelerating the
transfer of manufacturing jobs from Asia. In terms of presenting its industry as a united front, Brazil
is also seeking a partnership with Argentina and other South American producers of grains and oil
seeds to deal jointly with buyers from Asia and elsewhere, offering consistent policies rather than
being played off against each other as had been the case in recent years.
At the end of the day commodity prices are going to rise relative to the cost of other goods. This is
simply a reflection of the deterioration in resource quality exceeding efficiency gains in using them.
Wealth will be transferred from the resource consumers to the producers. How central banks and
governments decide to distribute the pain is a separate question. Money and credit are only
representations of what is going on in the real economy. Who controls the money will influence how
productive resources are used, but beyond that it has no scope for creating wealth. The simple printing
of money or quantitative easing, or broad fiscal policy cannot get around this reality. The only escape
from this transfer of wealth is for capital to be directed into the technology, research and education
that may eventually produce new high quality energy.
Chapter 12
Going Critical

22/02/2012
99
The future is extremely bright; just not yet. “To make an end is to make a beginning. It is the end we
start from”.
The story I have told so far offers little hope, yet this should not be the case. Nuclear fusion will open
the doors to untold wealth, totally new sciences, increased life span and the space travel that people
have dreamt of. It really is the next big leap for humanity, hopefully delivering gains that make the
Industrial Revolution pale into insignificance. My frustrations are directed at our leadership whose
primary responsibility is to the security of their people, yet by failing to grasp the gravity of the
situation, they are leading us into disaster. We should be wondering in amazement at the riches and
opportunities fusion can bring, but instead we are increasingly fearful of maintaining our standard of
living. Frustrations and hostilities are building up as we compete with each other for resources, yet
this need not be the case. Government and industry need to start working for the good of us all, and
investing serious money in fusion, as quite simply our future depends on it.
Fusion releases energy by fusing the nuclei of atoms whose combined mass is slightly smaller than the
sum of their individual masses, with the difference released as energy. The scale of energy from the
fusion of hydrogen to form helium is about 10 million times as much as the chemical energy released
by burning hydrogen or using it in a fuel cell. Given that water consists of 2 hydrogen atoms attached
to a single oxygen atom, the world’s oceans effectively become the fuel source. Fusion can happen at a
lower temperature with deuterium or heavy hydrogen, obtained from heavy water, which again is
abundant in vast quantities in the oceans, but in the Sun, hydrogen atoms combine to form this
isotope, so therefore using deuterium just avoids one step and speeds up the process. Once our
knowledge of fusion becomes better, there is no reason simple hydrogen cannot be used and indeed
heavier atoms.
Fusion is far more powerful than fission, converting larger percentages of the mass within an atom
into energy. It is achieved by heating a fuel to extremely high temperatures and giving the atoms
enough energy to collide, overcoming a natural electric repulsion known as the Coulomb barrier and
fusing. At large distances, positively charged nuclei repel each other, however if the nuclei can be
brought sufficiently close, then the electrostatic repulsion can be overcome by an attractive nuclear
force which is much stronger at closer distances. This force is understood to be a residual effect of the
even more powerful “strong force” which binds particles called quarks together which form the
nucleons themselves. By heating the hydrogen sufficiently to give the nuclei the energy to overcome
the repulsive force, the more the gas expands and the atoms move apart, resulting in less atomic
collisions and the fusion snuffing itself out. The Sun gets around this containment problem with its
gravitational force, however even then it is a balancing act between gravity trying to pull the atoms
together and heat trying to force them apart. This acts to regulate the pace at which the fuel can be
consumed, and therefore allows physicists to work out the age and life expectancy of the Sun by
comparing the mass of the fuel and the pace at which it is being consumed.
Fusion bombs overcome these two opposing forces of needing both extremely high heat and close
vicinity of the atoms by effectively squashing the hydrogen between two exploding fission bombs.
Even then the fusion reaction only lasts a fraction of a second before it has snuffed itself out, but in
that time huge amounts of energy are released. The largest ever bomb to be detonated was the 50
megaton Tsar Bomba in October 1961, nearly 3,500 times as powerful as the Nagasaki or Hiroshima
bombs or a quarter of the estimated yield of the 1883 Krakatoa eruption.
At the temperatures necessary to overcome the repulsive forces between nuclei and therefore to
achieve fusion, any container made of steel, concrete or glass would simply vaporise, so some other
form of containment is necessary. There are 4 states of materials; solids, liquids, gases and then at the
extremely high temperatures needed to create fusion there is plasma; “a gas of positive ions and free
electrons with little or no overall electric charge” according to the Oxford English dictionary. At these
temperatures electrons become unconnected from the nuclei although they are still attracted to them.
By using a magnetic field, physicists are able to make virtual containers or containment fields which
then allow the nuclei to be given sufficient energy to overcome their repulsive force without escaping.
The problem is that the magnetic confinement is not complete, and the plasma leakage has meant it
has been impossible to achieve sustained fusion.

22/02/2012
100
Lawson’s criterion defines the conditions needed for a fusion reactor to reach ignition whereby the
energy output from the fusion is sufficient to balance all the losses and maintain the temperature of
the plasma without any external power input. Ignition requires a minimum value for the product of
the plasma density, confinement time and temperature, in other words how long and at what pressure
the plasma can be contained. The combination of containment time and increased pressure leads to
more fusion events. In the book The Fusion Quest, professor T Kenneth Fowler highlights that the
“Lawson number has roughly doubled every two years for several decades, and there has been about a
million-fold improvement since the 1950’s”. There should be no reason why technological
improvements and better understanding won’t continue to advance this number at a similar pace,
boosting the potential yield. Indeed recent research on magnetic confinement has found that plasma
turbulence and heat loss is minimised in the same configuration necessary for achieving the highest
pressures, hence the performance and efficiency are self-reinforcing; higher pressures leads to more
self-generated electrical currents which help control the plasma leading to less reliance on external
controls and longer, steadier state operation according to
http://www.sciencedaily.com/releases/2009/11/091102103327.htm. “After decades of effort to
improve the behaviour and output of fusion plasmas, scientists are discovering that nature may
actually be so kind as to simultaneously allow high performance (lots of electricity!), optimal
efficiency (affordable!) and high reliability (the electrical output will always work!) in the design of
future power plants”. As the EROIE soars, the cost of energy would collapse whilst the supply would
become potentially infinite to all intents and purposes. The amount of work that could be done would
soar, only limited by other factor inputs although even these could be manufactured from a fusion
engine, allowing scientific advancement to accelerate.
In 2001 the US National Energy Policy Development Group noted “Although still in the early stages
of development, fusion research has made some advances. In the early 1970’s, fusion research
achieved the milestone of producing 1/10th watt of fusion power for 1/100th of a second. Today the
energy produced from fusion is 10 billion times greater, and has been demonstrated in the laboratory
at powers over 10 million watts in the range of a second”. That progress has continued with the Joint
European Torus regularly capable of producing 30MW.
According to Massachusetts Institute of Technology (MIT) http://web.mit.edu/newsoffice/2010/fusion-
ignition-0510.html Russia and Italy have entered into an agreement to build a fusion reactor outside
Moscow that could become the first Magnetic Confinement Reactor to achieve ignition and a self-
sustaining reaction. The design for the reactor called Ignitor, builds on decades of experience with
MIT’s Alcator fusion research program, which has the highest magnetic field and plasma pressure of
any tokamak fusion reactor. (A tokamak uses a magnetic field to confine a plasma in the shape of a
torus or donut).
Whilst ITER, the big global joint venture was originally designed to achieve ignition, that has been
scaled back. Its objective now is to achieve a ratio of thermonuclear power to applied power, a ratio
known as Q of 10 by around 2018 with its successor DEMO likely to achieve a Q ratio of 30 to 40
although this is not until 2040. ITER was first envisioned by Soviet President Mikhail Gorbachev
back in 1985 as a USD10bn collaboration project between the world powers, but then with the
Chernobyl disaster in 1986, the collapse of the Soviet Union, the Japanese recession and little support
from US scientists, it was postponed and postponed. It is still 8 years away and its aims and ambitions
have been diluted. Despite the push backs and the lack of funding, the smaller European, Japanese,
South Korean and US reactors have been closing in on sustained fusion. The French Tore Supra’s use
of perpendicular magnetic fields has produced and held plasmas over sustained periods, the longest
being 6 minutes and 30 seconds allowing more detailed studies to follow, whilst the use of
superconducting material for the magnets allowed it to achieve energy breakeven. The latest
progression of tokamaks is South Korea’s KSTAR engine which expects to advance research to high
performance steady state operation.

22/02/2012
101
Projected path from South Korea’s National Fusion R&D Centre
The National Ignition Facility (NIF) expects its Inertial Confinement experiments, using an array of
lasers to both ignite and contain the plasma, to achieve ignition by 2011 to 2012 although their
definition of ignition is comparable to the Q ratio. They expect NIF to generate 10 to 20 times more
energy than the laser energy delivered on the target, thus demonstrating the physics of laser
confinement or pulse fusion. Energy losses within the laser itself will be addressed in the follow up
Laser Inertial Fusion Energy (LIFE) engine which is now being designed at Lawrence Livermore
National Laboratory to generate net energy. In August 2010 the principal associate director of NIF,
Ed Moses declared that “inertial confinement fusion has arrived” and that the US Department of
Energy has begun to consider developing the technology for commercialisation. A pilot LIFE - (Laser
Inertial Fusion Energy) - plant on a similar scale to NIF could be built by 2020 with the laser firing
ramped up to 10 to 15 hertz - (cycles per second) - at which level it could produce enough energy to
power 1 million homes – (see http://optics.org/news/1/3/1). A global agreement was put together to
build the High Power Laser Energy Facility (HiPER), originally seen as a stepping stone between NIF
and LIFE, however it is now only expected to start construction mid-decade, with operation not until
the early 2020s.
Alcator and Ignitor are built on the principle that high plasma pressure, not large plasma size, was the
route to long plasma confinement time whereas ITER takes the different view. Inertial Confinement is
not interested in the containment time, but rather the force at which the atoms are initially slammed
together, ie it achieves its Lawson’s criterion through plasma pressure rather than confinement time.
Whether these programmes are successful or not, whatever is learned is seen as a gain. Various
different paths are being pursued and so large amounts of information and knowledge are being built.
Within the private sector the Canadian venture capital backed company General Fusion is aiming to
achieve a “full-scale proof of concept fusion generator to demonstrate a net gain in energy within four
years” or by 2013, with commercialisation of the technology taking place around 2016 – 2018
onwards. Its “magnetised target fusion” is a hybrid of traditional magnetic fusion and inertial

22/02/2012
102
confinement fusion, allowing considerably cheaper technologies to hopefully achieve the same goal.
It has taken a very mechanical approach using 220 pneumatically controlled pistons to send a high
pressure spherical compression wave through a sphere of spinning liquid lithium and lead contained
within a metal sphere. The aim is to trigger a fusion reaction in spheromaks or plasma rings – (like
smoke rings of plasma) - which are fired into the centre of the spinning sphere through a vortex by a
compact toroid accelerator or “plasma gun”. The fusion burst then releases its energy into the sphere
of liquid metal, and heat exchangers extract the energy for a standard steam turbine to turn into
electricity for the grid. The lithium in the liquid metal absorbs the neutrons acting as a catalyst to
produce or breed tritium gas which can then be used as the fuel. Whilst the idea is not particularly
new, it is only now that the technology has caught up to allow sufficiently precise control of the
pneumatic rams to make this a realistic possibility.
Hydrogen fusion requires temperatures of around 100 million degrees Kelvin whereas more complex
fusions require higher temperatures. Sandia National Laboratories have managed to use pinch fusion
to create temperatures of 2bn degrees Kelvin and radiated X-ray energy output as much as 4 times the
kinetic energy input. These Z-pinch machines produce large bursts of X-rays which are being studied
as drivers for inertial confinement. In February 2006 Lawrence Plasma Physics applied for a patent
entitled “Method and Apparatus for producing X-rays, Ion Beams and Nuclear Fusion Energy” or
what they call Focus Fusion. By releasing a large electric current from a bank of capacitors across two
electrodes, intense magnetic fields are generated. As electricity flows down any wire it creates a
magnetic field spiralling or winding around the wire. If it is sufficiently strong, it can crush and twist
the wire as was originally discovered in Australia where hollow lightning rods were crushed in
thunderstorms. The same “pinch” effect happens on the gas through which the electricity travels or
jumps between the electrodes. This powerful magnetic force squeezes the gas or fuel to extremely high
temperatures and densities. Whilst this is known technology, the plasma is unstable, twisting into tiny
dense balls only a few thousandths of an inch thick called plasmoids. The collapsing magnetic field
induces an electric field causing a beam of electrons to flow in one direction and a beam of ions in the
other. The electron beam heats the plasmoid enabling fusion reactions and therefore adding more
energy to the plasmoid. Rather than trying to stabilise the plasma as others have done Lawrence
Plasma Physics approach is to direct these charged particles into a particle decelerator to induce
electricity in much the same way that a transformer steps electricity down from a high voltage
transmission line to a voltage safe to be used in a house. This would remove the inefficiencies of
using steam turbines that other methods rely on. Sandia themselves under the auspices of Z-Pinch
IFE, have the long term goal of producing economically attractive power plants using the z-pinch
technology, however their near term goal is to address various science and technology issues of
repetitive firings which would be necessary for the economic production of electricity.
Tri Alpha is a privately funded venture looking to develop Aneutronic fusion similar to Sandia. It has
possibly been the most successful at raising funds from investors including the venture capital fund of
billionaire Paul Allen of Microsoft fame. Aneutronic or hydrogen-boron fusion requires ion
temperatures almost ten times higher than for deuterium-tritium (DT) fusion increasing the technical
challenge. Less than 0.2% of the energy released is carried by neutrons reducing problems associated
with neutron radiation and safety issues. Instead the energy is produced in the form of charged alpha
particles, hence the company name. This means the energy can be converted directly into electricity
using techniques based on mature technology derived from other fields such as microwave technology
that is cheaper than conventional thermal production of electricity. Simpler forms of fusion using
deuterium and tritium (DT) which produce their energy in the form of neutrons require a standard
thermal cycle, in which the neutrons are used to boil water, and the resulting steam drives a large
turbine and generator. This equipment typically accounts for about 80% of the capital cost of a
conventional fossil-fuel power station so fusion with DT fuels could not significantly reduce the
capital costs of electric power generation even if the fusion reaction was cost free. Direct conversion
techniques can either be inductive, based on changes in magnetic fields, or electrostatic, based on
making charged particles work against an electric field. Unfortunately Tri Alpha has surrounded itself
in secrecy so little is known about its development and progress.
This is by no means an exhaustive list, and there are many variations on the themes. Computer
modelling for example has shown that Diamond Methane Impact Fusion using linear accelerators to
fire diamond methane bullets into each other at around 1000km per second can generate net energy

22/02/2012
103
through fusion. NIF is itself exploring different paths including a fast ignitor approach in which the
fuel is contained by a long pulse laser whilst ignited by a short-pulsed laser, giving a higher yield.
Inertial confinement is usually associated with “indirect drive” whereby the fuel pellet is mounted
inside tiny metal can or hohlraum with holes at each end through which the laser enters causing the
metal container to emit X-ray’s which then compresses the capsule uniformly from every conceivable
angle igniting the fuel. The Laboratory for Laser Energetics is using a direct-drive approach of firing
the lasers directly on the fuel capsule which has the benefit of a higher yield if the plasma can be kept
in a stable spherical shape when it is compressed. In the magnetic confinement approach the Culham
Centre for Fusion Energy in the UK is experimenting with a spherical – (imagine a cored apple) -
tokamak known as MAST or Mega Amp Spherical Tokamak. Whilst this is only a test facility, the
spherical design has shown itself to be more efficient than the more traditional doughnut shaped or
toroidal reactor and therefore it should help to push the bounds of understanding and advance the
trajectory of the science.
The idea of harnessing nuclear fusion for power generation started in 1951, but the bad press
associated with its sibling nuclear fission, particularly after the partial core meltdown at Three Mile
Island and later Chernobyl, together with the availability of cheap North Sea and Alaskan oil, meant
that the science has received almost no funding. With neither political nor commercial support for
nuclear power of any form, the last fission plant to be commissioned in the United States of America
was in 1978. Budgets over the last 20 or 30 years did not allow much more than experimentation in
the garden shed. On a recent BBC documentary for example, it was claimed that the UK spends more
on ring tones for mobile phones than it does on fusion research.
At the end of the Cold War, agreements between the US and Russia over decommissioning weapons
and the Comprehensive Nuclear Test Ban Treaty banned all weapons testing, making the reliable
development of newer generations of nuclear weapons much more difficult. To circumvent this and to
ensure the US didn’t lose a generation of nuclear scientists; it developed the Stockpile Stewardship
and Management Program which would use computer modelling and low yield inertial confinement
experiments to maintain its lead which is where the National Ignition Facility was born. It is financed
by the DOE NNSA Defence budget. Inertial confinement technology allowed it to create miniaturised
nuclear explosions. The use of the same technology for power generation was just a happy
coincidence. Budgets for fusion energy are almost non-existent. Even 25 years after the initial
agreement to build ITER, funding the project is still not assured. During WWII the Manhattan Project
to create the nuclear bomb cost the US taxpayer 1.25% of GDP, the equivalent of USD178bn in 2009
terms, yet budgets for nuclear fusion are in the hundreds of millions. Even the ITER project only has a
budget of EUR10bn – EUR15bn. Despite the lack of funding, the technology has progressed
dramatically, but both us as individuals and the governments representing us have to recognise that it
is not the cost of achieving fusion that we should worry about but rather the cost of not achieving it. In
WWII the cost of not getting the nuclear bomb was the potential that the Axis Powers would, although
hindsight tells us that was never a realistic possibility. Today the cost of not achieving nuclear fusion
is potentially far worse for humanity as a whole.
Fusion energy has said to have been “twenty years away for the last fifty years” which has resulted in
a lot of people losing faith and ignoring the great advances being made. The book The Most Powerful
Idea in the World highlights the gestation period of the Industrial Revolution was extremely long,
taking almost 100 years even from Thomas Newcomen’s steam engine to the more famous James
Watt engine that was fundamental to the Industrial Revolution. They simply didn’t have the materials,
skills, tools or knowledge to build efficient systems. Watt struggled for years getting pistons to fit
accurately into cylinders. Simple things such as the lead-screw that gave lathes their accuracy and
repeatability all had to be invented. Parts could then be built within specified tolerances rather than
just to the maker’s eye. This opened up the possibilities of replication, common parts and mass
production. It was all self-reinforcing. Even creating sufficient supplies of iron and steel was
dependent on the performance of steam engines. The modern calculator and even programmable
computer owe their original concept to Charles Babbage, but yet again the ideas had to wait for the
tools, and in this case electricity, to catch up.
This is exactly the same with fusion. The materials, technologies and computer power need to be
developed to allow fusion to become realistic, but as the Lawson’s number shows this is happening

22/02/2012
104
despite what can only be described as shoestring budgets. The technology is all self-reinforcing. The
steam engines allowed more work to be done, which meant more steel could be produced. Mechanical
work meant parts could be replicated to exact specifications resulting in greater efficiencies and even
more work; the Industrial Revolution could accelerate and feed on itself. The ability to use computers
to make billions of calculations and experiment synthetically has enabled processor power to double
every 18 months, allowing new technologies such as genetics to be developed which again hopefully
reinforces itself by allowing a larger productive workforce. Once we achieve fusion, the same self-
reinforcing advancements should happen. The technologies that will be developed from fusion,
together with the infinite amount of cheap energy, and therefore work that can be done, will allow us
to make huge new leaps forward.
Just as the industrial revolution lacked relevant quality materials, so too does fusion. Whilst it
promises an emission-free power source with no long-term radioactive by-products, and whilst the
plasma itself is contained within a magnetic field, any heat that leaks out will leave a damaging
footprint on the reactor walls despite the fact that it will have lost most of its energy immediately it
leaves the hot plasma. Computer simulations are being used to understand the mechanical properties
of materials necessary to combat this, and how such materials might be built. According to the United
Kingdom Energy Authority, “The properties we need to worry about are the embrittlement under
irradiation, loss of strength at high temperatures, thermal creep, helium effects and dimensional
stability as the irradiation can change the material’s volume”. Tungsten shows promise for the area of
the reactor that must withstand the highest temperatures, whilst Ferritic steels based on iron-
chromium alloys are being investigated for the first wall of the reactor.
http://www.iom3.org/news/fusion-takes-materials-extreme highlights that the biggest issue with all
the materials being investigated is that so little is known about their behaviour in environments of
over 500 degrees Celsius and irradiation levels of up to 200 dpa. Computer modelling is backed up
with mechanical testing using “focused ion beam machining”, specialist equipment that had to be
designed and built for the purpose exactly as the lead-screw had to be built for the lathe 250 years
earlier. The materials then need to be tested for how their properties will be altered by helium and
hydrogen bombardment which will be done in a particle accelerator or in a spherical reactor built for
the purpose. Material engineers at Purdue University are harnessing nanotechnology to define tiny
features in coatings to create better “plasma facing” materials. One entirely new material is lithiated
graphite which is being designed to have self-healing functions to withstand the temperatures and
radiation involved. Physicists working at the National Spherical Torus Experiment (NSTX) at
Princeton have successfully used “snowflake” divertors, or a second magnetic field which resembles a
snowflake to act as a buffer for the escaped plasma to cool down sufficiently before causing any
damage. Whilst similar buffers have been used for some time, the specific configuration of this has
shown much better results. It has also shown no negative impacts on the confinement performance of
the main plasma and has even enhanced it.
Diagnostic tools are needed to understand what is happening in the plasma at temperatures in excess
of 200 million degrees Kelvin and at pressures that can reach a trillion times atmospheric pressure.
New Materials are required. Getting 220 pneumatically controlled pistons to act in precise unison and
at the right speed to cause high pressure spherical compression waves need new levels of control.
Getting 192 lasers to strike the target at the exact same time and at the correct angle needs both large
amounts of computer power but also incredibly precise mechanical control of the lasers and of the
firing mechanisms and of the optics themselves. One of the problems suffered by Inertial Confinement
is the cooling of the lasers necessary between repeated firings, but collaboration between Russian
scientists and Sandia – (a Lockheed Martin company working for the US Department of Energy’s
National Nuclear Security Administration with responsibility for all US energy technologies) – has
resulted in the Linear Transformation Driver (LTD) which can fire sufficiently strong lasers bursts
every 10.2 seconds. A test machine has fired without flaw for more than 13,000 fires which on my
calculations is 36 hours. According to Sandia’s web site, this would be “enough (theoretically) to
generate high yield nuclear fusion within the parameters necessary to run a power plant”. They
describe it as “revolutionary” and closing the gap with magnetic confinement. A second problem has
been to enable the laser optics to withstand the energy they are being subjected to, but optics grown
out of diamonds are now proving successful in other high powered laser technology being deployed in
uranium enrichment for nuclear fission. A third area of concern had been the cost of the high powered
UV lasers if Inertial Confinement was ever going to become commercial, but in recent years the

22/02/2012
105
output power and efficiency of laser diodes has improved enormously such that they have now
replaced flash-lamps in high-power commercial laser systems, and whilst they are not yet sufficient
for commercial fusion, it won’t be long before they are. Indeed the Lawrence Livermore National
Laboratory is constructing a high powered diode-pumped laser which they call Mercury. The
prototype should operate at a frequency of 10 hertz with each pulse delivering 100 Joules and with a
laser efficiency of 10% conversion of electricity to laser light. It won’t emit sufficient energy for LIFE,
however it is being built for proof of concept and if successful the technology is easily scalable.
It is understandable that 60 years after the initial concept of cheap nuclear fusion, that people have
become frustrated and disillusioned however there has been enormous progress and the potential
spoils are enormous. The science of fusion is actually relatively simple, and the technologies, tools
computer power and skills to enable its birth are gradually being built. It is surely no longer a case of
if but rather when, at what cost, what it will look like and what benefits it will deliver.
The Sun’s core which produces the fusion has a temperature of about 13.6m Kelvin – (fusion can
happen at much lower temperatures in the stars than on Earth due to something called quantum
tunnelling) - and density about 150 times that of water, whilst the surface is only around 5,800
Kelvin. Even at the core only simple fusion of hydrogen can happen, and scientists say that a lot of the
residual helium has come from other stars as the Sun is just not hot enough to have created that much
of the gas. To fuse heavier atoms– (the Coulomb barrier increases with the number of protons or
atomic number) – more energy is required which is found in Red Giants, or for heavier elements such
as iron, Supernova’s or collapsing stars where temperatures reach several billion degrees Kelvin.
Hydrogen is fused into heavier and heavier elements in these solar furnaces making all the matter and
materials we are familiar with. Even carbon and iron and other elements that make up our bodies are
really just nuclear waste from one or more of these fusion factories. Theoretically therefore there is no
reason why we can’t use fusion on Earth to create these elements, and perhaps even heavier ones that
we are not yet familiar with. This is clearly a long time away, and with iron and heavier atoms, fusion
would be energy consuming – (the fusion of two nuclei with lower masses than iron releases energy
while the fusion of nuclei of heavier atoms absorbs energy. The opposite is true for the reverse
process, nuclear fission) - but this is just one kind of science that could potentially be opened up. The
higher temperatures necessary have already been achieved on Earth although only for tiny fractions of
a second, but Lawrence Plasma Physics’ Focus Fusion approach jumps straight in to these more
complex fusions with its attempt to fuse boron with hydrogen, so it should not be dismissed out of
hand.
Beyond the initial ignition experiments NIF offers the potential to become the world’s premier facility
in high energy density science opening up the doors to the nature of matter and energy itself. Beyond
explosives or rocket fuel, the highest density energy we have used has been electricity but perhaps
totally new sciences can evolve with even denser forms of energy. Certainly high density fusion power
which could achieve exhaust velocities several thousand times more than rocket engines would be the
key to developing space travel to any meaningful degree. Ed Moses highlights that the National
Ignition Facility can already produce states of matter not previously achievable in any other
laboratory. It can accelerate more material for hydrodynamics experiments and heat more mass for
radiation transport studies than present facilities. After achieving ignition, the conditions in the hot
dense core will be unique to the laboratory. The neutron yield environment will provide high flux
densities for novel materials and nuclear physics studies. NIF will develop into a user facility by 2012
to broaden its scientific base and maximize its impact in the scientific community.
As I said earlier in the book, with every advance in science the difficulty of the task increases. To
move forward therefore more work needs to be done and increasingly more intelligent work. It is
unlikely that will be achieved by adding to the population but rather by accelerating computer
advancement from just following instructions to actually thinking. Nanotechnology could be
instrumental in opening these doors, creating much smaller and therefore more powerful computer
circuits. It could even create three-dimensional circuits taking computer power to a completely new
level. As it is, spin-offs from nuclear fusion research are already pushing the envelope of Moore’s
Law. The ultraviolet beams used to project an image onto a light-sensitive material to then chemically
etch a computer chip are simply too thick to increase the number of transistors much beyond the
present levels. Extremely thin plasma beams with a wavelength less than 1/10th of the present

22/02/2012
106
ultraviolet beams will advance the technology from lithography to “nanolithography”, opening up
more computer power to solving the fusion problem. Just as with the Industrial Revolution, it is this
kind of circular reinforcement that will soon make nuclear fusion a reality.
In fact Nano or molecular technology complements fusion energy perfectly just as Mother Nature
complements the energy of the Sun. Whilst nuclear fusion fuses the nucleus of atoms together to make
different atoms; Nanotechnology manipulates or moves those atoms around. It could be used to make
machines smaller than living cells which could themselves be used to make stronger and lighter
materials. Complex structures could be built atom by atom. If you think about nature, these machines
are the building blocks of life with for example our genes instructing cells to do millions of different
tasks. We are just starting to see this come through in terms of stem cell technology to repair and
regenerate tissue and bone, but why not programme them to assemble atoms into small machines.
Nanotechnology could assemble those atoms in different ways, joining 2 hydrogen atoms with 1
oxygen atom to create water for example or having a Star Trek style replication machine to assemble
food. With this kind of molecular technology we could compete with Mother Nature. Waste materials
could be disassembled atom by atom and then reassembled however we chose. The possibilities are
almost endless, but again, as with nature all of this requires vast amounts of energy which is where
fusion comes in. The route of using “alternative” energy like wind, solar, hydro and biofuel will steal
some of the energy required by nature to function and would therefore be environmentally damaging
whilst fusion would give us the energy to harness some of the same incredible molecular powers of
nature to advance humanity to the next level.
Over the last one hundred years the marginal productivity of research and development has gradually
declined. Research and development budgets, the number of scientists and engineers rose but patents
for new technology declined. To achieve big breakthroughs like this, adequate capital must be directed
at the project. That spending should not just go down one route at a time but should finance numerous
different projects and paths simultaneously. Technology and results should be shared so that a proper
network of information can be built to push the science forward. In the 1970’s this appeared to be the
case. Three large tokamak projects that were begun at that time all achieved “scientific break-even”
whereby the amount of energy released from fusion reactions equalled the amount of energy put in to
heat the plasma. Unfortunately budgets then started to fall despite the success. By the mid 1990’s
these three plants, designed to sustain fusion for only a few seconds, had produced more than 10MW
of power but in 1998 budget cutting in the United States of America pulled the plug on its Tokamak
Fusion Test Reactor (TFTR).
http://fire.pppl.gov/us_fusion50yr_dean.pdf highlights the financial struggle the industry has faced. In
1976 the US Energy Research and Development Administration published a detailed fusion
programme suggesting that if a sequence of advanced test facilities were constructed in a timely
fashion, fusion electricity could be on the grid in a demonstration power plant by the year 2000. This
plan was codified by US Congress in the Magnetic Fusion Energy Engineering Act of 1980 and
signed by President Jimmy Carter on October 7th 1980. With the energy crisis coming to an end,
President Reagan ensured the provisions of the act were never implemented and fusion budgets
suffered major cuts. In the early 1990’s the US Department of Energy’s Fusion Policy Advisory
Committee said the DOE should set 2025 as the target date for operation of a demonstration power
plant assuming a scaled up budget and the construction of a Compact Ignition Tokamak but no new
plant was forthcoming and budgets were cut back still further. In 1985 Soviet President Mikhail
Gorbachev proposed a new joint test reactor ITER which was agreed between the global powers, but
budget cuts in the US meant its withdrawal, whilst the Russian and Japanese financial problems has
meant construction has only recently begun and the first testing is not expected until 2018, some 33
years after the initial proposal. The US continued to cut its fusion budget through the 1990’s to just
USD225m a year and then in 1997 shifted the purpose of it from an energy programme to a science
programme. In September of the same year the President’s Committee of Advisors on Science and
Technology recommended across the board increases for most energy R&D programmes including
fusion “to close the gap between the current energy R&D program and the one that the challenges
require”. It specifically called for collaboration with ITER and said it was “Vital to continue without
delay the international pursuit of fusion energy”. US funding was “too low” to allow any significant
US activity to participate in an international development programme. Despite the recommendations
funding remained flat. In 1998 the US Secretary of Energy Advisory Board issued a review for the

22/02/2012
107
Senate Appropriations Committee, saying “It is the Task Force’s view that the threshold scientific
question – namely, whether a fusion reaction producing sufficiently net energy gain to be attractive as
a commercial power source can be sustained and controlled – can and will be solved. The time when
this achievement will be accomplished is dependent, among other factors, on the creativity of
scientists and engineers, skill in management, the adequacy of funding, and effectiveness of
international cooperation”. It also called for the DOE to expand its fusion portfolio rather than
selecting one route to follow which the committee had called for. None of this emerged. This process
has continued ever since. Whilst the statement “fusion has been 20 years away for the last 50 years” is
often used to criticise the science, the reality is that criticism should be aimed squarely at politicians
as the timetables have always been based on adequate funding which has never been forthcoming.
Without a sensible budget how was the science supposed to advance? Fusion’s slow development and
the consequent hit to our present and future standard of living are due to political rather than
scientific failure.
In June 2010 The American Energy Innovation Council created by Bill Gates, Jeffrey Immelt and
other top business leaders, issued a report urging government to more than triple spending on energy
research and development to at least USD16bn a year, arguing the world needs radical advances in
energy technology. Bill Gates said there is no way either in this country or internationally you’re
going to come close to meeting carbon reduction targets without “an immense breakthrough” in
technology. He said the only way to find such “disruptive” new technology is to pour large sums of
money into finding a solution, with the clear understanding that any number of ventures would fail
before the eureka moment arrived.
Politicians work to a 4 or 5 year election cycle which will always mean that funding for a 20 – 25 year
scientific programme will be minimal at best. As the science develops however, the development
timetable will fall and the gap between scientific and political interests will narrow making funding
much more freely available. Hopefully the success that we are seeing from the present programmes
together with the rising fuel prices will act as the carrot and stick to encourage both public and
eventually private sector budgets to be increased to levels commensurate with the risk of not achieving
fusion. The science has clearly advanced sufficiently that venture capital feels it might just strike
lucky, but hopefully it is not long before the science has progressed sufficiently for the mainstream
energy producers and capital goods companies to get involved, at which stage the amount of capital
coming into the sector will rise exponentially. If that were to happen then timescales can be
compressed and early commercial adoption could become a realistic possibility in the 2020’s. With
the right funding the decline in energy availability should be halted and reversed within 20 years of
today, allowing countries balance sheets to start growing once again.

22/02/2012
108
Chapter 13
Checkmate The main attribute of democracy can also be its biggest downfall. By allocating resources according
to the collection of interests rather than the collective interest and the common good, it suffers from
the so-called “tragedy of the commons”. If we are to get out of this problem, us turkeys must vote for
Christmas and leaders must stop fiddling whilst Rome burns!
If peak energy is not real, why are we using lower quality fuels? Why does the Financial Times report
that 9 out of the top 10 publicly quoted oil companies appear to have passed peak production? Why do
we have to accept less work from our energy? Why is coal going to become the biggest source of
energy in 2012 despite environmentalist’s concerns about carbon emissions? Why are we turning coal
and gas into gasoline when we lose around 60% of the energy in the process? Why is the capital cost
of energy extraction and conversion into useful work rising as a percentage of global GDP? Why is the
energy market competing with the food market for agricultural land? Why is our purchasing power
being squeezed by higher food and energy prices?
To be fair to the economics profession and broader industry, energy has been so cheap and plentiful
for the last 100 years that they have forgotten just how central it is to everything we do. Travel back a
bit further and the importance of energy becomes all too apparent and well understood. Market signals
such as the reallocation of capital to the BRICS - Brazil, Russia, India and China - and the changing
terms of trade have been totally lost on most of us, as was the credit crunch, however as the market
increasingly throws out these signals the band of people shouting is getting louder, and now with
leaders of industry such as Bill Gates and Jeff Immelt taking up the cause government will soon have
very little choice but to listen and act. The good news is that a single mistake rarely proves fatal, and
we are rich enough and have a sufficiently large balance sheet that we can achieve nuclear fusion and
get ourselves out of the present mess in a timely manner. Once our leadership has accepted that
conventional wisdom has been wrong, then a solution should not be far away.
Policy must be aimed back at the real economy rather than its financial representation. This way real
links and interdependencies become more apparent, making solutions more possible. Under a fiat
system, insufficient energy production is reflected in a higher cost, which economists think can be
squared away with a higher capital allocation. In the real world that capital is itself dependent on
energy supplies, and so shortages can creep up on us much more sharply than pricing signals would
suggest. The normal production curve does not factor in this feedback loop which will make the
decline much more aggressive. In this environment the market finds it very difficult to determine the
“correct” price, and so “price shocks” become more frequent, rapidly draining liquidity from the rest
of the economy -http://anz.theoildrum.com/node/6974#more. Investment becomes more complex as
the terms of trade, or basis of any decision is subject to rapid change and volatility, making previously
profitable investments worthless, and limiting future funding to short duration risk. In 2008 and 2009
we witnessed just how quickly a feedback loop of interdependency could bring asset prices crashing
down and drain liquidity from the broader market; however this was a monetary phenomenon and
easily solved by the Federal Reserve creating more paper liquidity. The only solution in the real
economy is to find a new source of energy, which first means correctly interpreting those market
signals and directing capital accordingly rather than the blind printing of money. Until that happens,
the real cost of capital will rise.

22/02/2012
109
The geological decline of fossil fuel production will play out in the form of reduced economic
productivity of all factor inputs. Politicians must use policy to position their country’s resources to win
this game. It’s not going to be painless. Some aspirations and ideals wills have to be sacrificed to
finance the necessary investment, just as pawns and other pieces have to be sacrificed to win a game
of chess. Our present position is similar to the 1930’s when Britain stuck its head in the sand and
appeased Nazi Germany, only to have to make far larger sacrifices down the line. Had it developed the
jet engine in the early 1930’s as it could easily have done, or had either it or the United States
matched the German military build-up, perhaps the war would not have happened. Government has to
be allowed to produce a credible strategy for longer term growth. The present regulatory and tax
uncertainty is stopping companies investing. Corporate liquidity will only be invested if there is
confidence in the future. Constitutions need changing to give certainty and direction to the economy
no matter which party is in power.
The energy industry is presently divided into oil and gas companies, coal miners, a few nuclear fission
companies, and then the so-called alternatives. None of them look beyond their own remit. Higher
energy prices necessary to maintain production are simply being reinvested in less efficient supplies,
“kicking the can down the road” but in no way finding an end solution. Government should impose a
tax on the consumption of these fuels, forcing energy prices even higher than the geological decline
would infer, and channel the funds into fusion research. If it is not willing to do this, then it should
open a fund to allow investors to participate in the public sector fusion programmes with some sort of
equity participation.
Whilst the problem we face is a scientific deficit, it may well play out in military terms. In September
2010 the German military think tank Bundeswehr Transformation Centre, tasked with fixing a
direction for military security, had an internal report leaked on the Web. It warned of a shift in the
global balance of power to the oil exporters and advocated the need to form new alliances based on
interdependency. Without such action it expects a decline in the importance of western industrial
nations, “the total collapse of markets” and the eventual relapse into planned economies. Whilst it
believes peak oil is happening at the moment, it feels the economic and social collapse will not turn
into external security issues for another 15 years. Unfortunately the full leaked report is in German –
(http://peak-
oil.com/download/Peak%20Oil.%20Sicherheitspolitische%20Implikationen%20knapper%20Ressourc
en%2011082010.pdf). The United States Joint Forces Command has similarly warned that the main
security threat the world now faces is energy related, with oil supply the main aspect of this. The
report warns “A severe energy crunch is inevitable without a massive expansion of production and
refining capacity”. To add to the urgency, it restates its 2008 forecast, “By 2012, surplus oil
production capacity could entirely disappear, and as early as 2015, the shortfall in output could reach
nearly 10 million barrels per day”, the equivalent of about 11% of today’s consumption. It warns,
“The implications for future conflict are ominous,” and acknowledges the resulting potential for a
prolonged US recession, deep cuts to defence spending, and diminished capabilities. In February 2010
The UK Industry’s Task Force for Peak Oil and Energy Security suggested that new oil supplies
would fail to offset declining production from the end of the year. Spare capacity would be able to
absorb the differential until 2014 when the decline from existing fields will accelerate rapidly relative
to new fields coming on stream.
Historically war has been necessary to trigger the re-set button, and clearly these warnings suggest
that is once again a real threat, possibly starting initially with a regional resource grab around Asia. In
the 1930’s, despite obvious signals, government hid behind the veil of economic hardship rather than
allocate capital correctly. We must not allow them to do the same again. Government must embrace,
direct and channel the economic signals rather than blindly fighting them. The very fact that society
can get itself into this kind of dead end once again suggests that the economic and political system
under which we live is sub-optimal, and needs strategic direction.
Oil remains the best source of high quality concentrated energy we have, and yet discoveries peaked in
1965 and production has exceeded discoveries every year since 1984. There is something incredibly
wrong with the system that has not forced leaders to invest more of that endowment in finding a
credible successor to oil. With conventional oil production now declining, we increasingly have to

22/02/2012
110
turn to lower quality coal and even lesser forms of energy to both support existing consumption and to
finance the investment necessary to make the nuclear breakthrough. Financial markets will keep
testing our resolve, contracting and rapidly re-shaping the global economy. Our leaders must accept
the game we are in and allocate however much capital is necessary to achieving fusion even though it
adds to the short term economic and social hardship. Federal R&D (research and development)
spending peaked relative to GDP almost precisely when oil discoveries peaked, and has fallen ever
since. This has to rapidly reverse to break the feedback loop, as the cost of not achieving sustainable
nuclear fusion is a cost none of us would want to contemplate.
At the end of the day, with the right allocation of resources we should have fusion by now, making our
future prospects incredibly rosy. The blame for our present predicament and the future hardship we
now face lies squarely at our own doors. The market will demand an increasing sacrifice from us the
longer we delay the necessary investment; it will only get tougher. We cannot maintain output by
consuming down resources; we must invest in the science that can open up virtually unlimited
reserves of high density energy. It is your future and it is in your hands; make the right choice.
This material has been prepared by AML Macro Limited. The material should not be viewed either as
sales material or as research. Opinions expressed herein are subject to change without notification. Any prices or
quotations contained herein are indicative screen prices and are for reference only. They do not constitute an offer to buy or sell any
securities at any given price. No representation or warranty, either express or implied, is provided in relation to the accuracy,
completeness, reliability or appropriateness of the information, methodology and any derived price contained within this material.
The securities and related financial instruments described herein may not be eligible for sale in all jurisdictions or to certain categories
of investors. AML Macro, its directors, officers and employees or clients may have or have had interests or long or short positions in
the securities or related financial instruments referred to herein, and may at any time make purchases and/or sales in them. Neither
AML Macro, its directors, employees or agents accept any liability for any loss or damage arising out of the use of all or any part of
these materials. The information contained herein does not apply to, and should not be relied upon by, private customers. All rights
reserved. This material is strictly for specified recipients only and may not be reproduced, distributed or forwarded in any manner
without the permission of AML Macro Limited.
Copyright © 2022 FDOKUMEN