Technology and petroleum exhaustion: Evidence from two mega-oilfields
28
Working Papers in Economics Department of Economics, Rensselaer Polytechnic Institute, 110 8 th Street, Troy, NY, 12180-3590, USA. Tel: +1- 518-276-6387; Fax: +1-518-276-2235; URL: http://www.rpi.edu/dept/economics/; E-Mail: [email protected] Technology and Petroleum Exhaustion: Evidence from Two Mega-Oilfields John Gowdy Rensselaer Polytechnic Institute Roxana Julia Rensselaer Polytechnic Institute Number 0512 December 2005 (Revised April 2006) ______________________________________________________________________________ For more information and to browse and download further Rensselaer Working Papers in Economics, please visit: http://www.rpi.edu/dept/economics/www/workingpapers/
Transcript of Technology and petroleum exhaustion: Evidence from two mega-oilfields

Working Papers in Economics Department of Economics, Rensselaer Polytechnic Institute, 110 8th Street, Troy, NY, 12180-3590, USA. Tel: +1-518-276-6387; Fax: +1-518-276-2235; URL: http://www.rpi.edu/dept/economics/; E-Mail: [email protected]
Technology and Petroleum Exhaustion: Evidence from Two Mega-Oilfields John Gowdy Rensselaer Polytechnic Institute Roxana Julia Rensselaer Polytechnic Institute
Number 0512
December 2005
(Revised April 2006)
______________________________________________________________________________
For more information and to browse and download further Rensselaer Working Papers in
Economics, please visit: http://www.rpi.edu/dept/economics/www/workingpapers/

1
TECHNOLOGY AND PETROLEUM EXHAUSTION: EVIDENCE
FROM TWO MEGA-OLDFIELDS
John Gowdy*
Department of Economics
Rensselaer Polytechnic Institute
110 8th St., Troy, NY, 12180,USA
tel.: (518) 276-8094
Roxana Juliá
Department of Economics
Rensselaer Polytechnic Institute
110 8th St., Troy, NY, 12180,USA
tel.: (518) 273-1123
* Corresponding Author, FAX:(518)276-2235, E-mail address: [email protected]

2
ABSTRACT. In this paper we use results from the Hotelling model of non-renewable
resources to examine the mainstream view among economists that improvements in
recovery technology can offset declines in petroleum reserves. We present empirical
evidence from two well-documented mega-oilfields: the Forties in the North Sea and the
Yates in West Texas. Patterns of depletion in these two fields suggest that technology
temporarily increases the rates of production at the expense of more pronounced rates of
depletion in later years - in line with Hotelling’s predictions. Insofar as our results are
generalizable, they call into question the view of most economists that technology can
mitigate absolute resource scarcity. This raises concerns about the capacity of current
mega-fields to meet future oil demand.
Key Words: Non-renewable resource scarcity, technological change, oil depletion.
3
1. The economic view of resource scarcity
A recurring theme in resource economics textbooks is that absolute resource
scarcity is not a major concern for economic policy. The standard view is that the price
system, by encouraging substitution, exploration, and technological advances, in effect
creates more resources as prices increase. In this view, scarcity is properly seen as an
economic not a physical concept [1]. The view expressed in a recent text by Hanley,
Shogren, and White [2] is typical:
As a resource gets scarcer, its price will, other things being equal, tend to
rise. This will reduce consumption (by substitution, for example), and
increase production…What is more, as prices rise producers will be
encouraged to engage in more exploration, which will increase the resource
base if finds are made.
On the face of it, this argument is quite reasonable. However, it is one thing to
accept the general statement that as a resource becomes scarce its price will rise and
suppliers can profitably search for more of it and invest in technologies that boost
production, but quite another to argue that the increasing scarcity of an essential resource
like petroleum can be easily accommodated. The later position has been the basic
message of resource economists for several decades now. The standard economic
position is that scarcity is a relative, not absolute, concept and that there is nothing unique
about any particular productive input, including petroleum.
Recent theoretical developments and empirical evidence suggests that economists
may have been too quick to dismiss absolute scarcity. First of all it has become clear that
the Walrasian general equilibrium model, upon which standard resource economics is
4
based, depends on some strong assumptions that do not accurately describe real-world
consumer or producer behavior [3], [4], [5], [6]. Theoretical economic models that
address the issue of resource scarcity assume rational and fully informed agents, efficient
allocation through time, and that present and future resource stocks are known. Secondly,
the use of prices as indicators of absolute scarcity has been shown to be seriously
misleading. Much of the empirical literature using historical prices to show that resources
are not becoming scarce does not adhere to the same premises as the theoretical literature
[7], [8]. Thirdly, the ceteris paribus assumption never holds so that we have to worry
about a number complicating factors always present when dealing with non-renewable
resources. These include the Jevons effect that efficiency leads to lower prices and more
consumption [9], the presence of historical lock-in of built infrastructure, and the political
power of vested interests dependent upon continued exploitation of a particular resource
[10], just to name a few. Finally, economists tend to see technology as a free good that
depends only on human ingenuity, not physical constraints [11], [12], [13]. This
technological optimism has been met with a great deal of criticism during the past few
years. A number of physical scientists, as well as a growing minority of economists,
argue that this view overlooks the uniqueness and finiteness of oil resources.
In this paper we use a result of Hotelling [14] to examine the hypothesis that
technology will mitigate the finiteness of petroleum reserves. Hotelling presented a
formal analysis of non-renewable resources and derived some basic implications as to
how technological investment in a finite resource affects the resource price, the extraction
path, and the time until depletion.1 Although the assumptions Hotelling used may have
1 Reserves are classified as proven, probable or possible. To be classified as “proven” the degree of certainty must be 90% [15].

5
been unrealistic he was able to isolate the effect of each variable if the others are held
constant. We use his basic model to analyze the production patterns of two mega oil
fields: the Forties in the North Sea and the Yates field in Texas—fields that have applied
advanced enhanced oil recovery (EOR) extraction technology—and examine the
relationship between exhaustion rates and technological change. We find that the pattern
of depletion in the Forties and Yates fields generally follows Hotelling’s predictions. Our
results question the traditional economic view that technology can easily overcome oil
scarcity and they raise concerns about the capacity of current mega-fields to meet future
oil demand.
The next section presents the basic theoretical structure of the Hotelling model of
non-renewable resources. The Forties and Yates oilfield case-study results are reported in
the third section. A fourth section expands on one result of the Hotelling model: the case
of an increase in demand. Finally, the last section presents the conclusions of our work.
2. Hotelling revisited
It is only a small exaggeration to say that most contemporary resource economics
is a footnote to Hotelling’s paper “The Economics of Exhaustible Resources.” [14].
Following Krautkraemer [16], the basic Hotelling equation can be written as:
Maximize ∫ e-δt[B(q(t),S(t)) – C(q(t), S(t))]dt (1)
subject to:
• S(t) = -q(t), S(t) ≥ 0, q(t) ≥ 0, S(0) = S0 (2)

6
where B[q(t), S(t)] represents gross benefits, C[q(t),S(t)] are the extraction costs; S is the
remaining stock, δ is the rate of discount, and q(t) is the time path for resource extraction
that maximizes the present value of the stream of net benefits from extraction. Notice that
this key equation for resource policy only contains discounted monetary units. All
information about the physical resource base comes through the price system.
It can be seen from equation (1) that any new technology that lowers extraction
costs, other things being equal, will increase the net present benefits of extraction. The
effect of this on the resource price and the time path of extraction are shown in Figure 1.
A technological improvement that reduces extraction costs (from C to C’) results in a
lower resource price (the decline from P to P’) at the beginning of the time path of
exhaustion and a steeper rise in price at the end, and it decreases the time left until
exhaustion. We argue below that Figure 1 approximates what is actually happening in the
representative oil fields we examined.
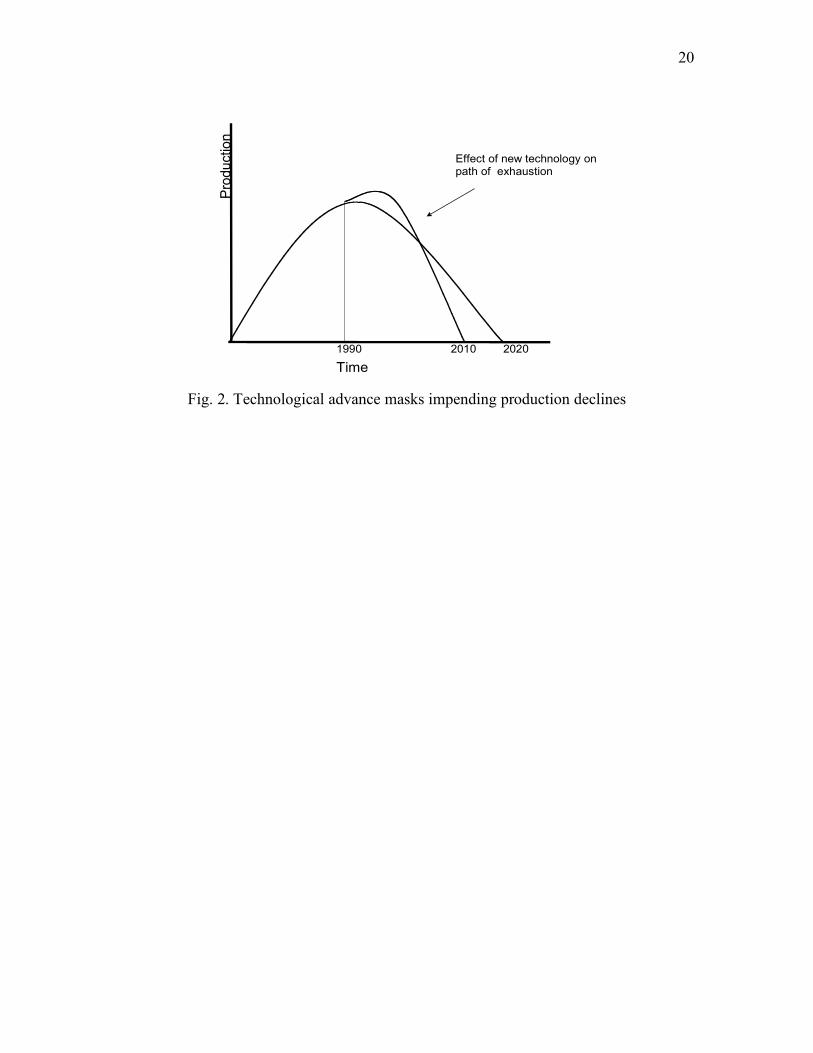
If Figure 1 is an accurate description of an exhaustible resource, then its
exhaustion path will show a pattern depicted in Figure 2 below. Technological change
increases production for a while but then the path to exhaustion becomes steeper.
To the extent that technological advance increases present output at the expense of future
output this implies that prices may be misleading indicators of future resource scarcity.
Today’s lower prices may be the result of extracting more of the future’s resource supply.
This is essentially the claim currently being made by a number of prominent energy
researchers [17], [18], as well as popular writers on the subject of “peak oil” [19]. They
argue that the approaching peak of world oil production is being masked by great
improvements in extraction technology since the 1990s and that these technological
7
improvements will make the decline steeper and the price rise more rapid in the years to
come. This view is summarized by Zittel [20] in the conclusion to a study of North Sea
oil production:
This analysis shows how false it is to base our confidence on oil reserves
being sufficient to maintain, let alone increase current production levels.
Once the peak production of large fields is passed, the situation may switch
very fast. According to our experience, individual oil companies are tempted
to keep a high production rate as long as possible, instead of planning to
smooth the future decline. Therefore, it might be feared that future decline
will be the steeper, the longer the world’s oil companies try to hold high
production levels.
This is essentially the same point Hotelling made in his classic paper. Is there
compelling empirical evidence supporting this point of view?
3. Is Extraction Technology Masking Scarcity? Evidence from the North Sea and
West Texas
In this section we present the production paths that followed in the North Sea
Forties and the West Texas Yates mega oilfields using historical production data reported
by the United Kingdom Department of Trade and Industry and the Railroad Commission
of Texas, respectively. We purposely focus on these two well-surveyed and well-
documented individual fields—rather than more aggregate examples—so as to
acknowledge the strict scarcity of the resource, as assumed in Hotelling’s framework.
8
The Forties and the Yates have been subject during their productive years to the
application of enhanced oil recovery (EOR) technologies. EOR measures (also called
secondary and tertiary measures) are often cited as a means of significantly increasing
future recoverable reserves of oil by mobilizing resources and enhancing the recovery of
oil and gas in place. EOR techniques include boosting extraction rates by better drainage
of the oil in place: when the pressure in the oil field has decreased to a level where the
viscosity of oil dominates the production profile leading to lower extraction rates,
pressure can be raised artificially by water or gas injection, or by reducing the viscosity
with the injection of steam or a chemical surfactant [21]. EOR technologies are widely
used and do have the potential to enhance oil production. However, we present evidence
that these measures increase the production rates only temporarily; apparently EOR
reassures make it possible to extract the oil faster for a few years, but partially at least at
the cost of steeper subsequent decline rates [22].
3.1. The North Sea Forties oilfield
The Forties oilfield (named Forties after the sea area in which it lies) is the first
and largest oilfield in the UK North Sea; it was discovered in 1970 and rapidly became
the symbol of Britain’s North Sea oil boom. The time path of production in mega-fields
such as this one shows a characteristic shape, slightly different from the classic bell-
shaped curve shown in Figure 2. Oil companies usually try to recover high initial
investments as fast as possible by initially producing the fields at high rate. Production is
normally capped at the maximum flow rate that can be kept given the pipeline system’s
capacity and the technology in place, generating a plateau for a while. Eventually a

9
decline in production occurs, driven by the decrease of pressure in the field and rising
water levels.
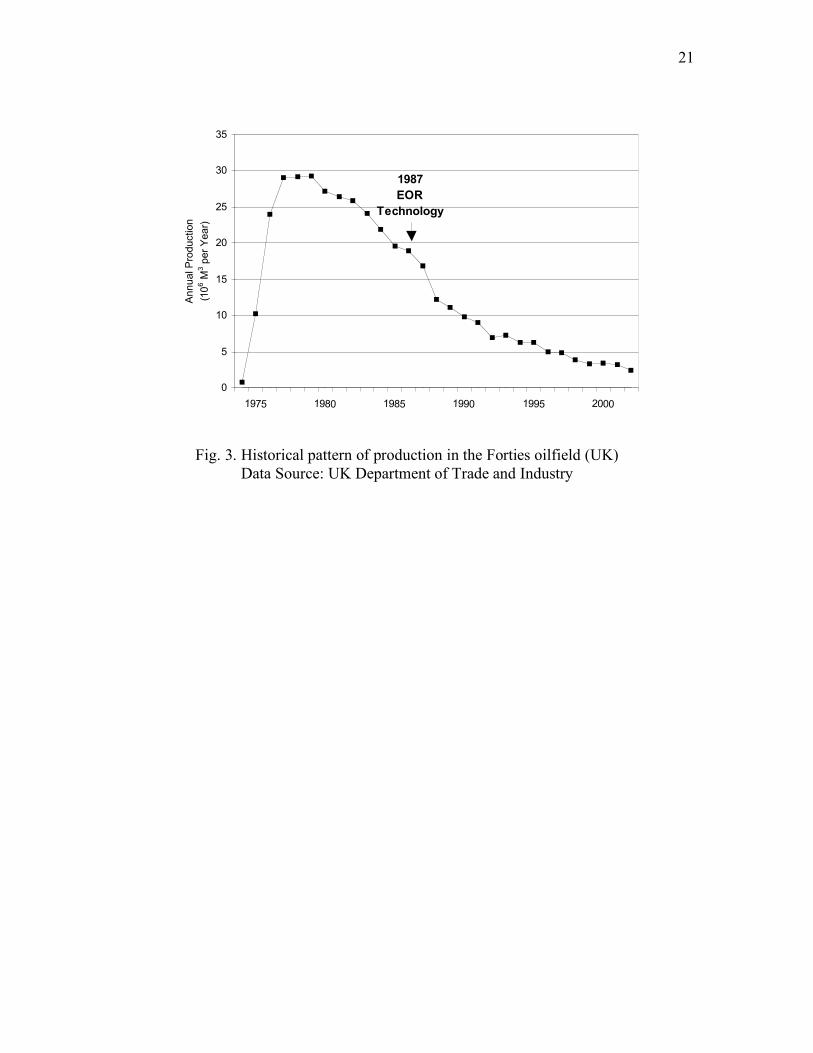
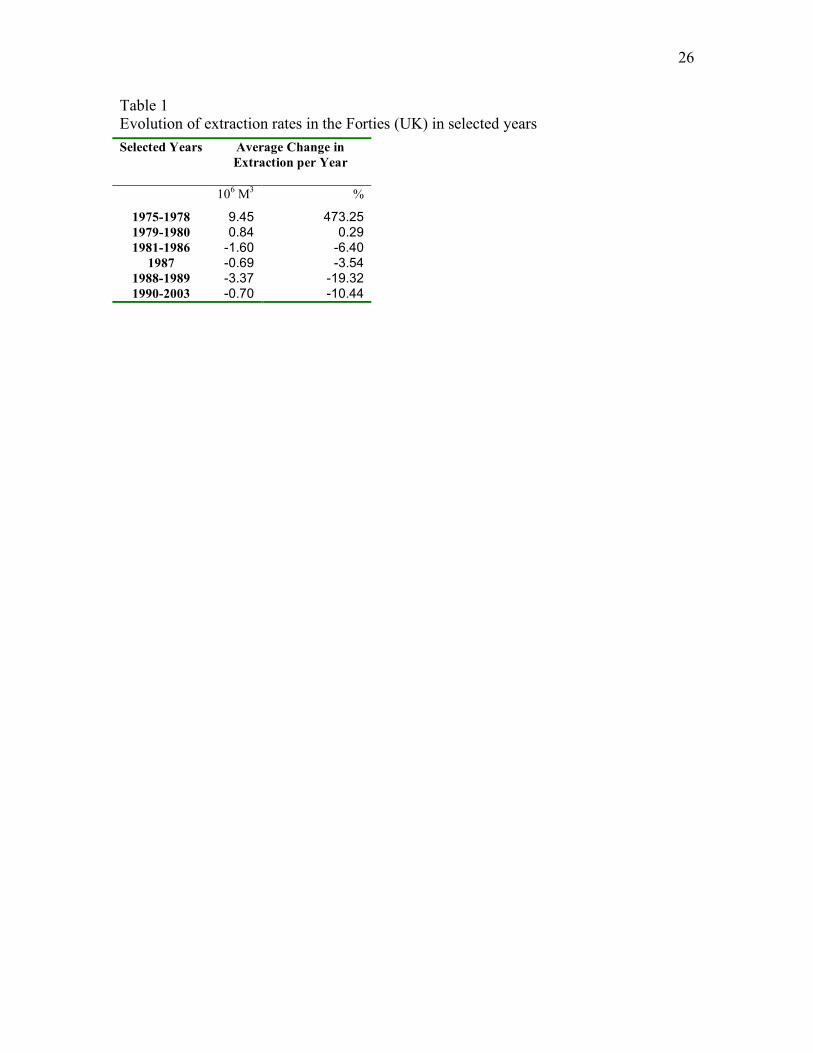
Figure 3 illustrates the historical production pattern of the Forties, and Table 1
shows the change in annual production rates (extraction rates) for selected years. The
field began production in 1975, and within three years, it reached a plateau at 500,000
barrels per day. This plateau lasted for about three more years before the decline started
in 1981. During the period 1981-1986 yearly production declined at an average rate of
6.4 %
In an attempt to boost production and recover production rates, in 1986 an
additional (fifth) oil platform2 was built, and EOR measures were implemented in 1987
by injecting gas (CO2) into the reservoir. EOR measures and the additional platform did
reduce the decline in production to about half of the previous average (from 6.4 to 3.5
%). However, during the two following years, annual production dropped sharply, to an
average rate of decline of 19.32 %. From then on, yearly production in the Forties
declined at an average rate of 10.44 % (see Table 1). Technology arrested the decline in
production for a year, from 1987 to 1988, but then the decline resumed at a rate steeper
than before the additional investments in technology took place.
Our analysis is constrained by the fact that there is no control case available to
compare what the rates of depletion might have been without the application of EOR
technology. Hence, it is impossible to determine precisely the contribution of EOR
measures to the ultimate recovery of the field. However, for offshore mega-fields like the
Forties, plotting annual production versus cumulative production shows a characteristic
2 An oil platform is a large structure used to house workers and machinery needed to drill and then produce oil and natural gas in the ocean. Depending on the circumstances, the platform may be attached to the ocean floor, consist of an artificial island, or be floating.
10
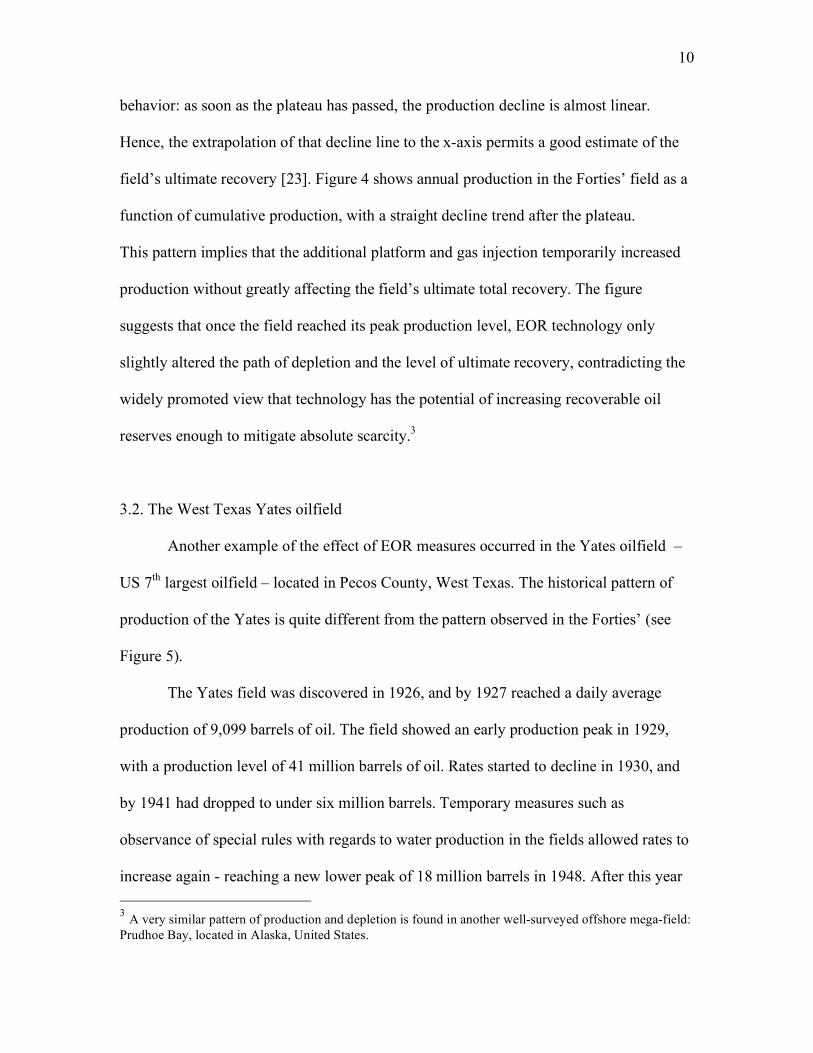
behavior: as soon as the plateau has passed, the production decline is almost linear.
Hence, the extrapolation of that decline line to the x-axis permits a good estimate of the
field’s ultimate recovery [23]. Figure 4 shows annual production in the Forties’ field as a
function of cumulative production, with a straight decline trend after the plateau.
This pattern implies that the additional platform and gas injection temporarily increased
production without greatly affecting the field’s ultimate total recovery. The figure
suggests that once the field reached its peak production level, EOR technology only
slightly altered the path of depletion and the level of ultimate recovery, contradicting the
widely promoted view that technology has the potential of increasing recoverable oil
reserves enough to mitigate absolute scarcity.3
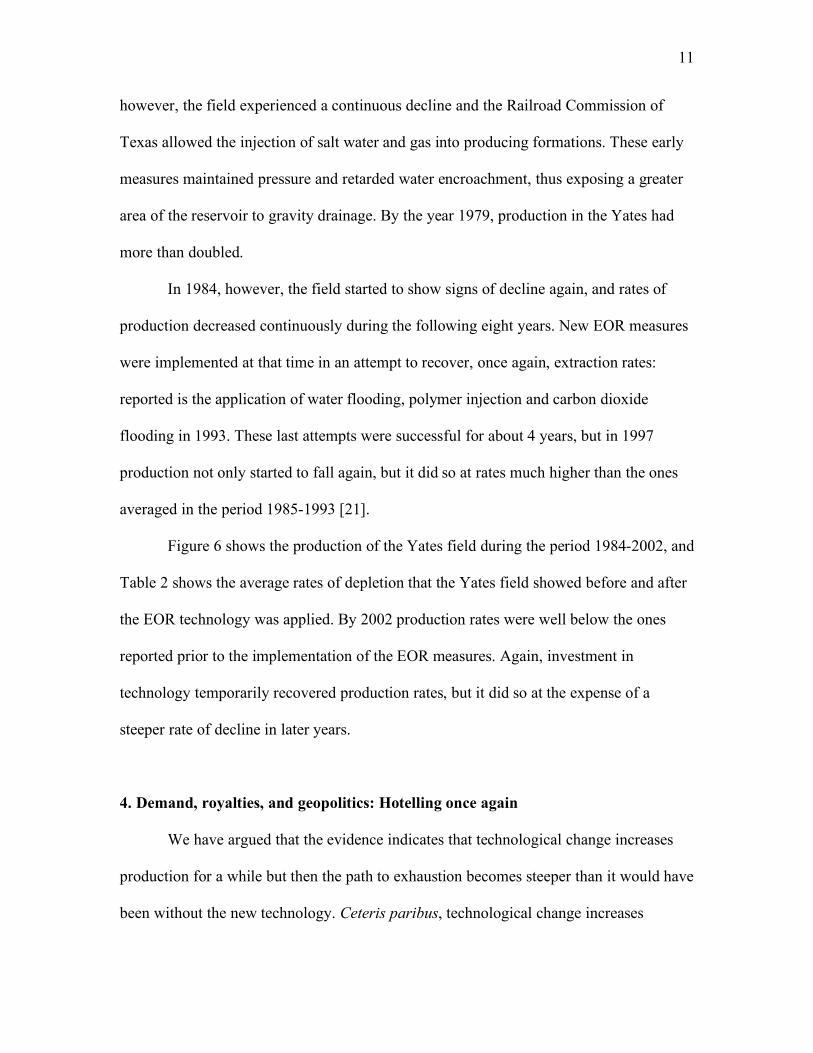
3.2. The West Texas Yates oilfield
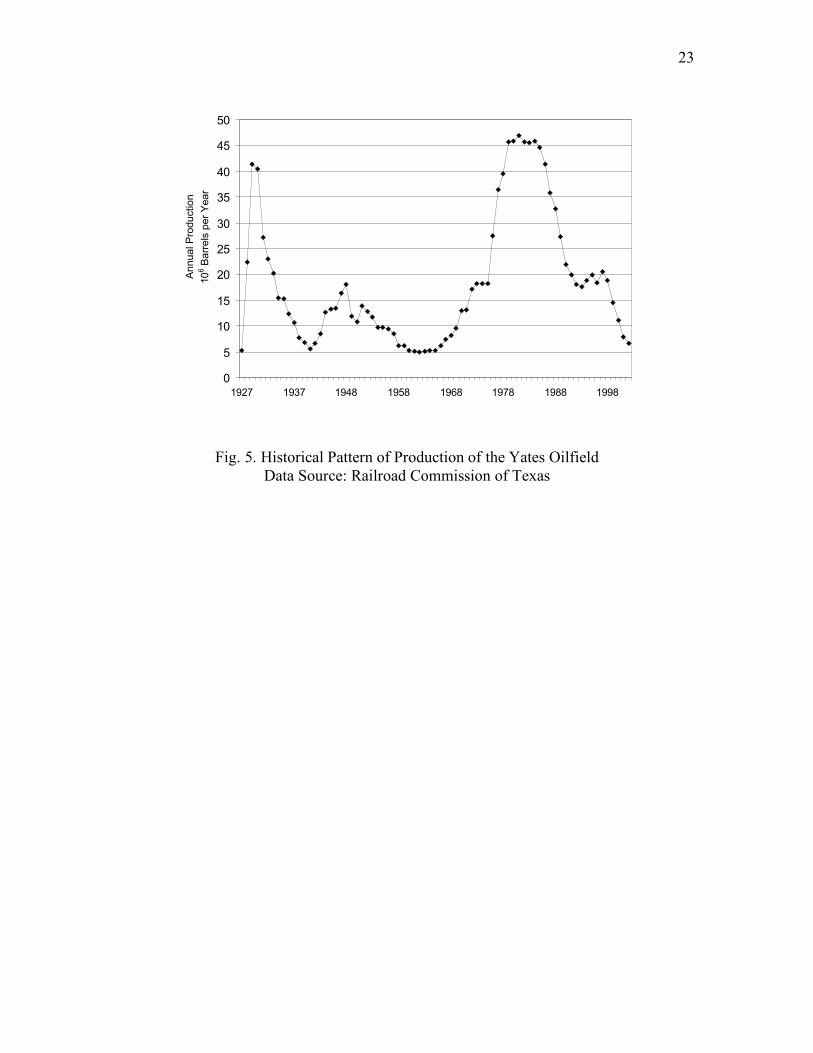
Another example of the effect of EOR measures occurred in the Yates oilfield –
US 7th largest oilfield – located in Pecos County, West Texas. The historical pattern of
production of the Yates is quite different from the pattern observed in the Forties’ (see
Figure 5).
The Yates field was discovered in 1926, and by 1927 reached a daily average
production of 9,099 barrels of oil. The field showed an early production peak in 1929,
with a production level of 41 million barrels of oil. Rates started to decline in 1930, and
by 1941 had dropped to under six million barrels. Temporary measures such as
observance of special rules with regards to water production in the fields allowed rates to
increase again - reaching a new lower peak of 18 million barrels in 1948. After this year 3 A very similar pattern of production and depletion is found in another well-surveyed offshore mega-field: Prudhoe Bay, located in Alaska, United States.
11
however, the field experienced a continuous decline and the Railroad Commission of
Texas allowed the injection of salt water and gas into producing formations. These early
measures maintained pressure and retarded water encroachment, thus exposing a greater
area of the reservoir to gravity drainage. By the year 1979, production in the Yates had
more than doubled.
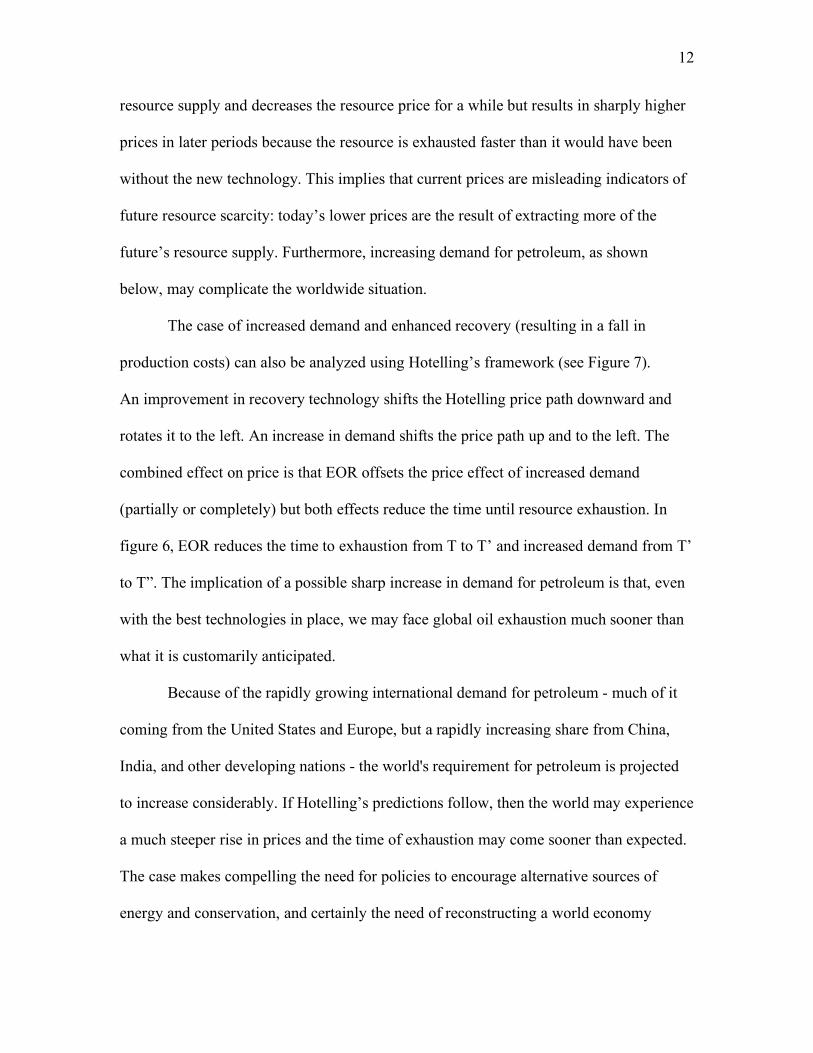
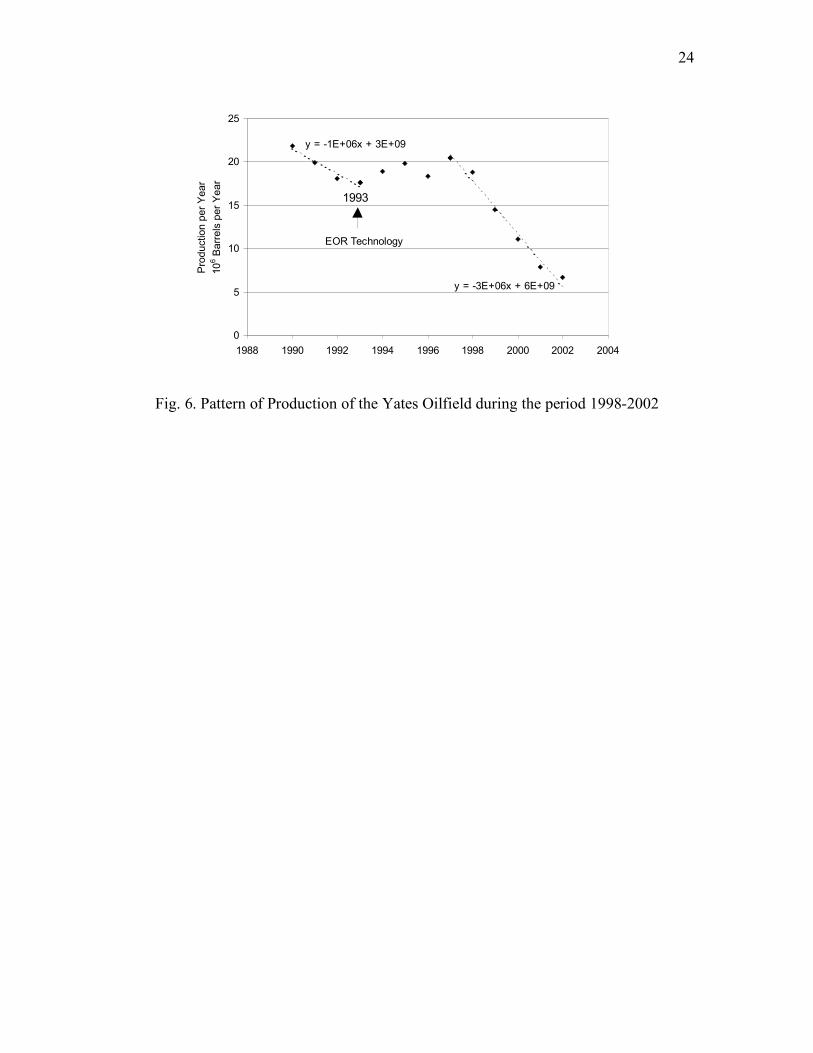
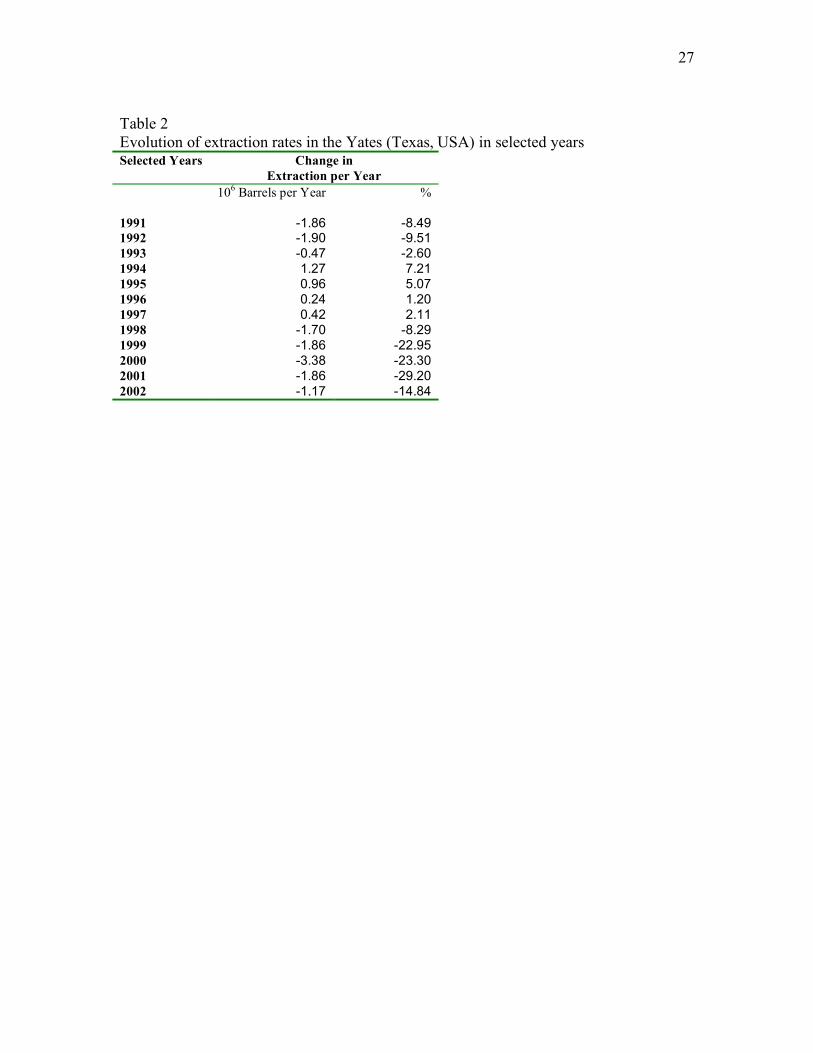
In 1984, however, the field started to show signs of decline again, and rates of
production decreased continuously during the following eight years. New EOR measures
were implemented at that time in an attempt to recover, once again, extraction rates:
reported is the application of water flooding, polymer injection and carbon dioxide
flooding in 1993. These last attempts were successful for about 4 years, but in 1997
production not only started to fall again, but it did so at rates much higher than the ones
averaged in the period 1985-1993 [21].
Figure 6 shows the production of the Yates field during the period 1984-2002, and
Table 2 shows the average rates of depletion that the Yates field showed before and after
the EOR technology was applied. By 2002 production rates were well below the ones
reported prior to the implementation of the EOR measures. Again, investment in
technology temporarily recovered production rates, but it did so at the expense of a
steeper rate of decline in later years.
4. Demand, royalties, and geopolitics: Hotelling once again
We have argued that the evidence indicates that technological change increases
production for a while but then the path to exhaustion becomes steeper than it would have
been without the new technology. Ceteris paribus, technological change increases
12
resource supply and decreases the resource price for a while but results in sharply higher
prices in later periods because the resource is exhausted faster than it would have been
without the new technology. This implies that current prices are misleading indicators of
future resource scarcity: today’s lower prices are the result of extracting more of the
future’s resource supply. Furthermore, increasing demand for petroleum, as shown
below, may complicate the worldwide situation.
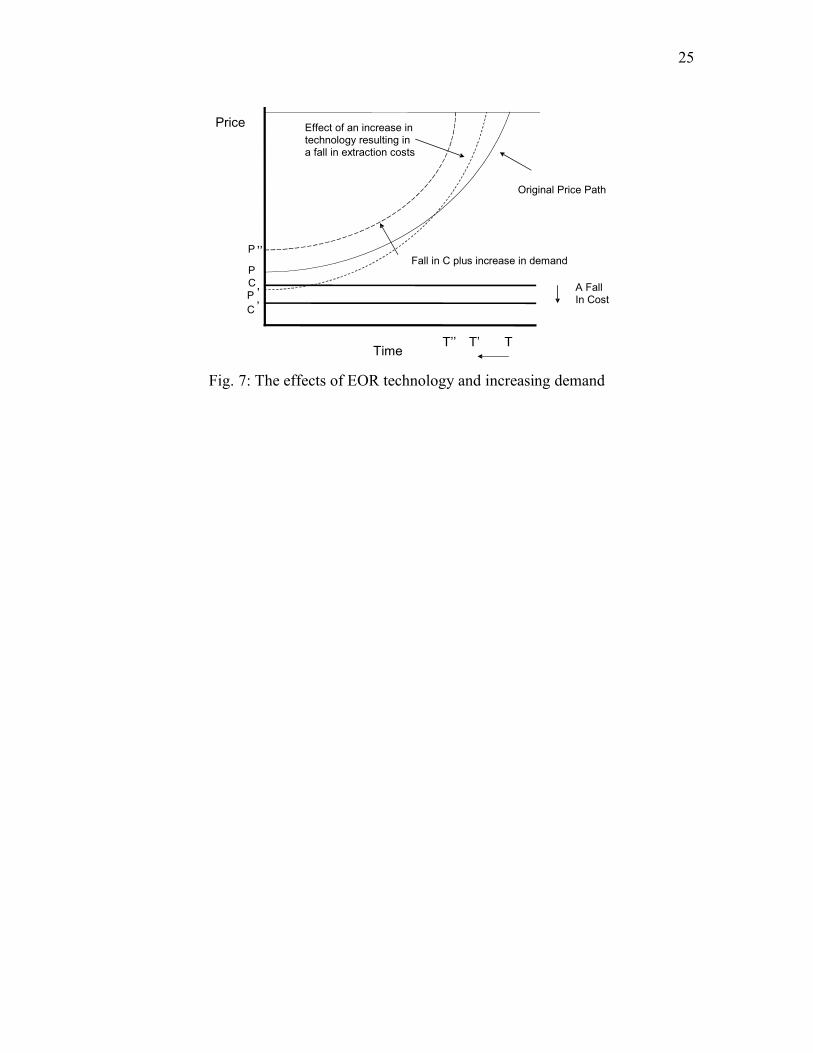
The case of increased demand and enhanced recovery (resulting in a fall in
production costs) can also be analyzed using Hotelling’s framework (see Figure 7).
An improvement in recovery technology shifts the Hotelling price path downward and
rotates it to the left. An increase in demand shifts the price path up and to the left. The
combined effect on price is that EOR offsets the price effect of increased demand
(partially or completely) but both effects reduce the time until resource exhaustion. In
figure 6, EOR reduces the time to exhaustion from T to T’ and increased demand from T’
to T”. The implication of a possible sharp increase in demand for petroleum is that, even
with the best technologies in place, we may face global oil exhaustion much sooner than
what it is customarily anticipated.
Because of the rapidly growing international demand for petroleum - much of it
coming from the United States and Europe, but a rapidly increasing share from China,
India, and other developing nations - the world's requirement for petroleum is projected
to increase considerably. If Hotelling’s predictions follow, then the world may experience
a much steeper rise in prices and the time of exhaustion may come sooner than expected.
The case makes compelling the need for policies to encourage alternative sources of
energy and conservation, and certainly the need of reconstructing a world economy
13
whose political institutions and physical infrastructures are now based on the availability
of cheap oil [24].
5. Discussion and Conclusion
Petroleum resources are not infinite on our planet and in the coming decades
increasing pressure will be placed on the ability of oil to supply energy for the world’s
growing economies. Technological progress has been posed as the major contributor in
the coming years to the mobilization of new reserves and increasing the lifetime of
present reserves. In this paper we examined this hypothesis and showed evidence from
two well documented mega-oilfields - the Forties in the North Sea and the Yates in West
Texas - that support the counter-argument that technology, rather than substantially
increasing the lifetime of present reserves, may only mask increasing absolute scarcity, in
accordance with Hotelling’s theoretical predictions. Technology does have the effect of
increasing extraction initially and makes it possible to extract more of the petroleum in a
given field, but it does so at the cost of increasing the rate of depletion – and decreasing
the lifetime of the resource. Contrary to standard economic assumptions, temporary low
prices may be misleading indicators of the ability of the economy to adjust to resource
exhaustion. The Classical economists were aware of this but contemporary welfare
economics has all but abandoned concern with real, physical production processes in
favor of abstract models of exchange in an idealized purely mathematical framework.
If our results are generalizable they have serious implications for future world oil
supply. If the pattern of depletion in the Forties and the Yates oilfields holds for the
mega-fields in the Middle East this does not bode well for future petroleum supply and
14
prices. Saudi Arabia - the world's leading oil producer – will soon face the peaking of its
already mature giant fields. The case is made explicit by Simmons [15]: most of Saudi
Arabia's oil output is generated by a few giant fields, of which Ghawar - the world's
largest - is the most prolific. While the Yates and Forties fields at their peaks produced
about 30 million barrels of oil a year, the Ghawar field has produced at at rate of 10
million barrels per day. The giant Saudi fields are aging (they were first developed 40 to
50 years ago), and are already subject to EOR measures (water injection and other
secondary measures) to maintain high levels of production and compensate for the drop
in natural field pressure. If the pattern of exhaustion of these fields follows the ones
shown in the Forties and Yates, then we can expect accelerated rates of depletion some
time in the near future. In addition, as time goes on, the ratio of water to oil in these
underground fields will rise to the point where further oil extraction will become difficult,
if not impossible. According to Simmons [15] there is little reason to assume that future
Saudi exploration will result in the discovery of new fields large enough to replace those
now in decline.
We have gathered and analyzed data for two of the three regions in the world that
do actually publicly report historical production for individual fields - namely the United
Kingdom, the United States and Norway. Individual oilfield estimates are confidential in
most other countries, and are available only at great expense from commercial databases
of variable quality [25]. Although results from two fields alone do not make by
themselves a solid case that technology accelerates depletion, they should lead the way to
a larger analysis. It is impossible to predict with any degree of reliability what the future
rates of oil production are likely to be without first understanding field-by-field depletion
15
rates [26]. It becomes critical then to develop and release reserve estimates, particularly
for the mega-fields in Saudi Arabia, if we are to evaluate where the future of oil
production, upon which the world’s economies now depend.
Our study shows that details are important. It is not enough to say that technology
will call forth substitutes as oil is exhausted. The critical question is how rapidly supplies
are depleted and how rapidly quality substitutes can be made available at reasonable
prices. EOR methods may just accelerate depletion of existing reserves OR they may
accelerate depletion and capture significant additional reserves. In this paper we make a
tentative case that, for two large fields at least, the first possibility was the case. What
happens in other fields and for the industry as a whole depends critically on the physical
characteristics of the fields and the nature of new technology. Can new technology
improve the recovery rate significantly beyond the current 35% average? To our
knowledge there is no technology now on the horizon that would do that. As we move
down the depletion curve the energy return on energy invested (EROI) [27] will decrease.
This is important since on the way up the peak EROI acts as a push and on the way down
acts as a pull on the economic feasibility of recovery. With its low extraction costs and
flexibility petroleum is a unique source of energy far superior to any suggested
alternatives. The “peak oil” debate has become polarized between those who say “there is
nothing to worry about, technology will solve everything” and “we’re about to run out of
oil and world’s economies will collapse.” Either one of these statements may be true and
the realistic answer may not be in the middle. But the first step in gauging the
implications of peak oil is to critically examine what has happened in the past and try to
extrapolate the results to the future.

16
Acknowledgements
We are grateful for the valuable comments provided by Jason Benno, Jerry Gilbert,
Charles Hall, John Hallock, Alexey Voinov, and Jack Zagar. We would like to thank the
Texas Railroad Commission for providing data about the Yates field. All conclusions
and opinions are the responsibilities of the authors.
17
References
[1] Barnett H, Morse C. Scarcity and growth: the economics of natural resource availability. Baltimore: John’s Hopkins University Press, 1963. [2] Hanley N, Shogren J, White B. Introduction to environmental economics. Oxford: Oxford University Press, 2001. [3] Fehr E, Fischbacher U. Why social preferences matter – the impact of non-selfish motives on competition, cooperation and incentives. Economic Journal 2002; 112: C1-C33. [4] Gintis H. Game theory evolving. Princeton University Press, 2000. [5] Gowdy J. The revolution in welfare economics and its implications for environmental valuation. Land Economics 2004; 80(2): 239-257. [6] Kahneman D. Maps of bounded rationality: psychology for behavioral economics. American Economic Review 2003; 93: 1449-1475. [7] Cleveland C. Natural resource scarcity and economic growth revisited: economic and biophysical perspectives. In: Costanza R, editor. Ecological economics: the science and management of sustainability. New York: Columbia University Press. p. 289–317. [8] Norgaard R. Economic indicators of resource scarcity: a critical essay. Journal of Environmental Economics and Management 1990; 19: 19-25. [9] Alcott B. Jevons’ paradox. Ecological Economics 2005; 54(1): 9-21. [10] Tainter J, Allen T, Little A, Hoekstra T. Resource transitions and energy gain: contexts and organization. Conservation Ecology 2003; 7(3). See also: http://www.consecol.org/vol7/iss3/art4. [11] Dasgupta P. Bottlenecks: review of Jared Diamond’s book collapse. London Review of Books 2005; 19(May): 21-22. [12] Easterbrook G. There goes the neighborhood. New York Times 2005; January 30. [13] Simon J. The ultimate resource. Princeton University Press, 1981. [14] Hotelling H. The theory of exhaustible resources. Journal of Political Economy 1931; 39: 137-175. [15] Simmons M. Twilight in the desert: the coming Saudi oil shock and the world economy. New Jersey: John Wiley and Sons, Inc., 2005.
18
[16] Krautkraemer J. Nonrenewable resource scarcity. Journal of Economic Literature 1998; XXXVI: 2065-2107. [17] Hall C, Tharakan P, Hallock J, Cleveland C, Jefferson M. Hydrocarbons and the evolution of human culture. Nature 2003; 426: 318-322. [18] Simmons M. For an overview of the evidence for and negative consequences of peak oil see: http://www.simmonsco-intl.com. [19] Heinberg R. The party’s over: oil, war and the fate of industrial societies. Canada: New Society Publishers, 2003. [20] Zittel W. Analysis of the UK oil production. L-B-System Technik, February 2001. See http://www.energiekrise.de/e/articles/Analysis_of_UK_oil_production.pdf [21] Zittel W, Schindler J. 2003 International Summer School on the Politics and Economics of Renewable Energy at Salzburg University. See http://www.Energiekrise.de/e/articles/International-Summer-School-Salzburg-2002.pdf. [22] Campbell CJ, Laherrère JH. The end of cheap oil. Scientific American 1998; March: 80-86. [23] Smith CJ. Yates oilfield. Handbook of Texas Online. See: http://www.tsha.utexas.edu/handbook/online/articles/YY/doy1.html [24] Hallocak J, Tharakan P, Hall C, Jefferson M, Wu W. Forecasting the limits to the availability and diversity of global conventional oil supply. Energy 2004; 29: 1673-1696. [25] Laherrère JH. Forecasting production from discovery. IV International Workshop on Oil and Gas Depletion. Lisbon, 2005. See also: http://www.cge.uevora.pt/aspo2005/ASPO2005_Proceedings.pdf [26] Simmons M. Depletion: the forgotten part of supply and demand. See: http://www/simmonsco-intl.com/files/41.pdf. [27] Hall, C, Cleveland, C, Kaufman, R. Energy and resource quality: the ecology of the economic process. Niwot, CO: University of Colorado Press, 1992. [28] Pearce D, Turner K. Economics of natural resources and the environment. Baltimore: The Johns Hopkins Press, 1990.

19
Time to Exhaustion
Price
Original Price Path
C
C’
A Fall
In Cost
TT’
Effect of an increase in
technology resulting in
a fall in extraction costs
P
P’
Fig. 1. Hotelling on technological change that lowers cost Adapted from Pearce and Turner [28].
20
Fig. 2. Technological advance masks impending production declines
1990 2010 2020
Effect of new technology onpath of exhaustion
Pro
duction
Time
21
1987
EOR
Technology
0
5
10
15
20
25
30
35
1975 1980 1985 1990 1995 2000
Annual P
roduction
(10
6 M
3 p
er
Year)
Fig. 3. Historical pattern of production in the Forties oilfield (UK) Data Source: UK Department of Trade and Industry

22
1987
y = -0.1123x + 5E+07
R2 = 0.9688
0
5
10
15
20
25
30
35
0 50 100 150 200 250 300 350 400 450
Cummulative Production
(106 M3)
Annual P
roduction
(10
6 M
3 p
er
Year)
Fig. 4. Pattern of cumulative production of the Forties oilfield (UK) Data Source: UK Department of Trade and Industry
23
0
5
10
15
20
25
30
35
40
45
50
1927 1937 1948 1958 1968 1978 1988 1998
Annual P
roduction
10
6 B
arr
els
per
Year
Fig. 5. Historical Pattern of Production of the Yates Oilfield Data Source: Railroad Commission of Texas
24
1993
y = -1E+06x + 3E+09
y = -3E+06x + 6E+09
0
5
10
15
20
25
1988 1990 1992 1994 1996 1998 2000 2002 2004
Pro
duction p
er
Year
10
6 B
arr
els
pe
r Y
ea
r
EOR Technology
Fig. 6. Pattern of Production of the Yates Oilfield during the period 1998-2002
25
Fig. 7: The effects of EOR technology and increasing demand
Time
Price
Original Price Path
C
C ’
A FallIn Cost
TT’
Effect of an increase intechnology resulting ina fall in extraction costs
P
P ’
Fall in C plus increase in demand
T’’
P ’’
26
Table 1 Evolution of extraction rates in the Forties (UK) in selected years
Selected Years Average Change in Extraction per Year
106 M3 %
1975-1978 9.45 473.25 1979-1980 0.84 0.29 1981-1986 -1.60 -6.40
1987 -0.69 -3.54 1988-1989 -3.37 -19.32 1990-2003 -0.70 -10.44
27
Table 2 Evolution of extraction rates in the Yates (Texas, USA) in selected years Selected Years Change in
Extraction per Year 106 Barrels per Year %
1991 -1.86 -8.49 1992 -1.90 -9.51 1993 -0.47 -2.60 1994 1.27 7.21 1995 0.96 5.07 1996 0.24 1.20 1997 0.42 2.11 1998 -1.70 -8.29 1999 -1.86 -22.95 2000 -3.38 -23.30 2001 -1.86 -29.20 2002 -1.17 -14.84