Estimation of Ligament Loading and Anterior Tibial Translation in Healthy and ACL-Deficient Knees...
12
Estimation of Ligament Loading and Anterior Tibial Translation in Healthy and ACL-Deficient Knees During Gait and the Influence of Increasing Tibial Slope Using EMG-Driven Approach QI SHAO,TORAN D. MACLEOD,KURT MANAL, and THOMAS S. BUCHANAN Department of Mechanical Engineering, Center for Biomedical Engineering Research, University of Delaware, 126 Spencer Laboratory, Newark, DE 19716, USA (Received 15 January 2010; accepted 12 July 2010; published online 4 August 2010) Associate Editor Peter E. McHugh oversaw the review of this article. Abstract—The purpose of this study was to develop a biomechanical model to estimate anterior tibial translation (ATT), anterior shear forces, and ligament loading in the healthy and anterior cruciate ligament (ACL)-deficient knee joint during gait. This model used electromyography (EMG), joint position, and force plate data as inputs to calculate ligament loading during stance phase. First, an EMG-driven model was used to calculate forces for the major muscles crossing the knee joint. The calculated muscle forces were used as inputs to a knee model that incorporated a knee– ligament model in order to solve for ATT and ligament forces. The model took advantage of using EMGs as inputs, and could account for the abnormal muscle activation patterns of ACL-deficient gait. We validated our model by comparing the calculated results with previous in vitro, in vivo, and numerical studies of healthy and ACL-deficient knees, and this gave us confidence on the accuracy of our model calculations. Our model predicted that ATT increased throughout stance phase for the ACL-deficient knee com- pared with the healthy knee. The medial collateral ligament functioned as the main passive restraint to anterior shear force in the ACL-deficient knee. Although strong co-contraction of knee flexors was found to help restrain ATT in the ACL- deficient knee, it did not counteract the effect of ACL rupture. Posterior inclination angle of the tibial plateau was found to be a crucial parameter in determining knee mechanics, and increasing the tibial slope inclination in our model would increase the resulting ATT and ligament forces in both healthy and ACL-deficient knees. Keywords—EMG, Posterior tibial slope, MCL, Biomechanical model. INTRODUCTION It is of great importance to know internal knee– ligament loading to develop better surgical procedures and rehabilitation regimens for anterior cruciate liga- ment (ACL)-deficient patients. Many researchers have used in vitro experiments to study the changes in anterior tibial translation (ATT) and ligament force distribution of the knee after transection of the ACL. 2,14,22,25,26,42,43,46 They have shown increases in ATT and in situ forces in other soft-tissue structures, such as the medial collateral ligament (MCL) and the meniscus after removal of the ACL. Nevertheless, the external loads applied to the knee in these experiments were smaller than the loads during walking due to the limitation of the experimental systems, so these in vitro experiments could not replicate in vivo ligament load- ing during gait. A few numerical models have been used instead to estimate in vivo ligament loading in the ACL-deficient knee during gait. 27,40 Liu and Maitland 27 developed a knee model in the sagittal plane to study knee mechanics of the ACL-deficient knee during level walking. This model was limited to a single selected position during early stance phase of gait. Shelburne et al. 40 developed a three-dimensional model of the lower extremity with a six degrees-of-freedom knee joint to calculate shear force and ligament loading in the ACL-deficient knee during walking, and compared the results to those of the healthy knee. In their study the joint angles, ground reaction forces, muscle forces, and joint-reaction forces of the ACL-deficient knee were assumed to be identical with those of the healthy knee. This assumption contradicted previous findings that ACL-deficient subjects have different gait patterns than healthy subjects. 34 ACL-deficient knees Address correspondence to Thomas S. Buchanan, Department of Mechanical Engineering, Center for Biomedical Engineering Research, University of Delaware, 126 Spencer Laboratory, Newark, DE 19716, USA. Electronic mail: [email protected] Annals of Biomedical Engineering, Vol. 39, No. 1, January 2011 (Ó 2010) pp. 110–121 DOI: 10.1007/s10439-010-0131-2 0090-6964/11/0100-0110/0 Ó 2010 The Author(s). This article is published with open access at Springerlink.com 110
-
Upload
independent -
Category
Documents
-
view
0 -
download
0
Transcript of Estimation of Ligament Loading and Anterior Tibial Translation in Healthy and ACL-Deficient Knees...

Estimation of Ligament Loading and Anterior Tibial Translation
in Healthy and ACL-Deficient Knees During Gait and the Influence
of Increasing Tibial Slope Using EMG-Driven Approach
QI SHAO, TORAN D. MACLEOD, KURT MANAL, and THOMAS S. BUCHANAN
Department of Mechanical Engineering, Center for Biomedical Engineering Research, University of Delaware,126 Spencer Laboratory, Newark, DE 19716, USA
(Received 15 January 2010; accepted 12 July 2010; published online 4 August 2010)
Associate Editor Peter E. McHugh oversaw the review of this article.
Abstract—The purpose of this study was to develop abiomechanical model to estimate anterior tibial translation(ATT), anterior shear forces, and ligament loading in thehealthy and anterior cruciate ligament (ACL)-deficient kneejoint during gait. This model used electromyography (EMG),joint position, and force plate data as inputs to calculateligament loading during stance phase. First, an EMG-drivenmodel was used to calculate forces for the major musclescrossing the knee joint. The calculated muscle forces wereused as inputs to a knee model that incorporated a knee–ligament model in order to solve for ATT and ligamentforces. The model took advantage of using EMGs as inputs,and could account for the abnormal muscle activationpatterns of ACL-deficient gait. We validated our model bycomparing the calculated results with previous in vitro,in vivo, and numerical studies of healthy and ACL-deficientknees, and this gave us confidence on the accuracy of ourmodel calculations. Our model predicted that ATT increasedthroughout stance phase for the ACL-deficient knee com-pared with the healthy knee. The medial collateral ligamentfunctioned as the main passive restraint to anterior shear forcein the ACL-deficient knee. Although strong co-contraction ofknee flexors was found to help restrain ATT in the ACL-deficient knee, it did not counteract the effect of ACLrupture. Posterior inclination angle of the tibial plateau wasfound to be a crucial parameter in determining kneemechanics, and increasing the tibial slope inclination in ourmodel would increase the resulting ATT and ligament forcesin both healthy and ACL-deficient knees.
Keywords—EMG, Posterior tibial slope, MCL, Biomechanical
model.
INTRODUCTION
It is of great importance to know internal knee–ligament loading to develop better surgical proceduresand rehabilitation regimens for anterior cruciate liga-ment (ACL)-deficient patients. Many researchers haveused in vitro experiments to study the changes inanterior tibial translation (ATT) and ligament forcedistribution of the knee after transection of theACL.2,14,22,25,26,42,43,46 They have shown increases inATT and in situ forces in other soft-tissue structures,such as the medial collateral ligament (MCL) and themeniscus after removal of the ACL. Nevertheless, theexternal loads applied to the knee in these experimentswere smaller than the loads during walking due to thelimitation of the experimental systems, so these in vitroexperiments could not replicate in vivo ligament load-ing during gait.
A few numerical models have been used instead toestimate in vivo ligament loading in the ACL-deficientknee during gait.27,40 Liu and Maitland27 developed aknee model in the sagittal plane to study kneemechanics of the ACL-deficient knee during levelwalking. This model was limited to a single selectedposition during early stance phase of gait. Shelburneet al.40 developed a three-dimensional model of thelower extremity with a six degrees-of-freedom kneejoint to calculate shear force and ligament loading inthe ACL-deficient knee during walking, and comparedthe results to those of the healthy knee. In theirstudy the joint angles, ground reaction forces, muscleforces, and joint-reaction forces of the ACL-deficientknee were assumed to be identical with those of thehealthy knee. This assumption contradicted previousfindings that ACL-deficient subjects have different gaitpatterns than healthy subjects.34 ACL-deficient knees
Address correspondence to Thomas S. Buchanan, Department
of Mechanical Engineering, Center for Biomedical Engineering
Research, University of Delaware, 126 Spencer Laboratory, Newark,
DE 19716, USA. Electronic mail: [email protected]
Annals of Biomedical Engineering, Vol. 39, No. 1, January 2011 (� 2010) pp. 110–121
DOI: 10.1007/s10439-010-0131-2
0090-6964/11/0100-0110/0 � 2010 The Author(s). This article is published with open access at Springerlink.com
110

have been reported to have different muscle activationstrategies, such as strong co-contractions, and dimin-ished vastus lateralis (VL) and lateral gastrocnemius(LG) muscle control.35,45 The previous numericalmodels did not estimate muscle forces based on mea-sured muscle activations, i.e., electromyographic(EMG) signals, so they may have difficulty predictingthe abnormal muscle activation patterns.5,19 This leadsto the first objective of this study to use an EMG-driven model to estimate ATT, anterior shear forces,and knee ligament loading during ACL-deficient gait.
Anterior–posterior knee stability has been shown tobe related to posterior inclination angle of the tibialplateau in previous experiments. An in vivo radio-graphic study showed increase in ATT during weightbearing for both healthy and ACL-deficient knees.8
Two in vitro studies found that the resting position ofthe tibia shifted anteriorly as posterior tibial slopeincreased in healthy knees, and the in situ ACL forceand ACL strain decreased.11,12 The limitation of thesein vitro studies is that the loads added to the cadavericknees were smaller than those of in vivo weight-bearingconditions during gait. This leads to the secondobjective of this study to use a numerical model tostudy the influence of increasing posterior tibial slopeon ATT and ligament loading.
In this article, we will describe for the first time anEMG-driven model that incorporates a knee–ligamentmodel, and apply this approach to estimate ATT,anterior shear forces, and ligament loading in the kneejoint of a healthy subject and an ACL-deficient subject.We validated this model by comparing with previouspublished results, and used the calculated results todiscuss how the ACL-deficient subject compensatedfor the loss of the ACL. We will also compare thedifference of ATT and ligament loading between twoknees that have different tibial slope inclinations, andstudy the influence of increasing tibial slope on kneebiomechanics.
METHODS
Data Collection
One male healthy subject (mass 60.5 kg, height1.70 m) and one male patient without an ACL (mass74.0 kg, height 1.72 m; right leg was the affected leg)gave informed consent before participating in thisstudy. The experimental protocol was approved by theHuman Subjects Review Board of the University ofDelaware. EMG, joint position, and force plate datawere collected from four walking trials in our motionanalysis lab. In addition, four isometric maximal vol-untary trials and four isokinetic maximal voluntarytrials (60�/s) of knee flexion/extension on a Biodex
dynamometer (Shirley, NY, USA), five straight run-ning trials (4.0 m/s), and five running sidesteppingtrials (to 45� from the direction of travel, 4.0 m/s) werecollected. EMGs were collected from nine muscles ofthe right knee using surface electrodes, including rectusfemoris (RF), VL, vastus medialis (VM), semimembr-anosus (SM), biceps femoris long head (BFL), medialgastrocnemius (MG), and LG. In this study we simu-lated the stance phase of the right leg during thewalking trials.
Computational Model
We calculated ATT and ligament loading through atwo-step procedure.
EMG-Driven Model
First, an EMG-driven model4,29,38 was used toestimate the muscle forces of the right leg. EMG andkinematic data were used as inputs. The modelincluded the following four main parts.
Anatomical ModelThe lower limb anatomical model was developed usingSIMM (Musculographics Inc.),10 and scaled based onthe subject’s static marker measurements usingOpensim.9 The model included ten musculotendonactuators crossing the knee joint. These were RF, VL,VM, vastus intermedius (VI), SM, semitendinosus (ST),BFL, biceps femoris short head (BFS), MG, and LG.
Muscle Activation Dynamics ModelThe muscle activation dynamics model transformedraw EMG to muscle activation. Firstly, the raw EMGwere high-pass filtered, then full wave rectified, nor-malized by peak rectified EMG values obtained frommaximum voluntary contraction trials, and then low-pass filtered.4 In the second step, we used a discreteform of a linear second-order differential equation toprocess the filtered EMG, and took the electrome-chanical delay into account.44 Finally, reported non-linear EMG–force relationships were accounted for byusing a logarithmic function for low levels of EMGand a linear function for high values to transform theprocessed EMG to the muscle activation.30 For thethree muscles that did not have surface EMG mea-surements, the muscle activations were calculatedusing the same procedure as Lloyd and Besier.29
Muscle Contraction Dynamics ModelThe muscle contraction dynamics model employed amodified Hill-type muscle model to calculate individ-ual muscle forces. The muscle activations and jointkinematics were used as inputs. The muscle–tendon
Estimation of Ligament Loading and ATT in Healthy and ACL-Deficient Knees 111
unit was modeled as a muscle fiber in series with atendon. The muscle fiber had a contractile element13,49
in parallel with an elastic element36 and a dampingelement.37 Once muscle forces were computed, theywere multiplied by respective muscle moment arms andsummed to determine total joint moments.
Calibration ProcessSince some of the model parameters (such as muscleactivation model parameters, optimal fiber length,tendon slack length, electromechanical delay, andstrength factor of muscles) were difficult to get fromin vivo measurements, we used a calibration process toobtain a set of model parameters for each subject thatcould accurately estimate the knee joint momentsduring a variety of dynamic tasks. It was assumed thatthe calculated EMG-driven joint moments shouldequal the inverse dynamic calculated joint moments.An optimization algorithm20 was employed, and theparameters in the EMG-driven model were tuned tominimize the difference between the EMG-driven kneejoint moments and inverse dynamics knee jointmoments. The calibration trials included five trials:(1) maximal isokinetic knee flexion, (2) maximalisokinetic knee extension, (3) walking, (4) straightrunning, and (5) running sidestepping. All the modelparameters were constrained within a reasonable rangeas suggested in the literature.29
After the parameters were calibrated, the tunedEMG-driven model was used to predict knee jointmoments for the 17 other trials for each subject. Sincedirect measurement of in vivo muscle force was difficultand invasive, it is impractical to validate numericalmodels directly using muscle force measurements.Therefore, joint moments measured using an inversedynamics approach are typically used as an indirectway to validate EMG-driven models.29 In this study,we validated the tuned EMG-driven model by com-paring the predicted joint moments with inversedynamics joint moments. The coefficient of determi-nation (R2) between the predicted joint moments andthe inverse dynamics joint moments, the normalizedroot mean square (RMS) error (normalized to peak-to-peak joint moment), and the normalized maximal errorwere calculated for each prediction trial. Once thetuned EMG-driven model had been validated, themodel was then used to estimate the muscle forcesduring the walking trials, and the calculated kneemuscle forces were used as inputs to the following kneejoint model to calculate ATT and ligament forces.
Knee Joint Model
A knee model that incorporated a knee–ligamentmodel was developed in the second step. The model
included the tibiofemoral joint and the patellofemoraljoint in the sagittal plane (Fig. 1a), and three segments:the femur, tibia, and patella. The origin of the femurcoordinate system was located at the midpoint betweenmedial and lateral femoral epicondyles, with the x-axispointing posteriorly and the y-axis pointing proximallyalong the long axis of the femur. The origin of the tibiacoordinate system was located at the center of mass ofthe tibia, with the u-axis pointing posteriorly and thev-axis pointing proximally along the long axis of thetibia.
The Patellofemoral Joint ModelThe approach used to model the patellofemoral joint inthis study was similar to that used by Shelburne andPandy,39 and Liu and Maitland27 (Fig. 1a). The patellawas approximated as a rectangle,47 and the length andwidth data were taken from magnetic resonanceimaging measurement.48 The femoral contour of thepatellofemoral joint was adapted as an ellipse.27 Thegeometrical parameters of the patellofemoral jointwere summarized in Table 1. The origin and insertionpoints of muscles and patellar tendon were from Delpet al.10 All the geometrical parameters in the kneejoint, including insertion points of muscles and liga-ments, segment lengths, and femoral contour sizes inthe knee joint model, were scaled based on the subject’sstatic marker measurements using Opensim.9 Muscleforces (RF, VL, VM, VI) calculated from the first stepwere applied on the patella along the muscle lines. Thecontact between the femoral condyles and the internaledge of the patella was assumed to be rigid and fric-tionless. We assumed that the mass of the patella wasnegligible in comparison to other segments, and thepatellar tendon was inextensible at all joint angles.Under these assumptions, the three force and momentequilibrium equations of the patella could be combinedinto just one equation.39 The orientation of the patella,a, was the only unknown and could be solved itera-tively. Once a was known, the patellar tendon force,FPT, could be solved through the force equilibriumequations.
The Tibiofemoral Joint ModelThe tibiofemoral joint had three degrees-of-freedom,including knee joint angle (h), anterior–posterior posi-tion (xt), and superior–inferior position (yt) of the tibiacoordinate system’s origin relative to the femur coor-dinate system (Fig. 1a). The contour of the tibial pla-teau was described as a straight line. Since posteriorinclination angle of the tibial plateau was reported to behighly variable between populations,32 we chose 4�16
and 8�31 as the two tibial slopes relative to the u-axis inthis study. The femoral contour of the tibiofemoraljoint was adapted as an ellipse.47 The parameters of the
SHAO et al.112

two contours were described in Table 1. The contactbetween the femoral condyles and tibial plateau wasassumed to be rigid and frictionless. Under theseassumptions, yt could be represented by a function of xtand h.1 Since knee joint angle was determined from
measurement, xt was the only unknown degree-of-freedom under the geometric constraints.
The Knee–Ligament ModelA knee–ligament model was developed to calculateligament forces. The cruciate and collateral ligaments,the posterior capsule, and the anterolateral structuresof the knee were modeled using 14 elastic bundles, andeach bundle was represented by a straightline from itsorigin to its insertion point.33,40 They were the anteriorand posterior bundles of the ACL, the anterior andposterior bundles of the posterior cruciate ligament(PCL), the anterior, central, and posterior bundles ofthe superficial MCL, the anterior and posterior bun-dles of the deep MCL, the lateral collateral ligament,the popliteofibular ligament, the medial and lateralposterior capsule, and the anterolateral structures.
FIGURE 1. (a) The two-dimensional patellofemoral and tibiofemoral joint models. Knee joint angle (h) represented the flexion/extension of the tibia coordinate system relative to the femur coordinate system. Muscle forces (FVAS and FRF), patellar tendonforce (FPT), and patellofemoral contact force (Fpf) were applied on the patella. Fpf was applied along the normal direction of internaledge of the patella at patellofemoral contact point, Pc. a was the angle between the long axis of the patella and the y-axis; dVAS, dRF,and b were the angles between the muscle or ligament lines and the y-axis. (b) The forces applied on the tibia included: hamstrings,Fhs (including SM, ST, BFL, and BFS), and gastrocnemius, Fgas (including MG and LG), calculated from the EMG-driven model inthe first step, external forces of the ankle joint (Fax and Fay) calculated from the inverse dynamics in the first step, patellar tendonforce (FPT) calculated from the patellofemoral joint model, ligament forces (FACL, FPCL, FMCL, and the forces of the other ligaments,Fothers) from the ligament model, inertia forces, gravity, and tibiofemoral joint contact force (Fcontact).
TABLE 1. Parameters used in the knee model.
ap–f bp–f s apat bpat Lpat at–f bt–f /
28.6 19.0 8.2 33.3 22.7 65.2 35.4 21.8 4� and 8�
ap–f, bp–f, the semi-major and semi-minor axes of the femoral
contour in the patellofemoral joint (mm). s, the offset along the
y-axis between the centers of two ellipses of femoral contours
(mm). apat, bpat, length and width of the patella (mm). Lpat, length of
the patellar tendon (mm). at–f, bt–f, the semi-major and semi-minor
axes of the femoral contour in the tibiofemoral joint (mm). /, the
angle of tibial plateau slope relative to the u-axis (�).
Estimation of Ligament Loading and ATT in Healthy and ACL-Deficient Knees 113

Each ligament bundle was modeled as a nonlinearelastic element, described by a nonlinear force–strainrelationship.3 For the ACL-deficient knee, the ACLforce was set to be zero. The model also included aposterior constraint force contributed by the medialmeniscus, which increased linearly with respect tothe ATT.40
The stiffness and zero load length of the ligamentbundles, and the point at which the constraint force ofthe medial meniscus begins and the increasing ratewere tuned so that the calculated ATTs of the knee–ligament model in response to a 100-N anterior forcematched the ATT results of previous in vitro experi-ments on healthy knees and ACL-deficientknees.25,26,43 A program coded in Matlab (The Math-Works, Inc., Natick, MA, USA) was developed, andlsqnonlin() with ‘trust-region-reflective’ as the optimi-zation algorithm was chosen to solve for the ligamentparameters. All the ligament parameters were given aninitial value as suggested by the literature,33,40 and theywere allowed to change within ±20% to account forindividual variation. First the knee–ligament modelwas used to calculate the resulting ATTs by adding a100-N anterior force, and then the knee–ligamentmodel without the medial meniscus (set the medialmeniscus force to be zero) was used to calculate theresulting ATTs. The differences between the ATTs ofthese two calculations (with/without the medialmeniscus) and the corresponding experimental ATTdata (with/without the medial meniscus) were summedas the cost function. We also conducted a sensitivitystudy on this tuning process. Another two sets of ATTdata were used as inputs to match the calculated resultswith during the optimization. The first one used theexperimental data plus 3 mm, and the second one usedthe experimental data minus 3 mm. The percentagechange of the ligament parameters and the changes inthe resulting ATT and ligament loading were calcu-lated to find out how our model responded to differentinput ATTs.
The Tibia Equilibrium ModelAll forces applied on the tibia (Fig. 1b) were assumedto be balanced at each time step during stance phase,and the foot was not included in this model. Theinertia forces caused by rectilinear acceleration of thetibia were calculated using the measured rectilinearacceleration of the center of mass, and the inertiaforces caused by rotation of the tibia, including Cori-olis force, centrifugal force, and Euler force, wereignored since they were small during the stance phaseof gait.15 Gravity of the tibia was applied on the centerof mass of the tibia. The tibiofemoral joint contactforce (Fcontact) was applied on the tibiofemoral contactpoint along the normal direction of the tibial plateau.
The magnitude of tibiofemoral joint contact force wasunknown. Anterior–posterior position of the tibia (xt)was another unknown, and it determined the relativepositions of the femur to the tibia (xt, yt, h), which wereused as inputs to the patellofemoral joint and tibio-femoral joint model. At each time step two forceequilibrium equations of the tibia in u and v directionswere obtained. Two independent unknown variables,including the position variable (xt) and the magnitudeof tibiofemoral joint contact force (Fcontact), weresolved through iterations until the force equilibrium ofthe tibia was satisfied. A program coded in Matlab(The MathWorks, Inc.) was used to solve the nonlinearequations, and fsolve() with ‘trust-region-dogleg’ as theoptimization algorithm was chosen as the solver. Afterxt and Fcontact were calculated, the ATT, anterior shearforces, and ligament loading could be calculated usingthe patellofemoral joint model, tibiofemoral jointmodel, and knee–ligament model.
RESULTS
Validation of the Tuned EMG-Driven Model
Table 2 showed the prediction results using thetuned EMG-driven model for both subjects. Theaverage R2 values were 0.848 and 0.826, and the nor-malized RMS errors and maximal errors were small, sothat the predicted EMG-driven joint moments wereclose to the inverse dynamics calculated joint momentsin a variety of tasks. This validated our tuned EMG-driven model.
Validation of the Knee Model
The calculated ATT patterns of the healthy subject(Fig. 3a) was similar to previous in vivo experimentsusing six degrees-of-freedom goniometer24,50 and dualfluoroscopic imaging technique23 (Fig. 3b). The cal-culated ATT patterns in the ACL-deficient knee(Fig. 3a) was also consistent with previous in vivoexperiments24,50 (Fig. 3b). The increase in ATT afterACL rupture has also been shown in a number ofin vitro2,14,22,25,26,42,43,46 studies (Fig. 3b). The average
TABLE 2. Average coefficient of determination (R2) betweenthe predicted EMG-driven joint moments and the inversedynamics calculated joint moments, the normalized RMS error(normalized to peak-to-peak joint moment), and the normal-
ized maximal error during 17 prediction trials.
Subject R2 % RMS error % Maximal error
Healthy 0.848 (0.060) 14.3% (4.3%) 31.9% (9.1%)
ACL-deficient 0.826 (0.041) 12.2% (3.5%) 27.4% (9.1%)
Standard deviations were reported in parentheses.
SHAO et al.114

RMS error between the calculated ATTs and theexperimental ATTs was 3.22 mm for the healthy kneewith 4� tibial slope and 3.23 mm for the ACL-deficientknee with 4� tibial slope, and the differences werewithin the standard deviation of the measurements.24
Our results of the healthy knee with 4� tibial slopeshowed that the peak anterior shear force applied bytibiofemoral joint contact force was 0.30 BW, andShelburne et al.40 generated result of 0.11 BW using anumerical model. Our calculation was close to twoin vivo studies that measured the peak anterior shearforces (0.2918 and 0.30 BW7) using an instrumentedknee implant during walking. The main passiverestraint of anterior shear force was the MCL inthe ACL-deficient knee as predicted by our model(Figs. 4a and 4b). Previous in vitro experiments showedsimilar results that the in situ force of the MCL wouldincrease after transection of the ACL.22 Meniscus alsocontributed to the balance of anterior shear force, andthis is consistent with previous in vitro experimentalresult.2
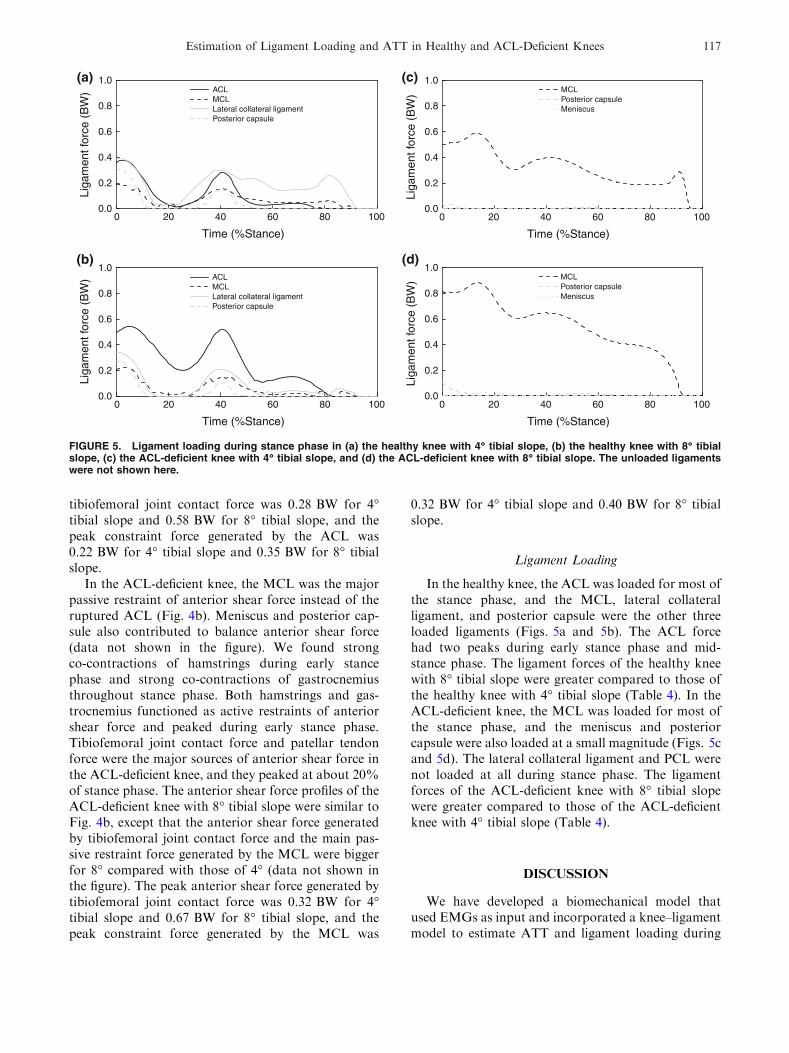
The magnitudes of ligament force estimation in ourmodel were comparable to previous numerical results.The maximum ACL force in the healthy knee of ourmodel (0.37 BW for the knee with 4� tibial slope and0.54 BW for the knee with 8� tibial slope) was similarto the previous numerical models15,40 (Table 4). Themaximum MCL force in the ACL-deficient knee wasthree times bigger than that of the healthy knee in ourmodel, and this is consistent with the numerical resultof Shelburne et al.40 (Table 4). Our calculated maxi-mum MCL force in the ACL-deficient knee (0.59 BWfor the knee with 4� tibial slope and 0.88 BW for theknee with 8� tibial slope) was bigger than the numericalresult of Shelburne et al.40 (0.17 BW).
Ligament Parameter Adjustment
After adjustment of the ligament model parameters,the calculated anterior–posterior laxity of the healthyknee and the ACL-deficient knee (with/without medialmeniscus) were within the range of in vitro measure-ments (Fig. 2). It gave us an adjusted ligament modelthat could predict the response of the knee ligaments toexternal loads. Table 3 showed that by increasing ordecreasing the in vitro ATT data by 3 mm the per-centage change of the tuned ligament parameters was0–8%. The RMS errors of the ATT change were rel-atively small (0.48–2.36 mm), and specially for theACL-deficient subject the R2 values of the ATT changewere greater than 0.96, which indicated a small changein the general pattern of the ATTs. The RMS errors ofboth the ACL force and MCL force were54.2–212.8 N, and the R2 values were 0.75–0.97, whichindicated a small change in the general force patterns.
Anterior Tibial Translation
Here, we report the results of one walking trial ofthe healthy knee and the ACL-deficient knee using ourmodel. The ACL-deficient knee had increased ATTcompared to the healthy knee throughout stance phasefor both knees with 4� and 8� tibial slope (Fig. 3). TheATT profiles of both healthy and ACL-deficient kneespeaked twice at about 20% of stance phase and near
0
4
8
12 Sullivan et al., 1984 Model calculated
ATT
(m
m)
Knee Angle (deg)
Levy et al., 1982 Levy et al., 1989 Haimes et al., 1994
5
10
15
20
25
30 Sullivan et al., 1984 Model calculated
ATT
(m
m)
Knee Angle (deg)
Levy et al., 1982 Levy et al., 1989 Haimes et al., 1994
0 20 40
0 20 40
0 20 40
5
10
15
20
25
30
ATT
(m
m)
Knee Angle (deg)
Levy et al., 1982 Model Calculated
(a)
(b)
(c)
FIGURE 2. Calculated ATT for (a) the healthy knee, (b) theACL-deficient knee, and (c) the ACL-deficient knee withoutmeniscus in response to a 100-N anterior force using theadjusted ligament model (black line). Also shown for com-parison are in vitro experimental data reported by Levyet al.,25,26 Haimes et al.,14 and Sullivan et al.43 The verticallines on the experimental data represent plus and minus onestandard deviation. We chose 0� to 45� as the data of interestbecause the knee joint angles of these two subjects duringstance phase were within this range.
Estimation of Ligament Loading and ATT in Healthy and ACL-Deficient Knees 115

toe off. The ATT of the knee with 8� tibial slope wasgreater than that of the knee with 4� tibial slope forboth knees, which showed increasing tibial slope in ourmodel would increase ATT.
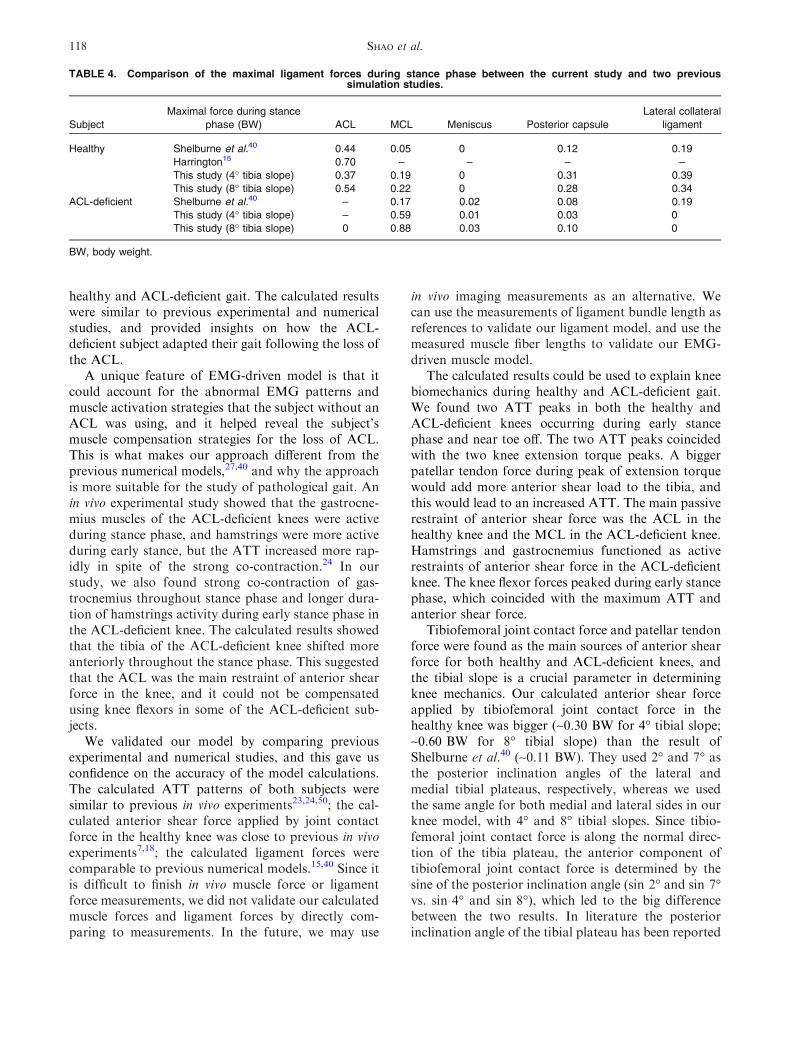
Anterior Shear Force
In the healthy knee, the ACL was the major passiverestraint to balance anterior shear force (Fig. 4a).Tibiofemoral joint contact force and patellar tendonforce were the major sources of anterior shear force in
the healthy knee, and they peaked at about 20% ofstance phase. The anterior shear force profiles of thehealthy knee with 8� tibial slope were similar toFig. 4a, except that the anterior shear force generatedby tibiofemoral joint contact force and the main pas-sive restraint force generated by the ACL were biggerfor 8� compared with those of 4� (not shown in thefigure). The peak anterior shear force generated by
TABLE 3. The differences between the new results using the in vitro ATT data minus 3 mm and the in vitro ATT data plus 3 mm asinputs and the results using the original in vitro data as inputs during tuning of the knee-ligament parameters.
Subject
Inputs of in vitro
ATT data
Percentage change (%) ATT ACL force MCL force
Stiffness Zero load length R2 RMS error (mm) R2 RMS error (N) R2 RMS error (N)
Healthy Plus 3 mm 1.85 (4.00) 20.15 (1.67) 0.628 1.10 0.863 212.8 0.852 191.6
Minus 3 mm 21.59 (6.69) 21.26 (7.17) 0.888 0.48 0.973 78.8 0.933 201.8
ACL-deficient Plus 3 mm 2.80 (6.38) 21.32 (2.60) 0.970 2.36 – – 0.800 150.1
Minus 3 mm 22.71 (3.53) 0.16 (1.94) 0.966 0.59 – – 0.746 54.2
Average percentage change of the calculated stiffness and zero load length of the ligament bundles were reported with standard deviations in
parentheses to show the influence of different ATT inputs on the tuned ligament parameters. Coefficient of determination (R2) and RMS error
between the new results of ATT, ACL force, and MCL force during stance phase and the original results were reported to show the influence
of different tuned knee–ligament parameters on the knee biomechanics. In this sensitivity study we chose to use the knee joint model with 4�of tibial slope as an example.
0 20 40 60 80 100-5
0
5
10
15 The healthy knee with 4° tibial slope
The ACL-deficient knee with 4° tibial slope
The healthy knee with 8° tibial slope
The ACL-deficient knee with 8° tibial slope
ATT
(m
m)
Time (%Stance)
0 20 40 60 80 100-5
0
5
10
15 Kozanek et al., 2009_healthy knee Zhang et al., 2003_healthy knee Zhang et al., 2003_ACL-deficient knee Kvist & Gillquist, 2001_healthy knee Kvist & Gillquist, 2001_ACL-deficient knee
ATT
(m
m)
Time (%Stance)
(a)
(b)
FIGURE 3. (a) Calculated ATT in the healthy and ACL-deficient knee with 4� and 8� tibial slopes during stance phaseusing our model. The ATT was measured as the anteriortranslation of the tibia relative to the midline between medialand lateral femoral epicondyles. (b) Adapted from previousin vivo measurements of ATT.23,24,50
0 20 40 60 80 100-0.6
-0.4
-0.2
0.0
0.2
0.4
0.6
0.8
MCL
Tibiofemoral joint contact forceExternal forceACL
Patellar tendon Hamstrings Gastrocnemius
Ant
erio
r sh
ear
forc
e (B
W)
Time (%Stance)
0 20 40 60 80 100-0.6
-0.4
-0.2
0.0
0.2
0.4
0.6
0.8Tibiofemoral joint contact forceExternal forceMCL
Patellar tendonHamstringsGastrocnemius
Ant
erio
r sh
ear
forc
e (B
W)
Time (%Stance)
(a)
(b)
FIGURE 4. Anterior shear forces applied to the tibia bymuscles, ligaments, external force, and joint contact force in(a) the healthy knee with 4� tibial slope and (b) the ACL-deficient knee with 4� tibial slope. The ACL provided morethan 90% of the passive restraint provided by soft tissues inthe healthy knee, and the MCL provided more than 90% of thepassive restraint provided by soft tissues in the ACL-deficientknee, so the other ligaments were not shown. BW, bodyweight.
SHAO et al.116
tibiofemoral joint contact force was 0.28 BW for 4�tibial slope and 0.58 BW for 8� tibial slope, and thepeak constraint force generated by the ACL was0.22 BW for 4� tibial slope and 0.35 BW for 8� tibialslope.
In the ACL-deficient knee, the MCL was the majorpassive restraint of anterior shear force instead of theruptured ACL (Fig. 4b). Meniscus and posterior cap-sule also contributed to balance anterior shear force(data not shown in the figure). We found strongco-contractions of hamstrings during early stancephase and strong co-contractions of gastrocnemiusthroughout stance phase. Both hamstrings and gas-trocnemius functioned as active restraints of anteriorshear force and peaked during early stance phase.Tibiofemoral joint contact force and patellar tendonforce were the major sources of anterior shear force inthe ACL-deficient knee, and they peaked at about 20%of stance phase. The anterior shear force profiles of theACL-deficient knee with 8� tibial slope were similar toFig. 4b, except that the anterior shear force generatedby tibiofemoral joint contact force and the main pas-sive restraint force generated by the MCL were biggerfor 8� compared with those of 4� (data not shown inthe figure). The peak anterior shear force generated bytibiofemoral joint contact force was 0.32 BW for 4�tibial slope and 0.67 BW for 8� tibial slope, and thepeak constraint force generated by the MCL was
0.32 BW for 4� tibial slope and 0.40 BW for 8� tibialslope.
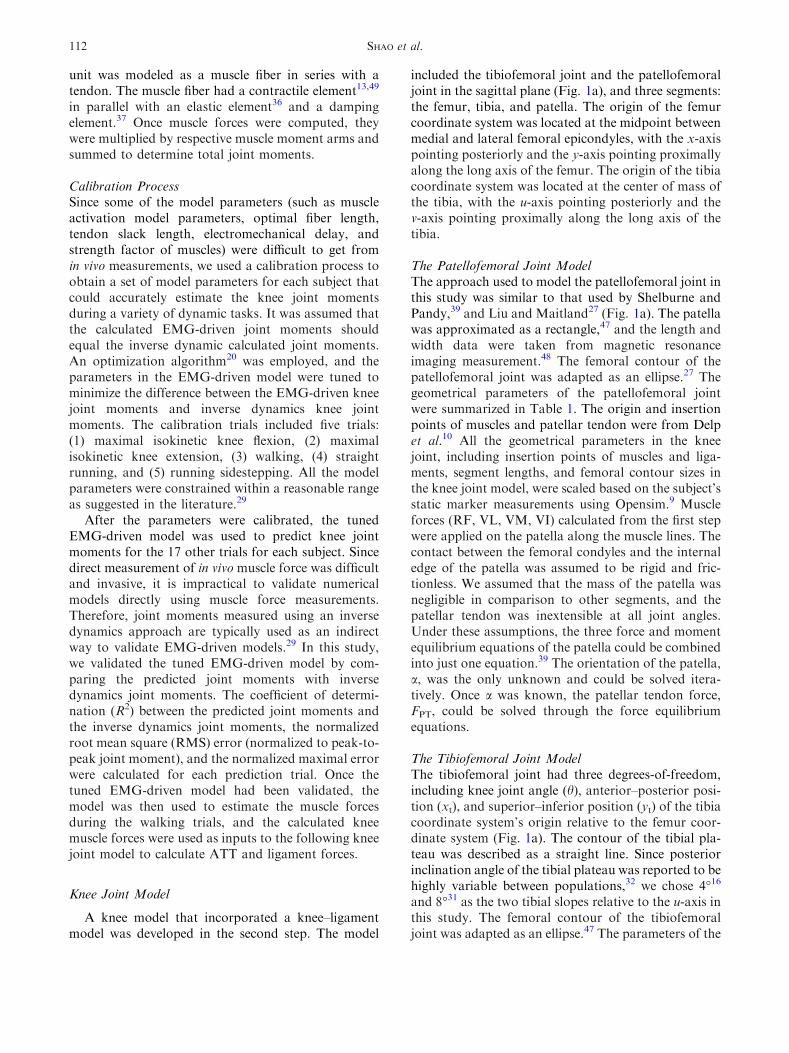
Ligament Loading
In the healthy knee, the ACL was loaded for most ofthe stance phase, and the MCL, lateral collateralligament, and posterior capsule were the other threeloaded ligaments (Figs. 5a and 5b). The ACL forcehad two peaks during early stance phase and mid-stance phase. The ligament forces of the healthy kneewith 8� tibial slope were greater compared to those ofthe healthy knee with 4� tibial slope (Table 4). In theACL-deficient knee, the MCL was loaded for most ofthe stance phase, and the meniscus and posteriorcapsule were also loaded at a small magnitude (Figs. 5cand 5d). The lateral collateral ligament and PCL werenot loaded at all during stance phase. The ligamentforces of the ACL-deficient knee with 8� tibial slopewere greater compared to those of the ACL-deficientknee with 4� tibial slope (Table 4).
DISCUSSION
We have developed a biomechanical model thatused EMGs as input and incorporated a knee–ligamentmodel to estimate ATT and ligament loading during
0 20 40 60 80 1000.0
0.2
0.4
0.6
0.8
1.0 ACL MCL Lateral collateral ligament Posterior capsule
Liga
men
t for
ce (
BW
)
Time (%Stance)
0.0
0.2
0.4
0.6
0.8
1.0 ACL MCL Lateral collateral ligament Posterior capsule
Liga
men
t for
ce (
BW
)
0.0
0.2
0.4
0.6
0.8
1.0 MCL Posterior capsule Meniscus
Liga
men
t for
ce (
BW
)0.0
0.2
0.4
0.6
0.8
1.0 MCL Posterior capsule Meniscus
Liga
men
t for
ce (
BW
)0 20 40 60 80 100
Time (%Stance)
0 20 40 60 80 100
Time (%Stance)
0 20 40 60 80 100
Time (%Stance)
(a)
(b) (d)
(c)
FIGURE 5. Ligament loading during stance phase in (a) the healthy knee with 4� tibial slope, (b) the healthy knee with 8� tibialslope, (c) the ACL-deficient knee with 4� tibial slope, and (d) the ACL-deficient knee with 8� tibial slope. The unloaded ligamentswere not shown here.
Estimation of Ligament Loading and ATT in Healthy and ACL-Deficient Knees 117
healthy and ACL-deficient gait. The calculated resultswere similar to previous experimental and numericalstudies, and provided insights on how the ACL-deficient subject adapted their gait following the loss ofthe ACL.
A unique feature of EMG-driven model is that itcould account for the abnormal EMG patterns andmuscle activation strategies that the subject without anACL was using, and it helped reveal the subject’smuscle compensation strategies for the loss of ACL.This is what makes our approach different from theprevious numerical models,27,40 and why the approachis more suitable for the study of pathological gait. Anin vivo experimental study showed that the gastrocne-mius muscles of the ACL-deficient knees were activeduring stance phase, and hamstrings were more activeduring early stance, but the ATT increased more rap-idly in spite of the strong co-contraction.24 In ourstudy, we also found strong co-contraction of gas-trocnemius throughout stance phase and longer dura-tion of hamstrings activity during early stance phase inthe ACL-deficient knee. The calculated results showedthat the tibia of the ACL-deficient knee shifted moreanteriorly throughout the stance phase. This suggestedthat the ACL was the main restraint of anterior shearforce in the knee, and it could not be compensatedusing knee flexors in some of the ACL-deficient sub-jects.
We validated our model by comparing previousexperimental and numerical studies, and this gave usconfidence on the accuracy of the model calculations.The calculated ATT patterns of both subjects weresimilar to previous in vivo experiments23,24,50; the cal-culated anterior shear force applied by joint contactforce in the healthy knee was close to previous in vivoexperiments7,18; the calculated ligament forces werecomparable to previous numerical models.15,40 Since itis difficult to finish in vivo muscle force or ligamentforce measurements, we did not validate our calculatedmuscle forces and ligament forces by directly com-paring to measurements. In the future, we may use
in vivo imaging measurements as an alternative. Wecan use the measurements of ligament bundle length asreferences to validate our ligament model, and use themeasured muscle fiber lengths to validate our EMG-driven muscle model.
The calculated results could be used to explain kneebiomechanics during healthy and ACL-deficient gait.We found two ATT peaks in both the healthy andACL-deficient knees occurring during early stancephase and near toe off. The two ATT peaks coincidedwith the two knee extension torque peaks. A biggerpatellar tendon force during peak of extension torquewould add more anterior shear load to the tibia, andthis would lead to an increased ATT. The main passiverestraint of anterior shear force was the ACL in thehealthy knee and the MCL in the ACL-deficient knee.Hamstrings and gastrocnemius functioned as activerestraints of anterior shear force in the ACL-deficientknee. The knee flexor forces peaked during early stancephase, which coincided with the maximum ATT andanterior shear force.
Tibiofemoral joint contact force and patellar tendonforce were found as the main sources of anterior shearforce for both healthy and ACL-deficient knees, andthe tibial slope is a crucial parameter in determiningknee mechanics. Our calculated anterior shear forceapplied by tibiofemoral joint contact force in thehealthy knee was bigger (~0.30 BW for 4� tibial slope;~0.60 BW for 8� tibial slope) than the result ofShelburne et al.40 (~0.11 BW). They used 2� and 7� asthe posterior inclination angles of the lateral andmedial tibial plateaus, respectively, whereas we usedthe same angle for both medial and lateral sides in ourknee model, with 4� and 8� tibial slopes. Since tibio-femoral joint contact force is along the normal direc-tion of the tibia plateau, the anterior component oftibiofemoral joint contact force is determined by thesine of the posterior inclination angle (sin 2� and sin 7�vs. sin 4� and sin 8�), which led to the big differencebetween the two results. In literature the posteriorinclination angle of the tibial plateau has been reported
TABLE 4. Comparison of the maximal ligament forces during stance phase between the current study and two previoussimulation studies.
Subject
Maximal force during stance
phase (BW) ACL MCL Meniscus Posterior capsule
Lateral collateral
ligament
Healthy Shelburne et al.40 0.44 0.05 0 0.12 0.19
Harrington15 0.70 – – – –
This study (4� tibia slope) 0.37 0.19 0 0.31 0.39
This study (8� tibia slope) 0.54 0.22 0 0.28 0.34
ACL-deficient Shelburne et al.40 – 0.17 0.02 0.08 0.19
This study (4� tibia slope) – 0.59 0.01 0.03 0
This study (8� tibia slope) 0 0.88 0.03 0.10 0
BW, body weight.
SHAO et al.118

to have a mean value between 4� and 14�.32 Two in vivostudies showed that the peak anterior shear forcesduring walking were 0.2918 and 0.30 BW,7 and it wasclose to our results of 4� tibial slope. Therefore, wethink our model was more valid, and using a subject-specific measurement would be a more accurate way infuture studies. The bigger anterior shear force gener-ated by tibiofemoral joint contact force in our modelcould also explain the higher estimation of the MCLforce in our model compared to that of Shelburneet al.,40 because a bigger MCL force was required tobalance the bigger anterior shear force.
The results of our two knee models with 4� and 8�posterior tibial slope showed that increasing the tibialslope in our model would increase the ATT and liga-ment loading for both healthy and ACL-deficientknees. This has also been shown in an in vivo radio-graphic study8 and two previous numerical studies.21,28
During weight-bearing conditions tibiofemoral jointcontact force generates an anteriorly directed forcecomponent, and this anterior component increases asthe tibial slope increases. This increased anteriorcomponent can produce a corresponding anteriorlydirected translation of the tibia and increase ligamentloading that is necessary to balance the anterior shearforce. The positive relationship between posteriortibial slope and ACL injury rate has been verified in acase–control study.17 Females in general have a steepertibial slope compared to males,16 and the bigger ante-rior shear force generated by tibiofemoral joint contactforce during weight-bearing conditions moves theirtibia more anteriorly and exposes them to an increasedrisk of ACL injury compared to males.
The sensitivity study of the knee–ligament modelshowed that the calculated results would be influencedby the inputs of in vitro ATT data during the tuning ofthe ligament parameters. The changes in the calculatedATTs were relatively small, especially for the ACL-deficient subject. The ligament force patterns were notchanged much after changing the in vitro ATT inputsto the ligament tuning model, but the force magnitudeswere changed by an amount of 100 or 200 N. Thisstudy showed that it is important to have subject-specific in vivo ATT data in order to tune the knee–ligament parameters more accurately.
In future studies we will incorporate imaging mea-surements to make our model more subject-specific,and use the model to provide useful information forpatient-specific surgery procedure and rehabilitationprograms. Kvist and Gillquist24 found the inter-subjectvariance of maximal ATT during walking to be±2.3 mm for healthy knees and ±4 mm for ACL-deficient knees, and the ligament loading would alsovary across different subjects. This big variabilitybetween subjects would require a more subject-specific
model to identify the individual difference in our futuremodel development. First, we will include imagingmeasurements to provide subject-specific anthropo-metric parameters, including the parameters of thefemur and tibia contours, the muscle and ligamentattachment points. Second, we will engage in vivomagnetic resonance imaging41 or ultrasound6 mea-surements during muscle contractions to make ourEMG-driven muscle model more subject-specific.Third, we will use in vivo ATT data from MRI orX-ray measurements in response to different externalloads to tune our ligament model’s parameters, andthis will make our ligament model more subject-specific. The increase in the model accuracy canstrengthen our model as a tool to help decisions on thesurgery and rehabilitation. For example, we can useour model to predict the ligament graft loading afterdifferent surgery procedures (patellar tendon graft vs.hamstring tendon draft, graft tunnel position, initialgraft tension, etc.), and find the best procedure thatwould restore the injured knee to normal function. Wecan also use our model to calculate the ligamentloading during various activities of rehabilitation, suchas strengthening program and running program, andwe will examine if the rehabilitation protocol is safe fora specific patient without reinjuring the ligaments.
There are some limitations in this study. First, thismodel was confined to the sagittal plane, and in futurestudies we will expand our model to the frontal andtransverse plane. Second, we assumed that the jointcontact was rigid, and ignored the deformability of themeniscus and cartilage. Our calculated ATT results ofboth healthy and ACL-deficient knees were close toin vivo measurements,23,24,50 and an in vitro study26 hasshown that the anterior–posterior laxity of healthyknees would not be affected after removal of themeniscus, so we think that the ATT results in ourstudy were not affected by the rigidity assumption. Theligament force estimations were likely to be higherbecause a deformable joint contact was not taken intoaccount.39 Third, experimental data were taken from aminimal amount of subjects in this study. In the future,this approach will be applied to a patient populationfor statistical comparison.
This is the first time that an EMG-driven model hasbeen incorporated with a knee–ligament model to esti-mate ligament loading in a healthy knee and an ACL-deficient knee. The calculated results were consistentwith previous experimental and numerical studies, andthis gave us confidence that our model could be used tostudy how ACL-deficient knees compensate for the lossof the ACL. We found increase in ATT throughoutstance phase for the ACL-deficient knee compared tothe healthy knee. The MCL was the main passiverestraint to anterior shear force in the ACL-deficient
Estimation of Ligament Loading and ATT in Healthy and ACL-Deficient Knees 119

knee, and knee flexors were used as active restraint tohelp balance anterior shear force. We anticipated thatincreasing the tibial slope would increase the resultingATT and ligament forces in both healthy and ACL-deficient knees based on the results of our model.
ACKNOWLEDGMENTS
We would like to thank Dr. Kevin B. Shelburne forproviding the data of his ligament model. This studywas supported, in part, by NIH R01-AR46386 andR01-AR48212.
OPEN ACCESS
This article is distributed under the terms ofthe Creative Commons Attribution NoncommercialLicense which permits any noncommercial use, distri-bution, and reproduction in any medium, provided theoriginal author(s) and source are credited.
REFERENCES
1Abdel-Rahman, E., and M. S. Hefzy. A two-dimensionaldynamic anatomical model of the human knee joint.J. Biomech. Eng. 115(4A):357–365, 1993.2Allen, C. R., E. K. Wong, G. A. Livesay, et al. Importanceof the medial meniscus in the anterior cruciate ligament-deficient knee. J. Orthop. Res. 18(1):109–115, 2000.3Blankevoort, L., J. H. Kuiper, R. Huiskes, et al. Articularcontact in a three-dimensional model of the knee. J. Bio-mech. 24(11):1019–1031, 1991.4Buchanan, T. S., D. G. Lloyd, K. Manal, et al. Neuro-musculoskeletal modeling: estimation of muscle forces andjoint moments and movements from measurements ofneural command. J. Appl. Biomech. 20(4):367–395, 2004.5Buchanan, T. S., and D. A. Shreeve. An evaluation ofoptimization techniques for the prediction of muscle acti-vation patterns during isometric tasks. J. Biomech. Eng.118(4):565–574, 1996.6Chino, K., N. Mitsukawa, K. Kobayashi, et al. Theinfluence of fascicle behavior on the lack of velocitydependence in eccentric joint torque in humans: in vivoobservation. J. Appl. Biomech. 25(2):111–118, 2009.7D’Lima, D. D., S. Patil, N. Steklov, et al. In vivo kneemoments and shear after total knee arthroplasty. J. Bio-mech. 40(Suppl 1):S11–S17, 2007.8Dejour, H., and M. Bonnin. Tibial translation after ante-rior cruciate ligament rupture. Two radiological testscompared. J. Bone Joint Surg. Br. 76(5):745–749, 1994.9Delp, S. L., F. C. Anderson, A. S. Arnold, et al. OpenSim:open-source software to create and analyze dynamicsimulations of movement. IEEE Trans. Biomed. Eng.54(11):1940–1950, 2007.
10Delp, S. L., J. P. Loan, M. G. Hoy, et al. An interactivegraphics-based model of the lower extremity to studyorthopaedic surgical procedures. IEEE Trans. Biomed. Eng.37(8):757–767, 1990.
11Fening, S. D., J. Kovacic, H. Kambic, et al. The effects ofmodified posterior tibial slope on anterior cruciate ligament
strain and knee kinematics: a human cadaveric study.J. Knee Surg. 21(3):205–211, 2008.
12Giffin, J. R., T. M. Vogrin, T. Zantop, et al. Effects ofincreasing tibial slope on the biomechanics of the knee. Am.J. Sports Med. 32(2):376–382, 2004.
13Gordon, A. M., A. F. Huxley, and F. J. Julian. The vari-ation in isometric tension with sarcomere length in verte-brate muscle fibres. J. Physiol. 184(1):170–192, 1966.
14Haimes, J. L., R. R. Wroble, E. S. Grood, et al. Role of themedial structures in the intact and anterior cruciate liga-ment-deficient knee Limits of motion in the human knee.Am. J. Sports Med. 22(3):402–409, 1994.
15Harrington, I. J. Bioengineering analysis of force actions atknee in normal and pathological gait. Biomed. Eng.11(5):167–172, 1976.
16Hashemi, J., N. Chandrashekar, B. Gill, et al. The geom-etry of the tibial plateau and its influence on the biome-chanics of the tibiofemoral joint. J. Bone Joint Surg. Am.90(12):2724–2734, 2008.
17Hashemi, J., N. Chandrashekar, H. Mansouri, et al. Shal-low medial tibial plateau and steep medial and lateral tibialslopes: new risk factors for anterior cruciate ligamentinjuries. Am. J. Sports Med. 38(1):54–62, 2010.
18Heinlein, B., I. Kutzner, F. Graichen, et al. ESB ClinicalBiomechanics Award 2008: Complete data of total kneereplacement loading for level walking and stair climbingmeasured in vivo with a follow-up of 6–10 months. Clin.Biomech. (Bristol, Avon) 24(4):315–326, 2009.
19Herzog, W., and T. R. Leonard. Validation of optimizationmodels that estimate the forces exerted by synergisticmuscles. J. Biomech. 24(Suppl 1):31–39, 1991.
20Higginson, J. S., R. R. Neptune, and F. C. Anderson.Simulated parallel annealing within a neighborhood foroptimization of biomechanical systems. J. Biomech. 38(9):1938–1942, 2005.
21Imran, A., and J. J. O’Connor. Theoretical estimates ofcruciate ligament forces: effects of tibial surface geometryand ligament orientations. Proc. Inst. Mech. Eng. H 211(6):425–439, 1997.
22Kanamori, A., M. Sakane, J. Zeminski, et al. In situ forcein the medial and lateral structures of intact and ACL-deficient knees. J. Orthop. Sci. 5(6):567–571, 2000.
23Kozanek, M., A. Hosseini, F. Liu, et al. Tibiofemoralkinematics and condylar motion during the stance phase ofgait. J. Biomech. 42(12):1877–1884, 2009.
24Kvist, J., and J. Gillquist. Anterior positioning of tibiaduring motion after anterior cruciate ligament injury. Med.Sci. Sports Exerc. 33(7):1063–1072, 2001.
25Levy, I. M., P. A. Torzilli, J. D. Gould, et al. The effect oflateral meniscectomy on motion of the knee. J. Bone JointSurg. Am. 71(3):401–406, 1989.
26Levy, I. M., P. A. Torzilli, and R. F. Warren. The effect ofmedial meniscectomy on anterior-posterior motion of theknee. J. Bone Joint Surg. Am. 64(6):883–888, 1982.
27Liu, W., and M. E. Maitland. The effect of hamstringmuscle compensation for anterior laxity in the ACL-deficient knee during gait. J. Biomech. 33(7):871–879,2000.
28Liu, W., and M. E. Maitland. Influence of anthropometricand mechanical variations on functional instability in theACL-deficient knee. Ann. Biomed. Eng. 31(10):1153–1161,2003.
29Lloyd, D. G., and T. F. Besier. An EMG-driven muscu-loskeletal model to estimate muscle forces and knee jointmoments in vivo. J. Biomech. 36(6):765–776, 2003.
SHAO et al.120

30Manal, K., and T. S. Buchanan. A one-parameter neuralactivation to muscle activation model: estimating isometricjoint moments from electromyograms. J. Biomech. 36(8):1197–1202, 2003.
31Nisell, R., G. Nemeth, and H. Ohlsen. Joint forces inextension of the knee. Analysis of a mechanical model.Acta Orthop. Scand. 57(1):41–46, 1986.
32Noyes, F. R., S. X. Goebel, and J. West. Opening wedgetibial osteotomy: the 3-triangle method to correct axialalignment and tibial slope. Am. J. Sports Med.33(3):378–387, 2005.
33Pandy, M. G., K. Sasaki, and S. Kim. A three-dimensionalmusculoskeletal model of the human knee joint. Part 1:theoretical construct. Comput. Methods Biomech. Biomed.Eng. 1(2):87–108, 1998.
34Papadonikolakis, A., L. Cooper, N. Stergiou, et al. Com-pensatory mechanisms in anterior cruciate ligament defi-ciency. Knee Surg. Sports Traumatol. Arthrosc. 11(4):235–243, 2003.
35Rudolph, K. S., M. J. Axe, T. S. Buchanan, et al. Dynamicstability in the anterior cruciate ligament deficient knee.Knee Surg. Sports Traumatol. Arthrosc. 9(2):62–71, 2001.
36Schutte, L. M. Using Musculoskeletal Models to ExploreStrategies for Improving Performance in ElectricalStimulation-Induced Leg Cycle Ergometry. StanfordUniversity, 1992.
37Schutte, L. M., M. M. Rodgers, F. E. Zajac, et al.Improving the efficacy of electrical stimulation induced legcycle ergometry: an analysis based on a dynamic muscu-loskeletal model. IEEE Trans. Rehabil. Eng. 1(2):109–125,1993.
38Shao, Q., and T. S. Buchanan. A biomechanical model toestimate corrective changes in muscle activation patternsfor stroke patients. J. Biomech. 41(14):3097–3100, 2008.
39Shelburne, K. B., and M. G. Pandy. A musculoskeletalmodel of the knee for evaluating ligament forces duringisometric contractions. J. Biomech. 30(2):163–176, 1997.
40Shelburne, K. B., M. G. Pandy, and M. R. Torry. Com-parison of shear forces and ligament loading in the healthy
and ACL-deficient knee during gait. J. Biomech. 37(3):313–319, 2004.
41Shin, D. D., J. A. Hodgson, V. R. Edgerton, et al.In vivo intramuscular fascicle-aponeuroses dynamics of thehuman medial gastrocnemius during plantarflexion anddorsiflexion of the foot. J. Appl. Physiol. 107(4):1276–1284,2009.
42Shoemaker, S. C., and K. L. Markolf. Effects of joint loadon the stiffness and laxity of ligament-deficient knees. Anin vitro study of the anterior cruciate and medial collateralligaments. J. Bone Joint Surg. Am. 67(1):136–146, 1985.
43Sullivan, D., I. M. Levy, S. Sheskier, et al. Medicalrestraints to anterior-posterior motion of the knee. J. BoneJoint Surg. Am. 66(6):930–936, 1984.
44Thelen, D. G., A. B. Schultz, S. D. Fassois, et al. Identi-fication of dynamic myoelectric signal-to-force modelsduring isometric lumbar muscle contractions. J. Biomech.27(7):907–919, 1994.
45Williams, G. N., L. Snyder-Mackler, P. J. Barrance, et al.Quadriceps femoris muscle morphology and function afterACL injury: a differential response in copers versus non-copers. J. Biomech. 38(4):685–693, 2005.
46Wroble, R. R., E. S. Grood, J. S. Cummings, et al. The roleof the lateral extraarticular restraints in the anterior cru-ciate ligament-deficient knee. Am. J. Sports Med. 21(2):257–262, 1993; (discussion 263).
47Yamaguchi, G. T., and F. E. Zajac. A planar model of theknee joint to characterize the knee extensor mechanism.J. Biomech. 22(1):1–10, 1989.
48Yoo, J. H., S. R. Yi, and J. H. Kim. The geometry ofpatella and patellar tendon measured on knee MRI. Surg.Radiol. Anat. 29(8):623–628, 2007.
49Zajac, F. E. Muscle and tendon: properties, models, scal-ing, and application to biomechanics and motor control.Crit. Rev. Biomed. Eng. 17(4):359–411, 1989.
50Zhang, L. Q., R. G. Shiavi, T. J. Limbird, et al. Six degrees-of-freedom kinematics of ACL deficient knees duringlocomotion-compensatory mechanism. Gait Posture 17(1):34–42, 2003.
Estimation of Ligament Loading and ATT in Healthy and ACL-Deficient Knees 121