ANALYSIS OF ISOKINETIC KNEE EXTENSION / FLEXION IN MALE ELITE ADOLESCENT WRESTLERS
Upload
independentCategory
view
0download
0
HUMAN MOVEMENT
102
MAXIMAL ISOKINETIC PEAK TORQUE AND EMG ACTIVITY DETERMINED BY SHORTER RANGES OF MOTION
ANDERSON S.C. OLIVEIRA 1, 2, ROGÉRIO B. CORVINO 3, 4, MAURO GONÇALVES 2, FABRIZIO CAPUTO 3, 4, BENEDITO S. DENADAI 3 *1 Biomechanics Laboratory, São Paulo State University, Rio Claro, Brazil2 Department of Health Science and Technology, Aalborg University, Aalborg, Denmark3 Human Performance Laboratory, São Paulo State University, Rio Claro, Brazil4 Center for Health and Sport Science, Santa Catarina State University, Florianópolis, Brazil
ABSTRACTPurpose. Isokinetic tests are often applied to assess muscular strength and EMG activity, however the specific ranges of motion used in testing (fully flexed or extended positions) might be constrictive and/or be painful for patients with injuries or under-going rehabilitation. The aim of this study was to examine the effects of different ranges of motion (RoM) when determining maximal EMG during isokinetic knee flexion and extension with different types of contractions and velocities. Methods. Eighteen males had EMG activity recorded on the vastus lateralis, vastus medialis, semitendinosus and biceps femoris muscles during five maximal isokinetic concentric and eccentric contractions for the knee flexors and extensors at 60° · s–1 and 180° · s–1. The root mean square of EMG was calculated at three different ranges of motion: (1) a full range of motion (90°–20° [0° = full knee extension]); (2) a range of motion of 20° (between 60°–80° and 40°–60° for knee extension and flexion, respectively) and (3) at a 10° interval around the angle where peak torque is produced. EMG measurements were statistically analyzed (ANOVA) to test for the range of motion, contraction velocity and contraction speed effects. Coefficients of variation and Pearson’s correlation coefficients were also calculated among the ranges of motion. Results. Predominantly similar (p > 0.05) and well-correlated EMG results (r > 0.7, p 0.001) were found among the ranges of motion. However, a lower coefficient of variation was found for the full range of motion, while the 10° interval around peak torque at 180° · s–1 had the highest coefficient, regardless of the type of contraction. Conclusions. Shorter ranges of motion at around the peak torque angle provides a reliable indicator when recording EMG activity during maximal isokinetic parameters. It may provide a safer alternative when testing patients with injuries or undergoing rehabilitation.
Key words: torque, concentric, eccentric, knee extension, joint angle
doi: 10.2478/v10038-012-0010-9
2012, vol. 13 (2), 102– 108
* Corresponding author.
Introduction
Maximal strength is currently one of the most im-portant parameters tested in sports performance and rehabilitation programs. Even modest sports associa-tions have procedures for measuring maximal capacity (using standard resistance training equipment), while more sophisticated centers may make use of iso kinetic equipment (which provides constant velocity throughout the entire range of motion). In addition, an evaluation of muscular activity by use of electromyography [EMG] during maximal effort provides more accurate results and optimizes readings during testing and training [1, 2]. This isokinetic procedure usually requires a full range of motion (RoM) from which the moment of maximal torque is selected for analysis.
The optimized joint positions to produce torque are ~40–80° for knee extension [3–5] and 40–60° for knee flexion [4, 5] (0° = full extension). However, existing
literature presents some divergent results on maximal torque and joint positions: (1) the use of short RoMs (partitions of 15° to 30° throughout the full RoM) pro-vides similar results compared to full RoM at low and moderate speeds, but also presents noteworthy incon-sistencies [5, 6], while (2) other studies have verified that the further from the optimized length-tension joint position, the lower the maximal torque [3, 4, 7].
Despite these conflicting results, the use of isoki-netic measurements are also used for rehabilitation purposes, which itself presents a number of idiosyncra-sies of joint RoM. Patients after trauma or with chronic knee disease should avoid the use of full RoM during such strength measurements [8], which can lead to com-plications in not allowing maximal torque to be deter-mined as well as related EMG activity. Concerned about how patients can adapt their neuromuscular system during restricted training programs, Barak et al. [8] found a transferability between the strength gains from using a RoM of 30–60° knee extension to other different RoMs (5°–30° and 60°–85°), which is useful for injured/rehabilitation patients. Thus, at least for re-habilitation purposes, the most likely angles providing maximal torque may be avoided.

A.S.C. Oliveira et al., EMG at different ranges of knee motion
103
HUMAN MOVEMENT
During isokinetic measurements both the contraction type and speed are very important issues; it is well known that concentric contractions show lower peak torque than eccentric contractions [7, 9], with the EMG activity for eccentric actions also being lower. Contrac-tion speed, which affects generating peak torque, has also been widely investigated, but EMG activity was found not to follow the same pattern and shows no changes among different contraction speeds [2, 7, 9].
Recent studies have assessed EMG activity during maximal contractions at short RoMs [9, 10], which in-clude the range corresponding to the optimal length-tension relationship (i.e., the range that includes the angle of peak torque). Sports performance and reha-bilitation research could be benefited by using shorter RoMs to evaluate maximal parameters, since knee joint disorders may affect afferent information, especially in the range of the injury [8]. It seems that by avoiding larger RoM, EMG may be more accurately represented. However there is no clear evidence in the reliability of using shorter RoMs to determine EMG respective to peak torque (PT) compared to the standard testing procedure using Full RoM [6].
With this in mind, our main hypothesis was that EMG during maximal isokinetic contractions, measured in different RoMs, may differ between each other, since different joint positions might reveal different muscle activations. A second hypothesis was that the changes verified between the different RoMs may be main-tained when different contraction speeds are executed, or even between different contractions types (eccentric × concentric). The objective of the present study was therefore to verify the differences in EMG activity during maximal isokinetic contractions when measured by different RoMs during concentric and eccentric actions at both slow and moderate speeds.
Material and methods
Eighteen physically active, though not specifically trained, males (mean ± SD: 22 ± 2 years old, height 179.1 ± 6.25 cm and weight 80.12 ± 9.56 kg) provided their informed consent to participate in the study. All subjects were healthy and free of cardiovascular, respira-tory and neuromuscular disease. The study was approved by the Institutional Research Ethics Committee.
The subjects were tested on two occasions. During their first visit, all subjects were familiarized with the maximal concentric and eccentric isokinetic contrac-tions they were to perform (knee extension and flexion) at speeds of 60° · s–1 and 180° · s–1 on an isokinetic dy-namometer (Biodex System 3, Biodex Medical Systems, USA). During the second test session, which took place at least five days later, the (already familiarized) sub-jects returned to the laboratory to perform five maximal concentric knee flexion and extension cycles at 60° · s–1 and 180° · s–1, and five maximal eccentric isokinetic
knee flexion and extension cycles at 60° · s–1 and 180° · s–1. The order of concentric and eccentric contractions and the contraction velocity was randomized.
During their familiarization session, the subjects were fully instructed about the tasks they were to per-form on the dynamometer. Prior to the test, they per-formed a standardized warm-up consisting of cycling for 5 min at 70 Watts. After this, the subjects were po-sitioned and allowed to perform the submaximal eccen-tric and isometric contractions at the tested velocity. The subjects were instructed to work at maximal force when performing knee extensions and flexions. The order of the type of contraction during the familiari-zation and testing process was random, with 5–10 max-imal contractions for knee flexion and extension at each velocity (60° · s–1 and 180° · s–1). In order to standardize the nomenclature, concentric contractions at 60° · s–1 and 180° · s–1 were named “CON-60” and “CON-180”, respectively, for the knee flexors and extensors, while the eccentric contractions at 60° · s–1 and 180° · s–1 were named “ECC-60” and “ECC-180”, respectively, for the knee flexors and extensors.
For both the familiarization and maximal test ses-sions, the subjects were placed in a sitting position and securely strapped into the test chair. Extraneous movement of the upper body was limited by two cross-over shoulder harnesses and an abdominal belt. The trunk/thigh angle was 85°. The axis of the dynamome-ter was lined up with the right knee flexion-extension axis, and the lever arm was attached to the shank by a strap. The subject was asked to relax his leg so that passive determination of the effects of gravity on the limb and lever arm could be carried out. The RoM for the knee test was 70° for both concentric and eccentric contractions (from 90° to 20° [0° = full extension]). To ensure full extension, an anatomical 90° position was determined by manual measurement using a goniometer. All subjects were encouraged to give maximal effort by both visual feedback and strong verbal encourage-ment when pushing the lever up, and then down, as hard and as fast as possible during extension in the eccentric contractions.
The isokinetic (torque, position and velocity) con-tractions were analyzed using specific algorithms cre-ated in MatLab software (The MathWorks Inc., USA). Torque and EMG measurements were collected through-out the whole ROM. From the isokinetic contractions, peak torque and angle of peak torque (PTANG) were de-termined by using specific Matlab algorithms. Torque curves were smoothed by use of a 10 Hz Butterworth fourth-order zero-lag filter. After this, the contraction with the highest peak torque from five individual efforts was considered for further analysis. Peak torque was taken in an averaged window of 10° around peak torque [9]. The right leg was utilized for all test procedures.
EMG signals from the vastus lateralis (VL), vastus medialis (VL), biceps femoris (BF) and semitendino-

A.S.C. Oliveira et al., EMG at different ranges of knee motion
104
HUMAN MOVEMENT
sus (ST) muscles were selected for analysis. The subjects were prepared for the placement of the EMG electrodes by having their skin shaven at each electrode site, which was then cleaned carefully with an alcohol wipe and lightly abraded. Two Medi-Trace Ag–Ag/Cl electrodes (Covidean, USA), with a diameter of 2 cm and an inter-electrode distance of 2 cm, were used per muscle and placed according to procedure suggested by Hermens et al. [11]. The ground (reference) electrodes were posi-tioned on the tibia. To ensure that movement artefacts were kept to a minimum, the electrodes and cables were taped to the skin with surgical tape. The EMG activity was recorded by an EMG System800 (EMG System, Bra-zil) at 2000 Hz with a signal amplification of 2000x. Surface EMG signals were high pass filtered (20 Hz) and low pass filtered (500 Hz), with the common mode rejection ratio set to 80 dB. All EMG data was stored together with the isokinetic measurements (torque, joint position, velocity) on a computer disk. The EMG data were low-pass filtered (15 Hz using a Butterworth fourth-order zero-lag filter), and the root mean square (RMS) was calculated for three different RoMs from the original signal: for the entire range of motion (FULLEMG), a RoM of 20° (20EMG – 60–80° for knee extension, 40–60° for
knee flexion), and a RoM of 10° around peak torque (10EMG). These RoMs were selected to verify the differ-ences in EMG determined by different joint positions (see Fig. 1 as an example).
Data are presented as mean ± standard deviation (SD) for torque measurements and mean ± standard error of mean (SEM) for EMG activity. A Shapiro-Wilks test assessed the normality of distribution for torque (PT and PTANG) and EMG (FULLEMG, 20EMG and 10EMG) mea-surements. The effects of the type of contraction and the velocity on PT and PTANG were accessed by two-way analysis of variance (two contraction types [concen-tric × eccentric], two velocities [60° · s–1 × 180° · s–1]) with Tukey’s HSD post-hoc test, when applicable. For the EMG measurements, the effects of the RoMs (FULLEMG,
20EMG and 10EMG) were assessed by a non-parametric test, the Kruskal-Wallis Analysis of Variance. Differe-nces in EMG between concentric and eccentric con-tractions, and between 60° · s–1 and 180° · s–1 were ac-cessed by the non-parametric Wilcoxon test. To assess the relationships between the EMG measurements (FULLEMG × 20EMG; FULLEMG × 10EMG and 20EMG × 10EMG), Pearson’s correlation coefficient (r) was used. For all sta-tistical tests, the significance level was set at p 0.05.
Results
For both knee extension and flexion the effects of the type of contraction were analyzed, where concen-tric contractions were found to present lower peak torque (PT) than eccentric contractions at 60° · s–1 and 180° · s–1 (p 0.01, Tab. 1). For PTANG, there were no dif-ferences in the contraction velocity, with the only con-
Figure 1. Representative diagram of the different ranges of motion used to calculate maximal EMG activity. The example was extracted from a subject during
isokinetic knee extension at 60° · s–1, showing the torque curve, EMG for the vastus lateralis (EMG VL) and the vastus medialis (EMG VM). The peak torque (PT) was achieved at 61° (marked by a thick vertical black line
and arrow). The more commonly-used method covered the entire range of motion (FULLEMG), the second method
was calculated in a 20° fixed window (between 60° and 80° for knee extension – marked between the dotted
vertical lines), and the third method considered peak torque as a reference point, using 10° around this peak
torque (in this example from 56° to 66° – marked between the thin solid vertical lines)
Table 1. Mean ± SD peak torque (PT) and the angle of peak torque (PTANG) during maximal isokinetic concentric
contractions at 60° · s–1 (CON-60) and 180° · s–1 (CON-180), and eccentric contractions at 60° · s–1
(ECC-60) and 180° · s–1 (ECC-180)
PT (Nm) PTANG (°) PTANG (min)
PTANG (max)
EXT
ENSO
RS CON-60 234 ± 46*† 63.7 ± 4.6 54.4 73.6
CON-180 166.8 ± 38 63.1 ± 5.8 47.3 71.8
ECC-60 316.2 ± 72 70.7 ± 6.6 56.4 78.2
ECC-180 317.7 ± 61* 65.7 ± 10.2 39.6 81.2
FLEX
OR
S
CON-60 123.6 ± 22† 46.4 ± 9 29.7 61.9
CON-180 114 ± 24 55.3 ± 15 39.1 86.4
ECC-60 183 ± 31 41.2 ± 7 23.8 54.8
ECC-180 193 ± 34* 42.4 ± 12* 31.5 82.8
* denotes significant difference in relation to CON-180 (p 0.05)
† denotes significant difference in relation to EXC-60 (p 0.05)
A.S.C. Oliveira et al., EMG at different ranges of knee motion
105
HUMAN MOVEMENT
traction that showed differences was during knee flex-ion, with higher PTANG during CON-180 compared to ECC-180 (p 0.05). The PTANG for knee extension and flexion was predominantly reached within the defined RoM of 20EMG. However, there were cases in which PTANG was not achieved at this RoM.
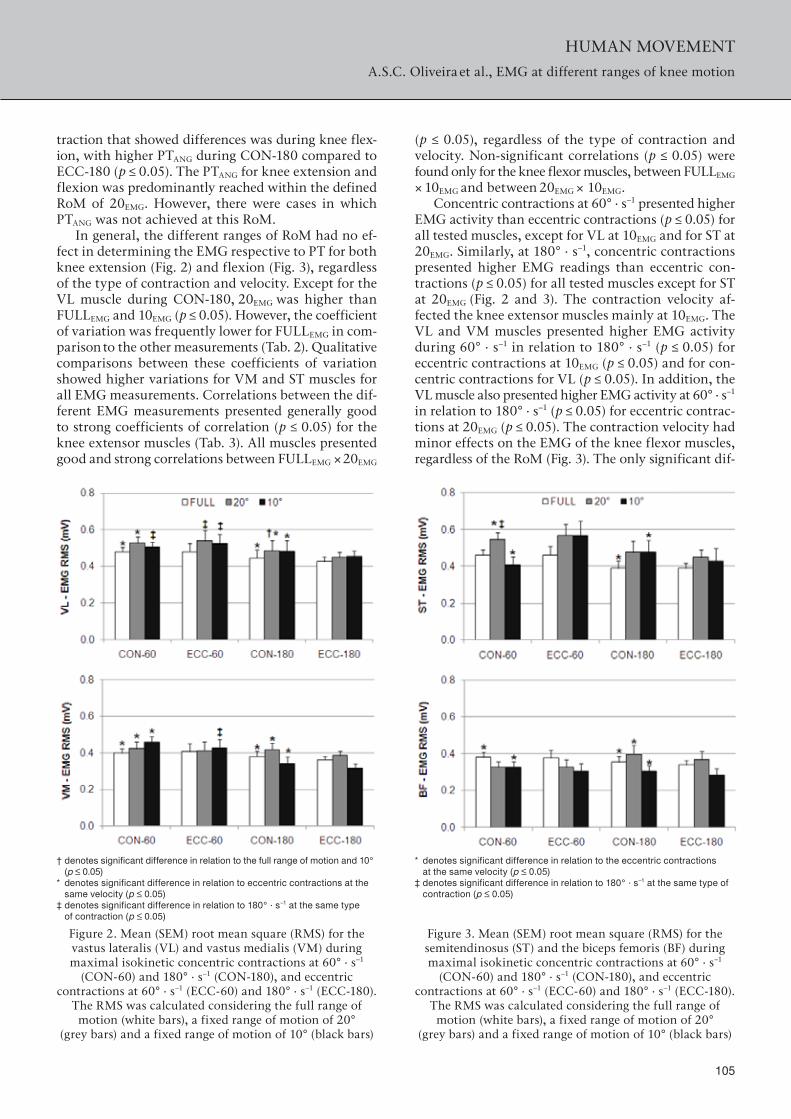
In general, the different ranges of RoM had no ef-fect in determining the EMG respective to PT for both knee extension (Fig. 2) and flexion (Fig. 3), regardless of the type of contraction and velocity. Except for the VL muscle during CON-180, 20EMG was higher than FULLEMG and 10EMG (p 0.05). However, the coefficient of variation was frequently lower for FULLEMG in com-parison to the other measurements (Tab. 2). Qualitative comparisons between these coefficients of variation showed higher variations for VM and ST muscles for all EMG measurements. Correlations between the dif-ferent EMG measurements presented generally good to strong coefficients of correlation (p 0.05) for the knee extensor muscles (Tab. 3). All muscles presented good and strong correlations between FULLEMG × 20EMG
† denotes significant difference in relation to the full range of motion and 10° (p 0.05)
* denotes significant difference in relation to eccentric contractions at the same velocity (p 0.05)
‡ denotes significant difference in relation to 180° · s–1 at the same type of contraction (p 0.05)
Figure 2. Mean (SEM) root mean square (RMS) for the vastus lateralis (VL) and vastus medialis (VM) during maximal isokinetic concentric contractions at 60° · s–1
(CON-60) and 180° · s–1 (CON-180), and eccentric contractions at 60° · s–1 (ECC-60) and 180° · s–1 (ECC-180).
The RMS was calculated considering the full range of motion (white bars), a fixed range of motion of 20°
(grey bars) and a fixed range of motion of 10° (black bars)
(p 0.05), regardless of the type of contraction and velocity. Non-significant correlations (p 0.05) were found only for the knee flexor muscles, between FULLEMG × 10EMG and between 20EMG × 10EMG.
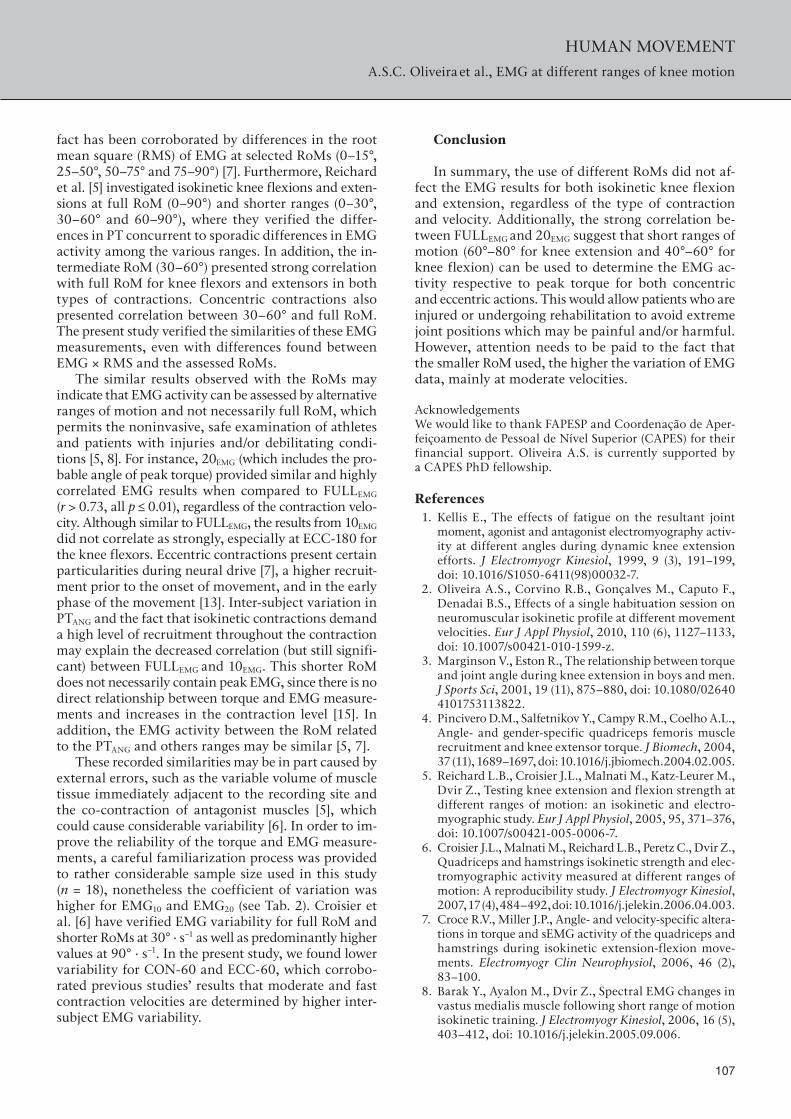
Concentric contractions at 60° · s–1 presented higher EMG activity than eccentric contractions (p 0.05) for all tested muscles, except for VL at 10EMG and for ST at 20EMG. Similarly, at 180° · s–1, concentric contractions presented higher EMG readings than eccentric con-tractions (p 0.05) for all tested muscles except for ST at 20EMG (Fig. 2 and 3). The contraction velocity af-fected the knee extensor muscles mainly at 10EMG. The VL and VM muscles presented higher EMG activity during 60° · s–1 in relation to 180° · s–1 (p 0.05) for eccentric contractions at 10EMG (p 0.05) and for con-centric contractions for VL (p 0.05). In addition, the VL muscle also presented higher EMG activity at 60° · s–1 in relation to 180° · s–1 (p 0.05) for eccentric contrac-tions at 20EMG (p 0.05). The contraction velocity had minor effects on the EMG of the knee flexor muscles, regardless of the RoM (Fig. 3). The only significant dif-
* denotes significant difference in relation to the eccentric contractions at the same velocity (p 0.05)
‡ denotes significant difference in relation to 180° · s–1 at the same type of contraction (p 0.05)
Figure 3. Mean (SEM) root mean square (RMS) for the semitendinosus (ST) and the biceps femoris (BF) during maximal isokinetic concentric contractions at 60° · s–1
(CON-60) and 180° · s–1 (CON-180), and eccentric contractions at 60° · s–1 (ECC-60) and 180° · s–1 (ECC-180).
The RMS was calculated considering the full range of motion (white bars), a fixed range of motion of 20°
(grey bars) and a fixed range of motion of 10° (black bars)

A.S.C. Oliveira et al., EMG at different ranges of knee motion
106
HUMAN MOVEMENT
ference was for the ST during concentric contractions at FULLEMG.
Discussion
The purpose of this study was to compare EMG ac-tivity at three different ranges of motion: (1) the more commonly used full range of motion, (2) at a fixed RoM of 20° at the point where PT is present (20EMG), and (3) at a fixed RoM of 10° around the point where PT was found (10EMG). We expected some differences in EMG due to the changes in the RoM. For instance, if the PTANG is found at 55° of knee extension, the EMG related to PTANG is not included for 20EMG (between 60° to 80°). This fact could cause differences between mea-surements, especially in relation to 10EMG, which always contains the EMG for PTANG (within a range of 5° below and 5° above peak torque). Contrary to our first hy-pothesis, no substantial differences were found among FULLEMG, 20EMG and 10EMG except for only one meas-urement (see Results). In this way, the EMG respective to the peak torque produced during isokinetic contrac-tions may be successfully obtained regardless of the RoM used, although caution needs to be exercised with res-pect to data variability.
In general, the subjects presented their PTANG within the range that had been verified in previous studies [7]
and concurrent to the results expected for such torque measurements. These expected results include higher PT during eccentric contractions, higher PT under lower velocity during concentric knee extension [7, 10], and minimal effects of both contraction type and velocity on PTANG [12]. However, ECC-180 presented higher variability, caused in part by the complexity of per-forming faster isokinetic actions even after extensive familiarization procedures [5]. Therefore, avoiding the use of full RoM for eccentric contractions might provide less reliable results since the variability is not only higher but the probability that a given patient produces PT outside this range is also high. However, further inves-tigation is needed to confirm this theory.
Higher EMG activity during concentric contractions is related to reduced input to the motor cortex and/or increases in peripheral facilitation during eccentric con-tractions [12, 13]. In the same way, as was previously verified [2, 14], there were minimal changes in EMG related to movement velocity. This issue as of yet has no consensus in the literature on the subject, primarily because of the wide range of studied velocities [7].
With respect to the effects of RoM on EMG, motor unit recruitment is increasingly impaired as it reaches more extreme RoM positions (excessive flexion or ex-tension), where EMG activity is decreased in order to protect the knee joint against high toque [4, 7]. This
Table 2. Coefficient of variation (CV) of the root mean square (RMS) for the vastus lateralis (VL), vastus medialis (VM), semitendinosus (ST) and biceps femoris (BF) during maximal isokinetic concentric contractions at 60° · s–1 (CON-60)
and 180° · s–1 (CON-180), and eccentric contractions at 60° · s–1 (ECC-60) and 180° · s–1 (ECC-180). The RMS was calculated considering the full range of motion (F), a fixed range of motion of 20° (20°) and a fixed range of motion of 10° (10°)
VL VM ST BF
F 20° 10° F 20° 10° F 20° 10° F 20° 10°
CON-60 23% 28% 21% 39% 43% 43% 45% 45% 52% 25% 25% 24%EXC-60 25% 38% 30% 48% 51% 46% 31% 36% 43% 22% 23% 31%CON-180 25% 29% 45% 41% 44% 58% 45% 55% 59% 30% 38% 57%EXC-180 28% 39% 38% 46% 52% 60% 39% 51% 40% 29% 53% 46%
Table 3. Pearson’s correlation coefficient (r) for EMG RMS of the vastus lateralis, vastus medialis, semitendinosus and biceps femoris muscles during maximal isokinetic concentric contractions at 60° · s–1 (CON-60) and 180° · s–1 (CON-180), and
eccentric contractions at 60° · s–1 (ECC-60) and 180° · s–1 (ECC-180). The correlation coefficient was calculated between the full range of motion and a fixed range of motion of 20° (F × 20°), between the full range of motion and a fixed range of motion of 10° (F × 10°) and between a fixed range of motion of 20° and a fixed range of motion of 10° (10° × 20°)
Vastus lateralis Vastus medialis Semitendinosus Biceps femoris
F ×
20°
F ×
10°
20°
× 10
°
F ×
20°
F ×
10°
20°
× 10
°
F ×
20°
F ×
10°
20°
× 10
°
F ×
20°
F ×
10°
20°
× 10
°
CON-60 0.87* 0.72* 0.59* 0.76* 0.84* 0.69* 0.77* 0.38 0.34 0.74* 0.39 0.55*ECC-60 0.98* 0.98* 0.96* 0.87* 0.92* 0.80* 0.94* 0.61* 0.73* 0.76* 0.74* 0.69*CON-180 0.97* 0.92* 0.92* 0.88* 0.69* 0.85* 0.96* 0.61* 0.71* 0.87* 0.45 0.52†
ECC-180 0.73* 0.77* 0.89* 0.75* 0.66* 0.56† 0.83* 0.45 0.42 0.82* 0.25 0.05
† denotes significance at p 0.05, * denotes non-significant correlation at p 0.01
A.S.C. Oliveira et al., EMG at different ranges of knee motion
107
HUMAN MOVEMENT
fact has been corroborated by differences in the root mean square (RMS) of EMG at selected RoMs (0–15°, 25–50°, 50–75° and 75–90°) [7]. Furthermore, Reichard et al. [5] investigated isokinetic knee flexions and exten-sions at full RoM (0–90°) and shorter ranges (0–30°, 30–60° and 60–90°), where they verified the differ-ences in PT concurrent to sporadic differences in EMG activity among the various ranges. In addition, the in-termediate RoM (30–60°) presented strong correlation with full RoM for knee flexors and extensors in both types of contractions. Concentric contractions also presented correlation between 30–60° and full RoM. The present study verified the similarities of these EMG measurements, even with differences found between EMG × RMS and the assessed RoMs.
The similar results observed with the RoMs may indicate that EMG activity can be assessed by alternative ranges of motion and not necessarily full RoM, which permits the noninvasive, safe examination of athletes and patients with injuries and/or debilitating condi-tions [5, 8]. For instance, 20EMG (which includes the pro-bable angle of peak torque) provided similar and highly correlated EMG results when compared to FULLEMG (r > 0.73, all p 0.01), regardless of the contraction velo-city. Although similar to FULLEMG, the results from 10EMG did not correlate as strongly, especially at ECC-180 for the knee flexors. Eccentric contractions present certain particularities during neural drive [7], a higher recruit-ment prior to the onset of movement, and in the early phase of the movement [13]. Inter-subject variation in PTANG and the fact that isokinetic contractions demand a high level of recruitment throughout the contraction may explain the decreased correlation (but still signifi-cant) between FULLEMG and 10EMG. This shorter RoM does not necessarily contain peak EMG, since there is no direct relationship between torque and EMG measure-ments and increases in the contraction level [15]. In addition, the EMG activity between the RoM related to the PTANG and others ranges may be similar [5, 7].
These recorded similarities may be in part caused by external errors, such as the variable volume of muscle tissue immediately adjacent to the recording site and the co-contraction of antagonist muscles [5], which could cause considerable variability [6]. In order to im-prove the reliability of the torque and EMG measure-ments, a careful familiarization process was provided to rather considerable sample size used in this study (n = 18), nonetheless the coefficient of variation was higher for EMG10 and EMG20 (see Tab. 2). Croisier et al. [6] have verified EMG variability for full RoM and shorter RoMs at 30° · s–1 as well as predominantly higher values at 90° · s–1. In the present study, we found lower variability for CON-60 and ECC-60, which corrobo-rated previous studies’ results that moderate and fast contraction velocities are determined by higher inter-subject EMG variability.
Conclusion
In summary, the use of different RoMs did not af-fect the EMG results for both isokinetic knee flexion and extension, regardless of the type of contraction and velocity. Additionally, the strong correlation be-tween FULLEMG and 20EMG suggest that short ranges of motion (60°–80° for knee extension and 40°–60° for knee flexion) can be used to determine the EMG ac-tivity respective to peak torque for both concentric and eccentric actions. This would allow patients who are injured or undergoing rehabilitation to avoid extreme joint positions which may be painful and/or harmful. However, attention needs to be paid to the fact that the smaller RoM used, the higher the variation of EMG data, mainly at moderate velocities.
AcknowledgementsWe would like to thank FAPESP and Coordenação de Aper-feiçoamento de Pessoal de Nível Superior (CAPES) for their financial support. Oliveira A.S. is currently supported by a CAPES PhD fellowship.
References1. Kellis E., The effects of fatigue on the resultant joint
moment, agonist and antagonist electromyography activ-ity at different angles during dynamic knee extension efforts. J Electromyogr Kinesiol, 1999, 9 (3), 191–199, doi: 10.1016/S1050-6411(98)00032-7.
2. Oliveira A.S., Corvino R.B., Gonçalves M., Caputo F., Denadai B.S., Effects of a single habituation session on neuromuscular isokinetic profile at different movement velocities. Eur J Appl Physiol, 2010, 110 (6), 1127–1133, doi: 10.1007/s00421-010-1599-z.
3. Marginson V., Eston R., The relationship between torque and joint angle during knee extension in boys and men. J Sports Sci, 2001, 19 (11), 875–880, doi: 10.1080/02640 4101753113822.
4. Pincivero D.M., Salfetnikov Y., Campy R.M., Coelho A.L., Angle- and gender-specific quadriceps femoris muscle recruitment and knee extensor torque. J Biomech, 2004, 37 (11), 1689–1697, doi: 10.1016/j.jbiomech.2004.02.005.
5. Reichard L.B., Croisier J.L., Malnati M., Katz-Leurer M., Dvir Z., Testing knee extension and flexion strength at different ranges of motion: an isokinetic and electro-myographic study. Eur J Appl Physiol, 2005, 95, 371–376, doi: 10.1007/s00421-005-0006-7.
6. Croisier J.L., Malnati M., Reichard L.B., Peretz C., Dvir Z., Quadriceps and hamstrings isokinetic strength and elec-tromyographic activity measured at different ranges of motion: A reproducibility study. J Electromyogr Kinesiol, 2007, 17 (4), 484–492, doi: 10.1016/j.jelekin.2006.04.003.
7. Croce R.V., Miller J.P., Angle- and velocity-specific altera-tions in torque and sEMG activity of the quadriceps and hamstrings during isokinetic extension-flexion move-ments. Electromyogr Clin Neurophysiol, 2006, 46 (2), 83–100.
8. Barak Y., Ayalon M., Dvir Z., Spectral EMG changes in vastus medialis muscle following short range of motion isokinetic training. J Electromyogr Kinesiol, 2006, 16 (5), 403–412, doi: 10.1016/j.jelekin.2005.09.006.

A.S.C. Oliveira et al., EMG at different ranges of knee motion
108
HUMAN MOVEMENT
9. Michaut A., Babault N., Pousson M., Specific effects of eccentric training on muscular fatigability. Int J Sports Med, 2004, 25 (4), 278–283, doi: 10.1055/s-2004-819940.
10. Oliveira Ade S., Caputo F., Gonçalves M., Denadai B.S., Heavy-intensity aerobic exercise affects the isokinetic torque and functional but not conventional hamstrings: quadriceps ratios. J Electromyogr Kinesiol, 2009, 19 (6), 1079-1084, doi: 10.1016/j.jelekin.2008.10.005.
11. Hermens H.J., Feriks B., Merletti R., European recom-mendations for surface electromyography. The Nether-lands: Roessingh Research and Development; 1999.
12. Duchateau J., Enoka R.M., Neural control of shortening and lengthening contractions: influence of tasks con-straints. J Physiol, 2008, 586, 5853–5864, doi: 10.1113/jphysiol.2008.160747.
13. Grabiner M.D., Owings T.M., EMG differences between concentric and ecccentric maximum voluntary contrac-tions are evident prior the movement onset. Exp Brain Res, 2002, 145 (4), 505–511, doi: 10.1007/s00221-002-1129-2.
14. Kellis E., Baltzopoulos V., Agonist and antagonist mo-ment and EMG-angle relationship during isokinetic ec-centric and concentric exercise. Isok Exerc Sci, 1996, 6 (2), 79–87.
15. Ricard M.D., Ugrinowitsch C., Parcell A.C., Hilton S., Rubley M.D., Sawyer R., Poole C.R., Effects of rate of force development on EMG amplitude and frequency. Int J Sports Med, 2005, 26 (1), 66–70, doi: 10.1055/s-2004 -817856.
Paper received by the Editors: March 17, 2011Paper accepted for publication: December 5, 2011
Correspondence address
Benedito S. DenadaiHuman Performance Laboratory UNESP. Av. 24 A, 1515, Bela Vista – Rio Claro – SP – Brazil – CEP – 13506-900e-mail: [email protected]
Copyright © 2022 FDOKUMEN