
Shorter latencies for motion trajectories than for flashes in population responses of cat primary...
12
J Physiol 556.3 (2004) pp 971–982 971 Shorter latencies for motion trajectories than for flashes in population responses of cat primary visual cortex Dirk Jancke 1,2 , Wolfram Erlhagen 1,3 , Gregor Sch¨ oner 1 and Hubert R. Dinse 1 1 Institut f¨ ur Neuroinformatik ND 04, Theoretische Biologie, Ruhr-Universit¨ at Bochum, D-44780 Bochum, Germany 2 Lehrstuhl f¨ ur Allgemeine Zoologie und Neurobiologie ND 7, Ruhr-Universit¨ at Bochum, D-44780 Bochum, Germany 3 Departamento de Matem´ atica para C&T, Universidade do Minho, P-4800-058-Guimar˜ aes, Portugal Psychophysical evidence in humans indicates that localization is different for stationary flashed and coherently moving objects. To address how the primary visual cortex represents object position we used a population approach that pools spiking activity of many neurones in cat area 17. In response to flashed stationary squares (0.4 deg) we obtained localized activity distributions in visual field coordinates, which we referred to as profiles across a ‘population receptive field’ (PRF). We here show how motion trajectories can be derived from activity across the PRF and how the representation of moving and flashed stimuli differs in position. We found that motion was represented by peaks of population activity that followed the stimulus with a speed-dependent lag. However, time-to-peak latencies were shorter by ∼16 ms compared to the population responses to stationary flashes. In addition, motion representation showed a directional bias, as latencies were more reduced for peripheral-to-central motion compared to the opposite direction. We suggest that a moving stimulus provides ‘preactivation’ that allows more rapid processing than for a single flash event. (Received 28 November 2003; accepted after revision 19 February 2004; first published online 20 February 2004) Corresponding author D. Jancke: Lehrstuhl f¨ ur Allgemeine Zoologie und Neurobiologie, ND 7, Ruhr-Universit¨ at Bochum, D-44780 Bochum, Germany. Email: [email protected] It takes some tens of milliseconds for visual information to reach the cortex. During that time, an approaching object might have moved several meters. Inevitably, mislocalization results unless compensational processes counterbalance for neural processing times. In fact, anticipatory mechanisms have been reported to occur already at the level of retinal ganglion cells (Berry et al. 1999). Psychophysically, a moving and a flashed stimulus presented aligned are perceived as being displaced. Surprisingly, the moving stimulus appears ahead of the flash (Hazelhoff & Wiersma, 1924). One explanation for this ‘flash-lag’ effect is that the visual system is pre- dictive by extrapolating the position of a moving stimulus into the future (Nijhawan, 1994). Alternatively, the ‘latency difference’ model assumes that the visual system processes moving objects ‘on-line’ but more rapidly than flashed objects (Purushothaman et al. 1999; Kirschfeld & Kammer, 1999; Whitney et al. 2000; for review and other explanations see Krekelberg & Lappe, 2001). In none of those studies, however, were neurophysiological correlates examined. In order to measure neurophysiological representations of flashed or moving stimuli we applied a population approach in the visual cortex that extracts the ‘quantity’ position from highly overlapping receptive fields (RFs) of many neurones. Their joint activity in response to a fixed set of stimuli was pooled, resulting in fine-scaled distributions of population activity both in visual space and time. Our concept is a straightforward consequence of the observation that a large number of broadly tuned neurones are activated, after even the simplest form of sensory stimulation or motor output. In addition, under natural viewing conditions stimuli are arbitrarily distributed across many RFs with highly diverse spatio-temporal properties (Szulborski & Palmer, 1990; Gegenfurtner & Hawken, 1996; Fitzpatrick, 2000; Dinse & Jancke, 2001a,b; for a similar approach in the somatosensory system see Nicolelis et al. 1998). We have previously demonstrated that the population approach can provide insight into neural interactions in response to small flashes presented with distances much less than average RF sizes (Jancke et al. 1999), and into mechanisms of multidimensional coding (Jancke, 2000). Here we used this technique to study how motion trajectories are presented at the level of primary visual cortex and how the representation of moving stimuli C The Physiological Society 2004 DOI: 10.1113/jphysiol.2003.058941
-
Upload
independent -
Category
Documents
-
view
0 -
download
0
Transcript of Shorter latencies for motion trajectories than for flashes in population responses of cat primary...

J Physiol 556.3 (2004) pp 971–982 971
Shorter latencies for motion trajectories than for flashesin population responses of cat primary visual cortex
Dirk Jancke1,2, Wolfram Erlhagen1,3, Gregor Schoner1 and Hubert R. Dinse1
1Institut fur Neuroinformatik ND 04, Theoretische Biologie, Ruhr-Universitat Bochum, D-44780 Bochum, Germany2Lehrstuhl fur Allgemeine Zoologie und Neurobiologie ND 7, Ruhr-Universitat Bochum, D-44780 Bochum, Germany3Departamento de Matematica para C&T, Universidade do Minho, P-4800-058-Guimaraes, Portugal
Psychophysical evidence in humans indicates that localization is different for stationary flashedand coherently moving objects. To address how the primary visual cortex represents objectposition we used a population approach that pools spiking activity of many neurones in catarea 17. In response to flashed stationary squares (0.4 deg) we obtained localized activitydistributions in visual field coordinates, which we referred to as profiles across a ‘populationreceptive field’ (PRF). We here show how motion trajectories can be derived from activity acrossthe PRF and how the representation of moving and flashed stimuli differs in position. We foundthat motion was represented by peaks of population activity that followed the stimulus witha speed-dependent lag. However, time-to-peak latencies were shorter by ∼16 ms compared tothe population responses to stationary flashes. In addition, motion representation showed adirectional bias, as latencies were more reduced for peripheral-to-central motion compared tothe opposite direction. We suggest that a moving stimulus provides ‘preactivation’ that allowsmore rapid processing than for a single flash event.
(Received 28 November 2003; accepted after revision 19 February 2004; first published online 20 February 2004)Corresponding author D. Jancke: Lehrstuhl fur Allgemeine Zoologie und Neurobiologie, ND 7, Ruhr-UniversitatBochum, D-44780 Bochum, Germany. Email: [email protected]
It takes some tens of milliseconds for visual informationto reach the cortex. During that time, an approachingobject might have moved several meters. Inevitably,mislocalization results unless compensational processescounterbalance for neural processing times. In fact,anticipatory mechanisms have been reported to occuralready at the level of retinal ganglion cells (Berry et al.1999). Psychophysically, a moving and a flashed stimuluspresented aligned are perceived as being displaced.Surprisingly, the moving stimulus appears ahead of theflash (Hazelhoff & Wiersma, 1924). One explanation forthis ‘flash-lag’ effect is that the visual system is pre-dictive by extrapolating the position of a moving stimulusinto the future (Nijhawan, 1994). Alternatively, the‘latency difference’ model assumes that the visual systemprocesses moving objects ‘on-line’ but more rapidly thanflashed objects (Purushothaman et al. 1999; Kirschfeld &Kammer, 1999; Whitney et al. 2000; for review and otherexplanations see Krekelberg & Lappe, 2001). In none ofthose studies, however, were neurophysiological correlatesexamined.
In order to measure neurophysiological representationsof flashed or moving stimuli we applied a population
approach in the visual cortex that extracts the ‘quantity’position from highly overlapping receptive fields (RFs)of many neurones. Their joint activity in responseto a fixed set of stimuli was pooled, resulting infine-scaled distributions of population activity both invisual space and time. Our concept is a straightforwardconsequence of the observation that a large numberof broadly tuned neurones are activated, after even thesimplest form of sensory stimulation or motor output.In addition, under natural viewing conditions stimuliare arbitrarily distributed across many RFs with highlydiverse spatio-temporal properties (Szulborski & Palmer,1990; Gegenfurtner & Hawken, 1996; Fitzpatrick, 2000;Dinse & Jancke, 2001a,b; for a similar approach in thesomatosensory system see Nicolelis et al. 1998).
We have previously demonstrated that the populationapproach can provide insight into neural interactionsin response to small flashes presented with distancesmuch less than average RF sizes (Jancke et al. 1999),and into mechanisms of multidimensional coding (Jancke,2000). Here we used this technique to study how motiontrajectories are presented at the level of primary visualcortex and how the representation of moving stimuli
C© The Physiological Society 2004 DOI: 10.1113/jphysiol.2003.058941

972 D. Jancke and others J Physiol 556.3
deviates from that of single flashes (Jancke et al. 1996). Weanalysed population activity in response to small squaresof light (0.4 deg) that were flashed or moved at differentspeeds and directions.
We show that in cat area 17 small moving stimuli arerepresented as propagating peaks of population activity.When compared to the representation of a flash, we founda significant reduction in time-to-peak latencies of thepopulation responses. Reduced neural latencies mightcontribute to the perceived positional lead of a movingstimulus compared to a flash, as shown psychophysicallyin humans.
Methods
Animals and preparation
Extracellular recordings from a total of 178 cells weremade in the central visual field representation of catarea 17. Neurones of the left hemisphere of anaesthetizedcats were recorded as previously described (Jancke et al.1999). Twenty adult animals of both sexes were used.Animals were initially anaesthetized with Ketanest (15 mg(kg body weight)−1, i.m., Parke-Davis) and Rompun(1 mg kg−1, i.m., Bayer, Germany). Additionally, Atropin(0.1 mg kg−1, s.c., Braun, Germany) was given. Duringsurgery and recording, anaesthesia was maintained byartificial respiration with a mixture of 75% N2O and25% O2, and by application of sodium pentobarbital(Nembutal, 3 mg kg−1 h−1, i.v., Ceva, Germany). Neuro-muscular block was established by continuous infusionsof gallamine triethiodide (2 mg kg−1, i.v. bolus, 2 mg kg−1
h−1, i.v., Sigma). In addition 5% glucose in physio-logical Ringer solution was continuously infused (3 mlh−1, Braun, Germany). Heart rate, intratracheal pressure,expired CO2, body temperature, and EEG were controlledduring the entire experiment. Respiration was adjusted foran end-tidal CO2 between 3.5 and 4.0%. Contact lenseswith artificial pupils were used to cover the eyes. Pupilswere dilated by atropine (5 mg ml−1), and nictitatingmembranes retracted by noradrenaline (norepinephrine;Neosynephrin-POS, 50 mg ml−1, Ursapharm, Germany).Treatment of all animals was within the regulations ofthe National Institution of Health Guide and Care forUse of Laboratory Animals (Rev. 1987). At the end ofthe experiments, animals were killed with an overdose ofsodium pentobarbital. All experiments were approved bythe German Animal Care and Use Committee.
Recording and stimulation
Stimuli were displayed on a PC-controlled 21-inchmonitor (120 Hz, non-interlaced) positioned at a distance
of 114 cm from the animal. Luminance of stimulationwas 0.9 cd m−2, background luminance was 0.002 cdm−2. Stimuli were repeated 32 times in pseudo-randomorder and presented to the contralateral eye. Stimuli werepresented within a fixed reference frame, irrespective ofthe receptive field (RF) location of the individual neuro-nes (non-RF-centred approach illustrated in Fig. 1A).To control for eye drift, RF locations were repeatedlymeasured during each recording session. Seven flashedsquares of light (0.4 deg) were used to sample 2.8 deg ofvisual space (Fig. 1A and B). Additionally, squares weremoved horizontally either centro-peripherally or in theopposite direction (Fig. 1C). Smooth trajectories weregenerated by varying the stimulus shift per video frameresulting in different speeds (4.5, 8.8, 15.1, 38.4 deg s−1,length of trajectory was 9.2 deg).
We pooled 178 single cell responses whose receptivefields (RFs) densely covered the central visual fieldrepresentation of cat area 17 (Fig. 1A). Our approachenables us (1) to average activity across a neural populationwith high spatial and temporal resolution, (2) to includecells with different tuning properties, and (3) to measureactivity independently of the individual cell’s RF locationrelative to the stimulus (non-centred approach). To depictthe population activity of these neurones, two differentcoding techniques were used (described below).
RF-derived population representations of stimulusposition
We first applied a population code consisting of an inter-polation procedure in which each cell ‘votes’ with itsfiring rate for the centre of the RF. The RF centres werequantitatively assessed for each cell separately by flashingsmall dots of light (diameter 0.64 deg) in pseudo-randomorder (20 times) for 25 ms (ISI 1000 ms) on 36 locations ofa six by six grid. The resulting RF profiles were smoothedand the RF centre was defined at the location of maximalamplitude (Jancke et al. 1999).
In the next step, population representations of theflashed or moved stimuli presented in a fixed referenceframe (Fig. 1B and C) were derived. To this end, eachcell’s normalized firing rate in response to the stimuliwas mapped to each individual RF centre, resulting in adistribution of activity. The responses were then inter-polated with a Gaussian (width = 0.6 deg; to correctfor uneven sampling, the distribution was divided bythe sum of unweighted Gaussians centred on all RFcentres). In summary, each neurone contributes to theentire population activity by its firing rate (1 ms timeresolution), which is dependent on the location of the RFcentre relative to the stimulus.
C© The Physiological Society 2004

J Physiol 556.3 Population coding of position in visual cortex 973
OLE-derived population representations of stimulusposition
As an alternative to this RF-derived procedure weemployed an optimal linear estimator (OLE) technique toreconstruct stimulus position from the observed neuronalpopulation activity. This technique, originally developedto estimate a single value of an encoded physical quantity(Salinas & Abbott, 1994), is based on a Bayesian theoreticalframework (Dayan & Abbott, 2001). We used an extensionof this method (Erlhagen et al. 1999; Jancke et al.1999; Jancke, 2000) that enabled us to estimate entiredistributions of population activity across visual space.
The method is based on two ideas. First, the populationdistribution is generated as a linear superposition ofa set of basis functions, one such function for eachneurone. Each neurone’s basis function is multiplied bythe current firing rate of the neurone. Second, for theset of seven joint reference stimuli (Fig. 1B), a templatefunction for the distribution of population activity wasdefined as a Gaussian centred at each of the sevenstimulus positions. Its width (0.6 deg) in visual spaceapproximately matched the average RF profile of allneurones measured. A systematic variation of the widthparameter showed that the reconstruction results didnot critically depend on the exact shape of the templatedistribution. The basis function each neurone contributeswas determined so that for the seven reference stimuli thereconstructed population distribution approximated thetemplate functions optimally. For this optimization, meanfiring rates within the time interval from 40 to 65 ms afterstimulus onset were used. This is the time for which peakresponses are observed in the PSTHs. The exact size ofthe integration window is not critical for the estimationprocedure.
To extend the estimation procedure beyond the sevenreference stimuli to the moving stimulus condition, thebasis function that each neurone contributes was heldfixed, but was now multiplied by the firing rate of thatneurone in response to a stimulus moving with a particularvelocity. The firing rate was determined in 10 ms bins toobtain time-resolved population representations.
Cumulative post-stimulus-time histograms (PSTHs)
Cumulative PSTHs in response to flashed or movingstimuli were obtained by averaging spiking activity acrossall neurones in time bins of 10 ms. A cell was judged assignificantly active when its firing rate was higher thanthe mean + 2 s.d. of activity revealed in a no-stimuluscondition (recording period 2 s).
Figure 1. Schematic illustration of the stimulus configurationsA, 178 neurones were recorded within the central visual fieldrepresentation of cat area 17. Their receptive fields (RFs, a smallrepresentative sample is illustrated by grey ellipsoids) denselyoverlapped within the sampled visual space, which is denoted as‘population receptive field’ (PRF). B, small squares of light 0.4 ×0.4 deg (depicted in black) were flashed for 25 ms at seven differentcontiguous horizontal positions across the PRF. Neural responses toeach of the squares were used to calculate the individual cell weightsby optimal linear estimation (OLE). C, squares were moved horizontallyat four different speeds (4.5, 8.8, 15.1, 38.4 deg s−1) eithercentro-peripherally or in opposite direction (arrows). Stimuli startedand ended 3.2 deg outside the sampled central visual space resultingin a trajectory of 9.2 deg.
C© The Physiological Society 2004
974 D. Jancke and others J Physiol 556.3
Bootstrap analysis
To investigate how critically the results depend on thecurrent sampling of neurones across visual space, weperformed a bootstrap analysis. One thousand iterationswere generated, each equal in size to the total number of allcells measured, by drawing neurones (with replacements)from the original data set. For each such ‘synthetic’ set ofneural populations the OLE, representing the populationresponses to each stimulus, was calculated.
Results
Population representations of moving and flashedstimuli show a spatial offset
We first applied a population approach based on inter-polation of many cell responses (Anderson, 1994; Janckeet al. 1999; see Berry et al. 1999 for a similar approach inthe retina). The resulting distributions of activity can beregarded as the profile of a population receptive field (PRF)in which each neurone contributes to the overall activityvia its RF location relative to stimulus position. Thus,flashing a stimulus at a specific site will predominantlyactivate neurones that have their RF centres close to thestimulus whereas neurones further away respond with
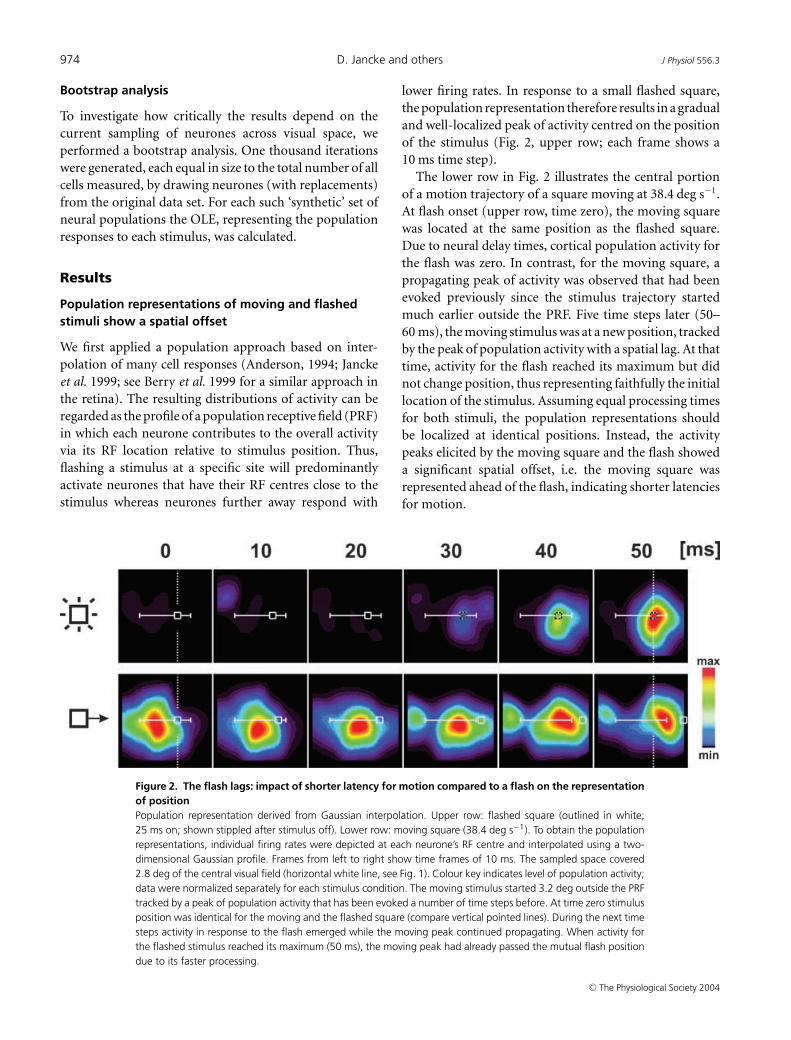
Figure 2. The flash lags: impact of shorter latency for motion compared to a flash on the representationof positionPopulation representation derived from Gaussian interpolation. Upper row: flashed square (outlined in white;25 ms on; shown stippled after stimulus off). Lower row: moving square (38.4 deg s−1). To obtain the populationrepresentations, individual firing rates were depicted at each neurone’s RF centre and interpolated using a two-dimensional Gaussian profile. Frames from left to right show time frames of 10 ms. The sampled space covered2.8 deg of the central visual field (horizontal white line, see Fig. 1). Colour key indicates level of population activity;data were normalized separately for each stimulus condition. The moving stimulus started 3.2 deg outside the PRFtracked by a peak of population activity that has been evoked a number of time steps before. At time zero stimulusposition was identical for the moving and the flashed square (compare vertical pointed lines). During the next timesteps activity in response to the flash emerged while the moving peak continued propagating. When activity forthe flashed stimulus reached its maximum (50 ms), the moving peak had already passed the mutual flash positiondue to its faster processing.
lower firing rates. In response to a small flashed square,the population representation therefore results in a gradualand well-localized peak of activity centred on the positionof the stimulus (Fig. 2, upper row; each frame shows a10 ms time step).
The lower row in Fig. 2 illustrates the central portionof a motion trajectory of a square moving at 38.4 deg s−1.At flash onset (upper row, time zero), the moving squarewas located at the same position as the flashed square.Due to neural delay times, cortical population activity forthe flash was zero. In contrast, for the moving square, apropagating peak of activity was observed that had beenevoked previously since the stimulus trajectory startedmuch earlier outside the PRF. Five time steps later (50–60 ms), the moving stimulus was at a new position, trackedby the peak of population activity with a spatial lag. At thattime, activity for the flash reached its maximum but didnot change position, thus representing faithfully the initiallocation of the stimulus. Assuming equal processing timesfor both stimuli, the population representations shouldbe localized at identical positions. Instead, the activitypeaks elicited by the moving square and the flash showeda significant spatial offset, i.e. the moving square wasrepresented ahead of the flash, indicating shorter latenciesfor motion.
C© The Physiological Society 2004

J Physiol 556.3 Population coding of position in visual cortex 975
Population representations of flashed stimuli
To show raw population data before employing any codingprocedure, Fig. 3A depicts the temporal evolution ofactivity in cumulative PSTHs (sum of activity across allneurones) for squares that were flashed at three adjoiningpositions (as shown in Fig. 3B). Firing rates for individualcells were 13–58 spikes s−1, which is within the rangetypically found for neurones in cat area 17 (Bishop et al.1971; Orban, 1984). Cumulative activity for more peri-pheral stimulus positions was slightly lower, due to thefact that less RFs were overlapping at the border thanwithin the central part of the sampled space. However, foreach stimulus position the number of cells contributingto the cumulative PSTHs was more than half of theentire population, even for the most peripheral stimuluspositions (∼90 cells; Fig. 3C), demonstrating the denseand homogeneous sampling.
In order to construct the PRF in a well-definedmathematical way, we applied an optimal linear estimator(OLE) (Salinas & Abbott, 1994; Erlhagen et al. 1999; Janckeet al. 1999; Jancke, 2000) that assigns to each neurone’sfiring a ‘weighting coefficient’ calculated by optimizing thecontribution of each neurone with respect to its relativeRF position. As a result, Fig. 3B depicts distributions ofpopulation activity with high precision in visual space.For each stimulus position, we observed a homogenousbuild-up and decay of activity accurately centred on thedifferent stimulus loci. Thus, all seven flashes used werefairly represented by 0.4 deg shifts of activity profiles acrossthe PRF (Fig. 3D). The mean time-to-peak latency acrossall squares was 54 ± 3 ms.
To test how critically the PRF profiles were dependenton the actual sample of neurones, we applied abootstrap analysis in which the population was repetitively(n = 1000) composed by ‘drawing’ 178 neurones withreplacements from the original data set. Figure 3D depictsthe distributions of activity for all seven squares withinthe time window of maximal discharge (50–60 ms). Theanalysis revealed that the OLE procedure guarantees aprecise decoding of the actual stimulus positions acrossthe entire sampled visual space. Furthermore, the observedscatter in amplitudes was not significantly dependent onthe actual sampling except for a small bias in response tothe most central stimulus.
Population representation of moving stimuli
To compare data from flashed stimuli with responses tomoving squares we first show cumulative PSTHs for allspeeds and for both directions (Fig. 4; blue = centro-
peripheral; red = periphero-central). Increasing speeds(top to bottom) evoked increasing amplitudes of theresponses. All moving stimuli recruited similar numbersof responding cells (see upper curves), thus the individualcell’s firing rates were enhanced with speed. For slow speeds(4.5, 8.8 deg s−1) the PSTHs show a moderate slope ofrising and decaying activity as it takes the stimulus longerto pass the PRF than for high speeds. In contrast, higherstimulus speeds (15.1, 38.4 deg s−1) induced more briskresponses and a second peak that occurred when thestimulus had already passed the PRF. Such a ‘rebound’response (Camarda et al. 1985) has recently been shownto contain information about stimulus orientation at thepopulation level (Jancke, 2000).
Second, to derive stimulus trajectories across thesampled PRF, we again applied the OLE procedureresulting in distributions of activity that unravel eachcell’s contribution to the current stimulus position. Forall speeds and both directions tested, Fig. 5 depicts space–time diagrams of population distributions within the timeintervals that revealed significant propagation of activity.The diagrams show coherent peaks of activity trackingeach moving stimulus across the PRF. We observed aspatial lag between the current stimulus position and theactivity peaks, which was dependent on speed and mostevident at high stimulus speeds (see red, blue lines atbottom). The profiles of the PRF showed some variabilityin response amplitudes and scatter in peak positions. Thesefluctuations were due to irregularities in cell sampling andof no significance (P > 0.05, bootstrap, n = 1000; seeSupplementary material, available online only). Thus, ourapproach allows for visualization of propagating activityon a fine spatial scale, resolving shifts of activity peaks in avisual space much smaller than RF sizes. Next, we exploitedthis outcome to derive latencies from the representationof moving stimuli.
Reduced latencies dependent on motion direction
In order to compare latencies evoked by a single flashwith the latencies for moving stimuli, we used the spatiallag method introduced by Bishop et al. (1971) for analysisof single cell latencies. This method uses the fact that thetime-to-peak of activity depends on stimulus speed: withincreasing speeds the stimulus passes longer distancesuntil the discharge peak is reached. However, as ourapproach produces continuous trajectories rather thanonly one single discharge peak we modified the originalmethod: for each iteration within a bootstrap analysis,we first determined the time interval within significantpropagation of peak activity occurred by calculating linear
C© The Physiological Society 2004

976 D. Jancke and others J Physiol 556.3
Figure 3. Population activity in response to squares flashed at different positionsA, time course of cumulative PSTHs (sum of spikes across all neurones) for squares flashed at three adjacentpositions as shown in B. Vertical lines mark time of maximum amplitude. Upper graphs visualize the numberof cells that showed significant activity (P < 0.05). All squares evoked similar latencies and firing rates, andinvolved similar numbers of cells, confirming the homogeneous sampling of visual space. B, space–time diagramsof OLE-derived population activity in response to the three flashed squares (black squares mark position, time onordinate). High spatial coherence of activity within the PRF can be seen reaching its maximum centred on eachstimulus position. Note that stimulus size (0.4 deg) was much smaller than the average RF size in area 17 (∼2deg, cf. Jancke et al. 1999). C, time course of the number of activated neurones in response to each of the sevensquares. Single bars represent the number of responding cells within a 10 ms time bin (each bar correspondsto a given stimulus position from left (central) to right (peripheral); cf. Fig. 1B. At time when activity reached itsmaximum (50–60 ms after stimulus onset) each stimulus was represented by activity of ∼90 neurones with denselyoverlapping RFs. D, bootstrap analysis. Shape and location of the PRF at time of peak maximum (50–60 ms) for allseven squares tested. A bootstrap analysis was applied to the OLE procedure (1000 iterations). Grey areas indicate99% confidence, curves show mean. Dashed horizontal line marks the mean of the amplitudes across all flashedsquares; continuous horizontal lines mark significance level (P < 0.05). Small fluctuations in amplitudes were ofnegligible significance (see arrow pointing to a slightly higher amplitude for the leftmost (central) stimulus). Eachsquare was fairly represented by the distribution of activity centred on the respective stimulus position.
C© The Physiological Society 2004

J Physiol 556.3 Population coding of position in visual cortex 977
regressions of the trajectories (under the constraint ofr > 0.98). We then measured the spatial lag between theactual maximum of the propagating peaks and the currentstimulus position. Finally, for all speeds and directions,the mean spatial lag was plotted as a function of stimulusspeed. As our data showed that the spatial lag increasedlinearly with stimulus speeds, the slope of the regressionlines directly corresponds to response latency of motion(Fig. 6).
The slope of the regressions revealed latencies of 38 msfor the peripheral–central (r = 0.99) and 42 ms (r =0.99) for central–peripheral direction. Thus the spatial lagwas significantly shorter than expected from time-to-peaklatencies in response to flashed stimulation (∼54 ms).
In addition to speed, the spatial lag was depended on thedirection of motion. For peripheral–central movementslatencies were significantly smaller compared to theopposite direction, particularly for higher speeds (P <
0.00001 for 38.4 and 15.1 deg s−1). With decreasingspeed, this asymmetry became less significant due to theincreasing positional scatter (P < 0.01 for 8.8 deg s−1; P> 0.05 for 4.5 deg s−1). For a slow speed of 4.5 deg s−1,the reduced latency for peripheral–central motion led to amatch between the peak of population activity and actualstimulus position as indicated by a spatial lag of nearlyzero.
Discussion
We showed that in cat primary visual cortex small movingsquares of light can be represented as propagating peaksof activity across a ‘population receptive field’. Latenciesfor motion were significantly shorter than expectedfrom the response to flashed stimuli, indicating reducedneural processing times. For slow peripheral–centralmovements (4.5 deg s−1) we observed compensation ofneural latencies. At higher speeds and for motion in theopposite direction, we found a spatial lag between themoving stimulus and its representing peak of populationactivity. This spatial lag increased with increasing stimulusspeeds.
On the single cell level, neural latencies have been shownto vary within a wide range of delay times. Generally,neurones that were sensitive to high stimulus speedswere also found to have short latencies for stationarylight bars (Duysens et al. 1982). Comparing responsesto flashed and moving slits of light, only a few cellsshowed reduced latencies (Bishop et al. 1971). A stimulusdark edge evoked responses in advance of the dischargecoming from the stimulus light edge (Bishop et al.1971, 1973). Also, LGN neurones were found to respond
Figure 4. Sum of spike rates (cumulative PSTHs) in response tosquares moving at different speedsMotion in centro-peripheral direction is outlined in blue, red curvesdepict peripheral–central direction (speeds indicated on top). Overallactivity increased with increasing stimulus speeds. Vertical interruptedlines show point in time when the stimulus entered and left thesampled space; vertical red and blue lines mark time period in whichsignificant propagation of activity was observed when applying theOLE procedure (cf. Fig. 5). Upper graphs show number of cellssignificantly active within each 10 ms time step. Note that similarnumbers of neurones were activated for all stimulus speeds.
C© The Physiological Society 2004

978 D. Jancke and others J Physiol 556.3
with shorter delays to moving than for flashed lightbars (Orban et al. 1985). Some of these controversialfindings may result from the relatively wide bin sizesused for analysis, which makes it difficult to detect smallchanges in latencies at the single cell level. Furthermore,the spatial-lag method is critically sensitive to responsevariability of single cells. The population approach usedhere, however, transforms the various spatio-temporaldynamics of single cell activity into homogeneous activitypatterns at the population level (Dinse & Jancke, 2001a),indicating a qualitative difference between microscopicand mesoscopic processing levels (Freeman, 2000). As aconsequence, the population approach permits the denseand fine-scaled analysis of activity trajectories across arepresentative neural population.
Figure 5. Motion trajectories across thepopulation receptive field (PRF)Space–time diagrams of activity representingsquares (shown in black) that moved withdifferent speeds and directions; arrowsindicate stimulus trajectories. Profiles werederived by OLE. x-axis depicts visual space indegrees, with zero indicating midpoint oftrajectories. Starting position of movementwas at ± 3.2 deg. The y-axis resolves 10 mstime steps within the time interval in whichpropagation of activity occurred. Activity wasnormalized for each speed separately. Thedifferent tilt angles of the space–time plotsarise from activity peaks matching stimulusspeed and direction. Red and blue lines in thebottom row sketch the spatial lag betweencurrent stimulus position and peak locationwithin the PRF.
Motion anticipation in V1: a novel achievement in therepresentation of stimulus position?
Judging correctly the location of moving objects is ofcrucial importance for evading obstacles or predators orfor catching prey. This task would be almost impossible,particularly for high speeds, if the relevant information isdelayed due to neural conduction and processing times.To overcome this problem, compensatory mechanismshave evolved that allow for anticipation of the path ofmotion.
Recently, it has been demonstrated that already at theretinal level a population of ganglion cells provides a firststep in the generation of anticipatory processes (Berryet al. 1999). These authors showed that a non-linear
C© The Physiological Society 2004

J Physiol 556.3 Population coding of position in visual cortex 979
contrast-gain control mechanism, together with spatiallyextended receptive fields and a biphasic temporal response,are prerequisites to accounting for the observed effects.Translating their data from millimetres of retina into visualfield coordinates (cf. Hughes, 1971; DeVries & Baylor,1997), the retinal compensatory mechanisms was limitedto stimulus speeds of approximately 5 deg s−1 which is inaccordance with our result for peripheral–central motiondirection. While we found a reduction of latencies up to40 deg s−1, latencies for this range of speeds have not beeninvestigated at the retinal level.
Directional asymmetry
In addition to the retinal data, our cortical data showedthat the reduction of latencies to moving stimuli dependson direction of motion. Directional asymmetries guidingthe optokinetic reflex have recently been found in monkeyareas V5/V5+ (Hoffmann et al. 2002) as well as forposition judgement tasks in human subjects (Musseler &Aschersleben, 1998): A small visual target which movesin the peripheral–central direction is perceived with alatency shorter than for the same target moving awayfrom the fovea (Mateeff & Hohnsbein, 1988; Mateeff et al.1991a,b). Single object motion, as applied in our study,may predominantly stimulate the so-called displacement-analysing system preferring foveopetal motion (opposedto a motion-analysing system that encodes ‘en masse’ dotmotion; Bonnet, 1984). Such a system was speculated toemphasize motion towards a centrally fixed target (Mateeffet al. 1991a).
Spatial asymmetries for representations of movingobjects might be the result of active mechanismscompensating neural delays for one direction on thecost of longer delays in the opposite direction (Jensen& Martin, 1980). van Beers et al. (2001) proposed anumber of putative mechanisms underlying differences inlocalization for foveopetal and foveofugal motion. Thesemechanisms include temporal asymmetries in neuraldelays, and a partial asymmetric spatial expansion of theretinal representation, both comparable to our findings.On the other hand, these authors provided evidence thatwhen shifting gaze, the central nervous system is ableto compensate for localization errors by sensorimotorintegration to maintain position constancy, maybe bytaking advantage of these internally generated erroneousposition signals.
Cellular mechanisms of preactivation
Long-range horizontal connections may constitute apossible substrate for preactivation as spreading sub-
threshold activity (Grinvald et al. 1994; Bringuier et al.1999) extends far beyond the classical RF (Allman et al.1985). Applying voltage-sensitive dye optical imagingin cat area 18, a method that emphasizes subthresholdsynaptic potentials (Grinvald et al. 1994), we recentlyshowed propagating waves of subthreshold activity inresponse to moving squares that covered large corticalregions ahead in time of the thalamic input (Janckeet al. 2004). In addition, using intracellular recordings incombination with a priming stimulus, reduced corticallatencies in the range reported here have been shownfor subthreshold response components (Hirsch et al.1998).
Extracellular recordings as employed in our studyprovide no information about the accompanying intra-cellular events. As a possible mechanism we suggestthat preactivation resulting from preceding stimulusdisplacements along the trajectory lead to an increasedprobability of firing action potentials when the stimulusmoves across the PRF. In terms of spike rates of singlecell RFs, such behaviour would cause an asymmetric
Figure 6. Calculation of latencies for moving stimuli: speeddependence of the spatial lagThe average spatial lag between the peak of population activity andthe actual position of the moving stimulus increased with stimulusspeeds. Data points show mean spatial lags for each speed anddirection (bootstrap, n = 1000). Blue squares indicatecentro-peripheral movement, red triangles indicate opposite direction(vertical blue and red lines sketch spatial lags for a speed of 38.4 degs−1 as shown in Fig. 4, bottom). Latencies were calculated by linearregression. Latency was 42 ms for centro-peripheral motion and 38 msfor peripheral-central direction. Significance of direction difference:∗∗P < 0.00001; ∗P < 0.01.
C© The Physiological Society 2004
980 D. Jancke and others J Physiol 556.3
enlargement of RF sizes. As a consequence, RFs are shiftedin the motion direction, causing neurones to respond withshorter latencies. Likewise, one might interpret such a shiftas a primarily spatial phenomenon: RF boundaries thatwere not responsive when mapped with flashed stimuli,become responsive when a stimulus moves, and RFs aretherefore ‘pulled’ towards a moving stimulus (Pulgarinet al. 2003).
Latency differences may contribute to the flash-lageffect
There is an extensive ongoing discussion about thenature of the psychophysically observed flash-lag effect(FLE), which has been studied under a large varietyof experimental designs (Metzger, 1932; MacKay, 1958;Nijhawan, 1994; Purushothaman et al. 1998; Krekelberg& Lappe, 1999; Kirschfeld & Kammer, 1999; Eagleman& Sejnowski, 2000; Krekelberg et al. 2000; Sheth et al.2000; Whitney et al. 2000; Krekelberg & Lappe, 2001).However, the neural substrates underlying this effectremain unknown.
The FLE has also been reported with no retinal motion,indicating that extra-retinal information can be usedto derive alternative motion information (Schlag et al.2000). Moreover, the FLE phenomenon not only appliesto motion, but to other dimensions as well, such as colour(Sheth et al. 2000). However, while not designed to mimic aparticular psychophysical experiment – our experimentalset-up corresponds to the traditional continuous motionprotocol (Hazelhoff & Wiersma, 1924) – the presenteddata revealed a ∼16 ms difference in latency between aflash and a moving stimulus, corresponding to a 30%reduction in processing time when the stimulus moves.For the FLE described by Eagleman & Sejnowski (2000),the stimulus moved at 360 deg s−1 rotation angle, leadingto a displacement of about 5 deg, which translates into adelay of 14 ms and is thus within the same range as found inour study. On the other hand, latency differences obtainedin various FLE paradigms commonly range between 40and 80 ms (Krekelberg & Lappe, 2001), most probablyinvolving additional mechanisms in downstream corticalareas. Furthermore, compensation for neural processingtimes must not necessarily be restricted to the perceptualdomain. It has recently been demonstrated that pointingmovements towards the final position of a moving targetwere directed beyond its vanishing point, suggestingthat for goal-directed tasks, sensorimotor integration iscritical for compensation of neural latencies (Kerzel &Gegenfurtner, 2003).
However, vision is not exclusively involved in theprocessing of time-critical stimulus characteristics. Inan earlier study we reported that after the horizontallymoving square has passed the PRF, population activitywas smeared out in space, producing a motion streak(Jancke, 2000). Subsequent to positional coding, this laterpart of the response (cf. Fig. 4) contained informationabout the orientation of the stimulus trajectory, i.e.activation was dominated by neurones tuned to horizontalorientation. This suggests that the primary visual cortexcodes orientation by integrating past stimulus positionsand thus conveys different stimulus aspects in differentmoments in time.
There is still not much knowledge about how timinginformation provided by visual cortical neurones maps toperception. Along the visual pathway various predictive(Nijhawan, 1994; Rao & Ballard, 1999) and integrativemechanisms (Krekelberg & Lappe, 1999; Eagleman &Sejnowski, 2000), from mechanisms in the retina (Berryet al. 1999) through to sensorimotor transformationmechanisms (Kerzel & Gegenfurtner, 2003), are involvedin motion processing. It remains an open question how therepresentation of moving stimuli in primary visual cortex,in particular its reduced response latencies as reportedhere, contribute to the processing of object position inthe higher brain.
References
Allman J, Miezin F & McGuiness E (1985). Stimulus specificresponses from beyond the classical receptive field:neurophysiological mechanisms for local-globalcomparisons in visual neurons. Annu Rev Neurosci 8,407–430.
Anderson CH (1994). Basic elements of biological computionalsystems. Int J Modern Physics C 5, 135–137.
Berry MJ II, Brivanlou IH, Jordan TA & Meister M (1999).Anticipation of moving stimuli by the retina. Nature 398,334–338.
Bishop PO, Coombs JS & Henry GH (1971). Responses tovisual contours: Spatio-temporal aspects of excitation in thereceptive fields of simple striate neurones. J Physiol 219,625–657.
Bishop PO, Coombs JS & Henry GH (1973). Receptive fields ofsimple cells in the cat striate cortex. J Physiol 231,31–60.
Bonnet C (1984). Two systems in the detection of visualmotion. Ophthalmic Physiol Opt 4, 61–65.
Bringuier V, Chavane F, Glaeser L & Fregnac Y (1999).Horizontal propagation of visual activity in the synapticintegration field of area 17 neurons. Science 283,695–699.
C© The Physiological Society 2004

J Physiol 556.3 Population coding of position in visual cortex 981
Camarda RM, Peterhans E & Bishop PO (1985). Simple cells incat striate cortex: responses to stationary flashing and tomoving light bars. Exp Brain Res 60, 151–158.
Dayan P & Abbott LF (2001). Theoretical Neuroscience:Computational and Mathematical Modeling of NeuralSystems. MIT Press, Cambridge, MA, USA.
DeVries SH & Baylor DA (1997). Mosaic arrangement ofganglion cell receptive fields in rabbit retina. J Neurophysiol78, 2048–2060.
Dinse HR & Jancke D (2001a). Time-variant processing in V1:From microscopic (single cell) to mesoscopic (population)levels. Trends Neurosci 24, 203–205.
Dinse HR & Jancke D (2001b). Comparative populationanalysis of cortical representations in parametric spaces ofvisual field and skin: a unifying role for nonlinearinteractions as a basis for active information processingacross modalities. Prog Brain Res 130, 155–173.
Duysens J, Orban GA & Verbeke O (1982). Velocity sensitivitymechanisms in cat visual cortex. Exp Brain Res 45,285–294.
Eagleman DM & Sejnowski TJ (2000). Motion integration andpostdiction in visual awareness. Science 287, 2036–2038.
Erlhagen W, Bastian A, Jancke D, Riehle A & Schoner G (1999).The distribution of neuronal population activation (DPA) asa tool to study interaction and integration in corticalrepresentations. J Neurosci Meth 94, 53–66.
Fitzpatrick D (2000). Seeing beyond the receptive field inprimary visual cortex. Curr Opin Neurobiol 10,438–443.
Freeman WJ (2000). Mesoscopic neurodynamics: from neuronto brain. J Physiol (Paris) 94, 303–322.
Gegenfurtner KR & Hawken MJ (1996). Interaction of motionand color in the visual pathways. TINS 19, 394–400.
Grinvald A, Lieke E, Frostig R & Hildesheim R (1994).Real-time optical imaging of naturally evoked electricalactivity in intact frog brain. J Neurosci 14, 2545–2568.
Hazelhoff FF & Wiersma H (1924). Die Wahrnehmungszeit[The sensation time]. Z Psychologie 96, 171–188.
Hirsch JA, Alonso JM, Reid RC & Martinez LM (1998).Synaptic integration in striate cortical simple cells. J Neurosci18, 9517–9528.
Hoffmann KP, Bremmer F, Thiele A & Distler C (2002).Directional asymmetry of neurons in cortical areas MT andMST projecting to the NOT-DTN in macaques. JNeurophysiol 87, 2113–2123.
Hughes A (1971). Topographical relationships between theanatomy and physiology of the rabbit visual system. DocOphthalmol 30, 33–159.
Jancke D (2000). Orientation formed by a spot’s trajectory: Atwo-dimensional population approach in primary visualcortex. J Neurosci 20, RC86, 1–6.
Jancke D, Akhavan AC, Erlhagen W, Schoner G & Dinse HR(1996). Reconstruction of motion trajectories from thedynamic population representation of neurons in cat visualcortex. Soc Neurosci Abstract 22, 646.
Jancke D, Chavane F, Naaman S & Grinvald A (2004). Imagingcorrelates of visual illusion in early visual cortex. Nature 428,423–426.
Jancke D, Erlhagen W, Dinse HR, Akhavan AC, Giese M,Steinhage A & Schoner G (1999). Parametric populationrepresentation of retinal location: Neuronal interactiondynamics in cat primary visual cortex. J Neurosci 19,9016–9028.
Jensen HJ & Martin J (1980). On localization of moving objectsin the visual system of cats. Biol Cybern 36, 173–177.
Kerzel D & Gegenfurtner KR (2003). Neuronal processingdelays are compensated in the sensorimotor branch of thevisual system. Curr Biol 13, 1975–1978.
Kirschfeld K & Kammer T (1999). The Frohlich effect: aconsequence of the interaction of visual focal attention andmetacontrast. Vision Res 39, 3702–3709.
Krekelberg B & Lappe M (1999). Temporal recruitment alongthe trajectory of moving objects and the perception ofposition. Vision Res 39, 2669–2679.
Krekelberg B & Lappe M (2001). Neuronal latencies and theposition of moving objects. Trends Neurosci 24, 335–339.
Krekelberg B, Lappe M, Whitney D, Cavanagh P, EaglemanDM & Sejnowski TJ (2000). The position of moving objects.Science 289, 1107a.
MacKay DM (1958). Perceptual stability of a stroboscopicallylit visual field containing self-luminous objects. Nature 181,507–508.
Mateeff S, Bohdanecky Z, Hohnsbein J, Ehrenstein WH &Yakimoff N (1991b). A constant latency differencedetermines directional anisotropy in visual motionperception. Vision Res 31, 2235–2237.
Mateeff S & Hohnsbein J (1988). Percepual latencies are shorterfor motion towards the fovea than for motion away. VisionRes 28, 711–719.
Mateeff S, Yakimoff N, Hohnsbein J, Ehrenstein WH,Bohdanecky Z & Radil T (1991a). Selective directionalsensitivity in visual motion perception. Vision Res 31,131–138.
Metzger W (1932). Versuch einer gemeinsamen Theorie derPhanomene Frohlichs und Hazelhoffs und Kritik ihrerVerfahren zur Messung der Empfindungszeit. Psychol Forsch16, 176–200.
Musseler J & Aschersleben G (1998). Localizing the firstposition of a moving stimulus: The Frohlich effect and anattention-shifting explanation. Perception Psychophysics 60,683–695.
Nicolelis MA, Ghazanfar AA, Stambaugh CR, Oliveira LM,Laubach M, Chapin JK, Nelson RJ & Kaas JH (1998).Simultaneous encoding of tactile information by threeprimate cortical areas. Nat Neurosci 1, 621–630.
Nijhawan R (1994). Motion extrapolation in catching. Nature370, 256–257.
Orban GA (1984). Neuronal operations in the visual cortex. InStudies of Brain Function XI , ed. Braitenberg, V., pp. 1–367.Springer, New York.
C© The Physiological Society 2004

982 D. Jancke and others J Physiol 556.3
Orban GA, Hoffmann KP & Duysens J (1985). Velocityselectivity in the cat visual system. I. Responses of LGN cellsto moving bar stimuli: a comparison with cortical areas 17and 18. J Neurophysiol 54, 1026–1049.
Pulgarin M, Nevado A, Guo K, Robertson RG, Thiele A &Young MP (2003). Spatio-temporal regularities beyond theclassical receptive field affect the information conveyed by theresponses of V1 neurons. Soc Neurosci Abstract 33, 910.16.
Purushothaman G, Patel SS, Bedell HE & Ogmen H (1998).Moving ahead through differential visual latency. Nature396, 424.
Rao RPN & Ballard DH (1999). Predictive coding in the visualcortex: a functional interpretation of some extra-classicalreceptive field effects. Nat Neurosci 2, 79–87.
Salinas E & Abbott LF (1994). Vector reconstruction fromfiring rates. J Comput Neurosci 1, 89–107.
Schlag J, Cai RH, Dorfman A, Mohempour A & Schlag-Rey M(2000). Extrapolating movement without retinal motion.Nature 403, 38–39.
Sheth BR, Nijhawan R & Shimojo S (2000). Changing objectslead briefly flashed ones. Nat Neurosci 3, 489–495.
Szulborski RG & Palmer LA (1990). The two-dimensionalspatial structure of nonlinear subunits in the RFs of complexcells. Vision Res 30, 249–254.
Whitney D, Murakami I & Cavanagh P (2000). Illusory spatialoffset of a flash relative to a moving stimulus is caused by
differential latencies for moving and flashed stimuli. VisionRes 40, 137–149.
van Beers RJ, Wolpert DM & Haggard P (2001). Sensorimotorintegration compensates for visual localization errors duringsmooth pursuit eye movements. J Neurophysiol 85,1914–1922.
Acknowledgements
We thank Dr Axel Steinhage for implementation of the OLEin MATLAB©, Drs W. von Seelen, K.-P. Hoffmann for helpfuldiscussion, and Drs A. Arieli, K. Kirschfeld, C. Schreiner, H.Wagner, F. Chavane, and Y. Fregnac for critical and constructivecomments on earlier versions of the manuscript. The work wassupported by grants from the Deutsche Forschungsgemeinschaft(Scho 336/4-2 and Di 334/5-1,3).
Supplementary material
The online version of this paper can be found at:DOI: 10.1113/jphysiol.2003.058941and contains supplementary material entitled:Bootstrap analysis. This material can also be
accessed at http://www.blackwellpublishing.com/products/journals/suppmat/tjp/tjp217/tjp217sm.htm
C© The Physiological Society 2004