Pigeons’ memory for sequences of light flashes: Reliance on temporal properties and evidence for...
11
Behavioural Processes 72 (2006) 128–138 Pigeons’ memory for sequences of light flashes: Reliance on temporal properties and evidence for delay interval/gap confusion Angelo Santi ∗ , Jennifer Lellwitz, Stephen Gagne Department of Psychology, Wilfrid Laurier University, Waterloo, Ont., Canada N2L 3C5 Received 28 June 2005; accepted 10 January 2006 Abstract In Experiment 1, pigeons were trained to discriminate between sequences of two and four light flashes (illumination of the feeder). Retention functions obtained with dark delays exhibited a choose-many bias at a 1-s delay and a choose-few bias at delays of 4 and 8 s. Retention functions obtained with illuminated delays only displayed a slight choose-few bias. In Experiment 2, additional birds were trained with the same sample sequences. However, the intertrial interval was illuminated by the houselight for Group Light, and it was dark for Group Dark. The acquisition data suggested that multiple temporal features of the light flash sequences controlled choice responding. For both groups, the retention functions were similar to those obtained in Experiment 1. In Experiment 3, baseline training with a 1-s dark delay eliminated the choose-many bias, but a significant choose-few bias at extended dark delays was still observed. Pigeons discriminate light flash sequences by relying on temporal properties of the sequence rather than using an event switch to count flashes. The biased-forgetting effects obtained in these studies appear to be primarily due to confusion between the delay interval and the gap between light flashes. © 2006 Elsevier B.V. All rights reserved. Keywords: Memory for number; Number discrimination; Sequential stimuli; Delayed matching-to-sample; Pigeon A delayed symbolic matching-to-sample (DMTS) procedure has been used to investigate memory for number of events in pigeons (Fetterman, 2000; Fetterman and MacEwen, 1989; Roberts et al., 1995; Santi and Hope, 2001). In the experiments of Roberts et al. (1995) and Santi and Hope (2001), trials began with the presentation of two 200 ms flashes of light in 4 s (2f/4s) or eight 200 ms flashes of light in 4 s (8f/4s). While the previous papers referred to these sequences as small and large samples, respectively, in the current paper the labels few and many will be used. A peck to one comparison stimulus (e.g., red) was rein- forced when the number of light flashes was few, while a peck to the other comparison stimulus (e.g., green) was reinforced when the number of light flashes had been many. Following acquisition, memory for number was assessed by inserting delay intervals of varying length between the termination of the sam- ple and the onset of the comparisons. Both Roberts et al. (1995) and Santi and Hope (2001) found that pigeons demonstrate a choose-few effect. That is, as the delay increases, pigeons tend to choose the comparison associated with the few sample. ∗ Corresponding author. Tel.: +1 519 884 0710x3087. E-mail address: [email protected] (A. Santi). Fetterman (2000) reported a similar finding with rates of stim- ulus change (slow versus fast) serving as sample stimuli. Delay tests indicated a bias to respond to the comparison stimulus associated with the slow sample. Fetterman (2000) hypothesized that rate discriminations were based on the number of sample events (light flashes) and that the choose-slow bias represented an instance of a choose-few effect. The choose-few effect obtained when memory for number is assessed parallels the response bias exhibited when memory for event duration is assessed. In studies of memory for event duration, a pigeon may be required to peck a red comparison stimulus after a 2-s sample stimulus and to peck a green comparison stimulus after an 8-s sample stimulus. As the delay interval is extended beyond that used in training, pigeons tend to choose the comparison associated with the short sample (Fetterman, 1995; Gaitan and Wixted, 2000; Grant, 1993; Grant and Kelly, 1996, 1998; Grant and Spetch, 1991, 1993, 1994; Kelly and Spetch, 2000; Kraemer et al., 1985; Santi et al., 1993, 1992; Sherburne et al., 1998; Spetch, 1987; Spetch and Rusak, 1989, 1992; Spetch and Wilkie, 1983). Both the choose-short effect and the choose-few effect have been attributed to pigeons coding duration and number in a retrospective, analogical form with response biases during delay testing occurring because the 0376-6357/$ – see front matter © 2006 Elsevier B.V. All rights reserved. doi:10.1016/j.beproc.2006.01.006
-
Upload
independent -
Category
Documents
-
view
2 -
download
0
Transcript of Pigeons’ memory for sequences of light flashes: Reliance on temporal properties and evidence for...

Behavioural Processes 72 (2006) 128–138
Pigeons’ memory for sequences of light flashes: Reliance on temporalproperties and evidence for delay interval/gap confusion
Angelo Santi∗, Jennifer Lellwitz, Stephen GagneDepartment of Psychology, Wilfrid Laurier University, Waterloo, Ont., Canada N2L 3C5
Received 28 June 2005; accepted 10 January 2006
Abstract
In Experiment 1, pigeons were trained to discriminate between sequences of two and four light flashes (illumination of the feeder). Retentionfunctions obtained with dark delays exhibited a choose-many bias at a 1-s delay and a choose-few bias at delays of 4 and 8 s. Retention functionsobtained with illuminated delays only displayed a slight choose-few bias. In Experiment 2, additional birds were trained with the same samplesequences. However, the intertrial interval was illuminated by the houselight for Group Light, and it was dark for Group Dark. The acquisitiondata suggested that multiple temporal features of the light flash sequences controlled choice responding. For both groups, the retention functionswere similar to those obtained in Experiment 1. In Experiment 3, baseline training with a 1-s dark delay eliminated the choose-many bias, but as al propertieso be primarilyd©
K
hiRowoprbftwaipaat
-elayulus
dmpleented
beremoryeventrisonreen
delaytendmplerant994;993,usak,rteons
0d
ignificant choose-few bias at extended dark delays was still observed. Pigeons discriminate light flash sequences by relying on temporf the sequence rather than using an event switch to count flashes. The biased-forgetting effects obtained in these studies appear toue to confusion between the delay interval and the gap between light flashes.2006 Elsevier B.V. All rights reserved.
eywords: Memory for number; Number discrimination; Sequential stimuli; Delayed matching-to-sample; Pigeon
A delayed symbolic matching-to-sample (DMTS) procedureas been used to investigate memory for number of events
n pigeons (Fetterman, 2000; Fetterman and MacEwen, 1989;oberts et al., 1995; Santi and Hope, 2001). In the experimentsf Roberts et al. (1995)andSanti and Hope (2001), trials beganith the presentation of two 200 ms flashes of light in 4 s (2f/4s)r eight 200 ms flashes of light in 4 s (8f/4s). While the previousapers referred to these sequences as small and large samples,espectively, in the current paper the labels few and many wille used. A peck to one comparison stimulus (e.g., red) was rein-
orced when the number of light flashes was few, while a pecko the other comparison stimulus (e.g., green) was reinforcedhen the number of light flashes had been many. Followingcquisition, memory for number was assessed by inserting delay
ntervals of varying length between the termination of the sam-le and the onset of the comparisons. BothRoberts et al. (1995)nd Santi and Hope (2001)found that pigeons demonstratechoose-few effect. That is, as the delay increases, pigeons
end to choose the comparison associated with the few sample.
Fetterman (2000)reported a similar finding with rates of stimulus change (slow versus fast) serving as sample stimuli. Dtests indicated a bias to respond to the comparison stimassociated with the slow sample.Fetterman (2000)hypothesizethat rate discriminations were based on the number of saevents (light flashes) and that the choose-slow bias represan instance of a choose-few effect.
The choose-few effect obtained when memory for numis assessed parallels the response bias exhibited when mfor event duration is assessed. In studies of memory forduration, a pigeon may be required to peck a red compastimulus after a 2-s sample stimulus and to peck a gcomparison stimulus after an 8-s sample stimulus. As theinterval is extended beyond that used in training, pigeonsto choose the comparison associated with the short sa(Fetterman, 1995; Gaitan and Wixted, 2000; Grant, 1993; Gand Kelly, 1996, 1998; Grant and Spetch, 1991, 1993, 1Kelly and Spetch, 2000; Kraemer et al., 1985; Santi et al., 11992; Sherburne et al., 1998; Spetch, 1987; Spetch and R1989, 1992; Spetch and Wilkie, 1983). Both the choose-shoeffect and the choose-few effect have been attributed to pig
∗ Corresponding author. Tel.: +1 519 884 0710x3087.E-mail address: [email protected] (A. Santi).
coding duration and number in a retrospective, analogical formwith response biases during delay testing occurring because the
376-6357/$ – see front matter © 2006 Elsevier B.V. All rights reserved.oi:10.1016/j.beproc.2006.01.006
A. Santi et al. / Behavioural Processes 72 (2006) 128–138 129
Table 1Temporal and numerical features of samples used in previous studies of memory for number of light flashes
Sample Total sequenceduration
Flashduration
Number offlashes
Number ofgaps
Sum offlashes
Gap betweenflashes
Sum of thegap durations
Resp
2f/4s 4000 200 2 1 400 3600 3600 Red8f/4s 4000 200 8 7 1600 343 2401 Green
analogical representation foreshortens (time) or shrinks (num-ber) during the delay interval. Consistent with this explanation,both choose-short and choose-few biases have been shown tobe dependent on the baseline training delay. If a constant longdelay interval (e.g., 5 or 10 s) is used during baseline trainingin a duration discrimination (Spetch, 1987) or number discrim-ination (Santi and Hope, 2001) task, the introduction of shorterdelay intervals during testing results in a choose-long effect forduration samples and a choose-many bias for number samples.
Recently,Hope and Santi (2004)reported results from a studyof memory for number of feeder light flashes in which the ambi-ent chamber illumination was manipulated during the intertrialinterval (ITI) and the delay interval. In Experiment 2, the birdsreceived baseline training with a 5-s illuminated delay. Testingat shorter and longer illuminated delays produced a differentpattern of response biases than those previously obtained withdark delays. That is, a choose-many bias was observed at delayslonger than the baseline delay, and a choose-few bias occurredat the delay shorter than the baseline delay. This result suggestedthat the presence of the houselight during the delay interval wassomehow adding to the perceived number of events which hadbeen signaled by flashes of the feeder light. One possibility isthat pigeons used an event switch (and number accumulator) forthe number samples, a run switch (and temporal accumulator)for the illuminated delay interval, and then based their responseon the sum of these two accumulator values. Another possibilityi Thai edel nuet rval.C seco ell toa mah mint ch toc )Sa thanm
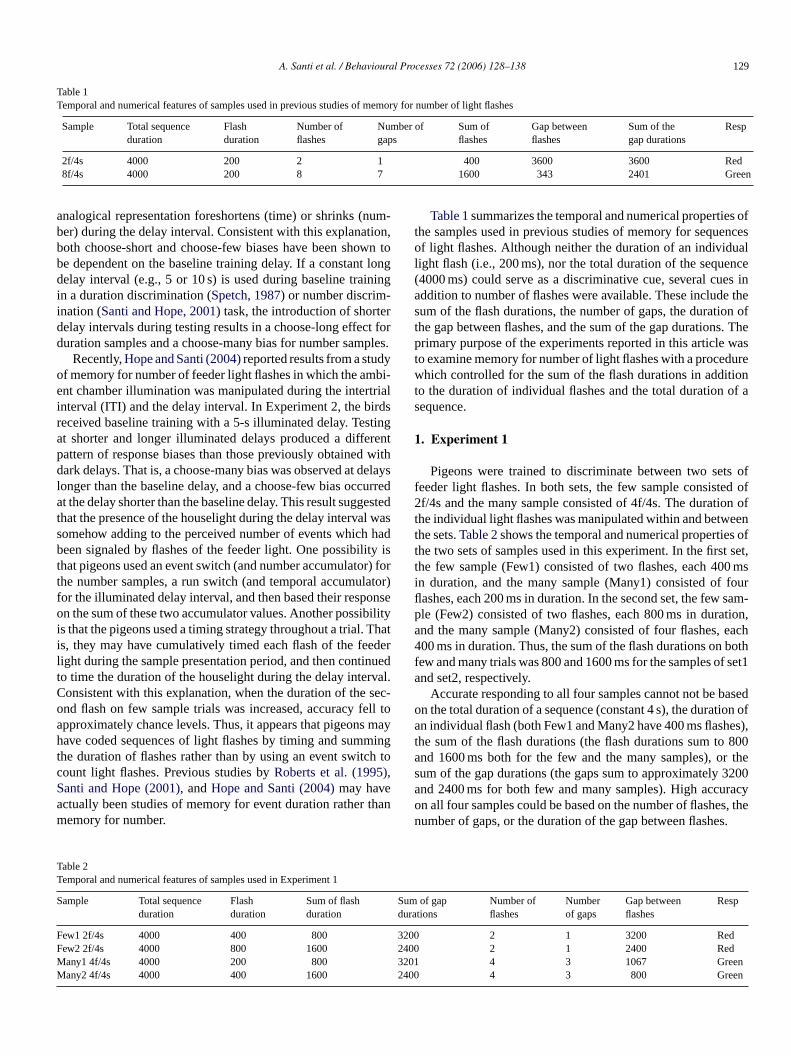
Table 1summarizes the temporal and numerical properties ofthe samples used in previous studies of memory for sequencesof light flashes. Although neither the duration of an individuallight flash (i.e., 200 ms), nor the total duration of the sequence(4000 ms) could serve as a discriminative cue, several cues inaddition to number of flashes were available. These include thesum of the flash durations, the number of gaps, the duration ofthe gap between flashes, and the sum of the gap durations. Theprimary purpose of the experiments reported in this article wasto examine memory for number of light flashes with a procedurewhich controlled for the sum of the flash durations in additionto the duration of individual flashes and the total duration of asequence.
1. Experiment 1
Pigeons were trained to discriminate between two sets offeeder light flashes. In both sets, the few sample consisted of2f/4s and the many sample consisted of 4f/4s. The duration ofthe individual light flashes was manipulated within and betweenthe sets.Table 2shows the temporal and numerical properties ofthe two sets of samples used in this experiment. In the first set,the few sample (Few1) consisted of two flashes, each 400 msin duration, and the many sample (Many1) consisted of fourflashes, each 200 ms in duration. In the second set, the few sam-ple (Few2) consisted of two flashes, each 800 ms in duration,a each4 bothf f set1a
asedo ion ofa hes),t 800a r thes 3200a racyo s, then s.
TT
S Sumdura
F 32F 24M 32 enM 24 en
s that the pigeons used a timing strategy throughout a trial.s, they may have cumulatively timed each flash of the feight during the sample presentation period, and then contio time the duration of the houselight during the delay inteonsistent with this explanation, when the duration of thend flash on few sample trials was increased, accuracy fpproximately chance levels. Thus, it appears that pigeonsave coded sequences of light flashes by timing and sum
he duration of flashes rather than by using an event switount light flashes. Previous studies byRoberts et al. (1995,anti and Hope (2001), andHope and Santi (2004)may havectually been studies of memory for event duration ratheremory for number.
able 2emporal and numerical features of samples used in Experiment 1
ample Total sequenceduration
Flashduration
Sum of flashduration
ew1 2f/4s 4000 400 800ew2 2f/4s 4000 800 1600any1 4f/4s 4000 200 800any2 4f/4s 4000 400 1600
trd
-
yg
nd the many sample (Many2) consisted of four flashes,00 ms in duration. Thus, the sum of the flash durations on
ew and many trials was 800 and 1600 ms for the samples ond set2, respectively.
Accurate responding to all four samples cannot not be bn the total duration of a sequence (constant 4 s), the duratn individual flash (both Few1 and Many2 have 400 ms flas
he sum of the flash durations (the flash durations sum tond 1600 ms both for the few and the many samples), oum of the gap durations (the gaps sum to approximatelynd 2400 ms for both few and many samples). High accun all four samples could be based on the number of flasheumber of gaps, or the duration of the gap between flashe
of gaptions
Number offlashes
Numberof gaps
Gap betweenflashes
Resp
00 2 1 3200 Red00 2 1 2400 Red01 4 3 1067 Gre00 4 3 800 Gre
130 A. Santi et al. / Behavioural Processes 72 (2006) 128–138
Following acquisition, pigeons received the first of two reten-tion tests. During the first retention test, the pigeons were givendark delay intervals of 0, 1, 2, 4, and 8 s. Following additionaltraining with a 0-s delay, the pigeons were tested with both darkand illuminated delays of 0, 1, 2, 4, and 8 s.
2. Method
2.1. Subjects
Twelve adult Silver King pigeons, maintained at approxi-mately 80% of their free-feeding weight, and housed individu-ally with constant access to water and grit served as subjects.Post session feedings of Purina Pigeon Chow were providedif necessary to maintain their target weights. The colony roomwas illuminated on a 12:12 cycle by fluorescent light turned onat 6:00 a.m. each day. Testing was conducted 5 days a weekbetween 9:00 a.m. and 3:00 p.m. The birds had previously beentrained to discriminate sequences of light flashes that varied innumber, but not in time, and in time but not in number (Hopeand Santi, 2004; Santi and Hope, 2001).
2.2. Apparatus
Four Coulbourn modular operant test cages (Model #E10-10), each housed within isolation cubicles (Model #10-20), wereu tema ntalla at ap ctow oject ntall undDw cont urnM ur-i e oft t thad age( en-t ed ba
2
2TS
t samp d offt ed wa ualls flashT , thes mb( tiond sam
ple sequences and two many sample sequences. One few sample(Few1) consisted of two 400 ms flashes in 4 s, and the secondfew sample (Few2) consisted of two 800 ms flashes in 4 s. Onemany sample (Many1) consisted of four 200 ms flashes in 4 s,and the second many sample (Many2) consisted of four 400 msflashes in 4 s. For six birds, color comparisons were presentedafter the number samples and red was correct following the fewsamples, while green was correct following the many samples.For the remaining birds, line comparisons were presented afterthe number samples. Vertical was correct following the few sam-ples, and horizontal was correct following the many samples. Forall birds, a single peck to the comparison stimuli turned themoff and if correct permitted 4-s access to mixed grain from theilluminated food hopper. Incorrect responses to the comparisonstimuli resulted in a 4-s blackout followed immediately by thepresentation of the same sample and comparison stimulus con-figuration. A correct response on a correction trial produced 4-saccess to mixed grain, although only the choice response on theinitial (noncorrection) trial was used to calculate matching accu-racy. Within each block of eight trials, all combinations of thefour sample stimuli with comparison stimuli counterbalancedon the left and right side keys occurred once. The order of pre-sentation was randomized individually for each bird. The ITI,spent in darkness, was 15 s and each session consisted of 160trials.
The mean percentage of correct responding during the lastt ny1,8 con-d sion,2 ny1,a ls fore , and8 n ofd o thatt ocia-t elined dW urer tersr
elayt ses-s eonsh cy. Ina werer ntiont a 0-sd e toi g thel ny1,8
trialse ples( elined otherd le ate spent
sed. Each cubicle utilized baffled air intake exhaust sysnd ventilation fans. Each test cage contained three horizoligned, translucent plastic keys positioned approximatelyigeon’s standing sight line. Behind each key was a projehich displayed red, green, or white onto a frosted rear pr
ion screen (Coulbourn Model #E21-18). Vertical and horizoines were presented as white bars with a black backgroirectly below the center key there was a 5.7 cm× 5 cm openinghich, during reinforcement, provided access to a hopper
aining mixed grain. Within the opening was a lamp (Coulboodel #E14-10 with bulb #S11819X) that was illuminated d
ng reinforcement or during the sample presentation phasrial. Located 6.5 cm above the center key was a houselighirected light upward to reflect light from the top of the cCoulbourn Model #14-10). The organization of all experimal events and recording of response choices was performmicrocomputer system located in the same room.
.3. Procedure
.3.1. 0-s DMTS number training and testingAll birds received 20 sessions of baseline training in a DM
ask with number samples. Each trial commenced with ale presentation in which the hopper light flashed on an
hroughout the sequence. Each sequence began and endlight flash. The remainder of the flashes occurred at eq
paced time intervals between the beginning and endinghroughout all of the experiments reported in this paperample presentation always occurred in a darkened chai.e., the hopper light flash was the only source of illuminauring the sample presentation period). There were two few
sy
r-
.
-
at
y
-
ithy.
er
-
wo sessions of training was 75.8% for Few1, 83.8% Ma1.7% for Few2, and 83.8% for Many2. Delay testing wasucted for 15 sessions of 160 trials each. Within each ses4 trials for each of the four samples (Few1, Few2, Mand Many2) occurred at the 0-s baseline delay, and 4 triaach sample occurred at each of the other delays (1, 2, 4s). Delay intervals were spent in darkness. This distributioelays (60% baseline delay, 40% other delays) was used s
he reference memory for number samples and their assion with the comparison stimuli established during 0-s baselay training would remain stable during testing (Spetch anilkie, 1983). During delay testing, the correction proced
emained in effect only for 0-s delay trials. All other parameemained the same as those described for training.
Following delay testing, all birds were returned to 0-s draining with the four number samples. Subsequent trainingions were conducted with a 2-s baseline delay, but the pigad difficulty responding at above-chance levels of accuraddition, all but one bird that had received line comparisonsetrained with color comparisons. Prior to the second reteest, all birds received 20 sessions of baseline training withelay. One bird was dropped from the study at this time du
llness. The mean percentage of correct responding durinast two sessions of training was 77.8% for Few1, 86.7% Ma7.6% for Few2, and 82.2% for Many2.
Delay testing was conducted for 15 sessions of 160ach. Within each session, 24 trials for each of the four samFew1, Few2, Many1, and Many2) occurred at the 0-s baselay, and 4 trials for each sample occurred at each of theelays (1, 2, 4, and 8 s). During two trials for each sampach of the delays greater than 0 s, the delay interval was

A. Santi et al. / Behavioural Processes 72 (2006) 128–138 131
in darkness. During the other two trials for each sample at eachof the delays greater than 0 s, the delay interval was illuminatedby presentation of the houselight. During delay testing, the cor-rection procedure remained in effect only for 0-s delay trials.All other parameters remained the same as those described pre-viously.
In all the statistical analyses reported in this article, the rejec-tion region wasp < 0.05.
3. Results and discussion
The mean percentage of correct responding during the firstretention test is shown inFig. 1. Accuracy was equivalent forfew and many samples at the 0-s delay. At the 1-s delay accu-racy remained high following the many samples, but it droppedto chance levels following the few samples. As the delay inter-val was extended beyond 1 s, accuracy dropped following manysamples, but it increased slightly following few samples. Ananalysis of variance (ANOVA) was conducted with set (set1,set2), sample (few, many) and delay interval as within-subjectsfactors. There was no main effect for set,F < 1, and it did notinteract significantly with any other factor. There was a signif-icant effect of delay interval,F(4, 44) = 76.41, and a sampletype× delay interval interaction,F(4, 44) = 37.20. A simplemain effect analysis indicated that at the 0-s delay, accuracy wasequivalent for few and many samples,F < 1. At the 1-s delay,a r fews nif-ib eatef dF
dif-f i,2w nge
F ampt . Thev tes thd r barsr
delay intervals, at the 1-s delay accuracy was significantly higherfollowing many samples than following few samples. The intro-duction of a brief interval of darkness following the last lightflash was much more disruptive on few sample trials than onmany sample trials. These retention functions would be difficultto explain if it was assumed that pigeons’ choice respondingwas primarily controlled by either the number of light flashes orthe number of gaps. The results appear more consistent with theassumption that the pigeons confused dark delay intervals withthe duration of the gap which occurred between light flashes. A1-s dark delay interval is very similar to the gap duration on manysample trials (either 1067 or 800 ms). As the length of the delayincreases, the interval becomes more like the gap on few sam-ple trials (either 3200 or 2400 ms). As a result, a choose-manybias at the 1-s dark delay would be expected, and an increasingchoose-few bias as the delay increases should occur. However,accuracy on few-sample trials following a 1-s dark delay only fellto chance levels. If similarity of the delay to the duration of a gapwas the only factor influencing choice responding, then accu-racy should have been significantly below chance. Nevertheless,if delay interval-gap confusion is one of the factors affectingperformance, then illuminating the houselight during the delayinterval should reduce the likelihood that pigeons confuse thedelay interval with the dark gap between the flashes.
The mean percentage of correct responding during the sec-ond retention test in which the illumination condition duringtb mlyd omlyd l wasd oseo d lit-t uceda rials.E y onm e tri-a eaterf ervalw wasr ervalw darkd n form
n( elayi tors.T na-t all ac-t yi ,s ll ig-n ll ly-s nw pent
ccuracy was significantly higher for many samples than foamples,F(1, 11) = 111.53. At the 2-s delay, there was no sigcant difference in accuracy for few and many samples,F < 2. Atoth the 4-s and 8-s delays, accuracy was significantly gr
or few samples than for many samples,F(1, 11) = 12.83, an(1, 11) = 10.13, respectively.
These retention functions for number of light flasheser from those reported in previous studies (Hope and Sant004; Roberts et al., 1995; Santi and Hope, 2001). While thereas a statistically significant choose-few bias at the two lo
ig. 1. The mean percentage of correct responding on few- and many-srials during delay test sessions following training with a 0-s delay intervalalues in parentheses following each sample type in the legend indicauration of the flash and the duration of the gap for that sample. Erroepresent the standard error of the mean.
r
r
le
e
he delay interval was manipulated is shown inFig. 2. It shoulde noted that one half of all 0-s delay intervals were randoesignated as dark delays, and the other half were randesignated as illuminated delays. When the delay intervaark (top panel), the retention functions were similar to thbtained during the first retention test. A 1-s dark delay ha
le effect on accuracy during many sample trials, but it redccuracy to approximately chance levels on few sample txtending the dark delay from 1 to 4 s, reduced accuracany sample trials but it increased accuracy for few samplls. Consequently, at the 8-s delay accuracy was slightly gr
or few samples than for many samples. When the delay intas illuminated by the houselight (bottom panel), accuracy
educed both for many and for few samples as the delay intas increased. In contrast to the results obtained with a 1-selay, accuracy was slightly greater for few samples thaany samples with a 1-s illuminated delay.An ANOVA was conducted with delay interval illuminatio
dark, light), set (set1, set2), sample (few, many) and dnterval length (0, 1, 2, 4, and 8 s) as within-subjects fachere were significant main effects of delay interval illumi
ion, F(1, 10) = 14.83, set,F(1, 10) = 9.09, and delay intervength,F(4, 40) = 72.97. There were significant two-way interions of delay interval illumination× set,F(1, 10) = 14.75, delanterval illumination× delay interval length,F(4, 40) = 5.59et× sample, F(1, 10) = 7.60, and sample× delay intervaength, F(4, 40) = 6.26. More importantly, there was a sificant delay interval illumination× sample× delay interva
ength interaction,F(4, 40) = 25.90. A simple main effect anais indicated that the sample× delay interval length interactioas statistically significant when the delay interval was s
132 A. Santi et al. / Behavioural Processes 72 (2006) 128–138
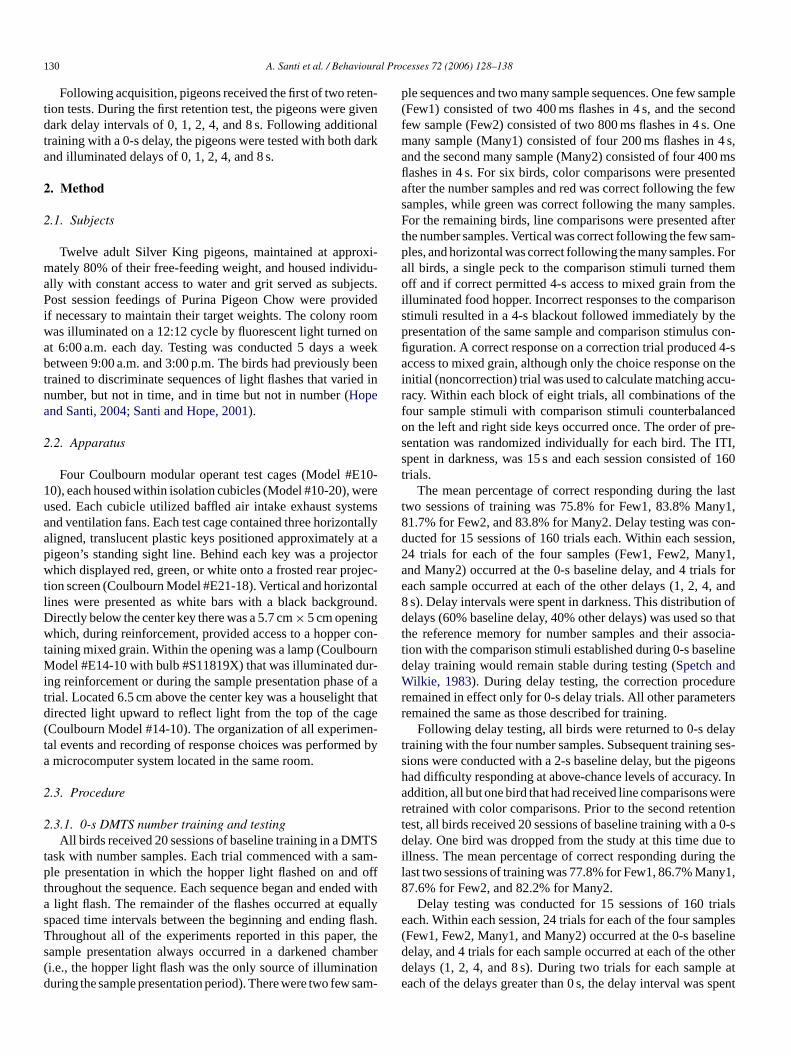
Fig. 2. The mean percentage of correct responding on few- and many-samptrials during delay test sessions following training with a 0-s delay interval. Thevalues in parentheses following each sample type in the legend indicates thduration of the flash and the duration of the gap for that sample. The data fotest trials with dark delays are shown in the top panel and the data for test trialin which the delay interval was illuminated by the houselight are presented inthe bottom panel. Error bars represent the standard error of the mean.
in darkness. At the 0-s and 4-s delays, there was no statistcally significant difference in accuracy on few and many sampletrials. However, at the 1-s and 2-s delay, accuracy was significantly greater on many sample trials than on few sample trialsF(1, 10) = 67.71 and 7.07, respectively. Finally, at the 8-s delayaccuracy was significantly greater on few sample trials than onmany sample trials,F(1, 10) = 6.31. When the delay interval wasilluminated, the sample type× delay interval length interactionwas only marginally significant,F(4, 40) = 2.41,p = 0.065. Asimple main effect analysis indicated that accuracy was significantly greater on few sample trials than on many sample trialsbut only at the 1-s delay interval,F(1, 10) = 12.40. In addition,the overall analysis of variance also indicated that there wassignificant set× sample× delay interval length interaction,F(4,40) = 10.47. This reflected a stronger sample× delay intervallength interaction for set1 samples,F(4, 40) = 10.68, than forset2 samples,F(4, 40) = 3.83.
The results of the second retention test indicated that thechoose-many bias observed at the1-s dark delay was eliminateand replaced by a slight choose-few bias when the delay wa
illuminated. These findings are consistent with the hypothesisthat the similarity of the ambient chamber illumination duringthe delay interval and the gaps between light flashes influencedchoice responding. A short dark delay would be more similarto the dark gaps for the many sample sequences and produce a“many” response, while longer dark delays would be more sim-ilar to the dark gaps for the few sample sequences and producea “few” response. Illuminating the delay would be expected toreduce the similarity of the delay to the dark gap and reduce thistype of instructional ambiguity (seeCohen and Njegovan, 1999;Dorrance et al., 2000; Kaiser et al., 2002; Sherburne et al., 1998;Zentall, 1997, 1999).
4. Experiment 2
The birds studied in Experiment 1 had extensive prior expe-rience with this task under conditions in which the illuminationconditions of the delay and ITI were varied. This may raise con-cerns about the impact that previous training had on the retentionfunctions obtained in this study. Consequently, in Experiment 2,experimentally naıve birds were trained in the same procedure asused in Experiment 1. In addition, to assess the role that house-light illumination during the ITI might have on the results, onegroup of pigeons was trained with a dark ITI (Group Dark),and another group was trained with an illuminated ITI (GroupLight).
5
5
ilverK samew xper-i
5
tedf apedt eft ort thei uallys g thes
eret train-i e train-i isonsw greenw irds( ITI,a lighto 5 s.T sionso rect.O ct on
le
ers
i-
-,,
-
a
ds
. Method
.1. Subjects and apparatus
The subjects were eight experimentally naive adult Sing Pigeons. They were housed and maintained in theay as the birds in Experiment 1. The apparatus used in E
ment 1 was also used in Experiment 2.
.2. Procedure
All birds were trained to eat mixed grain from the illuminaood hopper. After hopper training, the pigeons were autosho peck at red or green randomly presented on either the lhe right side keys. Any bird that was not reliably peckinglluminated keys by the end of the sixth session was manhaped. Training began once all birds were reliably peckinide keys on at least 85% of the trials.
During training, the two sets of few and many samples whe same as those used in Experiment 1. All aspects of theng sessions were the same as those described for baselinng in Experiment 1, except that only red and green comparere used. Red was correct following the few samples, andas correct following the many samples. In addition, four b
Group Light) were trained with the houselight on during thend four birds (Group Dark) were trained with the houseff during the ITI. As in Experiment 1, the ITI duration was 1raining continued for 75 sessions. Over the last five sesf 0-s training, overall accuracy was at or above 82% corn the last day of training, the birds averaged 80.9% corre
A. Santi et al. / Behavioural Processes 72 (2006) 128–138 133
the few-sample trials and 86.3% correct on the many-sampletrials.
Delay testing was conducted for 20 sessions of 160 trialseach. Within each session, 24 trials for each of the four samples(Few1, Few2, Many1, and Many2) occurred at the 0-s baselinedelay, and four trials for each sample occurred at each of theother delays (1, 2, 4, and 8 s). During two trials for each sam-ple at each of the delays greater than 0 s, the delay interval wasspent in darkness. During the other two trials for each sample ateach of the delays greater than 0 s, the delay interval was illu-minated by presentation of the houselight. During delay testing,the correction procedure remained in effect only for 0-s delaytrials. All other parameters remained the same as those describedpreviously.
6. Results and discussion
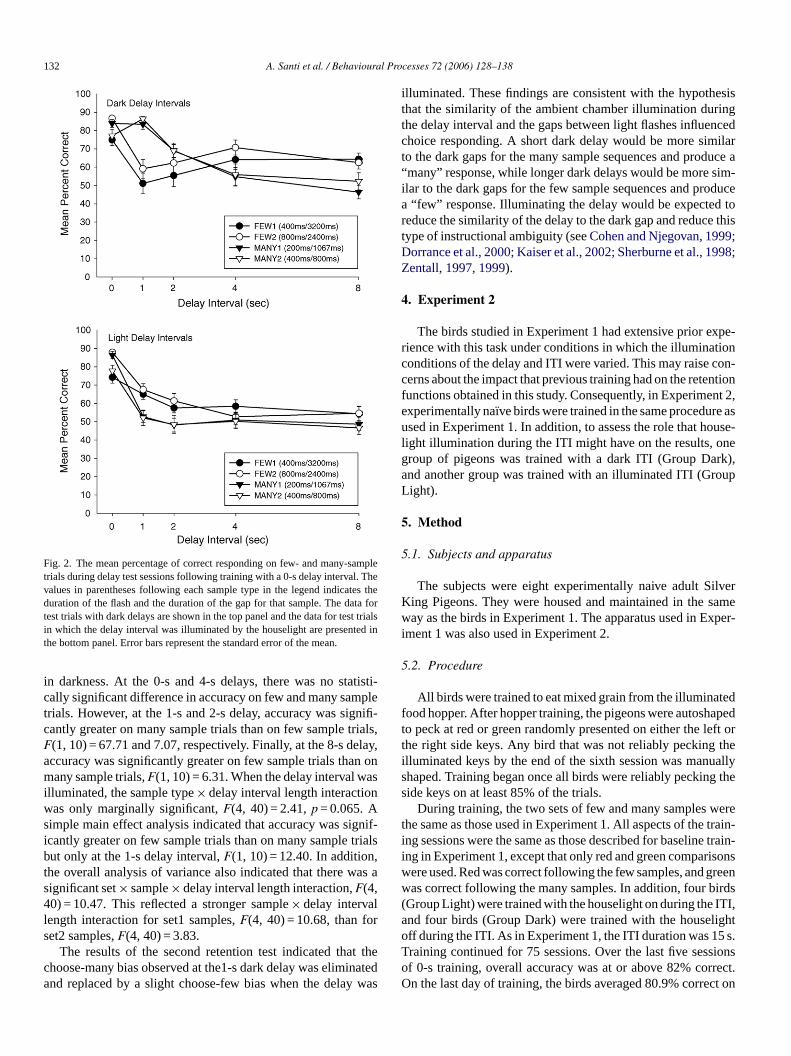
Fig. 3presents the mean percent correct responding for fewand many samples during acquisition of the discrimination. The
Fteodtb
data for Group Dark are shown in the top panel and those forGroup Light in the bottom panel. For both groups, accuracy washigher for samples which were more discriminable in terms of anindividual flash duration (Few2—800 ms and Many1—200 ms),than those with the same flash duration (Few1—400 ms andMany2—400 ms). At the end of acquisition, accuracy was high-est for the Few2 and Many1 samples and lowest for the Few1sample. An ANOVA was conducted on these data with group as abetween-subjects factor and set (set1, set2), sample (few, many),and blocks as within-subjects factors. There was a significantmain effect for session blocks,F(14, 84) = 28.42, a set× sampleinteraction,F(1, 6) = 38.09, as well as a set× sample× blockinteraction,F(14, 84) = 2.84. Neither the main effect of groupnor any interactions involving the group factor were statisti-cally significant. A simple main effects analysis indicated thatperformance was equivalent across set and sample type duringthe first block of 5 sessions. However, there was a statisti-cally significant interaction of set type× sample type at eachof the remaining 14 blocks,Fs(1, 16) = 5.77–61.98. These inter-actions reflected the fact that accuracy was generally greaterfor Few2—800 ms than for Many2—400 ms, but it was greaterfor Many1—200 ms than for Few1—400 ms. For example, asearly as the second block, accuracy was significantly greater forFew2—800 ms than for Many2—400 ms,F(1, 6) = 8.57, and itwas greater for Many1—200 ms than for Few1—400 ms,F(1,6) = 6.39. This was also evident during the fifteenth block inw mst orM
dis-c ra-t hichw axi-m plesw didn ax-i lieds aveb ms.T d oft thed ulti-p ut thed y ina sions
ig. 3. The mean percentage of correct responding on few- and many-samprials during acquisition in Experiment 2. The values in parentheses followingach sample type in the legend indicates the duration of the flash and the duratiof the gap for that sample. The data for the group trained with the houselight ofuring the ITI (Group Dark) are shown in the top panel. The data for the group
rained with the houselight on during the ITI (Group Light) are shown in theottom panel. Error bars represent the standard error of the mean.
otrials
w rG t int rvalsw r halfw ntionf oseo 1-sd ials.H velso the
le
nf
hich accuracy was significantly greater for Few2—800han for Many2—400 ms,F(1, 6) = 7.80, and it was greater fany1—200 ms than for Few1—400 ms,F(1, 6) = 33.10.The acquisition data suggest that pigeons acquired the
rimination by initially discriminating on the basis of flash duion rather than gap duration or number. The two samples were discriminated the best, Few2 and Many1, differed mally in flash duration (800 ms versus 200 ms). The two samhich were discriminated more poorly, Few1 and Many2,ot differ in flash duration (400 ms each), but they did differ m
mally in gap duration (3200 ms versus 800 ms). If pigeons reolely on the duration of an individual flash, they would not heen able to discriminate Few1—400 ms from Many2—400hus it seems unlikely that the pigeon’s choices at the en
raining were controlled solely by the duration of a flash,uration of a gap, number of flashes, or number of gaps. Mle features of the sequential events appear to be used, buration of an individual flash certainly played a role earlcquisition and continued to be important even after 75 sesf training.
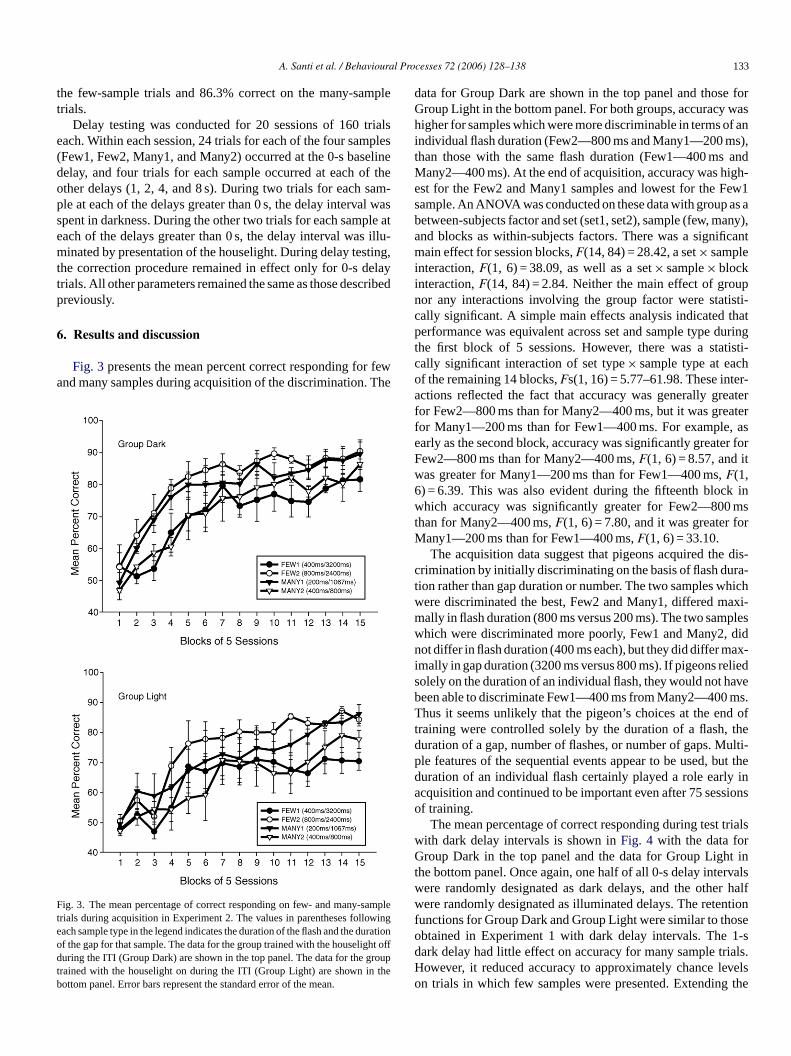
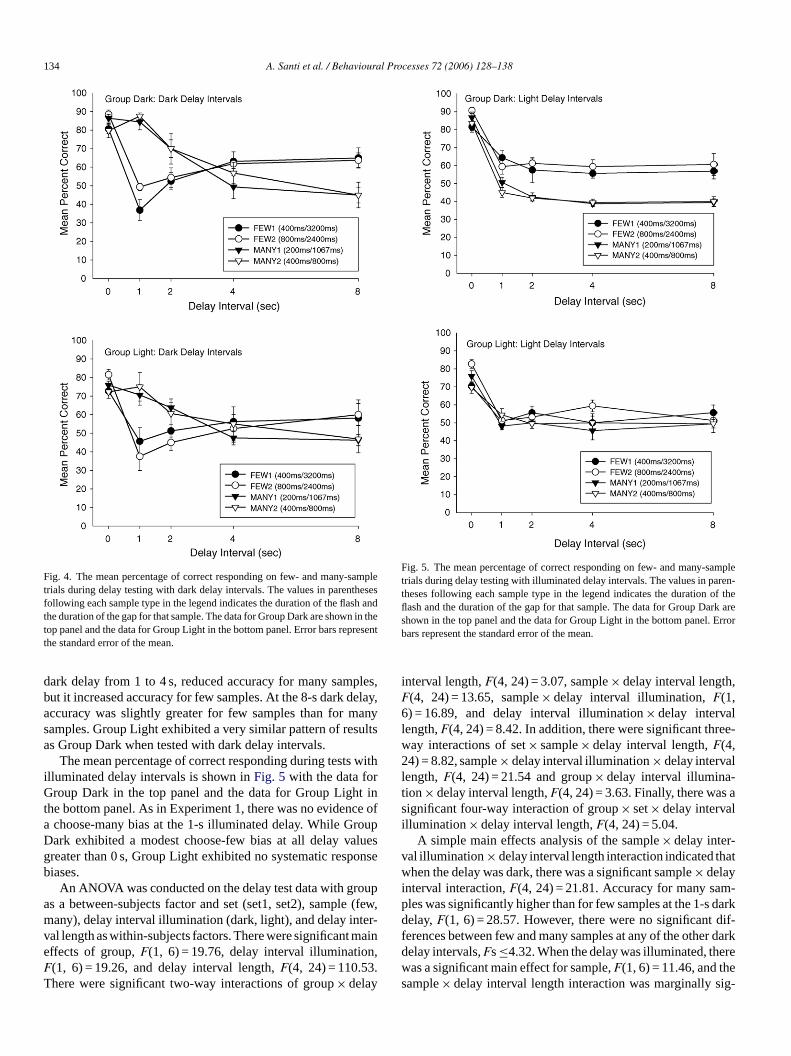
The mean percentage of correct responding during testith dark delay intervals is shown inFig. 4 with the data foroup Dark in the top panel and the data for Group Ligh
he bottom panel. Once again, one half of all 0-s delay inteere randomly designated as dark delays, and the otheere randomly designated as illuminated delays. The rete
unctions for Group Dark and Group Light were similar to thbtained in Experiment 1 with dark delay intervals. Theark delay had little effect on accuracy for many sample trowever, it reduced accuracy to approximately chance len trials in which few samples were presented. Extending
134 A. Santi et al. / Behavioural Processes 72 (2006) 128–138
Fig. 4. The mean percentage of correct responding on few- and many-sampletrials during delay testing with dark delay intervals. The values in parenthesesfollowing each sample type in the legend indicates the duration of the flash andthe duration of the gap for that sample. The data for Group Dark are shown in thetop panel and the data for Group Light in the bottom panel. Error bars representthe standard error of the mean.
dark delay from 1 to 4 s, reduced accuracy for many samples,but it increased accuracy for few samples. At the 8-s dark delay,accuracy was slightly greater for few samples than for manysamples. Group Light exhibited a very similar pattern of resultsas Group Dark when tested with dark delay intervals.
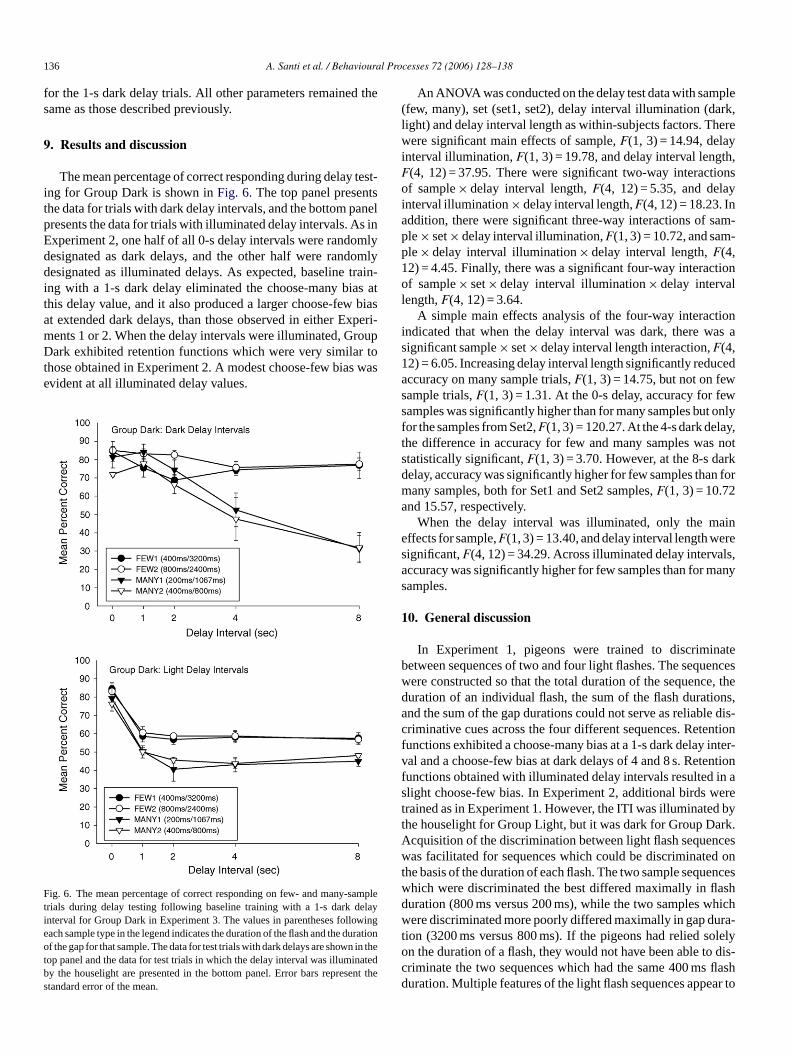
The mean percentage of correct responding during tests withilluminated delay intervals is shown inFig. 5 with the data forGroup Dark in the top panel and the data for Group Light inthe bottom panel. As in Experiment 1, there was no evidence ofa choose-many bias at the 1-s illuminated delay. While GroupDark exhibited a modest choose-few bias at all delay valuesgreater than 0 s, Group Light exhibited no systematic responsebiases.
An ANOVA was conducted on the delay test data with groupas a between-subjects factor and set (set1, set2), sample (few,many), delay interval illumination (dark, light), and delay inter-val length as within-subjects factors. There were significant maineffects of group,F(1, 6) = 19.76, delay interval illumination,F(1, 6) = 19.26, and delay interval length,F(4, 24) = 110.53.There were significant two-way interactions of group× delay
Fig. 5. The mean percentage of correct responding on few- and many-sampletrials during delay testing with illuminated delay intervals. The values in paren-theses following each sample type in the legend indicates the duration of theflash and the duration of the gap for that sample. The data for Group Dark areshown in the top panel and the data for Group Light in the bottom panel. Errorbars represent the standard error of the mean.
interval length,F(4, 24) = 3.07, sample× delay interval length,F(4, 24) = 13.65, sample× delay interval illumination,F(1,6) = 16.89, and delay interval illumination× delay intervallength,F(4, 24) = 8.42. In addition, there were significant three-way interactions of set× sample× delay interval length,F(4,24) = 8.82, sample× delay interval illumination× delay intervallength, F(4, 24) = 21.54 and group× delay interval illumina-tion× delay interval length,F(4, 24) = 3.63. Finally, there was asignificant four-way interaction of group× set× delay intervalillumination× delay interval length,F(4, 24) = 5.04.
A simple main effects analysis of the sample× delay inter-val illumination× delay interval length interaction indicated thatwhen the delay was dark, there was a significant sample× delayinterval interaction,F(4, 24) = 21.81. Accuracy for many sam-ples was significantly higher than for few samples at the 1-s darkdelay,F(1, 6) = 28.57. However, there were no significant dif-ferences between few and many samples at any of the other darkdelay intervals,Fs≤4.32. When the delay was illuminated, therewas a significant main effect for sample,F(1, 6) = 11.46, and thesample× delay interval length interaction was marginally sig-

A. Santi et al. / Behavioural Processes 72 (2006) 128–138 135
nificant,F(4, 24) = 2.29. Accuracy was higher for few samplesthan for many samples when the delay intervals were illumi-nated at delays of 2, 4, and 8 s,Fs(1, 6) = 14.05, 8.89, and 6.34,but not at the 1-s delay,F(1, 6) = 3.15.
The set× sample× delay interval length interaction was pri-marily a reflection of a set× sample interaction at the 0-s delaywhich was the same as that noted at the end of acquisitiontraining,F(1, 6) = 20.67. That is, for set1, accuracy was greaterfor Many1—200 ms samples (81.2%) than for Few1—400 mssamples (76.3%),F(1, 6) = 11.13. However, for set2, accu-racy was greater for Few2—800 ms (85.7%) samples thanfor Many2—400 ms samples (76.3%),F(1, 6) = 13.57. Theset× sample interaction was not significant at any of the remain-ing delay intervals,Fs(1, 6)≤2.42.
The group× delay interval illumination× delay intervallength interaction reflected differences in accuracy betweenGroup Dark and Group Light under some conditions of delayinterval illumination and delay length but not others. When thedelay interval was dark, accuracy was higher for Group Darkthan for Group Light at the 0-s,F(1, 6) = 9.28 and 1-s delay,F(1, 6) = 10.12. When the delay interval was light, accuracy forGroup Dark was higher than for Group Light only at the 0-sdelay,F(1, 6) = 14.95. The group× set× delay interval illumi-nation× delay interval length interaction occurred as a result ofa significant set× delay interval illumination× delay intervallength interaction for Group Dark,F(4, 24) = 4.92, but not forGi lay,Ft ccur .7%o ash en itw
eri-m whicc and2 hichfl mayh (i.e.3 timul eona o thg se as tionf durat risot ainh lowc dard pas arisi ys in theg d bee , anm
When a 1-s delay with ambient stimulus properties (i.e.,light) different from a gap occurs, pigeons do not show a biasto respond to the many-associated comparison. Instead accu-racy decreases substantially for both many and few samples.For Group Light, accuracy remains at chance as the illumi-nated delay interval is extended and there is no response biasevident. However, for Group Dark, accuracy was higher onfew-sample trials than on many-sample trials at all illuminateddelays greater than 0 s,Fs(1, 6) = 6.58, 17.35, 9.43, and 8.62,respectively.
7. Experiment 3
Given the results of Experiment 2, it appeared worthwhile todetermine what would happen if the birds were given baselinetraining with a constant 1-s dark delay interval. Presumably,this would prevent birds from responding on the basis of themost recently present “gap” and eliminate the choose-manybias at the 1-s delay. Testing at extended delays was conductedto determine if asymmetrical retention gradients would be stillevident with dark delay intervals but not with illuminated delayintervals.
8. Method
8.1. Subjects and apparatus
alsou
8
andG al tot tervalw mples rrec-t 1-sd iningw ge ofc was7 .4%f 30s ightc them ssions2 .8%f waso elayt trialsf ny2)o sam-p ). Foro , thee theset ringd only
roup Light,F(2, 24) = 1.51. For Group Dark, the set× delaynterval illumination interaction was significant at the 1-s de(1, 6) = 11.83, but not at any of the other delays,Fs≤4.13. At
he 1-s delay, for set1, there was no overall difference in aacy as a function of whether the delay interval was dark (60r light (57.5%),F < 1. However, for set2, overall accuracy wigher when the delay interval was dark (68.5%) than whas light (52.2%),F(1, 6) = 52.85.The main results of this study were similar to those of Exp
ent 1. At a 0-s delay, accuracy was greater for sequencesould be discriminated on the basis of flash duration (80000 ms) than those which could not (400 ms). On trials in wash duration was uninformative (i.e., 400 ms) pigeonsave used the duration of the immediately preceding gap200 ms versus 800 ms). When a 1-s delay with ambient s
us properties (i.e., darkness) identical to a gap occurs, pigppear to respond on the basis of the similarity of the delay tap duration presented during the sample sequence. Becaudark delay is more similar to the 800 and 1067 ms gap dura
or many samples than it is to the 3200 and 2400 ms gapions for few samples, pigeons tend to respond to the compahat is correct for many samples. As a result accuracy remigh for many sample trials but drops to levels at or behance for few sample sequences. As the duration of theelay increases, responding to the many-associated comon decreases and responding to the few-associated compncreases. It is also clear that responding during dark delaot solely based on the similarity of the delay interval toap duration. If it was, then accuracy for few samples woulxpected to be much further below chance at the 1-s delayuch further above chance at the 4-s and 8-s delay.
-)
h
,-se1-
s-ns
kri-ons
d
The subjects and apparatus used in Experiment 2 weresed in Experiment 3.
.2. Procedure
Following the delay testing of Experiment 2, Group Darkroup Light received training sessions which were identic
hose previously described except that a 1-s dark delay inas inserted between the end of the last light flash in a saequence and the onset of the comparison stimuli. A coion procedure as previously described was utilized for theark delay trials. Group Dark received 30 sessions of traith a 1-s delay interval. For this group, the mean percentaorrect responding during the last two sessions of training5.9% for Few1—400 ms, 81.3% for Many1—200 ms, 88
or Few2—800 ms, and 71.6% for Many2—400 ms. Afteressions of training with a 1-s dark delay interval, Group Lontinued to exhibit low levels of accuracy. For Group Light,ean percentage of correct responding averaged over se9 and 30 of training was 68.8% for Few1, 58.4% Many1, 67
or Few2, and 65% for Many2. Consequently, delay testingnly conducted for Group Dark. Group Dark received 20 d
esting sessions of 160 trials each. Within each session, 24or each of the four samples (Few1, Few2, Many1, and Maccurred at the 1-s baseline delay, and four trials for eachle occurred at each of the other delays (0, 2, 4, and 8 sne half of the trials involving the 1-, 2-, 4-, and 8-s delaysntire delay was spent in darkness. On the other half of
rials, the houselight was illuminated for the entire delay. Duelay testing, the correction procedure remained in effect
136 A. Santi et al. / Behavioural Processes 72 (2006) 128–138
for the 1-s dark delay trials. All other parameters remained thesame as those described previously.
9. Results and discussion
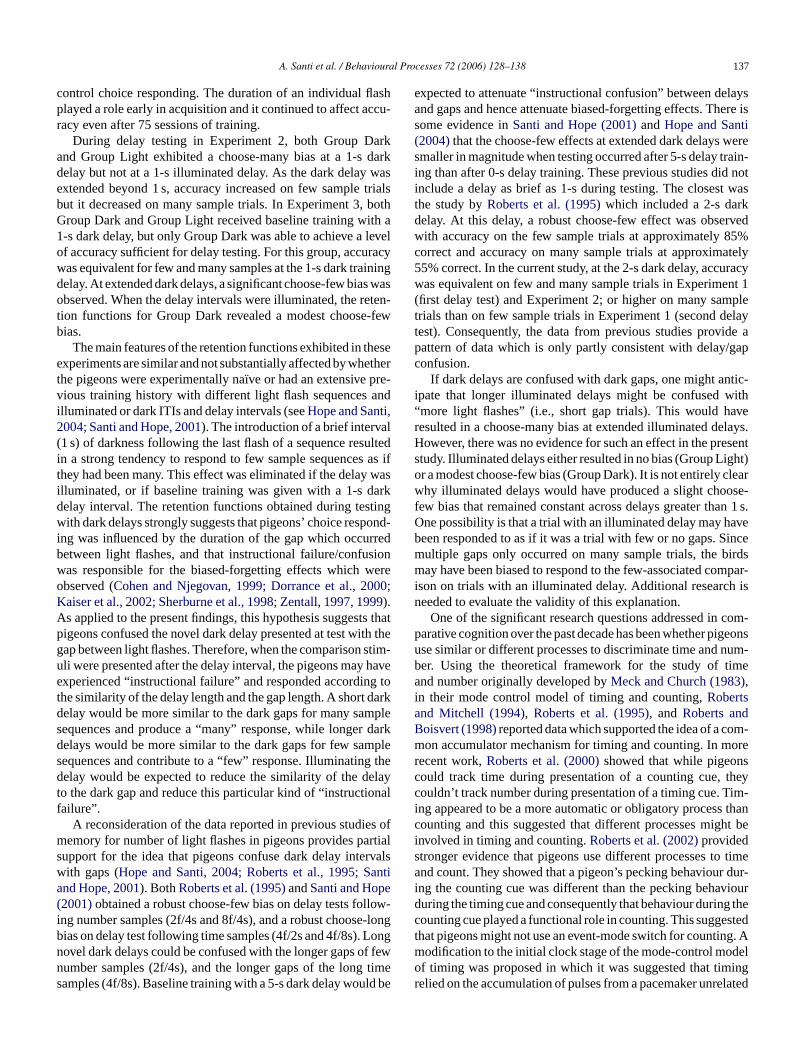
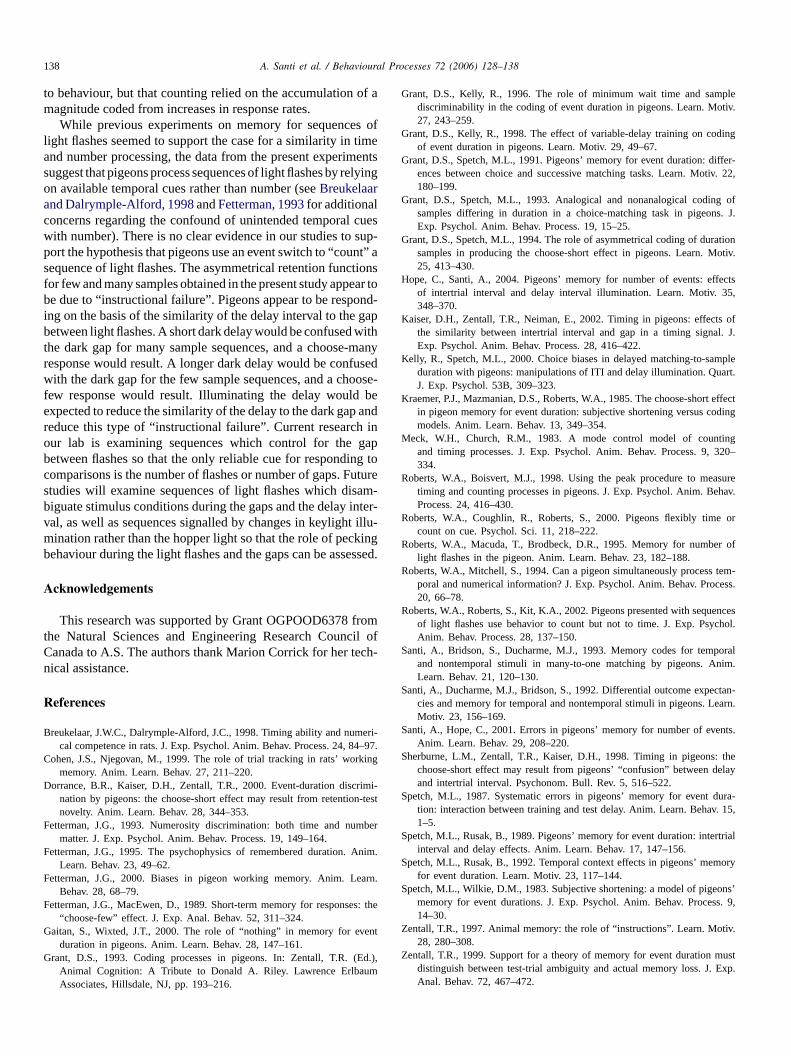
The mean percentage of correct responding during delay test-ing for Group Dark is shown inFig. 6. The top panel presentsthe data for trials with dark delay intervals, and the bottom panelpresents the data for trials with illuminated delay intervals. As inExperiment 2, one half of all 0-s delay intervals were randomlydesignated as dark delays, and the other half were randomlydesignated as illuminated delays. As expected, baseline train-ing with a 1-s dark delay eliminated the choose-many bias atthis delay value, and it also produced a larger choose-few biasat extended dark delays, than those observed in either Experi-ments 1 or 2. When the delay intervals were illuminated, GroupDark exhibited retention functions which were very similar tothose obtained in Experiment 2. A modest choose-few bias wasevident at all illuminated delay values.
Ftieotbs
An ANOVA was conducted on the delay test data with sample(few, many), set (set1, set2), delay interval illumination (dark,light) and delay interval length as within-subjects factors. Therewere significant main effects of sample,F(1, 3) = 14.94, delayinterval illumination,F(1, 3) = 19.78, and delay interval length,F(4, 12) = 37.95. There were significant two-way interactionsof sample× delay interval length,F(4, 12) = 5.35, and delayinterval illumination× delay interval length,F(4, 12) = 18.23. Inaddition, there were significant three-way interactions of sam-ple× set× delay interval illumination,F(1, 3) = 10.72, and sam-ple× delay interval illumination× delay interval length,F(4,12) = 4.45. Finally, there was a significant four-way interactionof sample× set× delay interval illumination× delay intervallength,F(4, 12) = 3.64.
A simple main effects analysis of the four-way interactionindicated that when the delay interval was dark, there was asignificant sample× set× delay interval length interaction,F(4,12) = 6.05. Increasing delay interval length significantly reducedaccuracy on many sample trials,F(1, 3) = 14.75, but not on fewsample trials,F(1, 3) = 1.31. At the 0-s delay, accuracy for fewsamples was significantly higher than for many samples but onlyfor the samples from Set2,F(1, 3) = 120.27. At the 4-s dark delay,the difference in accuracy for few and many samples was notstatistically significant,F(1, 3) = 3.70. However, at the 8-s darkdelay, accuracy was significantly higher for few samples than formany samples, both for Set1 and Set2 samples,F(1, 3) = 10.72a
aine eres ls,a anys
1
ateb encesw e, thed ons,a e dis-c ntionf inter-v ntionf in as ere
ig. 6. The mean percentage of correct responding on few- and many-samprials during delay testing following baseline training with a 1-s dark delaynterval for Group Dark in Experiment 3. The values in parentheses followingach sample type in the legend indicates the duration of the flash and the duratiof the gap for that sample. The data for test trials with dark delays are shown in th
op panel and the data for test trials in which the delay interval was illuminatedy the houselight are presented in the bottom panel. Error bars represent thtandard error of the mean.
t d byt rk.A ncesw d ont encesw ashd hichw ura-t olelyo dis-c flashd ar to
le
ne
e
nd 15.57, respectively.When the delay interval was illuminated, only the m
ffects for sample,F(1, 3) = 13.40, and delay interval length wignificant,F(4, 12) = 34.29. Across illuminated delay intervaccuracy was significantly higher for few samples than for mamples.
0. General discussion
In Experiment 1, pigeons were trained to discriminetween sequences of two and four light flashes. The sequere constructed so that the total duration of the sequencuration of an individual flash, the sum of the flash duratind the sum of the gap durations could not serve as reliablriminative cues across the four different sequences. Reteunctions exhibited a choose-many bias at a 1-s dark delayal and a choose-few bias at dark delays of 4 and 8 s. Reteunctions obtained with illuminated delay intervals resultedlight choose-few bias. In Experiment 2, additional birds wrained as in Experiment 1. However, the ITI was illuminatehe houselight for Group Light, but it was dark for Group Dacquisition of the discrimination between light flash sequeas facilitated for sequences which could be discriminate
he basis of the duration of each flash. The two sample sequhich were discriminated the best differed maximally in fluration (800 ms versus 200 ms), while the two samples were discriminated more poorly differed maximally in gap d
ion (3200 ms versus 800 ms). If the pigeons had relied sn the duration of a flash, they would not have been able toriminate the two sequences which had the same 400 msuration. Multiple features of the light flash sequences appe
A. Santi et al. / Behavioural Processes 72 (2006) 128–138 137
control choice responding. The duration of an individual flashplayed a role early in acquisition and it continued to affect accu-racy even after 75 sessions of training.
During delay testing in Experiment 2, both Group Darkand Group Light exhibited a choose-many bias at a 1-s darkdelay but not at a 1-s illuminated delay. As the dark delay wasextended beyond 1 s, accuracy increased on few sample trialsbut it decreased on many sample trials. In Experiment 3, bothGroup Dark and Group Light received baseline training with a1-s dark delay, but only Group Dark was able to achieve a levelof accuracy sufficient for delay testing. For this group, accuracywas equivalent for few and many samples at the 1-s dark trainingdelay. At extended dark delays, a significant choose-few bias wasobserved. When the delay intervals were illuminated, the reten-tion functions for Group Dark revealed a modest choose-fewbias.
The main features of the retention functions exhibited in theseexperiments are similar and not substantially affected by whetherthe pigeons were experimentally naıve or had an extensive pre-vious training history with different light flash sequences andilluminated or dark ITIs and delay intervals (seeHope and Santi,2004; Santi and Hope, 2001). The introduction of a brief interval(1 s) of darkness following the last flash of a sequence resultedin a strong tendency to respond to few sample sequences as ifthey had been many. This effect was eliminated if the delay wasilluminated, or if baseline training was given with a 1-s darkd tingw ondi rredb sionw ereo 000;KA s thap th thg stimu have g tot darkd ples dard ples g thed elayt nalf
es om rtials rvalw antia e( llow-i -lonb ongn f fewn times ld be
expected to attenuate “instructional confusion” between delaysand gaps and hence attenuate biased-forgetting effects. There issome evidence inSanti and Hope (2001)andHope and Santi(2004)that the choose-few effects at extended dark delays weresmaller in magnitude when testing occurred after 5-s delay train-ing than after 0-s delay training. These previous studies did notinclude a delay as brief as 1-s during testing. The closest wasthe study byRoberts et al. (1995)which included a 2-s darkdelay. At this delay, a robust choose-few effect was observedwith accuracy on the few sample trials at approximately 85%correct and accuracy on many sample trials at approximately55% correct. In the current study, at the 2-s dark delay, accuracywas equivalent on few and many sample trials in Experiment 1(first delay test) and Experiment 2; or higher on many sampletrials than on few sample trials in Experiment 1 (second delaytest). Consequently, the data from previous studies provide apattern of data which is only partly consistent with delay/gapconfusion.
If dark delays are confused with dark gaps, one might antic-ipate that longer illuminated delays might be confused with“more light flashes” (i.e., short gap trials). This would haveresulted in a choose-many bias at extended illuminated delays.However, there was no evidence for such an effect in the presentstudy. Illuminated delays either resulted in no bias (Group Light)or a modest choose-few bias (Group Dark). It is not entirely clearwhy illuminated delays would have produced a slight choose-f n 1 s.O aveb incem irdsm mpar-i h isn
com-p igeonsu um-b imea )ia dB om-m orer sc theyc im-i thanc ht beis timea r dur-i iourd g thec stedt g. Am delo ingr lated
elay interval. The retention functions obtained during tesith dark delays strongly suggests that pigeons’ choice resp
ng was influenced by the duration of the gap which occuetween light flashes, and that instructional failure/confuas responsible for the biased-forgetting effects which wbserved (Cohen and Njegovan, 1999; Dorrance et al., 2aiser et al., 2002; Sherburne et al., 1998; Zentall, 1997, 1999).s applied to the present findings, this hypothesis suggestigeons confused the novel dark delay presented at test wiap between light flashes. Therefore, when the comparisonli were presented after the delay interval, the pigeons mayxperienced “instructional failure” and responded accordinhe similarity of the delay length and the gap length. A shortelay would be more similar to the dark gaps for many samequences and produce a “many” response, while longerelays would be more similar to the dark gaps for few samequences and contribute to a “few” response. Illuminatinelay would be expected to reduce the similarity of the d
o the dark gap and reduce this particular kind of “instructioailure”.
A reconsideration of the data reported in previous studiemory for number of light flashes in pigeons provides pa
upport for the idea that pigeons confuse dark delay inteith gaps (Hope and Santi, 2004; Roberts et al., 1995; Snd Hope, 2001). BothRoberts et al. (1995)andSanti and Hop2001)obtained a robust choose-few bias on delay tests fong number samples (2f/4s and 8f/4s), and a robust chooseias on delay test following time samples (4f/2s and 4f/8s). Lovel dark delays could be confused with the longer gaps oumber samples (2f/4s), and the longer gaps of the longamples (4f/8s). Baseline training with a 5-s dark delay wou
-
te-e
k
f
s
g
ew bias that remained constant across delays greater thane possibility is that a trial with an illuminated delay may heen responded to as if it was a trial with few or no gaps. Sultiple gaps only occurred on many sample trials, the bay have been biased to respond to the few-associated co
son on trials with an illuminated delay. Additional researceeded to evaluate the validity of this explanation.
One of the significant research questions addressed inarative cognition over the past decade has been whether pse similar or different processes to discriminate time and ner. Using the theoretical framework for the study of tnd number originally developed byMeck and Church (1983,
n their mode control model of timing and counting,Robertsnd Mitchell (1994), Roberts et al. (1995), and Roberts anoisvert (1998)reported data which supported the idea of a con accumulator mechanism for timing and counting. In m
ecent work,Roberts et al. (2000)showed that while pigeonould track time during presentation of a counting cue,ouldn’t track number during presentation of a timing cue. T
ng appeared to be a more automatic or obligatory processounting and this suggested that different processes mignvolved in timing and counting.Roberts et al. (2002)providedtronger evidence that pigeons use different processes tond count. They showed that a pigeon’s pecking behaviou
ng the counting cue was different than the pecking behavuring the timing cue and consequently that behaviour durinounting cue played a functional role in counting. This suggehat pigeons might not use an event-mode switch for countinodification to the initial clock stage of the mode-control mof timing was proposed in which it was suggested that timelied on the accumulation of pulses from a pacemaker unre
138 A. Santi et al. / Behavioural Processes 72 (2006) 128–138
to behaviour, but that counting relied on the accumulation of amagnitude coded from increases in response rates.
While previous experiments on memory for sequences oflight flashes seemed to support the case for a similarity in timeand number processing, the data from the present experimentssuggest that pigeons process sequences of light flashes by relyingon available temporal cues rather than number (seeBreukelaarand Dalrymple-Alford, 1998andFetterman, 1993for additionalconcerns regarding the confound of unintended temporal cueswith number). There is no clear evidence in our studies to sup-port the hypothesis that pigeons use an event switch to “count” asequence of light flashes. The asymmetrical retention functionsfor few and many samples obtained in the present study appear tobe due to “instructional failure”. Pigeons appear to be respond-ing on the basis of the similarity of the delay interval to the gapbetween light flashes. A short dark delay would be confused withthe dark gap for many sample sequences, and a choose-manyresponse would result. A longer dark delay would be confusedwith the dark gap for the few sample sequences, and a choose-few response would result. Illuminating the delay would beexpected to reduce the similarity of the delay to the dark gap andreduce this type of “instructional failure”. Current research inour lab is examining sequences which control for the gapbetween flashes so that the only reliable cue for responding tocomparisons is the number of flashes or number of gaps. Futurestudies will examine sequences of light flashes which disam-b interv t illum kingb esse
A
fromt cil oC ech-n
R
B eri-4–97
C king
D rimi-n-tes
F mber
F Anim
F earn.
F s: th
G vent
G (Ed.),m
Grant, D.S., Kelly, R., 1996. The role of minimum wait time and samplediscriminability in the coding of event duration in pigeons. Learn. Motiv.27, 243–259.
Grant, D.S., Kelly, R., 1998. The effect of variable-delay training on codingof event duration in pigeons. Learn. Motiv. 29, 49–67.
Grant, D.S., Spetch, M.L., 1991. Pigeons’ memory for event duration: differ-ences between choice and successive matching tasks. Learn. Motiv. 22,180–199.
Grant, D.S., Spetch, M.L., 1993. Analogical and nonanalogical coding ofsamples differing in duration in a choice-matching task in pigeons. J.Exp. Psychol. Anim. Behav. Process. 19, 15–25.
Grant, D.S., Spetch, M.L., 1994. The role of asymmetrical coding of durationsamples in producing the choose-short effect in pigeons. Learn. Motiv.25, 413–430.
Hope, C., Santi, A., 2004. Pigeons’ memory for number of events: effectsof intertrial interval and delay interval illumination. Learn. Motiv. 35,348–370.
Kaiser, D.H., Zentall, T.R., Neiman, E., 2002. Timing in pigeons: effects ofthe similarity between intertrial interval and gap in a timing signal. J.Exp. Psychol. Anim. Behav. Process. 28, 416–422.
Kelly, R., Spetch, M.L., 2000. Choice biases in delayed matching-to-sampleduration with pigeons: manipulations of ITI and delay illumination. Quart.J. Exp. Psychol. 53B, 309–323.
Kraemer, P.J., Mazmanian, D.S., Roberts, W.A., 1985. The choose-short effectin pigeon memory for event duration: subjective shortening versus codingmodels. Anim. Learn. Behav. 13, 349–354.
Meck, W.H., Church, R.M., 1983. A mode control model of countingand timing processes. J. Exp. Psychol. Anim. Behav. Process. 9, 320–334.
Roberts, W.A., Boisvert, M.J., 1998. Using the peak procedure to measuretiming and counting processes in pigeons. J. Exp. Psychol. Anim. Behav.
R e or
R r of
R tem-cess.
R enceschol.
S poralnim.
S ctan-earn.
S ents.
S theelay
S dura-v. 15,
S rtrial
S mory
S ons’ss. 9,
Z tiv.
Z mustExp.
iguate stimulus conditions during the gaps and the delayal, as well as sequences signalled by changes in keylighination rather than the hopper light so that the role of pecehaviour during the light flashes and the gaps can be ass
cknowledgements
This research was supported by Grant OGPOOD6378he Natural Sciences and Engineering Research Counanada to A.S. The authors thank Marion Corrick for her tical assistance.
eferences
reukelaar, J.W.C., Dalrymple-Alford, J.C., 1998. Timing ability and numcal competence in rats. J. Exp. Psychol. Anim. Behav. Process. 24, 8
ohen, J.S., Njegovan, M., 1999. The role of trial tracking in rats’ wormemory. Anim. Learn. Behav. 27, 211–220.
orrance, B.R., Kaiser, D.H., Zentall, T.R., 2000. Event-duration discnation by pigeons: the choose-short effect may result from retentionovelty. Anim. Learn. Behav. 28, 344–353.
etterman, J.G., 1993. Numerosity discrimination: both time and numatter. J. Exp. Psychol. Anim. Behav. Process. 19, 149–164.
etterman, J.G., 1995. The psychophysics of remembered duration.Learn. Behav. 23, 49–62.
etterman, J.G., 2000. Biases in pigeon working memory. Anim. LBehav. 28, 68–79.
etterman, J.G., MacEwen, D., 1989. Short-term memory for response“choose-few” effect. J. Exp. Anal. Behav. 52, 311–324.
aitan, S., Wixted, J.T., 2000. The role of “nothing” in memory for eduration in pigeons. Anim. Learn. Behav. 28, 147–161.
rant, D.S., 1993. Coding processes in pigeons. In: Zentall, T.R.Animal Cognition: A Tribute to Donald A. Riley. Lawrence ErlbauAssociates, Hillsdale, NJ, pp. 193–216.
--
d.
f
.
t
.
e
Process. 24, 416–430.oberts, W.A., Coughlin, R., Roberts, S., 2000. Pigeons flexibly tim
count on cue. Psychol. Sci. 11, 218–222.oberts, W.A., Macuda, T., Brodbeck, D.R., 1995. Memory for numbe
light flashes in the pigeon. Anim. Learn. Behav. 23, 182–188.oberts, W.A., Mitchell, S., 1994. Can a pigeon simultaneously process
poral and numerical information? J. Exp. Psychol. Anim. Behav. Pro20, 66–78.
oberts, W.A., Roberts, S., Kit, K.A., 2002. Pigeons presented with sequof light flashes use behavior to count but not to time. J. Exp. PsyAnim. Behav. Process. 28, 137–150.
anti, A., Bridson, S., Ducharme, M.J., 1993. Memory codes for temand nontemporal stimuli in many-to-one matching by pigeons. ALearn. Behav. 21, 120–130.
anti, A., Ducharme, M.J., Bridson, S., 1992. Differential outcome expecies and memory for temporal and nontemporal stimuli in pigeons. LMotiv. 23, 156–169.
anti, A., Hope, C., 2001. Errors in pigeons’ memory for number of evAnim. Learn. Behav. 29, 208–220.
herburne, L.M., Zentall, T.R., Kaiser, D.H., 1998. Timing in pigeons:choose-short effect may result from pigeons’ “confusion” between dand intertrial interval. Psychonom. Bull. Rev. 5, 516–522.
petch, M.L., 1987. Systematic errors in pigeons’ memory for eventtion: interaction between training and test delay. Anim. Learn. Beha1–5.
petch, M.L., Rusak, B., 1989. Pigeons’ memory for event duration: inteinterval and delay effects. Anim. Learn. Behav. 17, 147–156.
petch, M.L., Rusak, B., 1992. Temporal context effects in pigeons’ mefor event duration. Learn. Motiv. 23, 117–144.
petch, M.L., Wilkie, D.M., 1983. Subjective shortening: a model of pigememory for event durations. J. Exp. Psychol. Anim. Behav. Proce14–30.
entall, T.R., 1997. Animal memory: the role of “instructions”. Learn. Mo28, 280–308.
entall, T.R., 1999. Support for a theory of memory for event durationdistinguish between test-trial ambiguity and actual memory loss. J.Anal. Behav. 72, 467–472.