Abdominal adiposity and hot flashes among midlife women
14
Abdominal adiposity and hot flashes among midlife women Rebecca C. Thurston, PhD 1,3 , MaryFran R. Sowers, PhD 2 , Kim Sutton-Tyrrell, DrPH 3 , Susan A. Everson-Rose, PhD, MPH 4 , Tené T. Lewis, PhD 5 , Daniel Edmundowicz, MD, MS 6 , and Karen A. Matthews, PhD 1,3 1 Department of Psychiatry, University of Pittsburgh School of Medicine, Pittsburgh, PA 2 Department of Epidemiology, University of Michigan School of Public Health, Ann Arbor, MI 3 Department of Epidemiology, University of Pittsburgh Graduate School of Public Health, Pittsburgh, PA 4 Department of Preventive Medicine, Rush University Medical Center, Chicago, IL 5 Department of Epidemiology and Public Health, Yale University School of Medicine, New Haven, CT 6 Cardiovascular Institute, University of Pittsburgh School of Medicine, Pittsburgh, PA Abstract Objective—Two competing hypotheses suggest how adiposity may affect menopausal hot flashes. The “thin hypothesis” asserts that aromatization of androgens to estrogens in body fat should be associated with decreased hot flashes. Conversely, thermoregulatory models argue that body fat should be associated with increased hot flashes. The study objective was to examine associations between abdominal adiposity and hot flashes, including the role of reproductive hormones in these associations. Design—The Study of Women's Health Across the Nation Heart Study (2001-2003) is an ancillary study to the Study of Women's Health Across the Nation, a community-based cohort study. Participants were 461 women (35% African American, 65% white) ages 45 to 58 years with an intact uterus and at least one ovary. Measures included a computed tomography scan to assess abdominal adiposity; reported hot flashes over the previous 2 weeks; and a blood sample for measurement of follicle-stimulating hormone, estradiol, and sex hormone-binding globulin- adjusted estradiol (free estradiol index). Associations were evaluated within multivariable logistic and linear regression models. Results—Every 1-SD increase in total (odds ratio [OR] = 1.28; 95% CI: 1.06-1.55) and subcutaneous (OR = 1.30; 95% CI: 1.07-1.58) abdominal adiposity was associated with increased odds of hot flashes in age- and site-adjusted models. Visceral adiposity was not associated with hot flashes. Associations were not reduced when models included reproductive hormone concentrations. Conclusion—Increased abdominal adiposity, particularly subcutaneous adiposity, is associated with increased odds of hot flashes, favoring thermoregulatory models of hot flashes. Body fat may not protect women from hot flashes as once thought. Address correspondence to: Rebecca C. Thurston, PhD, University of Pittsburgh, 3811 O'Hara Street; Pittsburgh, PA 15217. [email protected]. Financial disclosure: None reported. NIH Public Access Author Manuscript Menopause. Author manuscript; available in PMC 2010 May 25. Published in final edited form as: Menopause. 2008 ; 15(3): 429–434. doi:10.1097/gme.0b013e31815879cf. NIH-PA Author Manuscript NIH-PA Author Manuscript NIH-PA Author Manuscript
Transcript of Abdominal adiposity and hot flashes among midlife women
Abdominal adiposity and hot flashes among midlife women
Rebecca C. Thurston, PhD1,3, MaryFran R. Sowers, PhD2, Kim Sutton-Tyrrell, DrPH3,Susan A. Everson-Rose, PhD, MPH4, Tené T. Lewis, PhD5, Daniel Edmundowicz, MD, MS6,and Karen A. Matthews, PhD1,31Department of Psychiatry, University of Pittsburgh School of Medicine, Pittsburgh, PA2Department of Epidemiology, University of Michigan School of Public Health, Ann Arbor, MI3Department of Epidemiology, University of Pittsburgh Graduate School of Public Health,Pittsburgh, PA4Department of Preventive Medicine, Rush University Medical Center, Chicago, IL5Department of Epidemiology and Public Health, Yale University School of Medicine, New Haven,CT6Cardiovascular Institute, University of Pittsburgh School of Medicine, Pittsburgh, PA
AbstractObjective—Two competing hypotheses suggest how adiposity may affect menopausal hotflashes. The “thin hypothesis” asserts that aromatization of androgens to estrogens in body fatshould be associated with decreased hot flashes. Conversely, thermoregulatory models argue thatbody fat should be associated with increased hot flashes. The study objective was to examineassociations between abdominal adiposity and hot flashes, including the role of reproductivehormones in these associations.
Design—The Study of Women's Health Across the Nation Heart Study (2001-2003) is anancillary study to the Study of Women's Health Across the Nation, a community-based cohortstudy. Participants were 461 women (35% African American, 65% white) ages 45 to 58 years withan intact uterus and at least one ovary. Measures included a computed tomography scan to assessabdominal adiposity; reported hot flashes over the previous 2 weeks; and a blood sample formeasurement of follicle-stimulating hormone, estradiol, and sex hormone-binding globulin-adjusted estradiol (free estradiol index). Associations were evaluated within multivariable logisticand linear regression models.
Results—Every 1-SD increase in total (odds ratio [OR] = 1.28; 95% CI: 1.06-1.55) andsubcutaneous (OR = 1.30; 95% CI: 1.07-1.58) abdominal adiposity was associated with increasedodds of hot flashes in age- and site-adjusted models. Visceral adiposity was not associated withhot flashes. Associations were not reduced when models included reproductive hormoneconcentrations.
Conclusion—Increased abdominal adiposity, particularly subcutaneous adiposity, is associatedwith increased odds of hot flashes, favoring thermoregulatory models of hot flashes. Body fat maynot protect women from hot flashes as once thought.
Address correspondence to: Rebecca C. Thurston, PhD, University of Pittsburgh, 3811 O'Hara Street; Pittsburgh, PA [email protected] disclosure: None reported.
NIH Public AccessAuthor ManuscriptMenopause. Author manuscript; available in PMC 2010 May 25.
Published in final edited form as:Menopause. 2008 ; 15(3): 429–434. doi:10.1097/gme.0b013e31815879cf.
NIH
-PA Author Manuscript
NIH
-PA Author Manuscript
NIH
-PA Author Manuscript
KeywordsHot flashes; Abdominal adiposity; Vasomotor symptoms; Body fat; Central adiposity; Menopause
Approximately 70% of women in the United States experience hot flashes during themenopausal transition1,2 or episodes of intense heat often accompanied by flushing andsweating.2 Hot flashes are associated with reported sleep disturbance,3 negative mood,4 andimpaired quality of life5 and are a leading determinant of seeking menopause-relatedmedical care during midlife.6 However, the safety of a leading treatment for hot flashes,hormone therapy (HT), has come into question following the release of the Women's HealthInitiative findings,7 leading to calls for other safe and effective methods for the managementof hot flashes.8 An obstacle to developing other treatments has been the incompleteunderstanding of the risk factors for and etiology of hot flashes.
It has been proposed that body size and composition can influence the risk of hot flashes.The “thin hypothesis”9,10 asserts that women with more adipose tissue would have highercirculating estrogen and thus would have a lower risk of hot flashes. Hot flashes are believedto be due in part to declining estrogen levels. With diminished cyclic estradiol (E2) secretionfrom the ovary during the menopausal transition,2 adipose tissue may provide asupplemental source of estrogen due to aromatization of androstenedione to estrone (E1) andlimited conversion of E1 to E2 via 17β-hydroxysteroid dehydrogenase. Thus, according tothe thin hypothesis, women with more adipose tissue would have a lower risk of hot flashes.
Recent findings showing increased hot flashes among women with higher body mass index(BMI) have called the thin hypothesis into question.1,11,12 These findings are consistentwith thermoregulatory models of hot flashes, emphasizing the altered thermoregulatoryfunctioning observed among symptomatic menopausal women.13 According to thesemodels, the thermoneutral zone of symptomatic menopausal women is narrowed, smallincreases in core body temperature are perceived as too hot, and hot flashes are attempts todissipate heat and reduce core body temperature. Thus, factors that inhibit heat dissipation,such as adiposity, would increase hot flashes. This effect would be particularly apparent forsubcutaneous fat, which has potent insulating properties.14,15
Despite the critical role of adipose tissue in both the thin hypothesis and thermoregulatorymodels of hot flashes,9,10,13 little research has examined the association between bodycomposition and hot flashes. Previous research has been limited to weight or BMI, whichdoes not discriminate between lean and adipose tissue. Thus, the nature of the associationbetween adiposity and hot flashes is unclear.
Our primary aim was to examine associations between abdominal adiposity and hot flashesamong African American and white women transitioning through menopause. Consistentwith thermoregulatory models, we hypothesized that women with greater abdominaladiposity would be more likely to report hot flashes. We considered total abdominaladiposity and its components: subcutaneous adiposity (adipose tissue between skin andabdominal muscle wall) and visceral adiposity (adipose tissue behind the abdominal musclewall and in the peritoneal space around internal organs). We hypothesized that theassociation between adiposity and hot flashes would be strongest for subcutaneousadiposity. Finally, we evaluated evidence of the thin hypothesis, examining associationsbetween reproductive hormones and hot flashes, adiposity and reproductive hormones, andthe role of reproductive hormones in the association between adiposity and hot flashes. Weconsidered the hormones most consistently linked to hot flashes: folliclestimulating
Thurston et al. Page 2
Menopause. Author manuscript; available in PMC 2010 May 25.
NIH
-PA Author Manuscript
NIH
-PA Author Manuscript
NIH
-PA Author Manuscript

hormone (FSH), E2, and free estradiol index (FEI), the estimate of biologically activeE2.16,17
MethodsStudy population
The Study of Women's Health Across the Nation (SWAN) is a multiethnic cohort studydesigned to characterize the biological and psychosocial changes over the menopausaltransition. This study was conducted across seven sites in the United States. SWANparticipants (N = 3,302) were aged 42 to 52 years at time of enrollment, had an intact uterusand at least one ovary, were not pregnant or breast-feeding, had menstruated within the past3 months, and were not using oral contraceptives or HT. Details of the study design andrecruitment procedures have been previously reported.18 The baseline SWAN examinationoccurred in 1996 to 1997. The study was approved by the institutional review board at eachsite, and each participant provided written informed consent.
A subcohort of women at Pittsburgh and Chicago SWAN sites participated in the SWANHeart Study, an ancillary study that included computed tomography (CT) for assessment ofabdominal adiposity (n = 558). The present analysis is a cross-sectional analysis of SWANHeart Study data. The SWAN Heart CT assessment occurred once during SWAN studyyears 4 to 7 (2001-2003) within 3 months following the corresponding annual core SWANinterview and blood draw. By design,18 Pittsburgh and Chicago sites recruited only non-Hispanic white and African American women; therefore, all enrolled SWAN Heartparticipants described themselves as either white or African American. All eligible SWANparticipants were invited to participate in the SWAN Heart Study, and of these eligiblewomen, 76% enrolled. Exclusions for SWAN Heart included pregnancy; hysterectomy orbilateral oophorectomy; self-reported cardiovascular disease or diabetes; and medicationsfor hypertension, cardiovascular disease, arrhythmias, or HT at the time of enrollment. Themajority of enrollment for SWAN Heart occurred in SWAN years 4 to 7. However, becausescreening and enrollment began at the Pittsburgh site in year 1, by the time of the CT scan inSWAN years 4 to 7, a minority of participants (n = 51) were using HT at the time of thescan.
Of these 558 SWAN Heart participants, 13 women were excluded from this analysis due tohaving undergone hysterectomy or bilateral oophorectomy, and 77 women were excludeddue to missing values on one or more covariates (hot flashes, n = 53; menopausal status, n =3; anxiety symptoms, n = 8; HT use, n = 3; education; n = 19; nine women had more thanone missing value). An additional seven women were excluded for physiologicallyimplausible abdominal adiposity values. Missing smoking data were carried forward fromthe last completed assessment for one woman. Women with versus women without missingdata were more likely to be younger (P = 0.007), African American (P = 0.0009), and fromthe Chicago site (P < 0.0001). The final sample for evaluation of the primary hypothesesincluded 461 women (160 African American, 301 white). Analyses including hormonalmeasures excluded an additional 19 women missing hormonal data.
Design and proceduresHot flashes—All participants completed an interview, physical examination, blood draw,and questionnaires at the core SWAN baseline and annually thereafter. Hot flashes assessedat the annual core SWAN interview corresponding to the SWAN Heart assessment wereused in the present analyses. Participants self-reported the number of days on which hotflashes were experienced (not at all, 1-5 d, 6-8 d, 9-13 d, every day) in the 2 weeks before
Thurston et al. Page 3
Menopause. Author manuscript; available in PMC 2010 May 25.
NIH
-PA Author Manuscript
NIH
-PA Author Manuscript
NIH
-PA Author Manuscript
the interview. Women were categorized as experiencing any or no hot flashes based uponindication of a threshold effect at any versus no hot flashes.
Abdominal adiposity—Adiposity was measured using an electron beam CT scan takenduring the SWAN Heart baseline assessment, occurring within 3 months after the annualcore SWAN interview and blood draw. A 6-mm thick transverse image between L4 and L5was obtained during suspended respiration with a C-150 Ultrafast CT Scanner (GE Imatron,San Francisco, CA). Scans were read by a single reader at the University of Pittsburgh. Apixel range of −30 to −190 Hounsfield units was used to define fat in the scancircumference. The area of adipose tissue was defined using image analysis (AcuImagesoftware, South San Francisco, CA). A region of interest line was drawn at the interior ofabdominal musculature along the fascial plane. Fat within this area was considered visceralfat area. The fat area for the entire image was determined, and subcutaneous fat wascalculated as the difference between the whole image and visceral fat area. Interobserverreliability was determined by repeat reads performed on 10 scans, revealing intraclasscoefficient values of 0.97 and 0.94 for total and visceral fat area, respectively. Abdominaladiposity was correlated with BMI at r = 0.86 (P < 0.0001) for total adiposity, r = 0.81 (P <0.0001) for subcutaneous adiposity, and r = 0.71 (P < 0.0001) for visceral adiposity.
Reproductive hormones—Concentrations of FSH, E2, and sex hormone-bindingglobulin (SHBG) were obtained from a single morning fasting blood sample during theannual core SWAN visit corresponding to the baseline SWAN Heart visit. Participants werescheduled for venipuncture on days 2 to 5 of a spontaneous menstrual cycle. Two attemptswere made to obtain a day 2 to 5 sample. If a timed sample could not be obtained, a randomfasting sample was taken. A timed sample was obtained for 35% of the sample. Blood wasrefrigerated before centrifugation 1 to 2 hours after phlebotomy, and the serum wasaliquotted, frozen, and batched for shipment to the central laboratory. Samples werecatalogued and assayed in a batch monthly on arrival. Assays were performed on theACS-180 automated analyzer (Bayer Diagnostics Corporation, Tarrytown, NY) using adouble-antibody chemiluminescent immunoassay with a solid phase anti-IgGimmunoglobulin conjugated to paramagnetic particles, anti/ligand antibody, and competitiveligand labeled with dimethylacridinium ester. The FSH assay is a modification of a manualassay kit (Bayer Diagnostics) using two monoclonal antibodies directed to different regionson the beta subunit, with a lower limit of detection of 1.05 mIU/mL. The E2 assay modifiesthe rabbit anti/E2-6 ACS-180 immunoassay to increase sensitivity, with a lower limit ofdetection of 1.0 pg/mL. The SHBG assay was developed on site using rabbit anti/DHEA-Sand anti-SHBG antibodies, with a lower limit of detection of 1.52 μg/dL and 1.95 nM,respectively. Duplicate E2 assays were conducted with results reported as the arithmeticmean for each participant, with a coefficient of variation of 3% to 12%. All other assayswere single determinations. FEI, an estimate of bioavailable E2, was calculated as 100 × E2(pg/ mL)/272.11 × SHBG (nM).19 The laboratory performing the assays was blinded toadiposity status.
Covariates—Race/ethnicity and educational attainment (years of completed education,categorized into high school, some college/vocational school, college degree or higher) werederived from the baseline SWAN interview. Race/ethnicity was determined in response tothe open-ended question: “How would you describe your primary racial or ethnic group?”Age, smoking status (current versus past/never), menopausal status, and anxiety symptomsassessed annually were derived from the annual core SWAN interview corresponding to theSWAN Heart visit. Menopausal status was obtained annually from self-reported bleedingpatterns reflecting the year preceding the visit and were categorized as follows: bleeding inthe previous 3 months with no change in cycle predictability in the past year was considered
Thurston et al. Page 4
Menopause. Author manuscript; available in PMC 2010 May 25.
NIH
-PA Author Manuscript
NIH
-PA Author Manuscript
NIH
-PA Author Manuscript
premenopausal, bleeding the previous 3 months with a decrease in cycle predictability in thepast year was considered early perimenopausal, less than 12 and more than 3 months ofamenorrhea was considered late perimenopausal, and 12 months or more of amenorrhea wasconsidered postmenopausal. Women previously classified as pre- or perimenopausal whoreported hormone use (HT or oral contraceptives) since the last study were classified asindeterminate status due to the potential impact of hormone use on bleeding patterns.Women reporting taking hormones within the past 3 months were classified as hormoneusers. Given the impact of certain antidepressants on hot flashes,20 antidepressant use(reported use of medications for a nervous condition, eg, sedatives, antidepressants since thelast study visit) was also considered as a covariate. Anxiety symptoms, strongly associatedwith hot flashes,1,16 were a sum score of the number of days in the past 2 weeks (0 = nodays to 4 = every day) reporting irritability or grouchiness, feeling tense or nervous, heartpounding or racing, and feeling fearful for no reason.
Data analysisDemographic, psychosocial, and medical characteristics associated with hot flashes oradiposity were estimated by t tests and χ2 analyses. Associations between adiposity (total,visceral, subcutaneous) and hot flashes were estimated in three separate logistic regressionmodels. Results are presented with standardized adiposity values to increase interpretabilityof findings, and thus odds ratios reflect those associated with a 1-SD increase in adiposity.Covariates included age, site, race/ethnicity, educational attainment, menopausal status,smoking status, hormone use, antidepressant use, and anxious symptoms.
Associations between reproductive hormones FSH, E2, and FEI and hot flashes wereestimated with logistic regression. Associations between adiposity and log-transformedFSH, E2, and FEI measures, considered separately, were estimated with linear regression.Covariates for hormonal models included age, site, race/ethnicity, cycle day of blood draw,education, hormone use, and smoking. Reproductive hormones significantly associated withboth hot flashes and adiposity were included in logistic regression models examiningassociations between adiposity and hot flashes. Effect modification by race/ethnicity andmenopausal status were evaluated in all models. Because no significant interactions wereobserved, interactions were not included in final models. Analyses were performed withSAS version 8.2 (SAS Institute, Cary, NC) and were two sided at α = 0.05.
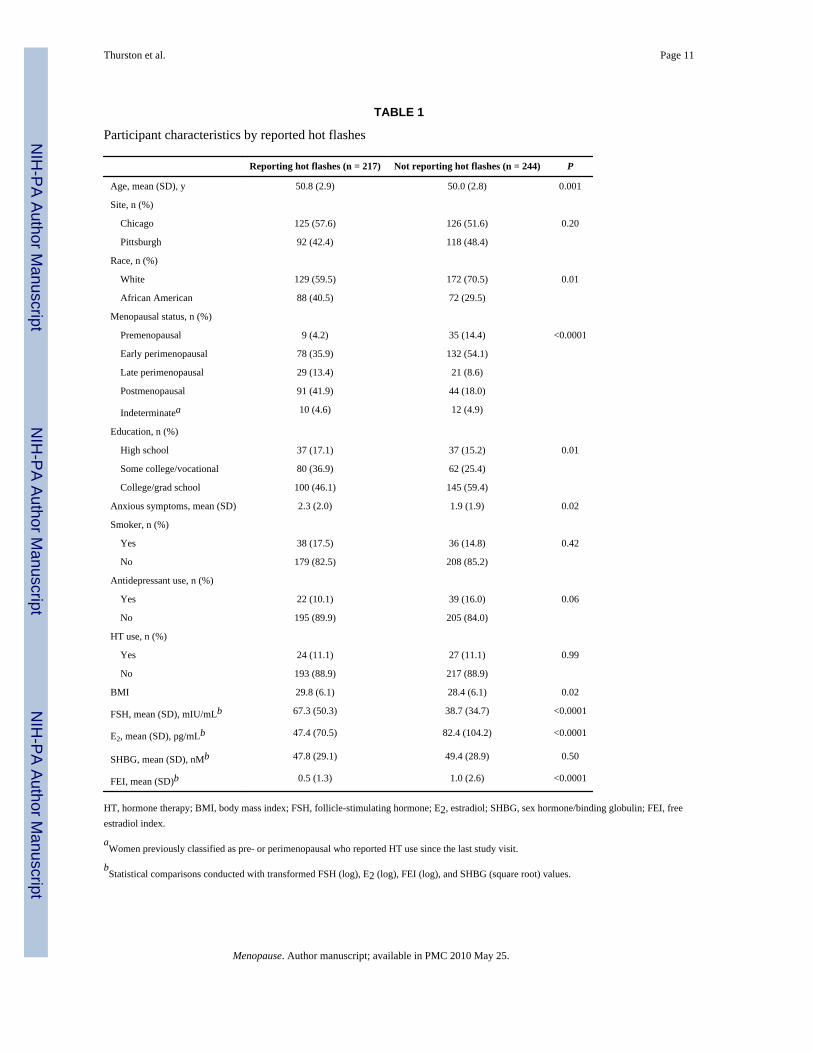
ResultsSample characteristics are presented in Table 1. Consistent with the full SWAN cohort,1,17
factors significantly associated with reporting hot flashes were age, race/ethnicity,education, menopausal status, anxiety symptoms, FSH, E2, and FEI. Mean (SD) adipositylevels were 455.3 (195.3) cm2 for total abdominal adiposity and 121.5 (64.3) cm2 and 333.7(150.7) cm2 for components visceral and subcutaneous adiposity, respectively. AfricanAmerican women had higher total adiposity (mean [SD], African American women: 486.7[187.8] cm2 versus white women: 438.6 [197.5] cm2, P = 0.01) and subcutaneous adiposity(African American women: 368.4 [151.3] cm2 versus white women: 315.4 [147.4] cm2, P =0.0003), but not visceral adiposity (African American women: 118.3 [53.0] cm2, whitewomen: 123.2 [69.6] cm2, P = not significant), relative to white women.
Greater total abdominal adiposity was significantly associated with higher odds of reportinghot flashes (Table 2). Examination of components visceral and subcutaneous adiposityindicated that this association was driven by significant associations observed forsubcutaneous adiposity. For example, a 1-SD (151 cm2) increase in subcutaneous adiposityconferred 30% increased odds of hot flashes in an age- and site-adjusted model. Theseassociations remained statistically significant in fully adjusted models. Visceral adiposity
Thurston et al. Page 5
Menopause. Author manuscript; available in PMC 2010 May 25.
NIH
-PA Author Manuscript
NIH
-PA Author Manuscript
NIH
-PA Author Manuscript
was not significantly related to hot flashes. Examination of mean (SD) adiposity levels byhot flashes confirmed this pattern of results for total (with hot flashes: 479.3 [193.2] cm2,without hot flashes: 431.9 [194.9] cm2, P = 0.008), subcutaneous (with hot flashes: 351.8[148.9] cm2, without hot flashes: 315.4 [150.9] cm2, P = 0.008), and visceral adiposity (withhot flashes: 127.5 [65.9] cm2, without hot flashes: 116.5 [62.5] cm2, P = 0.06). Nosignificant interactions in the relationship between adiposity and hot flashes by race/ethnicity or by menopausal stage (P values > 0.25) were observed.
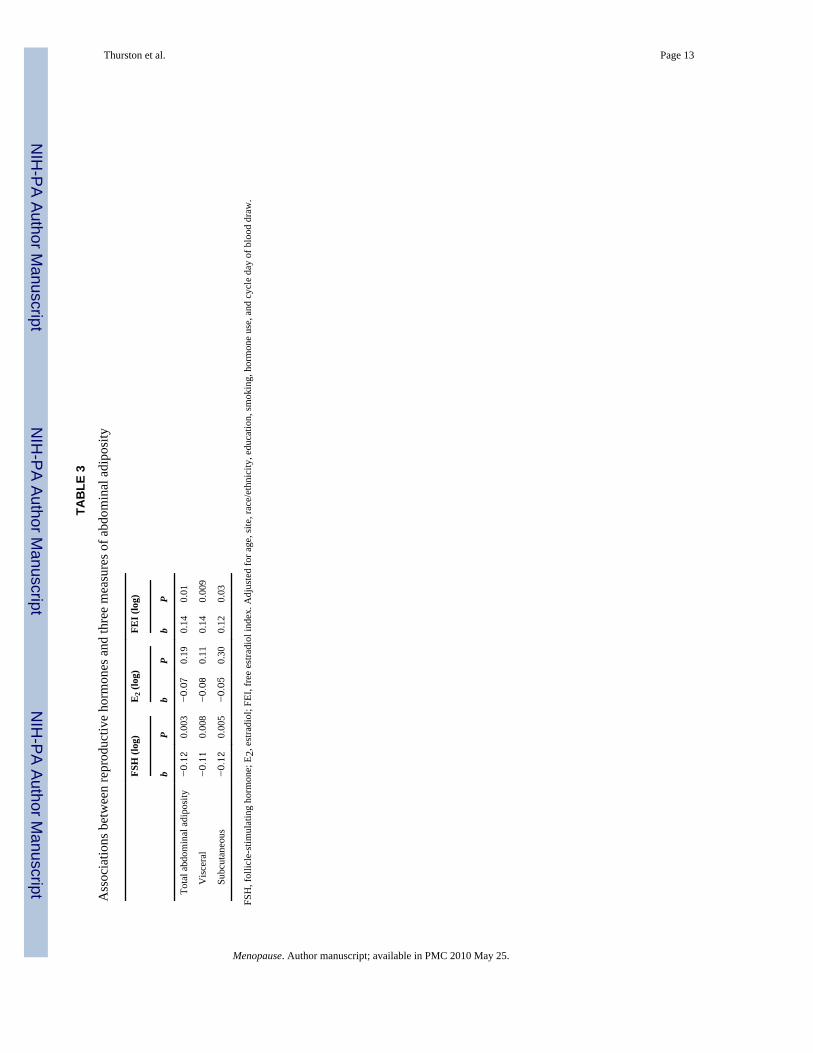
Considering evidence of the thin hypothesis, FSH (OR = 1.64; 95% CI: 1.28-2.11) wassignificantly and positively associated with hot flashes, and E2 (OR = 0.65; 95% CI:0.53-0.81) and FEI (OR = 0.73; 95% CI: 0.61-0.89) were significantly and negativelyassociated with hot flashes in fully adjusted models. Moreover, linear regression modelsindicated that increased total, subcutaneous, and visceral adiposity was associated withlower levels of FSH and higher levels of FEI (Table 3). Inclusion of FSH and FEI, thehormones significantly related to adiposity and hot flashes, failed to diminish the positiveassociation between adiposity and hot flashes (Table 4). For example, when FSH and FEIwere added to fully adjusted models, every 1-SD (151 cm2) increase in subcutaneousadiposity was associated with a 37% and 33% increased odds of hot flashes, respectively.
DiscussionThese findings challenge standard thinking that thinner women, or those with less body fat,are at increased risk of hot flashes. The present findings demonstrated that women withincreased abdominal adiposity, and particularly subcutaneous abdominal adiposity, weremore likely to report hot flashes. Because previous research has solely considered BMI,which does not measure adipose tissue, these findings provide stronger evidence against thethin hypothesis. Together with findings with BMI,1,11,12 they suggest the potentialimportance of considering obesity, and subcutaneous adiposity in particular, as a risk factorfor hot flashes.
The overall association between abdominal adiposity and hot flashes was positive,consistent with thermoregulatory models of hot flashes. We also evaluated the contributionof reproductive hormones, recognizing that these concentrations reflect the contribution ofestrogen from the ovary rather than aromatization of androstenedione from adipose tissue,limiting conclusions about peripheral production. However, we are operating under theassumption that these measures are a fair approximation of the total estrogen contributionbecause 70% of women are not postmenopausal and E2 is a more potent estrogen than E1.Although FSH and FEI were associated with both adiposity and hot flashes, adjusting forthese hormones failed to attenuate the association between abdominal adiposity and hotflashes. Further investigation with more complete hormonal assessment is warranted.However, these findings suggest that although abdominal adipose tissue may have boththermoregulatory and endocrine properties, the insulating properties of adipose tissue maybe more strongly related to hot flashes.
Thermoregulatory models of hot flashes conceptualize hot flashes as attempts to dissipateheat in the context of a narrowed thermoneutral zone.13 The observation that positiveassociations between abdominal adiposity and hot flashes were most pronounced forsubcutaneous fat is consistent with these models. The potent insulating properties ofsubcutaneous fat are well known, with evidence indicating that it insulates three times aswell as muscle.14 Moreover, in these investigations, the amount of heat dissipated isinversely related to subcutaneous adipose tissue thickness.15 Thus, increased subcutaneousadiposity would prevent the heat-dissipating action of hot flashes and require more hotflashes to achieve requisite heat loss.13
Thurston et al. Page 6
Menopause. Author manuscript; available in PMC 2010 May 25.
NIH
-PA Author Manuscript
NIH
-PA Author Manuscript
NIH
-PA Author Manuscript
The adiposity values obtained here are consistent with what would be expected of amultiethnic community sample of women in this age range.21-26 However, it is notable thatlarge community-based studies that include CT-assessed abdominal adiposity in a sample ofAfrican American and white midlife women are few. In the present investigation, adifferential distribution of adiposity was observed between racial/ethnic groups, withproportionately lower contribution of visceral to total adiposity levels among AfricanAmerican relative to white women. This finding is consistent with previous investigations.26-28
There is considerable interest in behavioral interventions for hot flashes. For example,aerobic exercise has been suggested as one initial approach to managing hot flashes.29
However, associations between exercise and hot flashes have been highly inconsistent,30-32
and randomized trials are few. In light of the present findings, interventions focused on fatreduction for the management of hot flashes may deserve further investigation. Theseinterventions may be particularly important during a period of life characterized byprogressive increases in adiposity,33 including abdominal adiposity.34
The present findings should be interpreted in the context of several limitations. First, SWANHeart participants underwent a single annual blood draw, which, given the hormonalfluctuations during perimenopause, is a less optimal measure than daily hormoneassessments. This method may have increased error and biased findings to the null.However, significant associations were observed for hormonal measures in relation to bothadiposity and hot flashes. Second, this study included assessment of abdominal adiposityrather than total adiposity. The relationship between total adiposity and hot flashes cannot bedetermined from this study. Third, this study was a cross-sectional analysis, limitingconclusions about the causal nature of associations and how the observed associations maychange over time, including later in postmenopause. Fourth, not unlike most epidemiologicinvestigations, hot flashes were measured via a brief self-report instrument that yieldslimited information about hot flashes. Compared with physiologic measures, reported hotflashes may be influenced by factors such as mood and affect.35 However, controlling foranxious symptoms, strongly related to hot flashes,1,16 did not reduce these associations.Finally, this study included African American and white women. Whether these findingsextend to other groups is unknown.
ConclusionsThis study has several notable strengths. It is the first to examine associations betweenabdominal adiposity and hot flashes, providing the strongest evidence to date that theassociation between abdominal adiposity and hot flashes is positive. This study evaluatedhow subtypes of adiposity, such as visceral versus subcutaneous abdominal adiposity, mayshow differential associations with hot flashes. Moreover, these results can help to providefurther evidence in support of key etiologic models, such as thermoregulatory models of hotflashes. Should these results be replicated, they may point to promising interventions, suchas fat loss, for the prevention and management of hot flashes. Finally, clinicians treatingmenopausal symptoms should not presume that obese women escape debilitating hotflashes.
AcknowledgmentsThe authors thank the study staff at each site and all the women who participated in SWAN.
Funding/support: The Study of Women's Health Across the Nation (SWAN) has grant support from the NationalInstitutes of Health, Department of Health and Human Services, through the National Institute on Aging, theNational Institute of Nursing Research and the NIH Office of Research on Women's Health (grants AG012505,
Thurston et al. Page 7
Menopause. Author manuscript; available in PMC 2010 May 25.
NIH
-PA Author Manuscript
NIH
-PA Author Manuscript
NIH
-PA Author Manuscript
AG012546). SWAN Heart was supported by grants from the National Institutes of Health, National Heart Lung andBlood Institute (grants HL065581, HL065591).
Clinical Centers: Rush University, Rush University Medical Center, Chicago, IL: Lynda Powell, PI and theUniversity of Pittsburgh, Pittsburgh, PA: Karen Matthews, PI.
NIH Program Office: National Institute on Aging, Bethesda, MD: Marcia Ory, 1994 to 2001; Sherry Sherman, 1994to present; National Institute of Nursing Research, Bethesda, MD, Program Officers.
Central Laboratory: University of Michigan, Ann Arbor: Daniel McConnell (Central Ligand Assay SatelliteServices).
Coordinating Center: New England Research Institutes, Water-town, MA: Sonja McKinlay, PI, 1995 to 2001;University of Pittsburgh, Pittsburgh, PA: Kim Sutton-Tyrrell, PI, 2001 to present.
Steering Committee: Chris Gallagher, Chair, Susan Johnson, Chair.
References1. Gold E, Colvin A, Avis N, et al. Longitudinal analysis of vasomotor symptoms and race/ethnicity
across the menopausal transition: Study of Women's Health Across the Nation (SWAN). Am JPublic Health 2006;96:1226–1235. [PubMed: 16735636]
2. Kronenberg, F. Hot flashes. In: Lobo, RA., editor. Treatment of the Post-menopausal Woman.Philadelphia: Lippincott Williams & Wilkins; 1999.
3. Kravitz HM, Ganz PA, Bromberger J, Powell LH, Sutton-Tyrrell K, Meyer PM. Sleep difficulty inwomen at midlife: a community survey of sleep and the menopausal transition. Menopause2003;10:19–28. [PubMed: 12544673]
4. Bromberger JT, Assmann SF, Avis NE, Schocken M, Kravitz HM, Cordal A. Persistent moodsymptoms in a multiethnic community cohort of pre- and perimenopausal women. Am J Epidemiol2003;158:347–356. [PubMed: 12915500]
5. Avis NE, Ory M, Matthews KA, Schocken M, Bromberger J, Colvin A. Health-related quality oflife in a multiethnic sample of middle-aged women: Study of Women's Health Across the Nation(SWAN). Med Care 2003;41:1262–1276. [PubMed: 14583689]
6. Guthrie JR, Dennerstein L, Taffe JR, Donnelly V. Health care-seeking for menopausal problems.Climacteric 2003;6:112–117. [PubMed: 12841881]
7. Rossouw JE, Anderson GL, Prentice RL, et al. Risks and benefits of estrogen plus progestin inhealthy postmenopausal women: principal results from the Women's Health Initiative randomizedcontrolled trial. JAMA 2002;288:321–333. [PubMed: 12117397]
8. Sherman S, Miller H, Nerurkar L, Schiff I. Research opportunities for reducing the burden ofmenopause-related symptoms. Am J Med 2005;118:166–171. [PubMed: 16414344]
9. Ryan, K.; Berkowitz, R.; Barbieri, R.; Dunaif, A. Kistner's Gynecology and Women's Health. 7th.St. Louis: Mosby; 1999.
10. Erlik Y, Meldrum DR, Judd HL. Estrogen levels in postmenopausal women with hot flashes.Obstet Gynecol 1982;59:403–407. [PubMed: 7078891]
11. Whiteman MK, Staropoli CA, Langenberg PW, McCarter RJ, Kjerulff KH, Flaws JA. Smoking,body mass, and hot flashes in midlife women. Obstet Gynecol 2003;101:264–272. [PubMed:12576249]
12. den Tonkelaar I, Seidell JC, van Noord PA. Obesity and fat distribution in relation to hot flashes inDutch women from the DOM-project. Maturitas 1996;23:301–305. [PubMed: 8794424]
13. Freedman RR. Pathophysiology and treatment of menopausal hot flashes. Semin Reprod Med2005;23:117–125. [PubMed: 15852197]
14. Anderson GS. Human morphology and temperature regulation. Int J Biometeorol 1999;43:99–109.[PubMed: 10639901]
15. Otte JW, Merrick MA, Ingersoll CD, Cordova ML. Subcutaneous adipose tissue thickness alterscooling time during cryotherapy. Arch Phys Med Rehabil 2002;83:1501–1505. [PubMed:12422316]
Thurston et al. Page 8
Menopause. Author manuscript; available in PMC 2010 May 25.
NIH
-PA Author Manuscript
NIH
-PA Author Manuscript
NIH
-PA Author Manuscript
16. Freeman EW, Sammel MD, Lin H, Gracia CR, Kapoor S, Ferdousi T. The role of anxiety andhormonal changes in menopausal hot flashes. Menopause 2005;12:258–266. [PubMed: 15879914]
17. Randolph JF Jr, Sowers M, Bondarenko I, et al. The relationship of longitudinal change inreproductive hormones and vasomotor symptoms during the menopausal transition. J ClinEndocrinol Metab 2005;90:6106–6112. [PubMed: 16144949]
18. Sowers, M.; Crawford, S.; Sternfeld, B., et al. SWAN: a multicenter, multiethnic, community-based cohort study of women and the menopausal transition. In: Lobo, RA.; Kelsey, J.; Marcus,R.; Lobo, AR., editors. Menopause: Biology and Pathology. New York: Academic Press; 2000. p.175-188.
19. van den Beld AW, de Jong FH, Grobbee DE, Pols HA, Lamberts SW. Measures of bioavailableserum testosterone and estradiol and their relationships with muscle strength, bone density, andbody composition in elderly men. J Clin Endocrinol Metab 2000;85:3276–3282. [PubMed:10999822]
20. Stearns V, Beebe KL, Iyengar M, Dube E. Paroxetine controlled release in the treatment ofmenopausal hot flashes: a randomized controlled trial. JAMA 2003;289:2827–2834. [PubMed:12783913]
21. Van Pelt RE, Jankowski CM, Gozansky WS, Schwartz RS, Kohrt WM. Lower-body adiposity andmetabolic protection in postmenopausal women. J Clin Endocrinol Metab 2005;90:4573–4578.[PubMed: 15886255]
22. Storti KL, Brach JS, FitzGerald SJ, Bunker CH, Kriska AM. Relationships among bodycomposition measures in community-dwelling older women. Obesity (Silver Spring)2006;14:244–251. [PubMed: 16571849]
23. Goodpaster BH, Krishnaswami S, Resnick H, et al. Association between regional adipose tissuedistribution and both type 2 diabetes and impaired glucose tolerance in elderly men and women.Diabetes Care 2003;26:372–379. [PubMed: 12547865]
24. Raikkonen K, Matthews KA, Kuller LH, Reiber C, Bunker CH. Anger, hostility, and visceraladipose tissue in healthy postmenopausal women. Metabolism 1999;48:1146–1151. [PubMed:10484055]
25. Irwin ML, Yasui Y, Ulrich CM, et al. Effect of exercise on total and intra-abdominal body fat inpostmenopausal women: a randomized controlled trial. JAMA 2003;289:323–330. [PubMed:12525233]
26. Lovejoy JC, Smith SR, Rood JC. Comparison of regional fat distribution and health risk factors inmiddle-aged white and African American women: the Healthy Transitions Study. Obes Res2001;9:10–16. [PubMed: 11346662]
27. Berman DM, Rodrigues LM, Nicklas BJ, Ryan AS, Dennis KE, Goldberg AP. Racial disparities inmetabolism, central obesity, and sex hormone-binding globulin in postmenopausal women. J ClinEndocrinol Metab 2001;86:97–103. [PubMed: 11231984]
28. Kanaley JA, Giannopoulou I, Tillapaugh-Fay G, Nappi JS, Ploutz-Snyder LL. Racial differences insubcutaneous and visceral fat distribution in postmenopausal black and white women. Metabolism2003;52:186–191. [PubMed: 12601630]
29. The North American Menopause Society. Treatment of menopause-associated vasomotorsymptoms: position statement of The North American Menopause Society. Menopause2004;11:11–33. [PubMed: 14716179]
30. Kemmler W, Lauber D, Weineck J, Hensen J, Kalender W, Engelke K. Benefits of 2 years ofintense exercise on bone density, physical fitness, and blood lipids in early postmenopausalosteopenic women: results of the Erlangen Fitness Osteoporosis Prevention Study (EFOPS). ArchIntern Med 2004;164:1084–1091. [PubMed: 15159265]
31. Guthrie JR, Dennerstein L, Taffe JR, Lehert P, Burger HG. Hot flushes during the menopausetransition: a longitudinal study in Australian-born women. Menopause 2005;12:460–467.[PubMed: 16037762]
32. Greendale GA, Gold EB. Lifestyle factors: are they related to vasomotor symptoms and do theymodify the effectiveness or side effects of hormone therapy? Am J Med 2005;118(Suppl 12B):148–154. [PubMed: 16414341]
Thurston et al. Page 9
Menopause. Author manuscript; available in PMC 2010 May 25.
NIH
-PA Author Manuscript
NIH
-PA Author Manuscript
NIH
-PA Author Manuscript
33. Sowers M, Zheng H, Tomey K, et al. Changes in body composition in women over six years atmid-life: ovarian and chronological aging. J Clin Endocrinol Metab 2006;92:895–901. [PubMed:17192296]
34. Ley CJ, Lees B, Stevenson JC. Sex- and menopause-associated changes in body-fat distribution.Am J Clin Nutr 1992;55:950–954. [PubMed: 1570802]
35. Thurston RC, Blumenthal JA, Babyak MA, Sherwood A. Emotional antecedents of hot flashesduring daily life. Psychosom Med 2005;67:137–146. [PubMed: 15673636]
Thurston et al. Page 10
Menopause. Author manuscript; available in PMC 2010 May 25.
NIH
-PA Author Manuscript
NIH
-PA Author Manuscript
NIH
-PA Author Manuscript
NIH
-PA Author Manuscript
NIH
-PA Author Manuscript
NIH
-PA Author Manuscript
Thurston et al. Page 11
TABLE 1
Participant characteristics by reported hot flashes
Reporting hot flashes (n = 217) Not reporting hot flashes (n = 244) P
Age, mean (SD), y 50.8 (2.9) 50.0 (2.8) 0.001
Site, n (%)
Chicago 125 (57.6) 126 (51.6) 0.20
Pittsburgh 92 (42.4) 118 (48.4)
Race, n (%)
White 129 (59.5) 172 (70.5) 0.01
African American 88 (40.5) 72 (29.5)
Menopausal status, n (%)
Premenopausal 9 (4.2) 35 (14.4) <0.0001
Early perimenopausal 78 (35.9) 132 (54.1)
Late perimenopausal 29 (13.4) 21 (8.6)
Postmenopausal 91 (41.9) 44 (18.0)
Indeterminatea 10 (4.6) 12 (4.9)
Education, n (%)
High school 37 (17.1) 37 (15.2) 0.01
Some college/vocational 80 (36.9) 62 (25.4)
College/grad school 100 (46.1) 145 (59.4)
Anxious symptoms, mean (SD) 2.3 (2.0) 1.9 (1.9) 0.02
Smoker, n (%)
Yes 38 (17.5) 36 (14.8) 0.42
No 179 (82.5) 208 (85.2)
Antidepressant use, n (%)
Yes 22 (10.1) 39 (16.0) 0.06
No 195 (89.9) 205 (84.0)
HT use, n (%)
Yes 24 (11.1) 27 (11.1) 0.99
No 193 (88.9) 217 (88.9)
BMI 29.8 (6.1) 28.4 (6.1) 0.02
FSH, mean (SD), mIU/mLb 67.3 (50.3) 38.7 (34.7) <0.0001
E2, mean (SD), pg/mLb 47.4 (70.5) 82.4 (104.2) <0.0001
SHBG, mean (SD), nMb 47.8 (29.1) 49.4 (28.9) 0.50
FEI, mean (SD)b 0.5 (1.3) 1.0 (2.6) <0.0001
HT, hormone therapy; BMI, body mass index; FSH, follicle-stimulating hormone; E2, estradiol; SHBG, sex hormone/binding globulin; FEI, freeestradiol index.
aWomen previously classified as pre- or perimenopausal who reported HT use since the last study visit.
bStatistical comparisons conducted with transformed FSH (log), E2 (log), FEI (log), and SHBG (square root) values.
Menopause. Author manuscript; available in PMC 2010 May 25.

NIH
-PA Author Manuscript
NIH
-PA Author Manuscript
NIH
-PA Author Manuscript
Thurston et al. Page 12
TABLE 2
Odds ratios of hot flashes associated with three measures of abdominal adiposity
Odds ratio (95% CI)a
Model 1 Model 2
Total abdominal adiposity 1.28 (1.06-1.55)b 1.24 (1.01-1.52)b
Visceral 1.15 (0.95-1.39) 1.15 (0.93-1.41)
Subcutaneous 1.30 (1.07-1.58)c 1.26 (1.02-1.55)b
Model 1: Adjusted for age and site.
Model 2: Adjusted for age, site, race/ethnicity, education, smoking, menopausal status, hormone use, antidepressant use, anxious symptoms.
aOdds ratios correspond to every 1-SD increase in adiposity.
bP < 0.05.
cP < 0.01.
Menopause. Author manuscript; available in PMC 2010 May 25.
NIH
-PA Author Manuscript
NIH
-PA Author Manuscript
NIH
-PA Author Manuscript
Thurston et al. Page 13
TAB
LE 3
Ass
ocia
tions
bet
wee
n re
prod
uctiv
e ho
rmon
es a
nd th
ree
mea
sure
s of a
bdom
inal
adi
posi
ty
FSH
(log
)E
2 (lo
g)FE
I (lo
g)
bP
bP
bP
Tota
l abd
omin
al a
dipo
sity
−0.12
0.00
3−0.07
0.19
0.14
0.01
V
isce
ral
−0.11
0.00
8−0.08
0.11
0.14
0.00
9
Su
bcut
aneo
us−0.12
0.00
5−0.05
0.30
0.12
0.03
FSH
, fol
licle
-stim
ulat
ing
horm
one;
E2,
est
radi
ol; F
EI, f
ree
estra
diol
inde
x. A
djus
ted
for a
ge, s
ite, r
ace/
ethn
icity
, edu
catio
n, sm
okin
g, h
orm
one
use,
and
cyc
le d
ay o
f blo
od d
raw
.
Menopause. Author manuscript; available in PMC 2010 May 25.

NIH
-PA Author Manuscript
NIH
-PA Author Manuscript
NIH
-PA Author Manuscript
Thurston et al. Page 14
TABLE 4
Odds ratios of hot flashes associated with abdominal adiposity adjusted for reproductive hormones
Odds ratio (95% CI)a
Model 1 (+ FSH) Model 2 (+ FEI)
Total abdominal adiposity 1.35 (1.09-1.69)b 1.32 (1.06-1.64)c
Visceral 1.21 (0.98-1.51) 1.20 (0.97-1.49)
Subcutaneous 1.37 (1.09-1.71)b 1.33 (1.07-1.66)c
FSH, follicle-stimulating hormone; FEI, free estradiol index.
Model 1: Adjusted for age, site, race/ethnicity, education, smoking, hormone use, antidepressant use, anxious symptoms, cycle day of blood draw,FSH.
Model 2: Adjusted for age, site, race/ethnicity, education, smoking, hormone use, antidepressant use, anxious symptoms, cycle day of blood draw,FEI.
aOdds ratios correspond to every 1-SD increase in adiposity.
bP < 0.01.
cP < 0.05.
Menopause. Author manuscript; available in PMC 2010 May 25.