Randomized Control Trial to Improve Adiposity and Insulin Resistance in Overweight Latino...
14
Randomized Control Trial to Improve Adiposity and Insulin Resistance in Overweight Latino Adolescents Jaimie N. Davis 1 , Louise A. Kelly 1 , Christianne J. Lane 1 , Emily E. Ventura 1 , Courtney E. Byrd- Williams 1 , Katharine A. Alexandar 1 , Stanley P. Azen 1,2 , Chih-Ping Chou 1 , Donna Spruijt- Metz 1 , Marc J. Weigensberg 1,3 , Kiros Berhane 1,4 , and Michael I. Goran 1,5 1 Department of Preventive Medicine, Keck School of Medicine, University of Southern California, Los Angeles, California, USA 2 Doheny Eye Institute and the Department of Ophthalmology, Keck School of Medicine, University of Southern California, Los Angeles, California, USA 3 Department of Pediatrics, Keck School of Medicine, University of Southern California, Los Angeles, California, USA 4 Division of Biostatics, Keck School of Medicine, University of Southern California, LosAngeles, California, USA 5 Department of Physiology and Biophysics, Keck School of Medicine, University of Southern California, Los Angeles, California, USA. Abstract Few randomized trials attempt to improve insulin sensitivity and associated metabolic risks in overweight Latino youth. The purpose of this study is to examine the effects of a modified carbohydrate nutrition program combined with strength training on insulin sensitivity, adiposity, and other type 2 diabetes risk factors in overweight Latino adolescents. In a 16-week randomized trial, 54 overweight Latino adolescents (15.5 ± 1.0 years) were randomly assigned to: (i) Control (C; n = 16), (ii) Nutrition (N; n = 21), or (iii) Nutrition + Strength training (N+ST; n = 17). The N group received modified carbohydrate nutrition classes (once per week), while the N+ST received the same nutrition classes plus strength training (twice per week). The following were measured at pre- and postintervention: strength by 1-repetition maximum, dietary intake by 3-day records, body composition by dual-energy X-ray absorptiometry, glucose/insulin indices by oral glucose tolerance test (OGTT) and intravenous glucose tolerance test with minimal modeling. Across intervention group effects were tested using analysis of covariance with post hoc pairwise comparisons. A significant overall intervention effect was found for improvement in bench press (P < 0.001) and reductions in energy (P = 0.05), carbohydrate (P = 0.04) and fat intake (P = 0.03). There were no significant intervention effects on insulin sensitivity, body composition, or most glucose/insulin indices with the exception of glucose incremental area under the curve (IAUC) (P = 0.05), which decreased in the N and N+ST group by 18 and 6.3% compared to a 32% increase in the C group. In conclusion, this intense, culturally tailored intervention resulted in no significant intervention effects on measured risk factors with the exception of a beneficial effect on glycemic response to oral glucose. © 2009 The Obesity Society Correspondence: Michael I. Goran ([email protected]). DISCLOSURE The authors declared no conflict of interest. NIH Public Access Author Manuscript Obesity (Silver Spring). Author manuscript; available in PMC 2010 March 28. Published in final edited form as: Obesity (Silver Spring). 2009 August ; 17(8): 1542–1548. doi:10.1038/oby.2009.19. NIH-PA Author Manuscript NIH-PA Author Manuscript NIH-PA Author Manuscript
Transcript of Randomized Control Trial to Improve Adiposity and Insulin Resistance in Overweight Latino...

Randomized Control Trial to Improve Adiposity and InsulinResistance in Overweight Latino Adolescents
Jaimie N. Davis1, Louise A. Kelly1, Christianne J. Lane1, Emily E. Ventura1, Courtney E. Byrd-Williams1, Katharine A. Alexandar1, Stanley P. Azen1,2, Chih-Ping Chou1, Donna Spruijt-Metz1, Marc J. Weigensberg1,3, Kiros Berhane1,4, and Michael I. Goran1,51Department of Preventive Medicine, Keck School of Medicine, University of Southern California,Los Angeles, California, USA2Doheny Eye Institute and the Department of Ophthalmology, Keck School of Medicine, Universityof Southern California, Los Angeles, California, USA3Department of Pediatrics, Keck School of Medicine, University of Southern California, Los Angeles,California, USA4Division of Biostatics, Keck School of Medicine, University of Southern California, LosAngeles,California, USA5Department of Physiology and Biophysics, Keck School of Medicine, University of SouthernCalifornia, Los Angeles, California, USA.
AbstractFew randomized trials attempt to improve insulin sensitivity and associated metabolic risks inoverweight Latino youth. The purpose of this study is to examine the effects of a modifiedcarbohydrate nutrition program combined with strength training on insulin sensitivity, adiposity, andother type 2 diabetes risk factors in overweight Latino adolescents. In a 16-week randomized trial,54 overweight Latino adolescents (15.5 ± 1.0 years) were randomly assigned to: (i) Control (C; n =16), (ii) Nutrition (N; n = 21), or (iii) Nutrition + Strength training (N+ST; n = 17). The N groupreceived modified carbohydrate nutrition classes (once per week), while the N+ST received the samenutrition classes plus strength training (twice per week). The following were measured at pre- andpostintervention: strength by 1-repetition maximum, dietary intake by 3-day records, bodycomposition by dual-energy X-ray absorptiometry, glucose/insulin indices by oral glucose tolerancetest (OGTT) and intravenous glucose tolerance test with minimal modeling. Across interventiongroup effects were tested using analysis of covariance with post hoc pairwise comparisons. Asignificant overall intervention effect was found for improvement in bench press (P < 0.001) andreductions in energy (P = 0.05), carbohydrate (P = 0.04) and fat intake (P = 0.03). There were nosignificant intervention effects on insulin sensitivity, body composition, or most glucose/insulinindices with the exception of glucose incremental area under the curve (IAUC) (P = 0.05), whichdecreased in the N and N+ST group by 18 and 6.3% compared to a 32% increase in the C group. Inconclusion, this intense, culturally tailored intervention resulted in no significant intervention effectson measured risk factors with the exception of a beneficial effect on glycemic response to oralglucose.
© 2009 The Obesity SocietyCorrespondence: Michael I. Goran ([email protected]).DISCLOSUREThe authors declared no conflict of interest.
NIH Public AccessAuthor ManuscriptObesity (Silver Spring). Author manuscript; available in PMC 2010 March 28.
Published in final edited form as:Obesity (Silver Spring). 2009 August ; 17(8): 1542–1548. doi:10.1038/oby.2009.19.
NIH
-PA Author Manuscript
NIH
-PA Author Manuscript
NIH
-PA Author Manuscript

INTRODUCTIONLatino youth are more likely to be at risk of overweight than white children, with 40.5 and37.1% of Latino boys and girls (aged 12–19 years), respectively, being overweight (≥85th CDCpercentile) compared to 34.5 and 31.7% of white children being overweight (1,2). Prediabetesand type 2 diabetes have emerged as significant health issues in overweight adolescents,especially among certain ethnic groups including Latinos (3). Our group has shown that over30% of overweight Latino children (aged 8–14 years) in the Los Angeles area have prediabetes(4,5) and the metabolic syndrome (6). While there are numerous interventions aimed atdecreasing obesity (7-9), few randomized trials address the underlying metabolicabnormalities, specifically insulin resistance, in overweight Latino youth.
There is evidence that modifying the quality of carbohydrates in the diet may be effective forreducing obesity and improving glucose control (10,11). We have previously shown inoverweight Latino youth (aged 19–17 years) population that high intakes of total added sugarand sugary beverages were the only dietary components associated with adiposity and poorβ-cell function (10,12). We also recently showed that in a 12-week, modified, carbohydratenutrition education pilot study called ALAS (Adolescent Latinas Adjusting Sugar) conductedwith overweight Latina girls (aged 12–17 years), resulted in a 5% reductions in BMI z scoresand those girls with the greatest reductions in added sugar intake had a 7% improvement ininsulin secretion (13,14). Therefore, a modified carbohydrate intervention has the potential toreduce type 2 diabetes risks in overweight youth who have insulin resistance.
Recently, strength training has also been linked to improvements in insulin sensitivity in adults(15,16). Poehlman et al. (16) showed that a 6-month strength training study resulted in a 10%improvement in insulin sensitivity in nonobese young women (18–35 years). While the studyby Ishii et al. (15) showed that an intensive 6-week strength training intervention improvedinsulin sensitivity by 48% in sedentary nonobese type 2 diabetic adults (35–60 years). To ourknowledge, we were the first to demonstrate through a 16-week randomized pilot study calledSTEALTH (Strength Training Exercise for Adolescent Latinos To improve Health) thatstrength training significantly increased insulin sensitivity by 45% in overweight Latinoadolescent males (aged 12–17 years), independent of changes in body composition (17).However, this pilot study did not include nutrition education and was conducted only in boys.
The purpose of this study was to therefore conduct a 16-week randomized control trial toexamine the incremental effects of combining a modified carbohydrate nutrition educationprogram like ALAS with the strength training regimen like STEALTH in high-risk overweightLatino boys and girls. There were three intervention groups: (i) control, (ii) a culturally tailored,modified carbohydrate nutrition education program once per week, and (iii) the same nutritioneducation program with twice per week strength training. We hypothesized that thecombination group would have the greatest reductions in adiposity and the greatest increasesin insulin sensitivity compared to the nutrition only and control groups.
METHODS AND PROCEDURESParticipants
Study participants satisfied the following criteria for inclusion: ageand gender-specific BMI≥85th percentile (18), Latino ethnicity (i.e., parents and grandparents of Latino descent byparental self report), and grades 9th through 12th (14–18 years of age). Participants wereexcluded based on the following criteria: (i) were using medication or were diagnosed withany disease that could influence dietary intake, exercise ability, body composition, or insulinindices; (ii) were previously diagnosed with any major illness since birth; (iii) had anydiagnostic criteria for diabetes; or (iv) participated in structured exercise, nutrition, or weight
Davis et al. Page 2
Obesity (Silver Spring). Author manuscript; available in PMC 2010 March 28.
NIH
-PA Author Manuscript
NIH
-PA Author Manuscript
NIH
-PA Author Manuscript

loss program in the past 6 months. For logistical reasons, intervention groups were gender-specific. Prior to any testing procedure, informed written consent from parents and assent fromthe children were obtained. This study was approved by the Institutional Review Board of theUniversity of Southern California, Health Sciences Campus.
Outpatient visitParticipants arrived at the General Clinical Research Center (GCRC) at ~7:30 am after anovernight fast. A licensed pediatric health care provider conducted a detailed medical historyexam and determined Tanner staging using established guidelines (19,20). Following the exam,a 3-h oral glucose tolerance test (OGTT) was conducted. This test included the application ofa topical anesthetic to one arm and ~30 min later a flexible intravenous catheter was placed inan antecubital vein. Subjects then ingested 1.75 g oral glucose solution/kg body weight (to amaximum 75 g). Blood samples were drawn at baseline and every 10 min for 3 h (a total of 18samples) and were assayed for glucose, insulin, and c-peptide. Fasting and 2-h glucose levelswere used to determine normal or impaired glucose tolerance as defined by the AmericanDiabetes Association (3). Three-hour insulin area under the curve (AUC) and incrementalinsulin area under the curve (IAUC) were calculated from the OGTT data, in nmol/l/min.
Anthropometry and body compositionWeight and height were measured to the nearest 0.1 kg and 0.1 cm, respectively, using a beammedical scale and wall-mounted stadiometer. BMI and BMI percentiles were determined(CDC, 2000). Whole body fat and soft lean tissue was measured by dual-energy X-rayabsorptiometry using a Hologic QDR 4500W (Hologic, Bedford, MA).
In-patient visitApproximately 7–14 days following the outpatient visit, participants were admitted to theGCRC and served a standardized dinner and an evening snack. An insulin-modified frequentlysampled intravenous glucose tolerance test (FSIVGTT) (21) was performed the followingmorning. At time 0, glucose (25% dextrose, 0.3 g/kg body weight) was administeredintravenously. Blood samples were collected at time points −15, −5, 2, 4, 8, 19, 22, 30, 40, 50,70, 100, and 180 min. Insulin (0.02 units/kg body weight, Humulin R (regular insulin for humaninjection); Eli Lilly, Indianapolis, IN) was injected intravenously at 20 min. Plasma collectedduring the FSIVGTT was analyzed for glucose and insulin, and values were entered into theMINMOD Millenium 2003 computer program (version 5.16, Bergman, USC) to determineinsulin sensitivity, acute insulin response, and disposition index (an index of β-cell function).
AssaysFasting and 2-h samples taken during the OGTT for clinical diagnosis were separated forplasma and immediately transported on ice to the Los Angeles County–USC Medical CenterCore Laboratory where glucose was analyzed on a Dimension clinical chemistry system usingan in vitro hexokinase method (Dade Behring, Deerfield, IL). Blood samples from all timepoints taken during the OGTT and FSIVGTT were centrifuged immediately for 10 min at 2500rpm and 8–10 °C to obtain plasma, and aliquots were frozen at −70 °C until assayed. Glucosewas assayed in duplicate on a Yellow Springs Instrument 2700 Analyzer (Yellow SpringsInstrument, Yellow Springs, OH) using the glucose oxidase method. Insulin was assayed induplicate using a specific human insulin enzyme-linked immunosorbent assay kit from Linco(St. Charles, MO).
Dietary intake and strength assessmentAt the outpatient visit, participants were given 3-day diet records to complete at home beforeand after the intervention and were instructed to bring them to their next GCRC visit.
Davis et al. Page 3
Obesity (Silver Spring). Author manuscript; available in PMC 2010 March 28.
NIH
-PA Author Manuscript
NIH
-PA Author Manuscript
NIH
-PA Author Manuscript
Participants were given a short lesson (10 min) on how to estimate portion sizes and completethe diet records and were given measuring cups and rulers to aid in accurate reporting. At thein-patient visit, research staff clarified all dietary records. Nutrition data were analyzed usingthe Nutrition Data System for Research (NDS-R version 5.0_35).
Upper- and lower-body strength were assessed before and after intervention by 1 repetitionmaximum (1-RM) in the bench press and leg press, respectively, using established procedures(22).
RandomizationAllocations were concealed from participants until after their in-patient visit. Sixty-sixparticipants were randomized to one of three groups. Randomization was blocked by genderto achieve balance in randomization between genders. Siblings (five pairs) were randomizedinto the same experimental group (one in C, two in N, and two in N+ST), and data from bothsiblings was used.
Description of interventionsNutrition education only (N)—Participants in the N group reported to the Veronica AtkinsLifestyle Intervention Laboratory once per week (~90 min) for 16 weeks for a culturally tailoreddietary intervention. This dietary intervention was modified from a pilot study and specificsare described in detail elsewhere (13,14). In brief, the dietary intervention targeted two goals:(i) ≤10% of total daily calorie intake from added sugar; and (ii) consuming at least 14 g/1,000kcal of dietary fiber a day. Participants received four individual motivational interviewing (MI)sessions throughout the 16-week program by trained research staff. MI is a client-centeredcounseling approach designed to enhance intrinsic motivation for behavior change by creating,exploring, and resolving ambivalence toward changing behaviors and habits (23). Participantswere given $25 grocery gift cards each week and transportation was provided to and from theclasses if needed. Parent(s) were asked to attend a minimum of four classes and were taughtthe same curriculum separately from the participants.
Nutrition education plus strength training (N+ST)—In addition to the nutritioneducation class described above, participants in the N+ST group also received strength trainingtwice per week (~60 min/session) for 16 weeks at Veronica Atkins Lifestyle InterventionLaboratory. Training sessions took place on 2 nonconsecutive days per week and the nutritioneducation took place once per week. The exercise program has been explained in detailelsewhere (17). In brief, the program was personalized and progressive such that the resistanceincreased as the participant's technique and strength improved. One day a week focused oncompound lower body exercises (i.e., leg press and dead lift) and isolated upper body exercises(i.e., biceps curl, triceps extension, and shoulder press) and the other training day included thereverse (i.e., bench press, lat pull-down, leg extension, leg curl, and calf raises). A 3:1 child/trainer ratio was employed. In addition, the N+ST received a minimum of four group MIsessions by trained research staff in order to enhance intrinsic motivation for physical activity.Participants were also given $25 grocery gift cards each week and transportation to and fromthe classes was provided if needed.
Control group (C)Participants randomized to the C group received no intervention between pre andpostintervention data collection. After post-testing, participants were offered an abbreviated1-month intervention, consisting of biweekly nutrition and strength training classes. No testingwas done after the abbreviated intervention.
Davis et al. Page 4
Obesity (Silver Spring). Author manuscript; available in PMC 2010 March 28.
NIH
-PA Author Manuscript
NIH
-PA Author Manuscript
NIH
-PA Author Manuscript
Post-testing proceduresAt the conclusion of the 16-week intervention/control period, participants returned to theGCRC for follow-up testing. The procedures were identical to those previously described inthe outpatient and in-patient visits. The FSIVGTT test took place within 1 week of the lastnutrition class and within 48–72 h after the final training session for the N+ST group tominimize the acute effects of the last training bout on insulin action and glucose homeostasis.
Statistical considerationsSample size considerations—Sample size calculations were based on results from theSTEALTH pilot study (17). Using a conservative estimate of the standard deviation of theinsulin sensitivity change score, a sample size of 60 (20/group) had 0.80 power to detect ameaningful difference >0.57 units in mean change in insulin sensitivity between the C and N+ST groups.
Statistical analyses—Across-group comparisons of baseline characteristics wereconducted for evaluable participants using ANOVA to identify possible randomizationimbalance. Except for 2-h insulin during the OGTT, no differences were found. Subsequentintent to treat analyses found no differences in OGTT related outcomes with and withoutcontrolling for baseline OGTT 2-h insulin as a potential confounder.
The overall effects of the interventions were tested for evaluable participants using analysis ofcovariance on the post-prechange score, after controlling for pretest values and preplannedcovariates. Change scores were evaluated for normality and transformations were made ifneeded. Covariates included age and gender, as well as outcome variable-specific covariatesbased on theoretical and biological decisions. When significant differences across groups wereidentified, post hoc pairwise comparisons with Bonferroni adjustments were conducted.Statistical analyses were carried out at the 0.05 level using the Statistical Analysis System 9.1(SAS Institute Inc, Cary, NC).
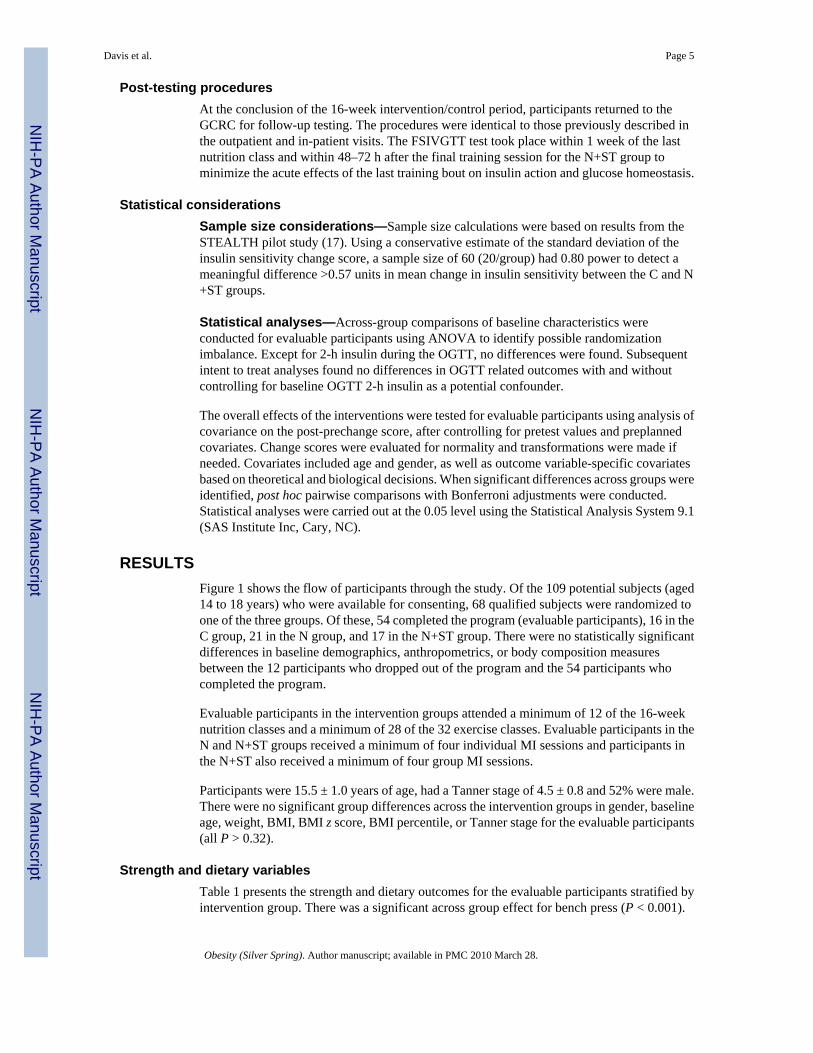
RESULTSFigure 1 shows the flow of participants through the study. Of the 109 potential subjects (aged14 to 18 years) who were available for consenting, 68 qualified subjects were randomized toone of the three groups. Of these, 54 completed the program (evaluable participants), 16 in theC group, 21 in the N group, and 17 in the N+ST group. There were no statistically significantdifferences in baseline demographics, anthropometrics, or body composition measuresbetween the 12 participants who dropped out of the program and the 54 participants whocompleted the program.
Evaluable participants in the intervention groups attended a minimum of 12 of the 16-weeknutrition classes and a minimum of 28 of the 32 exercise classes. Evaluable participants in theN and N+ST groups received a minimum of four individual MI sessions and participants inthe N+ST also received a minimum of four group MI sessions.
Participants were 15.5 ± 1.0 years of age, had a Tanner stage of 4.5 ± 0.8 and 52% were male.There were no significant group differences across the intervention groups in gender, baselineage, weight, BMI, BMI z score, BMI percentile, or Tanner stage for the evaluable participants(all P > 0.32).
Strength and dietary variablesTable 1 presents the strength and dietary outcomes for the evaluable participants stratified byintervention group. There was a significant across group effect for bench press (P < 0.001).
Davis et al. Page 5
Obesity (Silver Spring). Author manuscript; available in PMC 2010 March 28.
NIH
-PA Author Manuscript
NIH
-PA Author Manuscript
NIH
-PA Author Manuscript

Post hoc comparisons showed that the N+ST increased more than the C group (27 ± 2% vs.12 ± 7%; P = 0.004) and the N group (27 ± 2% vs. 2 ± 3%; P < 0.001).
There was an across group effect for total energy intake (P ≤ 0.05), the N+ST group decreasedtheir energy intake by 20 ± 4% compared to the C group that increased their energy intake by10 ± 3% (P = 0.04). The N group had a 10 ± 9% decrease in energy intake, although notsignificant from the other two groups. There was a significant across group effect forcarbohydrate intake (P = 0.04), the N+ST group decreased by 18 ± 5% compared to the Cgroup that increased by 7 ± 4% (P = 0.03). The N group decreased carbohydrate intake by 9 ±14%, but this was not significantly different from the other two groups. There was also asignificant across group effect for dietary fat (P = 0.03), the N+ST group decreased by 24 ±8% compared to the C group that increased by 11 ± 3% (P = 0.03). The N group decreaseddietary fat by 14 ± 9%, although not significantly different from the other groups. There wereno significant across group effects for dietary protein, total or added sugar or dietary fiberintake.
When stratified by gender (data not shown), there were several across group effects for strengthand dietary outcomes. For both genders there was an across group effect for bench and legpress. For males, the N group had only a 3 ± 4% increase in bench press compared to the 23 ±6% increase seen in the N+ST group (P < 0.001). For females, the N group had a 5 ± 6%decrease in bench press compared to the 40 ± 23% increase seen in the N+ST group (P < 0.001).Additionally, C females did significantly better (a 12 ± 2% increase) on bench press than Nfemales (P = 0.02).
For males only, there was a significant across group effect for carbohydrate intake (P = 0.01),the N group decreased by 13 ± 18% compared to N+ST who decreased by only 9 ± 18% (P =0.03). For females only, there was a significant across group effect for added sugar (P = 0.05);the C females reported a 4 ± 4% decrease in added sugar intake compared to the reported 16± 3% decrease by the N females (P < 0.001).
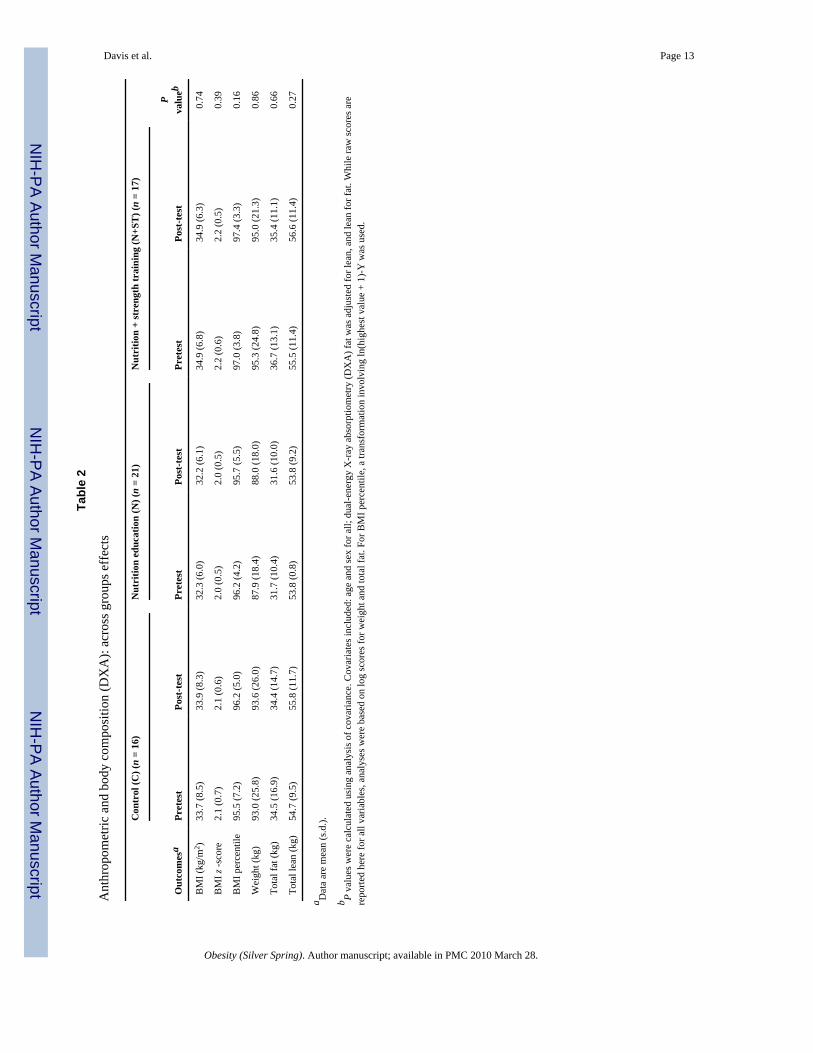
Anthropometric and body composition—Anthropometric and body composition (dual-energy X-ray absorptiometry) data, across group effects are presented in Table 2. There wereno significant across group difference for BMI, BMI z score, BMI percentile, or body weight(kg). There were also no significant across group effects for total fat mass, lean mass, or %body fat. However, for females (data not shown), there was a significant across group effectfor weight (P = 0.03), with the C group increasing by 1.3 ± 1.4% and the N+ST group increasingby 0.6 ± 1.5% (P = 0.02). The N group increased by 1.1 ± 1.3%, although not significantlydifferent from the other groups.
Glucose and insulin indices—The group effects for glucose and insulin indices from theOGTT and FSIVGTT are presented in Table 3. There was a significant across group effect forglucose IAUC (P = 0.05), with N group decreasing by 17 ± 19% compared to the C group thatincreased by 29 ± 19% (P = 0.05). The N+ST group also improved (reduction of 6 ± 4%),although not significantly different from the other groups. There were no other significantacross group effects for fasting and 2-h glucose and insulin, insulin IAUC, or for insulinsensitivity, acute insulin response, or disposition index measured by the FSIVGTT.
For females (data not shown), there was a significant across group effect for OGTT fastingglucose (P = 0.05); the N group increased by 0.6 ± 2.2 mg/dl and N+ST group decreased by1.1 ± 1.3 mg/dl compared to the C group that decreased by 3.8 ± 2.1 mg/dl (P = 0.05).
Davis et al. Page 6
Obesity (Silver Spring). Author manuscript; available in PMC 2010 March 28.
NIH
-PA Author Manuscript
NIH
-PA Author Manuscript
NIH
-PA Author Manuscript

DISCUSSIONWe hypothesized that strength gains in the N+ST group, independent of changes in bodycomposition, would result in significant improvements in insulin sensitivity, similar to whatwe saw in our pilot study (17). Although we saw similar strength gains as in our pilot, ~30%(17), these strength gains did not translate into improvement in insulin sensitivity. Other adultstudies have shown that 10–30% increases in strength resulted in 10–50% increases in insulinsensitivity (15,16), which suggests that although strength gains are associated with increasesin insulin sensitivity, there is no clear dose-dependent effect of strength gains on insulinsensitivity. However, these adult studies did not include a dietary component and it is possiblethat the addition of the dietary component in our study diluted the effects.
We hypothesized that changes in carbohydrate quality in the N and N+ST group would resultin reductions in adiposity and improvements in insulin secretion, similar to our ALAS pilotstudy (13,14). Numerous cross-sectional studies have shown that fiber and/or sugar intake areinversely associated with glycemic control and poor insulin action (12,24-26); however, fewintervention studies have been conducted that focus on reducing added sugar and increasingdietary fiber. A study by Ebbeling et al. (27) found that a low glycemic load diet improvedinsulin resistance compared to a conventional low-fat diet in 16 overweight adolescents (aged13–21 years). In this study, while neither intervention group significantly decreased addedsugar or increased fiber intake, there were significant reductions in overall carbohydrate intake.The reductions in carbohydrate could, in part, explain the significant decrease in the glucoseIAUC. In addition, females in the intervention groups did not gain as much weight comparedto the C group, which suggests that reduction in carbohydrate intake, regardless the quality,may have contributed to less weight gain in females but not males, similar to what we saw withthe ALAS pilot. These findings also highlight the need to further explore the response tointervention as a function of dietary compliance.
It is important to note that there were several improvements in insulin indices acrossintervention group, although not significant. The N and N+ST group decreased 2-h insulin by32 and 18% compared to a 24% increase in the C group. Insulin IAUC also improved, withthe N and N+ST decreasing by 20 and 25%, while the C group increased by 9%, although notsignificant. With a larger sample size, these improvements in insulin indices could have reachedsignificance.
There are several possible explanations for the null findings in insulin sensitivity and adiposityparameters of this study. Although we hypothesized that the different interventions would beadditive, intervening on multiple behaviors may not be optimal. Research suggests that thenumber of behavior targets is inversely related to the magnitude of the intervention effects forobesity (28,29). Specifically, an intensive nutrition and strength training program may haveattempted to change too many health behaviors and therefore diluted the potential effects.Although little is known about the effects of energy compensation in response to exercise inchildren, research in adults has shown that when individuals exercise they often compensatewith increased energy intake (30) or reduced physical activity outside of the training session(31) and this compensation is even more pronounced in females (32,33). Thus, the participantsin the N+ST group may have altered their intake in response to the exercise throughout theprogram. Subsequently, the diet records collected after the intervention would not really reflectthis acute compensatory intake.
Alternatively, the dose and the duration of the strength training intervention, two times a weekfor 16 weeks, may not have been frequent or long enough to see improvements in healthoutcomes. The American Academy of Pediatrics, Council on Sports Medicine and Fitness,recommends a frequency of 2–3 days a week of strength training for at least an 8-week duration
Davis et al. Page 7
Obesity (Silver Spring). Author manuscript; available in PMC 2010 March 28.
NIH
-PA Author Manuscript
NIH
-PA Author Manuscript
NIH
-PA Author Manuscript

(34). A 20-week intervention study conducted in obese, prepubertal girls showed that strengthtraining three times per week resulted in improvements in intra-abdominal adipose tissue andinsulin indices (35). Although, strength training two times per week for 16 weeks in STEALTHprogram resulted in improvements in insulin sensitivity in males, strength training 3 days/weekfor 20 weeks may be more optimal for females.
In secondary analyses and subsequent papers, we intend to assess whether there are differencesin compliance across intervention group. Although participants attended at least 12 of the 16nutrition classes and at least 28 of the 32 exercise sessions, we may stratify the participantsinto lower (12–14 classes) vs. more (15–16 classes) in order to assess changes in healthoutcomes. We also intend to evaluate compliance in regards to dietary intake strength and/orphysical activity levels in subsequent analyses. We are currently examining whether dietarycompliers, those who reduced sugar intake and increased dietary fiber, had more improvementsin insulin indices and adiposity parameters compared to dietary noncompliers. In futureanalyses, we will also assess whether participants who increased their strength and physicalactivity levels had greater improvements in adiposity and metabolic parameters compared tothose who decreased their strength and physical activity levels. In addition, the motivation ofthe participants must also be considered. Motivational questionnaires that were administeredpre- and postintervention will be useful in identifying the potential mediating role ofmotivational factors on health outcomes.
One potential limitation to consider relates to the small sample size. Although, the powercalculation showed that we would be able to detect significant differences in change in insulinsensitivity across intervention groups, this calculation was based on pilot data from only boysand the intervention did not include a nutrition component. In addition, this study was notpowered to detect differences in gender and a larger sample size would have allowed for betterexploration of gender differences across groups.
In conclusion, this intensive, randomized control trial, designed specifically for overweightLatino teenagers based on previous successful pilot studies, did not result in the expectedadiposity and metabolic improvements. These findings highlight the need for either differentor stricter dietary (i.e., more aggressive modification of carbohydrate intake) and exercise (i.e.,increased dose, duration, and intensity and different modality) approaches to elicitimprovements in adiposity and metabolic parameters in this high-risk population. Thesefindings also emphasize the need to further investigate the intervention response as a functionof dietary, strength, and physical activity compliance, the potential mediating effect ofmotivation, and whether intervening on multiple health behaviors is optimal.
AcknowledgmentsThis work was supported by the National Institutes of Cancer (NCI), University of Southern California Center forTransdisciplinary Research on Energetics and Cancer (U54 CA 116848), the National Institute of Child Health andHuman Development (RO1 HD/HL 33064), the Dr Robert C. and Veronica Atkins Foundation, the National CancerInstitute (Cancer Control and Epidemiology Research Training Grant, T32 CA 09492) and the M01 RR 00043 fromNCRR/NIH. We thank the SANO LA (Strength and Nutrition Outcomes for Latino Adolescents) team as well as thenursing staff at the GCRC. In addition, we are grateful for our study participants and their families for their involvement.
REFERENCES1. Ogden CL, Carroll MD, Flegal KM. High body mass index for age among US children and adolescents.
JAMA 2008;299:2442–2405. [PubMed: 18505955]2. Krebs N, Himes J, Jacobson D, et al. Assessment of child and adolescent overweight and obesity.
Pediatrics 2007;120:193–228.3. ADA. Type 2 diabetes in children and adolescents. Pediatrics 2000;105:671–680. [PubMed: 10699131]
Davis et al. Page 8
Obesity (Silver Spring). Author manuscript; available in PMC 2010 March 28.
NIH
-PA Author Manuscript
NIH
-PA Author Manuscript
NIH
-PA Author Manuscript

4. Weigensberg MJ, Ball GD, Shaibi GQ, Cruz ML, Goran MI. Decreased beta-cell function in overweightLatino children with impaired fasting glucose. Diabetes Care 2005;28:2519–2524. [PubMed:16186290]
5. Goran MI, Bergman RN, Avilla Q, et al. Impaired glucose tolerance and reduced beta-cell function inoverweight Latino children with a positive family history of type 2 diabetes. J Clin Endocrinol Metab2004;89:207–212. [PubMed: 14715851]
6. Cruz ML, Weigensberg MJ, Huang T, et al. The metabolic syndrome in overweight Hispanic youthand the role of insulin sensitivity. J Clin Endocrinol Metab 2004;89:108–113. [PubMed: 14715836]
7. Caballero B, Clay T, Davis SM, et al. Pathways: a school-based, randomized controlled trial for theprevention of obesity in American Indian schoolchildren. Am J Clin Nutr 2003;78:1030–1038.[PubMed: 14594792]
8. Gortmaker SL, Peterson K, Wiecha J, et al. Reducing obesity via a school-based interdisciplinaryintervention among youth: Planet Health. Arch Pediatr Adolesc Med 1999;153:409–418. [PubMed:10201726]
9. Pangrazi RP, Beighle A, Vehige T, Vack C. Impact of Promoting Lifestyle Activity for Youth (PLAY)on children's physical activity. J Sch Health 2003;73:317–321. [PubMed: 14593948]
10. Davis J, Ventura E, Weigensberg M, et al. The relation of sugar intake to beta-cell function inoverweight Latino children. Am J Clin Nutr 2005;82:1004–1010. [PubMed: 16280431]
11. Steffen LM, Jacobs DR, Stevens J, et al. Associations of whole-grain, refined-grain, and fruit andvegetable consumption with risks of all-cause mortality and incident coronary artery disease andischemic stroke: the Atherosclerosis Risk in Communities (ARIC) Study. Am J Clin Nutr2003;78:383–390. [PubMed: 12936919]
12. Davis JN, Alexander KE, Ventura EE, et al. Associations of dietary sugar and glycemic index withadiposity and insulin dynamics in overweight Latino youth. Am J Clin Nutr 2007;86:1331–1338.[PubMed: 17991643]
13. Davis JN, Ventura EE, Shaibi GQ, et al. Reduction in added sugar intake and improvement in insulinsecretion in overweight Latina Adolescents. Met Syn Rel Dis 2007;5:183–193.
14. Davis JN, Ventura EE, Alexander KA, et al. Development and testing of a culturally tailored nutritioneducation program for reducing sugar and increasing fiber intake in overweight Latina adolescents.Int J Ped Obes 2007;2:22–30.
15. Ishii T, Yamakita T, Sato T, Tanaka S, Fujii S. Resistance training improves insulin sensitivity inNIDDM subjects without altering maximal oxygen uptake. Diabetes Care 1998;21:1353–1355.[PubMed: 9702447]
16. Poehlman ET, Dvorak R, Denino W, Brochu M, Ades PA. Effects of resistance training and endurancetraining on insulin sensitivity in nonobese, young women: a controlled randomized trial. J ClinEndocrinol Metab 2000;85:2463–2468. [PubMed: 10902794]
17. Shaibi GQ, Cruz ML, Ball GD, et al. Effects of resistance training on insulin sensitivity in overweightLatino adolescent males. Med Sci Sports Exerc 2006;38:1208–1215. [PubMed: 16826016]
18. Centers for Disease Control and Prevention, Department of Health and Human Services. ResourceGuide for Nutrition and Physical Activity Interventions to Prevent Obesity and Other ChronicDiseases. Available at: <http://www.cdc/gov/nccdphp/dnpa/obesity/state_programs/index.htm>.Accessed September 14, 2007
19. Marshall WA, Tanner JM. Variations in pattern of pubertal changes in girls. Arch Dis Child1969;44:291–303. [PubMed: 5785179]
20. Marshall WA, Tanner JM. Variations in the pattern of pubertal changes in boys. Arch Dis Child1970;45:13–23. [PubMed: 5440182]
21. Cutfield W, Bergman R, Menon R, Sperling M. The modified minimal model: application tomeasurement of insulin sensitivity in children. JCEM 1990;70:1644–1650. [PubMed: 2189887]
22. Faigenbaum AD, Milliken LA, Westcott WL. Maximal strength testing in healthy children. J StrengthCond Res 2003;17:162–166. [PubMed: 12580672]
23. Miller, WR.; Rollnick, S. Motivational Interviewing: Preparing People for Change. 2nd edn.. TheGuilford Press; New York: 2001.
Davis et al. Page 9
Obesity (Silver Spring). Author manuscript; available in PMC 2010 March 28.
NIH
-PA Author Manuscript
NIH
-PA Author Manuscript
NIH
-PA Author Manuscript

24. Liese AD, Schulz M, Fang F, et al. Dietary glycemic index and glycemic load, carbohydrate and fiberintake, and measures of insulin sensitivity, secretion, and adiposity in the Insulin ResistanceAtherosclerosis Study. Diabetes Care 2005;28:2832–2838. [PubMed: 16306541]
25. Ludwig D, Pereira M, Kroenke C, et al. Dietary fiber, weight gain, and cardiovascular disease riskfactors in young adults. JAMA 1999;282:1539–1546. [PubMed: 10546693]
26. Ludwig DS, Majzoub JA, Al-Zahrani A, et al. High glycemic index foods, overeating, and obesity.Pediatrics 1999;103:E26. [PubMed: 10049982]
27. Ebbeling C, Leidig M, Sinclair K, Hangen J, Ludwig D. A reduced-glycemic load diet in the treatmentof adolescent obesity. Arch Pediatr Adolesc Med 2003;157:773–779. [PubMed: 12912783]
28. Stice E, Shaw H, Marti CN. A meta-analytic review of obesity prevention programs for children andadolescents: the skinny on interventions that work. Psychol Bull 2006;132:667–691. [PubMed:16910747]
29. Resnicow K, Robinson TN. School-based cardiovascular disease prevention studies: Review andsynthesis. Ann Epidemiol 1997;7:S14–S31.
30. Tremblay A, Despres JP, Bouchard C. The effects of exercise-training on energy balance and adiposetissue morphology and metabolism. Sports Med 1985;2:223–233. [PubMed: 3892629]
31. Goran MI, Poehlman ET. Endurance training does not enhance total energy expenditure in healthyelderly persons. Am J Physiol 1992;263:E950–E957. [PubMed: 1443128]
32. Donnelly JE, Smith BK. Is exercise effective for weight loss with ad libitum diet? Energy balance,compensation, and gender differences. Exerc Sport Sci Rev 2005;33:169–174. [PubMed: 16239833]
33. Pomerleau M, Imbeault P, Parker T, Doucet E. Effects of exercise intensity on food intake and appetitein women. Am J Clin Nutr 2004;80:1230–1236. [PubMed: 15531670]
34. American Academy of Pediatrics; Council on Sports Medicine and Fitness. Strength training bychildren and adolescents. Pediatrics 2008;121:835–840. [PubMed: 18381549]
35. Treuth MS, Hunter GR, Figueroa-Colon R, Goran MI. Effects of strength training on intra-abdominaladipose tissue in obese prepubertal girls. Med Sci Sports Exerc 1998;30:1738–1743. [PubMed:9861608]
Davis et al. Page 10
Obesity (Silver Spring). Author manuscript; available in PMC 2010 March 28.
NIH
-PA Author Manuscript
NIH
-PA Author Manuscript
NIH
-PA Author Manuscript

Figure 1.Consort diagram of participant flow (screening, randomization, completion of study).
Davis et al. Page 11
Obesity (Silver Spring). Author manuscript; available in PMC 2010 March 28.
NIH
-PA Author Manuscript
NIH
-PA Author Manuscript
NIH
-PA Author Manuscript

NIH
-PA Author Manuscript
NIH
-PA Author Manuscript
NIH
-PA Author Manuscript
Davis et al. Page 12
Tabl
e 1
Stre
ngth
and
die
tary
out
com
es: a
cros
s gro
ups e
ffec
ts fo
r eva
luab
le p
artic
ipan
ts (N
= 5
4)
Con
trol
(C) (
n =
16)
Nut
ritio
n ed
ucat
ion
(N) (
n =
21)
Nut
ritio
n +
stre
ngth
trai
ning
(N+S
T) (
n =
17)
Out
com
esa
Pret
est
Post
-test
Pret
est
Post
-test
Pret
est
Post
-test
P va
lueb
Stre
ngth
B
ench
pre
ss (k
g)42
.5 (1
3.0)
47.7
(13.
9)c
42.6
(11.
9)43
.5 (1
1.6)
c44
.3 (1
8.6)
56.1
(19.
0)d
<0.0
01
Le
g pr
ess (
kg)
233.
0 (8
7.4)
255.
4 (1
16.9
)23
2.4
(95.
8)22
6.8
(66.
0)21
6.6
(91.
8)27
1.5
(107
.3)
0.06
Die
tary
En
ergy
(kca
ls/d
)1,
957.
7 (7
21.9
)2,
146.
6 (9
87.0
)c1,
954.
5 (6
78.8
)1,
752.
1 (6
16.0
)c1,
788.
1 (4
55.9
)1,
436.
1(47
2.3)
d0.
05
C
arbo
hydr
ate
(g/d
)26
2.9
(94.
2)28
2.0
(133
.2)c
256.
3 (1
07.2
)23
4.0
(92.
3)c
226.
4 (6
1.1)
185.
1 (5
7.9)
d0.
04
Pr
otei
n (g
/d)
69.7
(29.
5)80
.0 (3
9.1)
76.4
(22.
2)71
.7 (2
4.5)
73.8
(23.
5)65
.0 (2
7.3)
0.50
Fa
t (g/
d)72
.6 (3
4.4)
80.3
(43.
7)c
71.7
(26.
3)61
.5 (2
3.8)
c67
.4 (2
4.9)
51.3
(22.
9)d
0.03
To
tal s
ugar
(g/d
)12
0.9
(52.
8)11
8.5
(65.
7)11
1.1
(58.
8)10
1.0
(55.
6)10
2.2
(35.
3)87
.1 (4
0.6)
0.70
A
dded
suga
r (g/
d)92
.6 (5
3.7)
84.2
(49.
8)75
.2 (4
8.9)
57.6
(49.
4)59
.7 (3
0.0)
50.4
(29.
2)0.
62
Fi
ber (
g/d)
14.2
(4.8
)17
.1 (7
.4)
16.8
(9.9
)17
.9 (7
.0)
14.8
(4.8
)15
.2 (7
.9)
0.52
a Dat
a ar
e m
ean
(s.d
.). S
ampl
e si
zes f
or d
ieta
ry v
aria
bles
are
as f
ollo
ws:
C (n
= 1
4); N
(n =
20)
; N+S
T (n
= 1
5).
b P va
lues
wer
e ca
lcul
ated
usi
ng a
naly
sis o
f cov
aria
nce.
Cov
aria
tes i
nclu
ded:
age
, sex
, dua
l-ene
rgy
X-r
ay a
bsor
ptio
met
ry fa
t and
lean
tiss
ue m
ass.
Die
tary
var
iabl
es in
clud
ed c
alor
ies n
ot a
ttrib
uted
to n
utrie
nt-
depe
nden
t var
iabl
e as
a c
ovar
iate
. Ana
lyse
s wer
e ba
sed
on lo
g sc
ores
for t
he fo
llow
ing
varia
bles
: pro
tein
, fat
, tot
al su
gar,
adde
d su
gar,
and
fiber
.
c Mea
ns w
ith d
iffer
ent l
ette
rs (c
and
d) a
cros
s int
erve
ntio
n gr
oups
are
sign
ifcan
tly d
iffer
ent f
rom
one
ano
ther
usi
ng B
onfe
rron
i mul
tiple
com
paris
ons (
P <
0.05
).
d Mea
ns w
ith d
iffer
ent l
ette
rs (c
and
d) a
cros
s int
erve
ntio
n gr
oups
are
sign
ifcan
tly d
iffer
ent f
rom
one
ano
ther
usi
ng B
onfe
rron
i mul
tiple
com
paris
ons (
P <
0.05
).
Obesity (Silver Spring). Author manuscript; available in PMC 2010 March 28.
NIH
-PA Author Manuscript
NIH
-PA Author Manuscript
NIH
-PA Author Manuscript
Davis et al. Page 13
Tabl
e 2
Ant
hrop
omet
ric a
nd b
ody
com
posi
tion
(DX
A):
acro
ss g
roup
s eff
ects
Con
trol
(C) (
n =
16)
Nut
ritio
n ed
ucat
ion
(N) (
n =
21)
Nut
ritio
n +
stre
ngth
trai
ning
(N+S
T) (
n =
17)
Out
com
esa
Pret
est
Post
-test
Pret
est
Post
-test
Pret
est
Post
-test
Pva
lueb
BM
I (kg
/m2 )
33.7
(8.5
)33
.9 (8
.3)
32.3
(6.0
)32
.2 (6
.1)
34.9
(6.8
)34
.9 (6
.3)
0.74
BM
I z -s
core
2.1
(0.7
)2.
1 (0
.6)
2.0
(0.5
)2.
0 (0
.5)
2.2
(0.6
)2.
2 (0
.5)
0.39
BM
I per
cent
ile95
.5 (7
.2)
96.2
(5.0
)96
.2 (4
.2)
95.7
(5.5
)97
.0 (3
.8)
97.4
(3.3
)0.
16
Wei
ght (
kg)
93.0
(25.
8)93
.6 (2
6.0)
87.9
(18.
4)88
.0 (1
8.0)
95.3
(24.
8)95
.0 (2
1.3)
0.86
Tota
l fat
(kg)
34.5
(16.
9)34
.4 (1
4.7)
31.7
(10.
4)31
.6 (1
0.0)
36.7
(13.
1)35
.4 (1
1.1)
0.66
Tota
l lea
n (k
g)54
.7 (9
.5)
55.8
(11.
7)53
.8 (0
.8)
53.8
(9.2
)55
.5 (1
1.4)
56.6
(11.
4)0.
27
a Dat
a ar
e m
ean
(s.d
.).
b P va
lues
wer
e ca
lcul
ated
usi
ng a
naly
sis o
f cov
aria
nce.
Cov
aria
tes i
nclu
ded:
age
and
sex
for a
ll; d
ual-e
nerg
y X
-ray
abs
orpt
iom
etry
(DX
A) f
at w
as a
djus
ted
for l
ean,
and
lean
for f
at. W
hile
raw
scor
es a
rere
porte
d he
re fo
r all
varia
bles
, ana
lyse
s wer
e ba
sed
on lo
g sc
ores
for w
eigh
t and
tota
l fat
. For
BM
I per
cent
ile, a
tran
sfor
mat
ion
invo
lvin
g ln
(hig
hest
val
ue +
1)-
Y w
as u
sed.
Obesity (Silver Spring). Author manuscript; available in PMC 2010 March 28.

NIH
-PA Author Manuscript
NIH
-PA Author Manuscript
NIH
-PA Author Manuscript
Davis et al. Page 14
Tabl
e 3
Glu
cose
and
insu
lin d
ynam
ics f
rom
OG
TT a
nd F
SIV
GTT
: acr
oss g
roup
s eff
ects
for e
valu
able
par
ticip
ants
(N =
54)
Con
trol
(C) (
n =
16)
Nut
ritio
n ed
ucat
ion
(N) (
n =
21)
Nut
ritio
n +
stre
ngth
trai
ning
(N+S
T) (
n =
17)
Out
com
esa
Pret
est
Post
-test
Pret
est
Post
-test
Pret
est
Post
-test
P va
lueb
OG
TT (3
-h)
Fa
stin
g gl
ucos
e (m
g/dl
)93
.7 (7
.1)
88.7
(8.0
)92
.2 (6
.1)
91.4
(6.5
)90
.9 (7
.3)
88.5
(8.6
)0.
11
2-
h G
luco
se (m
g/dl
)12
0.0
(25.
3)12
0.9
(32.
3)13
4.6
(18.
5)11
7.6
(24.
6)12
7.6
(30.
3)12
4.3
(17.
5)0.
16
Fa
stin
g in
sulin
(μU
/ml)
27.1
(17.
3)26
.1 (1
9.7)
26.1
(16.
3)24
.3 (1
4.5)
31.7
(10.
6)27
.8 (1
2.5)
0.82
2-
h In
sulin
(μU
/ml)
132.
7 (9
1.4)
164.
5 (1
83.5
)24
9.9
(204
.3)
169.
0 (2
59.6
)18
4.6
(108
.1)
150.
9 (9
2.5)
0.23
G
luco
se IA
UC
(nm
ol/m
in/l)
80.7
(50.
7)10
3.9
(60.
4)c
114.
1 (4
1.6)
94.8
(49.
4)d
98.2
(58.
3)91
.9 (5
6.0)
c0.
05
In
sulin
IAU
C (n
mol
/min
/l)30
9.4
(178
.0)
338.
4 (2
81.2
)45
9.3
(319
.5)
368.
3 (3
86.6
)40
5.0
(279
.1)
302.
6 (1
59.8
)0.
18
H
OM
A6.
2 (3
.8)
5.9
(4.8
)6.
1 (4
.2)
5.5
(3.3
)7.
1 (2
.5)
6.1
(3.0
)0.
71
FSIV
GTT
SI
(×10
−4/m
in/μ
U/m
l)1.
8 (1
.2)
1.9
(1.4
)1.
6 (0
.9)
1.8
(0.8
)1.
5 (0
.9)
1.5
(0.8
)0.
47
A
IR (μ
U/m
l × 1
0/m
in)
1,30
8.5
(930
.9)
1,40
4.8
(1,1
19.7
)1,
160.
4 (8
69.9
)1,
222.
8 (9
94.2
)1,
530.
0 (8
70.4
)1,
607.
0 (9
59.2
)0.
83
D
I (×1
0−4 /m
in)
1,94
4.4
(1,0
71.3
)1,
797.
4 (1
,038
.1)
1,29
7.1
(596
.7)
1,72
3.0
(898
.3)
1,83
2.6
(808
.8)
2,00
2.9
(994
.3)
0.43
AIR
, acu
te in
sulin
resp
onse
; FSI
VG
TT, f
requ
ently
sam
pled
intra
veno
us g
luco
se to
lera
nce
test
; HO
MA
, hom
eost
asis
mod
el a
sses
smen
t; O
GTT
, ora
l glu
cose
tole
ranc
e te
st.
a Dat
a ar
e m
ean
(s.d
.). S
ampl
e si
zes f
or in
sulin
sens
itivi
ty (S
I) a
nd d
ispo
sitio
n in
dex
(DI)
for t
he c
ontro
l gro
up w
as n
= 1
5.
b P va
lues
wer
e ca
lcul
ated
usi
ng a
naly
sis o
f cov
aria
nce.
Cov
aria
tes i
nclu
ded:
age
, sex
, dua
l-ene
rgy
X-r
ay a
bsor
ptio
met
ry fa
t and
lean
tiss
ue m
ass.
AIR
incl
uded
SI a
s a c
ovar
iate
. Whi
le ra
w sc
ores
are
repo
rted
here
for a
ll va
riabl
es, a
naly
ses w
ere
base
d on
log
scor
es fo
r all
varia
bles
exc
ept f
astin
g gl
ucos
e.
c Mea
ns w
ith d
iffer
ent l
ette
rs (c
and
d) a
cros
s int
erve
ntio
n gr
oups
are
sign
ifcan
tly d
iffer
ent f
rom
one
ano
ther
usi
ng B
onfe
rron
i mul
tiple
com
paris
ons (
P <
0.05
).
d Mea
ns w
ith d
iffer
ent l
ette
rs (c
and
d) a
cros
s int
erve
ntio
n gr
oups
are
sign
ifcan
tly d
iffer
ent f
rom
one
ano
ther
usi
ng B
onfe
rron
i mul
tiple
com
paris
ons (
P <
0.05
).
Obesity (Silver Spring). Author manuscript; available in PMC 2010 March 28.