3,5-Diiodo-L-thyronine powerfully reduces adiposity in rats by increasing the burning of fats
22
©2005 FASEB The FASEB Journal express article 10.1096/fj.05-3977fje. Published online July 12, 2005. 3,5-Diiodo-L-thyronine powerfully reduces adiposity in rats by increasing the burning of fats Antonia Lanni,* Maria Moreno, † Assunta Lombardi, ‡ Pieter de Lange,* Elena Silvestri, † Maurizio Ragni,* Paola Farina,* Gabriella Chieffi Baccari,* Pupah Fallahi, § Alessandro Antonelli, § and Fernando Goglia † *Dipartimento di Scienze della Vita, Seconda Università di Napoli, 81100 Caserta; † Dipartimento di Scienze Biologiche ed Ambientali, Università degli Studi del Sannio, 82100 Benevento; ‡ Dipartimento delle Scienze Biologiche Sezione Igiene e Fisiologia, Università degli Studi di Napoli “Federico II,” 80134 Napoli; and § Dipartimento di Medicina Interna, Università degli Studi di Pisa, 56126 Pisa, Italy Corresponding authors: Fernando Goglia, Dipartimento di Scienze Biologiche ed Ambientali, Università degli Studi del Sannio, Via Port’Arsa 11, 82100 Benevento, Italy. E-mail: [email protected]; and Antonia Lanni, Dipartimento di Scienze della Vita, Seconda Università di Napoli, Via Vivaldi 43, 81100 Caserta, Italy. E-mail: [email protected] ABSTRACT The effect of thyroid hormones on metabolism has long supported their potential as drugs to stimulate fat reduction, but the concomitant induction of a thyrotoxic state has greatly limited their use. Recent evidence suggests that 3,5-diiodo-L-thyronine (T 2 ), a naturally occurring iodothyronine, stimulates metabolic rate via mechanisms involving the mitochondrial apparatus. We examined whether this effect would result in reduced energy storage. Here, we show that T 2 administration to rats receiving a high-fat diet (HFD) reduces both adiposity and body weight gain without inducing thyrotoxicity. Rats receiving HFD + T 2 showed (when compared with rats receiving HFD alone) a 13% lower body weight, a 42% higher liver fatty acid oxidation rate, ~50% less fat mass, a complete disappearance of fat from the liver, and significant reductions in the serum triglyceride and cholesterol levels (–52% and –18%, respectively). Thyroid hormones and thyroid-stimulating hormone (TSH) serum levels were not influenced by T 2 administration. The biochemical mechanism underlying the effects of T 2 on liver metabolism involves the carnitine palmitoyl-transferase system and mitochondrial uncoupling. If the results hold true for humans, pharmacological administration of T 2 might serve to counteract the problems associated with overweight, such as accumulation of lipids in liver and serum, without inducing thyrotoxicity. However, the results reported here do not exclude deleterious effects of T 2 on a longer time scale as well as do not show that T 2 acts in the same way in humans. Key words: thyroid hormone ● mitochondria ● liver ● energy metabolism hyroid hormones [THs; thyroxine (T 4 ) and 3,3′,5-triiodo-L-thyronine (T 3 )] exert a multiplicity of effects and are necessary for growth, differentiation, and metabolism. The first two actions predominate in the early stages of life, whereas the “metabolic effect” T Page 1 of 22 (page number not for citation purposes)
-
Upload
independent -
Category
Documents
-
view
4 -
download
0
Transcript of 3,5-Diiodo-L-thyronine powerfully reduces adiposity in rats by increasing the burning of fats

©2005 FASEB
The FASEB Journal express article 10.1096/fj.05-3977fje. Published online July 12, 2005.
3,5-Diiodo-L-thyronine powerfully reduces adiposity in rats by increasing the burning of fats Antonia Lanni,* Maria Moreno,†Assunta Lombardi,‡ Pieter de Lange,* Elena Silvestri,† Maurizio Ragni,* Paola Farina,* Gabriella Chieffi Baccari,* Pupah Fallahi,§ Alessandro Antonelli,§ and Fernando Goglia†
*Dipartimento di Scienze della Vita, Seconda Università di Napoli, 81100 Caserta; †Dipartimento di Scienze Biologiche ed Ambientali, Università degli Studi del Sannio, 82100 Benevento; ‡Dipartimento delle Scienze Biologiche Sezione Igiene e Fisiologia, Università degli Studi di Napoli “Federico II,” 80134 Napoli; and §Dipartimento di Medicina Interna, Università degli Studi di Pisa, 56126 Pisa, Italy
Corresponding authors: Fernando Goglia, Dipartimento di Scienze Biologiche ed Ambientali, Università degli Studi del Sannio, Via Port’Arsa 11, 82100 Benevento, Italy. E-mail: [email protected]; and Antonia Lanni, Dipartimento di Scienze della Vita, Seconda Università di Napoli, Via Vivaldi 43, 81100 Caserta, Italy. E-mail: [email protected]
ABSTRACT
The effect of thyroid hormones on metabolism has long supported their potential as drugs to stimulate fat reduction, but the concomitant induction of a thyrotoxic state has greatly limited their use. Recent evidence suggests that 3,5-diiodo-L-thyronine (T2), a naturally occurring iodothyronine, stimulates metabolic rate via mechanisms involving the mitochondrial apparatus. We examined whether this effect would result in reduced energy storage. Here, we show that T2 administration to rats receiving a high-fat diet (HFD) reduces both adiposity and body weight gain without inducing thyrotoxicity. Rats receiving HFD + T2 showed (when compared with rats receiving HFD alone) a 13% lower body weight, a 42% higher liver fatty acid oxidation rate, ~50% less fat mass, a complete disappearance of fat from the liver, and significant reductions in the serum triglyceride and cholesterol levels (–52% and –18%, respectively). Thyroid hormones and thyroid-stimulating hormone (TSH) serum levels were not influenced by T2 administration. The biochemical mechanism underlying the effects of T2 on liver metabolism involves the carnitine palmitoyl-transferase system and mitochondrial uncoupling. If the results hold true for humans, pharmacological administration of T2 might serve to counteract the problems associated with overweight, such as accumulation of lipids in liver and serum, without inducing thyrotoxicity. However, the results reported here do not exclude deleterious effects of T2 on a longer time scale as well as do not show that T2 acts in the same way in humans.
Key words: thyroid hormone ● mitochondria ● liver ● energy metabolism
hyroid hormones [THs; thyroxine (T4) and 3,3′,5-triiodo-L-thyronine (T3)] exert a multiplicity of effects and are necessary for growth, differentiation, and metabolism. The first two actions predominate in the early stages of life, whereas the “metabolic effect” T
Page 1 of 22(page number not for citation purposes)
predominates in the adult. Many of the effects are exerted through the positive or negative regulation of thyroid-responsive genes via thyroid hormone receptors (TRs). The TRs are members of a larger family of nuclear receptors that are generally agreed to act by binding to specific DNA elements (for reviews, see refs 1–3), although a mechanism independent of DNA binding has been suggested (4). Many nongenomic effects of THs have also been reported, and some of these are attributable to iodothyronines other than T4 and T3 (for reviews, see refs 5–7). Thyroid hormones are well known both to stimulate metabolism and (at the same time) to lower metabolic efficiency. This effect has long been the focus of research into the potential use of THs as drugs to stimulate weight-loss. However, the concomitant induction of a thyrotoxic state has greatly limited the use of T3 and T4 as weight-lowering agents. The term “thyrotoxicosis” is used here, following Braverman and Utiger (8), to mean the clinical syndrome of hypermetabolism that results when the serum concentration of free T3 (FT3), free T4 (FT4), or both is increased as a consequence of the exogenous administration of these hormones. Some signs of the thyrotoxic state are increase in heart rate, increases in thyroid and heart mass, decrease in skeletal muscle mass, and serum thyroid-stimulating hormone (TSH) levels reaching minimal values (8). In patients receiving THs, variations in the above-mentioned serum parameters (TSH, FT3, and FT4 serum levels) constitute the biochemical confirmation of a thyrotoxic state. Until recently, T3 was commonly assumed to be the only active iodothyronine, with T4 being its precursor. A growing body of evidence, however, seems to require a revision of that opinion, and it is now evident that other iodothyronines, in particular T2, have biological effects (9–14). Indeed, a single dose of T2 (25 μg/100 g body wt.) stimulates the resting metabolic rate (RMR) of hypothyroid rats to the same extent (~40%) as the same dose of T3; however, the former acts via a different mechanism, one not involving the nuclear pathway (13). In addition, T2 can induce metabolic inefficiency, possibly by stimulating energy loss via mechanisms involving mitochondrial proton leakage/redox slippage (15, 16). Such inefficiency in energy transduction should result in reduced energy storage. In view of these metabolic effects of T2 and the very low affinity of T2 for nuclear T3 receptors (17), we thought it conceivable that in rats fed a high-fat diet (HFD), long-term treatment with T2 might result in a reduced adiposity and less body weight gain without inducing a clinical syndrome related to the thyrotoxic state. To test this idea, we administered T2 for 30 days to rats on an HFD and then assessed the thyroid state by measuring the serum levels of FT3 and FT4. To see if, under our conditions, T2 exerts an effect on the mechanism underlying TSH secretion by the pituitary, we also measured TSH serum levels. In addition, we measured the adipose tissue mass, body weight gain, liver adiposity, liver fatty acid oxidation rate, and the serum levels of triglyceride, fatty acids, and cholesterol.
We also searched for the cellular biochemical pathways involved in the effects of T2 on fatty acid oxidation. One of the major pathways leading to increased fatty acid oxidation involves activation of the carnitine palmitoyl-transferase (CPT) system by the AMP-activated protein kinase (AMPK)-acetyl-coenzymeA-carboxylase (ACC)-malonyl CoA signaling pathway (18, 19). The phosphorylated form of AMPK (P-AMPK) phosphorylates and inactivates ACC (18, 19), thus decreasing the cellular concentration of malonyl-CoA, an allosteric inhibitor of CPT1 (the outer enzyme of the CPT system), which is rate limiting for the transport of fatty acids into the mitochondrial matrix and thus for their oxidation. Decreased levels of malonyl-CoA thereby lead to an activation of CPT1 and hence to an increased transport of fatty acids into the mitochondrial matrix (20, 21). Under several physiological conditions, ACC has been shown to be subject to a regulation that is both transcriptional (22) and posttranslational via AMPK (23). Because of this, we investigated the possible involvement of such a pathway in the effects of T2
Page 2 of 22(page number not for citation purposes)

on liver fatty acid oxidation (by measuring both CPT and ACC activity, and AMPK phosphorylation in the liver). Finally, to ascertain whether T2 might induce a less efficient utilization of lipid substrates through a stimulation of mitochondrial uncoupling, the liver mitochondrial proton leak was measured. Indeed, during mitochondrial respiration, the transfer of protons along the respiratory chain in the inner mitochondrial membrane is coupled to the translocation (pumping) of protons from the mitochondrial matrix into the intermembrane space, thus generating an electrochemical proton gradient across the inner membrane. This gradient is used to drive the protons back into the matrix through the ATP synthase complex, thus resulting in ATP synthesis. Alternatively, the gradient can be dissipated by proton leak, which consists in a reentry of protons within the matrix that bypasses the ATP-synthase complex. The data from rats receiving HFD + T2 were compared both with those from normal euthyroid rats receiving a standard diet and with those from rats receiving HFD alone.
MATERIALS AND METHODS
Animals and animal care
Male Wistar rats (aged 8 wk) were purchased from Charles Rivers (Lecco, Italy). They were housed in individual cages in a temperature-controlled room at 28°C (thermoneutrality temperature for rats) with a 12 h light-dark cycle. A commercial mash (Charles Rivers) was available ad libitum, and the animals also had free access to water.
At the start of the study, after 7–10 days of acclimatization (day 0), the rats were divided into three groups (each group, 12 animals). In each group, body weight was normally distributed, and group means were similar (299±5 g). The first group (referred to as N) was fed a standard diet (total metabolizable percentage of energy: 60.4 carbohydrates, 29 proteins, 10.6 fat J/J; 15.88 KJ gross energy/g); the second group (referred to as D) with an HFD (total metabolizable percentage of energy: 21 carbohydrates, 29 proteins, 50 fat J/J; 19.85 KJ gross energy/g); and the third group (referred to as DT2) with the same HFD supplemented with a daily intraperitoneal injection of T2 (25 μg/100 g body wt.). N and D rats were daily intraperitoneally injected with the same volume of saline. Body weight and food intake were monitored daily throughout the entire experimental period lasting 1 month. The pharmacological dose of 25 μg T2/100 g body wt. was chosen after consideration of some data from studies in which T3 and T2 were used. In fact, 1) in previous studies in which an effort was made to decrease the body fat content of ob/ob mice by administering T3, only at 25 μg/100 g body wt. did T3 treatment sufficiently decrease the percentage of lipid in the body (24); and 2) chronic treatment (over 2 wk and over 3 months) of rats with doses of 25 μg T2 /100 g body wt. did not result in any thyrotoxic effect that might be of clinical relevance (25). These considerations, together with the data present in literature so far, showing that T2 serum levels are ~40–100 times lower than those of T3 (26), allow us to be confident that the dose of 25 μg/100 g bdoy wt. is a pharmacological one putatively with no thyrotoxic effect. Heart rate was monitored at the beginning, in the middle, and at the end of the treatment period from the electrocardiogram obtained by means of a paper ECG recorder (Cardiotest EK 41; Hellige, Freiburg, Germany). Energy expenditure (VO2) and respiratory quotient (RQ) were measured using an Oxymax indirect calorimeter (Columbus Instruments, Columbus, OH) with an air flow of 4 Lt/min at 28°C. This was done both at the beginning and at the end of the treatment period. After 1 h, to allow for adaptation to the metabolic chamber, VO2 and VCO2 were measured in individual rats at 15 min intervals over a 24 h period. RQ is the
Page 3 of 22(page number not for citation purposes)
ratio of the volume of CO2 produced to the volume of O2 consumed (VCO2/VO2). The rats had free access to food (normal pellets or the HFD, as appropriate) and water during the measurements (for more details, see ref 27). Body temperature was measured using a rectal probe (307-Digital Thermometer).
At the end of the treatment, the rats were anesthetized by intraperitoneal injection of chloral hydrate (40 mg/100 g body wt.) and then killed by decapitation. Liver, hindlimb skeletal muscle (gastrocnemius and tibialis anterior), heart, thyroid glands, and visceral white adipose tissue (epididymal or parametrial, perirenal, mesenteric, and inguinal depots) were removed. Tissues to be used for preparation of mitochondria were weighed and processed immediately; other samples were immediately frozen in liquid nitrogen and stored at –80°C before RNA extraction and histological analysis. All procedures were approved by the local and national institutional animal care and use committees.
Isolation of mitochondria
Fresh livers and hindlimb skeletal muscles were minced in ice-cold buffer consisting of 220 mM mannitol, 70 mM sucrose, 20 mM Tris-HCl, 1 mM EDTA, and 5 mM EGTA, pH 7.4 and then homogenized in a Potter-Elvehjem homogenizer. Nuclei and cell debris were removed by centrifugation at 500 g for 10 min, with the resulting supernatant being centrifuged at 3000 g and 8000 g for liver and skeletal muscle, respectively, as described by Lanni et al. (28, 29). The mitochondrial pellet was washed twice and resuspended in a minimal volume of isolation medium, and kept on ice. The protein concentration was determined by the method of Hartree (30), using bovine serum albumin (BSA) as standard.
Measurement of fatty acid oxidation rate
The rate of mitochondrial fatty acid oxidation was assessed polarographically using a Clark-type electrode (31) at 30°C in a final volume of 0.5 ml of 80 mM KCl, 50 mM HEPES (pH 7.0), 1 mM EGTA, 5 mM K2HPO4, 1% BSA (w/v), and 2.5 mM malate in the presence of ADP (120 μg/ml). The reaction was started by the addition of palmitoyl-L-carnitine (40 μM). All the chemicals were purchased from Sigma-Aldrich (St. Louis, MO).
Measurement of enzyme activities
To measure ACC activity, powdered frozen liver (0.1 g) was homogenized in 10 vol of 0.3 M mannitol, 100 mM Tris-HCl buffer (pH 7.4 at 4°C), 2 mM EDTA, 50 mM NaF, and 2 mM Na4P2O7 containing 1 mM benzamidine and 1 mM phenylmethanesulfonyl fluoride (PMSF). The homogenate was centrifuged at 12,000 g for 3 min, and poly(ethylene-glycol) was added to the supernatant to a final concentration of 6% (w/v) according to Munday et al. (32). The mixture was vortex mixed, left on ice for 5 min, and then centrifuged at 12,000 g for 3 min. The poly(ethylene-glycol) pellet was assayed spectrophotometrically for ACC activity, as reported by Tanabe et al. (33), in the presence of 20 mM citrate.
Total CPT (CPT1 plus CPT2) activity was measured spectrophotometrically by following (at 412 nm) the kinetics of carnitine-dependent CoASH production in the presence of 5,5′-dithio-bis(2-nitrobenzoic acid) using palmitoyl-CoA as substrate, as reported by Alexson and Nedergaard (34). An Σ412 value of 13.6 mM-1·cm-1 was applied for the calculation of total CPT activity.
Page 4 of 22(page number not for citation purposes)

Western blot analysis
Analyses were performed on liver crude lisates in 20 mM Tris-HCl pH 7.5, 150 mM NaCl, 1 mM EDTA, 1 mM EGTA, 2.5 mM sodium pyrophosphate, 1 mM β-glycerolphosphate, 1 mM Na3VO4, 1 mM PMSF, 1 mg/ml leupeptin, 1% Triton X-100 (all from Sigma) obtained by ultraturrax homogenizer, and centrifuged at 12,000 rpm for 10 min at 4°C. Protein levels (total AMPK and ACC) in liver lysates (30 μg of protein) were determined using 13% and 5% SDS polyacrylamide gels, respectively, and specific antibodies against AMPK (Cell Signaling Technology, Beverly, MA) and ACC (Upstate Biotech., Lake Placid, NY). Phosphorylation of the α-subunit of AMPK was determined using an antibody against phosphopeptides based on the amino acid sequence surrounding Thr 172 of the α-subunit of human AMPK (Cell Signaling Technology). UCP3 protein levels in mitochondrial lysates (30 μg of protein) were determined using 13% SDS polyacrylamide gel and a polyclonal antibody raised against the C-terminal region of the human UCP3 protein (AB3046; Chemicon International, Temecula, CA) was used as primary antibody as described by de Lange et al. (35). Protein levels were determined, using peroxidase-linked secondary antibodies, by a chemoluminescence protein-detection method, using a commercially available kit (NEN; Life Science Products, Boston, MA).
Mitochondrial proton leak
Mitochondria (1 mg/ml) were incubated at 37°C in a medium consisting of 80 mM KCl, 50 mM HEPES pH 7.0, 1 mM EGTA, and 5 mM K2HPO4, with 1 μg/ml oligomycin added to block protons from reentering the mitochondrial matrix via ATP synthase. Rotenone was added (4 μM) to prevent oxidation of any endogenous NAD-linked substrates. Nigericin (80 ng/ml) was added to abolish the pH gradient. With the use of succinate as a substrate (5 mM), respiration rate and membrane potential were measured simultaneously using a Clark-type oxygen electrode and a triphenylmethylphosphonium (TPMP+)-sensitive electrode, respectively, as described by Brown and Brand (36). Potential was varied by titration with submaximal doses of malonate within the range of 0-5 mM. A TPMP binding correction factor of 0.4 was used.
RNA isolation
Total RNA was isolated from individual livers using TRIzol Reagent (Life Technologies, Gaithersburg, MD), according to the protocol supplied by the manufacturer. The quality of the RNA samples was checked on a denaturing agarose gel.
RT-PCR assays
RT-PCR assays were performed as described previously (37) with slight adaptations. One microgram of total RNA was reverse-transcribed using 100 pmol random hexamers (Invitrogen Life Technologies, Groningen, The Netherlands), 2.0 units Superscript reverse-transcriptase, 10 units RNase inhibitor, and 1 mM deoxynucleotide triphosphates (dNTPs) in reverse-transcriptase buffer (all from HT Biotechnology, Cambridge, UK). The total volume was adjusted to 20 μl with distilled H2O, and the reaction was carried out for 1 h at 40°C. One quarter of the RT-reaction mixture was used directly for the PCR reaction in a total volume of 25 μl, containing 0.25 units of SuperTaq polymerase, 0.25 mM dNTPs, SuperTaq PCR buffer (all from HT Biotechnology), 5% (v/v) DMSO (DMSO, Sigma-Aldrich), and 0.38 pmol of the relevant
Page 5 of 22(page number not for citation purposes)
oligonucleotide primers (Sigma Genosys, Cambridge, UK). As an internal control, the same cDNAs were amplified using 40S ribosomal protein S12 (RPS12) oligonucleotide primers. The primers used had the following sequences: RPS12 sense, 5′-GCTGCTGGAGGTGTAATGGA-3′; RPS12 antisense, 5′-CTACAACGCAACTGCAACCA-3′; UCP3 sense, 5′-ATGGATGCCTACAGAACCAT-3′; UCP3 antisense, 5′-CTGGGCCACCATCCTCAGCA-3′; UCP2 sense, 5′-CCTTCTGCACTCCTGTGTTC-3′; UCP2 antisense, 5′-GTGGCCTTGAAACCAACCAT-3′; CPT1α sense, 5′-ATGTGGACCTGCATTCCTTC-3′; CPT1α antisense, 5′-CCTTCAGGAAAGGTGAGTCG-3′. Parallel amplifications (20, 25, and 30 cycles) of a given cDNA were used to determine the optimum number of cycles. For each gene under study, a readily detectable signal within the linear range was observed after 30 cycles. For the actual analysis, samples were heated for 5 min at 94°C, and then 30 cycles were carried out, each consisting of 1 min at 94°C, 1.5 min at 61°C, and 1.5 min at 72°C. This was followed by a final 10 min extension at 72°C. The quantities of the PCR products were determined in separate preparations from three rats. Separation of the PCR reaction products was performed on a 2% agarose gel containing EtBr, and the products were readily visualized. Reverse-image signals of the RT-PCR bands were quantified by means of a Bio-Rad Molecular Imager FX using the supplied software (Bio-Rad Laboratories, Hercules, CA). Expression signals of the genes were normalized to the nonregulated RPS12 signal.
Histological analyses
Sections of livers from three animals in each experimental group were fixed in formol-calcium, and 10 μm frozen sections were subsequently stained with Sudan black B for the detection of fat (38).
Serum levels of cholesterol, triglycerides, fatty acids, FT3, FT4, and TSH
The serum levels of cholesterol, triglycerides, and fatty acids were determined by following standard procedures. Those of FT3, FT4, and TSH were determined by means of radioimmunoassays. TSH was measured using materials and protocols supplied by Amersham Bioscience, with rat TSH as standard [Biotrak TM rat thyroid stimulating hormone (rTSH) [125I] assay system]. FT3 and FT4 levels were determined using materials and protocols supplied by Byk-Sangtec Diagnostica (Dietzenbach, Germany).
TRH stimulation test
To assess the integrity of the hypothalamo-pituitary-thyroid (HPT) axis in three additional groups of animals (N, D, and DT2), we performed a TRH stimulation test. TRH has been administered intraperitoneally at 100 ng/100 g body wt., a dose that has been reported to give a more than twofold increase in TSH at 2 min (39). Five rats from each treatment were killed at 0, 0.5, 1, and 2 h after administration of TRH, and blood was collected to perform serum TSH analysis.
Statistical analysis
Values are means ± SE. Data were evaluated by ANOVA followed by the Newman-Keuls test, with differences being considered significant when at least P < 0.05.
Page 6 of 22(page number not for citation purposes)

RESULTS
T2 decreases body weight gain and adiposity without inducing a thyrotoxic state
To determine if in rats fed an HFD, long-term treatment with T2 might result in reduced adiposity and thus less body weight gain, without inducing a clinical syndrome related to the thyrotoxic state, we administered T2 for 30 days to rats on an HFD. In such DT2 rats, serum levels of TSH, FT3, and FT4 showed no substantial differences from the normal euthyroid values (see Table 1). Although the slight decrease in FT4 values in DT2 rats was not significant, it might be thought to be in some way indicative of a suppression of the HPT axis. To examine this important issue, three additional groups of animals (N, D, and DT2, n=4 for each group) were subjected to a “TRH-test.” The basal TSH values were 0.58 ± 0.07, 0.53 ± 0.05, and 0.56 ± 0.06 ng/ml in N, D, and DT2 groups, respectively. No significant difference in the response of serum TSH to TRH injection was observed among the samples from the three groups. The TSH level peaked (roughly 5-fold increases) at 30 min, reaching values of 2.81 ± 0.14, 2.64 ± 0.23, and 2.89 ± 0.18 ng/ml, respectively. It then showed a marked decline to levels ~2× basal at 60 min after the TRH injection (1.14±0.11, 1.03±0.09, and 1.16±0.09 ng/ml, respectively) and had returned to values not significantly different from basal at 2 h. These results, showing no differences between N, D, and DT2 groups, demonstrate that the HPT axis is not disturbed in these animals. The weights of thyroid glands and heart did not change significantly from the normal euthyroid values, whereas visceral white adipose tissue and liver weights were significantly decreased (see Table 1). Moreover, no change in heart rate was observed (either in the middle or at the end of the treatment) after T2 administration. The data reported in Table 1 are the values recorded at the end of the treatment. Over the entire period of treatment, D rats consumed ~5% more food than N rats, while DT2 animals consumed ~6% more than the D ones (see Table 2). At the end of the treatment period, the D rats were overweight, weighing ~13% more than N rats (Fig. 1A). The DT2 rats, on the other hand, were 13% lighter than the D animals (Fig. 1B), with the result that their body weight was not different from that of normal animals fed a standard diet (Fig. 1A). The DT2 rats accumulated much less fat in their adipose tissue than the D animals (Fig. 1C). The visceral fat pad tissue weighed 19.3 ± 2.97 g per rat in D rats against 10.2 ± 2.4 g in DT2 ones (P<0.05; Table 1 and Fig. 1D). In N rats, the corresponding weight was 9.4 ± 1.5 g (not significantly different from the DT2 value). The lean mass was not affected by T2 treatment. The muscle mass, in fact, did not vary after T2 administration to both N and D rats (data not shown). Determinations made at the end of the treatment period showed that energy expenditure over a 24 h period was markedly greater in DT2 rats (+29%) than in D ones (see Table 2). These changes resulted in an increased heat production and an increased body temperature. Indeed, the colonic temperature of DT2 rats was slightly but significantly higher in DT2 rats compared with both D and N (Table 2). The livers of D rats were lighter in color than the DT2 livers, suggesting that they contained more fat (Fig. 2A). Stained sections showed that D livers contained abundant fat droplets, whereas these were not apparent at all in DT2 livers (Fig. 2B and C).
T2 increases hepatic fatty acid oxidation
We thought that an increased oxidation of fatty acids might underlie the reduced fat storage in adipose tissue in DT2 rats. We therefore measured the fatty acid oxidation rate in the liver and in hindlimb skeletal muscle.
Page 7 of 22(page number not for citation purposes)
The fatty acid oxidation rate (reported as nmol O/min mg protein) in the liver of N rats was 61 ± 4. The rate was 30% higher in D rats, and it was further increased (+42% vs. D rats) in DT2 rats (79±5 and 112±7, respectively; P<0.05 in each case). In the muscle, the fatty acid oxidation rate, which was 139 ± 13 in N rats, was almost unchanged in both D and DT2 rats (116±15 and 128±20, respectively). To extend our insight into the lack of stimulation of fatty acid oxidation in muscle mitochondria in D and DT2 rats, we measured CPT activity. This activity was not significantly different among the groups, although it tended to be slightly increased after T2 treatment (22.2±2.7, 18.7±2.1, and 23.4±2.5 nmol/min mg protein for N, D, and DT2 groups, respectively)
These results implicate the liver as a major player in the effects seen here with T2. Such results, showing an effect of T2 on fatty acid oxidation, are not surprising since a previous study (40) demonstrated stimulation of β-oxidation by T2 in the whole animal by a noninvasive method: namely, 13CO2 recovery in the breath after injection of octanoic acid-[1-13C]. The decrease in RQ shown in Table 2 for D rats (vs. N rats) and the further decrease in DT2 animals (vs. D) indicate a shift in metabolism toward an increase in the utilization of lipids as substrate. This is in line with the observed increase in the fatty acid oxidation rate.
T2 decreases serum levels of cholesterol and triglycerides
Increased fat oxidation might result in alterations in certain serum parameters related to fat metabolism, such as the levels of cholesterol, triglycerides, and fatty acids. In fact, when compared with those in the D group, all the above-mentioned parameters were decreased in DT2 rats (i.e., after T2 administration; Fig. 3). The serum cholesterol level was 30% higher in D rats than in N ones, whereas in DT2 animals it was significantly reduced (vs. the D value) to a level not significantly different from that seen in N rats. The serum triglycerides level was the most affected by T2 administration: the level was 107% higher in D than in N rats, and T2 administration significantly lowered this to a level similar to the N value. The serum fatty acid level was significantly higher in D rats, and administration of T2 reduced it to a value not significantly different from that of N animals (Fig. 3).
T2 activates CPT system and AMPK phosphorylation in liver
We next examined the biochemical mechanisms that might be involved in both the stimulation of liver fatty acid oxidation and the powerful reduction of adiposity that are induced by administration of T2.
To ascertain whether the stimulation of fatty acid oxidation in mitochondria from both D and DT2 rats might be dependent on the CPT system, we measured CPT activity. Although the CPT1 mRNA expression levels did not vary among the groups (data not shown), the CPT system activity was significantly greater (by 38%) in D rats than in N ones and significantly greater (by 52%) in DT2 rats than in D rats (Fig. 4A).
In D rats, the total ACC activity was ~65% lower than in N rats (Fig. 4B) despite the phosphorylated form of AMPK being decreased (vs. N; Fig. 4C). In DT2 animals, the ACC activity was not decreased further (Fig. 4B) despite the phosphorylated form of AMPK being increased in comparison with that in D rats (Fig. 4C). The decrease in ACC activity seen in D
Page 8 of 22(page number not for citation purposes)
animals (vs. N ones) was due to a reduced ACC protein content, as shown by the Western blot analysis (Fig. 4C). In DT2 rats, ACC protein levels and activity were not decreased below the levels seen in D rats despite the DT2 group exhibiting both the highest CPT activity (+52% vs. D rats) and the highest fatty acid oxidation rate (+42% vs. D rats) as well as a high level of phosphorylated AMPK (Fig. 4B and C).
T2 activates mitochondrial proton leak in liver
We next examined whether T2 might not only stimulate fatty acid oxidation but also induce a less efficient utilization of lipid substrates through a stimulation of mitochondrial uncoupling. We did this by evaluating the kinetic response of the proton leak to a change in membrane potential both in liver and skeletal muscle mitochondria from N, D, and DT2 rats. To judge from our data, liver mitochondria from DT2 rats would need to respire more than D and N rats to maintain the same membrane potential, indicating that DT2 liver mitochondria have a higher proton conductance, although no differences in proton leak kinetics between D and N rats were observed (Fig. 4D). The same did not occur in skeletal muscle mitochondria as D and DT2 skeletal muscle mitochondria have the same proton conductance (data not shown). As mitochondrial uncoupling increases the burning of fat, these results are in line with the above-mentioned effects of T2 on adiposity and further support the liver as a principal target of T2. The effect of T2 on liver mitochondrial efficiency could be ascribed to an induction of the expressions of uncoupling proteins (UCP2 and UCP3), which have been proposed by some authors as mediators of an uncoupling effect (for reviews see refs 41 and 42). However, this appears not to be true in the case of the effect of T2 on mitochondrial proton-leak since 1) UCP2 protein was found not to be expressed, even though its mRNA was present (data not shown); and 2) UCP3 was absent at both mRNA and protein levels (data not shown). Thus, the mechanism underlying the uncoupling effect of T2 remains to be elucidated even though previous studies (14, 16, 43) had already shown that the addition of T2 to a reconstituted cytochrome-c oxidase (COX) complex led to a decrease in the respiratory control ratio of the complex. The authors concluded that the effect of T2 on COX results in partial uncoupling of oxidative phosphorylation and decrease H+/e- stoichiometry, which may, at least in part, support our data.
DISCUSSION
Although it is well known that T3 stimulates lipogenesis as well as lipolysis, the precise biological relevance of this bidirectional effect is not clearly understood. It is possible that the primary function of enhanced lipogenesis is to provide fatty acids for membrane synthesis, while the increased fat oxidation may be useful to sustain the energy cost of the various activities that are stimulated by THs (5, 6, 44, 45). The effect of T3 on lipogenesis is due to an increased expression of genes encoding for lipogenic enzymes (5, 46, 47). Its effect on the oxidation of fats, on the other hand, seems to be secondary to a stimulation of many metabolic processes linked to mitochondrial activities (6, 45, 48, 49).
In the past, and to a large extent now, iodothyronines other than T3 have been regarded as inactive. However, several reports indicate that there are four iodothyronines with significant, but not identical, biological activities; namely, T4, T3, rT3, and T2 (for review, see ref 5). T2 is particularly intriguing because of its effects on metabolism. Starting more than a decade ago, when a surprising report appeared showing that T2 resulted in a rapid stimulation (within 30 min)
Page 9 of 22(page number not for citation purposes)
of oxygen consumption in perfused livers from hypothyroid rats (10), a number of papers were published showing biological effects of T2 (for reviews, see refs 5, 6, and 9). The results reported in the present paper are in line with the general conclusions of these previous studies. Indeed, our results show that T2 has the potential to reduce adiposity in HFD fed rats by increasing the burning of fats without inducing thyrotoxicosis. The problem of thyrotoxicosis has strongly limited the use of THs both as weight-lowering agents and as agents able to decrease serum parameters related to lipid metabolism. The major signs related to thyrotoxicosis are an increase in heart rate, decrease in skeletal muscle mass, and a dysfunction in the feedback mechanism that regulates the endogenous production of THs. The results reported here provide clear evidence that in HFD fed rats T2 is able to reduce both adiposity and the serum levels of fatty acids, triglycerides, and cholesterol without inducing any of these signs and without a significant effect on the thyroid axis. However, we cannot exclude that treatment with T2 on a longer time scale may produce some of these signs or possible deleterious effects linked to oxidative damages, and these aspects, in such a case, need to be carefully checked. No data are present in the literature about the effects of T2 in humans. Pinna et al. (50) reported that conditions in which a “low T3 state” occurs such as nonthyroidal illness and brain tumors are characterized by higher concentrations of T2 and concluded that such elevation of T2 may be a compensatory/defense mechanism activated to maintain a metabolic-clinical euthyroidism in patients with reduced T3 levels. In addition, as both central (TSH) and peripheral (CPT1 and UCP3) markers of the nuclear action of thyroid hormone are unaffected by T2 treatment, the present data lend further support to the notion that the effect of T2 on energy metabolism is independent of TRs [all the genes for the above markers have a thyroid-response element in their promoter (51–53)]. However, Ball et al. (17) have shown that T2 1) is able in stimulating growth hormone mRNA levels in GH3 cells, even if 100-fold less potent than T3; 2) has almost equivalent ability as that of T3 to down-regulate TRβ2 mRNA levels in the same cell line; and 3) when injected into hypothyroid rats (at the same dose at which it does not produce equivalent suppression of circulating TSH) is equivalent to T3 in inducing hepatic malic enzyme mRNA. Thus, we cannot exclude, at the moment, a potential involvement of a TRs isoform in some effects elicited by T2.
The liver, that is a major contributor to energy expenditure (54), appears to be the principal target for T2. Both the HFD and the T2 treatment employed in this study induced an increase in hepatic β-oxidation, but both the entity and the biochemical mechanisms underlying these effects may differ between the two treatments. When compared with the levels in N animals, in D rats β-oxidation was 30% higher, ACC activity significantly lower (–65%), and CPT activity 38% higher, but the phosphorylated form of AMPK (P-AMPK, which is known to inhibit ACC activity under several physiological conditions) was decreased. When compared with the levels in D animals, in DT2 rats ACC activity was not further decreased, despite further increases in β-oxidation (+42%), CPT activity (by 52%), and P-AMPK content (see Fig. 4C). These results apparently seem to exclude an involvement of the AMPK-ACC-CPT pathway in the observed effects of HFD and T2 on liver fatty acid oxidation when analyzed after 30 days. The reduced ACC activity seen in D rats was likely due to a reduced ACC protein content, and this suggests that the increase in fatty acid oxidation in D rats may be due to the following malonylCoA-dependent mechanism: reduced content of ACC→reduced level of malonylCoA→ activation of CPT system. Concerning DT2 rats, the results indicate that T2 is able further to increase fatty acid oxidation in parallel with CPT activity without increasing the mRNA levels of CPT1 and without any further inhibition of ACC activity but with a strong activation of AMPK. In view of this, we hypothesize that T2 might enhance fatty acid flux into mitochondria by regulating CPT1 activity
Page 10 of 22(page number not for citation purposes)
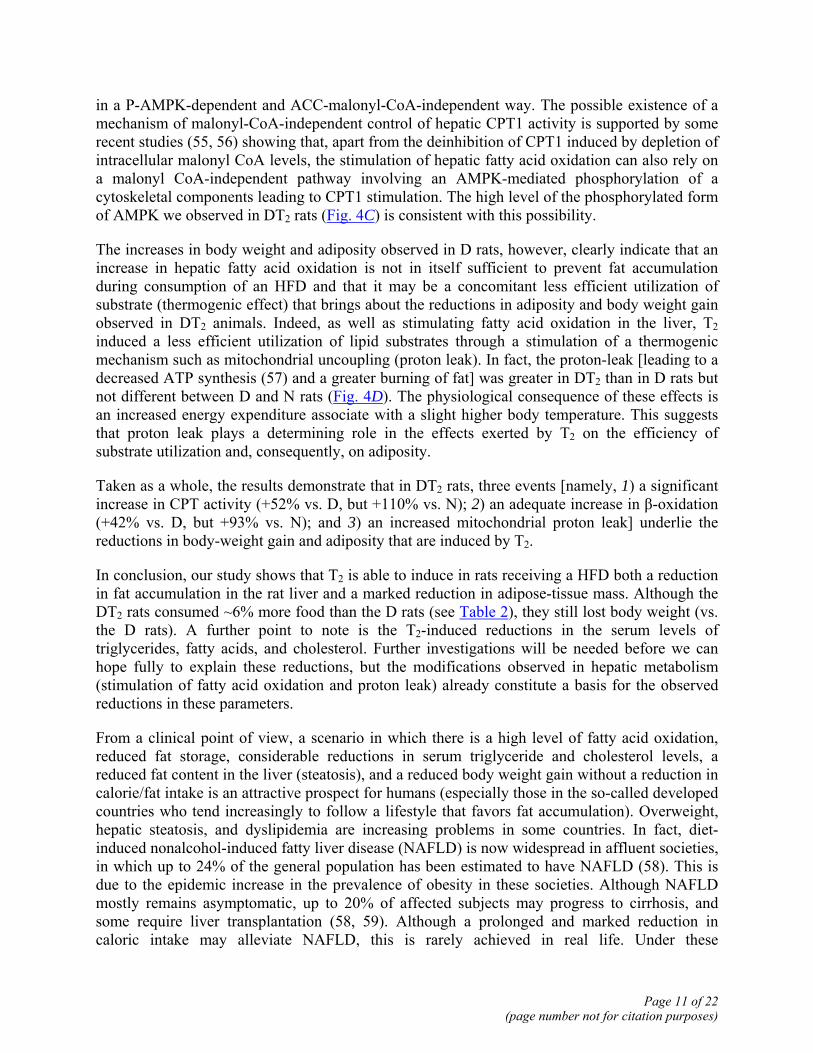
in a P-AMPK-dependent and ACC-malonyl-CoA-independent way. The possible existence of a mechanism of malonyl-CoA-independent control of hepatic CPT1 activity is supported by some recent studies (55, 56) showing that, apart from the deinhibition of CPT1 induced by depletion of intracellular malonyl CoA levels, the stimulation of hepatic fatty acid oxidation can also rely on a malonyl CoA-independent pathway involving an AMPK-mediated phosphorylation of a cytoskeletal components leading to CPT1 stimulation. The high level of the phosphorylated form of AMPK we observed in DT2 rats (Fig. 4C) is consistent with this possibility.
The increases in body weight and adiposity observed in D rats, however, clearly indicate that an increase in hepatic fatty acid oxidation is not in itself sufficient to prevent fat accumulation during consumption of an HFD and that it may be a concomitant less efficient utilization of substrate (thermogenic effect) that brings about the reductions in adiposity and body weight gain observed in DT2 animals. Indeed, as well as stimulating fatty acid oxidation in the liver, T2 induced a less efficient utilization of lipid substrates through a stimulation of a thermogenic mechanism such as mitochondrial uncoupling (proton leak). In fact, the proton-leak [leading to a decreased ATP synthesis (57) and a greater burning of fat] was greater in DT2 than in D rats but not different between D and N rats (Fig. 4D). The physiological consequence of these effects is an increased energy expenditure associate with a slight higher body temperature. This suggests that proton leak plays a determining role in the effects exerted by T2 on the efficiency of substrate utilization and, consequently, on adiposity.
Taken as a whole, the results demonstrate that in DT2 rats, three events [namely, 1) a significant increase in CPT activity (+52% vs. D, but +110% vs. N); 2) an adequate increase in β-oxidation (+42% vs. D, but +93% vs. N); and 3) an increased mitochondrial proton leak] underlie the reductions in body-weight gain and adiposity that are induced by T2.
In conclusion, our study shows that T2 is able to induce in rats receiving a HFD both a reduction in fat accumulation in the rat liver and a marked reduction in adipose-tissue mass. Although the DT2 rats consumed ~6% more food than the D rats (see Table 2), they still lost body weight (vs. the D rats). A further point to note is the T2-induced reductions in the serum levels of triglycerides, fatty acids, and cholesterol. Further investigations will be needed before we can hope fully to explain these reductions, but the modifications observed in hepatic metabolism (stimulation of fatty acid oxidation and proton leak) already constitute a basis for the observed reductions in these parameters.
From a clinical point of view, a scenario in which there is a high level of fatty acid oxidation, reduced fat storage, considerable reductions in serum triglyceride and cholesterol levels, a reduced fat content in the liver (steatosis), and a reduced body weight gain without a reduction in calorie/fat intake is an attractive prospect for humans (especially those in the so-called developed countries who tend increasingly to follow a lifestyle that favors fat accumulation). Overweight, hepatic steatosis, and dyslipidemia are increasing problems in some countries. In fact, diet-induced nonalcohol-induced fatty liver disease (NAFLD) is now widespread in affluent societies, in which up to 24% of the general population has been estimated to have NAFLD (58). This is due to the epidemic increase in the prevalence of obesity in these societies. Although NAFLD mostly remains asymptomatic, up to 20% of affected subjects may progress to cirrhosis, and some require liver transplantation (58, 59). Although a prolonged and marked reduction in caloric intake may alleviate NAFLD, this is rarely achieved in real life. Under these
Page 11 of 22(page number not for citation purposes)
circumstances, an effective pharmacological therapy would be useful. If the results reported here hold true for humans, then pharmacological administration of T2 might help to counteract the above problems without inducing a thyrotoxic state.
However, we wish to clearly state that here it is not excluded that T2 could have deleterious effects on a longer time scale and it is not shown whether T2 acts in the same way in humans.
ACKNOWLEDGMENTS
This work was supported by grant MIUR-COFIN 2004 PROT. 2004053441-001
REFERENCES
1. Lazar, M. A., and Chin, W. W. (1990) Nuclear thyroid hormone receptors. J. Clin. Invest. 86, 1777–1782
2. Zhang, J., and Lazar, M. A. (2000) The mechanism of action of thyroid hormones. Annu. Rev. Physiol. 62, 439–466
3. Lazar, M. (2003) Thyroid hormone action: a binding contract. J. Clin. Invest. 112, 497–499
4. Shibusawa, N., Hashimoto, K., Nikrodhanond, A. A., Liberman, M. C., Applebury, M. L., Liao, X. H., Robbins, J. T., Refetoff, S., Cohen, R. N., and Wondisford, F. E. (2003) Thyroid hormone action in the absence of thyroid hormone receptor DNA-binding in vivo. J. Clin. Invest. 112, 588–597
5. Hulbert, A. J. (2000) Thyroid hormones and their effects: a new perspective. Biol. Rev. 75, 519–631
6. Lanni, A., Moreno, M., Lombardi, A., de Lange, P., and Goglia, F. (2001) Control of energy metabolism by iodothyronines. J. Endocrinol. Invest. 24, 897–913
7. Davis, P. J., Tillmann, H. C., Davis, F. B., and Wehling, M. (2002) Comparison of the mechanisms of nongenomic actions of thyroid hormone and steroid hormones. J. Endocrinol. Invest. 25, 377–388
8. Braverman, L. E., and Utiger, R. D. (2000) Introduction to thyrotoxicosis. In The Thyroid. Werner and Ingbar, eds) p. 515-517, Lippincott, Philadelphia, PA
9. Goglia, F. (2005) Biological effects of 3,5-diiodothyronine (T2). Biochemistry (Mosc). 70, 164-172.
10. Horst, C., Rokos, H., and Seitz, H. J. (1989) Rapid stimulation of hepatic oxygen consumption by 3,5-di-iodo-L-thyronine. Biochem. J. 261, 945–950
11. O’Reilly, I., and Murphy, M. P. (1992) Studies on the rapid stimulation of mitochondrial respiration by thyroid hormones. Acta Endocrinol. (Copenh.) 127, 542–546
Page 12 of 22(page number not for citation purposes)
12. Goglia, F., Lanni, A., Barth, J., and Kadenbach, B. (1994) Interaction of diiodothyronines with isolated cytochrome c oxidase. FEBS Lett. 346, 295–298
13. Moreno, M., Lanni, A., Lombardi, A., and Goglia, F. (1997) How the thyroid controls metabolism in the rat: different roles for triiodothyronine and diiodothyronines. J. Physiol. 505, 529–538
14. Arnold, S., Goglia, F., and Kadenbach, B. (1998) 3,5-Diiodothyronine binds to subunit Va of cytochrome-c oxidase and abolishes the allosteric inhibition of respiration by ATP. Eur. J. Biochem. 252, 325–330
15. Lombardi, A., Lanni, A., Moreno, M., Brand, M. D., and Goglia, F. (1998) Effect of 3,5-di-iodo-L-thyronine on the mitochondrial energy-transduction apparatus. Biochem. J. 330, 521–526
16. Kadenbach, B. (2000) Mitochondrial energy metabolism is regulated via nuclear-coded subunits of cytochrome c oxidase. Free Radic. Biol. Med. 29, 211–221
17. Ball, S. G., Sokolov, J., and Chin, W. (1997) 3,5-Diiodo-L-thyronine (T2) has selective thyromimetic effect in vivo and in vitro. J. Mol. Endocrinol. 19, 137–147
18. Zammit, V. A. (1999) The malonyl-CoA-long-chain acyl-CoA axis in the maintenance of mammalian cell function. Biochem. J. 343, 505–515
19. Saddik, M., Gamble, J., Witters, L. A., and Lopaschuk, G. D. (1993) Acetyl-CoA carboxylase regulation of fatty acid oxidation in the heart. J. Biol. Chem. 268, 25836–25845
20. McGarry, J. D., Mills, S. E., Long, C. S., and Foster, D. W. (1983) Observations on the affinity for carnitine, and malonyl-CoA sensitivity, of carnitine palmitoyltransferase I in animal and human tissues. Demonstration of the presence of malonyl-CoA in non-hepatic tissues of the rat. Biochem. J. 214, 21–28
21. Abu-Elheiga, L., Brinkley, W. R., Zhong, L., Chirala, S. S., Woldegiorgis, G., and Wakil, S. J. (2000) The subcellular localization of acetyl-CoA carboxylase 2. Proc. Natl. Acad. Sci. USA 97, 1444–1449
22. Kim, K. H., Lopez, C. F., Bai, D. H., Luo, X., and Pape, M. E. (1989) Role of reversible phosphorylation of acetyl-CoA carboxylase in long-chain fatty acid synthesis. FASEB J. 3, 2250–2256
23. Young, M. E., Radda, G. K., and Leighton, B. (1996) Activation of glycogen phosphorylase and glycogenolysis in rat skeletal muscle by AICAR-an activator of AMP-activated protein kinase. FEBS Lett. 382, 43–47
24. Oh, S. S., and Kaplan, M. L. (1994) Early treatment of obese (ob/ob) mice with triiodothyronine increases oxygen consumption and temperature and decreases body fat content. Proc. Soc. Exp. Biol. Med. 207, 260–267
Page 13 of 22(page number not for citation purposes)
25. Horst, C., Harneit, A., Seitz, H. J., and Rokos, H. (1995) 3,5-Di-iodo-L-thyronine suppresses TSH in rats in vivo and in rat pituitary fragments in vitro. J. Endocrinol. 145, 291–297
26. Moreno, M., Lombardi, A., Beneduce, L., Silvestri, E., Pinna, G., Goglia, F., and Lanni, A. (2002) Are the effects of T3 on resting metabolic rate in euthyroid rats entirely caused by T3 itself? Endocrinology 143, 504–510
27. Lanni, A., Moreno, M., Lombardi, A., and Goglia, F. (1996) Calorigenic effect of diiodothyronines in the rat. J. Physiol. 494, 831–837
28. Lanni, A., Moreno, M., Cioffi, M., and Goglia, F. (1992) Effect of 3,3′-diiodothyronine and 3,5-diiodothyronine on rat liver oxidative capacity. Mol. Cell. Endocrinol. 86, 143–148
29. Lanni, A., Benedice, L., Lombardi, A., Moreno, M., Boss, O., Muezzin, P., Giacobino, J. P., and Goglia, F. (1999) Expression of uncoupling protein-3 and mitochondrial activity in the transition from hypothyroid to hyperthyroid state in rat skeletal muscle. FEBS Lett. 444, 250–254
30. Hartree, E. F. (1972) Determination of proteins: a modification of the Lowry method that gives a linear photometric response. Anal. Biochem. 48, 422–427
31. Kerner, J., Turkaly, P. J., Minkler, P. E., and Hoppel, C. L. (2001) Aging skeletal muscle mitochondria in the rat: decreased uncoupling protein-3 content. Am. J. Physiol. 281, E1054–E1062
32. Munday, M. R., Milic, M. R., Takhar, S., Holness, M. J., and Sudgen, M. C. (1991) The short-term regulation of hepatic acetyl-CoA carboxylase during starvation and re-feeding in the rat. Biochem. J. 280, 733–737
33. Tanabe, T., Nakanishi, S., Hashimoto, T., Ogiwara, H., Nikawa & J., Numa, S. (1981) Acetyl-CoA carboxylase from rat liver. Methods Enzymol. 71, C5-C16
34. Alexson, S. E. H., and Nedergaard, J. (1988) A novel type of short- and medium-chain acyl-CoA hydrolases in brown adipose tissue mitochondria. J. Biol. Chem. 263, 13564–13571
35. de Lange, P., Lanni, A., Beneduce, L., Moreno, M., Lombardi, A., Silvestri, E., and Goglia, F. (2001) Uncoupling protein-3 is a molecular determinant for the regulation of resting metabolic rate by thyroid hormone. Endocrinology 142, 3414–3420
36. Brown, G. C., and Brand, M. D. (1985) Thermodynamic control of electron flux through mitochondrial cytochrome bc1 complex. Biochem. J. 225, 399–405
37. de Lange, P., Ragni, M., Silvestri, E., Moreno, M., Schiavo, L., Lombardi, A., Farina, P., Feola, A., Goglia, F., and Lanni, A. (2004) Combined cDNA array/RT-PCR analysis of gene expression profile in rat gastrocnemius muscle: relation to its adaptive function in energy metabolism during fasting. FASEB J. 18, 350–352
Page 14 of 22(page number not for citation purposes)
38. Pearse, A. G. (1953) Histochemistry, Theoretical and Applied. Churchill Ltd., Edinburgh and London
39. Fail, P. A., Anderson, S. A., and Friedman, M. A. (1999) Response of the pituitary and thyroid to tropic hormones in Sprague-Dawley versus Fisher 344 male rats. Toxicol. Sci. 52, 107–121
40. Cimmino, M., Mion, F., Goglia, F., Minaire, Y., and Geloen, A. (1996) Demonstration of in vivo metabolic effects of 3,5-di-iodothyronine. J. Endocrinol. 149, 319–325
41. Rousset, S., Alves-Guerra, M. C., Mozo, J., Miroux, B., Cassard-Doulcier, A. M., Bouillaud, F., and Ricquier, D. (2004) The biology of mitochondrial uncoupling proteins. Diabetes 53, S130–S135
42. Krauss, S., Zhang, C.-Y., and Lowell, B. B. (2005) The mitochondrial uncoupling-protein homologues. Nat. Rev. Mol. Cell Biol. 6, 248–261
43. Kadenbach, B. (2003) Intrinsic and extrinsic uncoupling of oxidative phosphorylation. Biochim. Biophys. Acta 1604, 77–94
44. Castellan, L. W., Wilcox, H. C., and Heimberg, M. (1991) Relationships between fatty acid synthesis and lipid secretion in the isolated perfused rat liver: effects of hyperthyroidism, glucose and oleate. Biochim. Biophys. Acta 1086, 197–208
45. Lanni, A., Moreno, M., Lombardi, A., and Goglia, F. (2003) Thyroid hormone and uncoupling proteins. FEBS Lett. 543, 5–10
46. Freake, H. C., and Oppenheimer, J. H. (1995) Thermogenesis and thyroid function. Annu. Rev. Nutr. 15, 263–291
47. Brown, S. B., Maloney, M., and Kinlaw, W. B. (1997) “Spot 14” protein functions at the pretranslational level in the regulation of hepatic metabolism by thyroid hormone and glucose. J. Biol. Chem. 272, 2163–2166
48. Goglia, F., Moreno, M., and Lanni, A. (1999) Action of thyroid hormones at the cellular level: the mitochondrial target. FEBS Lett. 452, 115–120
49. Soboll, S. (1993) Thyroid hormone action on mitochondrial energy transfer. Biochim. Biophys. Acta 1144, 1–16
50. Pinna, G., Meinhold, H., Hiedra, L., Thoma, R., Hoell, T., Graf, K. J., Stoltenburg-Didinger, G., Eravci, M., Prengel, H., Brodel, O., et al. (1997) Elevated 3,5-diiodothyronine concentrations in the sera of patients with nonthyroidal illnesses and brain tumors. J. Clin. Endocrinol. Metab. 82, 1535–1542
51. Hollenberg, A. N., Monden, T., Flynn, T. R., Boers, M. E., Cohen, O., and Wondisford, F. E. (1995) The human thyrotropin-releasing hormone gene is regulated by thyroid hormone
Page 15 of 22(page number not for citation purposes)
through two distinct classes of negative thyroid hormone response elements. Mol. Endocrinol. 9, 540–550
52. Jansen, M. S., Cook, G. A., Song, S., and Park, E. A. (2000) Thyroid hormone regulates carnitine palmitoyltransferase I alpha gene expression through elements in the promoter and first intron. J. Biol. Chem. 275, 34989–34997
53. Acin, A., Rodriguez, M., Rique, H., Canet, E., Boutin, J. A., and Galizzi, J. P. (1999) Cloning and characterization of the 5′ flanking region of the human uncoupling protein 3 (UCP3) gene. Biochem. Biophys. Res. Commun. 258, 278–283
54. Ramsey, J. J., Harper, M. E., and Weindruch, R. (2000) Restriction of energy intake, energy expenditure, and aging. Free Radic. Biol. Med. 29, 946–968
55. Velasco, G., Geelen, M. J., and Guzman, M. (1997) Control of hepatic fatty acid oxidation by 5′-AMP-activated protein kinase involves a malonyl-CoA-dependent and a malonyl-CoA-independent mechanism. Arch. Biochem. Biophys. 337, 169–175
56. Velasco, G., Geelen, M. J., del Pulgar, T. G., and Guzman, M. (1998) Malonyl-CoA-independent acute control of hepatic carnitine palmitoyltransferase I activity. Role of Ca2+/calmodulin-dependent protein kinase II and cytoskeletal components. J. Biol. Chem. 273, 21497
57. Porter, R. K., and Brand, M. D. (1993) Body mass dependence of H+ leak in mitochondria and its relevance to metabolic rate. Nature 362, 628–630
58. Angulo, P. (2002) Nonalcoholic fatty liver disease. N. Engl. J. Med. 346, 1221–1231
59. Gilat, T., Leikin-Frenkel, A., Goldiner, I., Juhel, C., Lafont, H., Gobbi, D., and Konikoff, F. M. (2003) Prevention of diet-induced fatty liver in experimental animals by the oral administration of a fatty acid bile acid conjugate (FABAC). Hepatology 38, 436–442
Received March 9, 2005; accepted May 20, 2005.
Page 16 of 22(page number not for citation purposes)
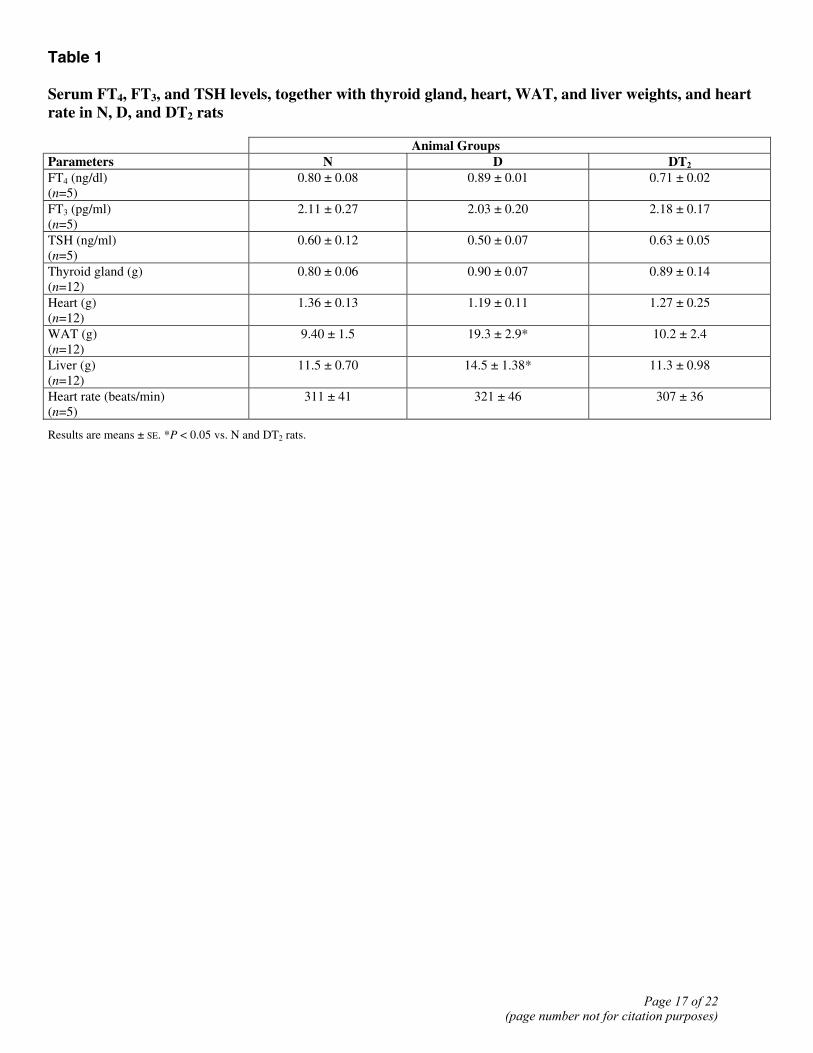
Table 1 Serum FT4, FT3, and TSH levels, together with thyroid gland, heart, WAT, and liver weights, and heart rate in N, D, and DT2 rats
Animal Groups Parameters N D DT2 FT4 (ng/dl) (n=5)
0.80 ± 0.08 0.89 ± 0.01 0.71 ± 0.02
FT3 (pg/ml) (n=5)
2.11 ± 0.27 2.03 ± 0.20 2.18 ± 0.17
TSH (ng/ml) (n=5)
0.60 ± 0.12 0.50 ± 0.07 0.63 ± 0.05
Thyroid gland (g) (n=12)
0.80 ± 0.06 0.90 ± 0.07 0.89 ± 0.14
Heart (g) (n=12)
1.36 ± 0.13 1.19 ± 0.11 1.27 ± 0.25
WAT (g) (n=12)
9.40 ± 1.5 19.3 ± 2.9* 10.2 ± 2.4
Liver (g) (n=12)
11.5 ± 0.70 14.5 ± 1.38* 11.3 ± 0.98
Heart rate (beats/min) (n=5)
311 ± 41 321 ± 46 307 ± 36
Results are means ± SE. *P < 0.05 vs. N and DT2 rats.
Page 17 of 22(page number not for citation purposes)

Table 2 Pellet intake, energy expenditure, respiratory quotient, and body temperature in N, D, and DT2 rats over a 1 month treatment period
Animal Groups
Parameters
N D DT2
Pellet intake (g) (n=12)
782 ± 70 821 ± 82 870 ± 79
Averaged daily energy expenditure (LtO2/Kg-0.67 min) (n=5)
241 ± 22 253 ± 24 326 ± 31
Respiratory quotient (n=5)
0.91 ± 0.01 0.79 ± 0.006* 0.75 ± 0.013*†
Body temperature (°C) (n=5)
37.5 ± 0.05 37.6 ± 0.1 38.3 ± 0.1*†
Results are means ± SE. *P < 0.05 vs. N rats ; †P < 0.05 vs. D rats.
Page 18 of 22(page number not for citation purposes)
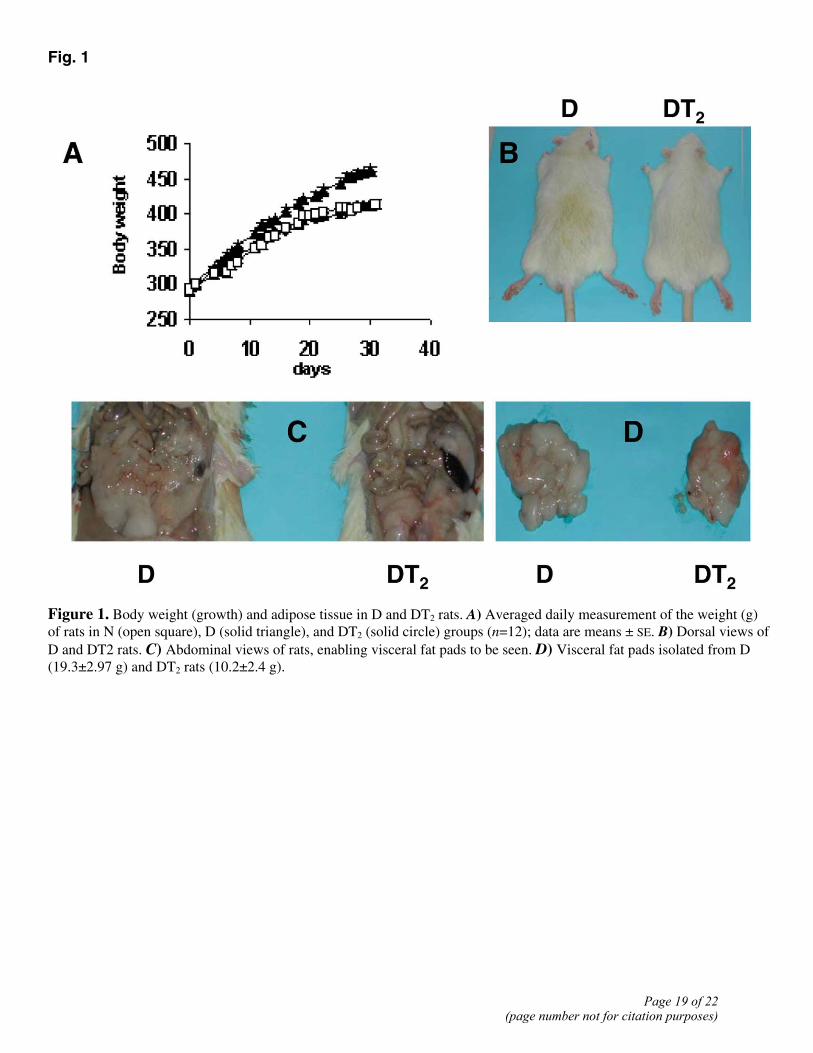
Fig. 1
Figure 1. Body weight (growth) and adipose tissue in D and DT2 rats. A) Averaged daily measurement of the weight (g) of rats in N (open square), D (solid triangle), and DT2 (solid circle) groups (n=12); data are means ± SE. B) Dorsal views of D and DT2 rats. C) Abdominal views of rats, enabling visceral fat pads to be seen. D) Visceral fat pads isolated from D (19.3±2.97 g) and DT2 rats (10.2±2.4 g).
Page 19 of 22(page number not for citation purposes)
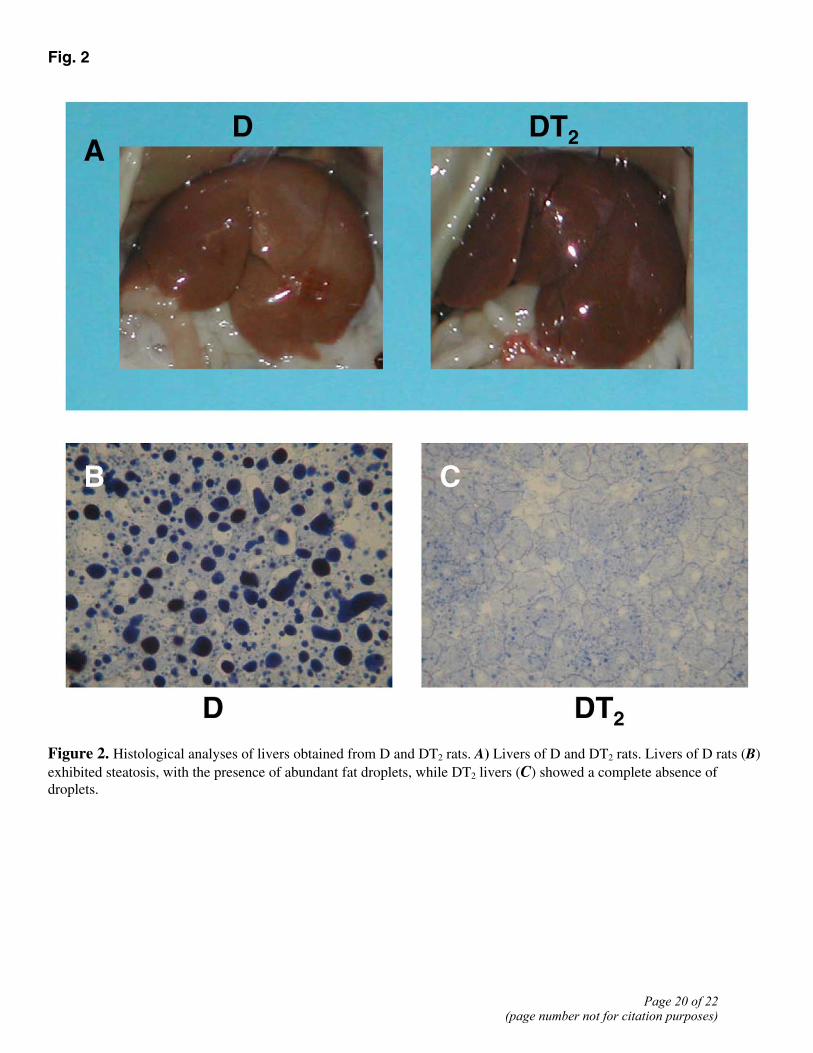
Fig. 2
Figure 2. Histological analyses of livers obtained from D and DT2 rats. A) Livers of D and DT2 rats. Livers of D rats (B) exhibited steatosis, with the presence of abundant fat droplets, while DT2 livers (C) showed a complete absence of droplets.
Page 20 of 22(page number not for citation purposes)
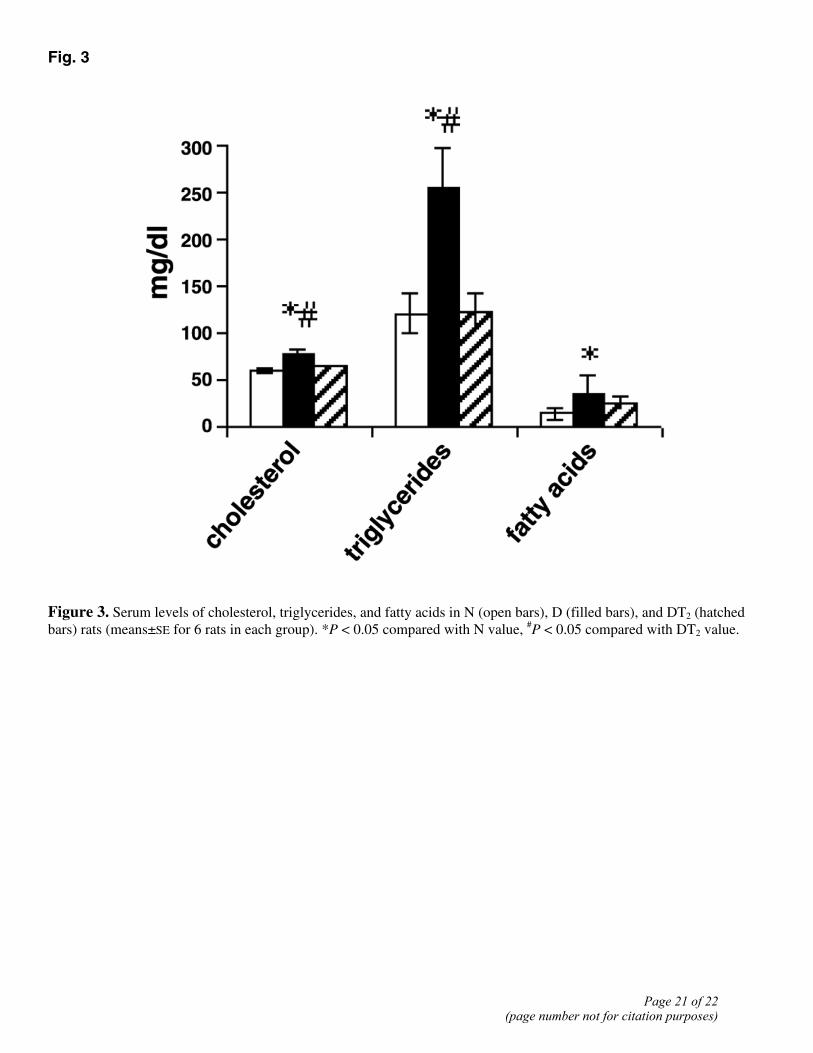
Fig. 3
Figure 3. Serum levels of cholesterol, triglycerides, and fatty acids in N (open bars), D (filled bars), and DT2 (hatched bars) rats (means±SE for 6 rats in each group). *P < 0.05 compared with N value, #P < 0.05 compared with DT2 value.
Page 21 of 22(page number not for citation purposes)
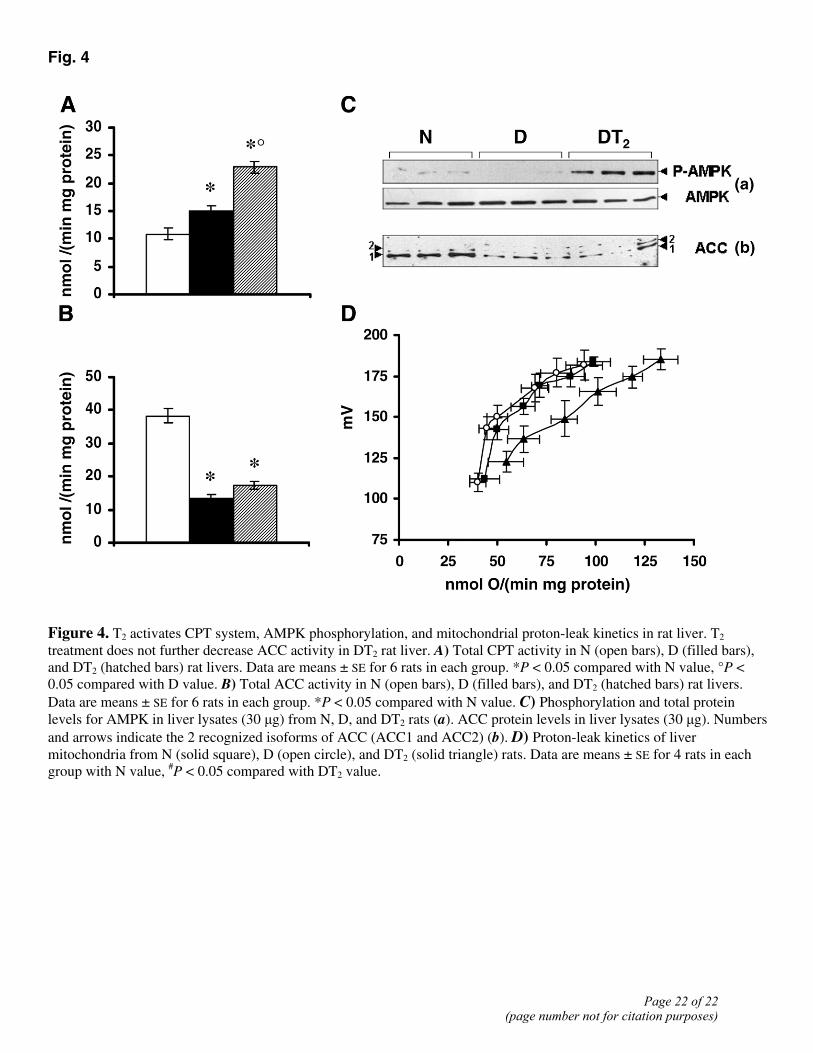
Fig. 4
Figure 4. T2 activates CPT system, AMPK phosphorylation, and mitochondrial proton-leak kinetics in rat liver. T2 treatment does not further decrease ACC activity in DT2 rat liver. A) Total CPT activity in N (open bars), D (filled bars), and DT2 (hatched bars) rat livers. Data are means ± SE for 6 rats in each group. *P < 0.05 compared with N value, °P < 0.05 compared with D value. B) Total ACC activity in N (open bars), D (filled bars), and DT2 (hatched bars) rat livers. Data are means ± SE for 6 rats in each group. *P < 0.05 compared with N value. C) Phosphorylation and total protein levels for AMPK in liver lysates (30 µg) from N, D, and DT2 rats (a). ACC protein levels in liver lysates (30 µg). Numbers and arrows indicate the 2 recognized isoforms of ACC (ACC1 and ACC2) (b). D) Proton-leak kinetics of liver mitochondria from N (solid square), D (open circle), and DT2 (solid triangle) rats. Data are means ± SE for 4 rats in each group with N value, #P < 0.05 compared with DT2 value.
Page 22 of 22(page number not for citation purposes)


![Vibrational spectra, NBO analysis, HOMO–LUMO and first hyperpolarizability of 2-{[(2-Methylprop-2-en-1-yl)oxy]methyl}-6-phenyl-2,3,4,5-tetrahydro-1,2,4-triazine-3,5-dione, a potential](https://static.fdokumen.com/doc/165x107/6324d4c6c9c7f5721c01c4b7/vibrational-spectra-nbo-analysis-homolumo-and-first-hyperpolarizability-of.jpg)