FATS, OILS AND VANASPATIS
122
STUDIES ON FATS, OILS AND VANASPATIS By N. D. Kehar and Associates Division of Animal Nutrition 1CAR. 8. 77 12.25 Indian :Veterinary Research Institute, lzatnagar IND.IAN COUNCIL OF AGRICULTURAL RESEARCH NEW DELHI P\JBLISHI'D BY THE MANAGER OF PUBLICATIONS, DELHI ED BY lliE GOVERNMENT OF INDIA PRESS, Cu.culTA. INDIA, . 1956. : n.s. 4 G o:- 7&h.
-
Upload
khangminh22 -
Category
Documents
-
view
1 -
download
0
Transcript of FATS, OILS AND VANASPATIS
STUDIES ON
FATS, OILS AND VANASPATIS
By N. D. Kehar and Associates
Division of Animal Nutrition
1CAR. 8. 77 12.25
Indian :Veterinary Research Institute, lzatnagar
IND.IAN COUNCIL OF AGRICULTURAL RESEARCH NEW DELHI
P\JBLISHI'D BY THE MANAGER OF PUBLICATIONS, DELHI
ED BY lliE GOVERNMENT OF INDIA PRESS, Cu.culTA. INDIA, . 1956.
Pr~ce : n.s. 4 G o:- 7&h.
STUDIES ON
FATS, OILS AND VANASPATIS
By N. D. Kehar and Associates
Division of Animal Nutrition
Indian Veterinary Research Institute, lzatnagar
INDIAN COUNCIL OF AGRICULTURAL RESEARCH NEW DELHI
PuBLISHED BY lltE MANAGEJI. OF Pl'BLICATIONS, DF~HI PJ.INrED BY lltE GOVERNMENT OF INDIA Pll£Slll. CALcutTA. INDIA
19S6.
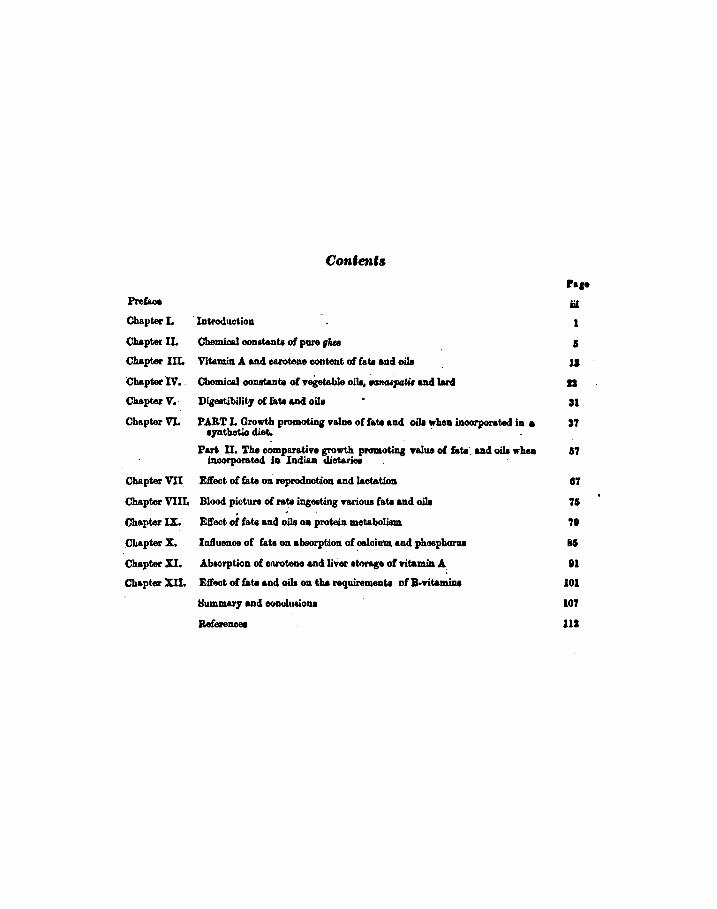
Contents
PrefaA!e
Chapter L · Introd11ction
Chapter IL Chemica! oon•t&Dtl of pure gllee
Chapter UI. Vitamin A and. cuotene content of fat. and oill
Chapter IV. . Chemica! ooDBtantAt of vegetable oile, "'""patiland lard
Chapter V. · Digestibility of fat. and oile
ChapterVL PART L Growth promoting value of fat. and. oill when inoorporated in a eynthetio diet. · .
Pap
iii
I
I
11
II
Jl
17
Part U. The oomparr.tive growth promoting value of fat.. and oillwhea 117 inoorporated in Indian dietarie1 . ·
Chapter VII. Elf'ect of fat. on reproduction and lactation
Chapter VIIL Blood picture of rat. ingesting various fa.tAt and oile
Chapter ~ Elf'ect of fat. and oill on protein metabolism
Chapter X. InJhaenoe of fat. on absmption of o&loium &nc1 phosph01'U8
Chapter XI. Absorption of onrotene and liver storage of vitamin A.
Chapter XII. E11'110t of fat. and oil• on the requireme~~ta of B·ritamine
l:lummary and oonulu&lona
RefetenOIII
17
71
71
81
Ill
101
107
111
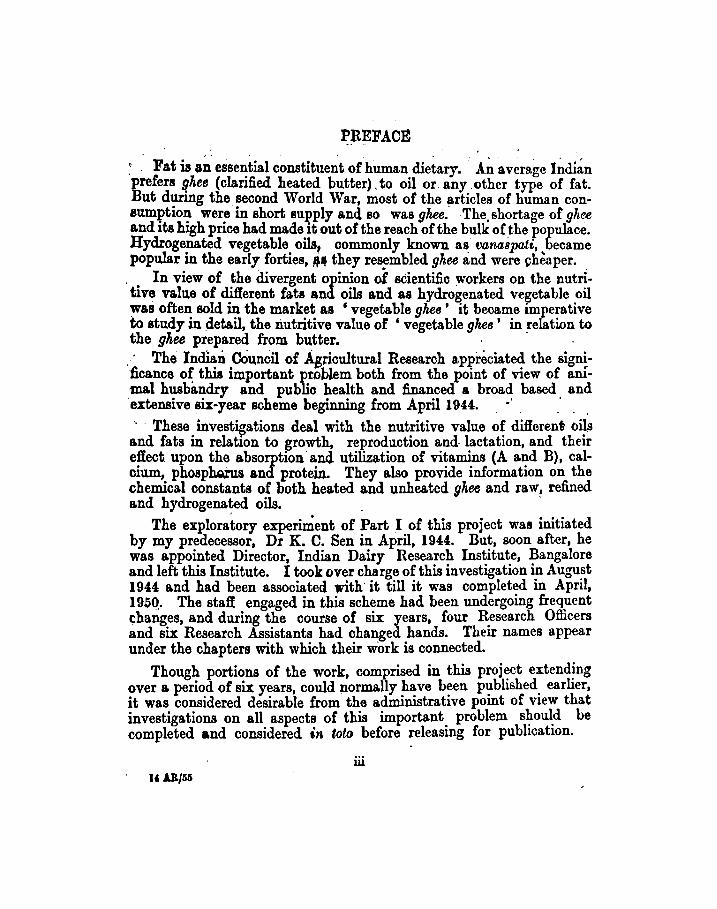
PREFACE
: . Fat is a~ ~ssential constitue~t of human dietary. A~ average l~di~n prefers ghee (clarified heated butter). to oil or any other type of fat. But during the_ second World War, most of the articles of human consumption were in short supply and so was ghee: The shortage or ghee and its high price had made it out of the reach of the bulk of the populace. Hydrogenated vegetable oils, commonly known as vanaspati, became popular in the early forties, 44 they resembled ghee and were ~heaper.
In view of the divergent opinion of scientific :workers on the nutritive value of different fats and oils and as hydrogenated vegetable oil ~as often sold in the market as • vegetable ghee ' it became imperative to study in _detail, the nutritive value of 'vegetable ghee' in relation to the ghee prepared from butter. · . · The Indian COuncil of .Agricultural Research appreciated the significance of this important problem both from the point of view of animal husbandry and public health and financed a broad based and ·extensive six-year scheme beginning from April194:4. ·' . .· . . · · These investigations deal with the nutritive value of different oils
and fats in relation to growth, reproduction and- lactation, and their effect. upon the absorption ancl. utilization of vitamins (A and B), calcium, phospb.Qrus and protem. They also provide information on the <lhemical constants of both heated and unheated ghee and raw, refined and hydrogena~ed oils. . ·
The exploratory exper~ent of Part I of this project was initiated by my predecessor, Dr K. C. Sen in April, 194:4. But, soon after, he was appointed Director, Indian Dairy Research Institute, Bangalore and left this Institute. I took over charge of this investigation in August 1944 and had been associated with it till it was completed in April, 195Q.. The staff engaged in this scheme had been undergoing frequent ~hanges, and during the course of six years, four Research Officers and six Research Assistants had changed hands. Their names appear under the chapters with which their work is connected.
Though portions of the work, comprised in this proj~ct extend~ng over a period of six years, could normally have been P';lblished. earlier, it was considered desirable from the administrative pomt of v1ew that investigations on all aspects of this important. problem s~ou~d be completed and considered in toto before releasmg for pubhcatlon.
iii 16 AB/55

iv
l take this opporttuuby of expressing my gratitude and also of my associates, to the Indian Council of Agricultural Research for financing this investigation. I am especially indebted to Sir Datar Singh, Vice President, Indian Council of Agricultural Research and Shri P. N~ Nanda, Animal Husbandry Oommissioner with the Government· of India· for their keen interest i11 the development of this project.. . . · · - .. ·
. . . " .
. To DrS. Datta and Dr F. C. Minett, the present and former Directors, Indian Veterinary Research Institute, ~zatnagar, I tender most sincere thanks for the sustained interest evinced by them in this work ·and for the kind. support and encouragement. ext~nded· during the period of .:this · investigation. · .. · · . · · . . · ·: ·: · · I am also grateful to the Hindustan Vanaspati Manufactu.riri.g. Coni.'pany Ltd., Bombay and the Modi Vanaspati Manufacturing Company
'Ltd., Modinagar for supplying part 9f o:ur requirements of hydrogenated fats, free of cost, · ._ .. , -.;
.. .' In the end, I expres::; my grateful thanks to the. Statistical'Adviser, .Indian Council of Agricultural· Research, fo~ analys~ and interpreting these results and also to Mr. M. R. Maha]an, Assistant Animal Hus" bandry Commissioner, .for his continued interest in the execution of this investigation and .for -constructive and helpful criticiSm in the pre· .sentation of these results. · ·
Indian Veterinary Research Institute,
Izatnagar, 1950 ·
. -N;D.KEHAR,
Head of the Divisio~ of Animal . .
Nutrition
CHAPTER I
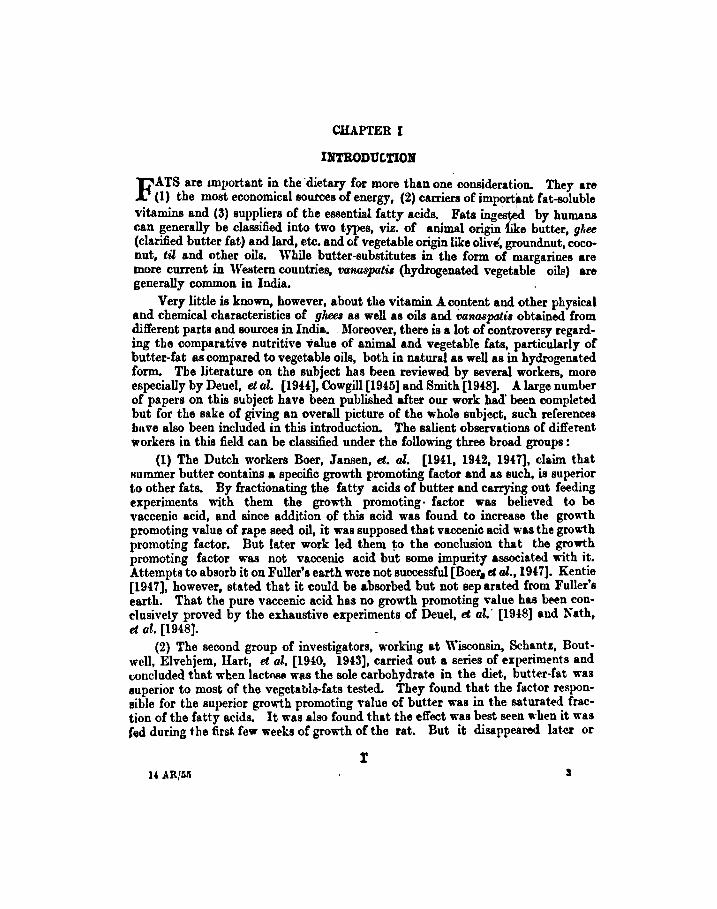
INTROD'UtTION
FATS are 1D1portant in the "dietary for more than one consideration. They are (1) the most economical sources of energy, (2) carriers of important fat-soluble
vitamins and (3) suppliers of the essential fatty acids. Fats inge~ by humans can ~enerally be classified into two types, viz. of animal origin fike butter, gl1ee (clarified butter fat) and lard, etc. and of vegetable origin like olive, groundnut, coconut, til and other oils. While butter-substitutes in the form of margarines are more current in Western countries, vanaspati1 (hydrogenated vegetable oils) are generally common in India.
Very little is known, however, about the vitamin A content and other physical and chemical characteristics of gkeel as well as oils and VaMBpali• obtained from different parts and sources in India. •. Moreover, there is a lot of controversy regarding the comparative nutritive value of animal and vegetable fats, particularly of butter-fat as compared to vegetable oils, both in natural as well as in hydrogenated form. The literature on the subject has been reviewed by several workers, more especially by Deuel, et al. (1944], Cowgill [1945] and Smith [1948). A large number of papers on this subject have been published after our work hacl' been completed but for the sake of giving an overall picture of the whole subject, suc'h references bve also been included in this introduction. The salient observations of different workers in this field can be classified under the following three broad groups :
(1) The Dutch workers Boer, Jansen, et. al. [1941, 1942, 1947], claim that Hummer butter contains a specific growth promoting factor and as such, is superior to other fats. By fractionating the fatty acids of butter and carrying out feeding experiments with them the growth promoting· factor was believed to be vaccenic acid, and since addition of this acid was found to increase the growth promoting value of rape seed oil, it was supposed that vaccenic acid was the grov.1:h promoting factor. But later work led them ~o the conclusion that the growth promoting factor was not vaccenic acid but some impurity associated with it. Attempts to absorb it on Fuller's earth were not successful [Boera et al., 19!7]. Kentie (1947], however, stated that it could be absorbed but not separated from Fuller's earth. That the pure vaccenic acid has no growth promoting value has been conclusively proved by the exhaustive experiments of Deuel, et al." [1948] and Nath, et al. [1948].
(2) The second group of investigators, working at Wisconsin, Schantz, Boutwell, Elvehjem, Hart, et al. (1940, 1943], carried out a series of experiments and "oncluded that when lact"flt'l was the sole carbohydrate in the diet, butter-fat was superior to most of the vegetable-fats tested. They found that the fact<~r responsible for the superior growth promoting value of butter was in the saturatM fraction of the fatty acids. It was also found that the effect was best seen 11·hen it was fed during the first few weeks of growth of the rat. But it disappeared later or
r U AR/51'1
2
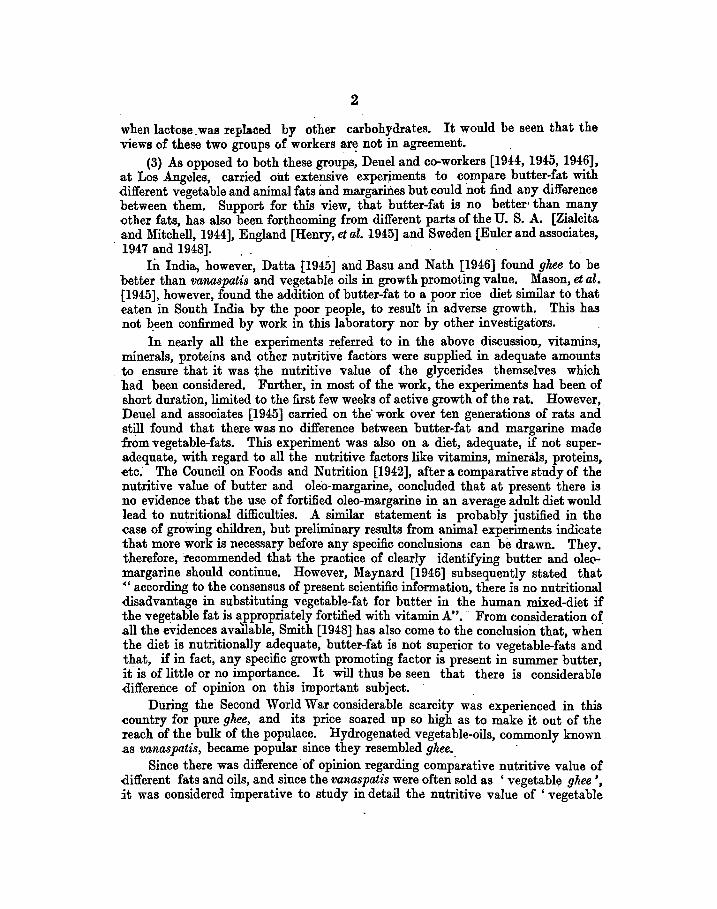
when lactose.was replaced by other carbohydrates. It would be seen that the views of these two groups of workers ar~ not in agreement.
(3) As opposed to both these groups, Deuel and co-workers [1944:, 1945, 1946], at Los Angeles, carried out extensive experjments to compare butter-fat with different vegetable and animal fats imd margarme.s but could not find any difference between them. Support for this view, that butter-fat is no better• than many other fats, has also been forthcoming from different parts of the U. S. A. [Zialcita and Mitchell, 1944:], England [Henry, et al. 1945] and Sweden [Euler and associates, 1947 and 1948]. .
In India, however, Datta [1945] and Basu and Nath [1946] found ghee to be better than vanaspatis and vegetable oils in growth promoting value. Mason, et al. (1945], however, found the addition of butter-fat to a poor rice diet similar to that eaten in South India by the poor people, to result in adverse growth. This has not been confirmed by work in this laboratory nor by other investigators.
In nearly all the experiments referred to in the above discussion, vitamins, minerals, proteins and other nutritive factors were supplied in adequate amounts to ensure that it was the nutritive value of the glycerides themselves which had been considered. Further, in most of the work, the experiments had been of short duration, limited to the first few weeks of active growth of the rat. However, Deuel and associates [1945] carried on the' work over ten generations of rats and still found that there was no difference between butter-fat and margarine made from vegetable-fats. This experiment was also on a diet, adequate, if not superadequate, with regard to all the nutritive factors like vitamins, minerals, proteins, etc. The Council on Foods and Nutrition [1942], after a comparative study of the nutritive value of butter and oleo-margarine, concluded that at present there is no evidence that the use of fortified oleo-margarine in an average adult diet would lead to nutritional difficulties. A similar statement is probably justified in the ease of growing children, but preliminary results from animal experiments indicate that more work is necessary before any specific conclusions can be drawn. They. therefore, recommended that the practice of clearly identifying butter and ole(.lmargarine should continue. However, Maynard [1946] subsequently stated that ~· according to the consensus of present scientific information, there is no nutritional disadvantage in substituting vegetabl~-fat for butter in the human mixed-diet if the vegetable fat it~ appropriately fortified with vitamin A" ... · From consideration of .all the evidences available, Smith [1948] has also come to the conclusion that, whenthe diet is nutritionally adequate, butter-fat is not superior to vegetable-fats and t~at, _if in fact, any specific growth promoting factor is present in summer butter, it is of little or no importance. It will thus be seen that there is considerable difference of opinion on this important subject.
Dil.ring the Second World War considerable scarcity was experienced in this eountry for pure ghee, and its price soared up so high as to make it out of the Teach of the bulk of the populace. Hydrogenated vegetable-oils, commonly known .as vanaspatis, became popular since they resembled ghee. ·
Since there was difference· of opinion regarding comp~rative nutritive value of different fats and oils, and since the vanaspatis were often sold as ' vegetable ghee ', it was considered imperative to study in detail thd nutritive value of ' vegetable

3
ghee in relation to what we are aceustomed to understand by g'kee prepared from clarified heated butter •
.Appreciating the immense importance of thiA problem. the Indian Council of .Agricultural Research sponsored a scheme for carrying out detailed investigations into the nutritive value of fats and oils. The first comprehensive work on this line, which extended over six years, was started in India at this Institute in .April 1944, when an investigation was undertaken to study in detail the following aspects of this important problem :
1. The chemical constants of pure ghee and raw, refined and hydrogenated oils. This study was also extended to ghee and oils when heated.
2. The vitamin .A and carotene content of fats and oils. 3. The comparative nutritive value of ghee and crude, refined and hydrogenated
oils when incorporated in synthetic or provincial dietaries with special reference to digestibility, growth, reproduction, lactation and general health. • ·
'· Effect of long period feeding of different fats on the morphological consti-tuents of blood.
5. Effect of different fats on calcium. phosphorus and protein metabolism. 6. Effect of different fats on the requirement of vitamins .A and B complex. The experim~ntal results are given in the subsequent chapters.

CHAPTER II
CHEMICAL CONSTANTS OF PURE GHEE
By N. D. KEJUB, S. N. RA.Y, B~ C. Josm, and B. C. R.us.a.Rua
GHEE forms one of the most important animal-fats in the Indian dietary • .1\Ianufacture "of gkee is, therefore, one of the most important industries in this
country, as about 43·3 per cent of the total milk produced in India is utilised. for preparation of gkee [Datar Singh, 1949]. In spite of this, demand for this commodity far exceeds the production. As a result, large seale adulteration of gkee takes place. The importance of fixing physical and chemical standards for distinguishing genuine and adulterated gkee has, therefore, become imperative. The standards adopted by the Indian food analysts are, however, based mainly on the European or American figures, as sufficient work on the variability of these constants under Indian conditions is not forthcoming. In fact the only work that is available to us is by Doctor et al., [1940] who studied the effect of different feeds and breeds on the physical and chemical constants of gkee. ·The data collected by them represented only one farm and are thus of limited value. The present study was undertaken toexamine the effect of breed, season and locality on some of the chemical
1 constants for gkee. It was felt that the data thus amassed could be utilised. in ~tting up standards for grading of glzu in India.
Through the courtesy of the Imperial Dairy Expert, arrangements were made to collect gkee from 12 cattle farms distributed all over India and representing eight different breeds of cattle and one breed of buffalo. Three batches of samples, one in September 19H and two others in January and June 194.5 were examined. Only one sample from each farm in any season was received and analysed.
The ghee in all the farms was prepared according to one standard mt:.thod. 'fhis was done to obviate the possibility of difference in the quality of gkee which is likely to occur when produced under divergent methods. Butter-fat produced by churning fresh cream was nielted and the gkee was separated by decantation. Immediately after preparation, the samples were sealed in airtight containers and sent to Izatnagar. These were stored in the laboratory in & refrigerator and were analysed at the earliest opportunity. Standard methods of analysis approved by the Association of Official Agricultural Chemists [1940] were followed. The following constants were examined : (a) Reichert-Meissl number, (b) Polenske number, (c) Kirschner number, (d) saponification value, (e) iodine value. For iodine value, Rosenmund-Kuhnhenn's pyridine sulphate dibromide method as modified by Yasuda [1931] was used. The results are given in Table I. The over-all averages given in this Table are, however, mostly influenced by the values for cow gh« as the number of samples of cow glzu examined were greatly in excess of those of buffalo u"~"·
5 1' AR/55
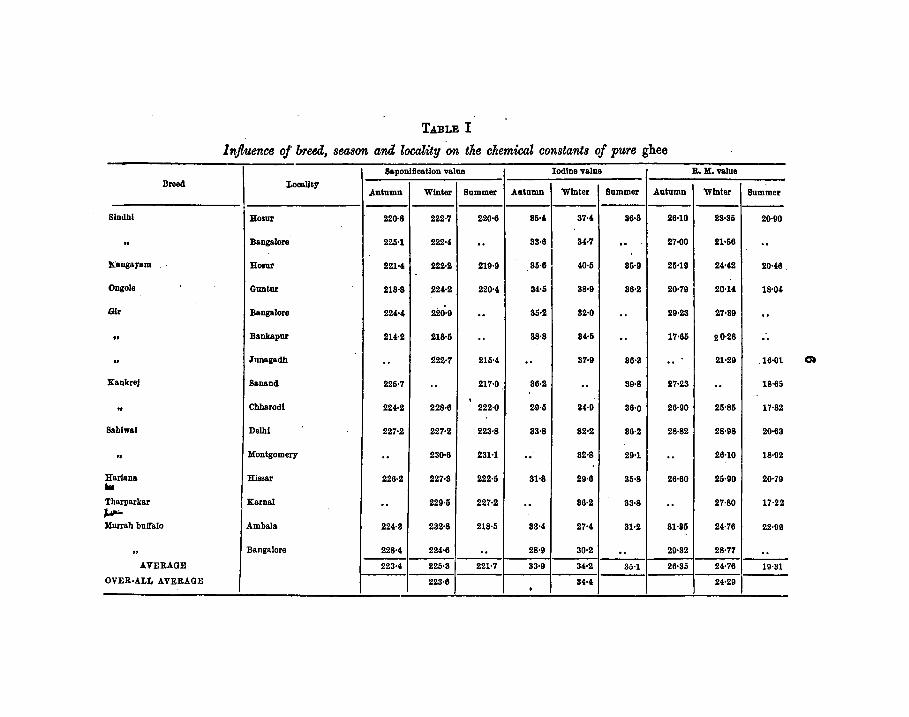
TABLE I
I n.fluence of breed, season and locality .on t'he chemical constants of pure ghee SaponlOcatlon value Iodine value R. M.value
Breed Locallty Winter I Autumn Summer Autumn Winter Summer Autumn Winter Bummer
Slndbl Hosur 220·8 222·7 220·6 35·4. 37-4. 86·8 26-10 28·35 20·90
.. Bangalore 225-1 222-4. .. 83·6 34-7 . . 27·00 21•56 .. Kangayam Hoaur 22H 222·2 219·9 85·61 4.0·5 85·9 25·19 2H2 20·{6
Ongole Guntnr 218·8 224·2 220·4. 34.-5 88·9 36·2 20·79 20·14 18·04
G!r Bangalore 224·4 220·9 .. 35·2 32·0 .. 29·23 27-89 .. .. Bankapur 214.·2 218·5 .. 38·8 34-5 .. 17·65 20·28 .. .. J'unagadh .. 222·7 215·4. .. 37·9 36·3 .. 21·29 .16·01
.Xankrej Sanand 225·7 .. 217·0 86·2 .. 39·8 27·23 .. 18·65
• .. Chharodl 224·2 228·6 222·0 29·5 84·9 36·0 26·90 25·85 17·82
Bahlwal Deihl 227·2 227·2 223·8 83·8 32·2 36·2 28·82 28·98 20·63
.. Montgomery .. 230·6 23H .. 82·8 29-1 .. 26-10 18·02
Harlana Hissar 226·2 227·3 222·5 31·8 29·6 85·8 26·60 25·90 20·79 a. Tharparkar Karnal .. 229·5 227·2 .. 86·2 83·8 .. 27·80 17-22 ..._ Murrah bnf!'alo Ambala 224·3 232·8 218·5 33·4. 27-4. 81-2 81-85 24-76 22·09
.. Bangalore 228-4 224-6 .. 28·9 30·2 .. 29·82 28·77 .. AVERAGE 223·4 225·3 221·7 83·9 84·2 35-1 26·35 24-76 19·31
OVER·ALL AVERAGE 223·6 84·4 24·29 .
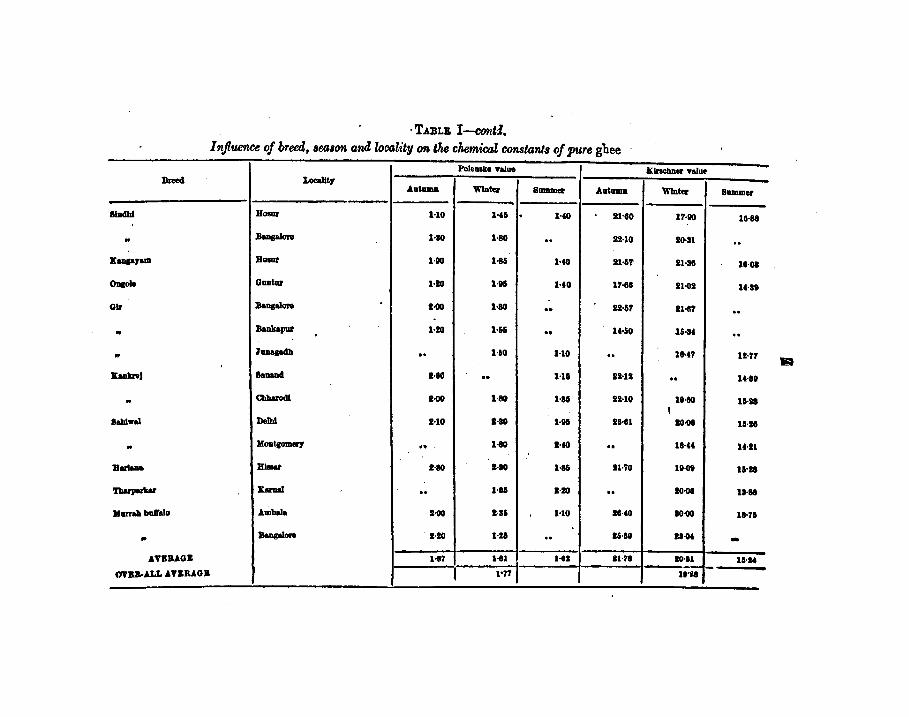
. TA:BLI. 1--()0tltJ. I njluen.ce of breed, season and locality on &he chemical consta'l'll.s of :pure ghee
PoleDIIka wue Klnchner wu• Breed Locality
A.umma Wlntc 8IIJIUDC A.utuma Wlntc Summer
SIDcJhl HOSUI' HO Hli . HO 21110 17-110 16·88
.. llaDga1ore l-80 1-80 .. 22-10 20·Sl .. Kaopram BCIIUI" 1-110 l-85 NO 21·5'1' 21-SG 18·01
Oulole Ountur 1·20 1-115 HO 1'1'·88 21-111 1H8
Olr Ballgalonl 1.00 1·80 .. 12-&7 11·117 .. .. Bankapur 1·20 1-&li .. 1WO l&·U . . • lunapdh .. HO HO . . 1H7 11-77
EaakreJ 81011ADC1 2·80 .. Hli 12-11 .. U·811
.. CbbarocU I-GO 1-80 1-85 21-10 111·80 11·18 I
lablwal DeDd 1-10 1·80 Hili 21·81 20-o& 15·18
• :Mootcomerr .. 1-80 1·40 .. 18·U lHl
B.r!AM BIIMr 1·80 1·80 1·85 IHO 111·011 15•28
'lbu"pubr Kamal .. l-lli 1·10 .. 20-01 11·88
:Murrah bull"alo Am bela I-GO I-ll HO 18·40 ao-oo 11-71
.. BomgaloN uo 1-15 .. 15·88 IS-ot -ATE&AOB 1·87 1-111 1•81 11-78 10·11 li·M
I 1·771 _...;.;;.... -OYBB.ALL A\'B&AOB 111"18
8
DISCUSSIONS
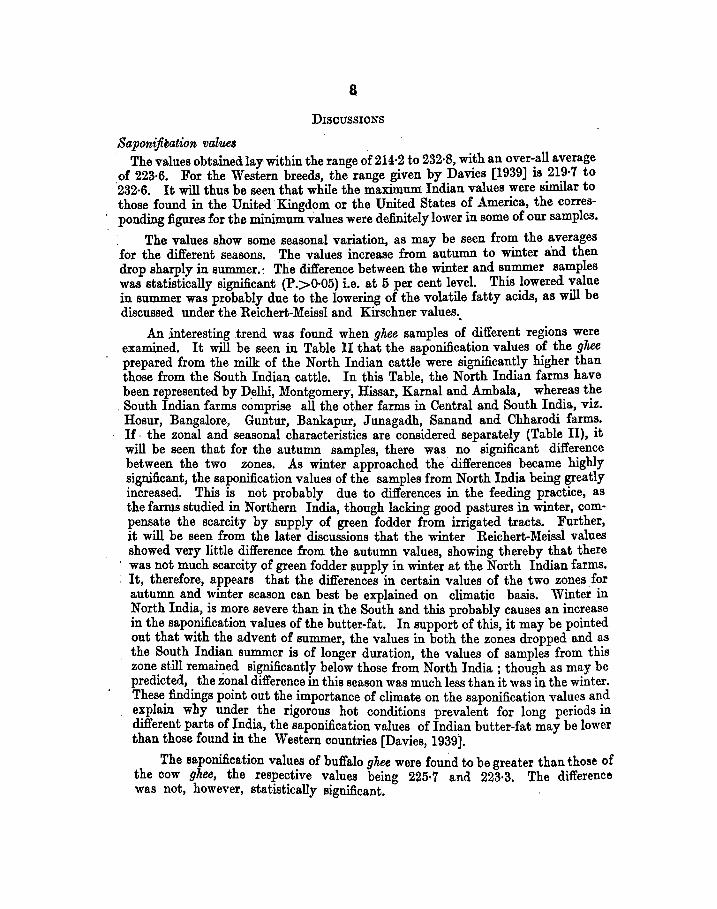
Saponifirotion values The values obtained lay within the range of 214·2 to 232·8, with an over-all average
of 223·6. For the Western breeds, the range given by Davies [1939] is _21?·7 to 232·6. It will thus be seen that while the maximum Indian values were similar to those found in the United Kingdom or the United States of America, the corresponding figures for the minimum values were definitely lower in some of our samples.
The values show some seasonal variation, as may be seen from the averages for the different seasons. The values increase from autumn to winter and then drop sharply in summer.: The difference between the winter and summer samples was statistically significant (P.>0·05) i.e. at 5 per cent level. This lowered yalue in summer was probably due to the lowering of the volatile fatty acids, as will be discussed under the Reichert-Meiss! and Kirschner values ..
An interesting trend was found when ghee samples of different regions were examined. It will be seen in Table II that the saponification values of the ghee prepared from the milk of the North Indian cattle were significantly higher than those from the South Indian cattle. In this Table, the North Indian farms have been represented by Delhi, Montgomery, Hissar, Kamal and Ambala, whereas the
. South Indian farms comprise all the other farms in Central and South India, viz. Hosur, Bangalore, Guntur, Bankapur, Junagadh, Sanand and Chharodi farms. If· the zonal and seasonal characteristics are considered separately (Table II), it will be seen that for the autumn samples, there was no significant difference between the two zones. As winter approached the differences became highly si&Wficant, the saponification values of the samples from North India being greatly increased. This is not probably due to differences in the feeding practice, as the farms studied in Northern India, though lacking good pastures in winter, compensate the scarcity by supply of green fodder from irrigated tracts. Further,
· it will be seen from the later discussions that the winter Reichert-Meiss! values showed very little difference from the autumn values, showing thereby that there was not much scarcity of green fodder supply in winter at the North Indian farms. It, therefore, appears that the differences in certain values of the two zones for autumn and winter season can best be explained on climatic basis. Winter in North India, is more severe than in the South and this probably causes an increase in the sapo?ification values of the butter-fat. In ~upport of this, it may be pointed out that w1th the advent of summer, the values m both the zones dropped and as the South Indian summer is of longer duration, the values of samples from this zone. st.m remai~ed significantly below those from North India ; though as may be predicted, the zonal difference in this season was much less than it was in the winter. These findings point out the importance of climate on the saponification values and e~plain why under the rigorous hot conditions prevalent for long periods in d1fferent parts of ~ndia, the saponification values of Indian butter-fat may be lower than those found 1n the Western countries [Davies, 1939].
The saponification values of buffalo ghee were fou~d to be greater than those of the cow ghee, the respective values being 225·7 and 223·3. The difference was not, however, statistically significant.
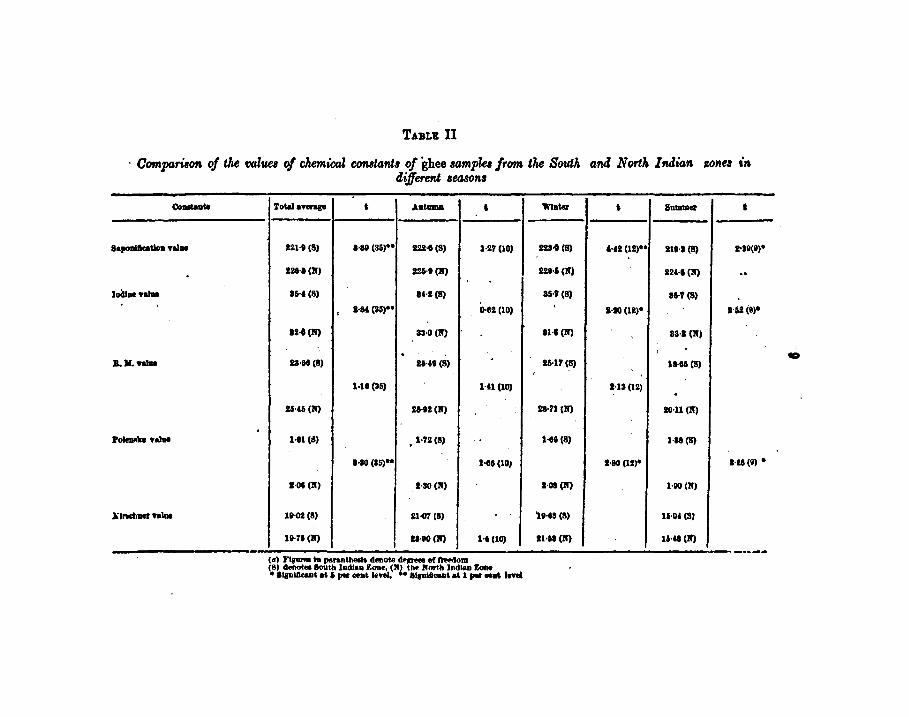
TABLE II
Comparistm of the mlues of chemical constant~ of ghee Bamples from the South aM North Irldian aones in differenl Bea&OIIB
Coutaate i'otelanrap ' Autama ' Wluter ' Sllllllller • 8apollilca\loll •alae 121-1 (8) 1·80 (36) .. 222-1(8) 1-27 (10) 228-G(S) ,.,. (11)•• 1118·1 (8) 1•311(8)0
128·1 (N) W·t Cl') 229·1(1'> 224-1 Cl') .. Jo'4iae•alal 15-& (8) IH(S) 15-7 (8) 18-7(8)
I I·M (85)00 0.62 (10) 1·10 (11)0 1-62(9)0
.... Cl') 83·0 Cl') 81-I(N) 81·1 (N)
. I
LIL ... U·&e (8) 25-40 (8) .
15-17(8) 11-tS(S) ..
1·18 (35) 1-11 (10) 1-11 (11) . IHS(N) 21·81 (N) 21·71 (N) 10·11 (N)
1'o1e111!111 •alul 1·01 (11) • l-'11 (8) 1-10(8) 1·18 (8)
1-10(15)00 1-110 (101 1·80 {12)0 1-28(11).
1·01 (K) 1-SO(N) 1·08 Cl') 1-110 (N)
);Jneb11er ... , ... 18-ot (8) 11-117 (8) '111·83 (8) 16·0& (8)
111-75 (N) 1
IUO(N) 1-1(10) 11-&S(N) 11-&I(N) -- .. ____ ..
10
Iodine values
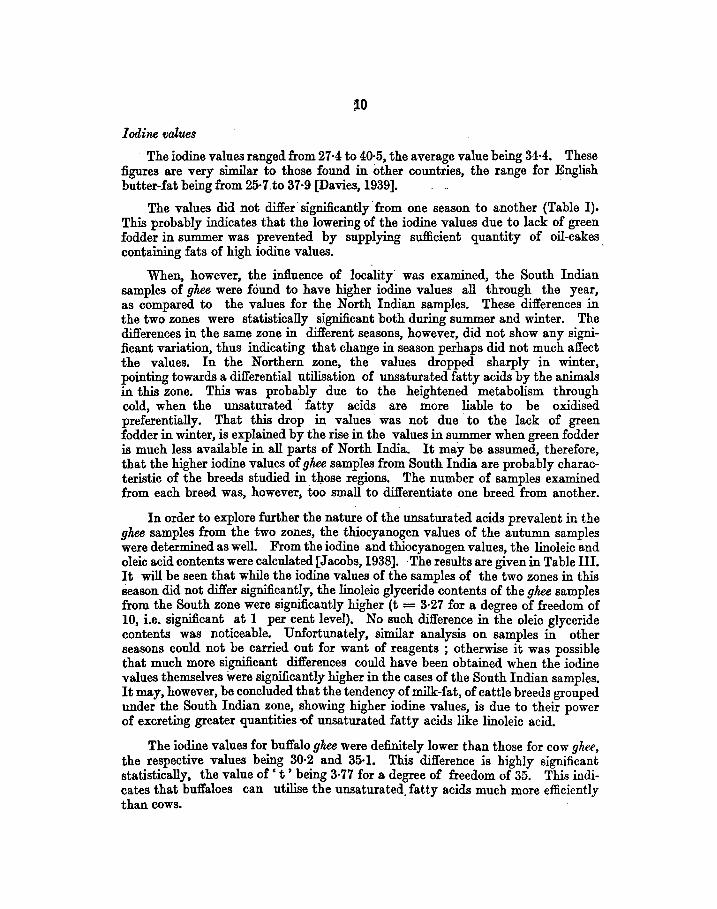
The iodine values ranged from 27·4 to 40·5, the average value being 34·4. These figures are very similar to those found in other countries, the range for English butter-fat being from 25·7.to 37·9 [Davies, 1939].
The values did not differ significantly· from one season to another (Table I). This probably indicates that the lowering of the iodine values due to lack of green fodder in summer was prevented by supplying sufficient quantity of oil-cakes containing fats of high iodine values. ·
When, however, the influence of locality" was examined, the South Indian samples of ghee were found to have higher iodine values all thl"ough the year, as compared to the values for the North Indian samples. These differences in the two zones were statistically significant both during summer and winter. The differences in the same zone in different seasons, however, did not show any significant variation, thus indicating that change in season perhaps did not much affect the values. In the Northern zone, the values dropped sharply in winter, pointing towards a differential utilisation of unsaturated fatty acids by the animals in this zone. This was probably due to the heightened metabolism through cold, when the unsaturated · fatty acids are more liable to be oxidised preferentially. That this drop in values was not due to the ·lack of green fodder in winter, is explained by the rise in the values in s~er when green fodder is much less available in all parts of North India. It may be assumed, therefore, that the higher iodine values of ghee samples from South India are probably characteristic of the breeds studied in_ tl;tose regions. The number of samples examined from each breed was, however, too small to differentiate one breed from another.
In order to explore further the nature of the unsaturated acids prevalent in the ghee samples from the two zones, the thiocyanogen values of the autumn samples were determined as well. From the iodine and thiocyanogen values, the linoleic and oleic acid contents were calculated [Jacobs, 1938]. ·The results are given in Table III. It will be seen that while the iodine values of the samples of the two zones in this season did not differ significantly, the linoleic glyceride contents of the ghee samples from the South zone were significantly higher (t = 3·27 for a degree of freedom of 10, i.e. significant at 1 per cent level). No such difference in the oleic glyceride contents was noticeable. Unfortunately, similar analysis on samples in other seasons could not be carried out for want of reagents ; otherwise it was possible that much more significant differences could have been obtained when the iodine values themselves were significantly higher in the cases of the South Indian samples. It may, however, be concluded that the tendency of milk-fat, of cattle breeds grouped under the South Indian zone, showing higher iodine values, is due to their power of excreting greater quantities 'Of unsaturated fatty acids like linoleic acid.
The iodine values for buffalo ghee were definitely lower than those for cow ghee, the respective values being 30·2 and 35·1. This difference is highly significant statistically, the value of' t ' being 3·77 for a degree of freedom of 35. This indicates that buffaloes can utilise the unsaturated. fatty acids much more efficiently than cows.
11
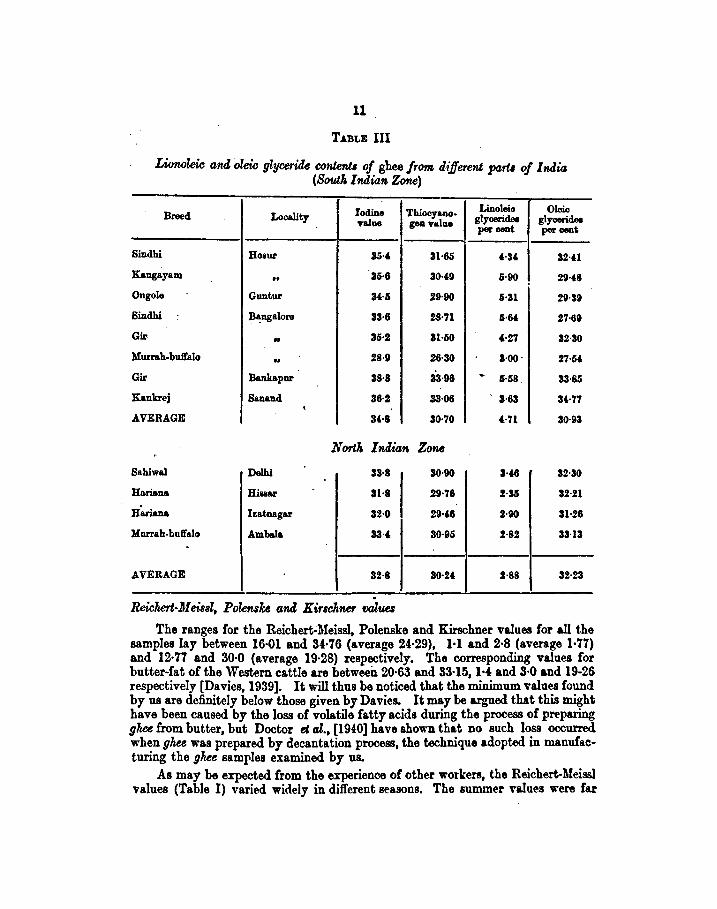
TABLE III
LWnoleic and oleic glycerid.e conten.U of ghee from different parll of I tulia (South Indian Zone)
Breed Iodine Thiocyano. Linoleic Oleic Loe&litf value geD Y&lue glyoeridel glyoeridel
per cent percent
Sindhi Ho•ur 35·' 31·65 ,.3, 3H1
K&ngay&m •• 35·6 3H9 5·90 2H8
Ongole Guntur 3'·5 29·90 6-31 29·39
Sindhi B~:ngalore 33-6 28-71 6·" 27·69
Gir •• 35·2 31-60 '·27 32-30
llunah-bufl'alo .. 28·9 26·30 3·00- 27-5,
Gir Bank& pur 38·8 33·96 . 5·58 33·85
K&nkrej Sanand 36·2 33·06 3-63 3H7 ' AVERAGE 3H 30·70 t-71 30·93
N ortk 1 ndian Zone
Sahiw Delhi 33·8 30·90 3·" 32·30
Ho.ri&n& Hiss&r - 31-8 29·76 %-35 32-21
H:U.iana Izatnaga.r 32·0 2H6 2·90 31·26
l'durrah-bufl'alo Ambal& 3H 30·95 !·82 33-13 .
AVERAGE 32·8 3o-2' !·88 32·23
. Reichert-Jleissl, Polens~ and Kirschner ooluea
The ranges for the Reichert~lleissl, Polenske and Kirschner values for all the samples lay between 16·01 and 34:·76 (average 24:·29), 1·1 and 2·8 (average 1·77) and 12·77 and 30·0 (average 19·28) respectively. The corresponding values for butter-fat of the Western cattle are between 20·63 and 33·15, 1·4: and 3·0 and 19-26 respectively [Davies, 1939]. It will thus be noticed that the minimum values found by us are definitely below those given by Davies. It may be argued that this might have been caused by the loss of volatile fatty acids during the process of preparing ghee from butter, but Doctor et al., [1940] have shown that no such loss occurred when ghee was prepared by decantation process, the technique adopted in manufacturing the ghee samples examined by us.
As may be expected from the experience of other workers, the Reichert-!lleissl values (Table I) varied widely in different seasons. The summer values were fat
12
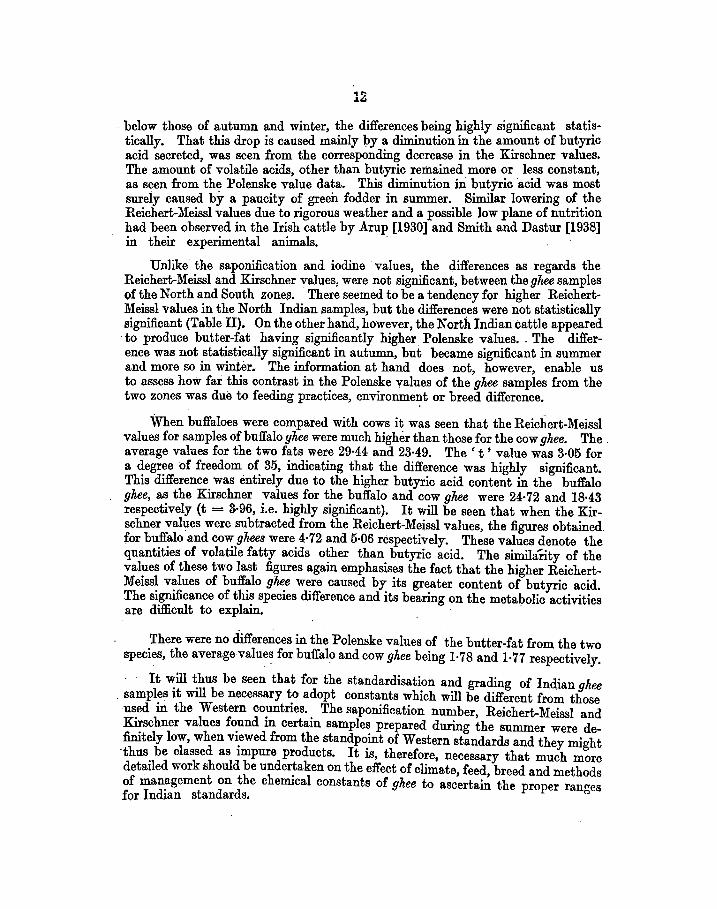
below those of autumn and winter, the differences being highly significant statistically. That this drop is caused mainly J:>y ~ diminution~ the a~ount of butyric acid secreted, was seen from the corresponding decrease m the Krrschner values. The amount of volatile acids, other than butyric remained more or less constant, as seen from the Polenske value data. This diminution iii butyric acid was most surely caused by a paucity of green fodder in summer .. Similar lowering of. ~he Reichert-1\Ieissl values due to rigorous weather and a possible low plane of nutrition had been observed in the Irish cattle by Arup [1930] and Smith and Dastur [1938] in their experimental animals. ·
Unlike the saponification and iodine values, the (l.ifferences as regards the Reichert-Meiss! and Kirschner values, were not significant, between the ghee samples of the North and South zone~. There seemed to be a tendency for higher ReichertMeiss} values in the North Indian samples, but the differences were not statistically significant (Table II). On the other hand, however, the North Indian cattle appeared ·to produce butter-fat having significantly higher. Polenske values .. The difference was not statistically significant in autumn, but became significant in summer and more so in winter. The information at hand does not, however, enable us to assess how far this contrast in the Polenske values of the ghee samples from the two zones was due to feeding practices, environme~t or breed difference.
When buffaloes were compared with cows it was seen that the Reichert-Meiss! values for samples of buffalo ghee were much higher than those for the cow ghee. The average values for the two fats were 29·44 and 23·49. The ' t ' value was 3·05 for a degree of freedom of 35, indicating that the difference was highly significant. This difference was entirely due to the higher butyric acid content in the buffalo ghee, as the Kirschner values for the buffalo and cow ghee were 24·72 and 18·43 respectively (t = 3-96, i.e. highly significant). It will be seen that when the Kirschner values were subtracted from the Reichert-Meiss} values, the figures obtained. for buffalo and cow ghees were 4·72 and 5·06 respectively. These values denote the quantities of volatile fatty acids other than butyric acid. The similarity of the values of these two last figures again emphasises the fact that the higher Reichert-. Meiss! values of buffalo ghee were caused by its greater content of butyric acid. The significance of this species difference and its bearing on the metabolic activities are difficult to explain. .
There were no differences in the Polenske values of the butter-fat from the two species, the average value~ for buffalo and cow ghee being 1·78 and 1·77 respectively.
· It "':ill ~hus be seen that for the standardisation and grading of Indian ghee . samples 1t will be necessary to adopt constants which will be different from those
used in the Western countries. The saponification number Reichert-Meiss! and Kirschner values found in certain samples prepared during the summer were definitely low, when vi.ewed from the standp~int of Western standards and they might ·thus be classed as Impure products. It IS, therefore, necessary that much more detailed work should be undertaken on the effect of climate feed breed and methods of management on the chemical constants of ghee to asc'ertai~ the proper rancres for Indian standards. '"'
. CHAPTER III
VITAMIN A AND CAROTENE CONTENT OP PATS AND OILS
BY N. D. KEBA.R, S. N. RAY, T. S. KRtsuN.ur, B. C. JosHI and B. C. RAISAB.JUB
T HE vitamin A potency of butter-fat produced from the milk of cattle under diverse conditions of feeding and of different breeds has been the subject of a
large number of investigations carried out in Europe and America. It has been established thereby that, as measured by the biological rat-growth method, there is no difference in the total vitamin A potency of butter-fats from different breeds of cattle under identical conditions of feeding. The ratio . between carotene and vitamin A present in butter-fats from different breeds may, however, show wide variation even under identical feeding conditions. Thus the butter-fat from Gue;nseys has twice as much carotene as that from Ayrshire [Wilbur et al., 1933] and thrice as much carotene as that from Shorthorns [Kon and Booth, 1933]. It is also
- recognised that access to fresh green pasture yields butter of high vitamin A value, whereas cows fed on poor dried up pasture or on badly cured hays and straws yield butter-fat low in vitamin content [Davies, 1940].
Very little work has been done in India. to evaluate the effect of breed or season on the vitamin A potency of ghee (clari1i.ed butter-fat). Doctor et al., [1940] observed that under similar conditions of feeding and management, foreign breeds (Ayrshire) secreted into milk more carotene and vitamin A than the Indian breeds like Sindhi or Gir. No difference, however, was found to exist in the milk of these two latter breeds. They also showed·that buffaloes (Murrah breed) yielded butter-fat having a lower vitamin A potency than even the Indian breeds of cattle. They also confirmed the findings of other workers that buffalo-milk fat was practically fffi1 from carotene. No other comparative work on the effect of breed or climate on
· the. vitamin A content of g'Me or butter has yet been carried out in India.
There also exists diversity of opinion about the presence or absence of vitamin A in ghee, as sold in Indian markets. Banerjee and Sunawala (1935] failed to detect any vitamin A in four samples of bazar g'Me. On the other hand, Grewal [1933] in Lahore found 18 I.U. per gram of ghee. Muthana and Seshan [1941] found eight micrograms of vitamin A per gram of Bengal bazar ghee and 12 micrograms per gram of Sindhi ghee. ·Majumdar (1941] found a very low value for market buffalo-ghee, i.e. 1·1 microgram per gram. Ahmed et al., [1946] found that six out of the seven market samples· of ghu, exainined by them, had a vitamin A content of less than 24 I.U. per gram.
The present work was taken in hand to find out, firstly, whether there exists any breed difference in the vitamin A content of milk and hence in the butter or ghee prepared from it and secondly, whether the ghee produced from the milk of the same breed of cattle in different regions of India, at different seasons shows any variation in the vitamin A content. . It was also proposed to purchase ghH from
13

14
the open market in the various provinces of India and to analyse those samples for their vitamin A content. The analysis of bazar ghee was undertaken to ascertain the amount of vitamin A reaching the actual consumer through this medium. These findings were assumed to be of value to the Public Health Authorities as the ghee forms i!he most important animal fat in the Indian dietary and diffe~s from the vegetable oils used as food ingredients, in its vitamin A content, this vitamin being absent from the vegetable oils. In fact, the ghee may be taken to be the only source of vitamin A in the vegetarian dietary, as the rest of the food contains only carotene. In human beings, vitamin A, owing to its greater digestibility and greater biological potency, is four to five times as a.ctive as the same quantity of carotene [Booher, 1938]. Hence even the small quantity of vitamin A ingested with ghee will be of great value in bringing up the low levels of vitamin A . potency of the Indian dietaries. .. Side by side with these, studies were carried out on the c~rotene and vitamin A content of commcn vegetable oils, different brands of vanaspatis and lard. It is generally believed that the vegetable oils except red palm oil, contain no carotene or vitamin A. Detailed data regarding this point is, however, lacking. Many va.naspati manufacturers advertise their products as having been fortified with vita~ins without giving any indication of the quantities present. Hence, an attempt was made to determine the quantity of vitamin A available to consumers of these products. The vitamin D content of a few samples of vanaspatis was also estimated.
A. . V i!amin A potency of fresh pure ghee Ghee samples were obtained from twelve different farms all over India. Eight,
different breeds of cat~le and one breed of buffalo were represented. Three batches of samples, one in September, 1944 and two others in January and June,1945, were examined, A standardised process was used in all the farms to prepare the ghee. The ghee.. samples were despatched to our laboratory immediately after preparation, packed in small air-tight containers which were filled in a way that very little air sp~ce was left inside them. The samples on receipt were immediate!~ ke~t in a refrigerator and ai31yr.ed at the earliest opportunity. Carotene and v1tamm A ~ere extracted after saponification, according to a modified method of Gillam et al., [ 1927]. Car~tene was determined colorimeterically after removal of xanthophyll. The unsa.porufiable matter of ghee was then dissolved in pure ethyl alcohol and the vitamin A in the solution was estimated in a Hilger vitameter. The results of these findinga are incorporated in Table IV. .
~t wi~l be seen that under identical feeding conditions, i.e. in the same farm, the vitamm A potencies of ghee made from the butter-fats of cows of different breeds ·were more or less the same. Thus ghee from Kangayam and Sindhi breeds from I:Iosur Cattle Farm had nearly the "same values and the ratio between carotene and
.,vital!lin A in sud1 fats was also more or less ~f the same order. Similar findings were also seen in the Sindhi and Gir breeds of the Indian Dairy Resel\rch Institute 'Farm at Bang~lore: On the other hand, the ghee from Murrah buffaloe:; iu Bangalore had .a lower VItamm A potency than the ghee from cows in the same farm. These d~ta ~upport the findings of Poctor et al., (1940] that the buffalo gltee contains less v1tamm A than cow pltee, · .
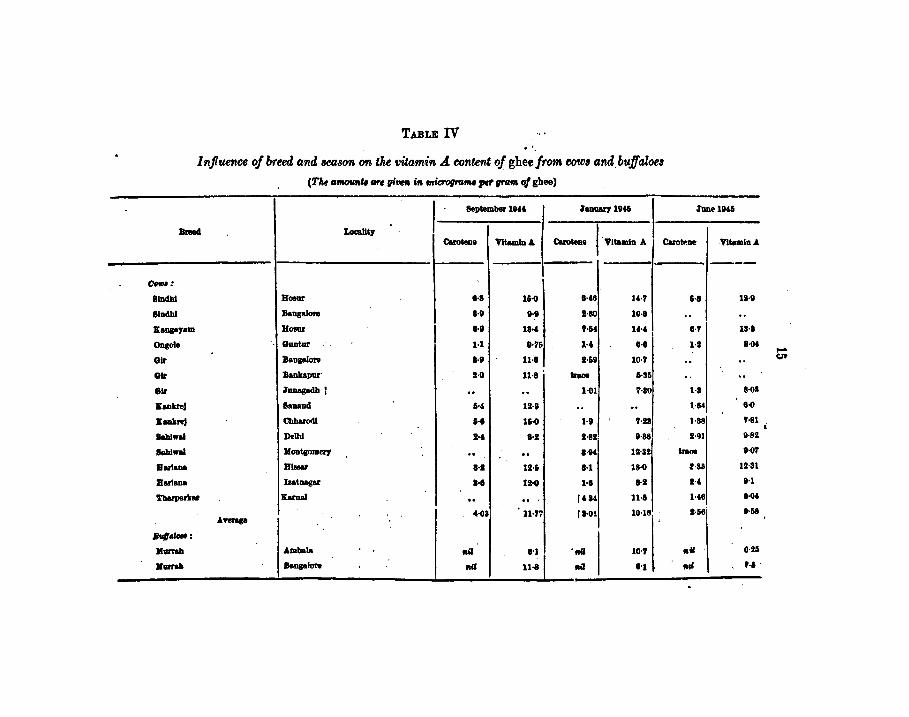
TABLE IV . ·. Influence of breed and scason on the 'Vitamin A content of gheefrom cows and. buffaloes
(Tile a~ are givm ita micrograrM fit' gram oJ ghee)
I September liiU
Bne4 Locality
.June 19U
Carotene VltemiDA
lanaar)' 111~ I Carotene ,.Titamio A CarotP.oe VItamin A
--eo.•:
SIDdbl Boeur •·• lH 8-46 lH fi·l 18·9
SIDdhl Jlaogalme 1·9 ••• 2·80 10·8 .. .. Eaogeyam Boeur 1·11 18•& H4 lH
1 "' lS·I
Oogole Guntur H 1-76 1·& •·• 1·1 8·04
Glr Jlaogalme ••• 11;1 2·611 10·7 .. .. etr Bankapur· 1.0 11·8 trace fi·36 .. .. 81r lunagadh l .. .. 1·01 '1-30 u 8-QS
:hokreJ Saoaool '"' 12-8 .. .. 1·84 8.0
J[llllkreJ Cbbarorll G-1 1&.0 ... 7·28 1·88 '1-81
lebi.U DeUd I·& 8·1 2·81. 11·88 2·!11 11-1!2
lkhi.U llootgomery .. .. 8·114 lli-SI trace 8·07
Butaoa BIMar 8·1 12-i ... 13·0 U& 111-31
Barlaoa Izatoagar •·• 11-G 1·8 8·1 ... IH
Tbarparllar Kamal .. .. , ... , tt-l H6 •ot .Ayerage
o&-oa Jt-77 i•Ot 10·18 .. 1·66 D·&l
Bvf/alwl:
llarnla Am bela "" 8•1 '1141 lO·f "" 8·26
llmab JlaogalON "" 11·8 1141 ••• "" f-1·
16.
The vitamin A potency varied markedly in the same breed from place to place, e. a. Sindhi cows in Hosur yielded ghee much richer in vitamin A than the same breed at~Bangalore. The explanation lies in the fact that whereas Hosur cattle get extensive grazing throughout the whole year, no grazing is possible in Bangalore. Moreover, the cattle at the latter place receive only cut green fodders and, thus, prob~bly do not get their optimum quota of carotene.
. The seasonal variations were rather irregular in most places, except in Hosur and Hissar where nearlv con~tant values were obtained all through the year. This was due to the all-year grazing facilities available at both the farms. In most of the other farms, the winter and summer values of the vitamin A content of ghees tended to be lower than the autumn values. This trend is brought out in the average values of the different seasons (Table IV). More marked diminution was seen in the carotene values for winter and summer. Here again the carotene values of samples from Hosur and Hissar were found to be more or less the same all through t~e year. The low values for June samples from the other places were probably caused by a lack of fresh green fodder. This would chieil.y affect the carotene excretion in the milk, as this pigment is seldom stored in the body as such. On the othP-r hand, vitamin A values of the samples did not show wide changes as the vitamin A of the milk in summer was probably obtained to a great extent from the vitamin A stored in the body during periods of high levels of green feeding.. Among cows, the. highest values of vitamin A content. of ghee approached 15 micrograms per gram, which may represent the peak values reached after supplying plenty of green fodder. This value is similar to the figures obtained by Ray, Sarkar and Sen [1943] in the butter-fat of cows under intensive green feeding conditions. The lowest values found by us were in the region of six micrograms per gram. ·
One point of interest may be brought to notice here. · The carotene content of ghee obtained from the milk of Ongole breed of cattle never rose to more than ~·5 microgram all through the year. The vitamin A contents were, however, quite high, i.e. at or below which, other breeds were giving ghee containing carotene at the rate of 2·5 to 4 micrograms per gram. In fact, such low values make this breed similar to buffalo, in which species, it may be noted, carotene is excreted in the. milk in slight traces only.
It may, therefore, be concluded that none of the Indian breeds examined gave ·milk as rich-in carotene as that of the Jersey breed. On the contrary, Ongoles
secrete very little caro~ene in the milk and thus appear to resemble the buffalo. Under an intensive green feeding regime, the butter-fat of Indian breeds of cattle is very rich in vitamin A, the values being similar to those of the European breeds under similar heavy green feeding, as reported by foreign workers [Atkenson et al., 1937].
Unlike Doct?r et al., (lov. vit.), we did not examine ghee from foreign breeds of catt.le. under .Ind1.an conditions of feeding and environment, but it is possible that the high~r v1tamm values which they obtained were due to the lower fat contents of the milk of these breeds, and thus the total potency in equal volumes of liquid milk o~ both foreign and indigenous breeds was of the same magnitude. This explanatiOn als.o s~rves for ~he low vitamin A value of buffalo ghee. The fat content of buffalo milk 1s v~ry high, so that the concentration of the vitamin A per gram

11
of butter-fat becomes lower, assuming that equal amounts of vitamin A are present in equal volumes of cow and buffalo milk.
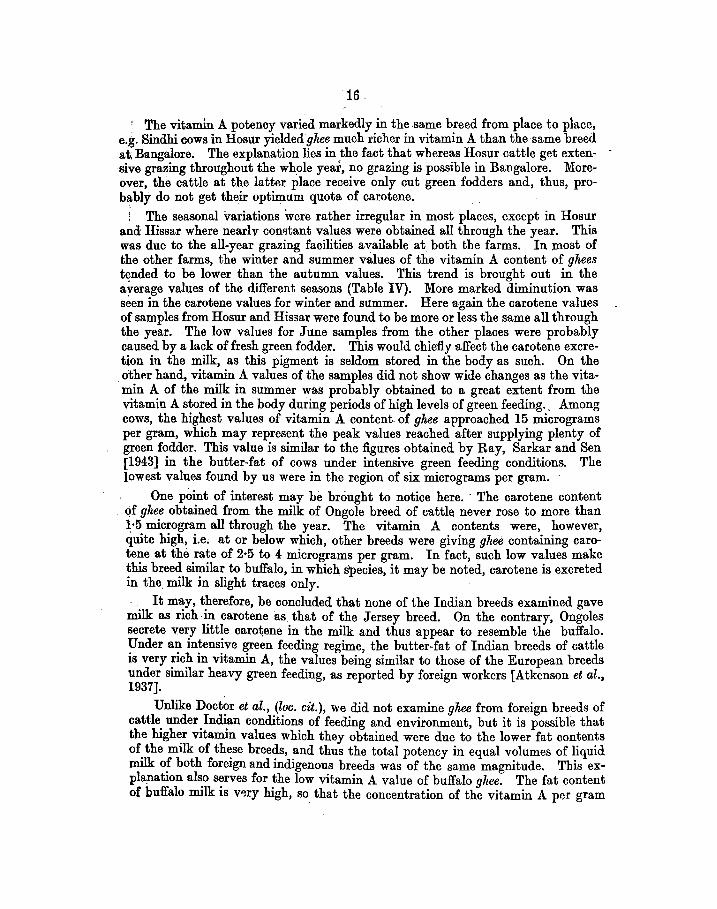
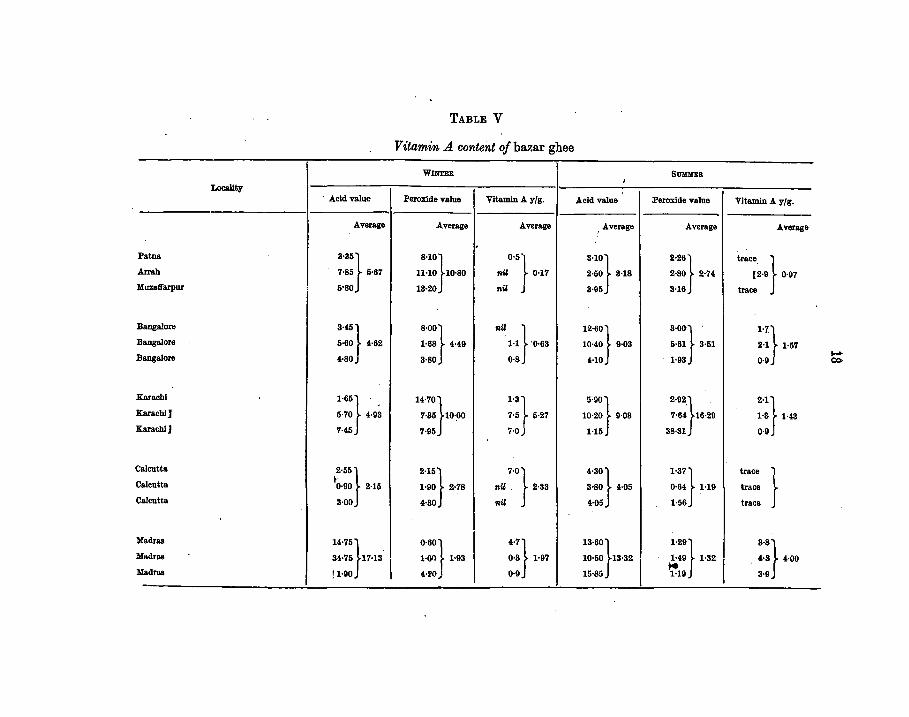
B. Vitamin ..4 content of hazar ghee
Thirty-one samples of bazar gh.ee collected during winter months, and 27 samples collected in summer from various parts of India, were examined. The average value for the winter samples was 1·26 micrograms per gram of gh.ee and for the summer samples 1·44. The detailed results are given in Table V.
The analyses were done both spectroscopically as well as tintometrically. The tintometric method followed was that used by Booth et al. [1933]. Most of the samples were more or less rancid, as was evident from the high acid and peroxide values. As rancidity was found to interfere with the spectroscopic determination of vitamin A, giving much higher figures, the tintometric results only are incorporated in the Table, according to the recommendations of Oser et al. [1943). For calculating the vitamin A content in micrograms, lloore's blue units, as determined in the tintometric method, were converted into micrograms of vitamin A, using the conversion faetor of 1 p..g. vitamin A=l·O blue units.
It will be seen that, judged by the vitamin A content, most of the samples were of poor quality. There was, however, scarcely any difference in the average values for summer ·and winter samples.
No carotene could be detected in any one of the samples. This might have been due to two causes, firstly; most of these samples were perhaps prepared from buffalo milk which contains no carotene and secondly, it is also possible that even if some of the samples were of cow gh.ee, the carotene originally present might have been destroyed during storage. ~
In order to find out the rate of destruction of vitamin A and carotene in gluo,e samples during storage, a sample of pure cow gh.ee was kept in a glass bottle. The container was stoppered lightly and was left on the laboratory shelf. The percentage of loss in storage during the periods of HO and 2{0 days was as follows: (1) vitamin A-20 per cent and 50 per cent respectively, and (2) carotene-35 per cent and 100 per cent respectively.
C. Vita min A and D and carol.eM content of vegetable oils, vanaspati and tard In the case of oils, ~oth crude and refined samples of each oil were separately
analysed. The oils were refined in the laboratory as follows :
Raw oil was treated with a requisite quantity of caustic soda to neutralise the free acidity, warmed and allowed to stand. The soaps and suspended impurities were filtered off and the oil washed free of soaps, etc. with hot water. The oil was then dried by shaking with anhydrous sodium sulphate. Bleaching was carried out by one treatment with animal charcoal.
The carotene content was determined by the method described earlier and the vitamin A was estimated by the Spectroscopic method. Vitamin D in a few samJlles of vanaspatis was assayed against a standard sample of.cod-~ivt>r oil by the A.O.A.C. official chick essay method [1940]. The results are g1ven an Table VI.
l'atna
Arrab
Muzalfarpur
Baoga!ore
Baogalore
B aogalore
achl Kar
K
K
arachl]
arachlJ
alcutta c c alcutta
Calcutta
Madras
Madras
Madras
-
Locality ·Acid value
Average
3·35} 7·85 6·67
5•80
3-'5} 5·60 •·62
4-80
1-65} . 5·70 4•93
7·45
2·55} ~0·90 2·15
3·00
14-75} 34·75 17-13
!1-90
TABLE V
Vitamin A content of hazar ghee
WINTER
l'eroxide value Vitamin A yfg.
Average Average
. 8·10} 0·]
11·10 10·80 nil 0·17
13·20 nil
8·00} nil
1·68 •·49 1·1} '0·63
3·80 O·S
14-70} 1-3} 7-35 10·00 7-6 6·27
7-95 7·0
2-15} 7·0} 1-90 2·78 nil 2·33
4·30 nil
0·601 4-7} 1·011 1·93 0·3 1-97
4-2(1) 0·9
SUMIIIER I
Acid value l'eroxide value Vitamin A yfg.
, Average Average Average
3-10} 2·26} trace } 2·50 3·18 2·80 2·7· [2·9 0·97
3·95 3·16 trace
12·60} 3·00} . 1-7} 10·40 9·03 6·61 3·61 2·1 1·57
4·10 1-93 0·9
5·90} 2·92} 2-1} 10·20 9·03 7-64 16·29 1-3 1-43
1·15 38·31 0·9
4·30} 1·37} trace
} 3·80 4·05 0·64 1·19 trace
4-05 1-56 trace
13·60} 1-29} 3·8} 10·60 13·32 I ;;.49 1·32 I . 4·3 4·00
16·85 1-19 3·9
T.ABLB V-contd.
Vitamin A content of bazar gbee
WPDB Bu ...
z-utr .6.el4 •aJue Perosl4t ftlue Vl&amlll A J/1· AGI4'1'111at PelOSI 4t 'I' alae VltllmiD A r/1•
A•.np """''' .& ....... A'I'II'IIP """••• A'1'8r ...
Delbl O·Sii} ··~} 1141
} 0·00
.. .. .. Delbl O·Bii O·H 0·85 1·81 nQ .. .. .. J)elbl 0·65 o-o nQ .. .. .. Jlombq ··~·} IH] .. } 1-8} a•} O·N} Jlombq 11·80 12·11 4·11 •. ,. 0·1 0·10 , .. •ro 10·18 11-71 .:·11 1·00
llombq 1'·80 . HI 0·1 18-1 81·11 .... ·~} •·m} .. } . 1·81} ·~} .... "} 1·10 ....... HO 1·91 1·26 ... , O·t O·tl 1-1!0 1·H . 1·11 .... .... ..,, 1·85 •• ·~ G-11 ••• 1UuN ... } 1·71} =}o•r G-80} 1·10}
,....,. } 1UuN : ...• 1·11 1-GI ... 0·11 G-ff HI nQ
1UuN l·N •• G-80 HO nQ
......... G-10 1·10 1·1 .. ... ..
...... ••10} IHI}
!141 1·1} HI ·~} f.St} .. } ...... U·IO 11-11 .... lUI l-10 ••• ... . ... fill ....... . ..,. NO I-to •• ·~ 11-10
Afthii(Tolal) .... ....
20
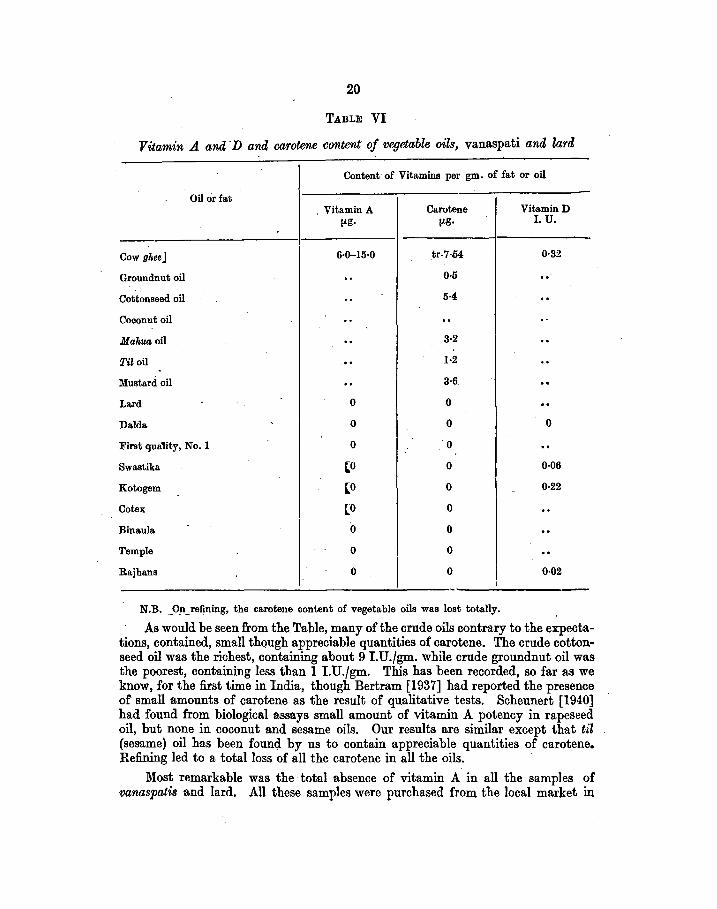
TABLE VI
Vitamin A arul"D arul carotene content of vegetable oils, vanaspati arul lard
Content of Vitamins per gm. of fat or oil
Oil or fat . VitaminA Carotene VitaminD
!Lg· !Lg. I. U.
Cow gheej 6•0-15·0 .tr-7-li4 0·32
Groundnut oil .. 0·5 .. Cottonseed oil .. 5·4 .. Coconut oil .. .. ... Mahua oil .. 3·2 .. Til oil .. 1·2 .. Mustard oil .. 3·6. . . Lard 0 0 .. Dalda. ' 0 0 0
First qua1ity, No.1 0 0 .. Swastika. ~0 0 0·06
Kotogem (0 0 - 0·22
Cotex [0 0 .. Bina.ula 0 0 .. Temple 0 0 .. Raj hans 0 I 0 I 0·02
I -N.B. _On_refining, the carotene content of vegetable oils was lost totally.
As would be seen from the. Table, many of the crude oils contrary to the expectations, contained, small though appreciable quantities of carotene. The crude cottonseed oil was the richest, containing about 9 I.U.fgm. while crude groundnut oil was the poorest, containing less than 1 I.U.fgm. This has been recorded, so far as we know, for the first time in India, though Bertram [1937] had reported the presence of small amounts of carotene as the result of qualitative tests. Scheunert [1940] had found from biological assays small amount of vitamin A potency in rapeseed oil, but none in coconut and sesame oils. Our results are similar except that til (sesame) oil has been found by us to contain appreciable quantities of carotene. Refining led to a total loss of all the carotene in all the oils. ·
Most remarkable was the total absence of vitamin A in all the samples of vanaspatis and lard. All these samples were purchased from the local market in
21.:
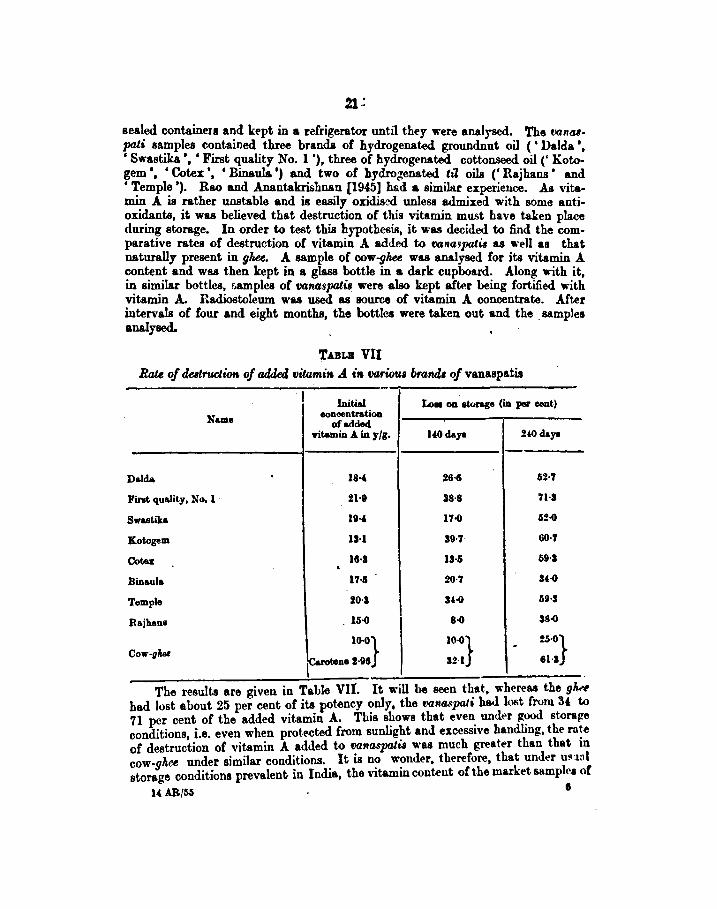
sealed containers and kept in a r~frigerator until they ..-ere analysed. The oon48· pati samples contained three brands of hydrogenated groundnut oil ( 'Dalda ', ' Swastika.', ' First quality No. 1 '), three of hydrogenated cottonseed oil (' Kotogem', 'Cotex ', 'Binaula ') and two of hydro6enated til oils (' Rajhans' and ' Temple '). Rao and Anantakrishnan [1945] had a similar experience. As vitamin A is rather unstable and is easily oxidiscd unless admixed with some antioxidants, it was believed that destruction of this vitamin must have taken place during storage. In order to test this hypothesis, it was decided to find the com· parative rates of destruction of vitamin A added to va~ta,pali& as •·ell as that naturally present in ghu. A sample of cow-gh.ee was analysed for its vitamin A content and was then kept in a glass bottle in a dark cupboard. Along with it, in similar bottles, r..a.mples of vanaspalis were also kept af~r being fortified with vitamin A. Radiostoleum •·as used as aource of vitamin A concentrate. After intervals of four and eight months, the bottles were taken out and the . samples analysed.
TA.BLB VII Rate of destruction of added vitamiK .A ita variotu brand• of vanaspatis
-I Initial Lo• on storage (iD per cent)
Name oonoentr&tion of added.
yitamiD A. iD yfg. 140days !40days
D aida 1H !6·6 62·7
First quality, No. 1 21-lt 38·8 71·1
s wastika 111-6 17.0 62.0
Kotogem 1H 39-7 60·7
Cotu: 16·1 IH 69-S . Binaula 17-5 20·7 14.0
Temple 20·1 14·0 69·1
Raj hans . 15.0 .
8.0 38.0
10·0} 10.0} !5.0} -Cow-gMI !Carotene !·96 I:H 61-S
The results are given in Table vn. It Wlll be seen that, whereas the glw had lost about 25 per cent of its potency only, the vana.~pali had lost from 34: to 71 per cent of the added vitamin A. This s~10ws that even. under ~ storage conditions, i.e. even when protected from sunlight and exoess1ve handling, the rn!e of destruction of vitamin A added to vanaspati& was much great ... r than that m cow-ghe~ under similar oon~tions.. It is n? w~nder, therefore, tha~ under unnl storage conditions prevalent- 1n India, the Vltamm content or the market samplt'.a of U~ I
22·
i'~naspati was totally lost. It is; therefore, desirable for the protection of vitamin A added to vanaspati, that suitable antioxidants should also be incorporated simultaneously.
Low values for vitamin D were found in the vanaspati samples. It was totally absent from Dalda. If the va'liaspatis had been fortified with vitamin D, this low value could not have been caused by loss of the vitamin during storage, as vitamin D is· comparative1y stable. Ass~g that vitamin D had really been added, it is probable that other factors might have masked the calciogenic action of vitamin D. The higher fatty acids present iri the vanaspatis might interfere with the ab · sorption of feed-calcium with the result that calcium salts are drained off from the bones to other parts of the body and also perhaps excreted through the gut. Sup port for this view is lent by the fact that the bone ash percentage of chicks receiving Dalda was even lower than that of the bones ofthe negative control birds, i.e. those receiving the vitamin D-free basal ration only.
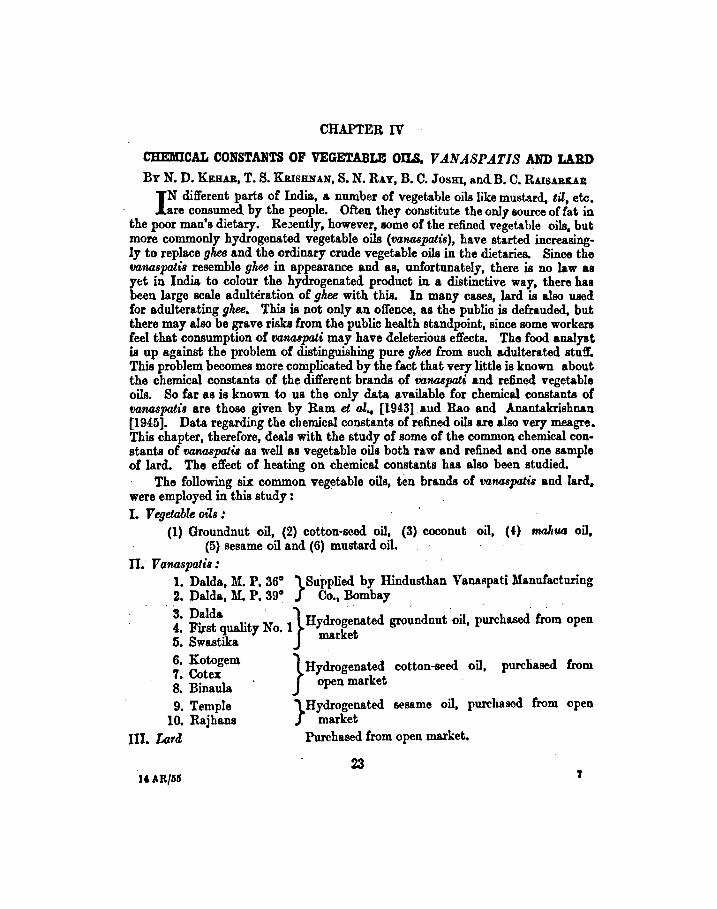
CHAPTER IV
CHEMICAL CONSTANTS OF VEGETABLE OILS, VANASPA.TIS AND LARD
BY N.D. KEBAB, T. S. KRISHNAN, S. N. R.u, B. C. Josax. and. B. C. R.usARJt.u:
I N different parts of India., & number of vegetable oils like mustard, til, etc. · are consumed. by the people. Often they constitute the only source of fat in the poor man's dietary. Re::ently, however, some of the refined vegetable oils, but more commonly hydrogenated vegetable oils (vanaspatis), have started increasingly to replace ghee and the ordinary crude vegetable oils in the dietaries. Since the tJanaspatis resemble ghee in appearance and as, unfortunately, there is no law as yet in India to colour the hydrogenated product in a distinctive way, there has been large scale adulteration of ghee with this. In many cases, lard is also used for adulterating ghee. This is not only an offence, as the public is defrauded, but there may also be grave risks from the public health standpoint, since some workers feel that consumption of vanaspati tnaY have deleterious effects. The food analyst is up against the problem of distinguishing pure ghee from such adulterated stuff. This problem becomes more complicated by the fact that very little is known about the chemical constants of the different brands of vanaspati and refined vegetable oils. So far as is known to us the only data available for chemical constants of oonaspatis are those given by Ram et al., [1943] and Rao and Anantakrishnan [1945]. Data regarding the chemical constants of refined oils are also very meagM. This chapter, therefore, deals with the study of some of the common chemical constants of vaMSpatis as well as vegetable oils both raw and refined and one sample of lard. The effect of heating on chemical constants has. also been studied.
The following six common veg~table oils, ten brands of vanaspatil and lard, were employed in this study ; I. Vegetable oils :
(1) Groundnut oil, (2) cotton-seed oil, (3) coconut oil, (4) nw.lltuJ oil, (5) sesame oil and (6) mustard oil.
II. V anaspatis : 1. Dalda, !II. P. 36° }Supplied by Hindusthan Vanaspati l\lanufacturing 2. Dalda, l\1. P. 39° Co., Bombay
. ~· FD!"ldta lit N. !}Hydrogenated gro~ndnut .oil, p~hased ~m· open -.:. J,l'S qua y o. k t 5. Swastika mar e
6. Kotogem }Hydrogenated cotton-seed oil, purchased from 7. Cotex k 8 B. ul open mar et • rna a 9. Temple }Hydrogenated sesame oil, purchased from open
10. Rajhans market III. Lard Purchased from open market.
23 7
24
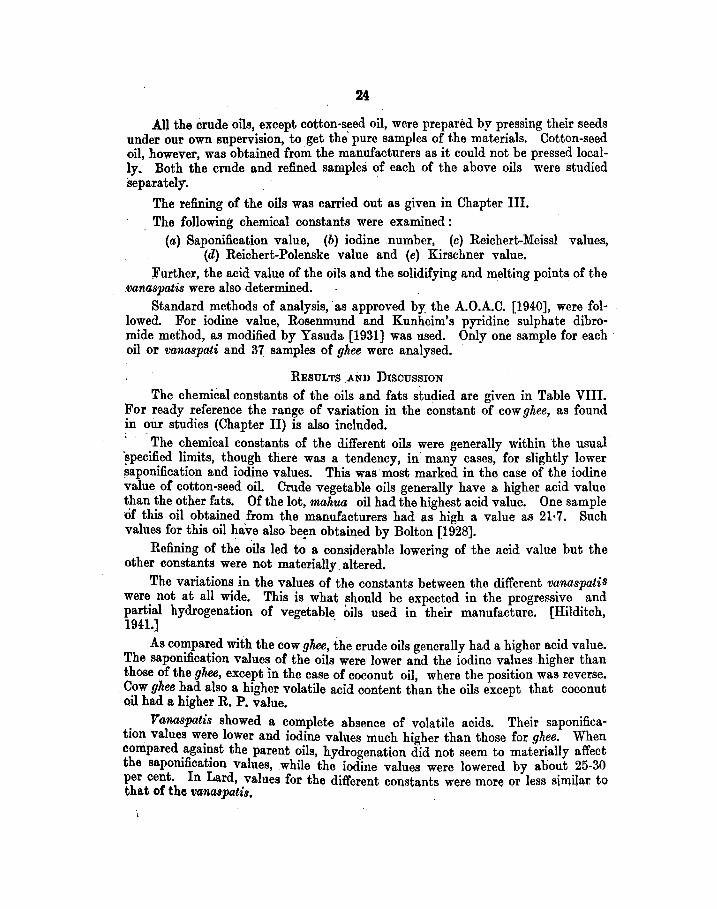
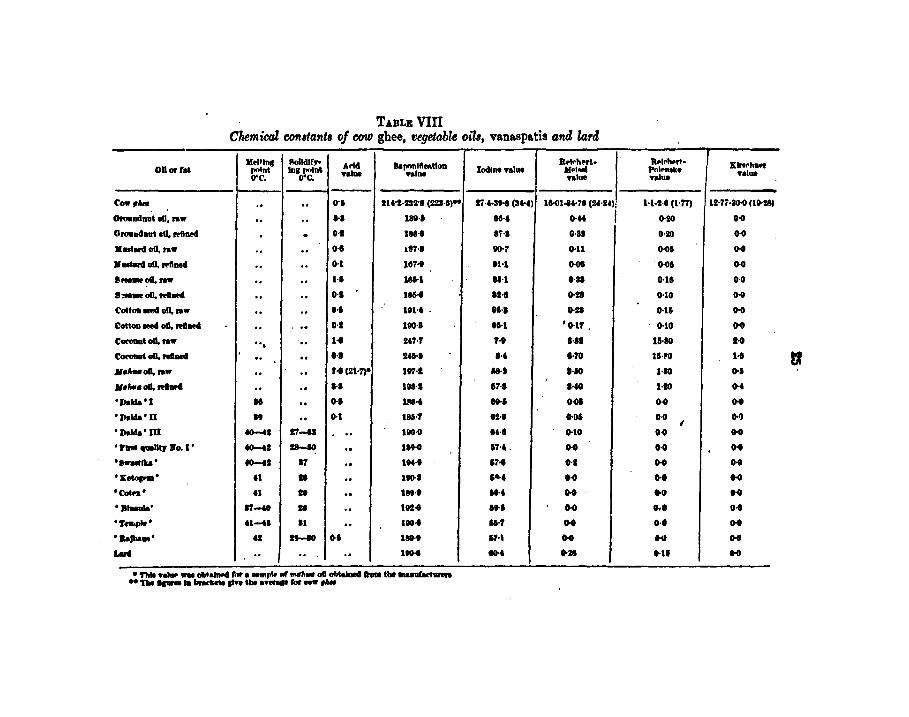
All the crude oils, except cotton-s~ed oil, were prepared by pressing their seeds under our own supervision, to get the pure samples of the materials. Cotton-seed oil, however, was obtained from the manufacturers as it could not be pressed locally. Both the crude and refined samples of each of the above oils were studied separately.
The refining of the oils was carried out as given in Chapter III. The following chemical constants were examined :
(a) Saponification value, (b) iodine number, (c) Reichert-Meiss! values, (d) Reichert-Polenske value and (e) Kirschner value.
Further, the acid value of the oils and the solidifying and melting points of the .vanaspatis were also determined.
Standard methods of analysis, as approved by the A.O.A.C. [1940], were followed. For iodine value, Rosenmund and Kunheim's pyridine sulphate dibromide method, as modified by Yasuda [1931] was used. Only one sample for each oil or vanaspati and 37 samples of ghee were analysed.
RESULTS .AND DISCUSSION
The chemical constants of the oils and fats studied are given in Table VIII. For ready reference the range of variation in the constant of cow ghee, as found in our studies (Chapter II) is also included. . . The chemical constants of the different oils were generally within the usual ~pecified limits, though there was a tendency, in many cases, for slightly lower ~aponification and iodine values. This was most marked in the case of the iodine value. of cotton-seed oil. Crude vegetl).ble oils generally have a higher acid value than the other fats. Of the lot, mahua oil had the highest acid value. One sample of this oil obtained from the manufacturers had as high a value as 21·7. Such values for this oil have also be!ln obtained by Bolton [1928].
. Refining of the oils led to a considerable lowering of the acid value but the other constants were not materially. altered.
The variations in the values of the constants between the different vanaspatis were not at all wide. This is what should be expected in the progressive and partial hydrogenation of vegetable oils used in their manufacture. [Hilditch, 1941J .
As compared with the cow ghee, the crude oils generally had a higher acid value. The saponification values of the oils were lower and the iodine values higher than those of the ghee, except in the case of coconut oil, where the position was reverse .
. Cow ghee had also a higher volatile acid content than the oils except that coconut oil had a higher R. P. value.
. Vanaspatis showed a complete absence of volatile acids. Their saponifica-tiOn values w~re lower and iodine values much higher than those for ghee. When compared .agau~.st the parent oils, hydrogenation did not seem to materially affect the sapomficat10n values, while the iodine values were lowered by about 25-30 per cent. In Lard, values for the different constants were more or less similar to that of the vanaspatis. · ·
TABLEVIIT Claemical const4nlB of cow ghee, veget.tible oils, vanaspatis and Ztlrd
.... , .... Solidify. A <'hi 8aJW1111ftCRtiOD Jtf'k'h~rt· JlAolrh•rt· Kl"rha.r ODOlf&& pnln& 1D1 pnln& Iodine ftlUI M•loel Pnl<'noke O"C. O"C. ftlae ealne nloe ftlue .....
-c_,,_ .. .. ••• !U•I-232'1 (228-6)" 17·t-3t·l (3H) lto()l .. Ht (2'·11'): l-l·!-6(1-17) 111-71·30-0 (111·181
Orouud0111 ell, raw .. .. •·• 189·1 ... , 0·" I 0·110 o-o Oroaud011l dl, mtllfd - 0-1 188-1 17-1 0·81 0·110 o-o Maotard ell, raw .. .. •·• 1tl7·1 110·7 0·11 0·05 o-o ......... oil, mtne4 .. .. O·l 187·1 IH 0·01 o-os 0·0
,_oil, raw .. .. u 186-1 IH 0·31 0·15 0·0
·--oil. mtaod .. .. •• .... . ... 0·111 0·10 o-o Cott011 .-1 oil, raw .. .. 0·1 1111·6 . 15·1 0·111 0·11 o-o Cotto& .-1 oD, ldne4 .. .. 0·1 1110·1 15-1 'O·lf. 0·10 o-o c-• oil. raw ... .. 1 .. UN' f-11 1·81 15·80 H
c-t.U.nl ... .. . . G-1 hl-1 ... 1-70 tHO 1 ..
JleAuoll, raw .. .. ., .. l21·ne 111'1·1 ... 1·50 1·10 ... ' ··""·oil. ftlaod
.. .. I· I 1118-1 17·1 1·60 1-!0 ... 'Dalda 'I .. .. 0·1 JM·• .... 0-ol 0·0 o-o 'Dalila' n 19 .. 0·1 18&-'1 8!·0 G-01 o-o
I C)o9
'Dalda'W to-41 11-11 .. 1110-G 11·1 0·10 o-o ... '1'11'11 41...Utr •o. I' to-41 11-10 .. 189-G IN. o-o 0·0 o-o '1...0..' to-41 17 .. liiU 17 .. 0·1 o-o o-o 'ltotap!D' .. II .. 110·1 , .... H 0·0 H
•eowa• t1 II .. 1811-t ... , H •• H .. ._... 17-60 II .. 111!·1 . .. H 0.0 o .. 'T_,.' 61-fl 11 .. 110 .. IH H 0·0 H
'&alba•' u .,_.., •• 189 .. '"' H o-o ... .... .. .. .. 1110 .. ... . •• .1. H
•,... nlaP- ...,. • ....,. ~ 1 •m .... ..,,..,. .. oil obtaiDOd thlllllhe ~ ......... ~ ""· , ........... ~- ,,_
'26
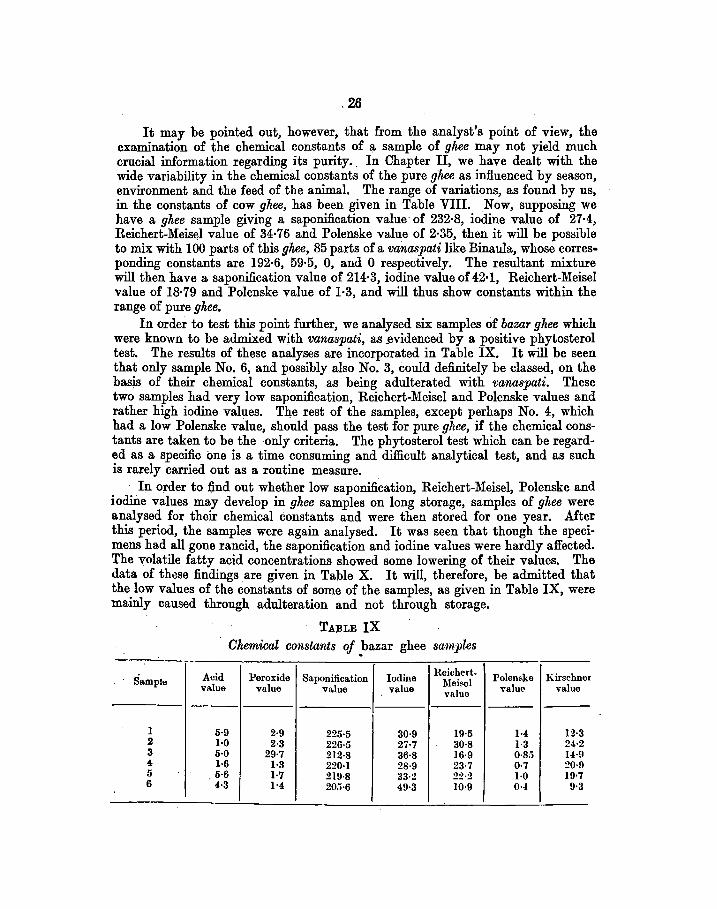
It may be pointed out, however, that from the analyst's point of view, the examination of the chemical constants of a sample of ghee may not yield much crucial information regarding its purity .. In Chapter II, we have dealt with the wide variability in the chemical constants of the pure ghee as influenced by season, environment and the feed of the animal. The range of variations, as found by us, in the constants of cow ghee, has been given in Table VIII. Now, supposing we have a ghee sample giving a saponification value of 232·8, iodine value of 27·4, Reichert-Meisel value of 34·76 and Polenske value of 2·35, then it will be possible to mix with 100 parts of this ghee, 85 parts of a vanaspati like Binaula, whose corres· ponding constants are 192·6, 59·5, 0, and 0 respectively. The resultant mixture will then have a saponification value of 214·3, iodine value of 42·1, Reichert-Meisel value of 18·79 and Polenske value of 1·3, and will thus show constants within the range of pure ghee.
In order to test this point further, we analysed six samples of bazar ghee which were known to be admixed with vanaspati, as _evidenced by a positive phytosterol test. The results of these analyses are incorporated in Table IX. It will be seen that only sample No. 6, and possibly also No. 3, could definitely be classed, on the basj.s of their chemical constants, as being adulterated with vanaspati. These two samples had very low saponification, Reichert-Meisel and Polenske values and rather high iodine values. T4e rest of the samples, except perhaps No. 4, which had a low Polenske value, should pass the test for pure ghee, if the chemical constants are taken to be the only criteria. The phytosterol test which can be regarded as a specific one is a time consuming and difficult analytical test, and as such is rarely carried out as a routine measure.
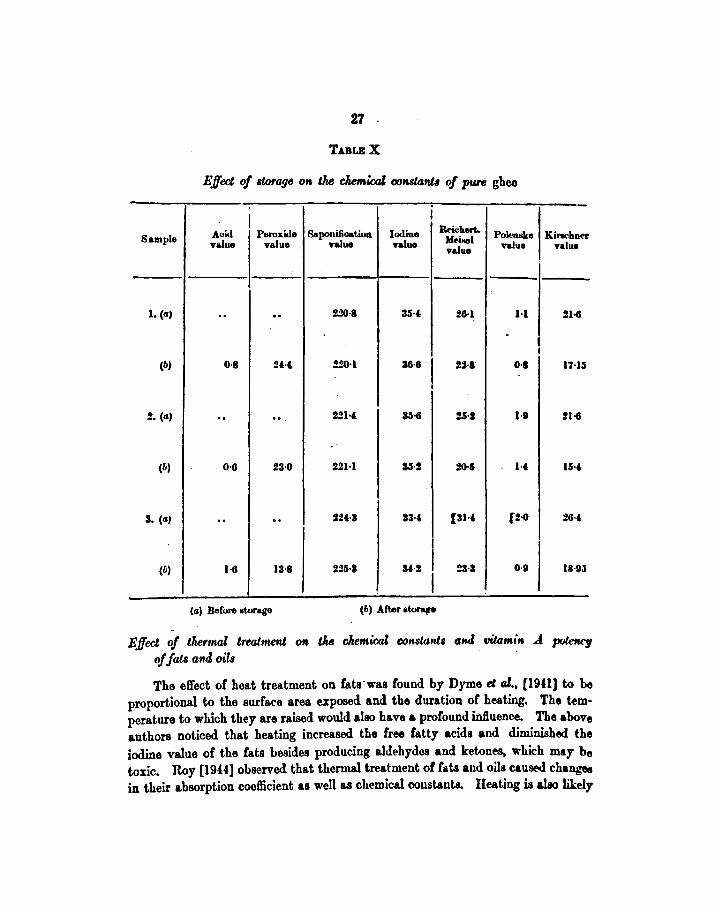
In order to find out whether low saponification, Reichert-Meisel, Polenske and iodine values may develop in ghee samples on long storage, samples of gltee were analysed for their chemical constants and were then stored for one year. After this period, the samples were again analysed. It was seen that though the specimens had all gone rancid, the saponification and iodine values were hardly affected. The volatile fatty acid concentrations showed some lowering of their values. The data of those findings are given in Table X. It will, therefore, be admitted that the low values of the constants of some of the samples, as given in Table IX, were mainly caused through adulteration and not through storage.
TA;BLE IX Chemical constants of _hazar ghee samples
---Sampltl Acid Peroxide Saponification Iodine Reichert- Polenske Kirschner Mei!'el value value value value value value value
----1 5·9 2·9 225·5 30·9 19·5 1·4 12·3 2 1·0 2·3 226·5 27·7 30·8 1·3 24·2 3 5·0 29·7 212·8 36·8 16·9 0·8;) 14·9 4 1·6 1·3 220·1 28·9 23·7 0·7 20·9 5 5·6 1·7 219·8 33·2 22·2 1·0 19•7 6 . 4·3 1•4 205·6 49·3 10·9 0·4 9·3
27 .
TABLE X
Effect of storage oM 1M cliemicaZ constant~ of pure gbeo
I i •
Sample Acid Per01dde Saponification Iodine Re-ichert. Polerulke Ki1"8Chner value value value value M«"iRel value value value
1. (a) .. .. 220·8 3H 26·1 H 21-8
I
(b) 0·8 2H, !20·1 36·6 I 2:!-8" 0·1 17-15
I
2. (a) .. .. 22H 35·6 2S·J l·t 21-6
(b) 0·6 23·0 22H 35·! ~-5 H 15·,
3. (GJ .. .. 221·3 3H (3H [2-6 2H
(b) 1·6 13·8 225-3 31-J 23-3 0·1 18·t.l
I (a} Before storage (P,) After stor&(!e
Effect of tT~-ermol trtalmetll ot~ 1M cliemioal con~tanll and WaMill .J. poletK'y of fats and oila
The effect of heat treatment on fata·was found by Dyme d al., [19-U] to be proportional to the surface area exposed and the duration of heating. The tem· perature to which they are raised would also have a profound inftuenoe. The above authors noticed that heating increased the free fatty acids and diminished the iodine value of the fats besides producing aldehydes and ketones, which may be toxic. Roy [19U] observed that thermal treatment of fats and oils caused changes in their absorption coefficient as well as chemical constants. Heating is also likely
28
to cause loss of vitamin A potency to varying degrees according to the intensity of heating "nd the duration of the process. Kennelly and Quackenbush [19!7] noted that the adverse effects of feeding oxidised-fats could be eliminated by giving vitamins A and E and suggested that the toxic effects were the result of destruction of dietary essentials· rather than a direct toxic _effect due to the oxidation of the fat. · Dyme et al., [1941] have observed that heating in air at 102-105°0. for 24 hours inactivated the vitamin A of cod-liver oil and butter-fat, as was judged by the effect on growth of rats. Karmarker [1944], Ahmed et al., [1946] and De and associates [1946] observed considerable destruction of vit~min A, when gltee was heated or used for frying. The last mentioned workers have also noticed severe losses in carotene on heating margarine fortified with carotene.
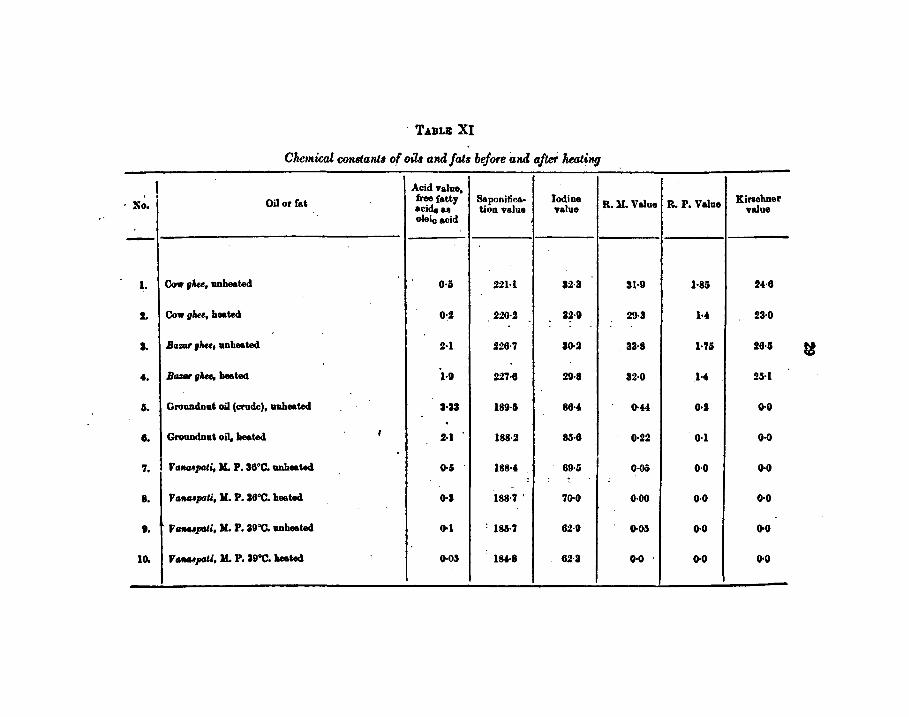
The effect of heating, on the following chemical constants, of cow gltee, bazar gltee, crude groundnut oil and vanaspatis of melting point 36°0. and 39°0. made from groundnut oil, for 30 minutes at 190°0., was determined:
(a) Acid value, (b) saponification value, (c) iodine value, (d) Reichert-Meisel value, (e) Reichert-Polenske value and(/) Kirschner value.
· The losses in carotene and vitamin A suffered by this thermal treatment were also estimated.
The cow gltee tested was a fresh sample prepared in the Institute dairy under standard conditions. The bazar ghee was a composite sample prepared by mixing material sold as.desi ghee in the bazar, obtained from five different shops situated in different parts of Bareilly city, in order to make it more representative. Groundnut oil was prepared by pressing the seeds under our own supervision. The vanaspatis were obtained from the manufacturers. Only one sample 'of each variety of ghee, oil and vanaspati was tested.
Vitamin A was determined by separating the unsaponifiable matter by the method of Olson, Hegsted and Peterson [1939] ; dissolving it in aldehyde-free pure ethyl alcohol and estimating the vitamin A content by a Hilger vitameter. Carotene was determined by the method of Seshan and Sen [1942].
RESULTS AND DISCUSSION
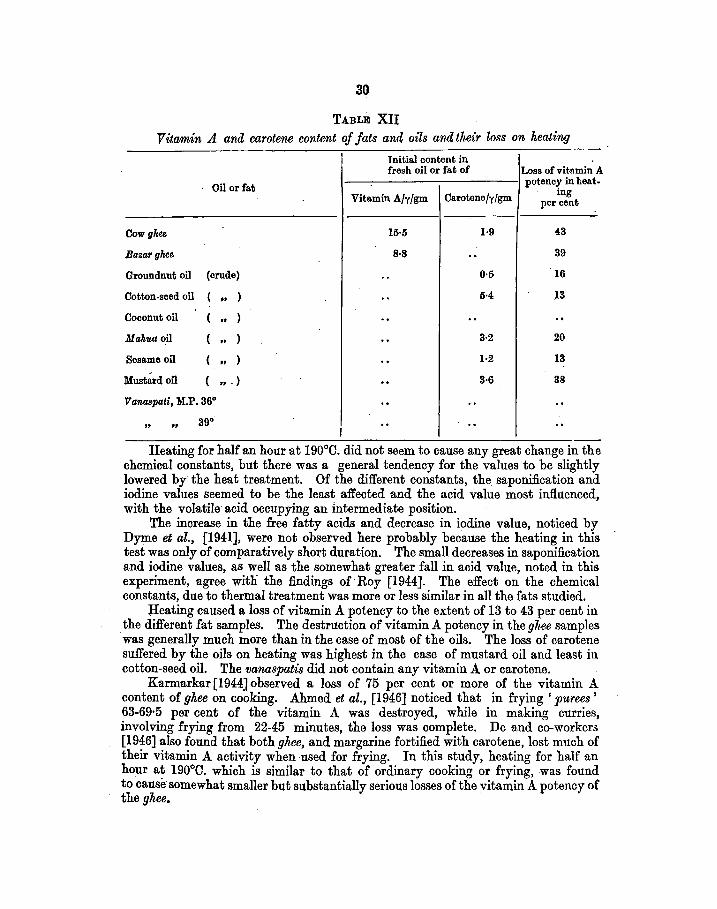
The chemical constants of the different oils and fats, before and after heating, is given in Table XI. The initial vitamin A and carotene content of ghee, vanaspati samples and ·common vegetable oils which had been found to contain some carotene, and the loss in vitamin A potency suffered by them due to thermal treatment, are given in Table XII.
. TA.BLB XI
Chetnical constant~ of oils and fats bejot'e and after heating
I AoidYalue, I
Oil or fa' free fatty Saponiflr.a.- Iodine R. M. Value R. P. Value Kirschner ·No. acideaa tion Yalue Yalue yaJue
oleic acid
-1. Cow pAee, unheated 0·5 221-1 32-3 31·9 1-85 24·6
I. Cow glee, heated 0~2 220·2 82-D 29·3 H 23·0
I. BaZM ghu, unheated 2-1 226·7 30·2 33·8 1-75 26-5
•• Bazer plaee, beatect l·D 227-6 29·8 32·0 H 25-l
6. Groundnat oil (crude), unheated 3·33 189·5 86·4 0·« 0·2 0·0 . •• Groundna' oil, heated I 2·1 188-2 85·6 0·22 0·1 0·0
7. V•-Jldli. x. P. 36•c. unheated 0·5 188·4 69·5 I 0·05 0·0 o-o : :
•• V111UUpall, Jd. P. 3600. heatecl 0·3 188·7 . 70·0 0·00 0·0 0·0
t. J'IIIIIUpdli, X. P. 1900. unheated Ool : 18ll·7 62·D 0.05 0·0 o-o
10. ,_,pat,, x. P. J9"C. beated 0.05 184-8 6%-3 0·0 o-o o-o
30
TABLE XU Vita min A. and carotene content of fats and oils and their loss on heating
Initial content in fresh oil or fat of Loss of vitamin A
Oil or fat potenc.y in heat-
Vitamin A/yfgm Carotenefy/gm mg per cent
Cow gkP...e 15·5 1·9 43
Ba.zarghee 8·8 .. 39
Groundnut oil (crude) .. 0·5 16
Cotton-seed oil ( .. ) .. 5·4 13
Coconut oil ( .. ) .. .. .. Makua oil ( .. ) .. 3·2 20
Sesame oil ( .. ) .. 1·2 13
Must~rd oil ( .. ") .. 3·6 38
Vanaspati, M.P. 36° .. .. .. " "
39° I I .. ..
Heating for half an hour at 190°0. did not seem to cause any great change in the chemical constants, but there was a general tendency for the values to be slightly lowered by the heat treatment. Of the different constants, the saponification and iodine values seemed to be the least affected and the acid value most influenced, with the volatile acid occupying an intermediate position.
The increase in the free fatty acids and decrease in iodine value, noticed by Dyme et al., (1941], were not observed here probably because the heating in this test was only of comparatively short duration. The small decreases in saponification and iodine values, as well as the somewhat greater fall in acid value, noted in this experiment, agree with the findings of Roy [1944]. The effect on the chemical constants, due to thermal treatment was more or less similar in all the fats studied.
l!eating caused a loss of vitamin A potency to the extent of 13 to 43 per cent in the different fat samples. The destruction of vitamin A potency in the ghee samples ·was generally much more than in the case of most of the oils. The loss of carotene suffered by the oils on heating was highest in the case of mustard oil and least in cotton-seed oil. The vanaspatis did not contain any vitamin A or carotene.
Karmarkar (1944] observed a loss of 75 per cent or more of the vitamin A content of ghee on cooking. Ahmed et al., [1946] noticed that in frying 'purees' 63-69·5 per cent of the vitamin A was destroyed, while in making curries, involving frying from 22-45 minutes, the loss was complete. De and co-workers [1946] also found that both ghee, and margarine fortified with carotene, lost much of their vitamin A activity when used for frying. In this study, heating for half an hour at 190°0. which is similar to that of ordinary cooking or frying, was found to cause somewhat smaller but substantially serious losses of the vitamin A potency of the ghee.
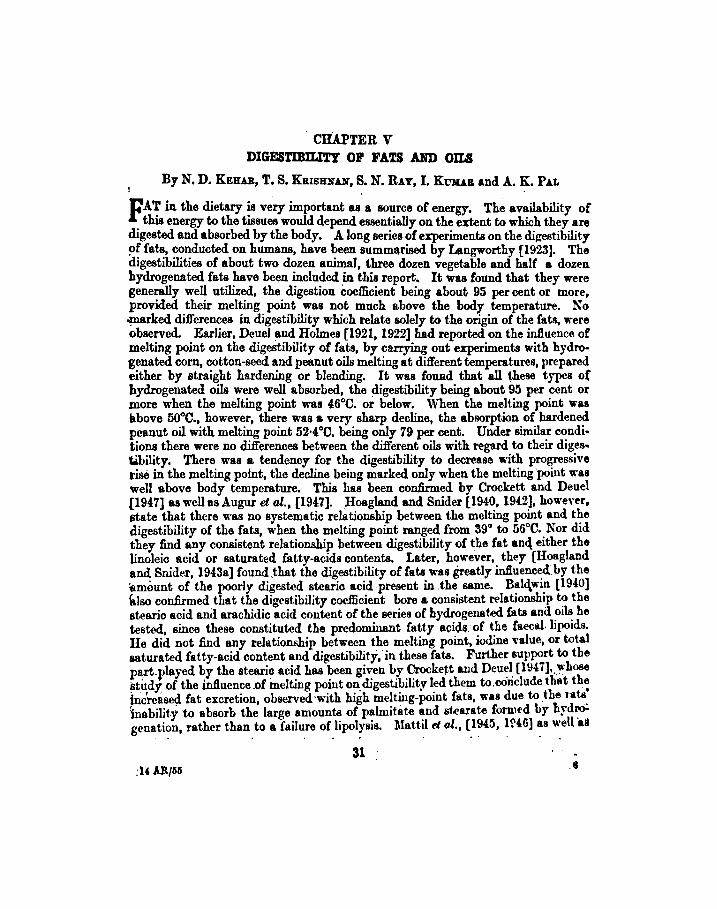
CHAPTER V DIGES'l'IBILI'l'Y OF FA'l'S AND OILS
By N, D. KEHAB, T. S. KaiSHNA.N, S. N. R.&Y, I. Kmu.a and A. K. PA.L
fAT in the dietary is very important as a source of energy. The availability of . this energy to the tissues would depend essentially on the extent to which they are
digested and absorbed by the body. A long series of erperiments on the digestibility ~f fats, conducted on humans, have been summarised by Langworthy [1923]. The digestibilities of about two dozen anima), three dozen vegetable and half a dozen hydrogenated fats have been included _in this report, It was found that they were generally well utilized, the digestion coefficient being about 95 per cent or more, provided their melting point was not much above the body temperature. No ·~arked differences in digestibility which relate solely to the origin of the fats, were observed. Earlier, Deuel and Holmes [1921, 1922] had reported on the influence of melting point on the digestibility of fats, by carrying out experiments with hydro· gena ted corn, cotton-seed and peanut oils melting at different temperatures, prepared either by straight hardening or blending. It was found that all these types of hydrogenated oils were well absorbed, the digestibility being about 95 per cent or more when the melting point was •6°C. or below. When the melting point was above 50°C., however, there was a very sharp decline, the absorption of hardened peanut oil with melting point 52·4°C. being only 79 per cent. Under similar condi· tions there were no differences between the different oils with regard to their diges. t.lbility. There was a tendency for the digestibility to decrease with progressive rise in the melting point, the decline being marked only when the melting point was well above body temperature. This has been conD.rmed by Crockett and Deuel {1947] as well as Augur et al., [1947]. Hoagland and Snider [1940, 1942], however, state that there was no systematic relationship between the melting point and the digestibility of the fats, when the melting point ranged from 39° to 56°C. Nor did they find any consistent relationship between digestibility of the fat an<{ either the linoleic acid or saturated fatty-acids contents. Later, however, they [Hoagland and Snider, 1943a] found .that the digestibility of fats was greatly influenced by the :amount of the poorly digested stearic. acid. present in .the same. Bal~w~ [1940] ~lso confirmed that the digestibility coefficient bore a consistent relationship~ the stearic acid and arachidic acid content of the series of hydrogenated fats and 01ls he tested, since these constituted the predominant fatty acid~. of the faecal.lipoids. He did not find any relationship between the melting point, iodine nlue, or total aaturated fatty-acid content and digestibility, in these fats. Further support to the p~~:rt.played ~y the steari~ aci~ has ~een gi':en b! .c:rockett a1;1d Deu~l. (1947] •.. \\'hose study: of the influence .of meltmg pomt on_digestib1lity led them to.conclude that th~ increased fat excretion observed ·with high melting-point fats, was due to _the raU!l inability to absorb th~ large amounts of palmitate and stearate fom1ed by hyd~ genation, rather than to a failure of lipolysis. l\Iattil d al., [1945, 1N6] as well u
. . . . ..
31 :14 AR/55 ••
Norris and Matti! [1946] have also studied this subject and demonstrated that stearic acid was very much unabsorbable, although better utilized when fed as a mixed triglyceride than as a tristearin mixed with triolein. It was suggested that this might be due to inter-esterification of glycerides during digestion. Mattil [1947] after a careful analysis of the published data, concludes that "the primary factor which limits the digestibility of fats is without doubt the amount of solid fatty acids present and the degree of limitation increases with chain length." He also showed that a positive co-relation existed between the digestion of fats found in human adults and those of corresponding fats observed in albino rats.
Most of these experiments on the digestibility of different fats and oils by foreign workers were carried out on a basal ration containing abundant quantities of vitamins. Since dietary surveys in India had shown that the food ingested by the majority of the population, viz. the poorer classes, was sub-adequate in essential nutritive factors particularly vitamin A, it was decided to carry out digestibility tests with different oils and fats to find out whether they showed any variation when added to a basal ration sub-optimum in vitamin A.
Experiments were carried out with adult male rats to find out the digestibility -coefficient of the cow ghee, buffalo ghee, lard, seven brands of vanaspatis as well as ,groundnut, sesftme, mustard, cotton-seed, mahua and coconut oils. The raw and refined samples of each of the oils were studied separately. Four to six adult male rats, weighing about 300 gm. each, were selected from the stock colony and housed in individual cages, made of 3/16 inch mesh wire netting and of the usual cylindrical pattern. The floor of the cage was about two inches above the ground level and was made of wire grid, with the strands half inch apart, to enable the faeces an.Q urine to pass through, immediately they were voided. Each cage was placed in a galvanised iron tray, in which it fitted loosely. During experimental periods when quantitative faeces collection W~J,s made, the tray was lined with filter paper. Fresh water was provided in self-feeding bottles fixed to the top of the cage. The food was given in small glazed earthenware cups, which were cleaned every day. The animals were at first put on the following fat-free ration:
Dextrinised starch Cas~in (extracted) 1least (extracted) Salt mixture* . * (MoCollum et al., 1916)
Total
64 I 24 JPlus 5 y of ~-carotene 8 plus 10 I.U. of vitamin D 4 per rat per day.
100
The rats were maintained on this ration for eight days to completely elimiuate the effects of the previous diet. They were fed atllib throughout. All the animals ware ~eighed tw~ce every week during the preliminary period and daily during the ~xperl.IIlental period.
At the end Of this preliminary period, a diaestion experime'.lt wtts carried out for eight days, in two periods of four days each~ with each of these rats. During this period of experiment, the exact food consumption was determined and the
whole of the faeces excreted wa8 quantitatively collected. The daily excretion of faeces was ~erred to small conical flasks containing some absolute alcohol, one for each rat, till the four days were over. The second four days collection was also· made similarly and stored in separate flasks. The fat content of the faeces was determined in each of the samples and the average endogenous excretion was deduced for each rat.
The fat in the faeces was extracted by a modi1ication of the method of Boyd (1933]. The faeces was ground up thoroughly with pure sand and 3:1 alcohol-ether . (JJ?-ade f~m ~urifi.~ alcohol and et~er) and the fat completely extracted by repeated trituration With this solvent, warmmg on a water bath to help the extraction. The extract was then filtered into a flask, the solvent evaporated off under reduced pre~ure and dried in a vacuum desiccator. The residue in the flask was next taken up with pure chlorolorm, filtered into a tared flask, the chloroform evaporated off and the fat estimated by drying to constant weight. ·
.After the coilection period of eight days was over, the animals were switched on to the following diet : ·
Dextrinised starch • Casein (extracted) ·• Yeast (extracted) Salt mixture • • Experimental fat or oii
Total •
• 59 } 24: Plw 5y o£ ~-carotene plua 10 8 l.U. of vitamin D per rat 4: per day. 5
100
The oils and fats, digestibilities of which were to be determined, were tested :one after another. When cow g'hee formed the dietary fat, the vitamin A intake of the rats was equated to that of the oil or VtJnaspati groups.· In these digestibility experiments a preliminary period of four days was allowed which was followed by an experimental period of eight days, divided into two periods of four days each, exactly as on the fat-free diet. The estimation of the food consumption, faeces -collection as well as the determination of their fat content was carried out as before.
The digestibility coefficient of the fat was determined after correcting for their endogenous fat excretion, with each individual animal, in both periods and the average of all the eight to twelve figures was taken as the digestibility of the fat or oil.
RESULTS AND DISCUSSION
A consolidated summary of all the digestibility figures of the different fats and <>ils is given in Table XUI. It would ba noticed from the same that ~ o! them we~e digested practically completely and to about an equal extent. A statistical analyS18 reveals, however, that the digestibility ooeffici~ts of Dalda only, ~?ng the vanaspatia and raw and refined cotton-seed oils, show figures &.,<Ttlifi.cantly lower than g'hee or most of the other fats and oils. .The dig~ti~ility coefficie~ts of raw coconut oil, refined ti& oil and raw mustard oil were significantly superior to
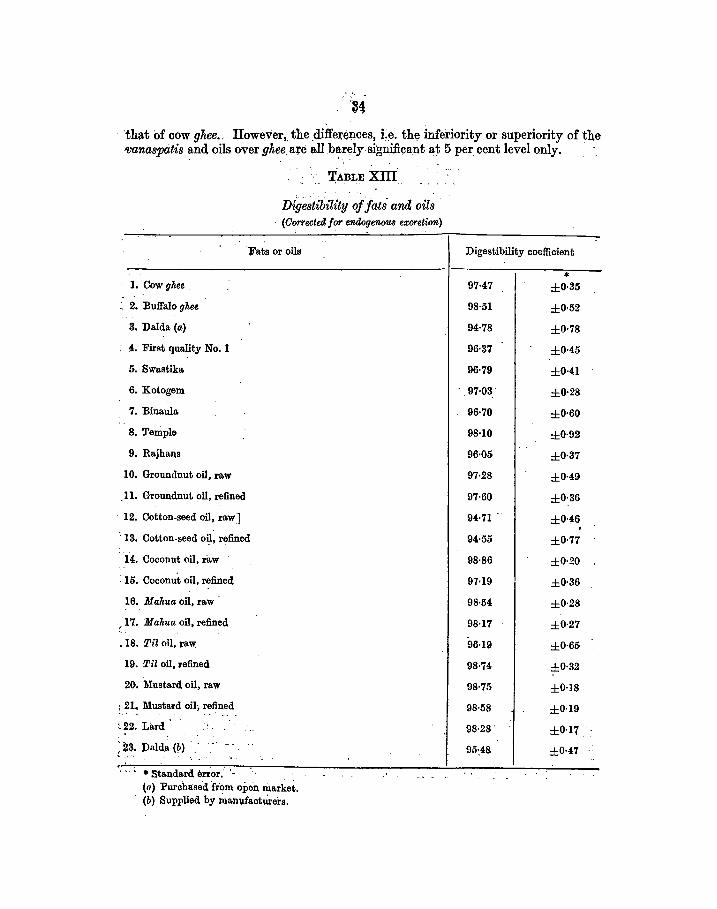
"thllt of cow ghee.: liowe.v~r, the _differeiJ,ces, i.e. the inferiority or superiority of the 'Vanaspatis and oils over ghee a:re all barely significant at 5 per cent level only.
- ' -
1. Cow ghee
2. Buffalo ghee
3. Dalda (a)
· 4. First quality No. 1
5. Swastika
6. Kotogem
7. Binaula.
8. Temple
9. Rajhans
10. Groundnut oil, raw
_11. Groundnut oil, refined
· 12. Cotton-seed oil, raw]
'fAilLE XIII
Dige~tibility offats- and oils - (Corrected for endogenom excretion)
Fats or oils
13. Cotton-seed oil, refined
14. Cocon_ut oil, raw
: 15. Coconut oil, refined
16. Malw.a oil, raw
~ 17. Mahua oil, refined
.18. TiZ oil, raw
19. TiZ oil, refined
20. Mustard oil, raw
: 21. Mustard oil, refined
c22. -Lard --.
;~~· Palda@
'f, ~. ~ *Standard enor.- '-(a) Purchased from open market. (b) Supplied by man11fa.otnrers.
Digestibility coefficient
* 97-47 ±0·35
98·51 ±0·52
94·78 ±0·78
96·37 ±0·45
96·79 ±0·41
97·03' ±0·28
96·70 ±0·60
98·10 ±0·92
96·05 ±0·37
97·28 ±o-49
97·60 ±0·36
94·71 ±0·46 , 94·55 ±0·77
98·86 ±0·20
97-19 ±0·36
98·54 ±0·28
98·17 ±0·27
96·19 ±0·65
98·74 ±0·32
98·75 ±0·18
98·58 ±0·19
98·28. ±0·17
95:48 ±0·47
· It woUld hA r.lear from the data given abOve that there was no material difference o~ an~ great ~~ctical si~can~ between the digestibilities of cow gh.ee, vegetable ()ils, ."a~pat" and lard.. In oils also· there was no indication of any coD,~;istent ):elattonsh~p between re~ or hydrogenation .and digestibility. These digestibilit_y -data are m agreement w1th the results obtamed by foreign workers. Basu and ~1!-~h [1946], who carried .out digestibility:· trials with men, obtained values very similar to those observed with the rats. in this experiment, for ~U fats other than hydrogenated groundnut oil. In their case the digestibility of grolindnut oil decreased from 99·0 to 89·8 per cent when it. was hydrogenated. Hence, they surmised that hydrogenation led to the lowering of the digestibility of the oil to some extent. A similar though much less lowering was seen in this series of experiments when the figures for raw or refined groundnut oil were compared with those of Dalda. As against the above fbdinga Misra and Patwardhan [1948] could not con1irm the same, as they found tha~ hydrogenation had no effect on the digestibility of groundnut · oil when the melting point of the hardened product ranged from 29·5"C. to 49"C. Even the presence of 9 and 18 per cent of iso-oleio acid did no~ seem to have any effect on the digestibility of the oil, aocording to them. Nhavi and Patwardhan [1946] also noticed that hydrogenation had little or no in1luence on the rate of absorption of the fat. Dutt [1945], however, stated that the utilization of the fatty acid! of hydrogenated fat was about 3 per cent less than that of the butter-fat. Basu and Nath [1946] did not find any material differences in digestibility between butter-fat and the natural vegetable oils.
Deuel, Cheng and Morehouse.(1948] noticed that crude rape-seed oil gave a comparatively low digestibility of 77 per cent, which was raised to 82 per cent on refining. They remarked that this oil had the lowest digestibility of any fat, liquid at ordinary temperature, which had been investigated in rats. However, in a later paper from the same laboratory, it was found that rape-seed o.il had a digestibility coefficient of 99 per cent, when human beings were w;ed as subjects [Deuel el al., 1949]. This value is practically identical with that found by us in rats. Basu and Nath [1946] obtained a value of 94·1 per cent as the digestibility of mustard oil, which is very similar to 98·8 per cent found in this experiment. Refining made .no change in the above figure in the present study. Basu and Nath carried out their experiments on men but their .figures tally well with the pr~nt results obtained on rats. The digestibility values obtained by Deue~ et al., (~. ctt.), though also carried out on rats were however much lower. In this connection the observation of Bhalerao et al.: [1947], that th~ugh vegetable oils generally ~ve an absorption rate not significantly different from that of butter-fat, mustard o1l gave a much lower value, may be of help. But Bs.su and Nath [194~a] w.ho studied the absorption rates of different oils and fats, found that though olive oil and butter-fat s~owed better rates. of absorption at the end of two ho~, mustard showed t~e maDlllum rate after four hours, and after six hours all the oils behaved nearly alike.
In view of this conflict of findings here, it would be difficult ~o. expla~ th~ difference without further study. It is possible, however, that the ~ngm and ~sto!:V of the crude rape-seed oil used by Deuel et al .• (loo. cit.) had. som~thing to do With .ata poor digestibility, because on re.frning it showed an appreca~bl(\ unproveruent wh10h had not been noticed in this study, where the effeut of re1in.ing had not been found
UAR/65 8
36
to show any consistent or significant effect on the digestibility of six different crude oils.
It would, therefore, appear from the above data, that all the fats tested were digested nearly completely and to about an equal extent, showing no great marked difference in this respect between cow and buffalo ghee, vegetable oils, vanaspatis and lard. Neither refining nor hydrogenation, as studied in this experiment, seemed to have any significant influence on the digestibility of the oil.
CHAPTER VI
Part I GROWTH PROMOTING VALUE OF FATS AND OILS WHEN INCORPORATED
IN A SYNTHETIC DmT
By N.D. KEDAR, T. S. KRISHNAN, S. N. RAY, I. KUMAR, B. C. JosHI, A. K. Pu, K. SAHAI and R. CHANDA.
IN. the previous chapter, it has been shown that as compared with g~ the vegetable oils and their hydrogenated products (tJanaspatis), generally have
more or less similar digestibility. A study of their chemical constants and composition indicates that the only important difference between gke6 and other fats is the Lick of vitamin A in any appreciable quantity in the latter. In this chai.ter, an attempt has been made to study whether vanaspatil and vegetable oils, when incorporated in a synthetic diet have the same effect as gke6 on the growth of young rats, taking care to equalise the vitamin A content of the different fat rations. This has been done as there is a wide-spread belief in this country that vanaspaH& are injurious to health. Even among research workers, as seen in Chapter I, _there is considerable difference of opinion on_ the comparative nutritive value of animal and vegetable fats, particularly of butter-fat (ghe.6) as compared to the common vegetable oils, both in the natural and hydrogenated form.
In one important respect, however,· our experiments differ from the foreign studies. Practically in all the investigations referred to in Chapter I, the diets were adequate in all the essential nutritive factors. like proteins, minerals, vitamins, etc. However, dietary surveys in this country have shown that the poorer classes, who form the bulk of the population, generally subsist on a sub-adequate diet and unleBB this fact is taken into consideration in planning the experiments, the results will have little practical value. Further, experiments in this laboratory and elsewhere have shown that the bad effects of a deficient diet may not often be apparent in the first generation but might manifest themselves more clearly in the second and subsequent generations. After taking into consideration the above factors, a synthetic diet sub-optimum in vitamin A was used as the basal ration and the study was extended over three generations of rats, which were used. as experimental animals, except in Experiment II, where the investigation was carried out over one generation only.
Experiment I. Ghee versus vana.spatis Weanling rats, similar in weight and all aged four weeks, were removed from
our stock colony and were divided into ten groups. Each group contained four males and six female rats. The fats cow gT~. buffalo gkee, three brands of hydro· gena ted groundnut oil, viz. 'Dalda ', •First quality No. 1 ', 'Swastika', three brands of hydrogenated cotton-seed oil, viz. 1 Kotogem ', 1 Cotex ' and 1 Binaula ', and two brands of hydrogenat.ed sesame oil, viz. 'Temple.' and 'Rajhans' "ere ~xamined. The hydrogenated fats were purchased from the open market in
37 HAR/M JO
38
April 1944 and again in April1945, whereas, the ghee samples were supplied by the Director, Dairy Research Institute, Bangalore, in three lots; the ~rst lot being supplied in Apri11944, the second in November 1944 and the third m September 1945. The basal ration, hereafter called' Diet A', used during the first six weeks of experiments was composed of cane sugar-62 parts, casein (alcohol and ether extracted)-24 parts, mineral mixture (McCollum, et al., 1916]-4 parts, and yeast (petroleum ether extracted}-5 parts. Ghee or vanaspatis were added to this diet at the rate of 5 per cent. In addition, 5 micrograms of caroten~ and 1 microgram of calciferol were given to vanaspati-fed rats and smaller amount of carotene supplement to rats of Ghee groups, so that the quantity of vitamin A received by them wa~ of the same order (i.e. 8-9 I. U. daily} as that received by the vanaspati-fed animals.
In, a preliminary experiment, the growth obtained on such a diet wa~ rather poor and was traced later to the poor quality of yeast at our disposal. The diet was, therefore, slightly modified by administering 10 mi. of skim milk per rat per day ~v hen the growth became satisfactory though not as good as that of rats in our stock colony. As our stock colony animals receive fresh greens and liver regularly, it is possible that the poorer growth rate of rats on the modified Diet A wa~ caused by a lack of sufficient vitamins and perhaps other factors as well. The importance of the use of this sub-optimum diet will be disuussed later. ·
From the seventh week onwards, i.e. from ten weeks of age until they were discarded, the rats were shifted to a cereal diet (Diet B) having a composition of maize-66 parts, whole wheat flour-22 parts, crude casein-9 parts, yeast -2 parts, NaCl-0·5 part and CaC03-0·5 part. Ninety-five parts of this diet were mixed with 5 parts of ghee or vanaspati, each group receiving the same fat it was getting during the previous period. In addition, each .rat in all the groups received daily 10 ml. of skim milk and 5 g. of fresh greens, usually lucerne or berseem.
The change over to Diet B was used for two "purposes. Firstly; our main objeGt in undertaking this work was to investigate whether the inclusion of vanaspatis daily in natural diet continuously over three generations would have any bad effect. The. Diet B represents a good vegetarian diet, containing abundant quantities of vitamins and minerals. The first six weeks of the synthetic diet regime was intended to give some quantitative idea about the comparative nutritive values of the different vanq,spatis with regard to each other as. well as to ghee. Secondly, as already men.tioned, the Diet A was a sub-optimal feed containing barely sufficient vitamin A and probably slightly deficient in certain B-vitamins. The switch over to an abundant diet helped us to examine whether the supply of excess of vitamins and of possibly other factors was helpful in dietaries containing hydrogenated fats. . ·
As soon as the animals were four months of age the females of each group were !fiB ted with the males of the same group, i.e. receiving the same fat. The reproductiv~ and lactating capabilities 'of the different groups of rats will be dealt in a later chapter.
From the litters thus born in each group, the heaviest member of each litter of the same group was selected (six males and six females beina thus selected) and kept on Diet A plus the respective fats their parents were rec~iving. The experime~tal proc~dure followed was the same as before, and in the third generation offs;prm~s obtamed were a,lso treated exactl,r as in the first geneJ.'3,tion. In this way

39.
the continuous eft'ect of feeding each fat through three complete generations was observed. The average gains in weight during experiment of the rats in the different groups and different generations are shown in Table XIV.
. It w~ll be noticed .that the growth ra~ of the rats on the Diet A and vanaspatis (I.e, durmg the first SIX weeks after weanmg) was slower than those on the same diet plus cow or buffalo ghee.· The effect was more pronounced in the male rats and the rates were significantly lower in the second and third generations. A statistical analysis carried out on the weekly growth rates of the rats fed on the different fats (Table XV) reveals that in the first generation the fats do not differ significantly between themselves in respect of promotion of growth. In the second generation, however, the male and female rats of the cow and buffalo ghee groups were found to exhibit growth rates significantly greater than those obtained for all the oonaspatis. Among
· the vanaspatis, the rats getting' Kotogem ' showed a significantly lower growth rate than most of the other hydrogenated fats. In the third generation, the rats of the vanaspati groups showed slightly better growth rates than those of the corresponding groups in the second generation, whereas the ghee-fed rats exhibited similar rates in both the generations. In spite of this, the growth of the male rats in mol!t vf vanaspati groups was signiJicantly lower than that of the ghee groups. The only exceptions were the male rats receiving 'Cotex ' and ' Temple • brands of tianaspatis, the difference between whose growth rates and those of the cow or buffalo ghee groups were not satistically significant. The female rats of this generation, however, grew equally. well, irrespective of receiving ghee or any of the oonaspatis. The signiJicance · of these differences in the third generation as compared to the results of the sooond generation, was perhaps due to the use of fresh and better type of yeast, the previous stock used in the first and second generations having been used up. However, the analysis on the comparative growth rates of male and female rats taken together shows that the' Rajhans ', • Dalda •, 'Binaula' and' First quality' group1 of rats grew at significantly lower rates than the rats of the ghu group.
When the results of the male and female rats of all the three generations were pooled together, it was observed that the cow and buffalo ghee groups did not differ signiJicantly, whereas all the oonaspati groups were found to yield growth rates significantly lower. Among the vanaspalis, • Kotogem' gave the lowest gro~h rate, which was signiJicantly lower than that given by a number of other vanaspall$. These statistical results are given in a precise form in Table XV.
It may be observed from Table XVI that, as soon as the rats were put on Diet B (adequate diet), the vanaspati-fed rats made very rapid gains, ":n~ their weigh~s at the end of ten weeks were very nearly the same as of those rece1vmg g~N. Th~ shows that the vanaspatis by themselves are probably not harmful, but that t~e1r nutritive effects are dependent to a great extent on the. ~ture of t~e basal ratton used. That the growth inhibiting property of vanaspalts ts absent man adequ~te diet was further brought out in another experiment. Rats of the S('f)oM: generah?n from the various gTwe and van.aspati groups were put directly a!'ter weanmg on pte t B plus ghe~ or t>anaspati at 10 per cent level ; the rats in the vanous groups recetvmg the same fats their parents \':ere getting. Two male an~ tw~ female rats we~ used in each group. Five grams of greens and 10 11!-l. of sk1m m1lk ~ere. also g!_w~ to each animal daily. The growth rates of the nnous groups are g1ven m Table X\ 11.
10•
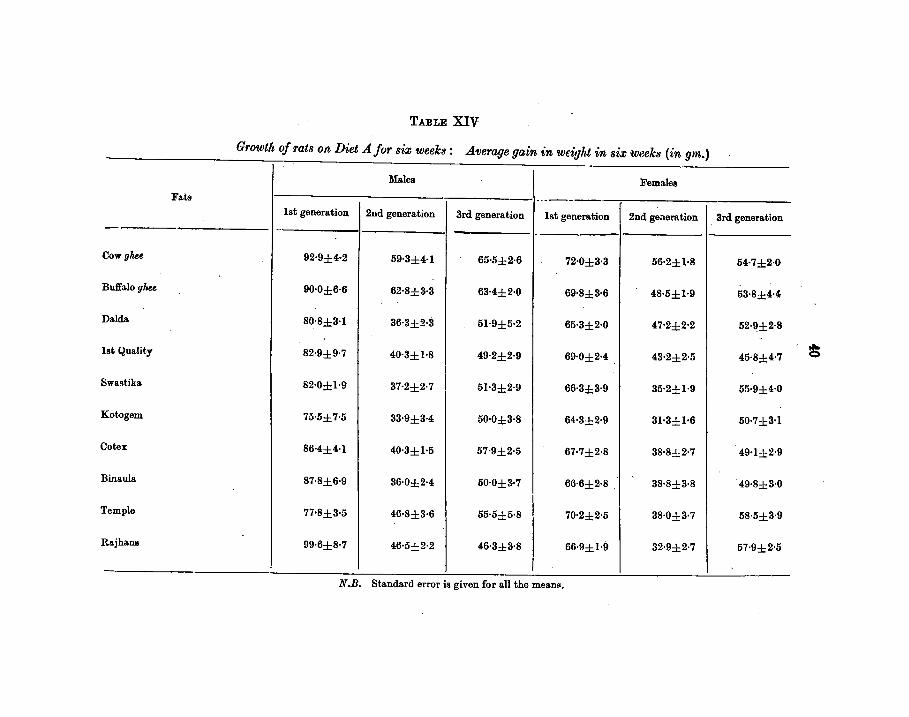
TABLE XIV
Growtft of rats on Diet A for six weeks: Average gain in weight in six weeks (in gm.)
Males Females Fats .. _____
r 1st generation 2nd generation 3rd generation 1st generation I 2nd geaera.tion 3rd generation
c ow ghet 92·9±4·2 59·3±4·1 65·5±2·6 72·0±3·3 56·2±1·8 54·7±2·0
B uffalo ghu 90·0±6·6 62·8±3·3 63-4±2·0 69·8±3·6 48·5±1·9 53-8±4-4
D aida 80·8±3-1 36·3±2·3 51·9±5·2 65·3±2·0 47·2±2·2 52·~±2·8 -
1 st Quality 82·9±9·7 40·3±1·8 49·2±2·9 69·0±2·4 43·2±2·5 45·8±4-7
s wa~tika 82·0±1·9 37·2±2·7 I 51·3±2·9 66·3±3·9 35·2±1·9 55·9±4·0
K otogem 75·5±7·5 33·9±3-4 50·0±3·8 64-3±2·9 31·3±1-6 5M±3-l
c otex 86·4±4·1 40·3±1·5 57·9±2·5 67·7±2·8 38·8±2·7 49·1±2·9
B inaula 87-8±6·9 36·0±2·4 50·0±3·7 66·6±2·8. 38·8±3·8 49·8±3·0
T emple 77·8±3·5 46·8±3·6 55·5±5·8 70·2±2·5 38·0±3·7 58·5±3·9
Raj hans 99·6±8·7 46·5±2·2 46·3±3·8 66·9±1·9 32·9±2·7 57·9±2·5
N.B. Standard error is given for all the mean~.
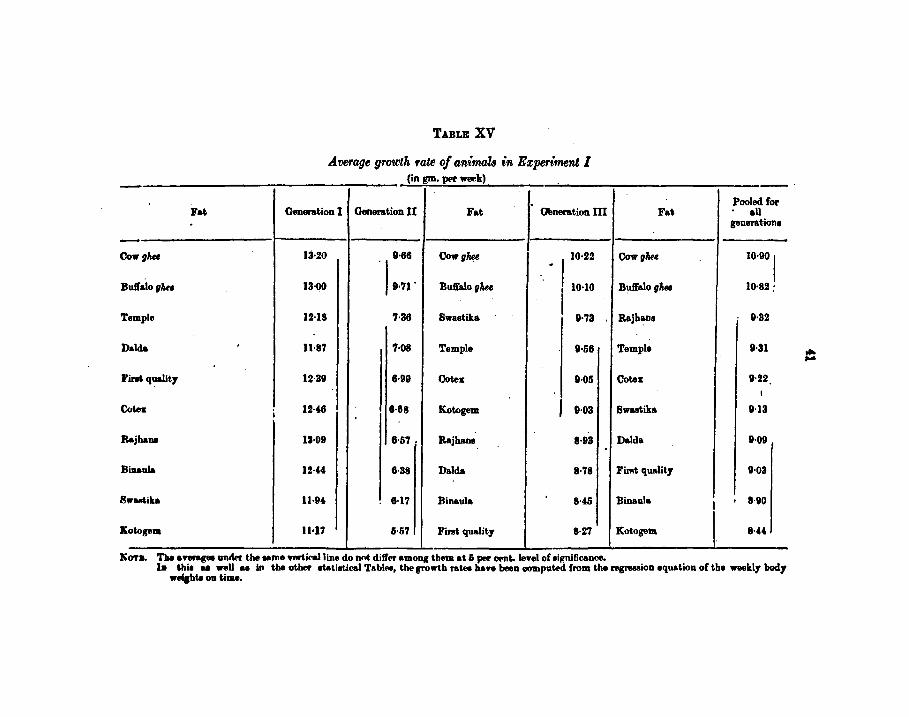
Fat .
gila
B utfaloglaa
T emple
Dal da '
F im qualit7
i
jhau
B inaula
8 wutika
otogem
TABLE XV
Average growth rate of animals in Experiment I (in gm. pl'1' week)
. Generation I Generation II Fat Ol!neration m
13-20 11·66 Cowghee 10·22
. ,11·71'
. , .... 13·00 Butralo gila
12-18 7·36 Swaatika 11·'73
11-87 7·08 Temple 11·56
12-39 6·99 OotelE 0·05
1H6 8·68 Kotogem I 0·03
13·09 8·57' Rajhana 8·113
1H4 8·38 Dalda 8·78
lH" 6·17 Binaula 8-45
llol7 6·57 Fint qualit1 8·27
Pooled for Fat aU
genera tiona
Cow ghee 10·90 I Butraloghee 10·82:
Rajhana 11·32
Temple 11·81
Cotn 11·22
' Swaatika 11·13
Dalda 11·09
FirAt qualit7 11·03
Binaula I . 8-90
Kotogem I. 8-44
ltiOTL Tbe ayerage. under the tame Yerticalline do not differ among them at 6 per tlf11t. lenl of eignlficance. In tbil ae well ae lrt the other etatistical TAbiN, the growth ratee haYI been oomputed from the regreaion equation of the weekl1 bod1
welthte on time.
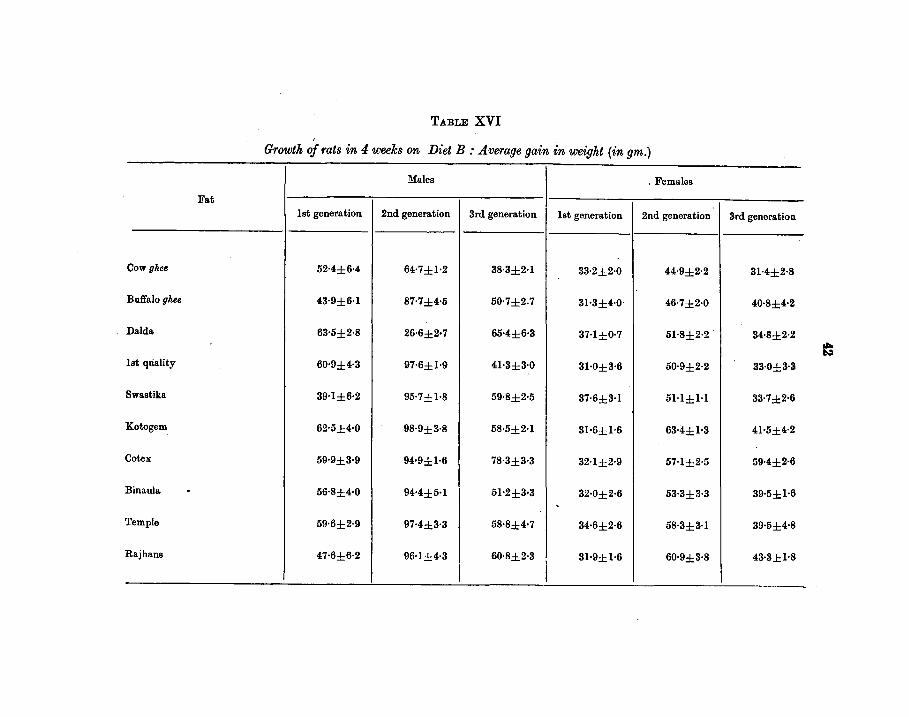
Fat
Cow ghee
Buffalo ght-e
Dalda
1st quality
Swastika
Kotogem
Cotex
Binaula. .
Temple
Raj hans
TABLE XVI I
Growth of rats in 4 weeks on Diet B: Average gain in weight (in gm.)
Males
I . Females
1st generation 2nd generation 3rd generation 1st generation 2nd generation
52·4±6·4 64·7±1-2 38·3±2·1 33·2±2·0 44·9±2·2
43·9±6·1 87·7±4·5 50·7±2.7 31·3±4·0· 46·7±2·0
63-5±2·8 26·6±2·7 65-4±6·3 37-1±0·7 51·8±2·2
60·0±4-3 97-6±1·9 41·3±3·0 31·0±3·6 50·9±2·2
39·1±6·2 95·7±1-8 59·8±2·5 37-6±3·1 51-l±H
62-5±4·0 98·9±3·8 58·5±2·1 31-6±1·6 63-4±1·3
59·9±3·9 94·9±1·6 78·3±3·3 32·1±2·9 57·1±2·5
56·8±4•0 94-4±5-1 51·2±3·3 32·0±2·6 53·3±3·3 '
59·6±2·9 97-4±3·3 58·8±4·7 34-6±2·6 58·3±3-1
47·6±6·2 96·1±4·3 60·8±2·3
I 31·9±1·6 60•9±3·8
I
3rd generation
31-4±2·8
40·8±4·2
34-8±2·2
33·0±3·3
33·7±2·6
41-5±4·2
59-4±2·6
39·5±1·6
39·5±4-8
43·3±1·8
... N
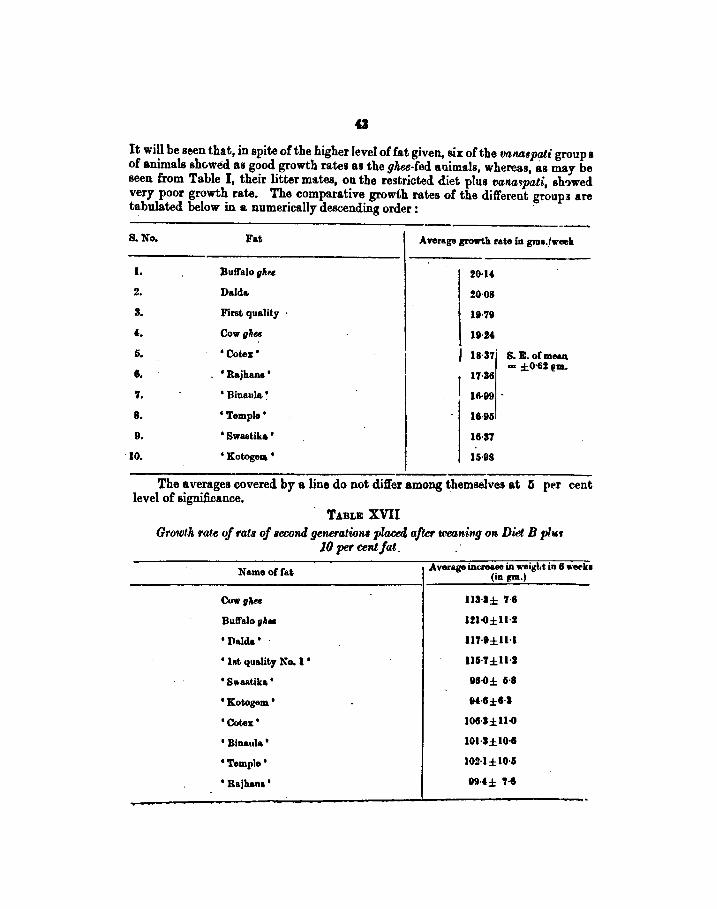
It will be seen that, in spite of the higher level of fat given, six of the vanmpati group a of animals shc.wed as good growth rates as the ghee-fed animals, whereas, as may be seen from Table I, their litter mates, on the restricted diet ph111 vanmpati, sb?wed very poor growth rate. The comparative growth rates of the different groupJ are tabulated below in a numerically descending order: ·
8. No. Fat Average growth rate in gm•.fweek
1. Buft'alogkee
I 20·U
%. Dalda 20·08
3. First quality · I 111-'79
'· Cowgku 19·2'
6. • Cote~t. I 18-37 S.E.oht68A - ;i0-62 (!ID.
6. • Rajhans' 17·36
7. • Binaula • 16·99 .
8. 'Temple' 16·95
9. • Swaetika' 16·37
10. 'Kotoge• • 15·98
The averages covered by a line do not differ among themselves at 5 per cent level of significance.
T.&BLE XVII Growth rate of rats of second generations plaoetl after weaning olt Did B pTr~r
Name of fat
CowgAu
Buft'aloglt•
• Dalda •
• ht quality No. l •
• 8\t&Rtika •
• Kotogem •
'Binaula'
'Temple'
• Rajhan1'
10 per cent fat. :
Average incre&~~~~ in -igl.t in 6 •-kl (in gm.)
113-l:i 7-6
1!1-G:ill-J
117-t:ill-1
115-7±11-1
96-G:i 6·8
9f-1±6·1
106·1±11.0
101-S;ilG·I
IOH;i10·6
9\H:i , .•

. 44'
These results, together with the data obtained in the investigation discussed before as well as those carried out afterwards, show that the poor growth rate of the rats receiving vanaspatis always improved whenever they were shifted from a suboptimum to a liberal diet. After four to five weeks on the liberal diet, their final weights were generally nearly equal to the ghee-fed rats. Thus, it would be seen that hydrogenated vegetable oils, when added to a diet, sub-optimum particularly in Vitamin A and possibly also in other factors, retarded the growth rate of young animals in the second and subsequent generations.
The animals of all the groups maintained good health in general. Though extensive alopecia was seen especially in the second generation in all the vanaspati groups, the animals of the ghee groups were not affected. The alopecia disappeared soon after the rats were put on Diet B.
Experiment II. Heated ghee versus heated vanaspatis.
As·ghees.and vanaspatis.are generally used as frying media and the heated fats form a large percentage of the total fat ingested, it was decided to find out also the comparative nutritive values of heated ghees and vanaspatis. A perusal of the available literature showed that Beck and Peacock [1941] found that digestibility of the fats was progressively lowered as they were heated for increasing lengths of time and the rate varied considerably from fat to fat.
Young rats, on weaning, were kept on Diet B supplemented with 10 c.c. of skim. milk and 5 gm. greens per rat per day. The rats, both male and female, were obtamed from. the third .gene:ration of the gh:e and_ vanaspati-fed parents and the
TABLE XVIII
Average increase in body weight (in gm.) in s1:x weeks of rats receiving various hea.ted fats
Name of heated fats Males Females
-·-·--·- .. --· Cow'ghee 115·5±1i-4 86·2±2·0
Buffalo gltee 114·0±3·6. 73·3±2·3
'Dalda • 114·0±2·8 82·5±1·0
' 1st quality ' ' .: .102·7 ±2·0 85·0±3-1 . 'Swastika' 96·8±1·9 74·0±4·3
'Kotogem' 109·5±5·7 87-8±2-1
.. , Cotex' 100·2±2·0 74·0±2·1
''Binaula' 80·0±4·0 63·2±3-4
'Temple' 92·8±1·7 78·3±0·6
'Rajhans' 97-<J±5·5 8HI±3·!l
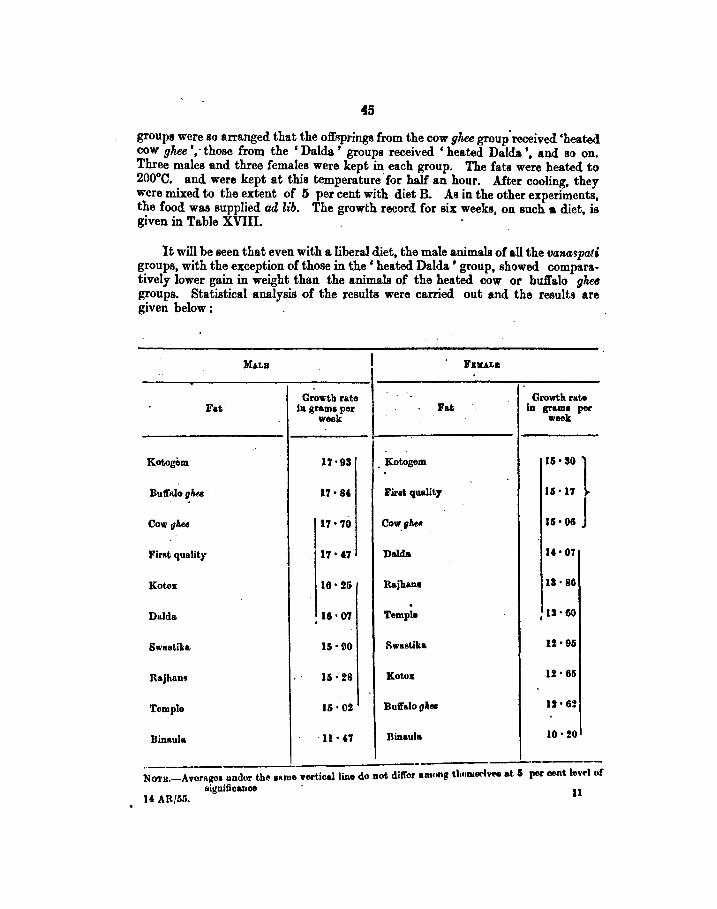
45
groups were so arranged that the o:fl'Rprings from the cow ghee group' received 'heated cow ghee ',-those from the ' Dalda ' groups received • heated Dald..a •, and so on. Three males and three females were kept in each group. The fats were heated to 200°0. and were kept at this temperature· for half an hour. After cooling, they were mixed to the extent of 5 per cent with diet B. As in the other experiments, the food was supplied acllib. The growth record for six weeks, on such a diet, is given in Table XVIII.
It will be seen that even with a liberal diet, the male animals of all the vana!paft groups, with the exception of those in the ' heated Dald..a ' group, showed comparatively lower gain in weight than the animals of the heated cow or buffalo ghee groups. Statistical analysis of the results were carried out and the results are given below :
Fat
:M.U.B I FBIULB
Gro,.·tb rate
' Growth r&te
ill grams per
I Fat ill gram• per
week week
17•93 . Kotogem. 15. so l 17. 84. First quality 15. 17
15•06 J 117.70 Cow_gllu
14•07 17." Dald&
Kotogem.
Bull"alogha
Cowghee
Fil'ftt quality
Kotos 16· 25 Rajh&nl 13 • SG
Dalda 18.07 Temple ,13·60
Swastika 15· DO Rwastik& U·95
Raj han• 15.28 Kotes U•65
Temple 15.02 lJuft'aloglk• U•62
·n·n Binaula 10. !0
-· NOTII:-=-A~ragel under the- 811rue vertical line do not differ anaong tlanau••IVN at I per oent levf'l or
H AR/llli. signifioanoo · 11
4.6
It will be seen that· the male rats of the heated ' Swastika ', ' Raj hans', ' Temple ' and • Binaula ' groups were significantly lighter in weight than the corresponding animals of either heated cow or buffalo ghee groups, whereas, for the females no such differmce was observed. The buffalo ghee group females, however, showed comparatively much poorer growth. It. appEars, therefore, that heating t:anasJatis seEmed to exercise a depressing effect on the growth to a certain extent because from Table XVI and subsequent statistical analysis it was seen that the rats getting Diet B plus unheated vanaspatis, even at ten per cent level, except those of ' Swastika' and ' KotogEm ' groups, did not show any slackening of growth as compared with the animals on similar liberal diet plus cow or buffalo ghee.
Experiment III. · Ghee versus vegetable oils and other fats
This experiment was unde.rtaken as vegetable oils form the general fat component of the common man's dietary, and there is dearth of accurate information on the nutritive value of the common vegetable oils as compared to ghee. Fri.rther, this study was also intended to throw light on whether the lower growth rates seen in the animals receiving vanaspatis, under certain dietary regimes, was caused by hydrogenation of the oils or the defect was inherent in the parent oils. Lard was also included in the studv as it is in common use. All the raw and refined oils ment.ioned in Chapter V we~e used for this study. For experimental convenience, the oils and fats were grouped into two series, A and B. Series A consisted of raw and refined samples of groundnut (fust generation only}, cotton-seed, coconut and mahua oils~ lard, ' Dalda ' and cow ghee, while Series B compriEed raw and refined groundnut, til, and mustard oils, 'Dalda ' and cow ghee. ' Dalda ' and cow ghee were included in both Series as reference fats.
The experimental procedure was very similar to that followed in Experiment I except that (a) the basal ration had a slightly different make up, viz. dextrinised starch-59, casein (extracted)-24, yeast (extracted)-8, salt mixture-4, experimental oil or fat-5 parts, (b) the experimental feeding extended over eight weeks instead of six weeks and (c) in place of a cereal ration from the seventh week, the basal ration was liberalised.
This liberalisation of the diet as mentioned in (c) above was necessary for the following reasons : . • ·
It was originally planned to observe the effect of feeding the above experimental diet over a period of 12 weeks, and then mate them to get the young ones for the next generation tests. The first generation experiments with Series A were carried out in accordance with the above plan. However, when the rats were mated after twelve weeks of feeding on the basal diet, they failed to reproduce.
In order to get the progeny for the second generation studies, those animals which failed to conceive were each given a supplement of 20 ml. skim milk, 5 gm. greens and 0·5 mg. alpha-tocopherol, daily. After four weeks on this regime they were ~e-mated. Th_is proved successful and so the feeding schedule of the subsequent e~penments was shghtl.y altered. The foregoing basal diet was given for the first e1ght weeks after weanmg, and the weight increase recorded in this period was
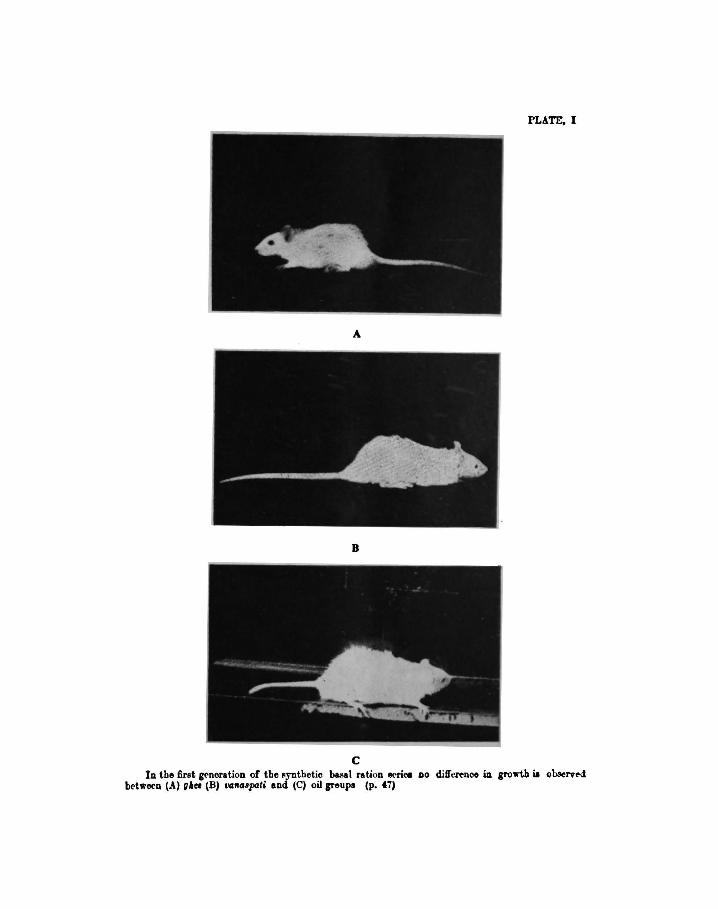
PLATE, I
A
B
c In the first gf'neration of the ~ynthetio basal ration IK'riea 110 difl'erenoe in gro'lrt.h ia ob..oervf'd
between (A) flllee (B) t'GII~pati and (C) oil greupa (p. f7)
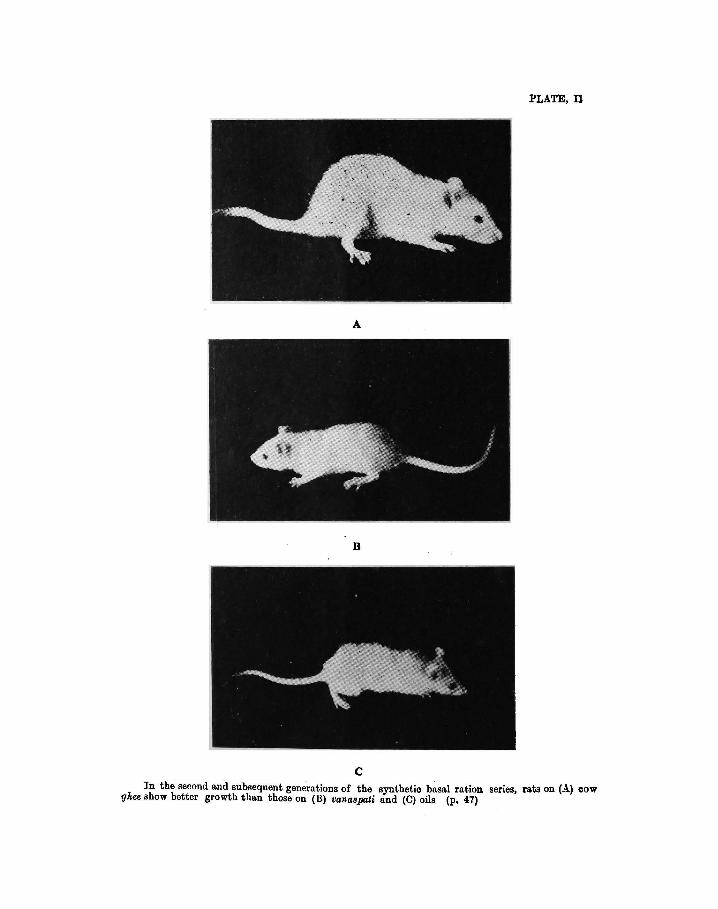
PLATE, Il
A
B
c In the second and subsequent generations of the synthetic basal ration series, rats on (A) cow
ghee show better growth than those on (B) vanaapati and (C) oils (p. 47)
f7
t~ken to repr('sent the gro~th pro~oting value of the fat. From the beginning of the n~th week, the basal ration mentioned above was supplemented with 20 ml. skim m11k, 5 gm. greens and 0·5 mg. alpha-tocopherol, per rat per day in all the groups. After four weeks on this liberalised ration, i.e., when they had completed twelve weeks of feeding and were four months or age, the rats were . mated as usual within each of the groups to .,_ret the next gel!-eration offspring.s. ;All the animals that had been mated weh! kept on th1s supplemented d1et bll the young ones were weaned at four we.eks of age, i.e., for the whole of the gestation and lactation periods also: For the second generation tests, a repreeentative group oftweh·e young ones {six males and six females) wa! selected from the weanlings of each of the fat groups, the young ones nearest the average weight in each of the litters being selected as far as po88ible. They were then switched on to the basal ration containing the same oil or fat their parents wen getting. The feeding, weighing, etc., were carried out in exactly the eame manne1 as in the first generation. Tl:e whole procedute was continued and repe•ted till the fourth generation• reeding tests, lasting for eight Weeks, were (lOmpleted.
This change in feeding procedure, of giving the supplemented diet from the beginning of the ninth 11eek, although primarily u:esnt to obtain litters for the subsequent generation experiments, also helped to study the effect of liberal feeding on the comparative growth-promoting value of the different fats. The growth-promoting values of the fats have been considel'f'd both on the basal ration fed for the first eight weeks, as well as on the supplemented one, ingeste~ during the next four weeks. The resulta are given in Table XIX.
It would be seen from this Table that there was no significant difference between the growth rates of the groups of animals getting the different fats in the first generation (Plate I). In the second and subsequent generations, however, cow gli~ was significantly superior to most of the other fats and oils {Plate II). It may not be out of place to mention here that we could not extend the observations in all th111 fat groups to the fourth generation, as in the groups like refined cotton-seed and larci, the majority oftLe animals died and it was not possible to get the subsequent generation. The stock of til oil and crude cotton-seed oil having been exhausted these groups too could not be carried forward to the fourth generation. Among the oils, crude mahua sroup fared better than the others in the seoond generation. llo~ever, in the fourth generation, even these lost ground and resembled the other 01ls in being significantly inferior to cow gliee. When compared a~ainst 'Dalda,' .the parent oi did not give a significantly .different growth e~ect lD any generation. The females generally showed less differences among the d1fferent groups than the correRponding males.
The rrsults olJRrrved with rt>fined oils 11·ere rath('r int.erestinjt. All the n•finNI oils gave eon:n hat better growth than the corffilpondi_ng crude ?ils in the. ~t generation. But in the second and subsequent generations the ammals rect'J\'JDg
• 011·ing to ~~;~cid,.;;-;he third ~nN'ati;n--;.;;.ri-;;;.t. ~ lp< lit atul bad t.n ~ rt'jeckd. Thr •tudy wu, therefore, ntrnded to the fourtb gooetatioa.
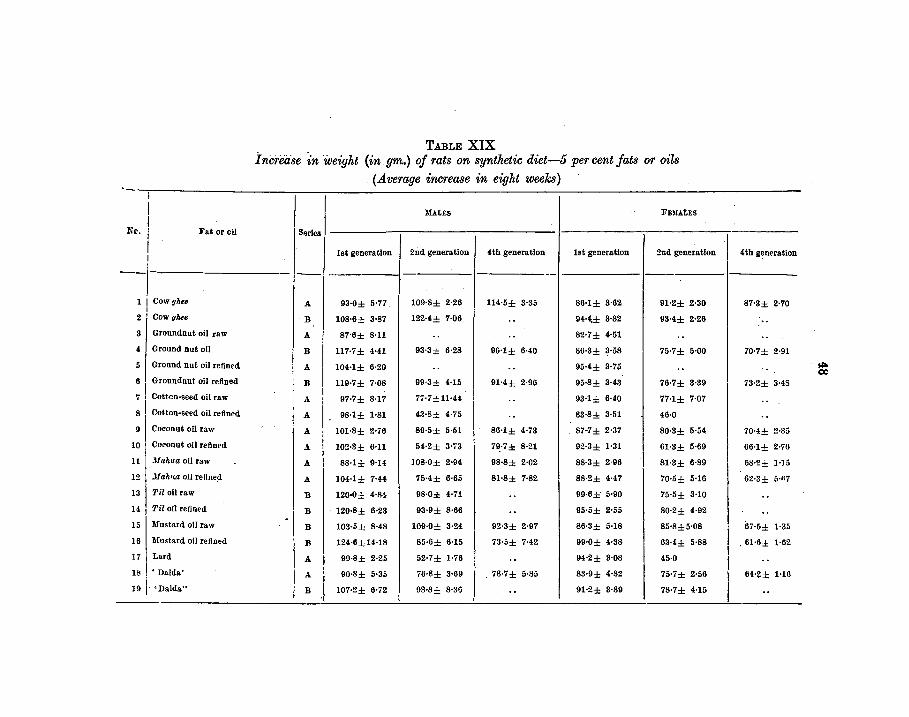
1
2
3
4
5
6
7
8
9
10
11
12
13
14
15
16
17
18
19
' I I I Fat or ell
I I
I 1 Cow ghee I 1 Cow ghee
Groundnut oil raw
Ground nut oil
Ground nut oil refined
I Groundnut oil refined
I Cottcn-seed oil raw
Cotton-seed oil refined
Coconut oil raw
1 Coconut oil refined
Jiahua oil raw . Jlah>IA oil refined
Til oil raw
I Til oil refined
Mustard oil raw
Mustard oil refined
Lard
'Dalda'
i· 'Dalda"
TABLE XIX Increase in weight (in gm..) of rats on synthetic diet-5 per cent fats or oils
(.Average increase in eight weeks)
I MALES FElU.tES
S4rlca
I 1st generation 2nd generation 4th generation 1st generation 2nd generation 4th generation I
-- --
A 93·0± 5·77 109·8± 2·26 114·5± 3·35 86·1± 3·62 91·2± 2·30 87-3± 2·70
B 108·6± 3·87 122·4± 7·06 .. 94·•1;± 3·82 93·4± 2·26 .. A 87•6± 8·11 .. .. 82·7± 4·51 .. . . B i 117·7± 4·41 93·3± 6·28 90·1± 6·40 86·3± 3·58 75·7± 5·00 70·7± 2·91
A 104·1± 6·20 .. .. 95·4± 3·75 .. . . B 119·7± 7·08 99·3± 4·15 91·4± 2·96 95·8± 3·43 76·7± 3·39 73·2± 3·48
A 97·7± 8·17 77·7±11·44 .. 93·1± 6·40 77-1± 7·07 .. A 98·1± 1·81 4~·8± 4·75 .. 83·8± 3·51 46·0 .. A 101·8± 2·76 89·5± 5·51 86·1± 4·73 87·7± 2·37
I 80·3± 5·54 70·4± 2·85
A 102·3± 6·11 54·2± 3·73 7~·7± 8·21 92·3± 1·31 61·3± 5·69 I 66·1± 2·:r6
A 88·1± 9·14 108·0± 2•94 98·8± 2·02 88·3± 2·96 81·3± 6·89
I 68·2± 1-15
A 104·1± 7·44 75·4± 6·65 81·8± 7·82 88·2± 4·47 70·5± 5-16 62·3± 5·R7
B 120·0± 4·81. 98·0± 4·71 .. 99·6±' 5·90 75·5± 3·10 .. B . 120·8± 6·23 93·9± 8·66 .. 95·5± 2·55 80·2± 4·92 . . .
67·5± B 103·5± 8·48 109·0± 3·24 92·3± 2·97 86·3± 5·18 85·8±5·08
I 1·35
B 124·6±14·18 85·6± 6·15 73·5± 7·42 99·0± 4·38 63-4± 5·88 . 61·6± 1·62 ' I
A 99·8± 2·25 52·7± 1·76 .. 114·2± 3·08 45·0 I .. A 90·8± 5·35 76·8± 3·69 78·7± 5·85 83·9± 4·82 75·7± 2·56 ! 64·~± 1•16
B .I 107·2± 6·72 08·8± 8·35 .. 91·2± 3·89 78·7± 4·15 I ..
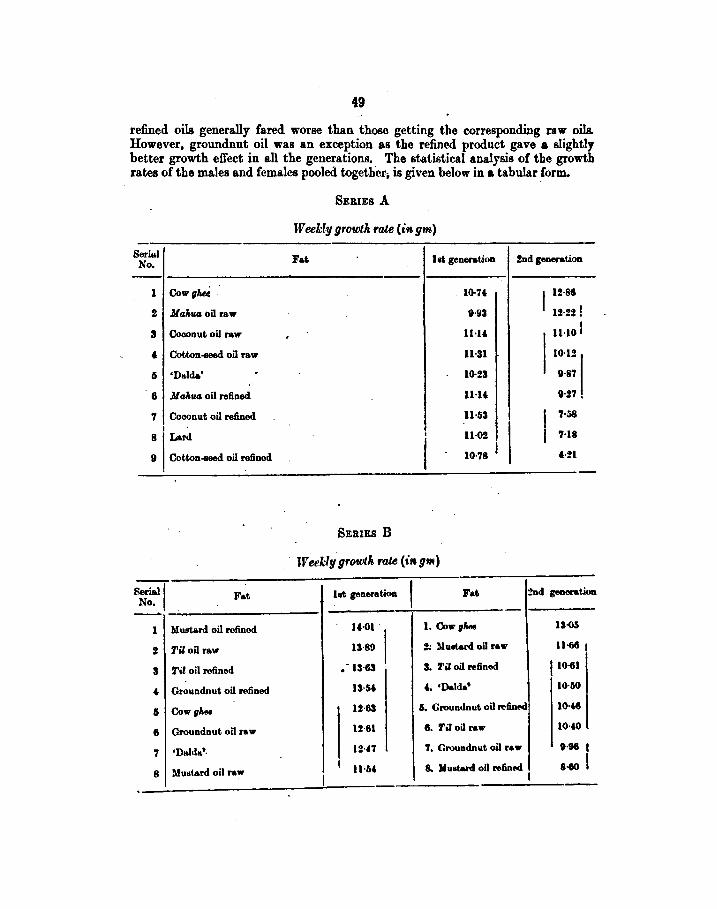
49
refined oils generally fared worse than those getting the corresponding raw oils. However, groundnut oil was an exception as the refined product gave a slightly better growth effect in all the generations. The statistical analysis of the growth rates of the males and females pooled together, is given below in a tabular form.
U..l Ser No
l
2
3
' li
6
'1
8
9
I
Serial' No.
1
2
3
' 5
6
7
8
CowghU
.Mahfl4 oU raw
Coconut oil raw
Cotton-seed oU raw
'Dalda' . .M ahfl4 oil refined
Coconut oil refined
Lard
Cotton-seed oU refined
Fat
Mustard oU refined
7'll oil raw
7'll oil refined
Groundnut oil refined
Cowg'-
Groundnut oil raw
•Dalda"·
Mustard oil raw
SERIES A
Weekly growth rate (in gm)
Fat lst generat.ion 2nd generat.ion
lO·U I U·86
IH13 1H2!
1H& 11-101
ll-31 10·12
10·23 1·87
1H& 1·27.
11-53 I NiB . 11.02 I 7-18
10·78 I &·!1
SERIES B
Weekly growth rate {ittgm)
lat generation Fat 2nd geoentjon
1'.01- 1. Vow 1'- 1S-o5
13·89 2: »uat&rd oil raw ll-6SJ
• - 13-63 S. 7'll oil refined 110-61
13·5& &. •D&Ida" 10·50
12·63 5. Groundnut oil refined 10·f&l
1!·61 I. 7'll oU raw 10·&0
1:!-47 7. Groundnut oil raw 1·96 I
11·5& 8. )I uat&rd oil refinNI a-eo I I
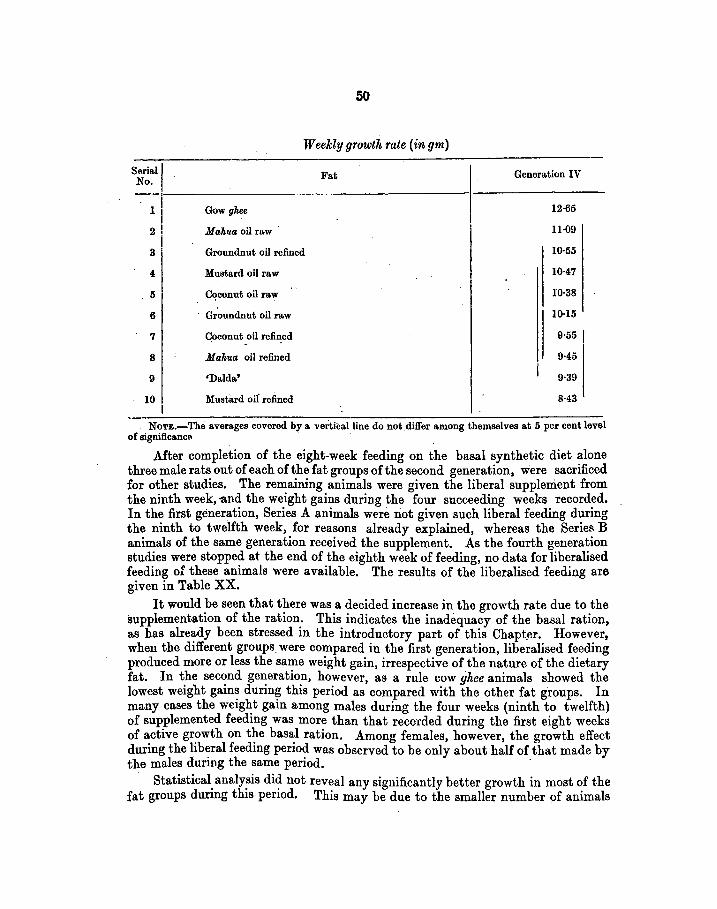
50
Weekly growth rate (in gm)
No. Fat Serial!
--;~------G-o_w_g_h_oo-------------------------------l
I 2 ! Mahua oil raw ·
I 3
4
5
6
7
8
9
10 I
Groundnut oil refined
Mustard oil raw
C<?conut oil raw
· Groundnut oil raw
Ooconut oil rcfi~ed
Mahua oil refined
•Da.lda.'
Mustard oif refined
Generation IV
12·65
11-09
10·55
10·47
10·38
10·15
9·55 1
9·45
9·39
8·43
·--~-The averages covered by a vertical line do not differ among themselves at 5 pe.r cent level of significance
After completion of the eight-week feeding on the basal synthetic diet alone three male rats out of each of the fat groups of the second generation, were sacrificed for other studies. The remaining animals were given the liberal supplement from the ninth week, -and the weight gains during the four succeeding weeks recorded. In the first generation, Series A animals were riot given such liberal feeding during the ninth to twelfth week, for reasons already explained, whereas the Serie111 B animals of the same generation received the supplement. As the fourth generation studies were stopped at the end of the eighth week of feeding, no data for liberalised feeding of these animals were available. The results of the liberalised feeding are given in Table XX.
It would be seen that there was a decided increase in the growth rate due to the supplementation of the ration. This indicates the inadequacy of the basal ration, as has already been stressed in the introductory part of this Chapter. However, when the different groups. were compared in the first generation, liberalised feeding produced more or less the same weight gain, irrespective of the nature of the dietary fat. In the second generation, however, as a rule cow gkee animals showed the lowest weight gains during this period as compared with the other fat groups. In many cases the weig~t gain among males during the four weeks (ninth to twelfth) of supplemented feedmg was more than that recorded during the first eight weeks of active growth on the basal ration. Among females, however, the growth effect during the liberal feeding period was observed to be only about half of that made by the males during the same period. ·
Statistical analysis did not reveal any significantly better growth in most of the fat groups during this period. This may be due to the smaller number of animals
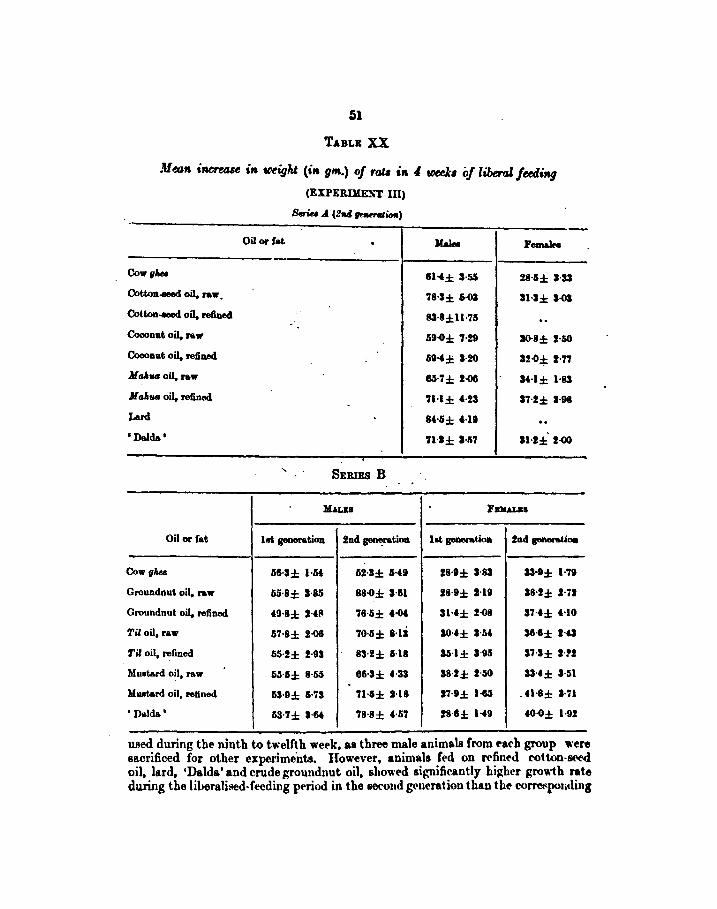
51
TABLE XX
ltfeaA Sncrea8~ SA tMghl (SA gm.) of raU SA 4 toed$ of liberal fe«Ji'llg
(EXPER~"T lll)
B.riu A (Zu ,._.,.,iml)
-Oil or Cat . llalea Femr.IN
Cow,,_ 6H:i: 3-55 28·5± U3
Cotton.-d oil. nw. '18·3 :i: 5.()3 31-1 :i: 3.()3
Cotton.-d oil. refined 83-8 :i: 11·'15 .. Coconut oil, nw 59-G:i: '1-29 30·8± !-50
Coconut oil, refined 5H:i: 3-20 32-G:i: 1·'1'1
AI alt.,. oil, nw 61)-'1 :i: J-()6 IH:i: l-83
M altWII oil. refined '11-l:i: HI 1'1-!:i: 1·98
Lard 8H:i: HO .. • Dalda' 71·1 :i: I-A7 11-l:i: 2.00
SERIES B
~L&I Fu.u.aa
Oil or fat 1st generation 2nd gert'!ration ht generation 2nd penti011
Cow,,_ 56·1± l·M 62·1± H9 28·9 :i: 1·83 Sli·D:i: 1·'19
Groundnut oil, nw 55-8± 1-85 88·0± 3·61 18·9± l-10 18·!± l·'l"l
Groundnut oil. refined f9·8:i: HI' '16-5 :i: f-Gf IH:i;l-o& IH:i: HO
Til oil. raw 67·8± 2·06 70·6± 8·1i IO·f:i: I·M 36·6± HI
Til oil, refined 65-!:i: 2·93 83-!:i: IHS 35·1± 1-95 17-I±HI
Mustard oil, raw 65·5± 8·65 66·1± HI 38-J:i: 1-50 IH± 1-51 . Muatard oil, relined 63·9± 5·'lll '11-11± l-IS 17-9± 1-el 0 tl-8± 1·'11
'Dalda' 53-'1± I·Gf 78·8± t-57 !8·1± H9 60·0 :i: 1·9!
used during the ninth to twelfth week, as three male animals from toach group •·ere sacrificed for other experime"nts. However, animals fed on refined rotton-~ oil, lard, •Dalda' and crude groundnut oil, showed significantly hiJ(her gro\\1h rate during the JilJeralised-feeding pl'riod in the &erond generation than the roi'I"CI'pon(ling
52
ghee-fed ones. This would seem to indicate an attempt on _the part _cf th?se fat groups which had made rather poor gr~wth ?n the basal ratiOn, to gam _weight. at an accelerated rate when the ration was hberahsed, to make up for the stuntmg durmg the basal ration period. In other words, they tried to equalise in body weight with the cow-ghee animals.
Thus, while on a sub-optimum diet the cow-ghee animals fared better than the other fat groups, under liberalised feeding there was no marked difference between their growth effects (Plate III). It might be recalled that similar observations were obtained in Experiment I also.
Health of animals
The animals of the first generation, in both the Series A and B getting different fats maintained fairly good health throughout. Only one animal in each of the groundnut oil (refined) group of Series A and mustard oil (raw) group of Series B died of unspecified reasons. Their mortality could not be ascribed to any deficiency disease. In the second generation, animals of aU the groups in the Series A, except those getting cow ghee, exhibited symptoms of ill health and deficiency diseases, at some stage or the other. Those fed refined cotton-seed oil and lard were the worst · affected. They developed a rough coat, showed alopecia and became weak and unthrifty, losing weight steadi!y after about the fifth week of experimental feeding on the basal ration (Plate IV). At about the same time, they also began to exhibit signs of dryness and inflammation of the eyes. In many of the animals this developed into total closing of the eyes and blindness. Several of them also exhibited a dragging gait, ending in paralysis of the hind quarters and legs and ultimately in death. Out of the twelve rats in each group at the commencement of the feeding test with the basal ration, only two (one male and one female) of the refined cotton-seed oil group and four (three male and one female) of the lard group survived at the end of eight weeks. The rats of the cotton-seed oil (refined) group also showed cannibalistic tendencies, as one of the rats of this group was eaten away by the others. The animals of the refined coconut oil group also showed clinical symptoms. These were, however, very much milder than the above. In this group, though there was severe inflammation of the eyes, they were not closed. Whereas, in the former two groups the rats showed loss of weight, in this case there was only. great reduction in the rate of their growth after about the fifth week till the end of the eighth week. The severity of manifestation of alopecia, roughness of the coat, as well as the unthrifty appearance, however, were not greatly different from those seen in the less affected animals ofthe lard and cotton-seed oil (refined) groups. In the coconut-oil (refined) group no symptoms of paralysis were observed nor did any of the rats die. Other groups of this Series showed alopecia and roughness of the coat which were somewhat less severe than was observed in those fed on refined coconut oil. Animals gettin" raw mahua. oil were the least affected among this Series. There was one death in thi~ group but nothing special was noticed in the post-mortem examination of the same. Cow g~ee fed_ rats did not show any noticeable clini<::al symptoms, except a slight alopecia, whiCh cleared up won after. "When the supplementary feeding of milk and greens was commenced frcrn the beginning of the nin1h we!:'k, there was aremarkable irnprovonent in tlte hEal1h and general <Trdition of all the animals.
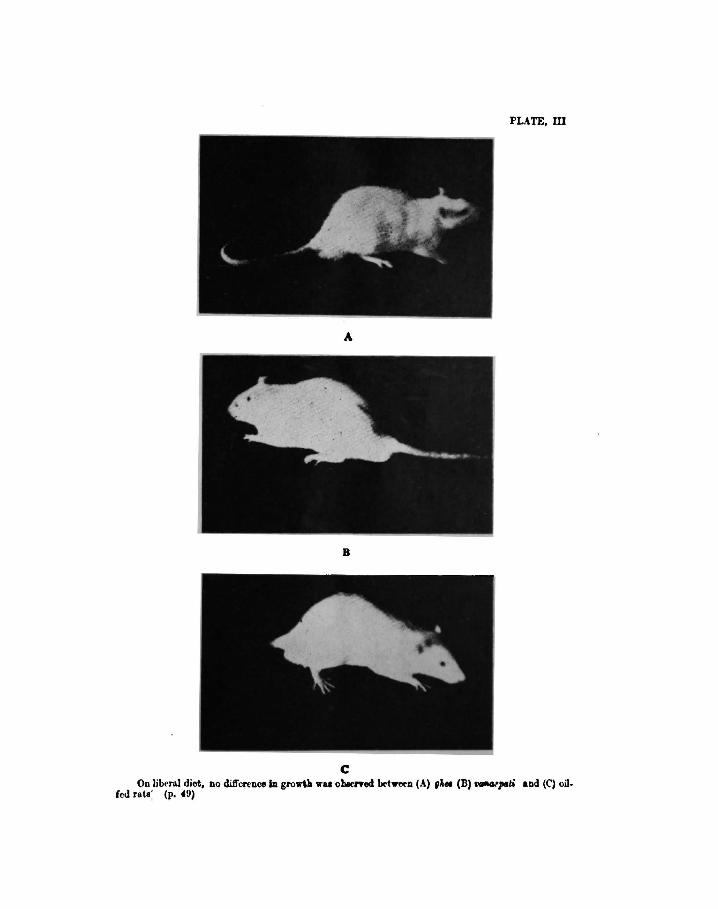
PLATE, m
A
B
c On liberal diet, DO dilrcl'eDCO Ill grorila 11fU obiened ootwet>D (J.) ,,. .. (B) NAG.'JISA &Dd (C') oil·
Cod rat.: (p. 49)
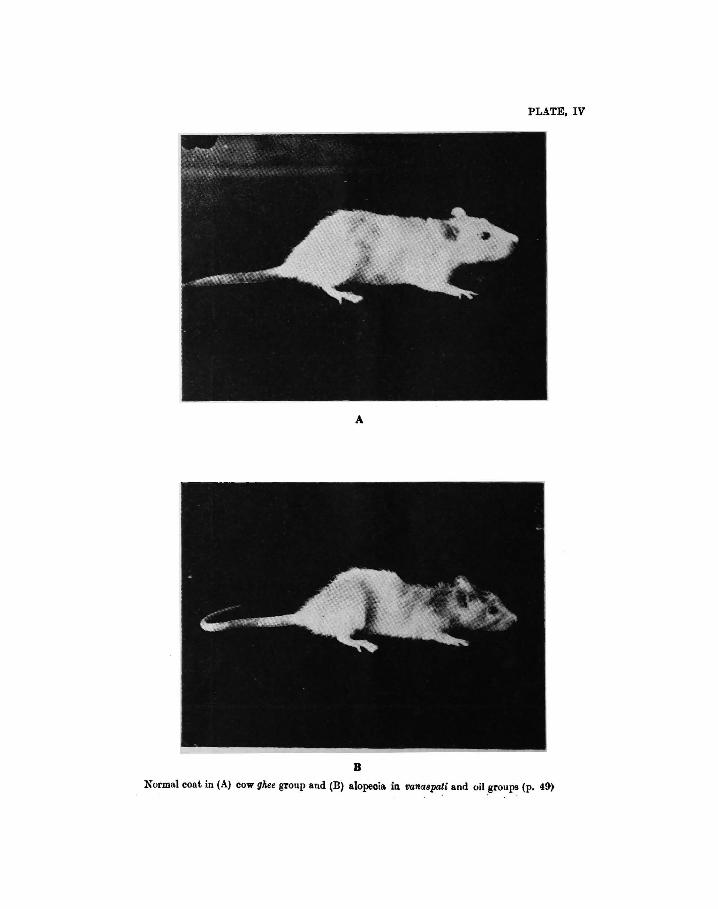
PLATE, IV
A
B
Normal coat in {A) cow ghee group and (B) alopecia. in van!18p&i and oil.groups (p. 49>

53
They put on weight rapidly and the deficiency symptoms of the eyes, fur, etc. also disappeared quickly. In about three to four weeks they appeared normal and more or less resembled the cow-gh.ee fed animals in general appearance.
Animals of Series B of this generation did not show any such abnormalities. Except for a slight alopecia in few of the rats, they appeared fairly normal throughout the eight weeks of the basal ration. Here also, the liberal diet impro\'ed their condition and appearance as well as their weight very considerably. There was no material difference in behaviour of the different fat groups in this Serie.s, from their health and appearance point of view. There were no deaths in any of these groups.
Fourth Generalion : The rats of this generation maintained fairly good health throughout the eight weeks of growth after weaning when they were fed the basal ration sub-adequate in vitamin A and containing the different experimental fats. Except for a mild manifestation of alopecia in some of the oil-fed groups, which was more particularly noticeable in the refined coconut-oil group, no other marked clinical symptoms were observed. The animals of some of the vegetable oils and • Dalda ' groups stopped gaining weight by the end of the seventh week of feeding. or these, ' Dalda I' coconut oil and mustard oil groups were more affected than the rest. Cow-ghee fed animals were practically free from any of these symptoms. Since the experiment was stopped at the end of the eighth week, further behaviour of the animals could not be pursued. There were no deaths in any of the groups.
The marked mortality and other pathological symptoms eeen in the second generation of Series A animals were probably due to the fact that the parents of these animals were on a sub-optimum diet for 18 weeks as against only eight weeks for the parents ofsecond generation animals of the Series B. It may aleo be recalled that in experiment I no mortality or any prominent pathological symptoms were seen in any group in any generation. This was due, possibly, to the fact that the animals were kept on the sub-optimum diet for six weeks only. ·
· Discussio" On consideration of all the above data it would appear that under the above
experimental conditions when only a sub-optimal basal ration was ingested, the growth promoting value of different vegetable oils, raw, refined or hydro.genated, as also lard, was generally significantly lower than that of cow-gltet!. The d1fference, however, seemed to manifest itself only on prolonged ingestion of the fats, i.e. in the second and subsequent generations. It would also app~ar that there were no marked consistent differences between either the various vanaspalis or the different oils in this respect. Hydrogenation did not appear to affect, materially the growth promoting value of the oil. Refining, however, seemed to lower the. growth promoting value of the oils on prolonged usage. The refined oot~n-seed ~·I gave the .worst results. Groundnut oil, however, differed from others, m that at gave a shghtly better growth on refining, in all the three generations of the ~xperiments. All the differences between tho '\'arious fats and oils, more or less d1sappeared when they were fed with a liberal di\\l·.
These results are in general agreement with the findings of Datta [1945] and Basu and Nath [1946]. Whereas Datta (loc. cit.) found musta~ oil to be much poorer than hydrogenated fat, in this experiment the raw mustard 01l was found to be UARJM. 11
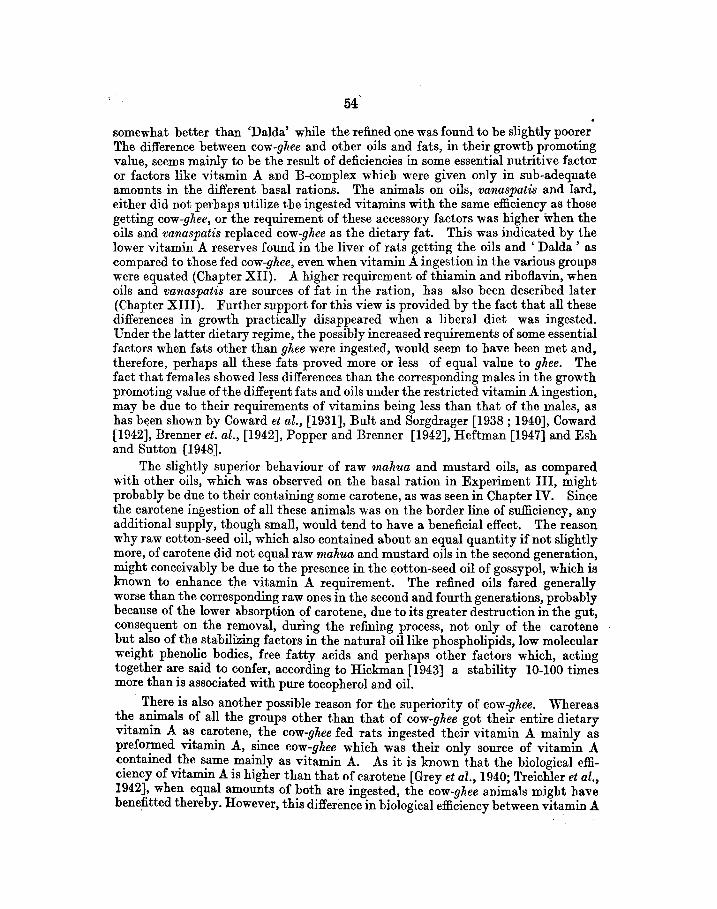
somewhat better than 'Dalda' while the refined one was found to be slightly poorer The difference between cow-ghee and other oils and fats, in their growth promoting value, seems mainly to be the result of deficiencies in some essential nutritive factor or factors like vitamin A and B-complex which were given only in sub-adequate amounts in the different basal rations. The animals on oils, vanaspatis and lard, either did not perhaps utilize the ingested vitamins with the same efficiency as those getting cow-ghee, or the requirement of these accessory factors was higher when the oils and vanaspatis replaced cow-ghee as the dietary fat. This was indicated by the lower vitamin A reserves found in the liver of rats getting the oils and ' Dalda ' as compared to those fed cow-ghee, even when vitamin A ingestion in the various groups were equated (Chapter XII). A higher requirement of thiamin and riboflavin, when oils and vanaspatis are sources of fat in the ration, has also been described later (Chapter XIII). Further support for this view is provided by the fact that all these differences in growth practically disappeared when a liberal diet was ingested. Under the latter dietary regime, the possibly increased requirements of some essential factors when fats other than ghee were ingested, would seem to have been met and, therefore, perhaps all these fats proved more or less of equal value to ghee. The fact that females showed less differences than the corresponding males in the growth promoting value of the different fats and oils under the restricted vitamin A ingestion, may be due to their requirements of vitamins being less than that of the males, as has been shown by Coward et al., [1931], Bult and Sorgdrager [1938; 1940], Coward (1942], Brenner et. al., [1942], Popper and Brenner [1942], Heftman [1947] and Esh and Sutton (1948].
The slightly superior behaviour of raw mahua and mustard oils, as compared with other oils, which was observed on the basal ration in Experiment III, might probably be due to their containing some carotene, as -was seen in Chapter IV. Since the carotene ingestion of all these animals was on the border line of sufficiency, any additional supply, though small, would tend to have a beneficial effect. The reason why raw cotton-seed oil, which also contained about an equal quantity if not slightly more, of carotene did not equal raw mahua and mustard oils in the second generation, might conceivably be due to the presence in the cotton-seed oil of gossypol, which is known to enhance the vitamin A requirement. The refined oils fared generally worse than the corresponding raw ones in the second and fourth generations, probably because of the lowar 11bsorption of carotene, due to its greater destruction in the gut, consequent on the removal, durrng the refining process, not only of the carotene but also of the stabiliZing factors in the natural oil like phospholipids, low molecular weight phenolic bodies, free fatty acids and perhaps other factors which, acting together are said to confer, according to Hickman [1943] a stability 10-100 times more than is associated with pure tocopherol and oil.
There is also another possible reason for the superiority of cow-ghee. Whereas t~e a~als of all the groups other than that of cow-ghee got their entire dietary v1tamm A as carotene, the cow-ghee fed rats ingested their vitamin A mainly as preformed vitamin A, since cow-ghee which was their only source of vitamin A contained th~ same mainly as vitamin A. As it is known that the biological efficiency of vitamin A is higher than that of carotene [Grey et al., 1940; Treichler et al., 1942], when equal amounts of both are ingested, the cow-ghee animals might have bene~tt~d thereby. However, this difference in biological efficiency between vitamin A
55
and carotene may not likely be much at the low level of carotene ingestion taking pla~e o!l. the basa~ dfet. Though these dffferences in vita~ A ingestion and availability were eXlStmg to the same extent m the first generat1on also, no differelll.".ea were found between the growth promoting value of cow-gliee and the different fats in this generation. This might probably be because the rata used for this test were taken from stock and consequently would be having large reserves of vitamin A in the liver. Moore [1940] has demonstrated that, with high vitamin A intake, the liver of a young rat can store enough vitamin A to last the animal the re.st of its life. Consequently, deficiencies arising in the first generation of oil or vanaspatifed rats, from insufficient ingestion or decreased availability of vitamin A, might have been made up for by drawing on their liver reserves so that no differences in growth rate from cow-gliee group were noticeable. This behaviour would also mean additional support for the presumption that differences in the growth promoting value of the fats were caused by variations in factors like vitamin A ingestion and requirement.
These results, viz. cow-ghee being superior to other vegetable oils, might seem -to be conflicting with the observations of Deuel and co-workers [1943; 1944; 1945a; 1950] who found no difference in the growth promoting values of butter-fat and other vegetable oils, margarines, etc. even when fed over several generations. There is, however, no contradiction because their experiments were conducted under entirely different conditions; Whereas the above authors fed an adequate ration, if not super-adequate in vitamin A and other essential nutritional factors (their animals were receiving at least 40 L U. of vitamin A per head per day), the experiments discussed here were carried out with a diet containing only a border-line sufficiency of vitamin A (8 I. U.) and possibly of B-complex aa well. That the present results are not only not conflicting with the findings of Deuel et al. [loc cit.] but actually confirm them is shown by the fact that the superiority of cow-ghu over other vegetable fats disappeared when the experimental animals were-switched on to a liberal diet, which made good the dietary deficiencies particularly of vitamin A. Our work only stresses the fact that, in the comparative estimation of the nutritive value of fats, proper definition of the basal ration used should be put forth, as the defects of a sub-optimum ration are likely to be aggravated in the presence of oils or. vanaspatia. This conclusion assumes a significant meaning when the average poor Indian diets are considered. Such diets are usually low in vitamins and minerals and the addition of certain oils and vanaspatia may, therefore, bring about adverse symptoms, unless precautions are taken to fortify these VE-getable dietaries with sufficient fat soluble vitamins and other similar essential nutritional factors.
PART II
TilE COMPARATIVE GROWTH PROMOTING VALUE OF FATS AND OILS WHEN INCORPORATED IN INDIAN DIETARIES
I N part I of this chapter, it was shown that when g/i.ee was incorporated in a synthetic basal ration containing sub-optimum quantity of vitamin A and per
haps of other factors as well, animals showed better growth, especially in the second and subsequent generations than rats fed the same basal ration plus other oils or 'Vanaspatis, even when the vitamin A intake in the different groups was equated. When, however, the diets were liberalised by addition of greens and skim milk, the difference between gkee and the other fats disappeared.
In this series of experiments, studies have been made on the effect of incorpora• ting different fats in some of the common Indian dietaries. As is well-known, many of the Indian dietaries are deficient in several essential nutritive factors like protein, calcium, vitamins, etc. but there is little precise information about the effects of adding different fats and oils to such dietaries. Mason et al., [1945] had observed adverse effects when butter-fat was added to a poor South Indian diet but they did not show whether other fats would also produce similar effects.
Experiment IV
For this experiment, the diet used by a poor Bengali was chosen. Since the work of McCarrison at Coonoor had labelled this diet as one of the poorest in the country, it was expected that any adverse effects on the health and well-being of the experimental animals due to the addition of different fats to it would be manifested quickly and prominently. The composition of the Bengali diet employed for this work was that used by MacDonald and Bose (1942] whic"h itself was based on the earlier work of McCarrison. It consisted of rice-25 parts, arluJr (cajantu indictu)-0·4 part,leafy vegetables-0· 2 part, potatoes-3· 5 parts, brinjals (solanum flt£loftgtM) -1·75 parts, torai (Luffa acutangula)-1·75 parts, mustard (Brassic4 jurteta} oil--0·3 part, salt-0·1 part and fish -0·7 part. The fats studied comprised cow glat~~ and six brands of 'Vanaspati, viz. • Dalda ', • Kotogem ', • First quality No. I', • Binaula. •, • Rajhans' and • Temple'.
These fats were fed at 5 per cent level along with the basal diet u in earlier experiments. For each of the fat groups similar lots of tw~v~ rats (si:x males and six females) were taken from the progeny of the parents rece1vmg the same fat plus diet B( Chapter VI) for four months before the birth of the litters. The weekly growth records were kept from weaning onwards. In the preparation of the diet fish alone was cooked by boiling in water while the vegetables were minced and m.il:ed together
57 u AR/u5 11
58
in the raw state. Powdered raw rice was added and all the ingredients were thoroughly mixed-95 parts of this diet being mixed with 5 parts of the fat. The weight gains recorded in twelve~week:feeding are given in Table XXI.
~TABLE XXI.
Average increase in weight in gm·: in 12 weeks, of rats getting Bengali diet plus different fats at 5 per cent level (Experiment IV)
--·· Fats Males Females
Cow ghee 37·6± 1·5 39·2± 3·8
'Dalda' 36·4± 1·6 35·8± 2·5 ..
•Kotogem' .. 24·9± 3·4 22.0± 3·6
•First qualit.r ~o. 1: : 20:5± 2·5 29·0± 2·9 .. 'Binaula' ,26:1± 5·5' 23·1± 4-2
·'Rajhans' -w;_ ..
. 25:0± 3·9 21·5± 4·6
'Temple' 23·8± 4-1 24·8± 3·8.
It would be nofed from the data given in Table XXI that there was very poor growth in all the groups. This is not surprising at all in view of the multiple deficiencies of the diet. However, it will be seen that with the exception of the' Dalda '-fed animals, all other vanaspati-ingesting rats made significantly poorer gains in comparison with those getting cow ghee. There was practically no difference between the cow ghee and the 'Dalda' so far as growth effect was concerned. This superiority of ' Dalcla • over other vanaspatis was also seen in Experiment II (Chapter VI), where the· comparative nutritive values of heated fats were examined. In view of the multiple deficie_:il.cies _present in the basal ration and also because many of the animals developed pa~hologicaJ symptoms, the results ·of statistical analysis of the growth rates of the diff~rent groups in this experiment-may not have much practical sigJ?ificance ..
. Though the comparative growth pro~oting abilities .:•fthe different groups have been given for a period ·of twelve weeks ·only, the experiment was further continued to examine the effect of long period feeding on the health of the animals, as well as to study the capability of the animals of the different groups for-reproduction and lactation. The data on reproduction and lactation are discussed in the next Chapter. The obseryations,_driring 25 ,weeks of feeding.regarding the general condition of the animals, are given; b~low. · · · · · · ·
. . In all the van.aspati groups, some ani~als, aJter third ~week, showed alopecia varying in intensity from mild to severe. Only two animals of the cow-ghee group showed very slight alopecia which disappeared in one case within a week. In most of the other affected animals, the time of disappearance was about three weeks though the symptom recurred again in all the vanaspati groups. .
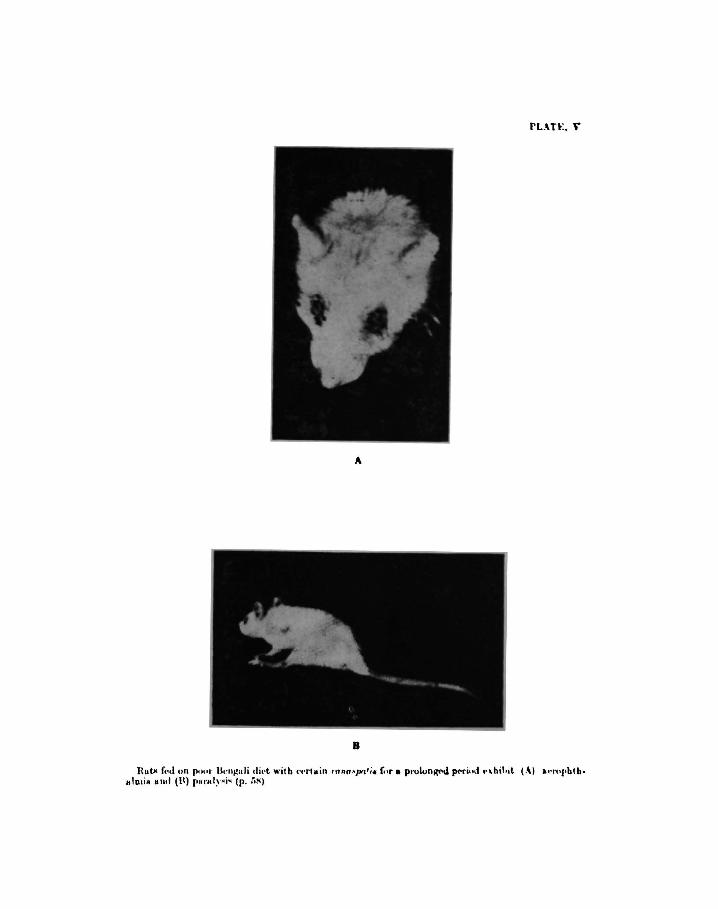
A
8
RutH f,,oJ nn (><H•r U<'lll(ali dil't " 'it h ••••rt11in rnna .•pr~'i• f. or a poulon~ p!'riud <'>hilool ( .,) l<'"•pbt h· BIDlill 1111<1 (B) ('III'KI~ · ·i• (p. lit')
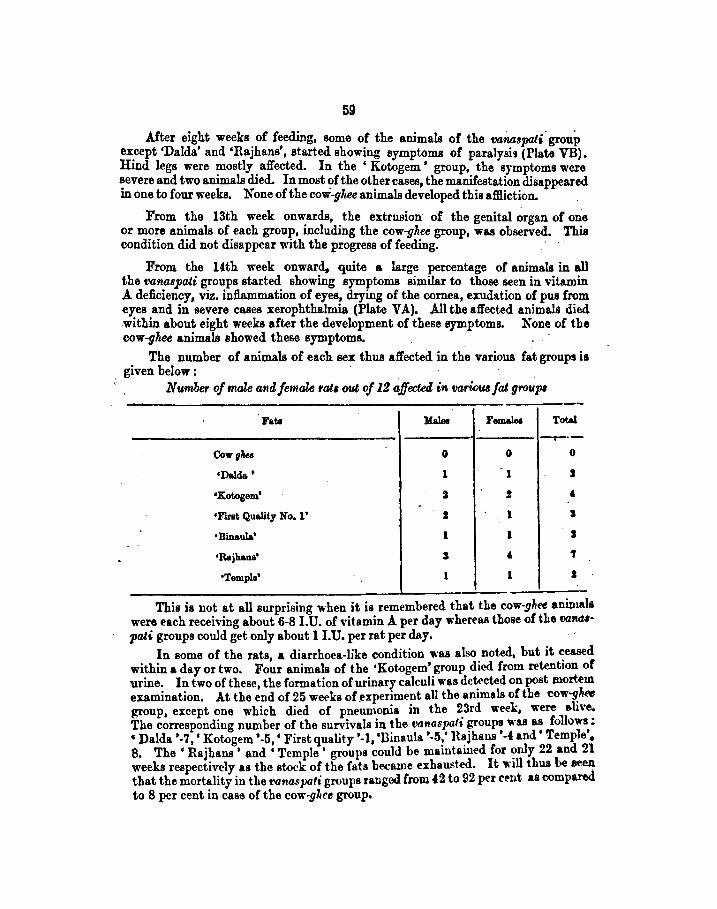
59
After eight weeks o£ reeding, some o£ the animals o£ the oonaspali. group except 'Dalda' and 'Rajhans', started showing symptoms o£ paralysi' (Pia.te VB). Hind legs were mostly affected. In the ' Kotogem ' group, the symptoms were ~evere and two animals died. In most'?£ the other cases, the manitestation disappeared m one to £our weeks. None o£the cow-ghee animals developed this affiiction.
. From the 13th week onwards, the extrusion of the genital organ of one or more animals of each group, including the oow-gha group, was observed. This condition did not disappear with the progress of feeding.
From the Uth week onward, quite a large percentage of animals in all the vanaspati groups started showing symptoms similar to those seen in vitamin A deficiency, viz. inflammation of eyes, drying of the oornea, exudation of pus from eyes and in severe cases xerophthalmia (Plate VA). All the affected animals died -within aboui eight weeks after the development of these symptoms. None of the oow-ghee animals showed these symptoms.
The number of anhnals of each sex thus affected in the various fat groups is given below : ·
N umher of male and female rat1 out of 12 affeckd in. ooriotu fat group• -
Fate Males Fomalel Total . --r-·-
Cow ghee 0 0 0
•Dalda' 1 1 I
•Kotogem' 2 ! ' . •F"Il'llt Quality No. 1' I 1 I
•Bin&ul&' 1 1 I
•Rajhana' I ' 1
•Temple' 1 1 I
This is not at all surprising when it is remembered that the oow1Jha anmulls were each receiving about 6-SI.U. of vitamin A per day whereaa those of the tlattAU-
1'ati groups could get only about li.U. per rat per day. In some of the rats a diarrhoea-like condition \\·as also noted, but it ceased
within a day or two. Fo~r animals of the •Kotogem' group died from retention of urine. In two of these, the formation of urinary calculi was det:ected on post mortem examination. At the end of 25 weeks of _experiment all the ammals of the cow-g_hee group, except one which died of pneumonia in the ~3rd week, were a-live. The corresponding number of the survivals in the vanaspalf groups was as foUI)ws: • Dalda '-7 'Kotogem '-5 • First quality '-1 'Binaula '-5,' Hajhans '-!and' Temple'• 8. The • Rajhaus • and ; Temple • groups ~ould be maintained for ?nly 22 and 21 weeks respectively as the stock of the fats became exhausted. It w1ll thus be seen that the mortality in the t•attaspati groups ranged from '2 to 92 per cent as oompared to 8 per cent in case of the cow-gl1ce group.

60
Experiment V
· After the above experiment was completed, it was decided to carry out a s~lar series of investigations to compare the effects of addition of ghee, vegetable oils or hydrogenated vegetable oils to a Bengali diet. A slightly different basal ration was used which is more accurate and representative of present conditions, as revealed by a consideration of all the published data on dietary surveys in India as well as from the information obtained from surveys carried out by this Institute. It may be recalled that the previous basal ration was a modified McCarrison diet as used by MacDonald and Bose [1942]. In order to avoid, as far as possible, associated effects of other fats, all free fats and oils which were part of the above dietary, as recorded in the surveys, were excluded and only the experimental fats were given .
. As most of the hydrogenated fats (vanaspatis) sold in the markets, are prepared from groundnut oil, this oil, in the natural crude form, was employed in this study. As there is some doubt about the inferior nutritive value of vanaspati having a melting point higher than that of the body temperature, two hydrogenated products prepared from groundnut oil and having different -melting points, one below body temperature and another above it, were tested. The following fats were studied :
1. Crude groundnut oiJ
2. Vansapati of m.p. 36° C. made from groundnut oil
3. V anaspati of m. p. 39° C. made from groundnut oil
4. Bazar ghee
5. Cow ghee
Pure cow ghee prepared in the Institute dairy under standard conditions, was used as the control. The bazar ghee was a composite sample prepared from material purchased from five different shops from different localities in Bareilly.
The composition of the diet was rice-65·5 per cent, masoor daZ (Lens esculanta}-2·0 per cent, mo011g daZ (Phaseolus radiatus)-0·5 per cent, onion-2 per cent, :fish-2 per cent, potatoes-11 per cent, leafy vegetables-1·2 per cent, brinjals (solanum meZongena)-4·5 per cent, tora.i (Luffa acutangula)-4·5 per cent, egg-1 per centl meat--0·5 per cent, common salt-0·3 per cent, and experimental fat or oil-5 per cent.
· The protein, lime and phosphoric acid contents of the diet were 9·8 per cent, 0·02 per cent and 0·45 per cent, respectively. The vitamin A potency ofthe ration was 75·8 I. U. per 100 gm.
· . Since the diet is low in vitamins and as the provision of adequate vitamins in a di~t is of very great importance, this aspect was also taken up for investigation. ~he Influence ~f the fortification of the diet with vitamins was determined by running sm;ultaneously ~n exactly similar duplicate series of trials in which the experimental arumals yvere. g1v~n an ~dequate supplement of the vitamins. Since the rat does n?t reqmre VItamm C this was omitted and only vitamin A, D and B-complex, were ~ven.. The schedule of the vitamin supplements given daily to each animal was ; ntamm ~ co~centrate-60 I. U., calciferol-10 I. U., thiamin-60 y, riboflavin-50 y, pyrldoxm-50 y, Ca-pantothenate-100 y and nicotinic acid-1 mg.
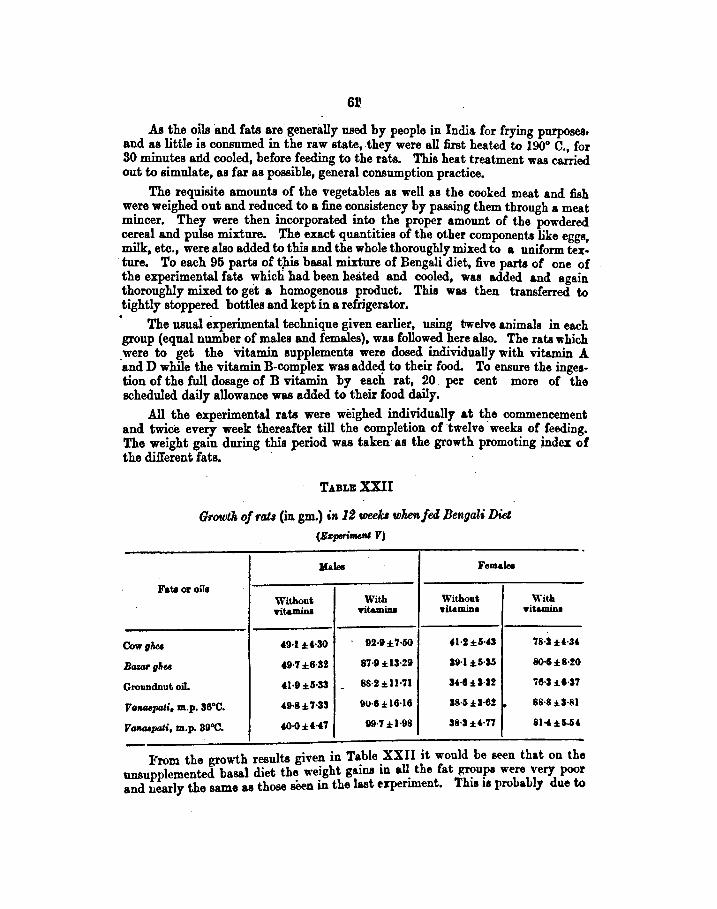
.As the oils ·and fats are generally used by people in India for frying purposes. and as little is consumed in the raw state, they were all first heated to 190° C. for 30 minutes and cooled, before feeding to the rats. This heat treatment was ca:ried out to simulate, as far as possible, general consumption practice.
The requisite amounts of the vegetables as well as the cooked meat and fish were weighed out and reduced to a fine consistency by passing them through a meat mincer. They were then incorporated into the proper amount of the powdered cereal and pulse mixture. The exact quantities of the other components like eggs, milk, etc., were also added to this and the whole thoroughly mixed to a uniform tex
. ture. To each 95 parts of tJ:tis basal mixture of Bengali diet, five parts of one of the experimental fats which had been heated and cooled, was added and again thoroughly mixed to get a homogenous product. This was then transferred to tightly stoppered bottles and kept in a refrigerator.
The usual experimental technique given earlier, using twelve animals in each group (equal number of males and females), was followed here also. The rats which .were to get the vitamin supplements were dosed individually with vitamin A and D while the vitamin B-complex was adde4 to their food. To ensure the ingestion of the full dosage of B vitamin by each rat, 20 per cent more of the scheduled daily allowance was added to their food daily.
All the experimental rata were weighed individually at the commencement and twice every week thereafter till the completion of "twelve weeks of feeding. The weight gain during this period was taken as the growth promoting j.ndex of the different fats.
TABLE XXII
Growth of rat& (in gm.) in 12 weeki whenfed Bengali Did (Ezperi~~~e"' V)
Males Females
Fate or oils Without With Without 'rit&mins 'rit&mins yitalllin•
Qlwgllu '9·1 *'·30 92·D:t:7-50 '1-!:t:HS
Bazar gltu ,9-7%6·32 8'1·D:il3-2D 19-l :i;S·Sii
Groundnut oil. , •• g ::1::5·33 - 88·! :i: 11-'11 34-l:i:I·U
Va11G8pati, m.p. 36"0. f9·8:i:7·33 &U·6::1:16·16 38·5±3·6! ~
Va11G8pati, m.p. 39"0. .0·0::1::, . ., W·7±1·98 38-3::1::,·77
-
With Yitamin•
'18-1:!:4·3·
80-8%8·:!0
'18-1±6·17
88·8±3·81
81-C::I::S-U
From the growth results give~ in T9:ble _XXII it would be seen that on the unsupplemented basal diet the ·we1ght gams m all. the fat ~ups were very poor and nearly the same as those seen in the la.st experunent. Th1a 1a probably due to
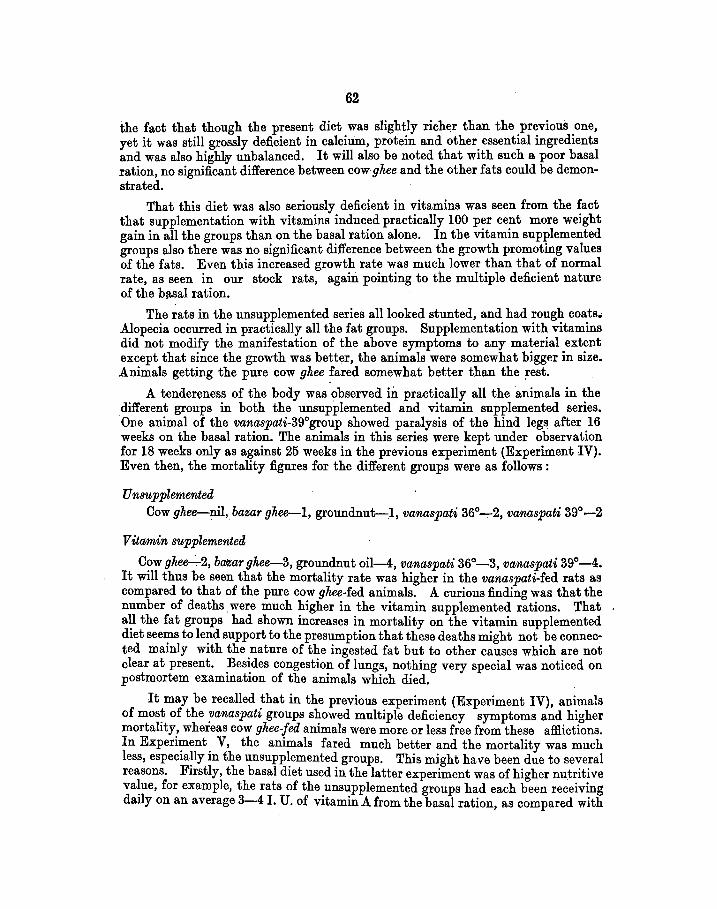
62
the fact that though the present diet was slightly richer than the previous one, yet it was still grossly deficient in calcium, protein and other essential ingredients and was also highll}' unbalanced. It will also be noted that with such a poor basal ration, no significant difference between cowghee and the other fats could be demonstrated.
That this diet was also seriously deficient in vitamins was seen from the fact that supplementation with vitamins induced practically 100 per cent more weight gain in all the groups than on the basal ration alone. In the vitamin supplemented groups also there was no significant difference between the growth promoting values of the fats. Even this increased growth rate was much lower than that of normal rate, as seen in our stock rats, again pointing to the multiple deficient nature of the b;tsal ration.
The rats in the unsupplemented series all looked stunted, and had rough coats. Alopecia occurred in practically all the fat groups. Supplementation with vitamins did not modify the manifestation of the above symptoms to any material extent except that since the growth was better, the animals were somewhat bigger in size. Animals getting the pure cow ghee fared somewhat better than the !est.
A tendereness of the body was observed in practically all the animals in the different groups in both the unsupplemented and vitamin supplemented series. One animal of the vanaspati-39°group showed paralysis of the hind leg~ after 16 weeks on the basal ration. The animals in this series were kept under observation for 18 weeks only as against 25 weeks in the previous experiment (Experiment IV). Even then, the mortality figures for the different groups were as follows :
U nsupplemented Cow ghee-nil,bazar ghee-1, groundnut-J, vanaspati 36°-,-2, vanaspati 39°-2
Vitamin supplemented
Cow ghell--7--2, baJZar ghee-3, groundnut oil-4, vanaspati 36°-3, vanaspati 39°-4. It will thus be seen that the mortality rate was higher in the vanaspati-fed rats as compared to that of the pure cow ghee-fed animals. A curious finding was that the number of deaths were much higher in the vitamin supplemented rations. That a~l the fat groups had shown increases in mortality on the vitamin supplemented diet seems to lend support to the presumption that these deaths might not be connected mainly with the nature of the ingested fat but to other causes which are not clear at present. Besides congestion of lungs, nothing very special was noticed on postmortem examination of the animals which died.
It may be recalled ~hat in the previous experiment (Experiment IV), anima!s of mos~ of the ~anaspat~ groups s~owed multiple deficiency symptoms and higher mortality, whereas cow gheejed ammals were more or less free from these afflictions. In ExperiJ;nent. V, the animals fared much better and the mortality was much less, espema!ly m the unsupp~emented groups. This might have been due to several reasons. Fustly, the basal diet used in the latter experiment was of higher nutritive va~ue, for example, the rats of the .unsupplemented groups had each been receiving dally on an average 3-4 I. U. of v1tamin A from the basal ration, as compared with
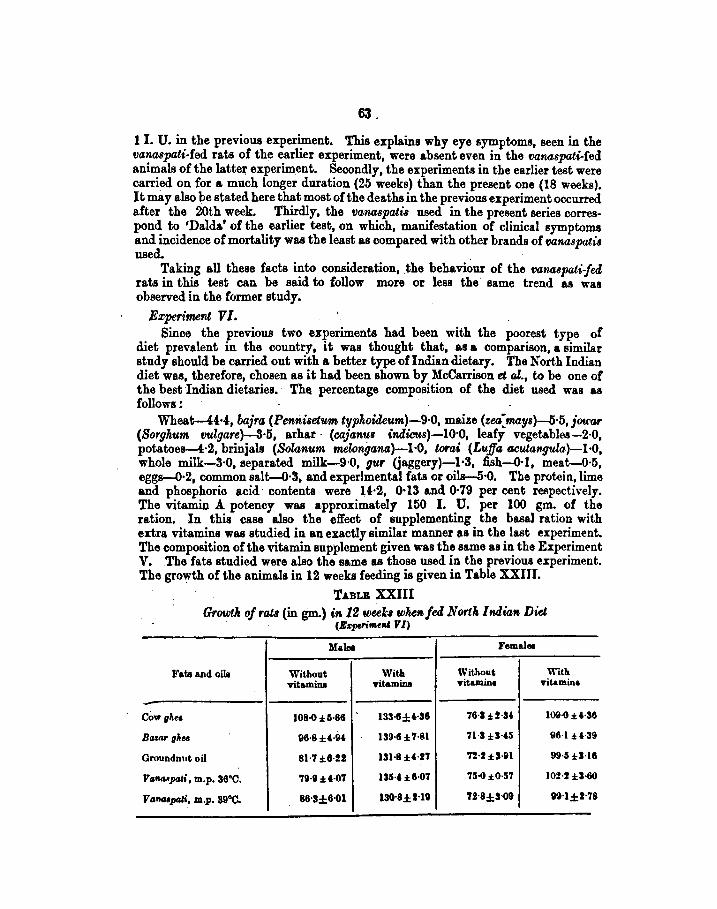
63.
1 I. U. in the previous experiment. This explains why eye symptoms, seen in the tJanaspati-fed rats of the earlier experiment, were absent even in the tJanaspati-fed animals of the latte~; experiment. Secondly, the experiments in the earlier test were carried on for a much longer duration (25 weeks) than the present one (18 weeks). It may also be stated here that most of the deaths in the previous experiment occurred after the 20th week. Thirdly, the tJanaspatis used in the present series correspond to 'Dalda' of the earlier test, on which, manifestation of clinical symptoms and incidence of mortality was the least as compared with other brands of vanaspatis used.
Taking all these facts into consideration, .the behaviour of the vanaspatijed rats in this test can be said to follow more or less the· same trend as was observed in the former study.
Experiment VI. Since the previous two experiments had been with the poorest type of
diet prevalent in the country, it was thought that, as a comparison, a similar study should be carried out with a better type of Indian dietary. The North Indian diet was, therefore, chosen as it had been shown by McCarrison et al., to be one of the best Indian dietaries. · Th~ percentage composition of the diet used was as follows:
Wheat-4:4:·4:, bajra (Pentiisetum typhoideum)-9·0, maize (zet(mays)-5·5,jowar (Sorghum wlgare)-3·5, arha.r · (cajanuB indicus)-10·0, leafy vegetables-2·0, potatoes-4:·2, brinjals {Solanum melongana)-1·0, torai (Luffa acutangula)-1·0, whole milk-3·0, separated milk-9·0, gur (jaggery)-1·3, fi.sh-0·1, meat-0·5, eggs-0·2, common salt-0·3, and experimental fats or oils-5·0. The protein, lime and phosphorio acid· contents were ~4:·2, 0·13 and 0·79 per cent respectively. The vitamin A potency was approximately 150 I. U. per 100 gm. of the ration. In this case also the effect of supplementing the basal ration with extra vitamins was studied in an exactly similar manner as in the last experiment. The composition of the vitamin supplement given was the same as in the Experiment V. .The fats studied were also the same as those used in the previous experiment. The growth of the animals in 12 weeks feeding is given in Table XXIII.
TA.BLB XXIII Growth of rats (in gm.) in 12 weeks whe'ttfed North lndia'lt Did
. (Ezperimelll VI)
Males Female~
J.l'ata and oils Without With Without With vitamins vitamins vitamin• vitamin a
cOw ghet 108·0%5·86 133·8±&-36 76·S±U& 109·0±'·36
Bazar glree 96·8H·H 139·6 :i 7-81 71·3 ±S·iS 96·1 ±i-39
Oroundnut oll 8H±6·U 131·8 ±&·2'7 '12·1 ±S·IIl 99·5 ±3-16
Vt~fi(J.Opah, m.p. 36"C. 79·11H·0'7 135·& :i 8·0'7 '75.() ±0·5'71 10!·! ±S-60
Va11C11pa.ti, m.p. 39"0. 86·3±6-Gl 130·8±1-11 72-8±3·09 99·1±1-78
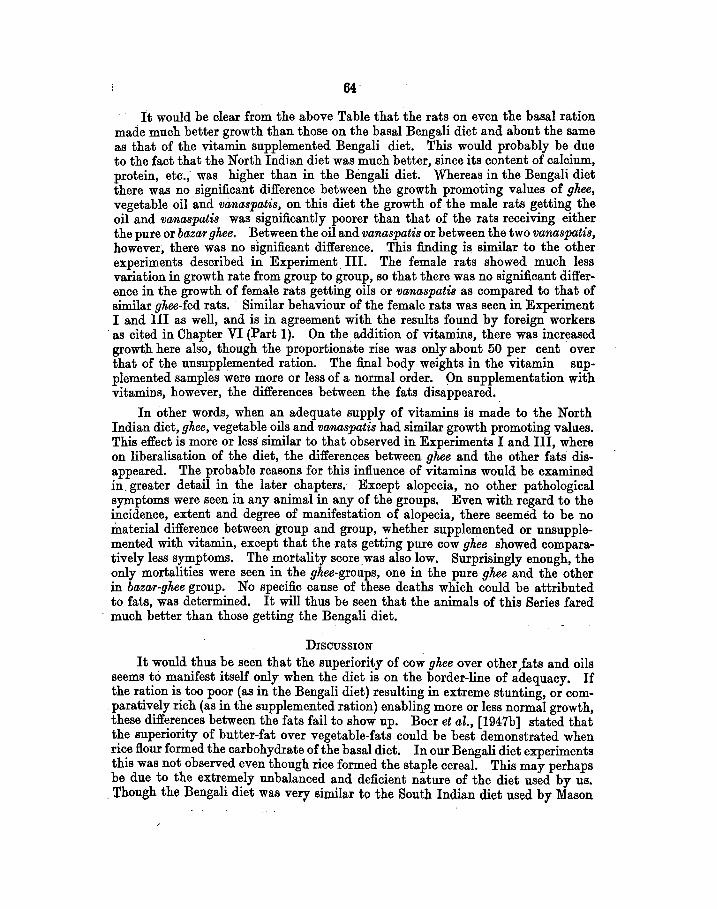
64
It would be clear from the above Table that the rats on even the basal ration made much better growth than those on the basal Bengali diet and about the same as that of the vitamin supplemented Bengali diet. This would probably be due to the fact that the North Indian diet was much better, since its content of calcium, protein, etc., was higher than in the Bengali diet. Whereas in the Bengali diet there was no significant difference between the growth promoting values of ghee, vegetable oil and vanaspatis, on this diet the growth of the male rats getting the oil and vanaspatis was significantly poorer than that of the rats receiving either the pure or bazar ghee. Between the oil and vanaspatis or between the two vanaspatis, however, there was no significant difference. This finding is similar to the other experiments described in Experiment III. The female rats showed much less variation in growth rate from group to group, so that there was no significant difference in the growth of female rats getting oils or vanaspatis as compared to that of similar ghee-fed rats. Similar behaviour of the female rats was seen in Experiment I and III as well, and is in agreement with the results found by foreign workers
·as cited in Chapter VI (Part 1). On the addition of vitamins, there was increased growth here also, though the proportionate rise was only about 50 per cent over that of the unsupplemented ration. The final body weights in the vitamin supplemented samples were more or less of a normal order. On supplementation with vitamins, however, the differences between the fats disappeared.
In other words, when an adequate supply of vitamins is made to the North Indian diet, ghee, vegetable oils and vanaspatis had similar growth promoting values. This effect is more or less similar to that observed in Experiments I and III, where on liberalisation of the diet, the differences between ghee and the other fats disappeared. The probable reasons for this influence of vitamins would be examined in. greater detail in the later chapters.- Except alopecia, no other pathological symptoms were seen in any animal in any of the groups. Even with regard to the incidence, extent and degree of manifestation of alopecia, there seemed to be no material difference between group and group, whether supplemented or unsupplemented with vitamin, except that the rats getting pure cow ghee showed comparatively less symptoms. The mortality score _was also low. Surprisingly enough, the only mortalities were seen in the ghee-groups, one in the pure ghee and the other in bazar-ghee group. No specific cause of these deaths which could be attributed to fats, was determined. It will thus b(, seen that the animals of this Series fared much better than those getting the Bengali diet.
DISCUSSION
It would thus be seen that the superiority of cow ghee over other fats and oils seems to manifest itself only when the diet is on the border-line of adequacy. If the ration is too poor (as in the Bengali diet) resulting in extreme stunting, or comparatively rich (as in the supplemented ration) enabling more or less normal growth, these differences between the fats fail to show up. Boer et al., [1947b] stated that the superiority of butter-fat over vegetable-fats could be best demonstrated when ri~e flour formed the carbohydrate of. the basal diet. In our Bengali diet experiments th1s was not observed even though nee formed the staple cereal. This may perhaps be due to the extr~m~ly unbalance~ 3;nd deficient nature of the diet used by us .
. Though the Bengah dtet was very srnular to the South Indian diet used by Mason
65
et at., [1945], the adverse effects noticed by them on the addition of butter-fat, were not observed in these experiments. It would be clear from the growth data obtained in the present series of experiments that the eow-ghee diets gne equal, if not better, growth than any of the other fats. In another series of experiments conducted in these laboratories by Kehar and Sahai [1949] only beneficial effects and no adverse effects have been observed by the addition of butter-fat to a poor rice diet similar to that prevalent in South India. On the other hand, in the North Indian dietary, when wheat formed the staple grain, the difference between g'Me and the fats was manifested. The superiority of cow-ghee over the vegetable-fat, observed in the vitamin low North Indian diet and its disappearance on a liberal supply of vitamins, agrees well with the findings of Heftmann [1947]. However, no difference in growth promoting value between the oil and its hydrogenated products could be found in any of the dietaries uSed, nor was the melting point of the wruupati within the limits studied, found to affect its growth promoting value. •
1
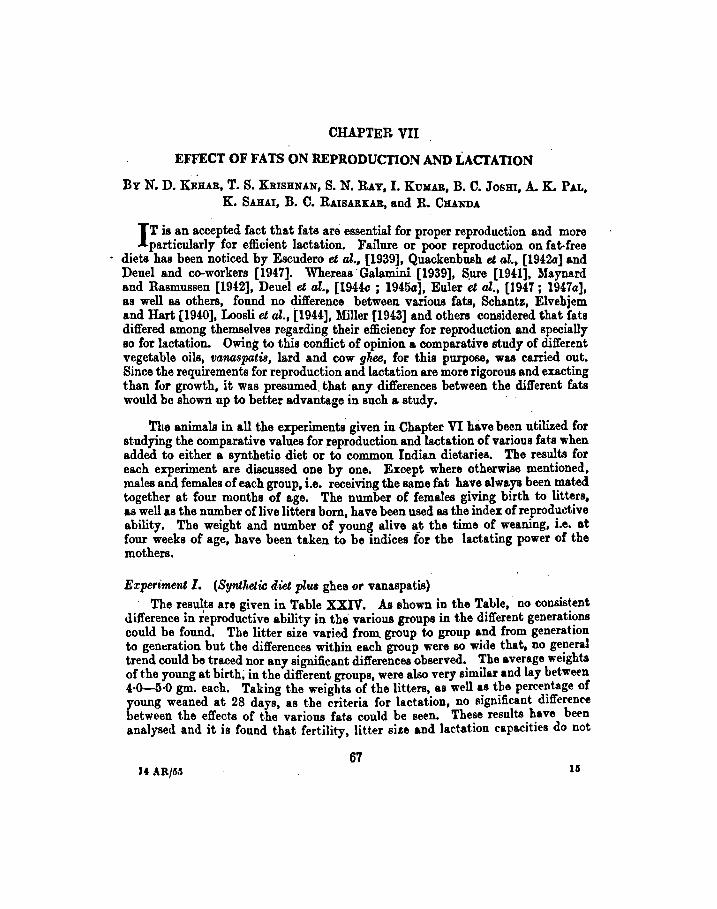
CHAPTER Vll
EFFECT OF FATS ON REPRODUCTION AND LACTATION
BY N.D. KEBAR, T. S. KRisHNAN, S. N. RAY, I. KuHAR, B. C. JosHI, A. K. PAL, K. SAHAI, B. C. RAISARKAB, and R. CHANDA
I T is an accepted fact that fats are essential for proper reproduction and more particularly for efficient lactation. Failure or poor reproduction on fat-free
diets has been noticed by Escudero et al., [1939], Quackenbush et al., [1942a] and Deuel and co-workers [1947]. Whereas· Galamini [1939], S.ure [1941], Maynard and Rasmussen [1942], Deuel et al., [1944c ; 1945a], Euler et al., [1947; 1947a], as well as others, found no difference between various fats, Schantz, Elvehjem and Hart [1940], Loosli et al., [1944], Miller [1943] and others considered that fats differed among themselves regarding their efficiency for reproduction and specially so for lactation. Owing to this conflict of opinion a comparative study of different vegetable oils, tJanaspatis, lard and cow ghu, for this purpose, was carried out. Since the requirements for reproduction and lactation are more rigorous and exacting than for growth, it was presumed. that any differences between the different fats would bo shown up to better advantage in such a study. ·
'rlte animals in all the experiments given in Chapter VI have been utilized for studying the comparative values for reproduction and lactation of various fata when added to either a synthetic. diet or to common Indian dietaries. The results for each experiment are discussed one by one. Except where otherwise mentioned, males and females of each group, i.e. receiving the same fat have always been mated together at four months of age. The number of females giving birth to litters, as well as the number of live litters born, have been used as the index of reproduetive ability. The weight and number of young alive a_t the time of weaning, i.e. at four weeks of age, have been taken to be indices for the lactating power of the mothers.
Experiment I. (Synthetic diet plta ghee or vanaspatis)
· The results are given in Table XXIV. As shown in the Table,· no consistent difference in reproductive ability in the various groups in the different generati?ns could be found. The litter size varied from. group to group and from generahon to gen~:ration but the differences within each group were so wide thst, no ge!leral trend could be traced nor any significant differences observed. The average weights of the young at birth, in the different groups, were also very similar and lay between 4·0-5·0 gm. each. Taking the weights of the litters,. as well ':s t~e perc.e':tage of young weaned at 28 days, as the criteria for lactation, no s1gmfi.cant difference between the effects of the various fat.s could be seen. These results have been analysed and it is found that fertility, litter size and lactation capacities do not
67 14 .4.RfM 15
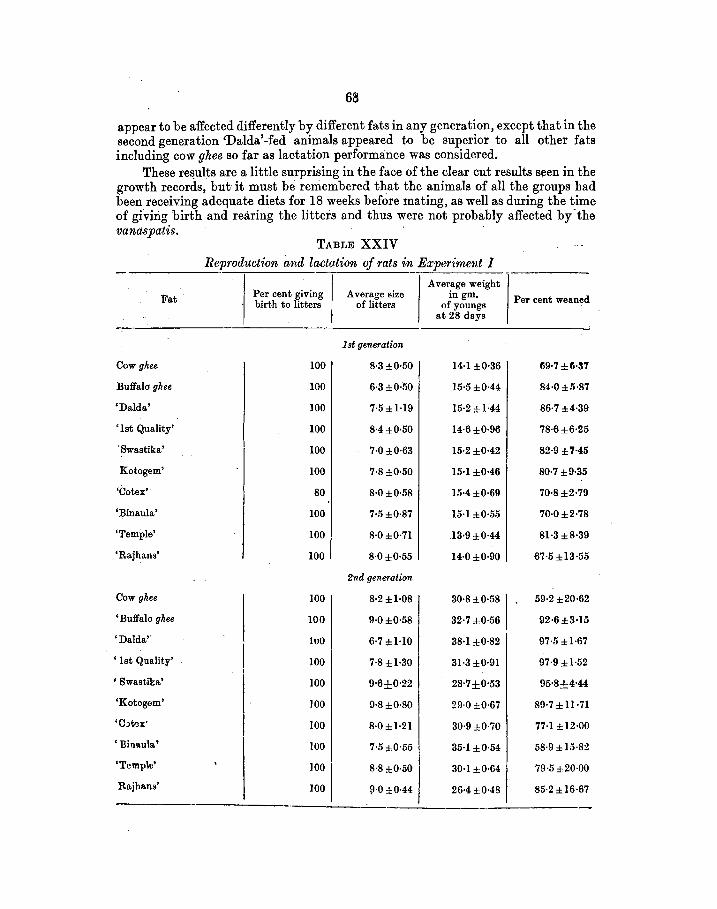
68
appear to be affected differently by different fats in any generation, except that in the second generation 'Dalda'-fed animals appeared to be superior to all other fats including cow ghee so far as lactation performance was considered.
These re~ults are a little surprising in the face of the clear cut results seen in the growth records, but it must be remembered that the animals of all the groups bad been receiving adequate diets for 18 weeks before mating, as well as during the time of giving birth and rearing the litters and thus were not probably affected by- the vanaspatis. ·
TABLE XXIV Reproduction and lactation of rats in Experiment I
Per cent giving Average weight
Fat Average size in gm. Per cent weaned birth to litters of litters ofyoungs at 28 days
1st generation
Cow ghee 100 8·3±0·50 14-1 ±0·36 ti9·7 ±6·37
Buffalo ghee 100 6·3±0·50 15·5±0·44 84·0±5·87
'Dalda' 100 7·5±1-19 15·2 ±1·44 86·7 ±4·39
'1st Quality' 100 8·4±0·50 14·6±0·96 78·6±6·25
·swastika' 100 7·0 ±0·63 15·2±0·42 82·9±'7-45
Kotogem' 100 7·8 ±0·50 15·1 ±0·46 80·7 ±9·35
'Cotex' 80 8·0±0·58 15·4±0·69 70·8±2·79
'Binaula' 100 7·5±0·87 15·1 ±0·55 70·0±2·78
'Temple' 100 8·0±0·71 13·9±0·44 81·3±8·39
'Rajhans' 100 8·0 ±0·55 14·0±0·90 67·5±13·55
2nd generation
Cow ghee 100 8·2 ±1·08 30·8±0·581 59·2 ±20·62
'Buffalo ghee 100 9·0±0·58 32·7 ±0·56 92·6±3·15
'Dalda'· luO 6·7±1-10 38·1 ±0·82 97·5 ±1·67
' 1st Quality' 100 7-8 ±1·30 31·3 ±0·91 97·9 ±1·52
'Swastika' 100 9·6±0·22 28·7±0·53 95·8±4-44
'Kotogem' 100 9·8±0·80 29·0±0·67 89·7 ± 11·71
'C)fzlx' 100 8·0±1·21 30·9±0·70 77·1 ± 12·00
'Binaula' 100 7·5±0·55 35·1 ±0·54 58·9 ±15·82
'Temple' I
100 I 8·8±0·50 30·1 ±0·64 79·5±20·00
Rajhans' 100 P·0±0·44 26·4±0·48 85·2 ±16·67

~ .. ·.- .... Fat
Col\> ghee
Buffalo ghee
'Dalda'
'let Quality'
'Swutika'
'Kotog!lm'
•cOtes'
•Binaul&'
•Rajhau'
'Temple' .
TABLE :XXIV~ttl.
Reproduction and lactation of rau in Experiment I
Per cent giving-~-. Average size birth to litters of litters
3rd get~uation
I ·100 1 6·2:1:0·551
.. 83·3 5·6%:1·32
100 5·8%:0·80
83·3 5·2S:O·li9
100 5·5%:0·75
.. 100 8·5_;!;0·18
190 6·8:!::0·50
100 8·~:!::0·631
100 7·8±0·55
100 6.0:i:0·82
j
Average weight in gr&Dlll ofyoungs
at 28 day•
30·5±0·90
25·8:!::1-17
31·5:i:H9
32-8H·60
.27·8:!::0·6!
26·2:!::0·52
29·5%:0·58
29·2±0·70
27-1:!::0·50
31·5±0·8'
Per cent weaned
86·5 :l: 15-91 .
112·9:!::19-44,
9'·3:!::3·13'
73·,%:20·00,
97·0:!::2-78
9H:!::3·28
SS·It%7-80
95·:!±H?
· . ' r.s·'i J::n·~
80-5:t2·U
NoTE.-In column '• the weightl of the young& of the let genera.tion at I' day. or age han been givea.
·Experiment II Table XXV shows the reproduction and lactation performance of the animala
getting heated ghus and vanaspatis when incorporated into Diet B (Chapt.er VI). The weight of the young at 14: days of age baa been used here as one of the il!-dices of lactating capacity [Maynard and Rasmussen, 1942]. It will be seen from the Table that except for the •Binaula' group (in which none of the animals cast any litter), there is no difference between fat and fat in respect to fertility and lactating capacity of the animals. The statistical analysis reveals that the fertility of rat~ does not appear to differ significantly from fat to fat. As regards lactation capaci~y. 'Temple'-fed rats appear to give results better than any other fats, The com-_ paratively small number of animals used here however robs the statistical data 'of any great prac~ical significance.
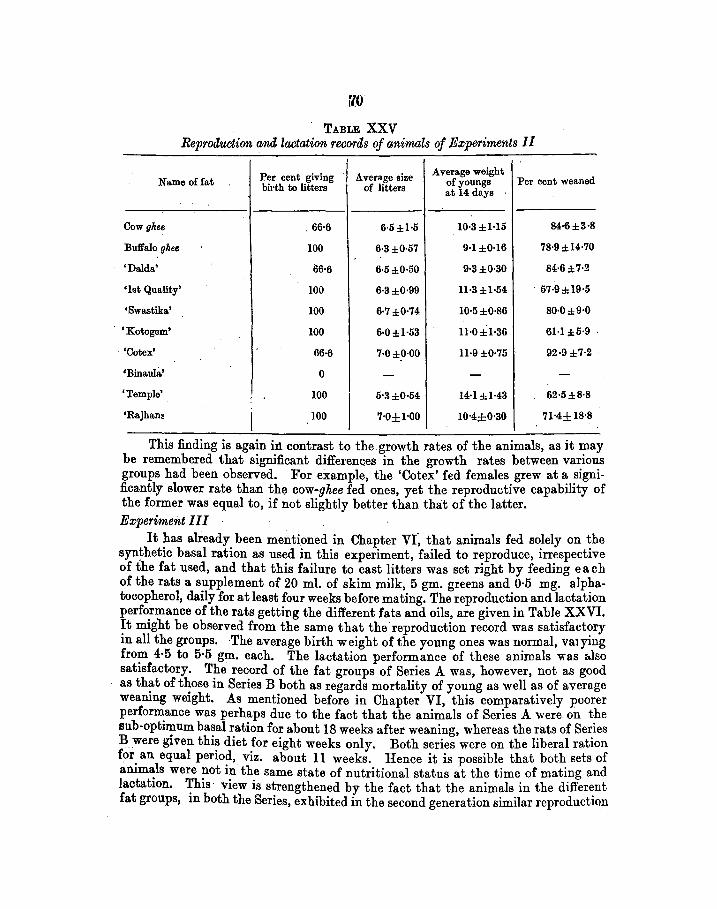
flO
TABLE XXV Reproauction ani!, lactation recoras of animals of Experiments I I
Per cent giving Average siZE' Average weight Per cent weaned Name of fat ofyoungs birth to litters of litters at 14 days
Cow ghee . 66·6 6·5±1-5 10·3±1-15 84·6±3·8
Buffalo ghee 100 6·3±0·57 9·1 ±0·16 78·9 ±14·70
'Dalda' 66·6 6·5 ±0·50 9·3 ±0·30 84·6±7·2
'1st Quality' 100 6·3 ±0·99 11·3±1-54 57·9±19·5
•Swastika' 100 6·7 ±0·74 10·5±0·86 80·0 ±9·0
'Kotogem' 100 6·0±1-53 11·0±1-36 61-1±5·9
'Cotex' 116·6 7·0 ±0·00 11·9 ±0·75 92·9 ±7·2
'Binaulit.' 0 - - -'Temple' 100
I 5·3±0·54 14-1±1-43 62·5±8·8
'Rajhans 100 7·0±1·00 10·4±0·30 71-4±18·8
This finding is again ii1 contrast to the growth rates of the animals, as it may be remembered that significant di:fferenQes in the growth rates between various groups had been observed. For example, the 'Cotex' fed females grew at a significantly slower rate than the cow-ghee fed ones, yet the reproductive capability of the former was equal to, if not slightly better than that of the latter. Experiment III
It has already been mentioned in Chapter VI~ that animals fed solely on the syn~hetic basal ration. as used in this experiment, failed to reproduce, irrespective of the fat used, and that this failure to cast litters was set right by feeding each of the rats a supplement of 20 mi. of skim milk, 5 gm. greens and 0·5 mg. alphatocopherol, daily for at least four weeks before mating. The reproduction and lactation performance of the rats getting the different fats and oils, are given in Table XXVI. It might be observed from the same that the· reproduction record was satisfactory in all the groups. The average birth weight of the young ones was normal, val ying from 4·5 to 5·5 gm. each. The lactation performance of these animals was also satisfactory. The record of the fat groups of Series A was, however, not as good as that of those in Series B both as regards mortality of young as well as of average weaning weight. As mentioned before in Chapter VI, this comparatively poorer performance was perhaps due to the fact that the animals of Series Awere on the sub-optimum basal ration for about 18 weeks after weaning, whereas the rats of Series Bwere given thi~ diet for eight weeks only. Both series were on the liberal ration for. an equal peno~, viz. about 11 weeks. Hence it is possible that both sets of ammals were not m the same state of nutritional status at the time of mating and lactation. ~his view is strengthened by the fact that the animals in the differ~nt fat groups, m both the Series, exhibited in the second generation similar reproductiOn
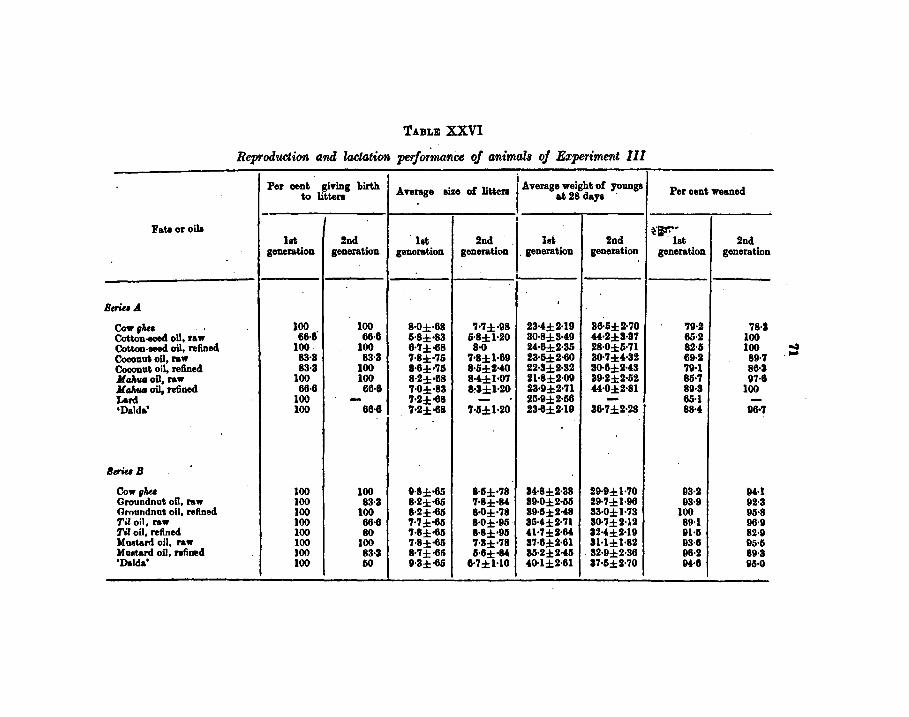
TABLE XXVI
Reproduction and lactation peifor'ma'llce of animals of Experime'llt III
Per oent giving birth Average . f litte f Average weight of :younga Per oent. weaned to littera BIH 0 ra at 28 daya ·
- I
Fat& or oila ~·F" 1at 2nd let 2nd lst 2nd ·1st 2nd
generation generation generation generation , generation generation generation generation
i
BeriuA .
Cow g'hu • 100 100 8·0:1:·68 'l-7:1:·98 23-4:1:2·19 86-11:1: 2·70 '79-ll '78-S Cotton.-d oil, raw 66·8· 68·8 6·8:1:·83 11·8:1: 1·20 30·8:1:3·49 44-2:1:3·37 65·2 100 Cotton.-d oil, refined 100' 100 8·7±·68 8·0 24·6:1:2·35 28·0:1:6·71 82·15 100 Coconut oil, raw 83·3 83·3 7-8:1:·75 '7·8:1: 1-89 23·5:1: 2·60 30·7 :I: 4·32 69·ll 89·7 Coconut oil, refined 83·3 100 8·8:1:·75 8·6±2-40 22·3:1:2·32 30·6:1:2-43 79-1 86·3 JlaAuo oil, raw 100 100 8·2±•68 8·4:1:1·07 21·8±2·09 39·2:1:2·52 85·7 117·8 Jl alw4 oil, refined 66·8 66·8 7·0:1:·83 8~3:1:1-20 23·11:1:2·71 44·0:1:2·81 89-3 100 Lard 100 - 7-2±·68 - 25·11:1:2·56 - 65-1 -•Dalda' 100 66·8 '1·2±•68 '1-15:1: l-20 23·6±2·19 36·7±2·28 88·4 116•7
BtriuB
Cow gM..c 100 100 0·8±·65 8·6:1:·'78 34·8:1:2·38 29·0::1:1·70 93·2 04-1 Oroundnut oil, raw 100 83-3 8·2±·65 7·8±•M 39·0:1:2-115 29·7:1: 1·96 93·9 92·3 Oroundnut oil, refined 100 100 8·2±·65 8.():1:·'78 39·15:1:11-48 33·0:1: 1-'73 100 95·8 Til oil, raw 100 68·8 '7-7:1:-85 8.()±·95 35-4:1:2·71 30·'1::1:2-12 89-1 96·9 Til oil, refined 100 80 '7-8:1:-85 8·8±·95 41-'7:1:2·64 32-4:1:2-19 91·15 82·9 )I ust&rd oil, raw 100 100 7·8:1:-85 '1·3±·78 37·6±2-61 31·1±1-82 93·8 95·5 )lullt&rd oil, refi~cl 100 83·3 8·7±-85 15·8±•M 35·2:1:1.1-45 32·9:1: 2·36 96·2 89·3 'Dalda' 100 60 9·3±·65 6·7±1-10 4<H:1:2-61 37-11±2·70 94·6 95·0
and.'lactation performances. Ito:we~er, the majority of the iats in the raw and refined coconut oil a's also the single rat Oil' refined cotton-seed oil groups, in Series A, failed to reproduce when mated at 16 weeks of ag~,when they h3:d been ~n the supplemented diet for only four weeks. But when_cm1tmued on _the liberal diet for some weeks moi:e:and tlien remated, they _showed satisfactory reproduction and lactation. The rather high .mortality of 21•7. ~per cent. observed ainong the litters of the cow-ghee group in Series A of the second generation, does not :give a true picture of the lactation capacity of the female rats of this group'because eight of the ten litters, which died; were killed -as the -result -efan accident. - . . .- On .. the wh.ole, therefore, it .woU.l<l be seen that in the different generatio;ns there WaS no difference between the various· fats with regard to their effect Oil: reproduction ~nd lactation. ·This view is st.rimgthened by the statistical analysis of the data which· shows that the fats did· not differ·sigiiificantly in any generation s:o far as fert_ility., litter size and lactatip.g .. capacity ·_W~re' coiicerne,d. . I
Expe~/ment TV . . -:Reproduction was more odessa·. t()~alf~ilure in all the g~oups of ruts receiving
the Bengali diet and ~-~th.er ghe~ pr vanaspa,ti. On,ly in the cow-ghee_ group,_one rat gave birth to four litters all of~hich died within a few hours of their bitth. The very poor quality of the basal diet is thus aJ?parent. ·
8xjieriment V In this experiment also, it :Was foirild .. that. even with an improved BengaJi diet
reproduction was a complete failure in all the·fat groups including cow ghee one. 'rhe reproduction. and lactation performance was little better when the diet was_fortified with vitamins. Only one out of five females mated, in each of the cow gl?ee imd bazargltee fed groups, reproducedand gave one andfour litters respectively. None of the fem_~les in any of the oil or p(lnaspati:fed ~groups gave birth to young. Even the few litters born, .in the cow-ghee itnd.bazar~ghee groups, died shortly _after birth. It would be clear, therefore, that reproduction was very unsatisfactory :and that fortification with vitamins made little improvement. : Also, all the fats including cow ghee fared equally badly in this respect: - .. · ·
Experiment VI·
• With the North Indian diet, more rats gave birth to litters than was ~eeri in the case of the Bengali diet, On the basal North Indian diet, i.e. without any vitamin supplementation, while none of the groundnut-oil fed rats reproduced, all the mated females on vanaspati 36°0. cast litters. Out of the five rats mated in each of the cow gh~e, bazar ghee and vanaspati 39°0 groups, only I, 2 and 3 animals respectively, gave-buth to young ones. The litter.size was very low, ranging from an average of 1·5" to 3,-2. • The total number of litters cast by all the rats of the vanaspati 36°0 group, which showe? 100 per cent reproduction, was only 16. The single rat in the cow·ghee-gro~p, whiCh reproduce&, gave birth only to two litters. The new horns were ~nder-s1zed and puny, _weighing ~nly3·5to 4·0 gm. each, on an average. That l~ctati~n ~as !1 complete failure ~as shown by the fact that not a single one of the htteJS many of the ·groups surv1ved even for one week. All of these died within two to three days of birth or earlier. Supplementation of the North Indian diet
73
with vitamins did not seem to have brought about any substantial change in the behaviour of the rats regarding reproduction or lactation. On this supplemented diet too, none of the females getting the groundnut oil gave any litters. '\\"'hereas on the unsupplemented North Indian diet all the females of the vanaspali 36°C group reproduced, in the group of vitamin supplemented diet none of them gave birth to any young ones. The cow-ghee group showed no change because on both the supplemented and unsupplemented diets, only one rat of the whole lot cast litters. In the bazar gkee and vanaspati 39°C groups, whereas on the unsupplemented diet, two and three respectively of the five in each gave litters, on the supplemented diet four and one respectively out of five in each, reproduced. The litter size too was practically unaltered, varying from an average of one to four in the different groups. The birth weight of the young was slightly better in some groups, the average weight ranging from 3·5 to 4·5 gm. each. The mortality rate and lactation performance were exactly the same as on the unsupplemented diet in which all the young ones died either just after, or within two to three days of birth.
DISCUSSION
It will thus be seen that with basal rations which permitted reproduction and fairly satisfactory lactation, there was no significant difference between fat and fat. These results are in agreement with the observations of Galamini [1939], Sure [1941 ], Maynard and Rasmussen [1942], Deuel et al., [1946c, 1945a] and Euler et al., [1947, 1947a]. The inability of various fats and oils, including butter-fat, to promote satisfactory lactation on an inadequate diet, noticed by Sure [19414] has been confirmed by the present results of both the sub-optimum synthetic ration as well as of the Indian dietaries. Boelter and Greenberg [1943] had observed that on a diet very low in calcium, successful mating was difficult. Cerecedo and Vinson [1944] had pointed to the importance of the level of protein in the diet for this purpose. As the Indian dietaries were sub-adequate in both these important proximate principles, it is not surprising that rats on such poor dietaries failed to reproduce or rear litters. Though supplementation with vitamins slightly improved the reproduction capacity, the females failed entirely to suckle their litters. It might, therefore, be surmised that the deficiencies of the dietary in calcium, protein and other factors were so overwhelming that successful reproduction and lactation were impossible.
These findings, therefore, indicate that on a poor human dietary, characterised by multiple deficiencies or on a sub-adequate synthetic diet as used in the above studies, rats fail to reproduce, irrespective of the nature of dietary fat, including cow ghee. When the synthetic diet was liberalised by the addition of skim milk, greens and vitamin E, reproduction and lactation was satisfactory and no si~ificant difference in these functions was seen in animals getting g11n or other fats like \'egetable oils raw, refined or hydrogenaf:ed.
CHAPTER VIII
BLOOD PICTURE OF RATS INGESTING VARIOUS FATS Al\TO OILS . BY N. D. KEHAR, T. S. KRISHNAN, D. N. !lluLLICK, D. N. !lluNRo and B. DuTT
I N rats deprived of riboflavin and in those with restricted food intake, Shukers and Day (1943] noticed that blood counts showed a low le,·el of leucocytes, an
increase in the per cent of neutrophiles and a decrease in lymphocytes, which were suggestive of inanition. Ershoff and Adams (1946] observed that the addition of folic acid correckd the reduction in leucocytes and suggested that rats on a restricted food intake were either unable to synthesize or utilize the folic acid
· present, or that they required more of this substance than animals on an unrestrictEd diet. Vitamin A deficiency was found by Abbott et al., [1939] to lead to a dEcrEase in totalleucocytes. Hassan, Ibrahim and Khanna [1948] also noticed that leucocytes, both collectively and differentially, responded to the level of vitamin A in the ~lood. These authors, however, state that with increase in ,·itamin A, the tOtal number tends to decrease, lymphocytes and monocytes to increase, and neutrophiles and eosinophiles to decrease. Brenner and Roberts [1943] had also ob&erved a relationship between vitamin A and the general defence mechanism of the body. Berry et al., [1945] found that rats on a basal deficient diet, compared with those on an adequate diet, showed a total white cell count of only a third, with a relative increase in granulocytes and decrease in lymphocyt~s, which confirmed their working hypothesis that resistance to certain bacterial infections may be lowered by an inadequate diet. Callaway and Noojni [194-0] noticed that animals on a low-fat diet had a lesser. degree of leucocytosis after infection than those on a normal or high fat diet. The differences were due principally to polymorphonuclear cells. No difference in the red cell count or haemoglobin of the blood of children, getting either butter-fat or margarine as their dietary fat, was observed by Leichcnger and associates [1948]. The following study was carried out to find out the effect of ingesting different fats and oils along with a stan~ard synthetic diet on the blood picture when the ingestion of vitamin A \\·as restricted to a sub-optimum level.
E:rperim~mtal
The blood pictwe offourth generation rats, which were fed the basal synthetie diet (mentioned in Experiment III, Chapter VI) containing~ per cent of co'!' gTttt!, groundnut, mustard, mahua or coconu~ oil or 'Dalda', was stud1ed. The exr~rliDentJll procedure, fe£ding, management of enirenls at:d Gther cvgnate matt~Is, arl!' gn·pn
in detail in Chapter. VI. ·
'l'he total count of the red blood corpusdl'S, white blood corpuscles, hat'moglobin content, as \\"ell as the differential count vf the leueocytes of t.he blood of the! aLo\·e
75 14ARM
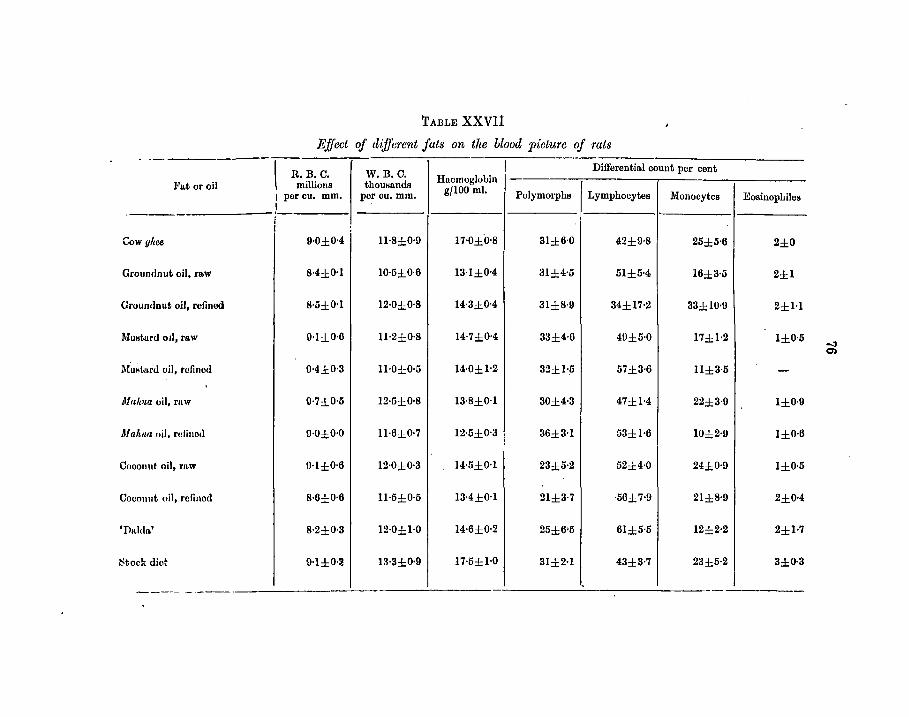
TADLE XXVIl
Effect of different fats on tlte blood picture of rats
Fat or oil \ R.B.C. W.B.C. I Differential count per cent
millions thouHanus llaomoglobin I 1 per cu. mm. por cu. mm. g/100 mi. Polymorphs Lymphocytes Monooytcs Eosioophiles I ! I ;
Cow yltU 9·0±0·4 ll·8±0·0 17·0±'0·8 31±6·0 42±9·8 25±5·6 2±0
Groundnut oil, raw B-4±0·1 10·5±0·6 13·1±0·4 31±4-5 51±5-4 16±3·G 2±1
Grounclout oil, refined !1·5±0·1 12·0±0·8 14·3±D-4 31±8·9 34±17·2 33±10·9 2±H
MuHtard od, raw 0·1 :.l 0·6 11·2±0·8 14·7±0·4 33±4·0 4!l±G·O 17±1·2 1±0·5
0·4±0·3 11·0±0·5 14·0±1·2 32±H 57±3·6 11±3·5 -
Makllauil, mw 0·7±0·5 12·5±0·8 13-8±0·1 30±4·3 47±1-4 22±3·9 1±0·9
llfalt~ta oil, rn!inod '
0·0±0·0 11·6±0·7 12-0±0·3 36±3-1 G3±1·6 10±2·9 1±0·6
Coconut. oil, mw 0·1±0·0 12·0±0·3 14-5±0·1 23±5·2 52±4·0 24±0·9 1±0·5
Coconut oil, rofinod 8·0±0·6 11-5±0·5 13-4±0·1 21±3·7 56±7·9 21±8·9 2±0·4
'Daldn.' 8·2±0·3 12·0±1·0 14·6±0·2 25±6•5 61±5·5 12±2·2 2±1-7
~tock diot 0·1±0·2 13-3±0·9 17-5±1·0 31±2-1 43±3·7 23±5·2 3±0·3
- -··- --
'1'1
rats,_ were carried ~ut when they had just completed eight weeks of experimental feedmg, after weanmg. All the above determinations were made according to the proced~e outlined by Napier and Das Gupta [1945]. Three male rats from each of the ml and fat groups as well as an equal number of similar rats from the stock colony, were examined for the above constituents.
The data relating to the total and differential counts of the cells as well as the haemoglobin content of the blood of the rats getting different oils, cow gh.ee or oomupati, besides those on the stock diet, are given in Table XXVII. It might be observed from the same that the average total R. B. C. count was nearly the same in the stock as well as experimental rats on the different fats. The average total W.B C. count, which range~ from _10·5 X 108 to 12·5 X 108, was a~so about the same in all the experimental rats mcludmg cow-gh.ee fed ones, but slightly lower than that observed in the stock animals, viz. 13·3 X 108• The differential counts, too, were roughly the same in all groups including· cow-gh.ee fed and stock rats. There was, however, a slight tendency for the average percentage of polymorphonuclear cells to be slightly lower in the coconut oil and •Dalda' groups, as compared with the others. The molit. pronounced difference, however, was in the haemoglobin content of the blood. While the average figures for stock rats and the experimental cow-gh.ee fed ones were practically the same, all other groups gave somewhat lower figures. Among the latter, the average figures ranged from 12·5 to 14:·7 gm., which were more or less within the normal values for such animals, while those obtained with stock rats and the cow-glwe fed animals in this experiment, viz. 17·5 and 17·0 gm. respectively, were somewhat higher than what are usually considered normal values.
0 •
DISCUSSION
Leichenger et al., [1948] did not find any difference in the red cell count and the haemoglobin content of the blood of children getting butter-fat or margarine as their dietary fat. In the present experiment too, no differences in the red cell counts were found in the blood of rats. getting different fats, though there was a tendency for the haemoglobin content of the cow-gltee fed animals to be somewhat higher than those of the other fat groups. However, the latter figures were approximately equal to that given by Geyer and associates [1947a] as normal The total W. B. C. count found by the latter workers in their rats was somewhat higher than that obtained in this experiment, but their minimum value of 13·5 X I ()I agreed fairly well with that obtained on our stock rats, viz. 13·3 X 108
• This lowering in the total W. B. C. count has been associated with vitamin A deficiency by Abbott and co-workers (1939]. Brenner and Roberts (1943] had also found some relationship between vitamin A deficiency and the general defence mechanism of the ~Y· Since all the experimental animals were on a diet supplying only sub-optimum amounts of vitamin A, this tendency for a slight lowering of th~ to~ W. B. C. may be an indication of incipient vitamin A deficiency.· The low VItamm A reserves found in the livers of these animals (Chapter XI) would be a further support for this presumption. Though the extent of decrease in the average total W. B. C. count observed by Berry et al., (1945] was no~. seen here, yet t_he val~es were slightly lower than those of the stock rats. \\ 1th regard _to the d1ffere~ttal count, there seemed to be no material difference between the different expenmenta.l or stock animals. Howt'iver, inthe coconut oil and 'Dalda'-fed rats there wu &
'18
tendency for fue polymorphs to be somewhat lower than the others. When this is coupled with the slightly lower total W. B. C. counts as well, it would seem that they indicate a condition which might render them more susceptible to acute bacterial infection than others. This is in line with the hypothesis of Berry and associates [loc. cit.] that resistance to certain bacterial infections may be lowered by inadequate diets. As has been shown elsewhere (Chapter XII), the vitamin A reserves in the liver of the. animals of these two groups were also about the lowest among all the groups. However, since the number of observations were small and as there were considerable individual variations, more work would seem essential before any definite conclusions regarding the comparative effects of the different £ats on the blood picture could be drawn.
. CIIAP1ER IX
THE EFFECf OF DIFFERENT FATS AND OD.S ON PROTEIN METABOLISM
By N.D. KEliA.a, T. S. Krusmr.ur and R; C:H..um.t. . T HOUGH a coll.Siderable amount of work has been done on the inftuence of
- different dietary fats on the absorption and utilization of vitamins, minerals. etc., very little seema to have been done regarding their effect on protein metabolism. . Maignon [1933-34] observed that fats had a favourable effect on the utilization of protein for synthetic purposes and on nitrogen metabolism. Forbes et al., [1946. 1946, a, b, c] have studied the effect of the level of dietary fat on protein and energy metabolism. As, however, no work seems to have been carried out regarding the
· relative effects of different fats on protein absorption and metabolism work. &comparison of different vegetable oils as well as lard and w,naspatis with cow ghee is reported here. - ·
Metabolism experiment~ were carried out with adult rats to compare the comparative. effect of groundnut, cotton-seed, coconut, makua, til and mustard oils, three brands of hydrogenated groundnut oil and two brands each of hydrogenated cotton-seed and sesame oils, as well as lard and cow ghee, to compare their effect on protein metabolism, as measured by the digestibility coefficient and biological value of the dietary protein. Both raw and refined samples of each of the oils were studied. The synthetic diet employed ·in the growth experiments, reported in Chapter VI was used.
Six ad;ut rrui.le rats from the Institute stock colony about 300 gm. in weight each, were selected and housed in individual cages with raised wire screen bottoms. They were then put on the following fat-free diet :
Dextrinised starch 64: plus 5 y of ~-carotene Casein (extracted) 24: plus 10 I.U. of vitamin ·D
Y~ast (extracted) 8 per head per day
Salt mixture 4 -100
The animals were fed ad zif, and had constant access to fresh water from a selffeeding bottle. After a preliminary period o~ ten d~ys. a metabolism expertment lasting three days, was carried out, during whtch per~od the exact food oonsump-. tion was determined and the total excretion of urme and faect"A was collected quantitatively and analysed.
UA.RfM. 17
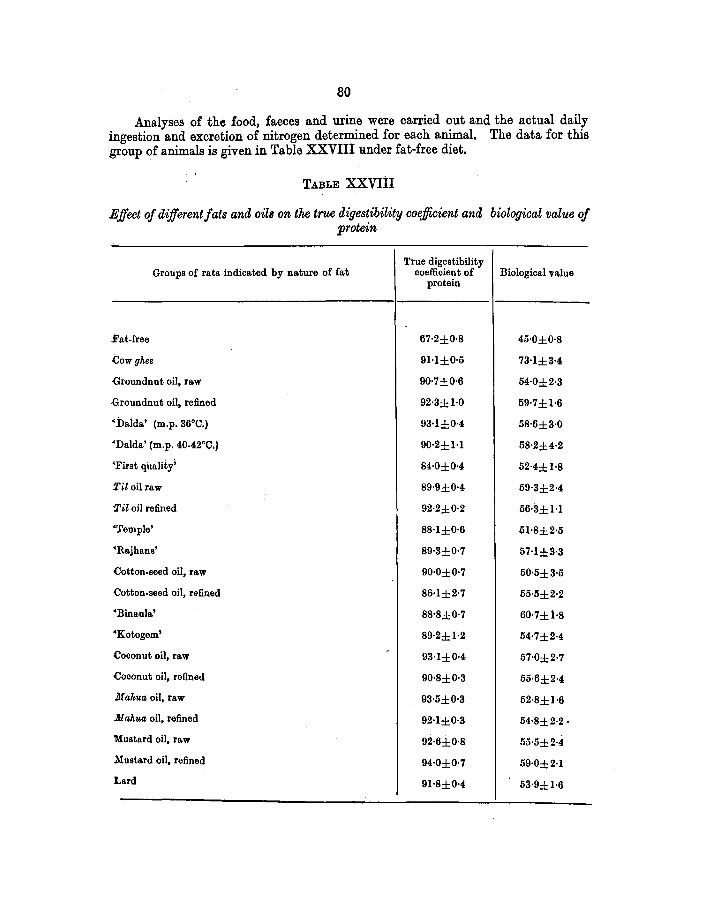
80
Analyses of the food, faeces and urine were carried out and the actual daily ingestion and excretion of nitrogen determined for each animal. The data for this group of animals is given in Table XXVIII tmder fat-free diet.
TABLE. XXVIII
Effect of different fats and oils on the true digestibility coefficient and biological value of protein
Groups of rats indicated by nature of fat True digestibility
coefficient of Biological value protein
Fat-free 67·2±0·8 45·0±0·8
.Cow ghee 9H±0·5 73-1±3·4
Groundnut oil, raw 90·7±0·6 54-0±2·3
Groundnut oil, refined 92·3±1·0 59·7±1·6
•i:>aida' (m.p. 36°C.) 93·1±0·4 58·6±3·0
•Dalda.' (m.p. 40-42°C.) 90·2±1-1 58·2±4-2
•First qiia.lity' 84-0±0·4 52·4±1·8
Til oil ra.w 89·9±0·4 59·3±2·4
Til oil refined 92·2±0·2 56·3±1-l
•Temple' 88·1±0·6 lil-8±2-5
•Ra.jha.ns' 89·3±0·7 57-1±3-3
Cotton-seed oil, ra.w 90·0±0·7 50·5±3·5
Cotton-seed oil, refined 86·1±2·7 55·5±2·2
•Bina.ula' 88·8±0·7 60·7±1·8
•Kotogem' 89·2± 1·2 54·7±2-4
Coconut oil, raw 93-1±0·4 57·0±2·7
Coconut oil, refined 90·8±0·3 55·6±2-4
M ahua oil, raw 93·5±0·3 52·8±1·6
Mahua oil, refined 92·1±0·3 54·8±2·2.
'Mustard oil, raw 92·6±0·8 55·5±2·4
:Mustard oii, refined 94-0±0·7 59·0±2-1
Lard 91·8±0·4 53·9±1·6
81
Simultaneously, a gronp .or 126 adult male rats, each weighing about 300 gm. '!'as selected from the Institute stock colony and divided into 2l&imilar groups of 81X each. They were then put on the following diet, sub-e.dequat6 in vitamin A :
Dextrinised starch) Casein (extracted) lreast(extracted} Salt mixture Experim,ental oil or fat
24: pillS 10 I.U. of vitamin D, 59 }Pl1185 yof(4-carotene
8 per he&d per day 4: 5
100
Each of the groups was gi'v'en the above diet containing one of the different oils and. fats. When cow ghee formed the dietalj fat, the dosAge of vitamin A. \vas equated. The experiment with each fat or oil eonsisted of a prelimina.ry period of four days, followed by an experimental period of three days during which (latter period) the ex:a.ct food consumption was determined and the total excretion of_ faeces and urine
-collected quantitatively and measured, as before. To determine the exact intake and outgo of N, the analysis of the food, faeces and urine of each of the experimental rats was also carried out as already described.
. The excretions of metabolic faecal N and the endogenoll8 urinary N were deter· mined in a similar separate group of adult male rata which were fed the following N-free ration: ·
Dextrinised starch
Sucrose
Cow ghee
Salt mixture
81
10 5
4:
ToTAL 100
Each animal received dally 8 i.tJ. of vitamin A, i. y caiciferoi and 1 c.c. of 20 per cent marmite solution.
The determination of the exact nitrogen intake and excretion, as well as the ·analysis of the food, faeces and urine, ~e ta~ed out for e&c;h of the ~fferent animals From these the average daily excretion of metabobo faecal mtrogen, express~d as gm. N pe; 100 gm. of dry faeces, as advocated by Kehar and Mukh~rjee tl949], and endogenous urinarynitrogen expressed as mg. N per 100 gm. body we~ht, were found to be 1·38 and 15·7 respectively. Th~e ~~ wer~ u~ to deter~e the true digestibility coefficient !U w~n as the b1ologlc&~ value of dietary prote111. in each of the fat-diets. The b1olog1cal value was estimated by the .method of Mitchell [1923-24] as modified by Mukherjee and Kehar (unpublished resutta).

82
The results of the experiments are given in Table XXVIII. From the same, it may be seen that the digestibility·as well as the biological value of the protein .was raised by the addition of fat to the diet. Replacement of 5 per cent of the starch of the above fat-free diet by an equal weight of cow ghee, improved the digestibility of the protein by 36 per cent and increased its biological value by 62 per cent. Replacement of cow gkee by an equal weight of any of the vegetable oils, vanaspati or lard did not seem to materially affect in general the improvement in digestibility 'of the protein'. Statistical analysis re:veals that 'First Quality', 'Temple ' and 'Binaula' fed rats showed significantly lower whereas 'Dalda' (m.p. 36°C.) fed rats gave significantly higher digestibility of protein, as compared to the cow-gkee fed rats. The rise in the biological value as compared to that on the fat-free diet was much less, being only about 12 to 35 per cent. Hence, when the vitamin A ingestion was restricted to a sub-optimum level, cow gkee seemed to be significantly superior to other oils and fats, as it enabled a more efficient utilization of the dietary protein as judged by its higher biological-value. This beneficial effect of fat on protein metabolism, observed here, is in agreement with the observations of Maignon [1933-34] and Kehar and Chanda [1948]. The superiority of cow gkee over other fats, enabling a better utilization of protein, may be due to the ability of cow gkee to make better use of the sub-optimum ingestion of vitamin A as has been demonstrated further by the higher storage of vit'amin A in the liver by. animals getting cow gkee (Chapter 11). The effect of low diet~ry provision of vitamin A in decreasing protein utilization has been observed by Reitzman et al., [1945] on calves. There were no marked differences between oils and fats other than cow ghee, in their effect on protein metabolism. Neither refining nor hydrogenation seemed to have a significant effect on the parent oil, with regard to its effect on the digestibility and utilization of the dietary protein.
The poorer growth of the oils or vanaspatiJed rats observed in the second and subsequent generations when given a basal ration sub-adequate in vitamin A (Chapter IV ) may perhaps be due, at least partly, to this lower efficiency of protein ·utilization on such a diet.
Effect of supplementation with B-vitamin:s .-Hartwell [1922; 1928], Reader and Drummond [1926] as well as Hassan and
Drll1lllll:ond [1927] have shown that an adequate provision of B-vitamins is essential for the proper utilization of dietary protein. Boutwell et. al., [1945] also indicated that the req~irement~ of B-vitamins were enhanced when corn oil was fed in place o~ bu~ter-fat m t~e d1et. I~ order to study the effect of supplementation with BVItamms on protem metabolism, the group of rats receiving raw groundnut oil and 'Dalda' (M.P. 36° C.) were used. After the test with the above fats on tl e basal diet was over, they were given the following amounts of B-vitamins and the experi-ments repeated-in an exactly similar manner. . .
Thiamine 30y ·1· Riboflavin 30y Pyri~oxin 30y rper rat per day Calcmm pantothenate 100y J . ·
and . · ·J · Nicotinic acid. ·1· mg1 J
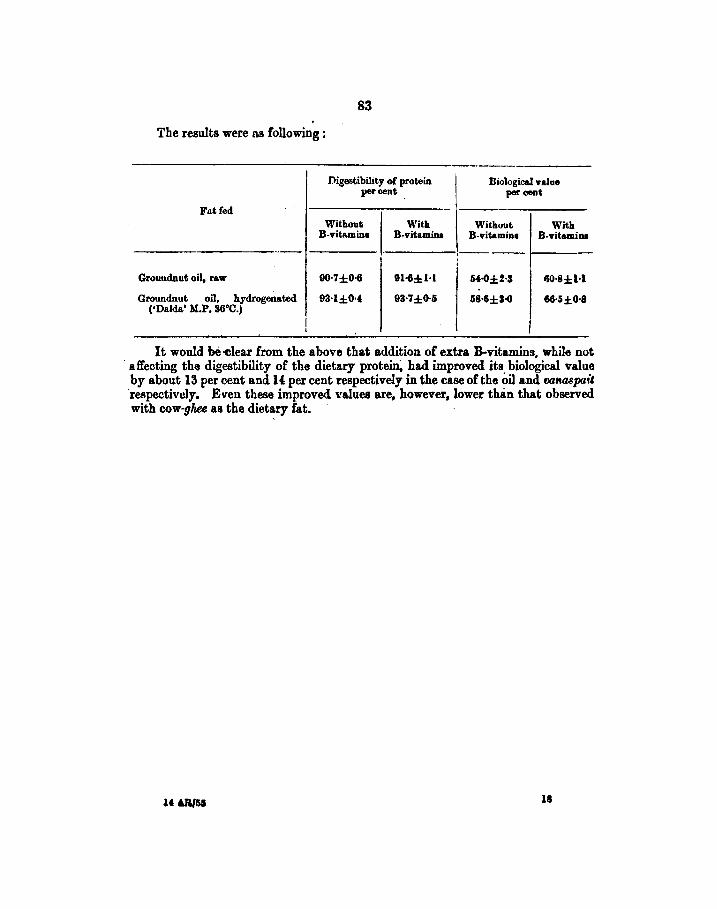
83
The results were as following :
Digestibility of protein i Biological yaJue peroent per cent
F11.tfed Without With Without With
B-Yitamina B-vitamina B-vitamin• B-Yit&miDI
-- ' --I
Gr<>uudnut oil, raw 90·7±0·6 91-6±1-l 6'-6±!-S 60·8:H·l
Groundnut oil, hydrogenated (•Dald&' M.P. 36°0.)
93-l±O·i 93-7±0·6 68·6±3-G 66-6±0·8
I I I
It would be -clear from the above that addition of extra B-vitamins, while not · affecting the digestibility of the dietary protein, had improved its. biological value
by about 13 per r-ent and 14: per cent respectively in the case of the oil and vaMSpail ·respectiv"ly. Even these improved values are, however, lower than that observed with cow-ghee as the dietary fat.
18
CHAPTER X
INFLUENCE OF FATS ON ABSORPTION OF CALCIUM AND PHOSPHORUS
By N. D. KEHAR, T. S. KRISHNAN and R. CHANDA
I T is generally admitted that dietary fat has a beneficial in1luence on the absorption of calcium. Though the antirachitic properties of fat in the diet
have been noticed by several workers, [Jones, 1940, Booth et. al., 1942, French, 1942, Dutt, 1945, Datta, 1948 and others], there is no complete unanimity regarding the comparative value of different fats for _this purpose. Whereas Booth et al., (1942], Euler and associates [1941, 1942] and others did not notice any difference between butter-fat, margarines, vegetable oils, lard, etc. in this respect, other in• vestigators like Hagnell-Zethraeus and collaborators [1942], French and Elliott [1943], Dutt (1945], Basu and Nath (1946 b] and Westerlund [1947-48] have observed differences between them, generally finding butter-fat superior to the others. Consequently, the following study was carried out to compare the effect of ingesting cow gkee, vegetable oils, vanaspatis and lard, as dietary· fats on the calcium and phosphorus assimilatipn in the rat. :
To determine their effect on calcium and phosphorus retention, metabolism experiments were carried out with cow gkee, six different vegetable oils generally used for human consumption andfor for the manufacture of vanaspatia, seven brands of vanaspati made by the hydrogenation of three different oils and lard as dietary fat. Both raw and refined samples of each of the oils were studied. The experimental technique employed, the diet used, the fats and oils tested, and other cognate factors were exactly the same as described earlier in Chapter IX. ·
The fat-free diet (Chapter IX) served as the negative control while the basal diet plus cow gkee formed the positive control.
Another experiment to determine the percentage of ash in the bones of growing "animals fed different fats, was carried out as follows:
Female stock rats were kept in & dark room and mated. The young ones were weaned at 28 days of age and divided into seven similar groups of six rats each. These were given the same basal ration as fed to the rats in the metabolism tests, the fats tested were cow ghee, two vanaspatis made by hydrogenation of groundnut oil ('Dalda.' M.P. 40°·42°C) and ('First Quality No. 1'), two vanaspati-1 made by hydrogenation of sesame oil ('Temple' !II.P. n °-45° C), and ('Rajhans' M.P. 42° C.) and two wnaspatia made bY' hydrogenation of cotton-seed oil ('Kotogem' M.P. n• C. and 'Binaula' M.P. 37°-40° C). The amount! of vitamins A and D fed also remained exactly the same as in the growth experiments, viz. 8 I.U. of vitamin A and 30 I.U. of vitamin D per rat per day. This ration was fed to the weanling rats for four weeks. The technique of feeding, housing, management, etc. were according to the standard
85 U ARfts5 ·
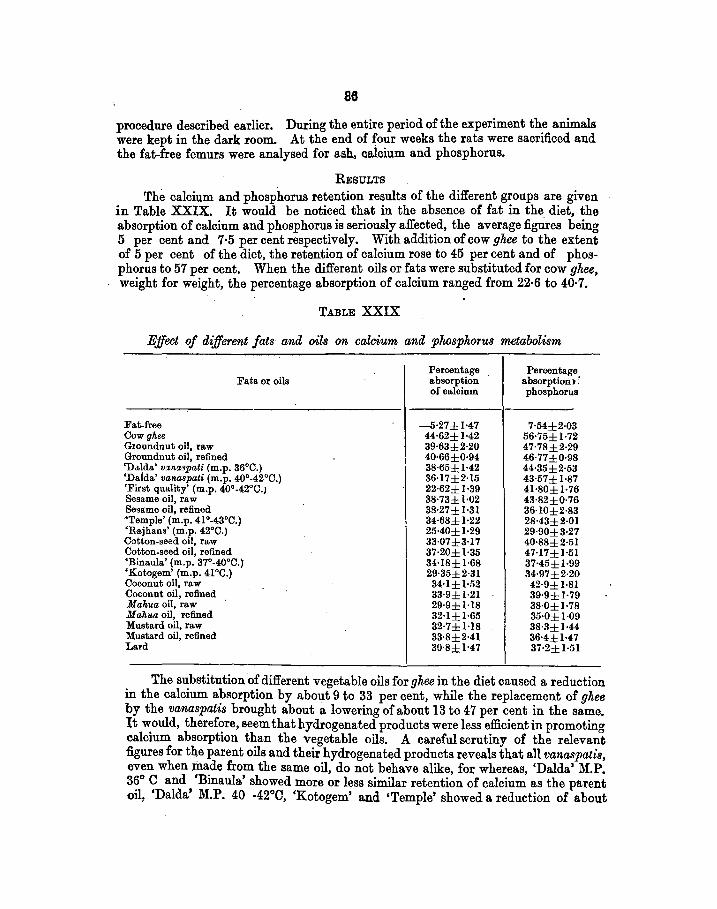
86
procedure described earlier. During the entire period of the experiment th_e animals were kept in the dark room. At the end of four weeks the rats were sacrificed and the fat-free femurs were analysed for ash. calcium and phosphorus.
RESULTS
The calcium and phosphorus retention results of the different groups are given in Table XXIX. It would be noticed that in the absence of fat in the diet, the absorption of calcium and phosphorus is seriously affected, the average figures being 5 per cent and 7·5 per cent respectively. With addition of cow ghee to the extent of 5 per cent of the diet, the retention of calcium rose to 45 per cent and of phosphorus to 57 per cent. When the different oils or fats were substituted for cow ghee, weight for weight, the percentage absorption of calcium ranged from 22·6 to 40·7.
TABLE XXIX
Effect of different fats and oils on calcium and phosphorus metabolism
Fats or oils
Fat-free Cow ghee Groundnut oil, raw Groundnut oil, refined 'Da.lda' V!J,na~pati (m.p. 36°0.) 'Dalda' vanaspati (m.p. 40°-42°0.) 'First quality' (m.p. 40°-42°C,J Sesame oil, raw Sesame oil, refined 'Temple' (m.p. 41°-43°0.) 'Rajhans' (m.p. 42°0.) Cotton-seed oil, raw Cotton-seed oil, refined 'Binaula' (m.p. 37°-40°0.) 'Kotogem' (m.p. 41"0.) Coconut oil, raw Coconut oil, refined Mahua oil, raw M aliua oil, refined Mustard oil, raw Mustard oil, refined Lard
Percentage absorption of calcium
-5·27±1·47 44·62±1-42 39·63±2·20 40·66±0·94 38·65±1-42 36·17±2·15 22·62±1·39 38·73±1-02 38·27±1·31 34-68±1·22 25·40±1·29 33·07±3-17 37·20±1·35 34·18±1·68 29·35±2·31 34-1±1·52 33·9±1·21 29·9±1-18 32-1±1·65 32·7±1-18 33·8±2·41 30·8±1-47
Percentage absorption J: phosphorus
7·54±2·03 56·75±1·72 47·78±2·29 46·77±0·98 44·35±2·53 43·57±1-87 41·80±1·76 43·82±0·76 36·10±2·83 28·43±2·01 29·90±3·27 40·88±2·51 47-17±1·51 37·45±1·99 34·97±2·20 42·9± 1-81 39·9±1·79 38·0±1·78 35·0±1·09 38·3±1-44 36·4±1-47 37·2±1·51
The substitution of different vegetable oils for ghee in the diet caused a reduction in the calcium absorption by about 9 to 33 per cent, while the replacement of ghee by the vanaspatis brought about a lowering of about 13 to 4 7 per cent in the same. It would, therefore, seem that hydrogenated products were less efficient in promoting calcium absorption than the vegetable oils. A careful scrutiny of the relevant figures for tl:te parent oils and their hydrogenated products reveals that all vanaspatis, even when made from the same oil, do not behave alike, for whereas, 'Dalda' J\I.P. 36° C and 'Binaula' showed more or less similar retention of calcium as the parent oil, 'Dalda' M.P. 40 -42°0, 'Kotogem' and 'Temple' showed a reduction of about
87
10 per cent from .the same. :First Quality No. 1' and 'Rajhans', however, recorded m~ch lower cale1um absorption· than the corresponding parent oils, the decrea.se being about 4:7 per cent and 34 per cent respectively. When lard replaced the ghu, the calcium value was reduced by about 31 per cent. ·
In .the case of phospho~ too, the absorption figuXes were lower when the vegetable oils, lard or oonaspat"' replaced the cow ghee, as was observed with calcium. 9fhe range of the figures of absorption with different fats in the diet was also roughly of the same ~gnitude for both the minerals. With the oils in the diet, the phosphorus absorption figures were about 16 to 38 per cent lower than that recorded when the cow ghee formed the dietary fat. The lard-fed animals gave an absorption value about 35 per cent less than the cow ghee group. The substitution of the vanaBpatiB for the ghee or parent oils in the dietary led to a decrease in retention of phosphorus which ranged from about 22 to 50 per cent and 7 to 35 per cent respectively. '!'he behaviour of the different hydrogenated products from the same oil was more uniform in this case than was seen with calcium. <fhe maximum decrease was seen in the hydrogenated sesame oils and the least with hydrogenated groundnut oils. Between the different vegetable oils (other than groundnut oil), there was generally no significant difference with regard to phosphorus absorption. Raw groundnut oil was slightly better than the rest. Lard was somewhat less efficient than 'Dalda'.
The absorption of phosphorus was somewhat better than that of calcium in nearly all the fats tested. In the case of refined makua, til and mustard oil, the difference between the calcium and phosphorus absorption figures was less than t~at observed with other fats and oils. There did not seem tQ be any consistently marked difference between the raw and refined oils in their capacity to promote calcium and phosphorus absorption. Hydrogenation appeared to affect significantly the efficiency of the parent oil to promote calcium and phosphorus absorption though the extent of the loss of efficiency varied with the nature of the hydrogenated product. 'I'he statistical analysis of the data reveals that refined groundnut oils yield results comparable to cow ghee for the absorption of calcium but cow ghu appears to give better results than any other fat for the absorption of.phosphorus. ·
The bone ash percentage was somewhat higher in ghu-fed rats than in the 1Janaspati-fed ones but the calcium and phosphorus contents as well as the calcium phosphorus ratio of the bones were practically unaffected by the nature of the dietary fat (Table XXX).
DISCUSSION
The antirachitic property of fat as evidenced by improved calcium assimilation, noticed by Knudson and Floody [1940], Jones [1940) and others has been substantiated by these experiments. Whereas Booth d al., [1942] as well as. Euler and aBSOciates [1941; 1942] found no differences between different fats~ like butter-!at, vegetable oils, margarines and lard in their effect to promote mcreased calclUm aBBimilation, the present results show a significant superiority of ghu over the others. 'I'hese results are in agreement with the findings of the work of Hagnell-Zethraeua et al., [1942], French and Elliot (194:3], Dutt [1945] and Westerlund [1947-tS] as well u Keha: and Chanda l1948]. _Whereas Dutt [19(~] found a decrea.ae of U
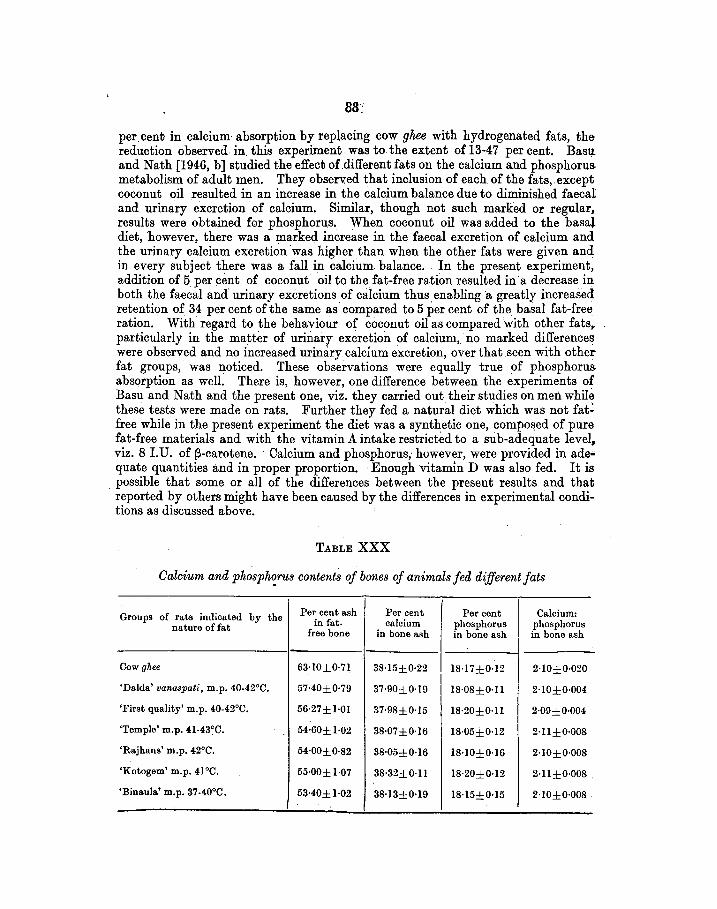
per cent in calcium absorption by replacing cow ghee with hydrogenated fats, th~ reduction observed in. this experiment was to the extent of 13-47 per cent. Basu and Nath [1946, b] studied the effect ofdifferent fats on the calcium and phosphorus. metabolism of adult men. They observed that inclusion of each of the fats, .except coconut oil resulted in an increase in the calcium balance due to diminished faecal and urinary excretion of calcium. Similar, though not such marked or regular, results were obtained for phosphorus. When coconut oil was added to the basal diet, however, there was a marked increase in the faecal excretion of calcium and the urinary calcium excretion 'was higher than when the other fats were given and in every subject there was a fall in calcium. balance .. In the present experiment, addition of 5 per cent of coconut oil to the fat-free ration resulted in· a decrease in both the faecal and· urinary excretions of calcium thus enabling ·a greatly increased retention of 34 per cent of the same as· compared to 5 per cent of the basal fat-free ration. With regard to the behaviour of coconut oil as compared with other fats~ particularly in the matter of urinary excretion of calcium, no marked differences were observed and no increased urinary calcium excretion, over that seen with other fat groups, was noticed. These observations were equally true of phosphorus absorption as well. There is, however, one difference between the experiments of Basu and Nath and the present one, viz. they carried out their studies on men while these tests were made on rats. Further they fed a natural diet which was not fat: free while in the present experiment the diet was a synthetic one, compo1led of pure fat-free materials and with the vitamin A intake restricted to a sub-adequate level, viz. 8 I.U. of ~-carotene. Calcium and phosphorus; however, were provided in ade• quate quantities and in proper proportion. ·Enough vitamin D was also fed. It is possible that some or all of the differences between the present results and that reported by others might have been caused by the differences in experimental conditions as discussed above.
TABLE XXX
Calcium and phosphorus contents of bones of animals fed different fats
Groups of rats indicated by the Per cent ash Per cent I Per cent Calcium: nature of fat in fat- calcium phosphorus phosphorus
free bone in bone ash in bone ash in bone ash
Cow ghee 63·10±0·71 38·15±0·22 18·17±0·12 2·10±0·020
'Dalda' va1UU1pati, m.p. 40-42°C. 57-40±0·79 37-90±0·19 18·08±0·11 2·10±0·004
'First quality' m.p. 40-42°C, 56·27±1-01 37·98±0·15 18·20±0·11 2·09±0·004
'Temple' m.p. 41-43°C. 54·60±1-02 38·07±0·16 18·05±0·12 2-11±0·008
'Rajhans' m.p. 42°C. 54·00±0·82 38·05±0·16 18·10±0·16 2·10±0·008
'Kotogem' m.p. 41°C. 55·00±1·07 38·32±0·11 18·20±0·12 2-11±0·008'
'Binaula' m.p. 37-40°C. 53-40±1·02 38·13±0·19 18·15±0·15 2·10±0·008
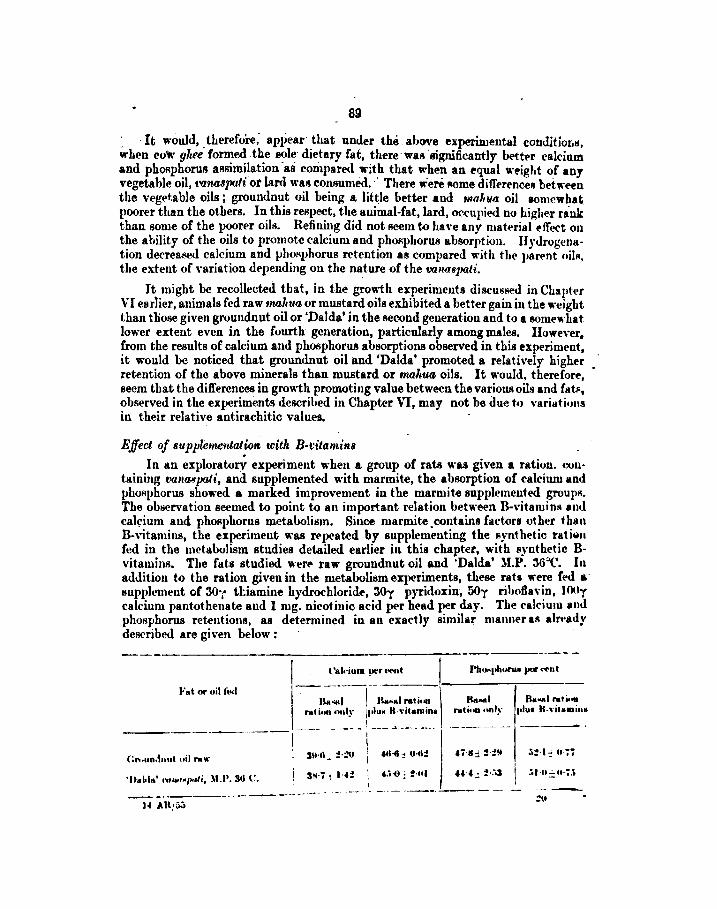
89
: It would, -therefore; ap}Jear· that under the above experimental conditioLII, 'W'hen cow gltte formed. the SQle· dietary fat, there· wu ·significantly bettt>r calcium and phoRphorus aBRimilation ·aa compared with that 1rhen an equal weight of any vegetable oil, tVl'IUISpalior lard was consumed. - There were Mme difference" beiwt>en the wgetab)e oils; groundnut oil being a little better and maliva oil aomewhat poorer than the others. In this re~~pect, the animal-fat, lard, oc.cupied no higher rank than some of the poorer oils. Refining did not 11eem to have any material effect on the ahility of the oils to promote calcium and phosphorus absorption. Hydrogenation decreased calcium and pho11phorus retention as compared with the part>nt nilfl, the extent of variation dt>})ending on the nature of the OOIUlBJJali.
It might be recollected that, in the growth experiments discussed in Chaph•r VI earlier, animals fed raw tnalwa or mustard oils exhibited a better gain in the weight than tliose given groundnut oil or 'Dalda' in the second generation and to a somewhat lower extent even in the fourth generation, particularly among males. However, from the results of calcium and phosphorus absorptions observed in this experiml'nt, it would be noticed that groundnut oil and 'Dalda' promoted a relatively higher retention of the above minerals than mustard or maltua oils. It would, therefore, seem that the differences in gro·wth promoting value between the various oiL<t and fat11, observed in the experiments described in Chapter VI, may not be 011e to \'ariations in their relative antirachitic values.
Effect of supplementation with B-titamina
In an exploratory experiment when a group of rats was given a ration. containing vamupati, and supplemented with marmite, the absorption of calcium and pho11phorus showed a marke.d improvement in the marmite supplemented groups. The observation se.emed to point to an important relation betwe.en B-,·itamins and cal~ium and pho11phorus metabolism. Since marmite_contains factors other than B-vitamins, the experiment was rt>peated by supplementing the 11ynthetic rati~n fed in the metabolism studies detailed earlier in this chapter, with synthetic Bvitamins. The fats studied werP raw groundnut oil and 'Dalda' li.P. 36°C. lu addition to the ration given in the metabolism experiments, these rats were Ct'd a supplement o( 30·: tl:iamiue hydrochloride, 30y pyridoxin, 50y riho6niu, lOOy calcium pantothenate and 1 mg. nicotinic acid per head per day. The c.-alc.-ium and phosphorus retentions, as determined in an exac.-tly similar manner as all't'ady described are given below:
Fat or oil ft,.J
-----~
r:~.un,iuut nilra\\~ l
f'al.-ium ~r<'l'tll
-. -n ..... J--,--n ...... rat inn
ratio.n only II''"" K-'l"ilamina I
----- ----- - l --- ~· ----
I I '"-6-· o-11_, I ... - -
I 4.H); :!·UI ' . I
--------------------··-----
& ... I rat ina nnly
s .... l ,.,;.,. t•h•• K-,·itawin•
90
It would be clear from the above data that calcium balance was raised by 18 and 16 per cent and phosphorus retention by 9 and 15 per cent when the oil and vailaspati respectively were supplemented with additional· B-vitamins. The in creased retention equalled·that obtained with the gltee in the case of calci·um and ·approached it in the case of phosphorus. ·
CHAPTER XI
ABSORPTION OF CAROTENE AND LIVER STORAGE OF VITAMIN A
N. D.KEHAR,S.N.RAv, T. S.KRISHNAN, B.C.JosHJ,andA.K.PAL
SINCE differences between the growth promoting values of ghee, vegetable oils, vanaspatis and lard were observed in the experiments reported in Chapters
V and VI, and as the dietary allowance of vitamin A was sub-adequate in many of the tests, it was decided to find out the comparative efficiencies of the different fats to promote the storage of the ingested carotene and vi tum in A in the liver as vitamin A. Though growth response is often used as a general index of the efficiency of vitamin A utilization, yet, as growth is influenced by several factors besides the level of vitamin A ingestion, it is not as reliable an index of vitamin A and carotene utilization as storage of vitamin A in the liver which had been used for this purpose ever since the cla!!sical work of:Moore (1929) demonstrating the conversion and storage of carotene as vitamin A in the liver. The animals of the Experiments I, IIJ, V and VI were utilized for studying this aspect in the different dietaries. The results are given below, The determination of the liver vitamin A was carried-out by the method of Davies [1933] except that the unsaponifiable matter was dissolved in aldehyde-free pure ethyl alcohol and the vitamin A measured by a. Tiilger vitameter.
Experiment'!
After tho young ones in the various generations were weaned, ~heir parents were sacrificed and the livers were examined for vitamin A content. As the total vitamin A. content per gram of liver was found to increase with the age of the animals and as animals of various ages were examined, the average rate of deposition of the vitamin, i.e. the total vitamin A content divided by the age of the animals, was nsed instead. The results are given in Table XXXI. It will be seen that in spite of the fact that all the groups were receiving plenty of carotene in the form of green fodder (five grams daily for the last three to four months of their lives), the livers of the vanaspati-fed rats contained much less vitamin A than those of the gltu ingesting ones. The amount of vitamin A and carotene fed to gltee-fed rats through the ghee was very small as compared with the total amount of carotene fed as greens. Thus the total carotene ingested daily through greens wa~ about 250-300 I.U., while the maximum amount of vitamin A and carotene supphed through gltH never exceeded above 10 I.U. per head per day._ In spite of this f~ct! the liver storage of vitamin A by most of the rats of the vanaspati group was . s1gmficantly lower than that of the cow ghec-fed animals. It is reasonable to beheve~ therefor~\ th~t the presence of vam1.spatis in the diet, iuterfered with the absorption or utahzabon of dietary carotene. Statistical analysis of the data confirms that cow gltH appears to
!)1 14AR/SS . 21
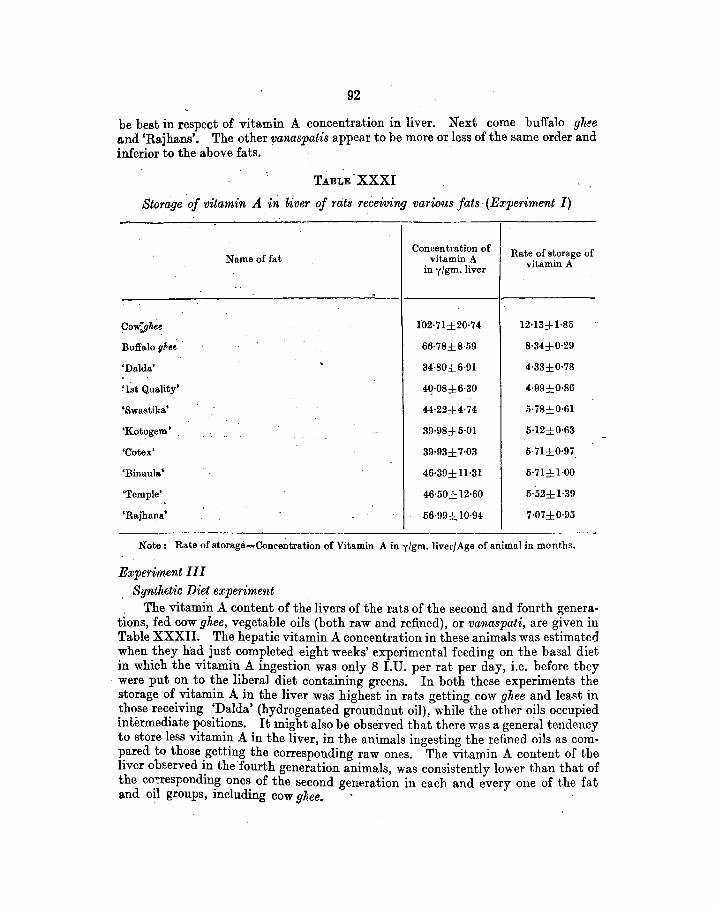
92
be best in respect of vitamin A concentration in liver. Next come buffalo gl~~e and 'Raj hans'. The other vanaspatis appear to be more or less of the same order and inferior to the above fats.
TABLE'XXXI
Storage of vitamin .A in "tiver of rats receiving various fats· (Experiment I)
Name of fat
Cow~gket
Buffalo gl>e-.
'Dalda'
'1st Quality'
'Swastika'
'Kotogem'
'Cotex'
'Binaula•
'Temple'
'Rajhana.'
Concentration of vitamin A
in y/gm. liver
102-·71±20·74
66·78±8·59
34·80±6·91
4q·08±6·30
44·22±4·74
39·98±5·01
39·93±7·03
46·39± ll·31
46·50± 12·60
56·99± 10·94
Rate of storage of vitamin A
12·13±1·85
8·34±0·29
4·33±0·78
4·99±0·86
5·78±0·61
5·12±0·63
5·71±0·97
5·71±1·00
5·52±1·39
7·07±0·95
Note: Rate of storage=Conrentration of Vitamin A in y/gm. liver/Age of animal in months.
Experiment II I
Synthet?'c Diet experiment . The vitamin A content of the livers of the rats of the second and fourth genera
tions, fed cow ghee, vegetable oils (both raw and refined), or vanaspati, are given in Table XXXII. The hepatic vitamin A concentration in these animals was estimated when they h'ad just completed eight weeks' experimental feeding on the basal diet in w.hich the vitamin A ingestion was only 8 I.U. per rat per day, i.e. before they
· were put on to the liberal diet containing greens. In both these experiments the storage of vitamin A in the liver was highest in rats getting cow ghee and least in those receiving 'Dalda' (hydrogenated grounduut oil), while the other oils occupied intermediate positions. It might also be observed that there was a general tendency to store less vitamin A in the liver, in the animals ingesting the refined oils as compared to those getting the corresponding raw ones. The vitamin A content of the liver obEerved ~n the fourth generation animals, was consistently lower than that of the co~espondmg ones of the second generation in each and every one of the fat and oil groups, including cow ghee.
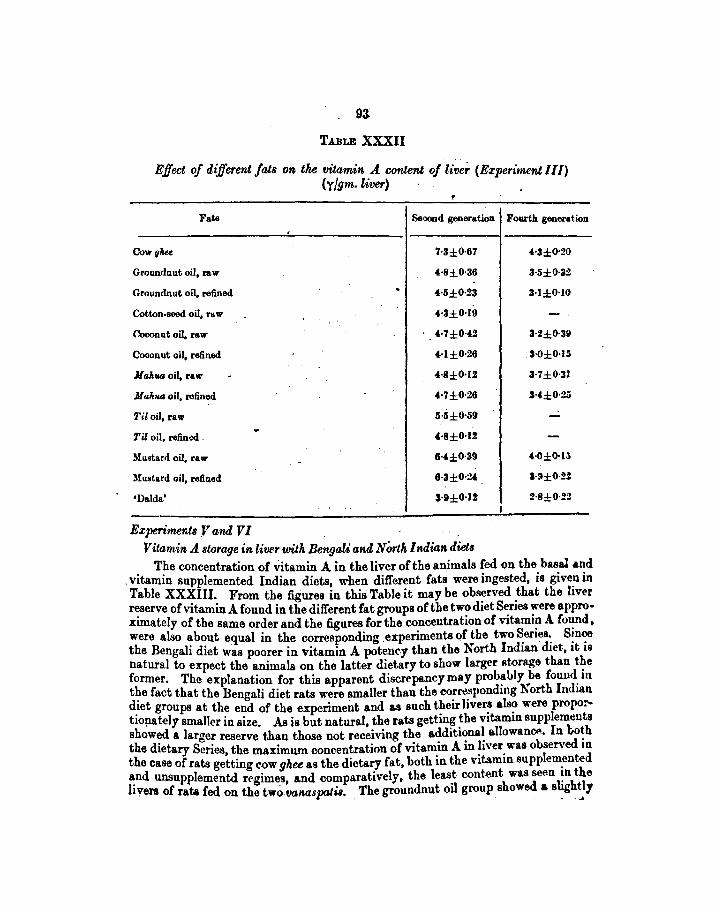
93
TABLE XXXII
Effect of dijferent fats on the vitamin A. content of -liver (Experiment Ill) (yfgm.liver) · .
Fats Seoood generation Fourth generation
Cowghu 7·3±0·67 •·3±0·20
Groundnut oil, raw H±0·36 3-5±0·32
·Groundnut oil. refined 4,·5±0·23 3-1±0·10
Cotton-seed oil, raw H±0·19
Coconut oil. raw •·7±0·•2 3-2±0·3~
Coconut oil. refined H±0·26 3·0±0·15
Maln'a oil. raw 4,·8±0·12 3·7±0·31
M aluua oil, refined 4-7±0·26 3-4±0·20
Til oil, raw s-5±0·59 -Til oil, refint>d . 4-8±0·1%
M11stard oil. raw 6·,±0·39 •·0±0·15
lllllStard oil, refined 6·3±0·2· 3·9±0·22
•Dalda' 3·9±0·12 2-8±0·22
Experiments V and VI . Vitamin A. storage in liver with Bengali atul North Indian diet&
The concentration of Vitamin A in the liver of the animals fed on the basal and . vitamin supplemented Indian diets, when different fats were ingested, is given in Table XXXIII. From the figures in this Table it may he observed that the liver reserve of vitamin A found in the different fat groups of the two diet Series were appro· ximately of the same order and the figures for the concentration of vitamin A found. were also ~h~ut equal in the corresponding experiments of the two ~eries: S!n~ the Bengah dtet was poorer in vitamin A potency than the North Indta.n dtet, 1t 1s natural to expect the animals on the latter dietary to show larger storage than the former. The explanation for this apparent discrepancy may prob~bly ..,.he found_ in t~e fact that the Bengali diet rats were smaller than the cor~spondmg North Indtan d1et groups at the end of the experiment and as such their livers also were proportio!llltely smaller in size. As is but natural. the rats getting the vitamin supplements showed a larger reserve than those not receiving the additional allowanCA"~. In hoth the dietary Series, the maximum concentration of vitamin A in liver was observed io the case of rats getting cow ghee as the dietary fat, both in the vitamin supplem.ented ~nd unsupplementd regim~s, and comparatively, the leas_t content was sean ~n the livers of rata fed on the twovanaspatu. The groundnut 01l group showed a slightly
. . -~
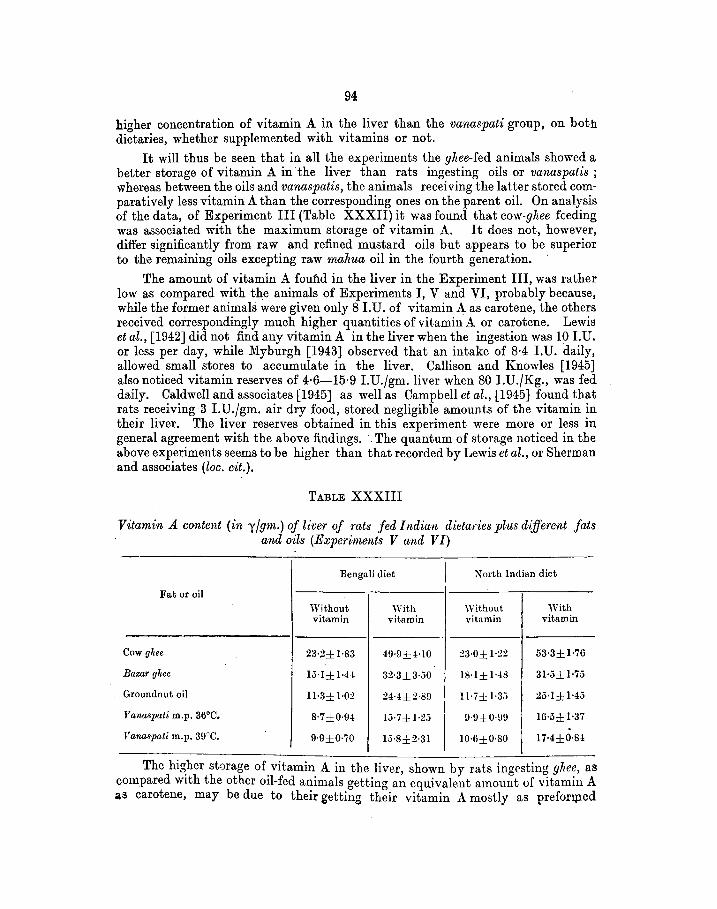
94
higher concentration of vitamin A in the liver than the vanaspati group, on both dietaries, whether supplemented with vitamins or not.
It will thus be seen that in all the experiments the glzee-fed animals showed a better storage of vitamin A in the liver than rats ingesting oils or vanaspatis ; whereas between the oils and vanaspatis, the animals receiving the latter stored comparatively less vitamin A than the corresponding ones on the parent oil. On analysis of the data, of Experiment III (Table XXXII) it was found that cow-ghee fEeding was associated with the maximum storage of vitamin A. It does not, however, differ significantly from raw and refined mustard oils but appears to be superior to the remaining oils excepting raw mahua oil in the fourth generation. ·
The amount of vitamin A found in the liver in the Experiment III, was rather low as compared with the animals of Experiments I, V and VI, probably because, while the former animals were given only 81.U. of vitamin A as carotene, the others received correspondingly much higher quantities of vitamin A or carotene. Lewis et al., [1942] did not find any vitamin A in the liver when the ingestion was 10 I.U. or less per day, while Myburgh [1943] observed that an intake of 8·4 I.U. daily, allowed small stores to accumulate in the liver. Callison and Knowles [1945] also noticed vitamin reserves of 4·6-15·9 I.U.Jgm. liver when 80 I.U.JKg., was fed daily. Caldwell and associates [1945] as well as Campbell et al., [1945] found that rats receiving 3 I.U.Jgm. air dry food, stored negligible amounts of the vitamin in their liver. The liver reserves obtained in this experiment were more or less in general agreement with the above findings. . The quantum of storage noticed in the above experiments seems to be higher than that recorded by Lewis et al., or Sherman and associates (loc. cit.).
TABLE XXXIII
Vitamin A content (i·n yfgm.) of liver of rats fed Indian dietaries plus different fats and oils (Experiments V and VI)
Bengali diet I 1'\ orth Indian diet
Fat or oil
l Without With Without With vitamin vitamin vitamin vitamin
I Cow glzee 23·2±1·83 4!)·9±4·10 :!3·0±1·22 53·3±1·76
Bazar ghee 15·1±1·44 32·3±3·50 18·1± 1·48 31·5±1·75
Groundnut oil ll·3±1·02 24·4±2·89 11·7±1·35 25·1±1·45
Vanaspati m.p. 36°C. 8·7±0·94 15·7 ± 1·25 !J-9±0·99 16·5±1·37
Vanaspati m.p. 39°C. 9·9±0·70 15·8±2·31 10·6±0·80 17-4±0·84
The htgher stQrage of vitamin A in the liver shown by rats inoestin" gltee, as d 'h h ' 0 0 compare wtt t e other oil-fed animals getting an equivalent amount of vitamin A
as carotene, may be due to their getting their vitamin A mostly as preforrp.ed
95
vit~min A whereas o~hers got it as carotene, since Gray et al., [1940] ·as well a.s TreiChler and assoctates [1942] have shown that greater storage in liver takes place from vitamin A than from an equivalent amount of ingested carotene. However, it has been found in Experiments I, V and VI, that when rats were given even plenty of carotene or vitamin A, on the same rations, the gkee-fed animals invariably stored a higher percentage of the ingested vitamin in the liver than the others. Hence, the form in which the vitamin is ingested, whether as carotene Of vitamin A, may not be the only or even the main reason for this difference in liver storage. Similarly, in the groundnut oil and Dalda or vanaspati-fed animals of the synthetic and human diet series, even when both fat groups ingested equal amounts of carotene or vitamin A, the oil-fed rats recorded a higher vitamin A content in the liver than the corresponding rats ingesting vanaspatil.
Lease et al.; [1939] found approximately equal stores ofvitamin A in the liver of rats when equal quantitietJ. of vitamin A dissolved in different fats were. administered. They found no difference between butter-fat, vegetable oil or hydrogenated fat, in this respeqt. Brown and Bloor [1945] found higher stores of vitamin A in the liver of rats when the dietary fat was rich i~ unsaturated fatty acids. In these experiments, cow ghee, which had a lower degree of unsaturation than groundnut oil or vanaspatis showed a much larger capacity to promote storage of vitamin A in the liver than the latter fats. The difference in tocopherol content of the fats, which has been given as the explanation of the difference by Guggenheim [1944] and Rao [1945; 1945a], also does not seem to be very satisfactory in this case, because, though the tocopherol content of groundnut oil is presumably higher than that of cow gkee, the hepatic storage of vitamin A wa.s higher in animals receiving the ghee than in those getting the oil on the same regime. The difference between the various oils themselves, as also between groundnut oil and • Dalda •, observed in Experiments Ill, V and VI, does not seem .to be completely explained by the above. It would, therefore, seem that there are other factors also controlling the efficiency of utilization of, or regulating the requirements of ingested carot('ne and vitamin A when different fats and oils are ingested in the diet.
The utilization of equal amounts of carotene dissolved m different fat~ ~nd oils, as revealed by growth response of rats, has been found to be near~y sumla r by Coward [1936] as well as Lease et al., [1939]. ~bramso~ and B~uru~ (194~] also found the biological potency of ~-cai"?tene ~lSsolve~ 1n .arachis ml and 111
margarine to be similar as measured by wetght gams of v1tamm A deplet('d rats. Sherman [1941] as well'as Brown and Bloor [1945] have found the stability of~carotene solutions to be greater in oils of soyabean, sun-flower, mustar:d, etc. than in comparatively less saturated fats like lard, re~ed tallow, coconut oal, et.c. sugge~ting that the degree of unsaturation had some mfluence on the same. Guggenheun [1944] and Ra.o [1945; 1945a], however, attributed the above difference betwe<>n the oils and fats to their variation in content of alpha-tocopherol.
In view of the above carotene absorption tests were carried out and the amounts of carotene digested and ~tored in the liver as vitamin A; in the presence of different dietary fats, _were measured.
96
Ex perimcnt A Prepa.ration of rats for ca-rotene absorption study
Stock females, immediately on giving birth to litters, were kept on the following stock diet:
Wheat atta 95 parts I Bran 3 , f-plus whole milk 20 ml. per rat Common salt 1 part ·J per day Calcium carbonate 1 ,
The daily supplement of greens was excluded. From the tenth day onwards the whole milk was replaced by skim inilk. The young animals were weaned on the twentyfirst day or as soon as they attained a weight of 30 grams. They were then separated from their mothers and kept on the following vitamin A and carotene deficient diet.
Starch 64 parts Casein (extracted) 24 , Yeast (extracted) 8 , Salt mixture 4 ,
After two weeks on this diet the animals were ready for the experiment.
Deta.ils of experimental procedurP. Faeces were collected from each individual rat on vitamin A and carotene
deficient diet, supplied ad lib. over a period of seven days. The daily collection was transferred to coloured bottles covered with black paper and stored in a refrigerator. The endogenous excretion of carotene was determined, on these collections, for each individual rat.
The rats were then divided into several groups. One group, serving as control, was getting vitamin-A deficient ration plus cow gl1ee, while the others were receiving vanaspatis instead of gllee, at a level of 5 per cent, mixed up with the same ration. This preliminary feeding continued for four days.
Mter four days, each rat in each group was given extra carotene at the rate of 100 I.U. (=60 y) per kilogramme body weight, per day, in addition to their experi-mental fat ration, as stated above. ·
The carotene was given dissolved in either gltee or the different mnaspatis as laid out in the plan. Twenty four-hourly collection of faeces was started from the very day the dosing of carotene was introduced and continued over a period of nine·days in the same way as stated above. Carotene determined in the collected faeces corrected for endogenous excretion, determined as above, gave the actual excretion in the faeces. The digestibility of carotene in the presence of each of the fats was then worked out.
All the carotene determinations were made by colorimetric method (Sen ar:d Seshan, 1942]. · ·
On the last day of collection, the rats were sacrificed, their livers removed, weighed and sampled and the vitamin-A content estimated. This served as an index of carotene utilization. The estimations of blue units were made by Lovibond Tintometer.
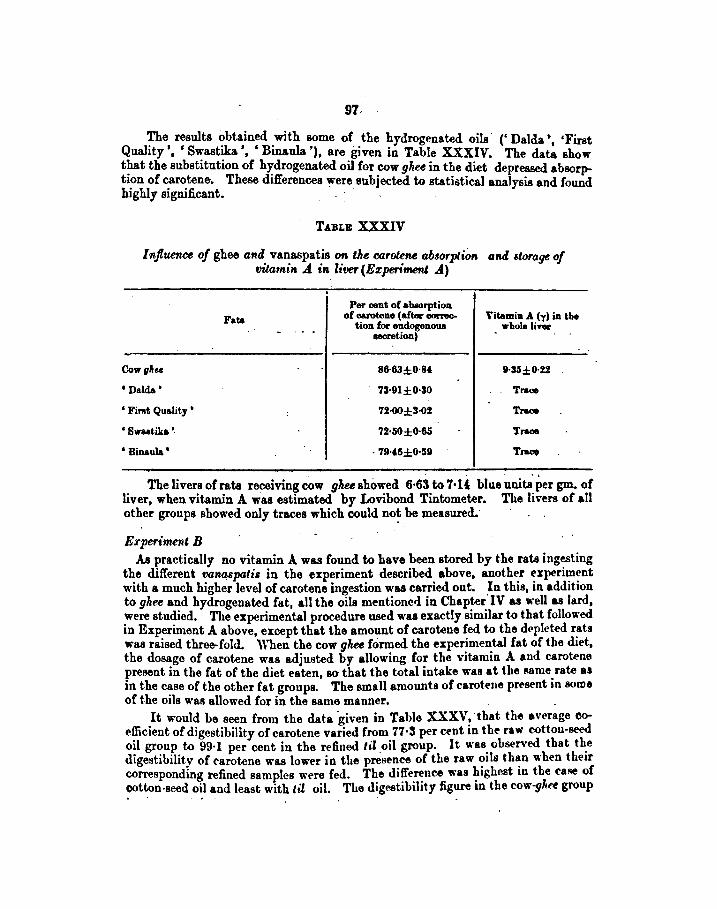
97-
The results obtained with some of the hydrogenated oils (' Dalda • •First Quality', ' Swastika', ' Binaula '), are given in Table XXXIV. The da~ show t!mt the substitution of h~drogenated oil for cow ghu in the diet depressed absorptton of carotene. These differences were subjected to statistical analysis and found highly significant. . · .
TABLE XXXIV
Influence of ghee and vanaspatis on the carorene absorption and Wlrage of vitatnin A in liver (Expen'mem .A)
Per cent of at-rption
Fata of earotene (after oonec- Vitamin A (y) in lbe tion for endogenona whole liYel'
aecretion)
Cowgllu 86·63±0·8, t·S5±0·H
1 Dalda' 73·91±0·30 Tra011
1 Fin1t Quality ' 72·00±3·02 Trace
1 Swaati.ka '· 72-50±0·65 Traoa
1 Binaula • . '19·f6±0·5!a Tract
The livers of rata receiving cow ghu showed 6·63 to 7· U blue units. Per gm. of liver, when vitamin A was estimated by Lovibond Tintometer. The livers of all other groups showed only traces which could no~ be measured.
Experi~nt B As practically no vitamin A was found to have been stored by the rata ingesting
the different va~spatis in the experiment described above, another experiment with a much higher level of carotene ingestion was carried out. .In this, in addition to ghe,e and hydrogenated fat, all the oils mentionc<l in Chapter IV as well as lard, were studied. The experimental procedure used was exactly similar to that followed in Experiment A above, except that the amount of carotene fed to the depleted rats was raised three-fold. When the cow ghu formed the experimental fat of the diet, the dosage of carotene was adjusted by allowing for the vitamin A and carotene present in the fat of the diet eaten, so that the total intake was at the 11ame rate as in the case of the other fat groups. The small amounts of carotene present in some of the oils was allowed for in the same manner.
It would be seen from the data given in Table XXXV, ·that the average coe~cient of digestibility of carotene varied from 77·3 per c.ent in the raw cotton-seed ml group to 99·1 per cent in the refined til oil group. It was observed that the digestibility of carotene was lower in the presence of the raw oils than "'·hen their corresponding refined samples were fed. The difference was highest in the case of ootton-seed oil and least with til oil. The digestibility figure in the cow-ghn group . . ·"
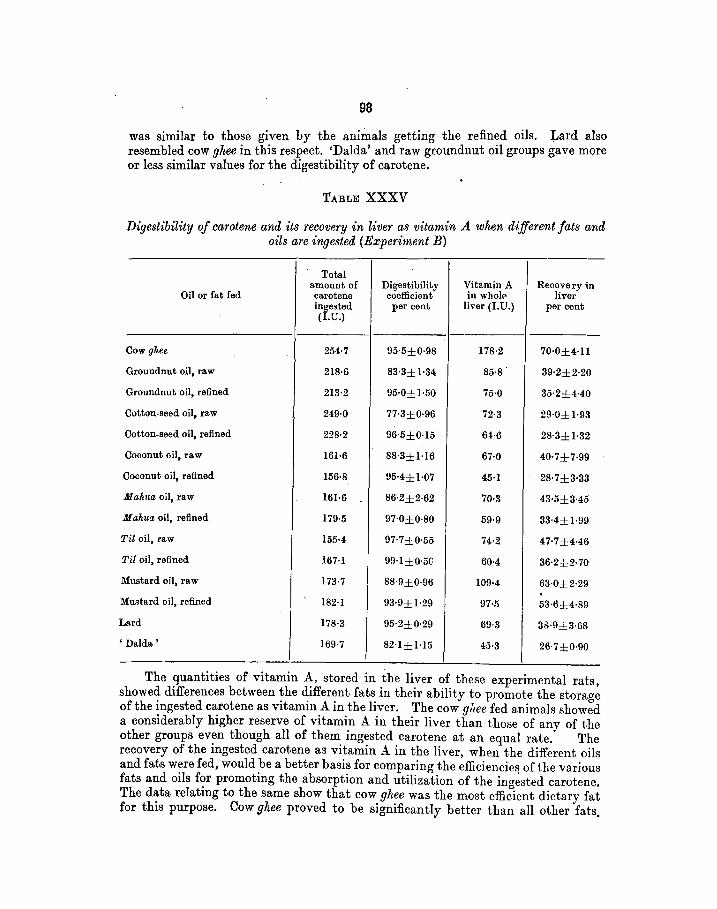
98
was similar to those given by the animals getting the refined oils. Lard also resembled cow ghee in this respect. 'Dalda' and raw groundnut oil groups gave more or less similar values for the digestibility of carotene.
TABLE XXXV
Digestibility of carotene and its recovery in liver as vitamin A when different fats and oils are ingested (Experiment B)
Total amount of Digestibility Vitamin A Recovery in
Oil or fat fed carotene coefficient in wholE" liver ingested per cent liver (I.U.) per cent (I.U.)
Cow ghee 254·7 95·5±0·98 178·2 70·0±4-11
Groundnut oil, raw 218·6 83·3±1·34 85·8. 39·2±2·20
Groundnut oil, refined 213·2 95·0±1·50 75·0 35·2±·i·40
Cotton-seed oil, raw 249·0 77·3±0·96 72·3 29·0±1·93
Cotton-seed oil, refined 228·2 96·5±0·15 64·6 28·3±1·32
Coconut oil, raw 161·6 88·3±1-16 67·0 40·7±7·99
Coconut oil, refined 156·8 95·4±1·07 45·1 28·7±3·33
Mahua oil, raw 161-6 86·2±2·62 70·3 43·5±3-45
Mahua oil, refined 179·5 97·0±0·80 59·9 33·4±1·99
Til oil, raw 155·4 97·7±0·55 74·2 47·7±4·46
Til oil, refined 167-1 99·1±0·5(} 60·4 36·2±2·70
Mustard oil, raw 173·7 88·9±0·96 109·4 63·0±2·29 . Mustard oil, refined 182-1 93·9±1·29 97·5 53·6±4·89
Lard 178·3 95·2±0·29 69·3 3iHl±3·68
'Dalda' 169·7 82·1±1·15 45·3 26·7±0·90
The quantities of vitamin A, stored in the liver of these experimental rats, showed differences between the different fats in their ability to promote the storage of the ingested carotene as vitamin A in the liver. The cow gltee fed animals showed a considerably higher reserve of vitamin A in their liver than those of any of the other groups even though all of them ingested carotene at an equal rate. The recovery of the ingested carotene as vitamin A in the liver, when the different oils and fats were fed, would be a better basis for comparing the efficiencie~ of the various fats and oils for promoting the absorption and utilization of the ingested carotene. The data relating to the same show that cow ghee was the most efficient dietary fat for this purpose. Cow [Jhee proved to be significantly better than all other fats.
99
'D~' was found to. be signifi.~ntl~ poorer th~n groundnut oil with regard to its effictency for promotmg the utd.izat10n of the mgested carotene for storage in the liver as vitamin A. The efficiency-of' Dalda • was less than 40 per cent of that of cow ghee for promoting liver storage of vitamin A from ingested carotene or vitamin A and was only about two-third as efficient as groundnut oil from which it was .prepared. Lard was more or less similar to groundnut oil in this respect.
The statistical analysis suggests, that ·raw and refined til oil promote the maximum digestibility of carotene and are perhaps as good as refined f!I'Ulliua wtton-seed and coooanut oils in this respect. Refined til oil appears to be bette;
· than oow fJhee. An analysis of the .data ·on the storage of vitamin A has yielded that cow ghee helps .such ~torage "inost and -is better than any -other oil. Raw and refined mustard oils came ned in order and appear to be better than other oils. ·
One interesting observation \Vas the lack of any consistent relationship between the growth promoting value and liver storage of vitamin A. lt was demonstrated in previous chapters that cow ghee gave &..significantly better growth effect in the second and subsequent generations ·than .oils .and other fa.ts. It ha.s been shown here that the liver reserve of .vitamin A in eaw~ghee fed .animals was higher than that of the oil and va.naspati-fed ones. This would seem to indicate a ·direct and close relationship between the ·two. llowever, this relationship was only generally true and not ahvnys strictly-proportional, as thet"e was no consistently regular correlation bet.ween growth effect .and the liver content of vitamin A in the same group. As an example, it might be pointed out that in :Experiments I .andlll, the 'Dald& 'fed rata which showed. the lowest liver vitamin A.content.did not consistently recol"d the least weight gain in all the tests. Similarly, .theugh the refined mustard oil ~roup .. howed lower growth than many of the other oil groups, it consistently gave hi••hcr liver reserves of vitamin A than all .other oil groups except musta.rd raw. ln° Experiments V and VI also the same tande;tcy was -exhibited. Whereas cow gl,ee and bazar gltee-fed animals co~istently showed considerably higher hepatic vitamin A storage than the corre>ponding oil and vanaspati-fed groups, under all comparable dietary regimes, the growth recorded on the different fats including the ghees was not significantly different except on the baEal North Indian diet. This
· lack of consiste:tt correlation between~rowth effect and hepatic vitamin A storage might probably be due to the fact that, whereas vitamin A storage in the liver is ,directly dependent upon the level of ing~stion of carotene or vitamin A, growth~ .the result of several factors some of which may have nothing at all to do with the dietary vitamin A level such as quality and amount of protein, minerals, other vitamins, etc. of the fvod.
The fueal excretion of carotene, observed in these experiments, ••as also of about the same order as that reported by Wagner and associates [19U_), <?uggenheim [1942] and ll.amasanna and Hakim [19t2]. In the C&86 of refined til ml, however, the exl're.tion observed here was very low, i.e. less ~n O?e p~«ut at: tha~ iu~esred. Since it 18 a ~ell established. fact that storage of Vltamm Am the li\·er u dtreetly ~ependent upon the amount of vitamin A or carotene ingested, a close correlation between the digestibility of C'arot.ene and ita recovery as \"it&min _A in the liver might be expected. A scrutiny of the relevant figurea, howe\·er, fa1ls to show any
14AR/5S 22
100
such relationship. For example, whereas raw groundnut oil and ' Dalda ' groupJ showad more or less similar digestihilities of carotene, the hepatic recovery of the ingested carotene in the latter group was only about two-third of that of the former. The reaaons for this lack of correlation batween carotene digestibility and vitamin A storage in liver is probably due, at least to a consiJerable extent, to the de>tructior. of carotene and vitamin A taking place in the gastro-inte:>tinal tracb, as has been pointed out by Hickman [1943]. He states, "the quantity of vitamin and provitamin A :recovered (from the faeces), subtracted from the quantity ingested, has hitherto been assumed to represent the quantity absorbed. Since tocopherol increase!:' the quantity excreted as well as the biological potency of that retained, it is evident that a third figure, the quantity destroyed in the intestine, must be added to balance the equation. Until further work has evaluated this factor, fiaures for the intestinal absorption of vitamin A and carotene will be untrustworthy. The possibility of intestinal biogenesis further complicates the intake-discardutilization balance of all vitamins.'' The greater apparent digestibility of carotene along with lower liver storage of vitamin.A, seen in the refined oils, may also be due to the greater gastro-intestinal destruction consequent on the greatly lowered stability of the refined oils brought about by the removal, during the refining process, of" phospholipids, low molecular weight phenolic bodies, free fatty acids and perhaps other fact:>rs " accompanying tocopherol in natural oils " which, acting together, are said to confer a stability from 10-100 times more than we associate with pure tocopherol and oil" [Hickman, 1943]. It would, therefore, seem that carotene digestibility figures, by themselves, are, perhaps, only of complementary value. The percentage of the ingesteq carotene found to be stored in the liver as vitamin A in this experiment, was somewhat higher than that obtained by Kemmerer, Fraps and DeMottier [1947] or Lemley et al., [1947].
The results of these series of experiments are different from those of Coward [1936] and Lea3e eta[, [1939], who found no difference in the biological potency of carotene admini3tered in different oils or fats. Euler and Euler [19!5] and Brown and Bloor [1945] had fou.nd that the degree of unsaturation of the dieta.ry fat plays an important role on the utilization of ingested carotene. Our re::;ults, howevil'l', show, that thoagh cow ghee is much less unsaturated than most of the other fats and oils, yet auimah getting the former fat stored much greater vitamin A in their liver. Similarly, the tocopherol content of the fat3 also does not sec·m to have any consistent relationship to the hepatic storage of vitamin A, though Guggenheim [1944] and Rao [19-15, 1945a] have stressed that the biological response of carotene, dis3olve:l in different vegetable _oils, is more or less the same when the tocopherol contentf! of the oils are equated.
To .. urn up, it would seem from tp.e d!!.ta presented above that, under the conditions studied, cow ghee as dietary fat, was more efficient in promoting the absorption and utilization of ingested vitamin A or carotene, as judged by the recovery of the same as vita~in A in the liver, than any of the vegetable oils, either raw, refined or hydrogenated, which have been tested. The animal fat, lard, seemed to be no better than most of the vegetable oils and definitely poorer than cow ghee. Refining of the oils led to a decrease in efficiency to promote storaae of vitamin A in the liver. Hydrogenation also seemed to lower the ability of the parent oil to promote liver storage of vitamin A from ingested carotene.
CHAPTER XII
-EFFECT OF FATS AND OILS ON THE REQUIREMENTS OF THE
B-VITAMINS
By N.D. KEHAR, T. S. KRISHNAN and B. C. JosHI
T HE B-vitamins play a very important part in fat metabolism. The close inter-relationship of pyridoxin, pantothenic acid and unsaturated fatty acids
in rat nutrition [Quackenbush et al., 1939; 1942b, o; Richardson et al., 1941]; the sparing action of dietary fat on thiamine [Evans and Lepkovsky, 1929, Salmon and associates, l930, 1931, 1937; Guerrant. and Dutcher, 1934:; Whipple and Church, 1936 ;- ?IIacDonald and McHenry, 1940; Banerji and associates, 1940, 1941, 1942; Wainio, 1942], pantothenic acid [Unna et al., 1941] and biotin [Nielson and Elvehjem, 1942] needs of the rat, and the enhanced riboflavin requirements with increased fat ingestion [Mannering et al., 1941, 1944.], are some of the examples indicating the effect of B-vitamins on fat metabolism. Though it is known that fats have a thiamine sparing action, there is very little know:ledge of the comparative value of different fats and oils for this purpose. Arnold and associates [Arnold and Elvehjem, 1939 ; Stirr et al., 1939] demonstrated no marked difference in the thiamine sparing action of olive oil, autoclaved peanut or cotton-seed oil and autoclaved lard or butter-fat. ·
However, since it was observed in the .foregoing chapters that there were differences in the growth. promoting value, vitamin A storage in liver, Ca and P absorption, etc. between cow ghee and different vegetable oils and other fats, it was considered desirable to find out whether there was any difference in the requirements of these fats and oils for thiamine and riboflavin.
Effect of different fats and oils on thiamine requirement
'. The procedure employed was an adaptation of the improved rat growth method of assay of vitamin B1, of Kline, Hall and Morgan [1941], incorporating_co'! ghee, raw and refined groundD.ut oil or 'Dalda • (hydrogenated groundnut oil), m the basal diet. These were selected in order to study the effect of refining and hydrogenation on vegetable oils as also to find out the difference, if any, from cow ghee. The cow glwe was separated from casein or any other extraneous matter by repeated melting and filtering through filter paper.
Weanling rats from the stock colony, 24 to 26 days old and 40 to 50 gm. in weight, were distributed evenly into 16. groups of eight rats eac~ (four males plus four females). These 16 groups were sub-divided into four ser1es of four groups each. One series formed the negative control while the other three were tested at three levels of pure thiamine ingestion, viz. 3, 5 and Sy per rat_per day. Each of the four groups in all the series was given one of the four expenmental fats. Thus
101 14. AR/65
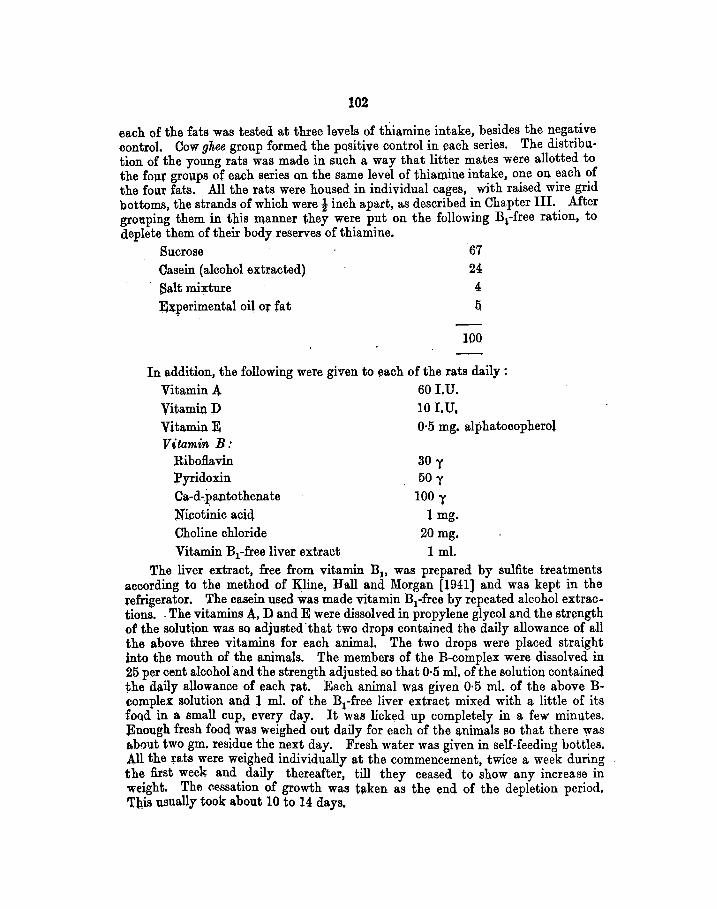
102
each of the fats was tested at three levels of thiamine intake, besides the negative control. Cow ghee group formed the positive control in each series. The distribu· tion of the young rats was made in such a way that litter mates were allotted to the four groups of each series on the same level of thiamine intake, one on each of the four fats. All the rats were housed in individual cages, with raised wire grid bottoms, the strands of which were! inch apart, as described in Chapter III. After grouping them in this manner they were put on the following Bl-free ration, to deplete them of their body reserves of thiamine.
Sucrose .67
Casein (alcohol extracted) 24 Salt mixture 4 :mx:perimental oil o:r fat ij
100
In addition, the following were given to each of the rats daily : Vitamin A. 60 I.U. Vitamill. P 10 I, U, Vitamm E 0·5 mg. alphatocopherol Vitamin B:
Riboflavin 30 y Pyridoxin 50 y
Ca-d~P,antothenate 100 y ;Nicotinic aciq 1 mg. Choline chloride 20 mg. Vitamin B1-free liver extract 1 mi.
The liver extract, free from vitamin B1, was prepared by sulfite treatments according to the method of K;line, Ball and Morgan [l941] and was kept in the :refrigerator. The casein used was made vitamin B1-free by repeated alcohol extractions .. 'fhe vitamins 1\., D and E were dissolved in propylene glycol and the strength of the solution was so adjusted.that two drops contained the daily allowance of all the above three vitamins for each animal. The two drops were placed straight into the mouth of the animals. The members of the B-complex were dissolved in 25 per cent alcohol and the strength adjusted so that 0·5 mi. of the solution contained the daily allowance of each :rat. Each animal was given 0·5 ml. of the above Bcomplex solution and 1 mi. of the B1-free liver extract mixed with a little of its food in a small cup, every day. It was licked up completely in a few minutes. ~nough fresh food was weighed out daily for each of the animals so that there was Jtb011t two gm. residue the next day. Fresh water was given in self-feeding bottles. All the :rats were weighed individually at the commencement, twice a week during the first week and daily thereafter, till they ceased to show any increase in weight. The cessation of growth was t11-ken as the end of the depletion period. T}lis usually took about 10 to 14 days.
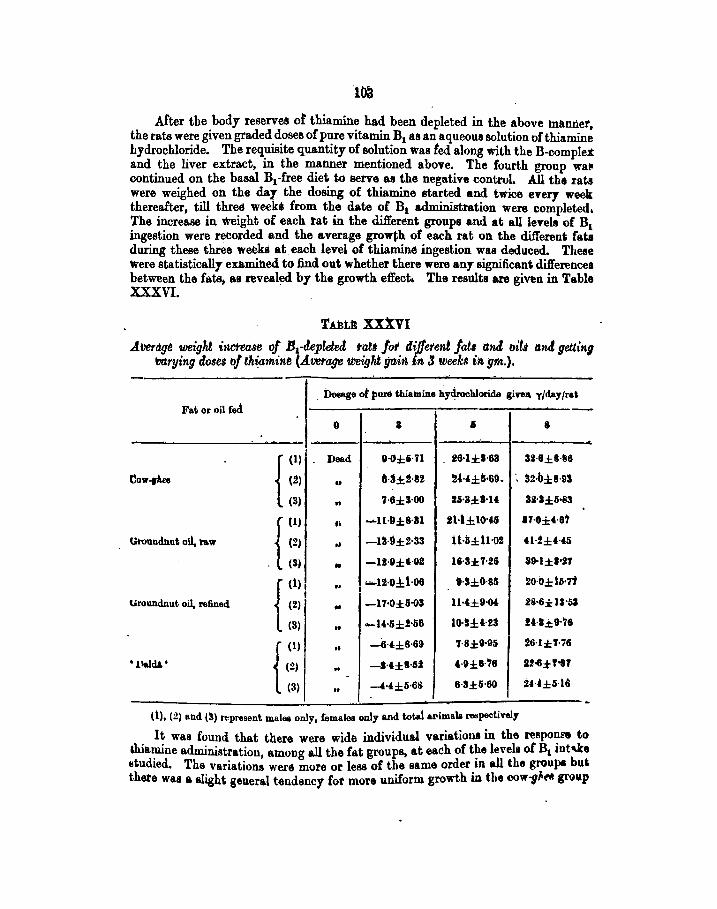
After the body reserves or thiamine had been depleted in the above bllW:iet, the rats were given graded doses of pure vitamin B1 as an aqueous solution of thiamine hydrochloride. The requisite quantity of solution 'f{as ted along with the B-complex and the liver extract, in the manner mentioned above. The fourth group wall continued on the basal B1-free diet to serve as the negative controL All the rats were weighed on the day the dosing of thiamine started and twice every week thereafter, till three weeki from the date of B1 administration were completed, The increase in might of each tat in the different groups and at all lenls of B1 ingestion were recorded and the average grollih of each rat on the differen~ fats during these three weekli at. each level of thiamine ingestion was deduced. These Were statistically examined to find out whether there were any signifi.can~ differences between the fats, as reveal~ by the growth effect. The results are gi~n in Table XXXVI.
TABU XXXVI
.Aver~ weigltt increase of B1-depleted tall fot' dit!erent fats ttnd oil~ and getting Wrying doses vf thi_amine (Average weight gaitt, In 3 week# itt gm.) •
.. -
. Do~~t~ge ot pure thiamine hy4rochlorid.e givem y{dayfrat
Fat or oil fed -· -0 a li 8
r Dead 8-0±i-71 . 26-l::i:I·&B 3U±H6
Vow-rkea (2) .. &·3±!-82 !H±~·69. ·. ~2·0±11·93
(3) " 7·6±3·00 15-3±1·1' 3H±Ii•83
r .. ...... n·t±S·81 li·l±lO·.S IT·O±U'
Uroundnut oil, 1.'&\\' (2) ,, -13·11±2-33 U·li±ll·O! "·2±H5
. (3) .. -11·8±•·02 16·3::i:7-26 19-1±1•27
r~~ .. ..-uo ±1·06 t·HO·B5 20·0±16<71
I
Groundnut oil, refilled (2) .. -17·0±6·03 1H±9·M 28·6:1;11•61
(S) .. -14-5±!·&6 lO·!I±HS !H±D-'16
r .. -4H±8·69 7-8±9·95 26·1±7·76
•tlald&. (2) .. -H±8·5i &·9±8·'78 1!-&;t-T-87 -
2H±H6 (3) .. --H±5·68 6·3±5·60
·-(1), (2) and (3) represent malea only, femalea only a.nd total &l'imala l'Cl6pectively
It was found that there were wide individual variations in the re!!pOnFe to ~ia~ne administration, ablong all the fat groups. at each of t~elevels of B1 iot~e studted. The variations wer~ more or less of the same order m all the grou}ll but there was a slight gelleral tendency fot more uniform growth in the cow-g/t~ P 11P
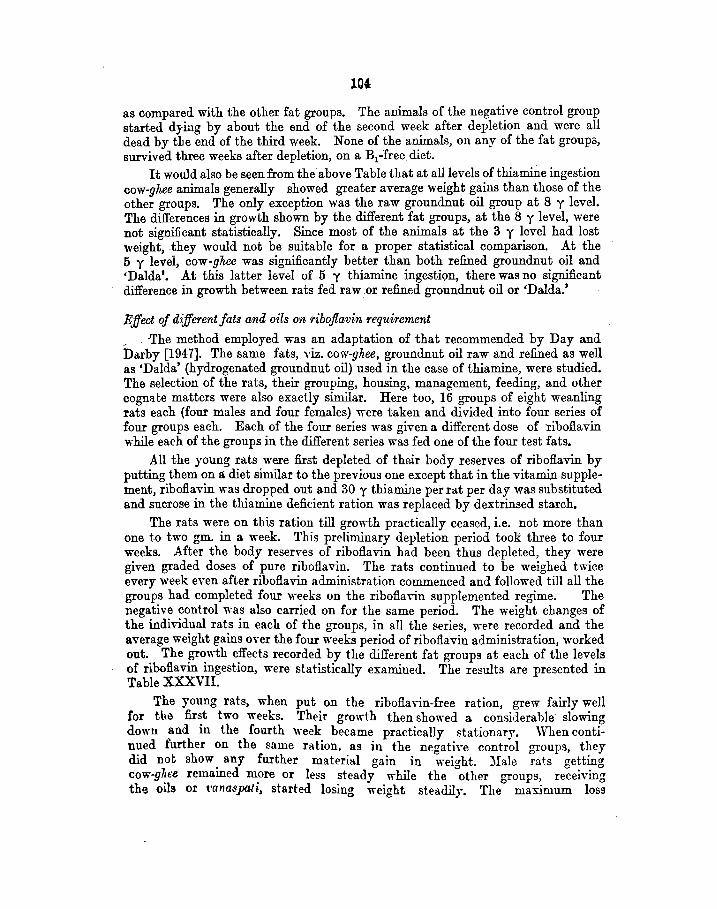
as compared with the other fat groups. The animals of the negative control group started dying by about the end of the second week after depletion and were all dead by the end of the third week. None of the animals, on any of the fat groups, survived three weeks after depletion, on a B1.:free diet.
It would also be seen from the above Table that at all levels of thiamille ingestion cow-ghee animals generally showed greater average weight gains than those of the other groups. The only exception was the raw groundnut oil group at 8 y level. The differences in growth shown by the different fat groups, at the 8 y level, were not signi£cant statistically. Since most of the animals at the 3 y level had lost weight, .they would not be suitable for a proper statistical comparison. At the 5 y levei, cow-ghee was significantly better than both refined groundnut oil and 'Dalda'. At this latter level of 5 y thiamine ingestion, there was no significant difference in growth between rats fed raw.or refined groundnut oil or 'Dalda.'
Effect of different fats and oils on riboflavin requirement
. -The method employed was an adaptation of that recommended by Day and Darby [1947]. The same fats, viz. cow-ghee, groundnut oil raw and refined as well as 'Dalda' (hydrogenated groundnut oil) used in the case of thiamine, were studied. The selection of the rats, their grouping, housing, management, feeding, and other cognate matters were also exactly similar. Here too, 16 groups of eight weanling rats each (four males and four females) were taken and divided into four series of four groups each. Each of the four series was given a different dose of riboflavin while each of the groups in the different series was fed one of the four test fats.
All the young rats were first depleted of their body reserves of riboflavin by putting them on a diet similar to the previous one except that in the vitamin supplement, riboflavin was dropped out and 30 y thiamine per rat per day was substituted and sucrose in the thiamine deficient ration was replaced by dextrinsed starch.
The rats were on this ration till growth practically ceased, i.e. not more than one to two gm. in a week. This preliminary depletion period took three to four weeks. After the body reserves of riboflavin had been thus depleted, they were given graded doses of pure riboflavin. The rats continued to be weighed twice every week even after riboflavin administration commenced and followed till all the groups had completed four weeks on the riboflavin supplemented regime. The negative control was also carried on for the same period. The weight changes of the individual rats in each of the groups, in all the series, were recorded and the average weight gains over the four weeks period of riboflavin administration, worked out. The growth effects recorded by the different fat groups at each of the levels of riboflavin ingestion, were statistically examined. The results are presented in Table XXXVII.
The young rats, when put on the riboflavin-free ration, grew fairly well for the first two weeks. Their growth then showed a considerable slowin11 down and in the fourth week became practically stationary. When conti~ nued further on the same ration, as in the negative control groups, they did not show. any further material gain in weight. )!ale rats getting cow-gllee remamed m?re or less steady while the other groups, receiving the oils or. t•anaspal~, started losing weight steadily. The maximum loss
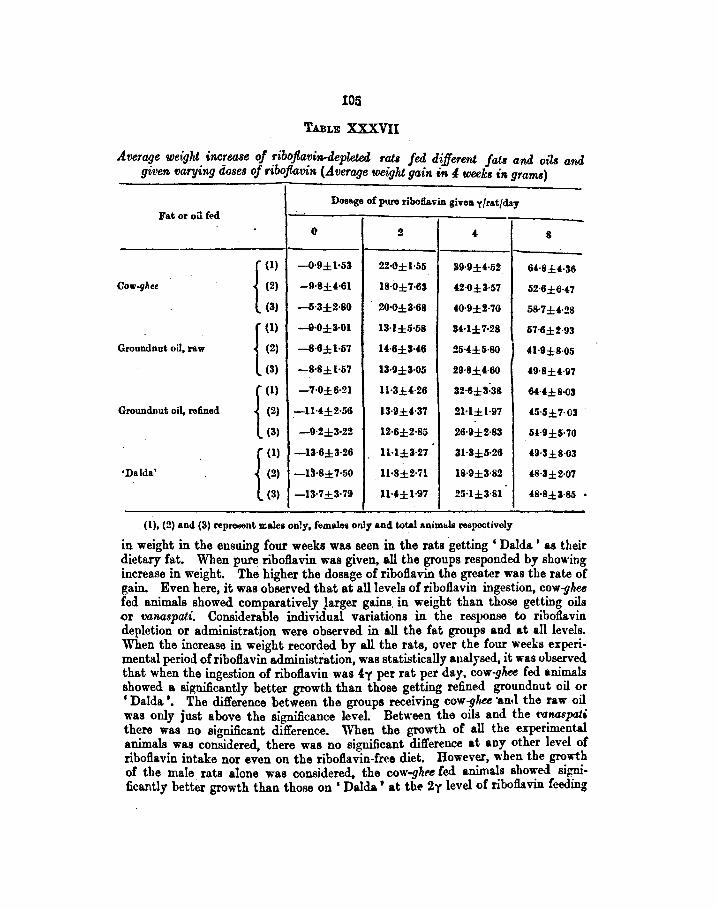
105
TABLE XXXVII
Averaqe weight. inc!ease of ~ibofla?in-depleted rat& fed different fat• and oil& and gwen vary~ng dose1 of nboflamn (Average weight gain in 4 weeki in grams)
Dosage o£ pure ribob~in given yfra.tfday Fat or oil ft>d
(t 2 4 8
r -0·9±1·53 22·0±1·55 39·9±4-52 64·8±4·36
Cow-ghee (2) -9·8±4-61 18·0±7·63 42·0±3·57 52·6±6·47
(3) -5·3±2·80 20-6±3·68 40·9±2·70 58·7±4·28
r -9·0±3·01 13-1±5·58 SH±7·28 57·6±2·93
Groundnut oil, raw (2) -8·6±1-57 14-6±3-46 25-4±5·80 41·9±8·05
(3) -8·8±1·57 13·9±3·05 29·8:!:;4-60 49·8±4·97
r -'7-0±6·21 ll·3±H6 32·6±3-38 64·4±8·03
Groundnut oil, refined (2) -11·4±2·56 13·9±4-37 21-1±1·97 45·5±7·03
(3) -9·2±3·22 12·6±2-85 26·9±2·83 5!-9±5·70
r -13·6±3·26 11-1±3·27 31·3±5·26 49·3±8·03
•Dalda' (2) -13·8±7-50 11-8±2·71 18·9±3·82 48·3±2·07
(3) -13·7±3·79 1H±1·97 25'1±3·81 48·8±3·85 . (1), (2) and (3) represent ~r.a.les only, females only and total anim.Js respectively
in weight in the ensuing four weeks was seen in the rats getting ' Dalda ' as their dietary fat. When pure riboflavin was given, all the groups responded by showing increase in weight. The higher the dosage of riboflavin the greater was the rate of gain. Even here, it was observed that at all levels of riboflavin ingestion, cow-ghu fed animals showed comparatively Jarger gains. in weight than those getting oils or vanaspati. Considerable individual variations in the response to riboflavin depletion or administration were observed in all the fat groups and at all levels. When the increase in weight recorded by all the rats, over the four weeks experimental period of riboflavin administration, was statistically analysed, it was observed that when the ingestion of riboflavin was 4:y per rat per day, cow-gl!N, fed animals showed a significantly better growth than those getting refined groundnut oil or 'Dalda '. The difference between the groups receiving cow-gl!N, ·an.l the raw oil was only just above the significance level. Between the oils and the tVJ.naspali there was no significant difference. When the growth of all the e.x:per1mental animals was considered, there was no significant difference at any other level of riboflavin intake nor even on the riboflavin-free diet. However, \\·hen the growth of the male rats alone was considered, the cow-ghn fed animals showed significantly better growth than those on ' Dalda' at thto 2y level of riboflavin feeding
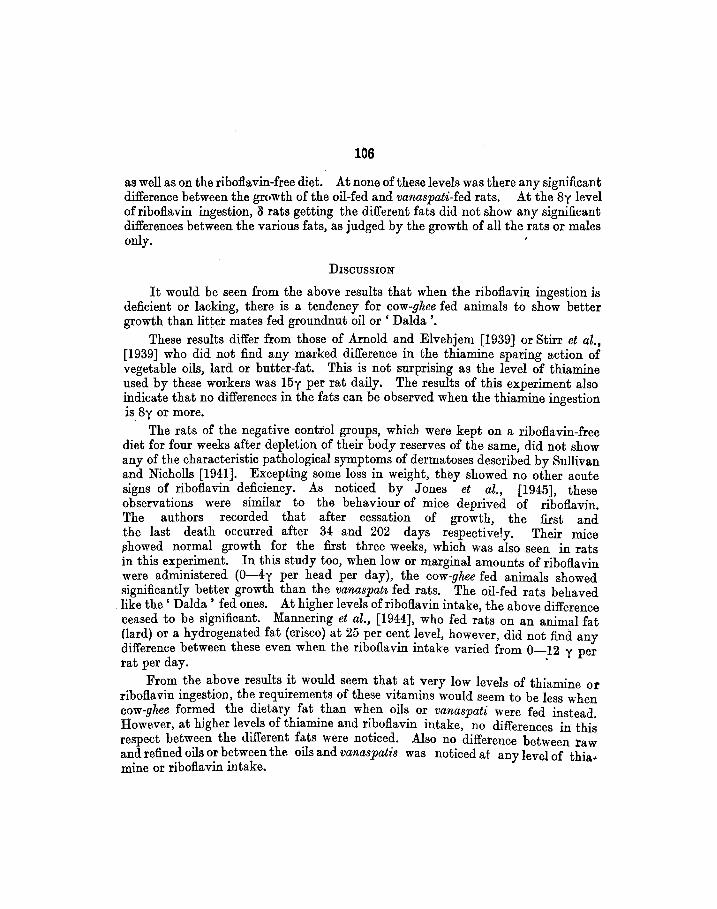
106
a.s well as on the riboflavin-free diet. At none of these levels was there any significant difference between the growth of the oil-fed and vanaspati-fed rats. At the 8y level of riboflavin ingestion, 8 rats getting the different fats did not show any significant differences between the various fats, as judged by the growth of all the rats or males only. '
DISCUSSION
It would be seen from the above results that when the riboflavin ingestion is deficient or lacking, there is a tendency for cow-ghee fed animals to show better growth than litter mates fed groundnut oil or ' Dalda '.
These results differ from those of Arnold and Elvehjem [1939] or Stirr et al., [1939] who did not find any marked difference in the thiamine sparing action of vegetable oils, lard or butter-fat. This is not surprising as the level of thiamine used by these workers was 15y per rat daily. The results of this experiment also indicate that no differences in the fats can be observed when the thiamine ingestion is 8y or more.
The rats of the negative control groups, which were kept on a riboflavin-free diet for four weeks after depletion of their body reserves of the same, did not show any of the characteristic pathological symptoms of dermatoses described by Sullivan and Nicholls [1941]. Excepting some loss in weight, they showed no other acute signs of riboflavin deficiency. As noticed by Jones et al., [1945], these observations were similar to the behaviour of mice deprived of riboflavin. The authors recorded that after cessation of growth, the first and the last death occurred after 34 and 202 days respectively. Their mice t~howed normal growth for the first three weeks, which was also seen in rats in this experiment. In this study too, when low or marginal amounts of riboflavin were administered (0-4y per head per day), the cow-ghee fed animals showed significantly better growth than the vanaspat~ fed rats. The oil-fed rats behaved like the' Dalda' fed ones. At higher levels of riboflavin intake, the above difference ceased to be significant. Mannering et al., [1944], who fed rats on an animal fat (lard) or a hydrogenated fat (crisco) at 25_per ce~t ~evel, how~ver, did not find any difference between these even when the nboflavm mtake vaned from 0-12 y per ~~~ .
From the above results it would seem that at very low levels of thiamine or riboflavin ingestion, the requirements of these vitamins would seem to be less when cow-ghee formed the dietary fat than when oils or vanaspati were fed instead. However, at higher levels of thiamine and riboflavin intake, no differences in this respect between the different fats were noticed. Also no difference between raw and refined oils or between the oils and vanaspat~·s was noticed at any level of thia• mine or riboflavin intake.

SUMMARY AND CONCLUSIONS . .
The investigations outlined in this bulletin were taken in hand with the following objects in mind:
1. To make a survey of market gkee in order to a.sseu the vitamin A available to the consumers tbrougq this medium..
2. To assess the effect of breed, feeding, eto. of animals, on the vitamin .\ content of gkee. ·
3. To determine the nutritive values of vanaspatis (hydrogenated vegetable oils), raw and refined vegetable oils, a~ well as of lard as compared with that of pure ghee. ·
In order to examine the above poiqts, a nu,nber of experiments have been carried out, the results of which have been given in detail in the foregoing chapters. A general summary o~ the resqlts obtained and the broad c;,nclusions drawn from these, are briefly given below:
(I) Chemical constants of pure ghee
The che.nical constants ot pllre gk~ fron diff!rent bre3dJ of cattle and balialo in different parts of Indi.$ aQ.d for different seasons b.l!.ve been determined. The constants varied from breed to breed and froiQ. place to place.
The saponifi.cation, Reichert-Meiss!, Polenske and Kirschner values of gkee prepared from the milk of Indian cattle in certain localities and seasons, may fall much below the minimum limits set for butter-fat in the Western countries.
The sa.ponifu:ation, R~ichert-Meissl and Kirschner V(l.lues were significantly lowered in summer. The iodine values did not show -much seasonal variation.
Glwe samples obtaineit from North India showed higher saponification and Polenske values, but definitely lower iodine value!\. The Reichert-!lleissl and Kirschner values of the North and South Indian samples were not much different.
Buffalo gkes had higher saponification, Reichert-Meissl and Kirschner values and lower iodine values, as compared with cow gkee. Polenske values of the two fats were similar.
(II) Vita min. A and carotene content of fats and oils The vitamin A content of gkee samples, of different breeds of cattle in different
parts of India, varied from 5·35 to 15·0 !Lafgm. and that of carotene from trace to 7·5 iJ.g/gm. Buffalo ghee had no carotene
0
content and, generally, a lower vitamin A concentration than cow gkee. A very low carotene content, even after liberal green feeding, characteriseit the ghee prepared from the milk of the Ongole breed of cattle.
Under aimilar conditions of feeding, ghee from different breeds of cattle had aimilar vitamin A potency.
107
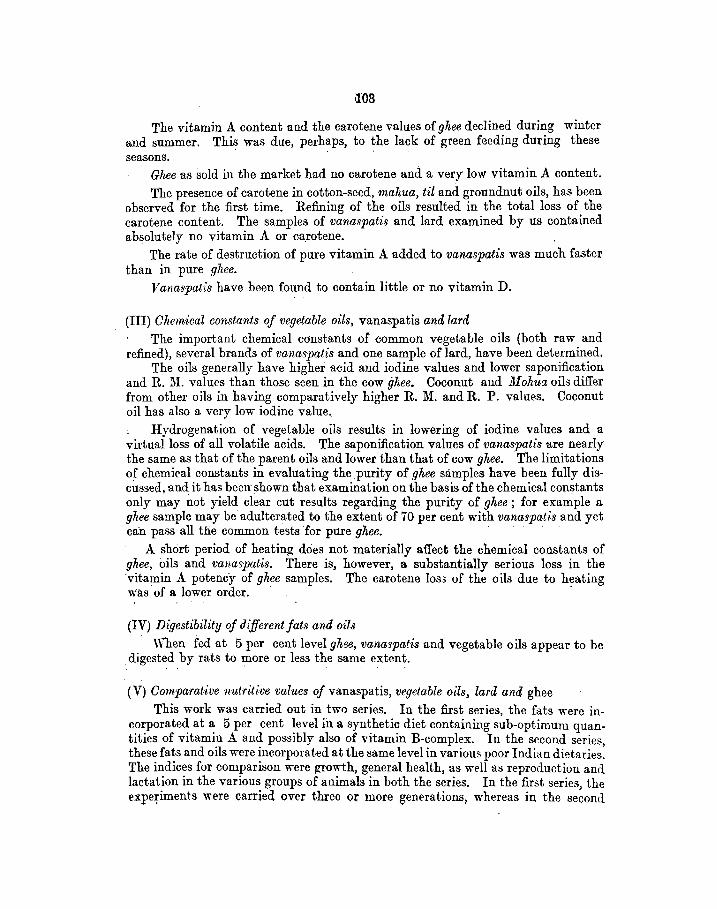
The vitamin A content and the carotene values of ghee declined during winter and summer. This was due, perhaps, to the lack of green feeding during these seasons.
Ghee as sold in the market had no carotene and a very low vitamin A content. The presence of carotene in cotton-seed, mahua, til and groundnut oils, has been
observed for the :first. time. Refining of the oils resulted in the total loss of the carotene content. The samples of vanaspatis and lard examined by us contained absolutely no vitamin A or carotene.
The rate of destruction of pure vitamin A added to vanaspatis was much faster than in pure ghee.
Vanaspatis have been found to contain little or no vitamin D.
(III) Clzemical constants of vegetable oils, vanaspatis and lard
The important chemical constants of common vegetable oils (both raw and refined), several brands of vanaspatis and one sample of lard, have been determined.
The oils generally have higher acid and iodine values and lower saponification and R. :M. values than those seen in the cow ghee. Coconut and J.Iohua oils differ from other oils in having comparatively higher R. :M:. and R. P. values. Coconut oil has also a very low iodine value,
Hydrogenation of vegetable oils results in lowering of iodine values and a virtual loss of all volatile acids. The saponification values of vanaspatis are nearly the same as that of the parent oils and lower than that of cow ghee. The limitations _of chemical constants in evaluating the purity of ghee samples have been fully discussed, and it has been: shown that examination on the basis of the chemical constants only may iwt yield clear cut results regarding the purity of ghee ; for example a ghee sample may be adulterated to the extent of 70 per cent with vanaspatis and yet can pass all the common tests for pure ghee. .
A short period of heating dcies not materially affect the chemical constants of ghee, oils and vanaspatis. There is, however, a substantially serious loss in the vitamin A potency of ghee samples. The carotene los3 of the oils due to heating was of a lower order. ·
(IV) Digestibility of different fats and oils
. Wben fed at 5 per cent level ghee, vanaspatis and vegetable oils appear to be . digested by rats to more or less the same extent.
( V) Comparative n-utritl:ve values of vanaspatis, vegetable oils, lard and ghee This work was carried out in two series. In the :first series, the fats were in
corporated at a 5 per cent level in a synthetic diet containing sub-optimum quantities of vitamin A and possibly also of vitamin B-complex. In the second series, these fats and oils were incorporated at the same level in various poor Indian dietaries. The indices for comparison were growth, general health, as well as reproduction and lactation in the various groups of animals in both the series. In the :first series, the expe~iments were carried over three or more generations, whereas in the second
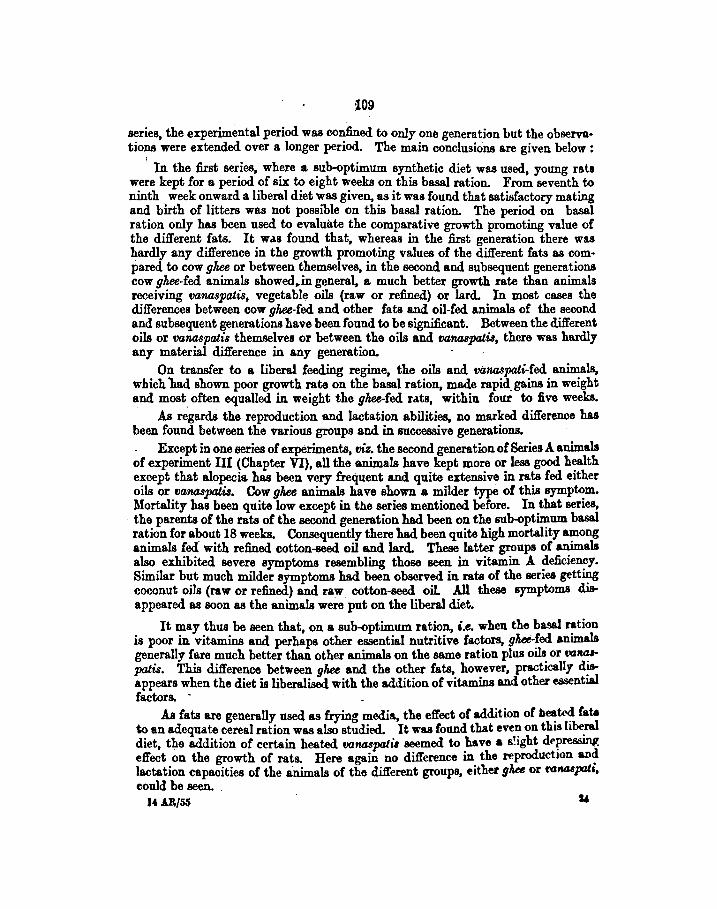
109
series, the experimental period was confined to only one generation but the observations were extended over a longer period. The main conclusions are given below :
l
In the first series, where a sub-optimum synthetic diet was used, young rata were kept for a period of six to eight weeks on this basal ration. From seventh to ninth week onward a liberal diet was given, as it was found that satisfactory mating and birth of litters was not possible on this basal ration. The period on basal ration only has been used to evaluate the comparative growth promoting value of the different fats. It w~s found that, whereas in the first generation there was hardly any difference in the growth promoting values of the different fats as compared to cow ghee or between themselves, in the second and subsequent generations cow ghee-fed animals showed,.in general, a much better growth rate than animals receiving tJanaspatis, vegetable oils (raw or refined) or lard. In most cases the differences between cow ghee-fed and other fats and oil-fed animals of the second and subsequent generations have been found to be significant. Between the different oils or tJanaspatia themselves or between the oils and oonaspati&, there was hardly any material difference in any generation.
On transfer to a liberal feeding regime, the oils and t~anaspati-fed animals, which had shown poor growth rate on the basal ration, made rapid_ gain& in weight and most often equalled in weight the ghee-fed r~ts, within four to five weeks.
As regards the reproduction and lactation abilities, no marked difference has been found between the various groups and in successive generations. . Except in one series of experiments, viz. the second generation of Series A animals of experiment III (Chapter VI), all the animals have kept more or less good health except that alopecia has been very frequent and quite extensive in rats fed either oils or t~anaspati&. Cow ghee animals have shown a milder type of this symptom. Mortality has been quite low except in the series mentioned before. In that series, the parents of the rats of the second generation had been on the sub-optimum basal ration for about 18 weeks. Consequently there had been quite high mortality among animals fed with refined cotton-seed oil and lard. These latter groups of animals also exhibited severe symptoms resembling those seen in vitamin A deficiency. Similar but much milder symptoms had been observed in rats of the series getting coconut oils (raw or refined) and raw cotton-seed oiL All these symptoms disappeared as soon as the animals were put on the liberal diet.
It may thus be seen that, on a sub-optimum ration, i.e. when the basal ration is poor in vitamins and perhaps other essential nutritive factors, ghee-fed animals generally fare much better than other animals on the same ration plus oils or roi!Mpatis. This difference between ghu and the other fats, however, practically d~ appears when the diet is liberalised with the addition of vitamins and other essential factors. - ·
As fats are generally used as frying media, the effect of addition of h~~ fata to an adequate cereal ration was also studied. It was found that eve~ on thiS hbe_ral diet, the addition of certain heated ronaspatia seemed to have a s!~ght dep~ effect on the growth of rats. Here again no difference in the reproduction an~ lactation capaoities of the animals of the different groups, either gl.N or N1148pala, could be seen. .
"~ u
110
In the second series of experiments ghee, vanaspatis and oils had been added to either a Bengali or a North Indian dietary, used by an average poor man. The Bengali diet used was very poor in calcium, protein and vitamin A content. The North Indian diet was comparatively much richer with regard to these nutrients. On the Bengali dietary regime the growth of rats getting either ghee or any of the other fats is very poor and as such hardly any significant diiference could be observed between diiferent groups. Even when this diet was fortified by the addition of extra vitamins A, B-complex and D, there was no diiference in the growth promoting effect of the various fats, though the t<>tal weight gain by the experimental animals was much higher than that on the unsupplemented diet. "\Then rats were kept on the 1·nsupplemented poor Bengali diet for a long period, t·iz. 25 weeks or more, various pathological symptoms were seen, especially in rats consuming some of the brands of t·anas-patis. Cow ghee-fed animals were found to be comparatively more immune to such symptoms. ~ls the t:anaspatis contained no vitamin A, and whereas the cow ghee is a fairly rich source of vitamin A, it was concluded that most of these deficiency symptoms, seen in the t•anaspati-fed rats might be due to chronic vitamin A deficiency.
On the other hand, rats on a North Indian dietary, getting cow gltee, grew at a .much faster rate than their litter mates on the same diet plus either oil or t·anaspatis. The differences in the growth rate were statistically quite significant. As may be expected, the rats of all the groups in this experiment grew at a much better rate than the rats fed on Bengali diet. However, supplementation of the Xorth Indian diet with extra vitamins also helped the animals to make still better growth showing that even the North Indian dietary can hardly be called an adequate diet. One interesting finding was that, whereas on the nnsupplemented North Indian diet oow gliP.-e-fed animals were best, in the vitamin supplemented Xorth Indian diet series there was no significant difference between the diiferent groups of animals getting ghee, oils or vawnpati.'j. Thus it was seen again that, whereas on a suboptimum diet cow gl.ee was the best fat, on a liberal diet animals fared equally well whether receiving ghee or any other fat. On a very poor dietary, like poor Bengali diet, which is deficient in many essential factors, no such diiference between fat and fat could be observed.
Reproduction and lactation in all the groups were more or less a total failure, p<>inting once more t<> the nnsatk-factory nature of the Indian dietaries under study.
In order to find out the reason for the superiority of cow gltee over other fats and oils when incorp<>rated in a suh-<>ptimum ration. a number of experiments were planned to ~d out the comparative effects of different dietary fats on protein metaoolk1Il, calcium and phosphorus absorption, absorption and utilization of carotene as well as requirements of B-vitamiru.
(i) Protein metaboli.m~ It had been observed that the addition of fat to a fat-free diet, sub-optimum
n regard to vitamin A, improved the digestibility of the dietary protein anti also ncreased its biological value.
111
Whereas all the f'ats and pi1s studied, viz. gkee, raw and refined oils and vana1· patia, were more or lesr equally efficient in improving the digestibility of the ingested protein, the cow gk.ee was significantly superior to the others in raising the biological value of the dietary protein. There was no material difference between the other fats with regard to their effect on the biological value of the protein. NeithPr refining nor hydrogenation seemed to have any significant effect on the parent oil with regard to its action on protein absorption or utilization.
(ii) Calcium and plwsphorua metabolism To determine the absorption of calcium and phosphorus in the presence of
different fats like cow gkee, vegetable oils or vanaspatis, metabolism experiments had been carried out with adult rats fed on a synthetic diet similar to those used in the growth test. On a fat-free diet, there was little absorption of these minerals. When 5 per cent of cow gk.ee was added to the above ration the absorption r<ise to 45 per cent and 57 per cent for calcium and phosphorus respectively. 'When the different oils or vanaspatia replaced cow gkee in the above diet, the absorption · of calcium ranged from 23 to 41 per cent and of phosphorus from 28 to 48 per cent. Hence, the replacement of cow gk.ee by vegetable oils or vanaspatis, reduced calcium and phosphorus absorption significantly. ·
Refining seemed to have no material effect on the ability of thd oils to promote calcium and phosphorus retention. Hydrogenation depressed calcium and (Jhollphorus retention by about 8 to 10 per cent as compared with the parent oils, which difference, however, was not significant statistically.
(iii) Storage of tJitamin A. In all the experiments carried out to determine the comparative nutritive
values of gkees, vegetable oils and vanaspatia, livers of the animals receiving cow ghee had been found to contain the maximum quantity of vitamin A. Among the different oils, mustard oil gave the maximum storage while the refined coconut oil group of animals recorded the lowest liver reserves. Refining as well as hydro. genation seemed to lower the capacity of the oil to promote the storage of vitAmin A in the liver. .
(iv) .Ab~torptima and utilizatima of carot.eM It was found that different dietary fats differed in their ability to promote
absorption and utilization of orally administered carotene. The digestibility of carotene, when administered with the refined oils, was found to be higher than when
• g!ve~ wit~ the corresponding raw onea. Cow ghee and lard resembled t~e ~~ oils m thiS respect. Vanaapatia be~ved similar to the raw parent o1ls 10 thJB matter.
With regard to their efficiency to promote the utilization oCt he ingested carotene, as measured by the percentage recovf'!'d as vitamin A in the livt>r, co'!' g~ wu found to be definitely better than all other fata and oils. • .\mong the 01ls, mll3-tard seemed to be the best and cotton-seed and refined coconut, about the worst. Con· trary to the findings in the carotene absorption experiments, refining seemed to
112
decrease the efficiency of the oils for the hepatic storage of vitamin A. Hydrogen at ion too appeared to adversely affect the capacity of the parent oil to promote vitamin A storage in liver.
(v) Vitamin B requirement
It was observed that, at the sub-optimum level of thiamine intake of 5y daily pet head, cow ghee-fed rats made significantly better gains than those fed on the corresponding oils and vanaspatis. At other levels of thiamine ingestion, when there were either losses or fairly good gains in body weight, there were no significant differences between the various fats. Refining or hydrogenation did not seem to have any significant effect on the thiamine sparing action of the oil.
A similar study carried out to compare the riboflavin requirement in the presence of different fats showed that, when the daily allowance of riboflavin was 4y or less per head, riboflavin-depleted rats getting cow ghee as the dietary fat showed significantly better growth than litter mates fed vegetable oils or 'Vanashpati'. The superiority of cow ghee disappeared when the average dose of riboflavin was increased to 8y per head daily. No differences between the oils and.vanaspatis were observed at any of the levels of riboflavin intake.
Summing up, it would seem that, with the sub-adequate dietaries that are widely PEevalent in most regions of this country, the replacement of cow ghee by vegetable oils-raw, refined or hydrogenated-over long periods, is likely to lead to adverse effects such as decreased growth, higher vitamin requirements, lower Ca and P absorption, etc. However, when the deficiencies of the dietary are removed and the ration made adequate in all essential nutritional factors, the difference between cow ghee and the vegetable oils or vanaspatis tends to disappear and all of them seem to have about similar nutritive values. Between the different oils as also between the parent oil and its hydrogenated product, however, there seems to be no significant difference in most of these respects, under the conditions studied.
REFERENCES Abbot, 0. D., Ahmann, C. P. and Overstreet, 1\I. R. (1939). Amer. J. Physiol., 126, 254.
Abramson, E. and Brunius, E. (1942), Acta. Physiol. Scand., 3, 164. (Nutr. Abstr. Rev. 13, No. 124, 1943-44.)
Ahi:nad, B., Chand, R. and 1\Iansoor-ul-Hassan (1946), Indian J. med. Res., 34, 75. Arnold, A. and Elvehjem, C. A. (1939), Amer. J. Physiol.126, 289. Arup, P. S. (1930)--J. Dept. Agric., Irish Free State, 29, 236.
Association of Official Agricultural Chemists, Official anJ Tentative Methods of Analysis, Washington, IV Edn. (1935).
Association of Official Agricultural Chemists, Official and Tentative Methods of Analysis Washington, IV Edn. (1940).
Atkenson, F. W., Hughes, J. S., Kunerth, B. L., Peterson, W. J. and Kramer, M. (1937), J. Nulrt, U, 62.
Augur, V., Rollman, H. S. arid Deuel, H. J. (Jr.) (1947), J. Nutrit, 33, 177. Baldwin, A. R. (1940), Univ. Pittsburg Bull., 40, 28.
Banerjee, B. N. and Sonawala, S. D. (1935), Agric. Livestock India, 5, 382. Banerji, G. G. (1940), Biochem. J., 34, 1329.
113
BanerJI, G. G. {1941), Biochem. J., 35, 1354. --and Yudkin, J. (1942), BiocMm. J., 36, 530. Baau, K. P. and Nath, H. P. (1946), lruliara J. med. Bu., 34, 13. --- (1946a), Indian J. med. Bu., 34, 19. --(1946b), Indian J. med. Ru., 34, 27. Beck, S. and Peacock, P. R. (1941), Brit. J. up. Path., 21, 227,.
Berry, L. J., Davis, J. and Spies, T. D. (1945), J. Lab. Clira. Me4 .. 30,684.
Bertram, S. H. (1937), Chem • .dbstr., 31, 7680.
Bhalerao, V. R., Venkatappiah, D. and Anantakrishnan, 0. P. ( 1947), lr&dia• J. t~tl. S.,.i. 1'1, 221.
Boelter, M. D. D. and Greenberg, D. M. (1943), J. Nutrit, 26, 105. Boer, J. (1941), .Acta bre11. nun. 11, 180. -and Jansen, B. C. P. (19l2), Arch. NurlGnd. Phgsior., 26, 1. --and K.entie, A. (1947a), J. Nutrit, 33, 339. --and Knol, H. W. (1947b), J. Nv.trit, 33, 359. Boer, J. E. H., Groot and Jansen B. C. P. (1948), Voedirag, 9, 60. Bolton, E. R. (1928), Oils, Fats and Fatty Foods, J. & A. Cht1rchill, London. ll Edo. Booher, L. E. (1938), J . ..tmer. J!ed. Assoc., 110, 1920. Booth, R. G., Kon, S. K., Dann, W. J. and Ti Moore (1933), BiocMm. J., 1'1, 1189. Booth, R. G., Henry, K. M. ani Kon, S. K. (1942), Biochem. J., 36, 446. . Boutwell, R. K., Geyer, R. P., Elvehjem, C. A. and Hart, E •. B. p945), .AreA. Biochefft., '1, Ul.
Boyd, E. M. (1933), J. Bior. Chem., 101, 328. Brenner, 8., Brookes, H. C. H. and Roberts, L. J. (1942), J. Nv.trie, :.a. ~9. Brenner, S. and Roberts, L. J. (1943), Arch. Im. Jle4., '11, 47'-Brown, E. F. and Bloor, W. R. (1945), J. Nutrit, 29, 349. Bult, A. R. and Sorgdrager, 0. J. (1933), Acta. bre1111etrl. Phgsior. 8, 114. --(1940), Nurland. f'ijtlsclt lhraeul;, 84, 1963. . Caldwell, A. B., McLeod, G. and Sherman, H. C. {1945), J. Nutrie, 30, 349. Callaway, J. L. and Noojni, R. 0. (1940), J.IIWest. Dermatol., 3, 71. Callison, E. C. and Knowles, V. H. (1945), ..tmu. J. P!griol, 143, 444. Campbell, H. L., Ud.iljak, M., Yarmolinaky, H. and Sharman, H. C. (1945), J. Nv.trie, 30, 343. Cereoedo, L. R. and Vinson, L. J. (1944), .AreA. BioMtfft., S, 157.
Council on Foods and Nutrition (1942), J • .dmu. Jle4 • ..tu.,119,1425. Coward, H. K. (1936), Biochem. J., 30, 1878. -{1942), Brie. Jle4. J., 1, 435. -Key, K. H., Dyer, F. J. and Morgan, B. 0. E. (1931), Bioche,._ J., 15, 511. Cowgill, G. R. {1945), Phgsiol, Rew., 15, 664. Crockett, M. E. and Deuel, H. J. (Jr.) (1947), J. Nv.trie, 33, 187.
Datar Singh (1949),Irulial& Dairgmal&, 1, 23.
Datta, N.C. (1945), Ann.. Biochem. Ezp. Jletl. (Caloutta), S, 109.
- (1948), A1111. Biochem. Ezp. Me4., (Calcutta), 8, 69. Daviea, A. W. {1933), Biochem. J., 1'1, 1770. Davies, W. L. (1939). The Chemistry of Milk, Chapman and Ha.ll Ltd., London, P. t2. Day, P. L. and Darby, W. J. {1947), Eatimation of the vitamina, Biologio.J Sympoeia., Vol XII.
The Jaquea Cattell Preas, Lancaster, PA. De, N. K., Ranganathan, S. and S11nd&rarajan, A. R. {1946),IIIdiall J. 111811. Bu., II, 3. Deuel, H. J. (Jr.) and Holmes, A. D. (1921), ..tmu. J. PAg1iol., $4, '79.
114
Deuel, H. J. (Jr.) and Holmes, A. D. (1922), BuU. U. S. Dept. Agri., No. 1033.
--, Movitt, E. and Hallman, L. F. (1943), Sci. 98, 139. ----and Mattson F. (with E. Wur) (1944), J. Nutrit., 27, 107. ---- and Wu, E. (1944a), J. Nutrit, 27, 335. ----(with E. Brown) (1944c), J. Nutrit., 27, 509.
---- (1945 a), J. Nutrit., 29, 309. Deuel, H. J. (Jr.) and Movitt, E. (with E. Brown) (1945), J. Nutrit., 29, 237. Deuel, H. J. (Jr.), Hendrick, C. and Crockett, M. E. (1946), J, Nutrit, 31, 737. Deuel, H. J. (Jr.), Hendrick, C., Movitt, E. Crockett, M. E., Smith, I. M. and Winzler, R. J.
(1946a), J. Nutrit., 31, 747.
Deuel, H. J. (Jr.) and Meserve, E. R. (1946b), Oil8 and Soaps, 23, 211. Deuel, H. J. (Jr.), Meserve, E. R. Straub, E. E., Hendrick C. and Scheer, B. T. (1947), J.
Nutrit., 33, 569. Deuel, H. J. (Jr.), Cheng, A. L. S. and Morehouse, M. C. (1948), J. Nutrit., 35, 295.
Deuel, H. J. (Jr.), Johnson, R. M., Calbert, C. E., Gardener, J. and Thom.as, B. (1949), J. Nutrit., 38, 369.
Deuel, H. J. (Jr.), Greenberg. S. M. and Savage, E. M. (1950), J. Nutrlt., 42, 239. Doctor, N. S., Banerjee, B. N. and Kothavalla, Z. R. (19!0), Indian J. vet. Sci. 10, 63. Dutt, N. C. (1945), Sci. and Cult., 10, 390. Dyme, H. C., Nelson, P.M., Lowe, B. and Nelson, V. E. (19!1), Iowa State CoU. J. Sci., 15, 189. Ershoff, B. H. and Adams, A. D. (Jr.) (1946), Proc. Soc. Ezp. Biol. Med., 62, 154. Escudero, P., E>cudero, A. and Herraiz, M.L. (with Mosto, D., Pico, R. J., RW.ice, J. C. and
Polak, M. (1939), Nutrit., Abs. Rev., U, No. 484, (1944-45.) Esh, G. C. and Sutton, T. S. (1948), J. Nutrit, 36, 391.
Euler, B. V., Euler, H. V. and Saberg, I. (1941), Ark. Kemi. Min. Geol., (B), H, No. 34. ---- (1942), Ark. Kemi. Min. Geol., (B), 15, No. 8.
Euler, B. V. and Euler, H. V. (1945), Ark. Kemi. Min. Geol., (B) 18, No. 12.
Euler, B. V., Euler, H. V. and Ronnestam-Saberg, J. (1947), Ark. Kemi. Min. Geol., (A) 24 No.15.
---- (1947a), Ark. Kemi. Min. Geol., (A) 24, No. 20. Euler, B. V. and Euler, H. V. (1948), Ark. Kemi. Min. Geol., (B), 25, No. 2.
Euler, B. V., Euler, H. V. and Lindeman, G. (19!8), Ark. Kemi. Min. Geol., (B), 26, No. 2. Evans, H. M. and Lepkovsky, S. (1928), Science, 68, 298.
Forbes, E. B., Swift, R. W., Elliott, R. F. and James, W. H. (1946), J. Sutrit., 31, 203. -- (194&), J. Nutrit., 31, 213.
Forbes, E. B., Swift, R. W., James W. H., Bratzler, J. W. and Black, A. (1946b), J. Nutrit., 32, 387. Forbes, E. B., Swift, R. W., Thacker, E. J., Smith, V. F. and French, C. E. (1945c), J.
Nutrit., 32, 397. French, C. E. (1942), J. Nutrit., 23, 375.
French, C. E. and Elliott, R. F. (1943), J. Nutrit., 25, 17.
Galanini, A. (1939), Rend. 1st. Sanit. Publ., 2, 312, (Nutr. Ab.str., Rev. (19!0) 9, 375). Geyer, R. P., Geyer, B. R., Derse, P. H., Zinkin, T., Elvehje"m, C. A. and Hart, E. B. (1947), J.
1.' utrit., 33, 129.
Gillam, A. E., Heilbom, I. M., Morton. R. A., Bishop, G. and Drummond, J. G. (1933), Biochem. J. 27, 878. .
Gray, E., Leb., Hickman, K C. D., and Brown, E. F. (1940), J. Sutrit., 19, 39. Grewal, K S. (1933), Quart. J. Pharm. 6, 650.
Guerrant, N. B. and Dutcher, R. A. (1934), J. Nutrit., 8, 397. Guggenheim, K. (1944), Biochem. J., 38, 260.
115
Hagnell-Zethraeus, G., Neymark M. and Windmark, E.·M. P. (1942), Nutrit, .Abtr., RefJ, 12, 92. Hartwell, G. (1922), Biochem. J., 16, 78, 825. -- (1928), Biockem. J., 22, 1212. Hassan, A., and Drummond. J. C. (1927), Biockem. J. 31, 653. ·
Hassan, M., Ibrahim, M. and Khanna, L. C. (19lS), [dian J. me4. Ru., 311, 33. Heftmann, E. (1947), J. Nutrit., 34, 455.
Henry, K. M., Kon, S. K., Hillditoh, T. P., and Meara, M. D. (19l5), J. Dairy Re.., 14, 45. Hickman, K. (1943), .Ann. Reu. Biockem. 12, 353. ·
Hilditoh, T. P. (1941) Industrial Chemistry of fat and waxes, Balliere. Tindall and Cox, London Hoagland. R. and Snider, 0. G. (1940), U. B. Dept. Agric. Tech. Bull. No. 725. -- (1942), U; S. Dept. Agric., Tech. Bull. No. 821. Hoagland. R. and Snider, C. G. (1943), J. Nutrit., 26, 219.
Jacobs, M. B. (1938), Chemical analysis of foods and food products, Macmillan and Co., Ltd. London, P. 218.
Jones, J. H. (1940), J. Nutrit., 20, 367. Jones, J. H., Foster, C. Dorfman, F. and Hunter, G. L., (with Quincy, M. E. and Alexender, D. L.)
(1945), J. Nutrit., 29, 127. . · Karmarkar, G. (1944), Indian mel. Gaz., 19, 535. Keb.ar, N.D. and Chanda, R. (1948) Sci. 41 Out, 13,426. - (1948), Sci. 41 our., 14, 33 •. Kehar, N. D. and Sab.ai, K. (1949), Report of tha Vanaspati Scheme· submitted to tha
Vanaspati Research Pla.nning · Committee, Food Dept. Kehar, N. D. & Mukherjee, R. (1949), Indian J. tiel. Bci.19, 113. · Kemmerer, A. R., Fraps, G. S. and DeM:ottier, J. (1947), Amh. Biochem.; 12, 135. Kennelly, B. and Quackenbush, F. W. (1947), Fe4. Proc., 6, 266. Kentie, A. (1947), Nederlands Melk Zuiveltijelschr., 1, ll8. {Nutrit., · Ablltr. Refl., 11 No.
4871, 1947-48). Kline, L., Hall, W. L. and Morgan, J. F. {1941), J • .A11. OJ1 • .Agr-ic~ Okem., 24, 147. Kundson, A. and Floody, R. J. (1940), J. Nutrit., 20, 317. Kon, S. K. and Booth, R. G. (1933), Okem.. 41lndv.lltrg, 52, 844. Langworthy, C. F. (1923), 1ndustr. Eng. Okem., IS, 276, Lassen, S. and Bacon, E. K. (1949), J. Nutrit., 39, 83. Laue, E. J., Lease, J. G., Steellbook. H. and Baumun, C. A. {1939), J. Nutrit., 1'1, 91. Leiohnger, H., Eisenberg, G., and Carlson, A. J .. (1948), J • .Amu. Me4 • .Au., 136, 388. Lemley, J. M., Brown, R. A., Bird. 0. D. and Emmnett, A. D. (1947), J. NMtri.t., JJ, 53. Lewis, J. M., Boda.nsky, 0., Falk. K. G. and McGuire. G. {1942), J. NMtri.t., 23, 351. Loosli, J. K., Lingenfelter, J. F., Thomas, J. w; and Maynard. I. A. (1944), J. Nv.trit., 28, 8L . M:aodona.ld. D. G. H. and McHenry, E. W. (1940), .Amu. J. Phystol., 128, 608. MacDonald. A. J. and Bose, S. (1942),lndian. J. me4. Ru., 30, 285, Ma.ignon, F. (1933-34), Nutr • .Ab&tr. Reu., 3, 345. . Majumdar, B. N. (1941), Indian J. tiel. Sci., 11, 329. Mannering, G. J., Lipton, M. A. and Elvehjem, 0. A. (1941), Proc. Soc. up. Bioi.., 46, 100. Mannering, G. J., Orsini, D. and Elvehjem, C. A. {1944), J. Nutril., 18, 141. Mason, E. D., Th&Ophills, F. and Frindot-Moll~, J. (1945), lrtdian J • .-L Ru., .U, 219. Mattil, K. F. and Higgins, J. W. (1945), J. Nutrie., 29, 255. Ma.ttil, K. F., Higgins, J. W. and Robinson, H. E. (1946), Science, 104, 255. Mattil, K. F. (1947), Oilortd Soap, 28, 344. Maynard. L. A. and Rasm~Wen, E. (1942), J, Nutrit., 23, 385.

116
Maynard, L. A. (1946), J. Nutrit., 32, 345. McCollum, E. V., Simmonds, N. and Pitz, W. (1916), J. biol. Ohem., 27, 33.
Miller, H. G. (1943), J. Nutrit., 26, 43. Misra, U. C. and Patwardhan, V. N. (1948), Indian. J. me4. Re8., 36, 27.
Mitchell, H. H. (1923-24), J. biol. Ohem., 58, 873. Moore, T. (1929), Lancet, 1, 499.
-- (1940), Biochern. J., 34, 1321. Mukherjee, R. and Kehar, N. D. (unpublished results). Muthanna, M. C. and Seshan, P. K. (1941), Indian rned. Gaz., 76, 487.
Myburgh, S. J. (1943), Onderat. J. vet. Sci., 18, 157. Napier, L. E. and Das Gupta, C. R. (1945), Haematological Technique, III Edn., Revised
by C. R. Das Gupta, U. N. Dhar and Sons Ltd., Calcutta. Nath, H., Barki, V. H., Elvehjem, C. A. and Hart, E. B. (1948), J. Dairy Sci., 31, 793. Nhavi,. N~ G. and Patwardhan, V. N. (1946), Indian J. med. Res., 3~, 49. ,-Nielson, E. and Elvehjem, C. A. (1942), J. Biol. Ohern., 144, 405. Norris, F. A. and Mattil, K~ F. (1946), Oil and Soap, 23, 289. Olson. F. R., Hegsted, D. M. and Peterson, W. H. (1939), .T. Dairy Sci., 22, 63. Oser, B. L., Melnick, D. and Pader, M. (1943), Ind. Eng. Ohern. Anal. Ed., 15, 724.
Popper, H. and Brenner S. (1942), J. Nutrit., 23, 431. Quackenbush, F. W., Platz, B. R. and Steenbock, H. (1939), J. Nutrit., 17, 115. Quackenbush, F. W., K11'11merow, F. A. and Steenbock, H. (1942a), J. Nu.trit., 24, 213. Quackenbush, F. W., Stennbock, H., Kummerow, F. A. and Platz., B. R. (1942b); J. Nutrit., 24, 225.
Quackenbush, F. W. and Steenbock, H. (1942c), J. Nutrit., 24, 393. Ram, Gupta and Athawala (1943), J. Indian Ohern. Soc., Indus. &. News Ed. 6, 23.
Ramasarma, G. B. and Hakim, D. N. (1942), Nature, 149, 611. · Rao, B. V. and Anantakrishnan, C. P. (1945), Indian. J. vet. Sci., 15, 231. Rao, S. D. (1945), Nature, 156, 234.
-- (1945a), Nature, 156, 449. ·Ray Sarkar, B. C. and Sen, K. C. (1943), Indian J. vet. Sci., 13, 219. Reader, V. and Drummond, J. C. (1926), Biochern. J., 20, 1256. Richardson, L. R., Hogan, A. G. and Itschner, K. F. (1941), Missouri Agri. Exp. Sta. Res.
Bull. No. 333, 3 •.
Ritzman, E. G., Colovos, N. F., .Keener, H. A. and Teeri, A. E. (1945), New Harnp. Agr. Exp. Sta. Tech. Bull. No. 87.
Roy, A. (1944), Ann. Biochern. Exp. Med., (Calcutta), 4, 17.
Salmon, W. D. and Guerrant, N. B. (1930), Alabama Expt. Sta. 41st Ann. Rept. --and Goodman, J. G. (1931), Alabama Expt. Sta. 42nd Ann. Rept. -- (1937), J. Nutrit., 13, 477.
Schantz, E. J., Boutwell, R. K., Elvehjem, C. A. and Hart, E. B. (1940), J. Dairy Sci., 23, 1205. Schantz, E. J., Elvehjem, C. A. and Hart E. B. (1940), J. Dairy Sci., 23, 181. Scheunert, A. (1940), Klin. Wochs., 19, 342.
Seshan, P. A. and Sen, K. C .. (1942), J. Agric. Sci., 32, 194.
Sherman, W. C. (1940), J. Biol. Ohem., 89, xc Proc. -- (1941), J. Nutrit., 22, 153.
Sherman, H. C., Campbell, H. L., Udiljak, M. and Yarmolinsky, H. (1945a), Proc. Nat. Aca4. Sci., u. s., 31, 107.
Shukers, C. F. and Day, P. L. (1943), J. Nutrit., 25, 511.
Smith, J. A. B. and Dastur, N. N (1938), Biochem. J., 32, 1868,
117
Smith .• T. A. B. (1948), Proc. Nufr. Soe., Abstr. Communicat{oM, Br;l, }. Nutrit,. z, 'l. Stir, F. E., ArnoloL A. and Elvehjem, C. A. (1939), J. Nufrit., 17, 48;),
Sullivan, ~1. and ~icho!: •.• T. (1941). J. /niJPxf. D"rm·thl., 4. lSI.
Sure, B. (1941), J. N•Lirit., 22, 49l.
-- (194la), J. Xutrit., 22, 499.
Treichler, R., Kermerer, A. R. and Fraps, C. S. (1942), J. Nutrit., :U, 51.
Unna, K., Richar<!s, G. V. and Sampson, W. L. (1941), J. Nutrit., 24, G3.
Wagner, K. H., Gunther, L. and Schulze (1941), Vitamin u. Hormone, 1, 4-~->.
Wainio, W. W. (1942), J. Nutrit., 24, 317. Westerlund, A. (1947-4!!), Nutrit., Abstr. Ret•,, 17, ~o. 4753.
Whipple, D. V. and Church, C. F. (1936), J. Biol. CMm. 113, cvii (Proc.j.
Wilbur, J. W., Hilton, J. H. and Hango, S. M:. (1933), J. D::tiry Sci., 16, lli3. Ya..ud><, M. (l!131l, J. Biol. Chem., 94, 40l.
Zialcita, L. l'. (Jr.) and :Mitehell, fl. H. (1944), Science, 100, 1\0.
t::::'C-M- H AR/55--30-8-56-1,225.