3,5-Diiodo-L-thyronine prevents high-fat-diet-induced insulin resistance in rat skeletal muscle...
13
The FASEB Journal • Research Communication 3,5-Diiodo-L-thyronine prevents high-fat-diet-induced insulin resistance in rat skeletal muscle through metabolic and structural adaptations Maria Moreno,* Elena Silvestri,* Rita De Matteis, † Pieter de Lange, ‡ Assunta Lombardi, § Daniela Glinni,* Rosalba Senese, ‡ Federica Cioffi, ‡ Anna Maria Salzano, Andrea Scaloni, Antonia Lanni, ‡ and Fernando Goglia* ,1 *Dipartimento di Scienze per la Biologia, la Geologia e l’Ambiente, Universita ` degli Studi del Sannio, Benevento, Italy; † Dipartimento di Scienze Biomolecolari, Universita ` di Urbino Carlo Bo, Urbino, Italy; ‡ Dipartimento di Scienze della Vita, Seconda Universita ` degli Studi di Napoli, Caserta, Italy; § Dipartimento delle Scienze Biologiche, Sez. Fisiologia ed Igiene, Universita ` degli Studi di Napoli Federico II, Naples, Italy; and Laboratorio di Proteomica e Spettrometria di Massa, Instituto per Il Sistema Produzione Animale in Ambiente Mediterraneo, Consiglio Nazionale delle Ricerche, Naples, Italy ABSTRACT The worldwide prevalence of obesity- associated pathologies, including type 2 diabetes, re- quires thorough investigation of mechanisms and inter- ventions. Recent studies have highlighted thyroid hormone analogs and derivatives as potential agents able to counteract such pathologies. In this study, in rats receiving a high-fat diet (HFD), we analyzed the effects of a 4-wk daily administration of a naturally occurring iodothyronine, 3,5-diiodo-L-thyronine (T2), on the gastrocnemius muscle metabolic/structural phe- notype and insulin signaling. The HFD-induced in- creases in muscle levels of fatty acid translocase (3-fold; P<0.05) and TGs (2-fold, P<0.05) were prevented by T2 (each; P<0.05 vs. HFD). T2 increased insulin-stimu- lated Akt phosphorylation levels (2.5-fold; P<0.05 vs. HFD). T2 induced these effects while sparing muscle mass and without cardiac hypertrophy. T2 increased the muscle contents of fast/glycolytic fibers (2-fold; P<0.05 vs. HFD) and sarcolemmal glucose transporter 4 (3-fold; P<0.05 vs. HFD). Adipocyte differentiation-related pro- tein was predominantly present within the slow/oxidative fibers in HFD-T2. In T2-treated rats (vs. HFD), glycolytic enzymes and associated components were up-regulated (proteomic analysis, significance limit: 2-fold; P<0.05), as was phosphofructokinase activity (by 1.3-fold; P<0.05), supporting the metabolic shift toward a more glycolytic phenotype. These results highlight T2 as a potential therapeutic approach to the treatment of diet-induced metabolic dysfunctions.—Moreno, M., Silvestri, E., De Matteis, R., de Lange, P., Lombardi, A., Glinni, D., Senese, R., Cioffi, F., Salzano, A. M., Scaloni, A., Lanni, A., Goglia, F. 3,5-Diiodo-L-thyronine prevents high-fat diet-induced insulin resistance in rat skeletal muscle through metabolic and structural adaptations. FASEB J. 25, 3312–3324 (2011). www.fasebj.org Key Words: thyroid hormone metabolism proteomics Fat accumulation within tissues has deleterious consequences for organ function and may lead to metabolic disorders such as insulin resistance (IR), type 2 diabetes, heart disease, and hypertension. Several strategies aim to combat these events by limiting the inappropriate deposition of fat within peripheral tis- sues. In this context, research on skeletal muscle (SKM) is attractive because of that tissue’s integral role in regulating whole-body glucose/lipid homeostasis. In fact, 80% of ingested glucose is taken up by SKM and either oxidized to provide energy or stored as glycogen (1). Moreover, fatty acid oxidation within SKM satisfies a large part of the energy requirements of this tissue in the resting state (2). Under situations of fat overload, such as during high-fat feeding, SKM is faced with increasing amounts of lipids that it is unable to oxidize, and these therefore accumulate, leading to derange- ments in insulin signaling and to muscle and, indeed, to systemic insulin resistance (3). This condition plays a key role in the metabolic disorders associated with obesity, thus contributing to the development of the metabolic syndrome (4). The mechanisms underlying muscle insulin resistance have not yet been fully eluci- dated, although they seem to involve derangements in lipid metabolism and lipotoxicity (1–11), alterations in the PI3K/Akt pathway (12–16), and skeletal muscle fiber type (17–20). Most effort has been directed at reducing the accu- mulation of detrimental lipids within muscle and liver by decreasing the availability of triglycerides (TGs) and nonesterified fatty acids via the circulation. This can be done by using either or both of the classic preventive strategies (reducing caloric intake and/or increasing 1 Dipartimento di Scienze per la Biologia, la Geologia e l’Ambiente, Universita ` degli Studi del Sannio, via Port’Arsa 11, 82100 Benevento, Italy. E-mail: [email protected] doi: 10.1096/fj.11-181982 3312 0892-6638/11/0025-3312 © FASEB
-
Upload
independent -
Category
Documents
-
view
1 -
download
0
Transcript of 3,5-Diiodo-L-thyronine prevents high-fat-diet-induced insulin resistance in rat skeletal muscle...
The FASEB Journal • Research Communication
3,5-Diiodo-L-thyronine prevents high-fat-diet-inducedinsulin resistance in rat skeletal muscle throughmetabolic and structural adaptations
Maria Moreno,* Elena Silvestri,* Rita De Matteis,† Pieter de Lange,‡
Assunta Lombardi,§ Daniela Glinni,* Rosalba Senese,‡ Federica Cioffi,‡
Anna Maria Salzano,� Andrea Scaloni,� Antonia Lanni,‡ and Fernando Goglia*,1
*Dipartimento di Scienze per la Biologia, la Geologia e l’Ambiente, Universita degli Studi delSannio, Benevento, Italy; †Dipartimento di Scienze Biomolecolari, Universita di Urbino Carlo Bo,Urbino, Italy; ‡Dipartimento di Scienze della Vita, Seconda Universita degli Studi di Napoli, Caserta,Italy; §Dipartimento delle Scienze Biologiche, Sez. Fisiologia ed Igiene, Universita degli Studi diNapoli Federico II, Naples, Italy; and �Laboratorio di Proteomica e Spettrometria di Massa, Institutoper Il Sistema Produzione Animale in Ambiente Mediterraneo, Consiglio Nazionale delle Ricerche,Naples, Italy
ABSTRACT The worldwide prevalence of obesity-associated pathologies, including type 2 diabetes, re-quires thorough investigation of mechanisms and inter-ventions. Recent studies have highlighted thyroidhormone analogs and derivatives as potential agentsable to counteract such pathologies. In this study, inrats receiving a high-fat diet (HFD), we analyzed theeffects of a 4-wk daily administration of a naturallyoccurring iodothyronine, 3,5-diiodo-L-thyronine (T2),on the gastrocnemius muscle metabolic/structural phe-notype and insulin signaling. The HFD-induced in-creases in muscle levels of fatty acid translocase (3-fold;P<0.05) and TGs (2-fold, P<0.05) were prevented byT2 (each; P<0.05 vs. HFD). T2 increased insulin-stimu-lated Akt phosphorylation levels (�2.5-fold; P<0.05 vs.HFD). T2 induced these effects while sparing musclemass and without cardiac hypertrophy. T2 increased themuscle contents of fast/glycolytic fibers (2-fold; P<0.05vs. HFD) and sarcolemmal glucose transporter 4 (3-fold;P<0.05 vs. HFD). Adipocyte differentiation-related pro-tein was predominantly present within the slow/oxidativefibers in HFD-T2. In T2-treated rats (vs. HFD), glycolyticenzymes and associated components were up-regulated(proteomic analysis, significance limit: 2-fold; P<0.05), aswas phosphofructokinase activity (by 1.3-fold; P<0.05),supporting the metabolic shift toward a more glycolyticphenotype. These results highlight T2 as a potentialtherapeutic approach to the treatment of diet-inducedmetabolic dysfunctions.—Moreno, M., Silvestri, E., DeMatteis, R., de Lange, P., Lombardi, A., Glinni, D.,Senese, R., Cioffi, F., Salzano, A. M., Scaloni, A., Lanni,A., Goglia, F. 3,5-Diiodo-L-thyronine prevents high-fatdiet-induced insulin resistance in rat skeletal musclethrough metabolic and structural adaptations. FASEB J.25, 3312–3324 (2011). www.fasebj.org
Key Words: thyroid hormone � metabolism � proteomics
Fat accumulation within tissues has deleteriousconsequences for organ function and may lead tometabolic disorders such as insulin resistance (IR), type2 diabetes, heart disease, and hypertension. Severalstrategies aim to combat these events by limiting theinappropriate deposition of fat within peripheral tis-sues. In this context, research on skeletal muscle (SKM)is attractive because of that tissue’s integral role inregulating whole-body glucose/lipid homeostasis. Infact, �80% of ingested glucose is taken up by SKM andeither oxidized to provide energy or stored as glycogen(1). Moreover, fatty acid oxidation within SKM satisfiesa large part of the energy requirements of this tissue inthe resting state (2). Under situations of fat overload,such as during high-fat feeding, SKM is faced withincreasing amounts of lipids that it is unable to oxidize,and these therefore accumulate, leading to derange-ments in insulin signaling and to muscle and, indeed,to systemic insulin resistance (3). This condition plays akey role in the metabolic disorders associated withobesity, thus contributing to the development of themetabolic syndrome (4). The mechanisms underlyingmuscle insulin resistance have not yet been fully eluci-dated, although they seem to involve derangements inlipid metabolism and lipotoxicity (1–11), alterations inthe PI3K/Akt pathway (12–16), and skeletal musclefiber type (17–20).
Most effort has been directed at reducing the accu-mulation of detrimental lipids within muscle and liverby decreasing the availability of triglycerides (TGs) andnonesterified fatty acids via the circulation. This can bedone by using either or both of the classic preventivestrategies (reducing caloric intake and/or increasing
1 Dipartimento di Scienze per la Biologia, la Geologia el’Ambiente, Universita degli Studi del Sannio, via Port’Arsa11, 82100 Benevento, Italy. E-mail: [email protected]
doi: 10.1096/fj.11-181982
3312 0892-6638/11/0025-3312 © FASEB
physical activity). A number of therapeutic options arecurrently available for the treatment of metabolic dis-orders, but because of the existence of some unwantedside effects, the development of safer and more effec-tive agents is still a major priority.
Thyroid hormone (TH) is an important modulatorof lipid metabolism and metabolic rate, favoring lipol-ysis and increasing the use of fatty acids as fuels, effectsthat have the desirable result of reducing fat accumu-lation (21). A number of investigations have demon-strated stimulatory effects of triiodothyronine (T3) oninsulin-stimulated glucose transport and/or phosphor-ylation in muscle (22, 23), on the insulin-sensitivemuscle glucose transporter, namely glucose transporter4 (GLUT4; 22, 24), and on glycolysis in isolated muscle(23). Other, consistent data have shown decreasedinsulin-stimulated glucose transport and/or phosphor-ylation, as well as a lower rate of glycolysis in isolatedmuscles from hypothyroid animals (25). Because of theinduction of adverse side effects (mostly at the cardiaclevel), the use of TH as an adiposity counteractor hasbeen greatly limited.
We showed that a natural TH derivative, namely3,5-diiodo-l-thyronine (T2), has the potential to pre-vent adiposity when administered to rats receiving ahigh-fat diet (HFD) without the undesirable side effectsattributed to THs (26), and they were accompanied atthe cellular level by an increase in fatty acid oxidationin the liver, and reductions in the circulating levels ofcholesterol and TGs (26). These actions may ultimatelyreduce the amount of lipids available to skeletal mus-cle, thus counteracting the fat-induced IR attributableto an HFD. To test the above idea, we designed thisstudy to investigate the capacity of T2 to counteractHFD-linked muscle IR in rats. To that end, we directlyassessed the effects of T2 on muscle insulin signaling;the muscle content of lipids and TGs; the muscle fibertype profile; the sarcolemmal levels of Akt, fatty acidtranslocase (FAT/CD36), and GLUT4; the muscleproteomic profile; and the fiber-specific localization ofadipocyte differentiation-related protein (ADRP).
MATERIALS AND METHODS
Animals
Male Wistar rats (aged 8 wk) were purchased from CharlesRiver (Lecco, Italy). They were housed in individual cages ina temperature-controlled room at 28°C (thermoneutral tem-perature for rats) with a 12-h light-dark cycle. A commercialmash (Charles River) was available ad libitum, and the animalsalso had free access to water.
At the beginning of this study, which was after 7–10 d ofacclimatization (d 0), rats were divided into 3 groups (15animals/group). In each group, body weight was normallydistributed, and group means were similar (300�5 g). Thefirst group (N group) was fed a standard diet (Muscedolas.r.l., Milan, Italy); the total metabolizable percentage ofenergy was made up as follows: 60.4% carbohydrates, 29%proteins, and 10.6% fat, J/J (15.88 kJ gross energy/g). Thesecond group (HFD group) was fed an HFD; the total
metabolizable percentage of energy was made up as follows:21% carbohydrates, 29% proteins, and 50% fat, J/J (19.85 kJgross energy/g; 26). The third group (HFD-T2 group) re-ceived the above HFD together with a daily intraperitonealinjection of T2 (25 �g/100 g body weight). N and HFD ratswere sham-injected. Each group was divided into 3 subgroupsof 5 rat. Ten rats were subjected to food deprivation for 5 hand were subsequently injected with either insulin (10 U/kgbody weight; 5 rats) or saline (5 rats) for the determination ofinsulin-stimulated Akt phosphorylation. The remaining ratswere used for all other measurements.
Animal care and experiments were conducted in accor-dance with the guidelines issued by the Italian Ministry ofHealth. At the end of the treatments, rats were anesthetizedby an intraperitoneal injection of chloral hydrate (40 mg/100g body weight) and were then killed by decapitation. Gastroc-nemius muscles were excised, weighed, and either immedi-ately processed or stored at �80°C for later processing.
Metabolic measurements
Total lipid and TG content of muscle were determined bymeans of an Infinity kit (Sigma-Aldrich Corp., St. Louis, MO).Protein levels of Akt and phosphorylated Akt (Ser-473 weredetermined in the supernatants of ultracentrifuged gastroc-nemius lysates. Polyclonal antibodies were used for thispurpose (27). Phosphofructokinase (PFK) was assayed by themethod described by Opie and Newsholme (28), except thatnonspecific oxidation of nicotinamide adenine dinucleotidehydroxide was inhibited by 1 mM potassium cyanide (27).The serum levels of cholesterol and TGs were determined byfollowing standard procedures. Thyroid hormone levels weredetermined using materials and protocols supplied by Byk-Sangtec Diagnostica (Hessen, Germany).
Muscle samples were fixed by overnight immersion in 4%formaldehyde and 0.1 M sodium phosphate buffer (PB), pH7.4. After a brief wash in PB, tissues were either dehydratedand paraffin embedded or immersed in sucrose (30% w/v;with 0.1% sodium azide) and were then embedded in Tissue-Tek (Sakura Finetek Europe, Zoeterwoude, The Nether-lands) and immediately frozen in liquid N2-cooled isopen-tane. For immunohistochemical analysis, adjacent serialsections (4 �m) were cut, collected onto uncoated glassslides, and used to stain ADRP, GLUT4, and myosin heavychain type I (MHC Ib) and type II (MHC IIb). The followingantibodies were used: anti-ADRP (guinea pig polyclonal,RDI-PROGP40, 1:5000; Fitzgerald Industries RDI Division,Concord, MA, USA), anti-GLUT4 (rabbit polyclonal, 1:100;Abcam, Cambridge, UK), anti-fast myosin (clone MY-32,monoclonal, 1:4000; Sigma-Aldrich Corp.), and anti-slowmyosin (clone NOQ7.5.4D, monoclonal, 1:6000; GeneTex,Irvine, CA, USA). Bound antibody was finally stained by theABC peroxidase (Vector Laboratories, Burlingame, CA, USA)method. Peroxidase activity was revealed by incubation with3,3�-diaminobenzidine tetrahydrochloride as substrate. Nu-clei were counterstained with hematoxylin, and the sectionswere mounted in Eukitt (Kindler, Freiburg, Germany). Con-trol sections for nonspecific staining were subjected to thesame incubation protocol but with the primary antibodyomitted.
To study the fiber type-specific ADRP content, double-staining was performed. Sections processed for ADRP stain-ing (as described above) were washed in running tap water,incubated in PBS for 5 min, and subsequently incubated withmonoclonal anti-fast myosin (clone MY-32, dilution 1:4000;Sigma-Aldrich). The immunoreaction was detected by meansof a different visualization system from that described above,using an ABC-AP reagent (Vectastain ABC-AP Standard Kit;Vector Laboratories) and Vector Blue Alkaline Phosphatase
3313T2 PREVENTS MUSCLE FAT ACCUMULATION AND INSULIN RESISTANCE
Substrate Kit III as the alkaline phosphatase substrate solution(Vector Laboratories). Gray-stained fibers were classified astype II fibers, whereas unstained fibers were classified as typeI fibers. The fiber type-specific ADRP-immunoreactive lipiddroplet content was valuated by counting the number ofADRP-stained fibers for either slow and fast fibers. Approxi-mately 3000 fibers were individually counted in each experi-mental group (n�4).
Immunohistochemical fiber type determination
Muscle fiber types were classified as fiber types I and II on thebasis of myosin monoclonal antibody immunostaining. Sev-eral adjacent serial cross-sections (from each rat) were exam-ined for fast and slow MHC expression. Entire cross-sectionalareas were photographed and collected at �20. Then, recom-posed tissue sections stained with slow and fast myosin-directed antibodies were compared to confirm the position ofeach fiber. Muscle fiber composition was determined bycounting the number of positive fibers stained exclusively foreither slow or fast myosin. Muscle fibers expressing multipleMHC isoforms were taken to indicate a transitional MHCphenotype and were counted as mixed (fast/slow myosin).Approximately 4000 fibers were individually counted in eachexperimental group. To confirm colocalization of slow andfast MHCs within fibers, a double-labeling protocol wasdesigned using the above antibodies against fast and slowmyosin, each with a different visualization system. In brief,slow myosin was visualized as blue/gray type I fibers, using anSG Substrate Kit (Vector Laboratories) for peroxidase andalkaline phosphatase-conjugated antibody, whereas fast myo-sin was visualized as pink type II fibers, using a Red AlkalinePhosphatase Substrate Kit I (Vector Laboratories). Fibersexpressing multiple MHC isoforms appeared as a pale grey-ish-pink color (29).
Staining of lipid droplets
Muscle cryosections (6 �m) obtained using a Leica CM1850cryostat (Leica Microsystems, Wetzlar, Germany) at �29°Cwere collected onto room-temperature glass slides; lipid drop-lets were stained by means of a neutral lipid dye [oil red O(ORO)]. ORO staining of muscle cross-sections, combinedwith immunohistochemistry (fast myosin), has been de-scribed previously for the simultaneous visualization of in-tramyocellular lipids (IMCLs) and identification of the mus-cle fiber type (30).
Western blotting
Western blot analysis was performed as described previously(27). The following antibodies were used: anti-fast myosin(clone MY-32, monoclonal, 1:4000; Sigma-Aldrich), anti-slowmyosin (clone NOQ7.5.4D, monoclonal, 1:6000; GeneTex),anti-GLUT4 (raised in rabbit, polyclonal, 1:50; Cell SignalingTechnology, Danvers, MA, USA), and anti-FAT/CD36 (mousemonoclonal FA6-152 to CD36 AB 1744; Abcam]. A �-actinantibody was purchased from Sigma-Aldrich.
Protein extraction and sample preparation for2-dimensional gel electrophoresis (2-DE)
2-DE was performed essentially as reported previously (31). Inbrief, frozen muscle tissue (40 mg) was homogenized in0.25–1 ml of 8.3 M urea, 2 M thiourea, 2% 3-[3-cholamido-propyl) diethylammonio]-1 propane sulfonate, 1% dithio-threitol, and 2% immobilized pH gradient buffer (pH 3–10).
The extracts were shaken vigorously for 30 min at 4°C,followed by a 30-min centrifugation at 10,000 g. Proteinconcentration was determined using the detergent-compati-ble method (DC Protein Assay; Bio-Rad Laboratories, Hercu-les, CA, USA). Protein extracts were prepared for eachanimal, and each individual animal was assessed separately.Protein samples (650 �g) were applied to immobilized pH3–10 nonlinear gradient strips (17 cm; Bio-Rad Laboratories).For each sample, triplicate runs were performed as indepen-dent experiments. Focusing started at 200 V; the voltage wasgradually increased to 3500 V and then kept constant for afurther 66,500 Vh (Protean IEF System; Bio-Rad Laborato-ries). The second-dimensional separation was performedusing 12% SDS-polyacrylamide gels. After protein fixation,the gels were stained with colloidal Coomassie blue (Sigma-Aldrich). Electronic images of the gels were acquired bymeans of a calibrated GS-800 densitometer (Bio-Rad Labora-tories) and analyzed using PDQuest software (Bio-Rad Labo-ratories). For all spot-intensity calculations, normalized valueswere used to calculate the relative intensity (RI) for each spot:RI � vi/vt, where vi is the volume of the individual spot andvt the sum of the volumes of all matched spots. Spots withvalues of P 0.05 and �1.5-fold variation in pairwise com-parisons were considered to display a significant differencebetween experimental groups.
Protein digestion and mass spectrometry analysis
Spots from 2-DE were excised from gels, S-alkylated, anddigested with trypsin as reported previously (32). Digests weredesalted on �ZipTipC18 (Millipore Corp., Billerica, MA,USA) before mass spectrometry analysis. During matrix-as-sisted laser desorption ionization/time of flight (MALDI-TOF) peptide mass fingerprinting (PMF) experiments, pep-tide mixtures were loaded on the instrument target with-cyano-4-hydroxycinnamic acid as matrix, using the drieddroplet technique. Samples were analyzed on a Voyager-DEPRO mass spectrometer (Applied Biosystems, Foster City, CA,USA). Spectra were acquired in reflectron mode; internalmass calibration was performed using peptides from trypsinautoproteolysis. Data were elaborated using DataExplorersoftware (Applied Biosystems). Digests were eventually ana-lyzed by nano-liquid chromatography-electrospray ionization-linear ion trap-tandem mass spectrometry (nLC-ESI-LIT-MS/MS) using a LTQ XL mass spectrometer (Thermo FisherScientific, Waltham, MA, USA) equipped with a Proxeonnanospray source connected to an Easy-nLC system (ThermoFisher Scientific; ref. 33). Peptide mixtures were separated onan Easy C18 column (10�0.075 mm, 3 �m; Thermo FisherScientific) using a gradient of acetonitrile containing 0.1%formic acid in aqueous 0.1% formic acid; acetonitrile wasramped from 5 to 35% over 10 min and from 35 to 95% over2 min and remained at 95% for 12 min, at a flow rate of 300nl/min. Spectra were acquired in the range of m/z 400–2000.Acquisition was controlled by a data-dependent production-scanning procedure over the three most abundant ions,enabling dynamic exclusion function.
Protein identification
MASCOT 2.2.06 software (Matrix Science Ltd., London, UK;ref. 34) was used to identify spots from a Rattus norvegicussequence database (National Center for Biotechnology Infor-mation no. 2010/08/07). MALDI-TOF PMF data weresearched using a mass tolerance value of 50 ppm, with trypsinas the proteolytic enzyme, a missed-cleavage maximum valueof 2, and Cys carbamidomethylation and Met oxidation asfixed and variable modifications, respectively. nLC-ESI-LIT-
3314 Vol. 25 October 2011 MORENO ET AL.The FASEB Journal � www.fasebj.org
MS/MS data were searched using the same criteria but with amass tolerance value of 2 Da for the precursor ion and 0.8 Dafor MS/MS fragments. MALDI-TOF PMF candidates with acumulative MASCOT score � 83 or nLC-ESI-LIT-MS/MScandidates with �2 assigned peptides with an individualMASCOT score � 30, both corresponding to P 0.05 for asignificant identification, were further evaluated for theirexperimental mass and pI values obtained from 2-DE. Proteinidentification was checked with a reverted sequence databaseto provide a false-positive rate of 1%.
Statistical analysis
Results are expressed as means � se. The statistical signifi-cance of differences between groups was determined using1-way ANOVA followed by a Student-Newman-Keuls test.Differences were considered significant at P 0.05.
RESULTS
T2 prevents HFD-induced hyperlipidemia withoutinducing a thyrotoxic state
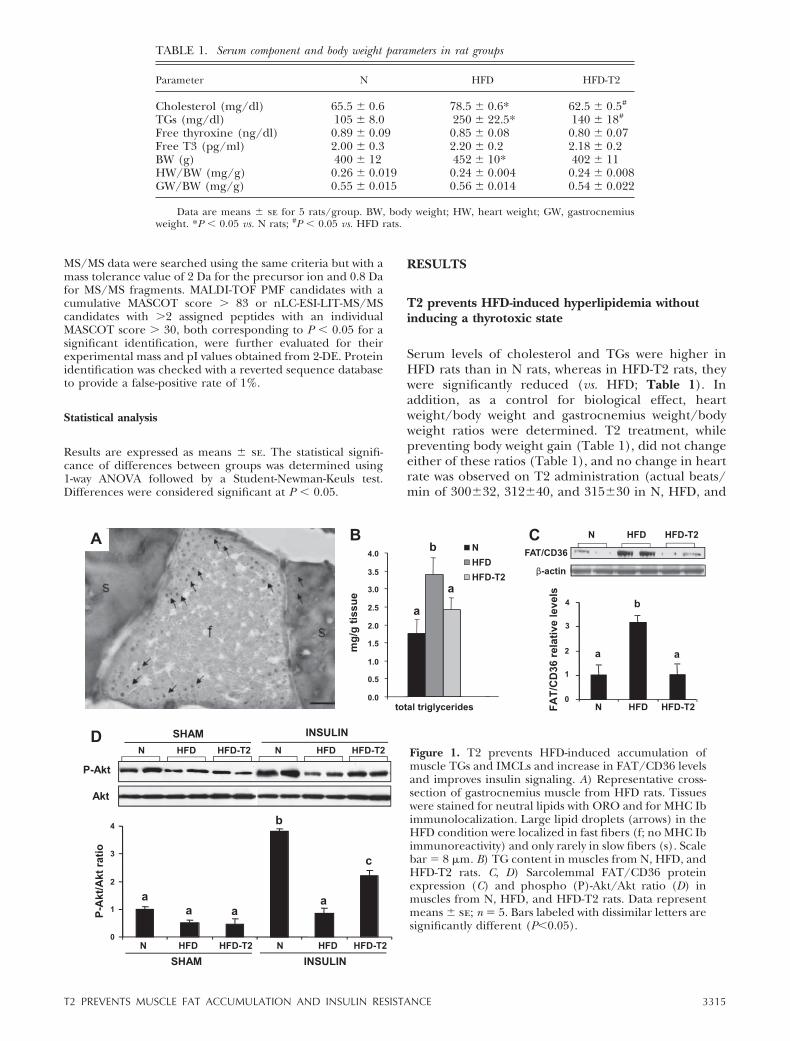
Serum levels of cholesterol and TGs were higher inHFD rats than in N rats, whereas in HFD-T2 rats, theywere significantly reduced (vs. HFD; Table 1). Inaddition, as a control for biological effect, heartweight/body weight and gastrocnemius weight/bodyweight ratios were determined. T2 treatment, whilepreventing body weight gain (Table 1), did not changeeither of these ratios (Table 1), and no change in heartrate was observed on T2 administration (actual beats/min of 300�32, 312�40, and 315�30 in N, HFD, and
Figure 1. T2 prevents HFD-induced accumulation ofmuscle TGs and IMCLs and increase in FAT/CD36 levelsand improves insulin signaling. A) Representative cross-section of gastrocnemius muscle from HFD rats. Tissueswere stained for neutral lipids with ORO and for MHC Ibimmunolocalization. Large lipid droplets (arrows) in theHFD condition were localized in fast fibers (f; no MHC Ibimmunoreactivity) and only rarely in slow fibers (s). Scalebar � 8 �m. B) TG content in muscles from N, HFD, andHFD-T2 rats. C, D) Sarcolemmal FAT/CD36 proteinexpression (C) and phospho (P)-Akt/Akt ratio (D) inmuscles from N, HFD, and HFD-T2 rats. Data representmeans � se; n � 5. Bars labeled with dissimilar letters aresignificantly different (P0.05).
TABLE 1. Serum component and body weight parameters in rat groups
Parameter N HFD HFD-T2
Cholesterol (mg/dl) 65.5 � 0.6 78.5 � 0.6* 62.5 � 0.5#
TGs (mg/dl) 105 � 8.0 250 � 22.5* 140 � 18#
Free thyroxine (ng/dl) 0.89 � 0.09 0.85 � 0.08 0.80 � 0.07Free T3 (pg/ml) 2.00 � 0.3 2.20 � 0.2 2.18 � 0.2BW (g) 400 � 12 452 � 10* 402 � 11HW/BW (mg/g) 0.26 � 0.019 0.24 � 0.004 0.24 � 0.008GW/BW (mg/g) 0.55 � 0.015 0.56 � 0.014 0.54 � 0.022
Data are means � se for 5 rats/group. BW, body weight; HW, heart weight; GW, gastrocnemiusweight. *P 0.05 vs. N rats; #P 0.05 vs. HFD rats.
3315T2 PREVENTS MUSCLE FAT ACCUMULATION AND INSULIN RESISTANCE
HFD-T2 groups, respectively). No significant differencewas found in serum free thyroxine and free T3 levelsamong the 3 groups (Table 1), in accordance withour previous results (26), showing that in the pres-ence of an unaltered hypothalamus-pituitary-thyroidaxis, T2 prevented body weight gain in HFD ratswithout influencing energy intake, with the changesin body weight being primarily the result of decreasesin fat mass, confirming that T2 does not inducethyrotoxic effects.
T2 prevents HFD-induced increases in gastrocnemiusmuscle TG, IMCL, and FAT/CD36 levels andsignificantly improves insulin signaling
Skeletal muscles adapt to a given stimulus with struc-tural, biochemical, and functional modifications in linewith the fuel used and the energy demand (35). This isparticularly true for a mixed-fiber-type muscle, such asgastrocnemius, which contains regions of slow- andfast-twitch fibers. As expected, HFD feeding raised the
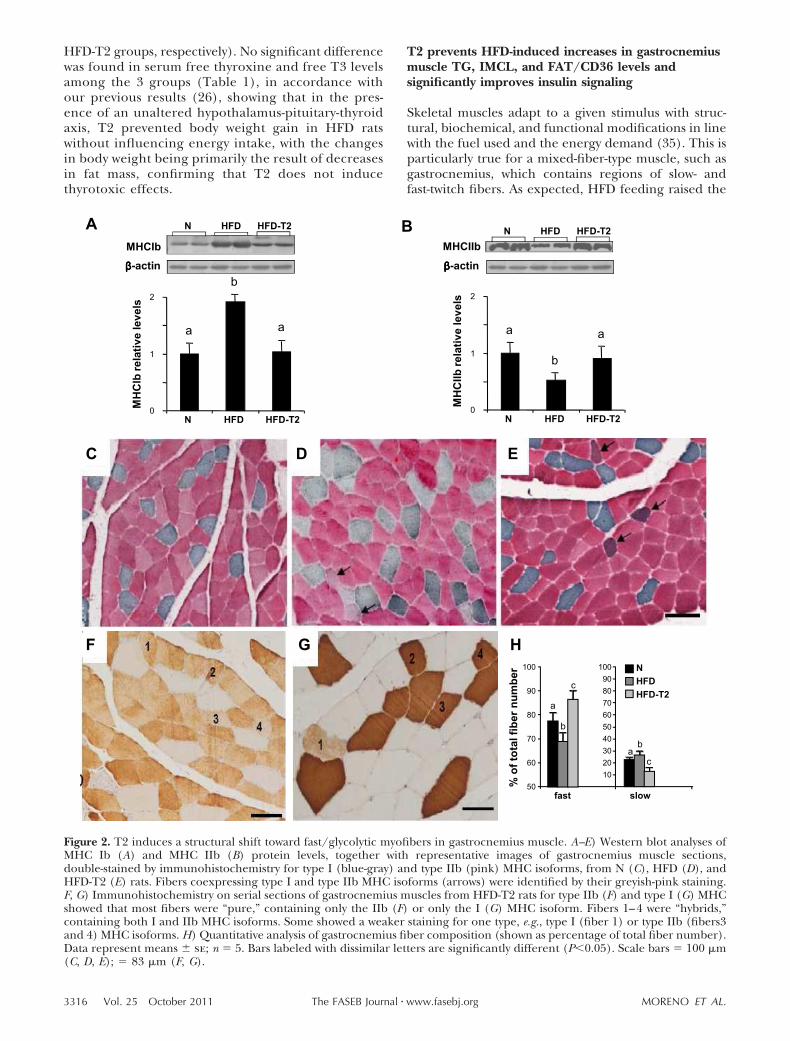
Figure 2. T2 induces a structural shift toward fast/glycolytic myofibers in gastrocnemius muscle. A–E) Western blot analyses ofMHC Ib (A) and MHC IIb (B) protein levels, together with representative images of gastrocnemius muscle sections,double-stained by immunohistochemistry for type I (blue-gray) and type IIb (pink) MHC isoforms, from N (C), HFD (D), andHFD-T2 (E) rats. Fibers coexpressing type I and type IIb MHC isoforms (arrows) were identified by their greyish-pink staining.F, G) Immunohistochemistry on serial sections of gastrocnemius muscles from HFD-T2 rats for type IIb (F) and type I (G) MHCshowed that most fibers were “pure,” containing only the IIb (F) or only the I (G) MHC isoform. Fibers 1–4 were “hybrids,”containing both I and IIb MHC isoforms. Some showed a weaker staining for one type, e.g., type I (fiber 1) or type IIb (fibers3and 4) MHC isoforms. H) Quantitative analysis of gastrocnemius fiber composition (shown as percentage of total fiber number).Data represent means � se; n � 5. Bars labeled with dissimilar letters are significantly different (P0.05). Scale bars � 100 �m(C, D, E); � 83 �m (F, G).
3316 Vol. 25 October 2011 MORENO ET AL.The FASEB Journal � www.fasebj.org
gastrocnemius content of IMCLs and TGs (Fig. 1A, B).Large lipid droplets were noted within muscle fibers inthe HFD condition (Fig. 1A). Combined ORO stainingand MHC Ib immunolocalization showed that thoselarge lipid droplets (Fig. 1A, arrows) were localized tofast fibers. This augmented IMCL accumulation wasassociated with an elevated basal sarcolemmal-associ-ated FAT/CD36 level (�3-fold vs. N; Fig. 1C). T2treatment normalized muscle TG levels (Fig. 1B) andprevented the increase in the sarcolemmal FAT/CD36protein level (Fig. 1C), when compared with HFD rats,in the absence of any increase in fatty acid oxidation(data not shown). Therefore, it appears that underHFD conditions, gastrocnemius responds by maintain-ing a higher concentration of FAT/CD36 on the cellmembrane; as a consequence, uptake of fatty acids isincreased, and they are stored as IMCLs. By reducingthe fatty acid uptake, T2 evidently leads to decreases in
IMCL and TG levels in muscle. This result suggests aprotective role for T2 in preventing IMCL accumula-tion and consequently ameliorating the condition of IRinduced by the HFD. Indeed, under in vivo insulin-stimulated conditions, T2 treatment enhanced the con-centration of the phosphorylated form of Akt (�2.5-fold; P0.05 vs. HFD), demonstrating that it preservesinsulin signaling against the deleterious effect of HFDfeeding (Fig. 1D).
T2 induces in gastrocnemius muscle a structuraland biochemical shift toward glycolytic myofibers
Because the skeletal muscle fiber-type profile mightplay a role in the IR observed in HFD rats, wemeasured the relative protein expression levels of theMHC isoforms Ib and IIb in gastrocnemius. Westernblot analysis revealed that the MHC Ib level was
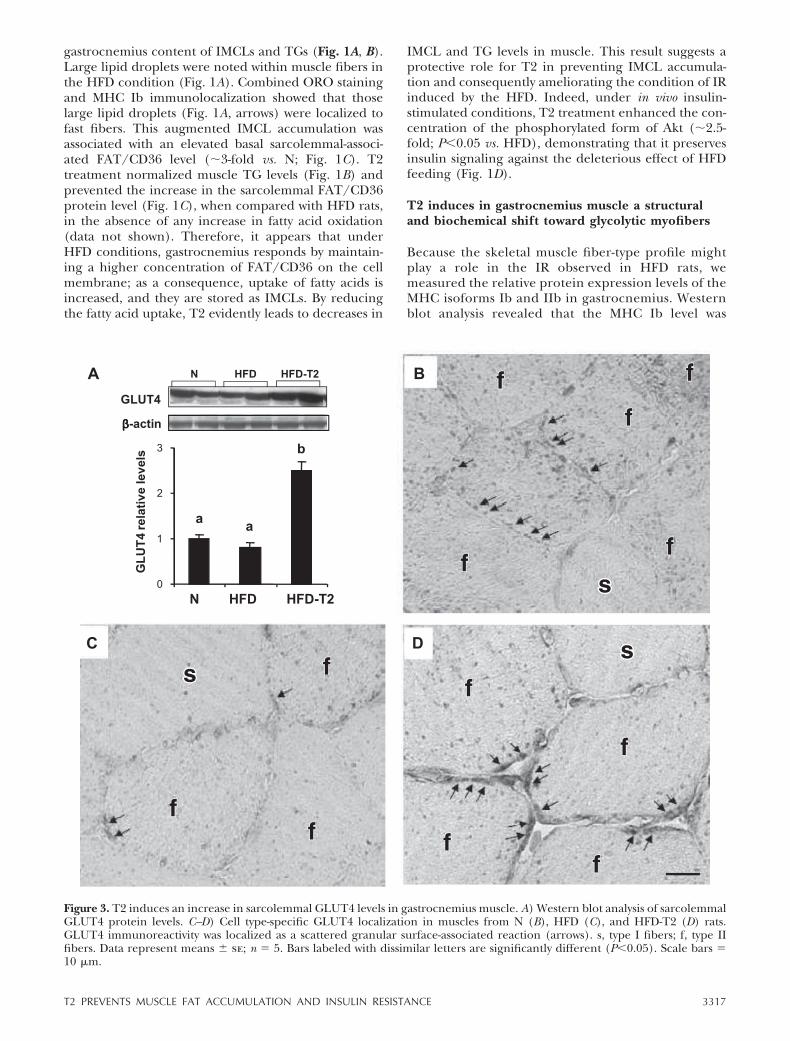
Figure 3. T2 induces an increase in sarcolemmal GLUT4 levels in gastrocnemius muscle. A) Western blot analysis of sarcolemmalGLUT4 protein levels. C–D) Cell type-specific GLUT4 localization in muscles from N (B), HFD (C), and HFD-T2 (D) rats.GLUT4 immunoreactivity was localized as a scattered granular surface-associated reaction (arrows). s, type I fibers; f, type IIfibers. Data represent means � se; n � 5. Bars labeled with dissimilar letters are significantly different (P0.05). Scale bars �10 �m.
3317T2 PREVENTS MUSCLE FAT ACCUMULATION AND INSULIN RESISTANCE
significantly increased in gastrocnemius from HFDrats, whereas T2 treatment significantly reduced it tothe level observed in N rats (Fig. 2A). The MHC IIblevel, on the other hand, was significantly reduced ingastrocnemius muscles from HFD rats, but it, too, wasrestored by T2 treatment (Fig. 2B). Quantitativeanalysis of fiber types revealed that slow/oxidativefibers were replaced to a significant extent by fast/glycolytic fibers after T2 treatment (Fig. 2C–H). Ofnote, although some 4% of fibers were joint fast/slowimmunoreactive in both HFD and HFD-T2 rats, the
fast component prevailed after T2 treatment (Fig. 2E,F), indicating an ongoing structural shift toward theglycolytic phenotype. This shift was supported by theobservation that many of the slow/fast immunoreac-tive fibers were only weakly stained for slow myosin inmuscles from HFD-T2 rats (Fig. 2G). The sarcolem-mal membrane-associated GLUT4 protein contentwas up-regulated by T2 treatment, in accordance withthe observed structural shift (Fig. 3A). The plasmamembrane-associated labeling in fast/glycolytic fi-bers was more intense in the HFD-T2 gastrocnemius
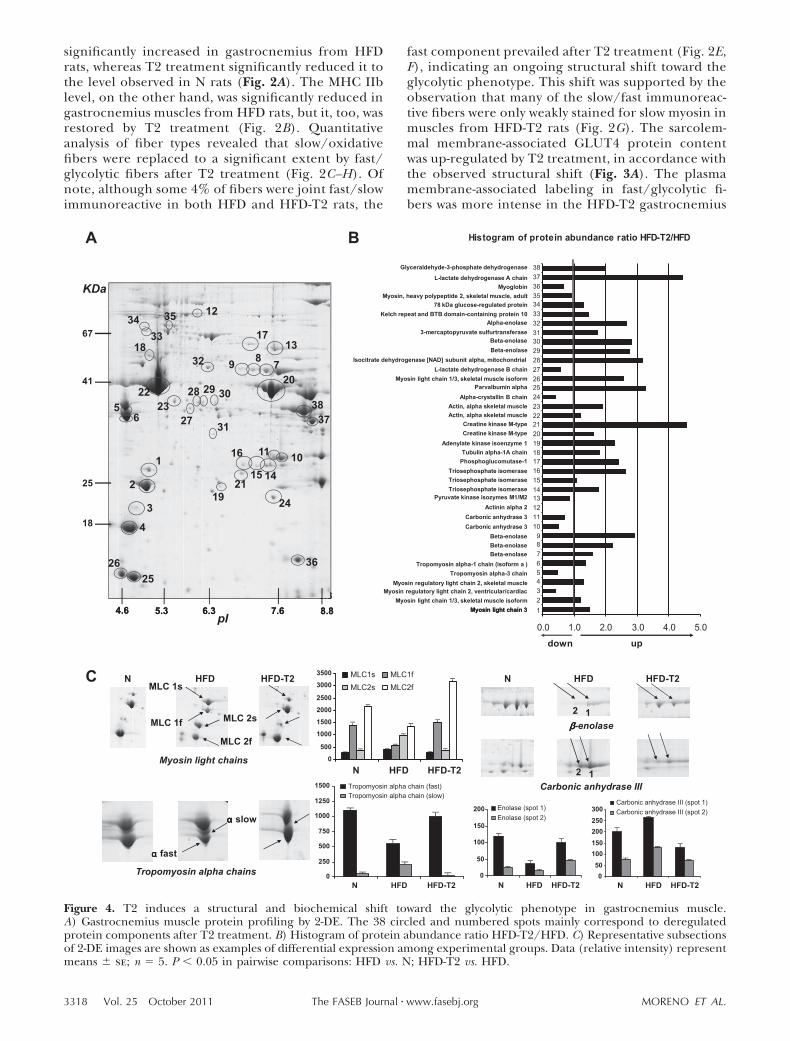
Figure 4. T2 induces a structural and biochemical shift toward the glycolytic phenotype in gastrocnemius muscle.A) Gastrocnemius muscle protein profiling by 2-DE. The 38 circled and numbered spots mainly correspond to deregulatedprotein components after T2 treatment. B) Histogram of protein abundance ratio HFD-T2/HFD. C) Representative subsectionsof 2-DE images are shown as examples of differential expression among experimental groups. Data (relative intensity) representmeans � se; n � 5. P 0.05 in pairwise comparisons: HFD vs. N; HFD-T2 vs. HFD.
3318 Vol. 25 October 2011 MORENO ET AL.The FASEB Journal � www.fasebj.org
(Fig. 3D) than in the N (Fig. 3B) or HFD (Fig. 3C)rats.
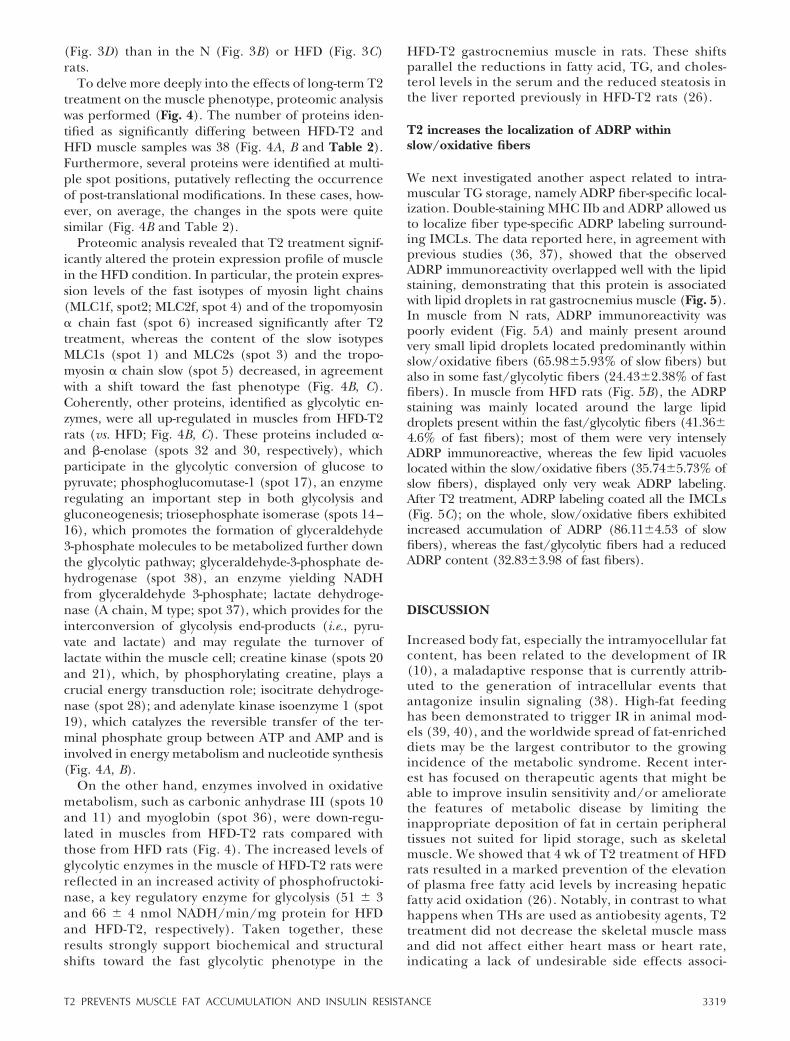
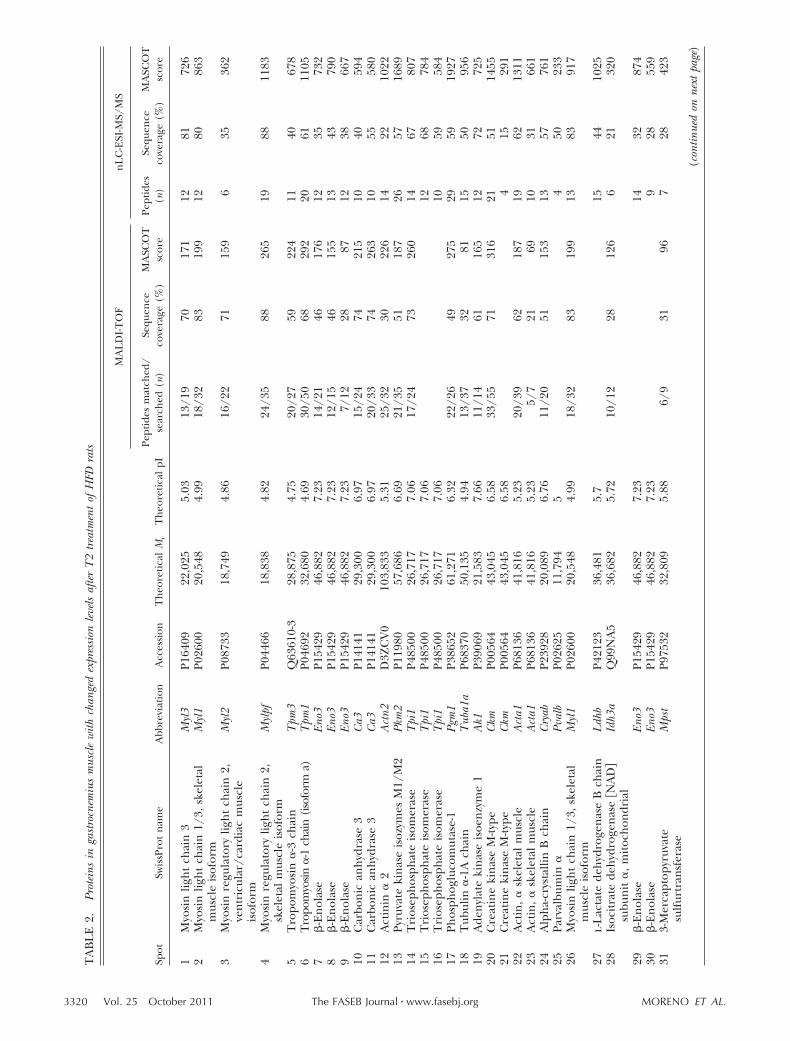
To delve more deeply into the effects of long-term T2treatment on the muscle phenotype, proteomic analysiswas performed (Fig. 4). The number of proteins iden-tified as significantly differing between HFD-T2 andHFD muscle samples was 38 (Fig. 4A, B and Table 2).Furthermore, several proteins were identified at multi-ple spot positions, putatively reflecting the occurrenceof post-translational modifications. In these cases, how-ever, on average, the changes in the spots were quitesimilar (Fig. 4B and Table 2).
Proteomic analysis revealed that T2 treatment signif-icantly altered the protein expression profile of musclein the HFD condition. In particular, the protein expres-sion levels of the fast isotypes of myosin light chains(MLC1f, spot2; MLC2f, spot 4) and of the tropomyosin chain fast (spot 6) increased significantly after T2treatment, whereas the content of the slow isotypesMLC1s (spot 1) and MLC2s (spot 3) and the tropo-myosin chain slow (spot 5) decreased, in agreementwith a shift toward the fast phenotype (Fig. 4B, C).Coherently, other proteins, identified as glycolytic en-zymes, were all up-regulated in muscles from HFD-T2rats (vs. HFD; Fig. 4B, C). These proteins included -and �-enolase (spots 32 and 30, respectively), whichparticipate in the glycolytic conversion of glucose topyruvate; phosphoglucomutase-1 (spot 17), an enzymeregulating an important step in both glycolysis andgluconeogenesis; triosephosphate isomerase (spots 14–16), which promotes the formation of glyceraldehyde3-phosphate molecules to be metabolized further downthe glycolytic pathway; glyceraldehyde-3-phosphate de-hydrogenase (spot 38), an enzyme yielding NADHfrom glyceraldehyde 3-phosphate; lactate dehydroge-nase (A chain, M type; spot 37), which provides for theinterconversion of glycolysis end-products (i.e., pyru-vate and lactate) and may regulate the turnover oflactate within the muscle cell; creatine kinase (spots 20and 21), which, by phosphorylating creatine, plays acrucial energy transduction role; isocitrate dehydroge-nase (spot 28); and adenylate kinase isoenzyme 1 (spot19), which catalyzes the reversible transfer of the ter-minal phosphate group between ATP and AMP and isinvolved in energy metabolism and nucleotide synthesis(Fig. 4A, B).
On the other hand, enzymes involved in oxidativemetabolism, such as carbonic anhydrase III (spots 10and 11) and myoglobin (spot 36), were down-regu-lated in muscles from HFD-T2 rats compared withthose from HFD rats (Fig. 4). The increased levels ofglycolytic enzymes in the muscle of HFD-T2 rats werereflected in an increased activity of phosphofructoki-nase, a key regulatory enzyme for glycolysis (51 � 3and 66 � 4 nmol NADH/min/mg protein for HFDand HFD-T2, respectively). Taken together, theseresults strongly support biochemical and structuralshifts toward the fast glycolytic phenotype in the
HFD-T2 gastrocnemius muscle in rats. These shiftsparallel the reductions in fatty acid, TG, and choles-terol levels in the serum and the reduced steatosis inthe liver reported previously in HFD-T2 rats (26).
T2 increases the localization of ADRP withinslow/oxidative fibers
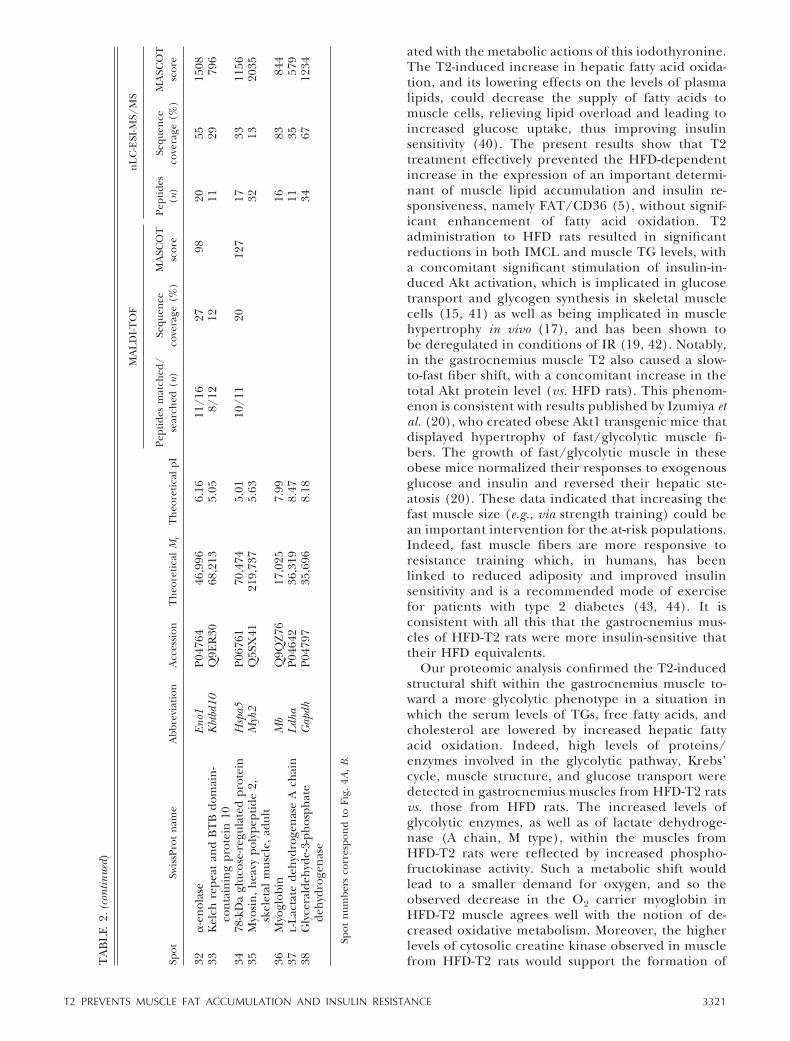
We next investigated another aspect related to intra-muscular TG storage, namely ADRP fiber-specific local-ization. Double-staining MHC IIb and ADRP allowed usto localize fiber type-specific ADRP labeling surround-ing IMCLs. The data reported here, in agreement withprevious studies (36, 37), showed that the observedADRP immunoreactivity overlapped well with the lipidstaining, demonstrating that this protein is associatedwith lipid droplets in rat gastrocnemius muscle (Fig. 5).In muscle from N rats, ADRP immunoreactivity waspoorly evident (Fig. 5A) and mainly present aroundvery small lipid droplets located predominantly withinslow/oxidative fibers (65.98�5.93% of slow fibers) butalso in some fast/glycolytic fibers (24.43�2.38% of fastfibers). In muscle from HFD rats (Fig. 5B), the ADRPstaining was mainly located around the large lipiddroplets present within the fast/glycolytic fibers (41.36�4.6% of fast fibers); most of them were very intenselyADRP immunoreactive, whereas the few lipid vacuoleslocated within the slow/oxidative fibers (35.74�5.73% ofslow fibers), displayed only very weak ADRP labeling.After T2 treatment, ADRP labeling coated all the IMCLs(Fig. 5C); on the whole, slow/oxidative fibers exhibitedincreased accumulation of ADRP (86.11�4.53 of slowfibers), whereas the fast/glycolytic fibers had a reducedADRP content (32.83�3.98 of fast fibers).
DISCUSSION
Increased body fat, especially the intramyocellular fatcontent, has been related to the development of IR(10), a maladaptive response that is currently attrib-uted to the generation of intracellular events thatantagonize insulin signaling (38). High-fat feedinghas been demonstrated to trigger IR in animal mod-els (39, 40), and the worldwide spread of fat-enricheddiets may be the largest contributor to the growingincidence of the metabolic syndrome. Recent inter-est has focused on therapeutic agents that might beable to improve insulin sensitivity and/or amelioratethe features of metabolic disease by limiting theinappropriate deposition of fat in certain peripheraltissues not suited for lipid storage, such as skeletalmuscle. We showed that 4 wk of T2 treatment of HFDrats resulted in a marked prevention of the elevationof plasma free fatty acid levels by increasing hepaticfatty acid oxidation (26). Notably, in contrast to whathappens when THs are used as antiobesity agents, T2treatment did not decrease the skeletal muscle massand did not affect either heart mass or heart rate,indicating a lack of undesirable side effects associ-
3319T2 PREVENTS MUSCLE FAT ACCUMULATION AND INSULIN RESISTANCE
TA
BL
E2.
Prot
eins
inga
stro
cnem
ius
mus
cle
with
chan
ged
expr
essi
onle
vels
afte
rT
2tr
eatm
ent
ofH
FDra
ts
Spot
Swis
sPro
tn
ame
Abb
revi
atio
nA
cces
sion
Th
eore
tica
lM
rT
heo
reti
cal
pI
MA
LD
I-T
OF
nL
C-E
SI-M
S/M
S
Pept
ides
mat
ched
/se
arch
ed(n
)Se
quen
ceco
vera
ge(%
)M
ASC
OT
scor
ePe
ptid
es(n
)Se
quen
ceco
vera
ge(%
)M
ASC
OT
scor
e
1M
yosi
nlig
ht
chai
n3
Myl
3P1
6409
22,0
255.
0313
/19
7017
112
8172
62
Myo
sin
ligh
tch
ain
1/3,
skel
etal
mus
cle
isof
orm
Myl
1P0
2600
20,5
484.
9918
/32
8319
912
8086
3
3M
yosi
nre
gula
tory
ligh
tch
ain
2,ve
ntr
icul
ar/c
ardi
acm
uscl
eis
ofor
m
Myl
2P0
8733
18,7
494.
8616
/22
7115
96
3536
2
4M
yosi
nre
gula
tory
ligh
tch
ain
2,sk
elet
alm
uscl
eis
ofor
mM
ylpf
P044
6618
,838
4.82
24/3
588
265
1988
1183
5T
ropo
myo
sin
-3
chai
nT
pm3
Q63
610-
328
,875
4.75
20/2
759
224
1140
678
6T
ropo
myo
sin
-1ch
ain
(iso
form
a)T
pm1
P046
9232
,680
4.69
30/5
068
292
2061
1105
7�
-En
olas
eEn
o3P1
5429
46,8
827.
2314
/21
4617
612
3573
28
�-E
nol
ase
Eno3
P154
2946
,882
7.23
12/1
546
155
1343
790
9�
-En
olas
eEn
o3P1
5429
46,8
827.
237/
1228
8712
3866
710
Car
bon
ican
hyd
rase
3C
a3P1
4141
29,3
006.
9715
/24
7421
510
4059
411
Car
bon
ican
hyd
rase
3C
a3P1
4141
29,3
006.
9720
/33
7426
310
5558
012
Act
inin
2
Act
n2D
3ZC
V0
103,
833
5.31
25/3
230
226
1422
1022
13Py
ruva
teki
nas
eis
ozym
esM
1/M
2Pk
m2
P119
8057
,686
6.69
21/3
551
187
2657
1689
14T
rios
eph
osph
ate
isom
eras
eT
pi1
P485
0026
,717
7.06
17/2
473
260
1467
807
15T
rios
eph
osph
ate
isom
eras
eT
pi1
P485
0026
,717
7.06
1268
784
16T
rios
eph
osph
ate
isom
eras
eT
pi1
P485
0026
,717
7.06
1059
584
17Ph
osph
oglu
com
utas
e-1
Pgm
1P3
8652
61,2
716.
3222
/26
4927
529
5919
2718
Tub
ulin
-1
Ach
ain
Tub
a1a
P683
7050
,135
4.94
13/3
732
8115
5095
619
Ade
nyl
ate
kin
ase
isoe
nzy
me
1A
k1P3
9069
21,5
837.
6611
/14
6116
512
7272
520
Cre
atin
eki
nas
eM
-type
Ckm
P005
6443
,045
6.58
33/5
571
316
2151
1455
21C
reat
ine
kin
ase
M-ty
peC
kmP0
0564
43,0
456.
584
1529
122
Act
in,
sk
elet
alm
uscl
eA
cta1
P681
3641
,816
5.23
20/3
962
187
1962
1311
23A
ctin
,
skel
etal
mus
cle
Act
a1P6
8136
41,8
165.
235/
721
6910
3166
124
Alp
ha-
crys
talli
nB
chai
nC
ryab
P239
2820
,089
6.76
11/2
051
153
1357
761
25Pa
rval
bum
in
Pval
bP0
2625
11,7
945
450
233
26M
yosi
nlig
ht
chai
n1/
3,sk
elet
alm
uscl
eis
ofor
mM
yl1
P026
0020
,548
4.99
18/3
283
199
1383
917
27l-
Lac
tate
deh
ydro
gen
ase
Bch
ain
Ldh
bP4
2123
36,4
815.
715
4410
2528
Isoc
itra
tede
hyd
roge
nas
e�N
AD
su
bun
it
,m
itoc
hon
dria
lId
h3a
Q99
NA
536
,682
5.72
10/1
228
126
621
320
29�
-En
olas
eEn
o3P1
5429
46,8
827.
2314
3287
430
�-E
nol
ase
Eno3
P154
2946
,882
7.23
928
559
313-
Mer
capt
opyr
uvat
esu
lfur
tran
sfer
ase
Mps
tP9
7532
32,8
095.
886/
931
967
2842
3
(con
tinue
don
next
page
)
3320 Vol. 25 October 2011 MORENO ET AL.The FASEB Journal � www.fasebj.org
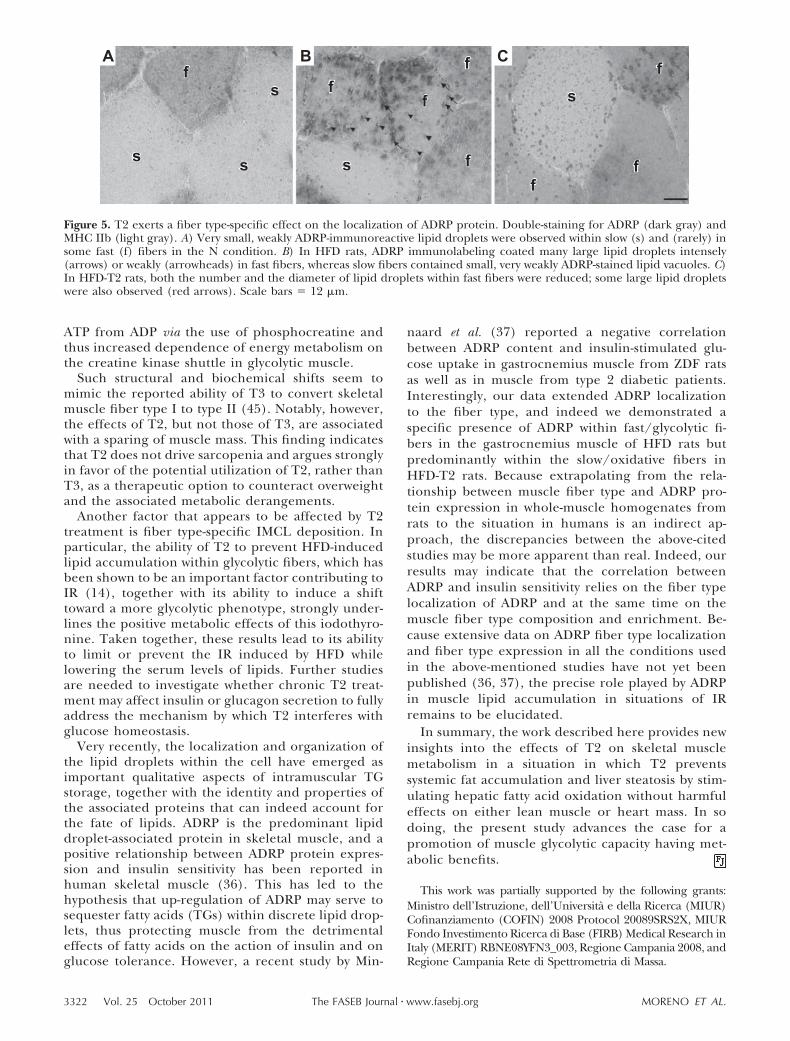
ated with the metabolic actions of this iodothyronine.The T2-induced increase in hepatic fatty acid oxida-tion, and its lowering effects on the levels of plasmalipids, could decrease the supply of fatty acids tomuscle cells, relieving lipid overload and leading toincreased glucose uptake, thus improving insulinsensitivity (40). The present results show that T2treatment effectively prevented the HFD-dependentincrease in the expression of an important determi-nant of muscle lipid accumulation and insulin re-sponsiveness, namely FAT/CD36 (5), without signif-icant enhancement of fatty acid oxidation. T2administration to HFD rats resulted in significantreductions in both IMCL and muscle TG levels, witha concomitant significant stimulation of insulin-in-duced Akt activation, which is implicated in glucosetransport and glycogen synthesis in skeletal musclecells (15, 41) as well as being implicated in musclehypertrophy in vivo (17), and has been shown tobe deregulated in conditions of IR (19, 42). Notably,in the gastrocnemius muscle T2 also caused a slow-to-fast fiber shift, with a concomitant increase in thetotal Akt protein level (vs. HFD rats). This phenom-enon is consistent with results published by Izumiya etal. (20), who created obese Akt1 transgenic mice thatdisplayed hypertrophy of fast/glycolytic muscle fi-bers. The growth of fast/glycolytic muscle in theseobese mice normalized their responses to exogenousglucose and insulin and reversed their hepatic ste-atosis (20). These data indicated that increasing thefast muscle size (e.g., via strength training) could bean important intervention for the at-risk populations.Indeed, fast muscle fibers are more responsive toresistance training which, in humans, has beenlinked to reduced adiposity and improved insulinsensitivity and is a recommended mode of exercisefor patients with type 2 diabetes (43, 44). It isconsistent with all this that the gastrocnemius mus-cles of HFD-T2 rats were more insulin-sensitive thattheir HFD equivalents.
Our proteomic analysis confirmed the T2-inducedstructural shift within the gastrocnemius muscle to-ward a more glycolytic phenotype in a situation inwhich the serum levels of TGs, free fatty acids, andcholesterol are lowered by increased hepatic fattyacid oxidation. Indeed, high levels of proteins/enzymes involved in the glycolytic pathway, Krebs’cycle, muscle structure, and glucose transport weredetected in gastrocnemius muscles from HFD-T2 ratsvs. those from HFD rats. The increased levels ofglycolytic enzymes, as well as of lactate dehydroge-nase (A chain, M type), within the muscles fromHFD-T2 rats were reflected by increased phospho-fructokinase activity. Such a metabolic shift wouldlead to a smaller demand for oxygen, and so theobserved decrease in the O2 carrier myoglobin inHFD-T2 muscle agrees well with the notion of de-creased oxidative metabolism. Moreover, the higherlevels of cytosolic creatine kinase observed in musclefrom HFD-T2 rats would support the formation ofT
AB
LE
2.(c
ontin
ued)
Spot
Swis
sPro
tn
ame
Abb
revi
atio
nA
cces
sion
Th
eore
tica
lM
rT
heo
reti
cal
pI
MA
LD
I-T
OF
nL
C-E
SI-M
S/M
S
Pept
ides
mat
ched
/se
arch
ed(n
)Se
quen
ceco
vera
ge(%
)M
ASC
OT
scor
ePe
ptid
es(n
)Se
quen
ceco
vera
ge(%
)M
ASC
OT
scor
e
32
-en
olas
eEn
o1P0
4764
46,9
966.
1611
/16
2798
2055
1508
33K
elch
repe
atan
dB
TB
dom
ain
-co
nta
inin
gpr
otei
n10
Kbt
bd10
Q9E
R30
68,2
135.
058/
1212
1129
796
3478
-kD
agl
ucos
e-re
gula
ted
prot
ein
Hsp
a5P0
6761
70,4
745.
0110
/11
2012
717
3311
5635
Myo
sin
,h
eavy
poly
pept
ide
2,sk
elet
alm
uscl
e,ad
ult
Myh
2Q
5SX
4121
9,73
75.
6332
1320
35
36M
yogl
obin
Mb
Q9Q
Z76
17,0
257.
9916
8384
437
l-L
acta
tede
hyd
roge
nas
eA
chai
nL
dha
P046
4236
,319
8.47
1135
579
38G
lyce
rald
ehyd
e-3-
phos
phat
ede
hyd
roge
nas
eG
apdh
P047
9735
,696
8.18
3467
1234
Spot
num
bers
corr
espo
nd
toFi
g.4A
,B
.
3321T2 PREVENTS MUSCLE FAT ACCUMULATION AND INSULIN RESISTANCE
ATP from ADP via the use of phosphocreatine andthus increased dependence of energy metabolism onthe creatine kinase shuttle in glycolytic muscle.
Such structural and biochemical shifts seem tomimic the reported ability of T3 to convert skeletalmuscle fiber type I to type II (45). Notably, however,the effects of T2, but not those of T3, are associatedwith a sparing of muscle mass. This finding indicatesthat T2 does not drive sarcopenia and argues stronglyin favor of the potential utilization of T2, rather thanT3, as a therapeutic option to counteract overweightand the associated metabolic derangements.
Another factor that appears to be affected by T2treatment is fiber type-specific IMCL deposition. Inparticular, the ability of T2 to prevent HFD-inducedlipid accumulation within glycolytic fibers, which hasbeen shown to be an important factor contributing toIR (14), together with its ability to induce a shifttoward a more glycolytic phenotype, strongly under-lines the positive metabolic effects of this iodothyro-nine. Taken together, these results lead to its abilityto limit or prevent the IR induced by HFD whilelowering the serum levels of lipids. Further studiesare needed to investigate whether chronic T2 treat-ment may affect insulin or glucagon secretion to fullyaddress the mechanism by which T2 interferes withglucose homeostasis.
Very recently, the localization and organization ofthe lipid droplets within the cell have emerged asimportant qualitative aspects of intramuscular TGstorage, together with the identity and properties ofthe associated proteins that can indeed account forthe fate of lipids. ADRP is the predominant lipiddroplet-associated protein in skeletal muscle, and apositive relationship between ADRP protein expres-sion and insulin sensitivity has been reported inhuman skeletal muscle (36). This has led to thehypothesis that up-regulation of ADRP may serve tosequester fatty acids (TGs) within discrete lipid drop-lets, thus protecting muscle from the detrimentaleffects of fatty acids on the action of insulin and onglucose tolerance. However, a recent study by Min-
naard et al. (37) reported a negative correlationbetween ADRP content and insulin-stimulated glu-cose uptake in gastrocnemius muscle from ZDF ratsas well as in muscle from type 2 diabetic patients.Interestingly, our data extended ADRP localizationto the fiber type, and indeed we demonstrated aspecific presence of ADRP within fast/glycolytic fi-bers in the gastrocnemius muscle of HFD rats butpredominantly within the slow/oxidative fibers inHFD-T2 rats. Because extrapolating from the rela-tionship between muscle fiber type and ADRP pro-tein expression in whole-muscle homogenates fromrats to the situation in humans is an indirect ap-proach, the discrepancies between the above-citedstudies may be more apparent than real. Indeed, ourresults may indicate that the correlation betweenADRP and insulin sensitivity relies on the fiber typelocalization of ADRP and at the same time on themuscle fiber type composition and enrichment. Be-cause extensive data on ADRP fiber type localizationand fiber type expression in all the conditions usedin the above-mentioned studies have not yet beenpublished (36, 37), the precise role played by ADRPin muscle lipid accumulation in situations of IRremains to be elucidated.
In summary, the work described here provides newinsights into the effects of T2 on skeletal musclemetabolism in a situation in which T2 preventssystemic fat accumulation and liver steatosis by stim-ulating hepatic fatty acid oxidation without harmfuleffects on either lean muscle or heart mass. In sodoing, the present study advances the case for apromotion of muscle glycolytic capacity having met-abolic benefits.
This work was partially supported by the following grants:Ministro dell’Istruzione, dell’Universita e della Ricerca (MIUR)Cofinanziamento (COFIN) 2008 Protocol 20089SRS2X, MIURFondo Investimento Ricerca di Base (FIRB) Medical Research inItaly (MERIT) RBNE08YFN3_003, Regione Campania 2008, andRegione Campania Rete di Spettrometria di Massa.
Figure 5. T2 exerts a fiber type-specific effect on the localization of ADRP protein. Double-staining for ADRP (dark gray) andMHC IIb (light gray). A) Very small, weakly ADRP-immunoreactive lipid droplets were observed within slow (s) and (rarely) insome fast (f) fibers in the N condition. B) In HFD rats, ADRP immunolabeling coated many large lipid droplets intensely(arrows) or weakly (arrowheads) in fast fibers, whereas slow fibers contained small, very weakly ADRP-stained lipid vacuoles. C)In HFD-T2 rats, both the number and the diameter of lipid droplets within fast fibers were reduced; some large lipid dropletswere also observed (red arrows). Scale bars � 12 �m.
3322 Vol. 25 October 2011 MORENO ET AL.The FASEB Journal � www.fasebj.org
REFERENCES
1. DeFronzo, R. A., and Tripathy, D. (2009) Skeletal muscle IRis the primary defect in type 2 diabetes. Diabetes Care 32,S157–S163
2. Kelley, D. E., Mokan, M., Simoneau, J. A., and Mandarino, L. S.(1993) Interaction between glucose and free fatty acid metabo-lism in human skeletal muscle. J. Clin. Invest. 92, 91–98
3. Itani, S. I., Ruderman, N. B., Schmieder, F., and Boden, G.(2002) Lipid-induced IR in human muscle is associated withchanges in diacylglycerol, protein kinase C and I�B-. Diabetes51, 2005–2011
4. Stump, C. S., Henriksen, E. J., Wei, Y., and Sowers, J. R. (2006)The metabolic syndrome: role of skeletal muscle metabolism.Ann. Med. 38, 389–402
5. Bonen, A., Parolin, M. L., Steinberg, G. R., Calles-Escandon, J.,Tandon, N. N., Glatz, J. F., Luiken, J. J., Heigenhauser, G. J., andDyck, D. J. (2004) Triacylglycerol accumulation in humanobesity and type 2 diabetes is associated with increased rates ofskeletal muscle fatty acid transport and increased sarcolemmalFAT/CD36. FASEB J. 18, 1144–1146
6. Chabowski, A., Chatham, J. C., Tandon, N. N., Calles-Escandon,J., Glatz, J. F., Luiken, J. J., and Bonen, A. (2006) Fatty acidtransport and FAT/CD36 are increased in red but not in whiteskeletal muscle of ZDF rats. Am. J. Physiol. Endocrinol. Metab. 291,E675–E682
7. Kelley, D. E., Goodpaster, B., Wing, R. R., and Simoneau, J. A.(1999) Skeletal muscle fatty acid metabolism in association withinsulin resistance, obesity, and weight loss. Am. J. Physiol. 277,E1130–E1141
8. Kim, J. Y., Hickner, R. C., Cortright, R. L., Dohm, G. L., andHoumard, J. A. (2000) Lipid oxidation is reduced in obesehuman skeletal muscle. Am. J. Physiol. Endocrinol. Metab. 279,E1039–E1044
9. McGarry, J. D. (2002) Banting lecture 2001: dysregulation offatty acid metabolism in the etiology of type 2 diabetes. Diabetes51, 7–18
10. Watt, M. J. (2009) Storing up trouble: does accumulation ofintramyocellular triglyceride protect skeletal muscle from insu-lin resistance? Clin. Exp. Pharmacol. Physiol. 36, 5–11
11. Son, N. H., Yu, S., Tuinei, J., Arai, K., Hamai, H., Homma, S.,Shulman, G. I., Abel, E. D., and Goldberg, I. J. (2010) PPAR�-induced cardiolipotoxicity in mice is ameliorated by PPARdeficiency despite increases in fatty acid oxidation. J. Clin. Invest.120, 3443–3454
12. Hajduch, E., Alessi, D. R., Hemmings, B. A., and Hundal, H. S.(1998) Constitutive activation of protein kinase B by mem-brane targeting promotes glucose and system A amino acidtransport, protein synthesis, and inactivation of glycogen syn-thase kinase 3 in L6 muscle cells. Diabetes 47, 1006–1013
13. Ueki, K., Yamamoto-Honda, R., Kaburagi, Y., Yamauchi, T.,Tobe, K., Burgering, B. M., Coffer, P. J., Komuro, I.,Akanuma. Y., Yazaki, Y., and Kadowaki, T. (1998) Potentialrole of protein kinase B in insulin-induced glucose transport,glycogen synthesis, and protein synthesis. J. Biol. Chem. 273,5315–5322
14. Bodine, S. C., Stitt, T. N., Gonzalez, M., Kline, W. O., Stover,G. L., Bauerlein, R., Zlotchenko, E., Scrimgeour, A., Lawrence,J. C., Glass, D. J., and Yancopoulos, G. D. (2001) Akt/mTORpathway is a crucial regulator of skeletal muscle hypertrophyand can prevent muscle atrophy in vivo. Nat. Cell Biol. 3,1014–1019
15. Tremblay, F., and Marette, A. (2001) Amino acid and insulinsignaling via the mTOR/p70 S6 kinase pathway. A negativefeedback mechanism leading to insulin resistance in skeletalmuscle cells. J. Biol. Chem. 276, 38052–38060
16. Belfort, R., Mandarino, L., Kashyap, S., Wirfel, K., Prati-panawatr, T., Berria, R., Defronzo, R. A., and Cusi, K. (2005)Dose-response effect of elevated plasma free fatty acid on insulinsignaling. Diabetes 54, 1640–1648
17. Van Loon, L. J., and Goodpaster, B. H. (2006) Increasedintramuscular lipid storage in the insulin-resistant and endur-ance-trained state. Pflugers Arch. 451, 606–616
18. Tanner, C. J., Barakat, H. A., Dohm, G. L., Pories, W. J.,MacDonald, K. G., Cunningham, P. R., Swanson, M. S., andHoumard, J. A. (2002) Muscle fiber type is associated with
obesity and weight loss. Am. J. Physiol. Endocrinol. Metab. 282,E1191–E1196
19. Levin, M. C., Monetti, M., Watt, M. J., Sajan, M. P., Stevens,R. D., Bain, J. R., Newgard, C. B., Farese, R. V., Sr., andFarese, R. V., Jr. (2007) Increased lipid accumulation andinsulin resistance in transgenic mice expressing DGAT2 inglycolytic (type II) muscle. Am. J. Physiol. Endocrinol. Metab.293, E1772–E1781
20. Izumiya, Y., Hopkins, T., Morris, C., Sato, K., Zeng, L., Viereck,J., Hamilton, J. A., Ouchi, N., LeBrasseur, N. K., and Walsh, K.(2008) Fast/glycolytic muscle fiber growth reduces fat mass andimproves metabolic parameters in obese mice. Cell Metab. 7,159–172
21. Oppenheimer, J. H., Schwartz, H. L., Lane, J. T., and Thomp-son, M. P. (1991) Functional relationship of thyroid hormone-induced lipogenesis, lipolysis, and thermogenesis in the rat.J. Clin. Invest. 87, 125–132
22. Weinstein, S. P., O’Boyle, E., and Haber, R. S. (1994) Thyroidhormone increases basal and insulin-stimulated glucose trans-port in skeletal muscle. The role of GLUT4 glucose transporterexpression. Diabetes 43, 1185–1189
23. Dimitriadis, G., Parry-Billings, M., Bevan, S., Leighton, B.,Krause, U., Piva, T., Tegos, K., Challiss, R. A., Wegener, G.,and Newsholme, E. A. (1997) The effects of insulin ontransport and metabolism of glucose in skeletal muscle fromhyperthyroid and hypothyroid rats. Eur. J. Clin. Invest. 27,475– 483
24. Weinstein, S. P., Watts, J., and Haber, R. S. (1991) Thyroidhormone increases muscle/fat glucose transporter gene ex-pression in rat skeletal muscle. Endocrinology 129, 455– 464
25. Dimitriadis, G. D., Leighton, B., Parry-Billings, M., West, D., andNewsholme, E. A. (1989) Effects of hypothyroidism on thesensitivity of glycolysis and glycogen synthesis to insulin in thesoleus muscle of the rat. Biochem. J. 257, 369–373
26. Lanni, A., Moreno, M., Lombardi, A., de Lange, P., Silvestri, E.,Ragni, M., Farina, P., Baccari, G. C., Fallahi, P., Antonelli, A.,and Goglia, F. (2005) 3,5-Diiodo-l-thyronine powerfully reducesadiposity in rats by increasing the burning of fats. FASEB J. 19,1552–1554
27. De Lange, P., Senese, R., Cioffi, F., Moreno, M., Lombardi,A., Silvestri, E., Goglia, F., and Lanni, A. (2008) Rapidactivation by 3,5,3�-l-triiodothyronine of adenosine 5�-mono-phosphate-activated protein kinase/acetyl-coenzyme a car-boxylase and akt/protein kinase B signaling pathways: rela-tion to changes in fuel metabolism and myosin heavy-chainprotein content in rat gastrocnemius muscle in vivo. Endocri-nology 149, 6462– 6470
28. Opie, L. H., and Newsholme, E. A. (1967) The activities offructose 1,6-diphosphatase, phosphofructokinase and phos-phoenolpyruvate carboxykinase in white muscle and red mus-cle. Biochem. J. 103, 391–399
29. Behan, W. M., Cossar, D. W., Madden, H. A., and McKay, I. C.(2002) Validation of a simple, rapid, and economical techniquefor distinguishing type 1 and 2 fibres in fixed and frozen skeletalmuscle. J. Clin. Pathol. 55, 375–380
30. Koopman, R., Schaart, G., and Hesselink, M. K. (2001) Optimi-sation of oil red O staining permits combination with immuno-fluorescence and automated quantification of lipids. Histochem.Cell Biol. 116, 63–68
31. Silvestri, E., Burrone, L., de Lange, P., Lombardi, A., Farina, P.,Chambery, A., Parente, A., Lanni, A., Goglia, F., and Moreno,M. (2007) Thyroid-state influence on protein-expression profileof rat skeletal muscle. J. Proteome Res. 6, 3187–3196
32. Talamo, F., D’Ambrosio, C., Arena, S., Del Vecchio, P., Ledda,L., and Zehender, G. (2003) Proteins from bovine tissues andbiological fluids: defining a reference electrophoresis map forliver, kidney, muscle, plasma and red blood cells. Proteomics 3,440–460
33. Scippa, G. S., Rocco, M., Ialicicco, M., Trupiano, D., Viscosi,V., Di Michele, M., Arena, S., Chiatante, D., and Scaloni, A.(2010) The proteome of lentil (Lens culinaris Medik.) seeds:discriminating between landraces. Electrophoresis 31, 497-506
34. Qian, W. J., Liu, T., Monroe, M. D. E., Strittmatter, E. F.,Jacobs, J. M., Kangas, L. J., Petritis, K., Camp, D. G. 2nd, andSmith, R. D. (2005) Probability-based evaluation of peptideand protein identification from tandem mass spectrometry
3323T2 PREVENTS MUSCLE FAT ACCUMULATION AND INSULIN RESISTANCE
and SEQUEST analysis: the human proteome. J. Proteome Res.4, 53– 62
35. Fluck, M., and Hoppeler, H. (2003) Molecular basis of skeletalmuscle plasticity—from gene to form and function. Rev. Physiol.Biochem. Pharmacol. 146, 159–216
36. Phillips, S. A., Choe, C. C., Ciaraldi, T. P., Greenberg, A. S.,Kong, A. P., Baxi, S. C., Christiansen, L., Mudaliar, S. R., andHenry, R. R. (2005) Adipocyte differentiation-related protein inhuman skeletal muscle: relationship to insulin sensitivity. Obes.Res. 13, 1321–1329
37. Minnaard, R., Schrauwen, P., Schaart, G., Jorgensen, J. A.,Lenaers, E., Mensink, M., and Hesselink, M. K. (2009)Adipocyte differentiation-related protein and OXPAT in ratand human skeletal muscle: involvement in lipid accumula-tion and type 2 diabetes mellitus. J. Clin. Endocrinol. Metab. 94,4077– 4085
38. Muoio, D. M., and Newgard, C. B. (2006) Obesity-relatedderangements in metabolic regulation. Annu. Rev. Biochem. 75,367–401
39. Pimenta, A. S., Gaidhu, M. P., Habib, S., So, M., Fediuc, S.,Mirpourian, M., Curi, R., and Ceddia, R. B. (2008) Prolongedexposure to palmitate impairs fatty acid oxidation despiteactivation of AMP-activated protein kinase in skeletal musclecells. J. Cell. Physiol. 217, 478–485
40. Randle, P. J., Garland, P. B., Hales, C. N., and Newsholme,E. A. (1963) The glucose fatty-acid cycle. Its role in insulin
sensitivity and the metabolic disturbances of diabetes melli-tus. Lancet 1, 785–789
41. Saltiel, A. R., and Kahn, C. R. (2001) Insulin signalling and theregulation of glucose and lipid metabolism. Nature 414, 799–806
42. Tremblay, F., Lavigne, C., Jacques, H., and Marette, A. (2001)Defective insulin-induced GLUT4 translocation in skeletal mus-cle of high fat-fed rats is associated with alterations in bothAkt/protein kinase B and atypical protein kinase C (�/�)activities. Diabetes 50, 1901–1910
43. Albright, A., Franz, M., Hornsby, G., Kriska, A., Marrero, D.,Ullrich, I., and Varity, L. S. (2000) American College of SportsMedicine position stand. Exercise and type 2 diabetes. Med. Sci.Sports Exerc. 32, 1345–1360
44. Schmitz, K. H., Hannan, P. J., Stovitz, S. D., Bryan, C. J., Warren,M., and Jensen, M. D. (2007) Strength training and adiposity inpremenopausal women: strong, healthy, and empowered study.Am. J. Clin. Nutr. 86, 566–572
45. Miyabara, E. H., Aoki, M. S., Soares, A. G., Saltao, R. M., Vilicev,C. M., Passarelli, M., Scanlan, T. S., Gouveia, C. H., andMoriscot, A. S. (2005) Thyroid hormone receptor-�-selectiveagonist GC-24 spares skeletal muscle type I to II fiber shift. CellTissue Res. 321, 233–241
Received for publication February 14, 2011.Accepted for publication June 2, 2011.
3324 Vol. 25 October 2011 MORENO ET AL.The FASEB Journal � www.fasebj.org