METABOLIC ADAPTATIONS OF LIVER MITOCHONDRIA DURING RESTRICTED FEEDING SCHEDULES
36
METABOLIC ADAPTATIONS OF LIVER MITOCHONDRIA DURING RESTRICTED FEEDING SCHEDULES Adrián Báez-Ruiz 1 , Carolina Escobar 2 , Raúl Aguilar-Roblero 3 , Olivia Vázquez- Martínez 1 and Mauricio Díaz-Muñoz 1* 1 Instituto de Neurobiología, Campus UNAM-Juriquilla, Apdo. postal 1-1141, Querétaro 76001. 2 Facultad de Medicina and 3 Instituto de Fisiología Celular, Universidad Nacional Autónoma de México. MÉXICO ADDRESS FOR CORRESPONDENCE: Mauricio Díaz Muñoz, Ph.D. Departamento de Neurobiología Celular y Molecular Instituto de Neurobiología, UNAM-Juriquilla Apartado Postal 1-1141 Querétaro, Qro. 76001 México E-mail: [email protected] Telephone and Fax: (5255) 5623-4035 Running Head: liver mitochondria and restricted feeding Keywords: Liver mitochondria, metabolism, restricted feeding, food entrainable oscillator, oxidation, swelling, , pH, μ. Number of figures:5 Number of tables:5 Articles in PresS. Am J Physiol Gastrointest Liver Physiol (June 23, 2005). doi:10.1152/ajpgi.00488.2004 Copyright © 2005 by the American Physiological Society.
-
Upload
independent -
Category
Documents
-
view
0 -
download
0
Transcript of METABOLIC ADAPTATIONS OF LIVER MITOCHONDRIA DURING RESTRICTED FEEDING SCHEDULES

METABOLIC ADAPTATIONS OF LIVER MITOCHONDRIA DURING
RESTRICTED FEEDING SCHEDULES
Adrián Báez-Ruiz1, Carolina Escobar2, Raúl Aguilar-Roblero3, Olivia Vázquez-Martínez1 and Mauricio Díaz-Muñoz1* 1Instituto de Neurobiología, Campus UNAM-Juriquilla, Apdo. postal 1-1141, Querétaro 76001. 2Facultad de Medicina and 3Instituto de Fisiología Celular, Universidad Nacional Autónoma de México. MÉXICO
ADDRESS FOR CORRESPONDENCE:
Mauricio Díaz Muñoz, Ph.D. Departamento de Neurobiología Celular y Molecular Instituto de Neurobiología, UNAM-Juriquilla Apartado Postal 1-1141 Querétaro, Qro. 76001 México E-mail: [email protected] Telephone and Fax: (5255) 5623-4035
Running Head: liver mitochondria and restricted feeding
Keywords: Liver mitochondria, metabolism, restricted feeding, food entrainable oscillator, oxidation, swelling, ∆Ψ, ∆pH, ∆µ.
Number of figures: 5 Number of tables: 5
Articles in PresS. Am J Physiol Gastrointest Liver Physiol (June 23, 2005). doi:10.1152/ajpgi.00488.2004
Copyright © 2005 by the American Physiological Society.

2
ABSTRACT
Food anticipatory activity (FAA) is an output of the food–entrained oscillator (FEO), a
conspicuous biological clock which expresses when experimental animals are under a restricted
food schedule (RFS). We have shown that the liver is entrained by RFS and exhibits anticipatory
response prior to meal time in its oxidative and energetic state. The present study was designed to
determine the mitochondrial oxidative and phosphorylating capacity in the liver of rats under
RFS, to further support the biochemical anticipatory role that this organ plays during the food
entrainment (Díaz-Muñoz et al. 2000). Metabolic and functional parameters of liver mitochondria
were characterized before (08:00 h), during (11:00 h) and after (14:00 h) FAA. The main results
were: A) An enhancement during the FAA (11:00 h) in: 1) oxidative capacity (Site I of the
electron transport chain), 2) phosphorylating ability (estimated by ATP synthesis), 3) activities of
NADH-shuttles; B) After feeding (14:00 h), the phosphorylating capacity remained high but it
was not the case for the respiratory control ratio for site I, and C) In the three experimental
conditions, before, during and after the FAA, an increment was detected in mitochondrial yield
and in the +H-electrochemical potential (∆µ), the latter due to an elevation in mitochondrial
membrane potential (∆Ψ). Most of the changes in mitochondrial properties related to RFS, were
also present when comparing to a 24 h fasting group. In conclusion, the results support the notion
that a distinctive rheostatic state is installed in the metabolic activity of the liver when the FEO is
being expressed.

3
INTRODUCTION
Biological rhythms are entrained by cyclic environmental external signals (zeitgebers).
The light-dark cycle is the most consistent environmental 24 h-synchronizer, and its information
is transmitted to the suprachiasmatic nuclei (SCN) of the hypothalamus. The SCN is considered
the master clock of the organism (Klein et al., 1991). Additionally, other recurring inputs, such as
the cyclic access to food, may also act as an entraining factor, by means of a different circadian
oscillator termed the food-entrained oscillator (FEO) (Stephan, 2002).
The FEO is expressed when animals are exposed to a food-restricted schedule (RFS) of 2
to 4 h of food access per day during 2 or 3 weeks. This condition increases locomotive activity
and arousal during the previous hours of mealtime (Mistlberger, 1994), generating a condition
known as food anticipatory activity (FAA). FAA is characterized by physiological and behavioral
changes in the organism such as: increment of wheel running activity, water drinking and body
temperature, as well as a peak of serum corticosterone (Mistlberger, 1994; Escobar et al., 1998
and Díaz-Muñoz et al., 2000).
The nature and location of the FEO are still unknown. The working hypothesis of our
group is that the FEO is a distributed system constituted by: 1) Central nervous structures such as
hypothalamic nuclei with the capacity to act in response of signals derived from the nutritional
state and energetic metabolism, and 2) Peripheral organs such as liver, pancreas or adipose tissue,
in which synthesis, oxidation and coordinated handling of energy metabolites such as
carbohydrates, lipids and amino acids take place. The time-keeping mechanism of the FEO would
emerge based in the feedback loops between these two systems by either neuronal and/or
humoral signals (Escobar et al., 1998; Ángeles-Catellanos et al., 2004). A crucial feature of this
model is the role played by the liver, since this organ is directly involved with food processing,

4
nutrients delivery and bioenergetic status of the organism (Langhans, 1996).
Liver is a peripheral oscillator (Yamazaki et al., 2000), and reports based in monitoring
rhythms of clock genes have indicated that plays a relevant role in the FEO’s physiology: 1) Per1
gene variations in the liver are entrained by feeding (Stokkan et al., 2001); 2) The rhythms of Per
1 and other clock genes in hepatic tissue are uncoupled from the SCN by restricted feeding
schedules (Damiola et al., 2000). However, some reports dispute the participation of the liver as a
direct or principal component of the FEO: 1) Peak of Per1 in liver and other digestive organs did
not remain in the phase promoted by restricted feeding, but shifted back to nocturnal phase
during subsequent periods of ad-libitum feeding and food deprivation (Davidson et al., 2003); 2)
Cirrhotic rats with hepatic malfunction by chronic CCl4 treatment still exhibit FAA to a restricted
feeding schedule (Escobar et al., 2002).
In food-restricted rats, we have reported correlation between metabolic parameters in the
liver concomitant with the expression of FAA (Díaz-Muñoz et al., 2000). The metabolic pattern
found in the food-restricted rats presented obvious differences from the patterns displayed by fed
ad-libitum rats and 24 h fasting control groups, suggesting that the hepatic physiology during the
expression of FEO adopts a novel regulatory status promoted by the RFS. We have found that
during FAA a significant reduction of glycogen levels (Escobar et al., 1998), the occurrence of an
oxidized cytoplasmic and mitochondrial redox state, an enhancement of ATP and ADP levels
(Díaz-Muñoz et al., 2000), a diminution in activity of the tri-iodothyronine-forming enzyme, 5’-
deiodinase, leading to an transient hypothyroidal state in the liver (Aceves et al., 2003). In
addition, at the onset of FAA the energetic status switched to a metabolic condition with an
enhanced lipid mobilization from adipose tissue, and an increase in fatty acids hepatic
metabolism (Martínez-Merlos et al., 2004 and Escobar et al., 1998). A striking finding involved
in this protocol, was the marked hyperphagia presented by the rats under the food restricted

5
schedule, since they had a ≈25 g meal during the 2 h of food accessibility (Martínez-Merlos, et
al., 2004). As a consequence, the full stomach gradually processed the food, becoming empty in a
time coincident with the FAA, the decrease in hepatic glycogen and the enhanced lipid
mobilization (Martínez-Merlos, et al., 2004).
With the purpose of gaining more understanding about the energy metabolic adaptations
in the liver during food-entrainment, the aim of the present study was to characterize in rats under
RFS the next mitochondrial properties: 1) levels of mitochondrial protein; 2) Oxidative capacity
for substrates to site 1 and 2 of the respiratory chain; 3) ATP-generating ability; 4) Activities of
aspartate-malate and α-glycerophosphate shuttles; 5) Components of mitochondrial membrane
potential and 6) Mitochondrial swelling. The results obtained reinforced the notion that the
hepatic energy metabolism adopts a new regulatory state when the FEO is being expressed.
MATERIALS AND METHODS
Animals and Housing
Adult male Wistar rats weighing 180 + 20 g at the beginning of the experiments were
maintained under constant conditions of 12:12-h light-dark cycle (LD, lights on 08:00 h) and
temperature (22 + 1°C). Rats were kept in groups of six in transparent acrylic cages (40 x 5 0 x
20 cm), with free access to Purina Chow and water except during food restriction or fasting
conditions. All experimental procedures were conducted in accordance with our Institutional
Guide for Care and Use of Animal Experimentation (Universidad Nacional Autónoma de
México).
Experimental Design
Rats were randomly assigned to one of three groups: 1) control rats fed ad libitum during
three weeks; 2) rats exposed to a daily restricted feeding schedule (RFS) with access to food from

6
12:00 to 14:00 h during three weeks, and 3) rats fasted for 24 h (sacrificed at 11:00 h). At the end
of the third week, rats from ad libitum and RFS groups were sacrificed following the protocol
reported by Davidson et al., 1999, at three different time points: 08:00 h (before FAA), 11:00 h
(during FAA) and 14:00 h (after feeding). The 24 h fasting group, was sacrificed at 11:00 h. Each
group contained 6 individuals per time point.
Hepatic Mitochondrial Fraction
Liver was removed (≈3 g) and immediately placed in an ice-cold isolation medium and
homogenized (1:10 w/v). The isolation medium contained: 250 mM sucrose, 2 mM HEPES, 10
mM Tris/HCl, 0.1% fatty acid-free bovine serum albumin (BSA) and 0.5 mM EGTA (pH 7.4).
Liver mitochondria fraction was obtained according to a modification of the method of Dumas, et
al (2004). Liver was homogenized with a teflon-on-glass homogenizer Potter-Elvehjem (40 RPM
for 10 s). The homogenized tissue was first centrifuged at 500 g x 10 min (in a Sorvall SS-34
centrifuge). The resulting supernatant was newly centrifuged at 8,500 g x 15 min. In this and next
steps, the foamy layer at the top of the supernatant was removed to prevent mitochondrial
uncoupling. The pellet was resuspended in the isolation medium but omitting EGTA (1:10 w/v)
with a fine camel-hair paint brush and finally centrifuged at 9,500 g x 15 min. This part was
repeated two times. The final pellet was resuspended in 0.5 ml of isolation medium (without
EGTA). Mitochondrial protein was measured by the Biuret method (Gornall, 1949).
Mitochondrial Marker Enzymes
Citrate synthase (EC 2.3.3.1) was assayed and quantified as described by Venditti, et al
(2004). Mitochondrial yield was calculated according to the method described by Idell-Wenger,
et al (1982).
Oximetry

7
Mitochondrial respiratory activity and oxidative phosphorylation were recorded
polarographically with a Clark-type oxygen electrode in 3 ml of respiratory medium as reported
by Hernández-Muñoz, et al (1992). The incubation medium contained 225 mM sucrose, 10 mM
KCl, 5 mM MgCl2, 10 mM KH2PO4, 10 mM Tris-HCl and BSA 0.1% (pH 7.4). For site I of the
electron transport respiratory chain, 10 mM Glutamate (Glu) and 1 mM Malate (Mal) were used
as substrates whereas 5 mM Succinate (Suc) was used for site II. The mitochondrial state 3 was
stimulated adding ADP (250 µM final concentration), whereas state 4 was evaluated when ADP
had been totally consumed. The highest velocity of the electron transport chain (uncoupled state)
was promoted by the addition of 2-4 dinitrophenol (DNP) 0.1 mM final concentration. State 3
(plus ADP), state 4 (without ADP) and uncoupled state (plus DNP) were determined as in
Hernández-Muñoz et al (1992). Respiratory control (RC) was calculated from the state 3/state 4
ratio. The phosphorylation capacity of the system was evaluated by the ADP/O ratio: 750 nmols
of ATP formed/total O2 consumed in state 3. ATP synthesis rates were calculated from the
product of state 3 respiration x ADP/O for site II substrates.
Mitochondrial shuttles
The “endogenous” and “reconstituted” activities of the malate-aspartate and α-
glycerophosphate shuttles were determined using the essay reported by Cederbaum et al (19731),
with the modifications used by Hernández-Muñoz et al (1987). Mitochondrial shuttle activities
were measured by the disappearance of NADH followed spectrophotometrically at 340 nm.
Mitochondria (5-10 mg) were incubated in 3 ml of final volume of respiratory medium (as
described above) in the presence of 5 mM NADH and 5 mM ADP final concentration. In these
conditions, the “endogenous” activity of the malate-aspartate and the α-glycerophsphate shuttles
(with the addition of 12 µM rotenone final concentration) were monitored. In the “reconstituted”
experiments cytosolic components of each shuttle were added to reach maximum activities. The

8
malate-aspartate shuttle was reconstituted with 2 mM aspartate, 5 mM glutamate, 1 mM malate,
25 units of malate dehydrogenase and 2 units of glutamic-oxalacetic transaminase; whereas the α-
glycerophosphate shuttle was reconstituted with 10 mM α-glycerophsphate, 1 mM ATP and 3
units of α-glycerophosphate dehydrogenase. All mixtures were incubated for 20 min at 37 °C and
the reactions were stopped with the addition of 3 M of perchloric acid solution (0.2 ml for every
1 ml of mitochondrial suspension) and cooled with ice. The samples were prepared and the
shuttles activities determined according to Klingenberg (1965) by quantifying the amount of
NAD+ formed by the alcohol dehydrogenase reaction.
Mitochondrial ∆Ψ
The mitochondrial membrane potential (∆Ψ) was measured by monitoring the movements
of [14C]tetraphenylphosphonium (TPP2+) across the mitochondrial membranes, in a medium (1.9
ml per sample) containing 40 mM sucrose, 40 mM KCl, 0.4 mM EDTA, 10 mM MgCl2, 50 mM
Tris-HCl, and 4.8 mM monobasic potassium phosphate (pH 7.4), 21 mm ADP, 100 mm succinate
and 30 µM radiolabeled TPP+2 (30 mCi/mmol specific activity) (Kamo et al, 1979, modified by
Hernández-Muñoz, et al, 1992). The essay started with the addition of 2 mg of mitochondrial
protein, and lasted 30 min keeping the temperature at 37 °C. After stopping the reaction by
placing the samples on ice, mitochondria were rapidly separated from the medium by
centrifugation at 13,000 rpm x 1 min (Eppendorf Centrifuge 5415 C), the supernatants were taken
and stored. The mitochondrial pellet was washed twice with the medium described above. The
radioactivity contained in the supernatant and the pellet was counted after adding 10 ml of
Tritosol. The ∆Ψ (distribution of TPP2+) was calculated according to the Nernst equation: ∆Ψ = -
RT/nF log (Ci/Ce) (Nicholls, 1982).
Mitochondrial ∆pH

9
The difference of pH across the inner mitochondrial membrane was determined by the
equilibrium distribution of radiolabeled [14C] sodium acetate (30 mci/mmol specific activity),
according to Valcarce, et al. (1988). The technique is similar to the one described for ∆Ψ
determination, with the exception that the respiratory medium (see description above) was used
during the essay. The ∆pH (distribution of [14C]acetate) was calculated also by the Nernst
equation, as described for ∆Ψ.
Mitochondrial ∆µH+
The value for the proton-motive electrochemical force (∆µH+) was derived from the
following equation: ∆µH+ = ∆Ψ + 2.303RT ∆pH /F, where RT means room temperature and F is
the Faradays constant (Nicholls, 1982).
Mitochondrial Swelling
Mitochondrial swelling was determined according to the method of Packer (1967), and
following the modifications reported by Hernández-Muñoz, et al. (1992). Changes of
mitochondrial volume induced for osmotic modifications with succinate were monitored at 546
nm. Mitochondria (1 mg/ml) were suspended in 10 mM Tris buffer, containing 50 mM sucrose, 5
mM MgCl2, 10 mM KCl and 250 µM ADP (pH 7.5). The reaction was started with the addition
of succinate (5 mM final concentration). Difference between initial and final readings at 546 nm
after 5 min of recording was representative of swelling activity.
Calculations and Statistics
The results are expressed as mean + SEM of at least six individual experimental
observations. The statistical significance among RFS and ad lib groups was assessed with a two-
way ANOVA (feeding condition X time), followed by a Tukey multiple-comparisons post-hoc
test with α set at 0.05. The differences among RFS at 11:00 h, ad- lib at 11:00 h and fasted

10
groups were assessed with a one-way ANOVA (feeding condition), followed by a Tukey
multiple-comparisons post-hoc test with α set at 0.05.
RESULTS
A scheme of the main mitochondrial metabolic activities is presented in Figure 1.
Mitochondria are a key factor in the bioenergetic balance of the cell since most of ATP synthesis
occurs in this organelle. Oxidative phosphorylation takes place on its inner membrane whereas
the major catabolic pathways for acetyl coenzyme A (acetyl CoA) production such as pyruvate
degradation and the β-oxidation of fatty acids occur in the mitochondrial matrix. Acetyl CoA
feeds the Krebs cycle to produce reducing equivalents (NADH and FADH2) to activate the
electron transport chain (ETC). The flow of electrons from the reducing equivalents through the
ETC towards O2 promotes the extrusion of H+ from the matrix to the intermembranal space
creating a membrane potential (∆µ). The ∆µ, that includes electrical (∆ψ) and chemical (∆pH)
components, is used by the ATP synthetase to form ATP. NADH produced in the cytosol has
access to the mitochondrial matrix by means of the malate-aspartate and the α-glycerophosphate
shuttles. In addition to oxidative phosphorylation, mitochondria are involved in thermogenesis,
cell death, radical production and modulation of calcium homeostasis (Scheffler 2001).
Mitochondrial Fraction. The use of a marker enzyme of mitochondrial matrix (citrate
synthase activity) and the quantification of protein in homogenate and mitochondrial fraction,
were used to calculate the mitochondrial yield (expressed as mg of protein per liver gram) and the
recovery of this fraction (calculating the recover percentage from the total mitochondrial content
for liver gram) The percentage of mitochondrial protein purified in our experiments ranged from
18%-19% in all the experimental conditions. No significant differences were found in FRS and
control groups (fed ad-libitum and 24 h fasting) in the total mitochondrial content (ratio between

11
enzyme activity from homogenate and mitochondrial sample) (Table 1). However, a strong
tendency to present more protein in both, homogenates and mitochondrial fractions of the three
RFS groups, was consistently observed. As a consequence, a significant increase of
mitochondrial yield was observed in the RFS groups in all the three time points studied (average
14% augmentation, Table 1). The higher yield of the mitochondrial fraction in the FRS
presenting FAA (11:00 h), was even more accentuated when it was comparing to the 24 h fasting
rats (24% augmentation). No significant change was observed in mitochondrial yield between ad
libitum fed and 24 h fasted rats (Table 1). These results are indicative that FRS induces in the
liver the presence of more cellular constituents, and hence promotes a higher mitochondrial yield
but without affecting the recovering of this fraction.
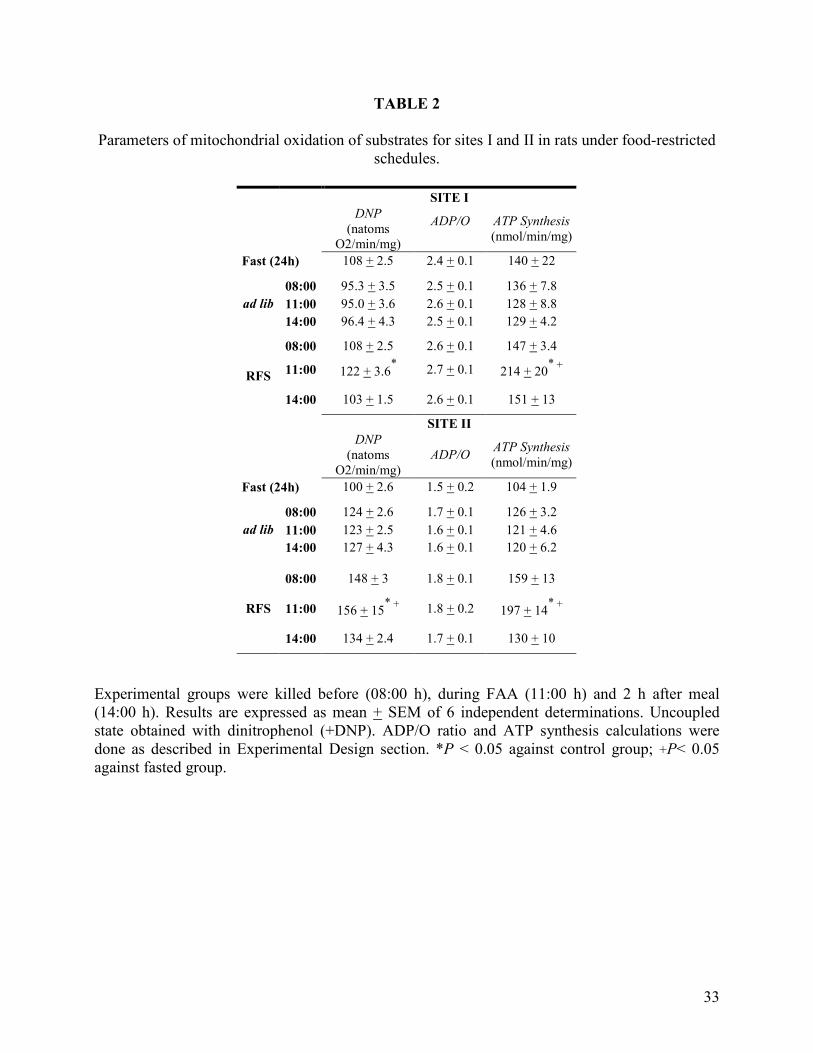
Mitochondrial Substrate Oxidation. No significant changes in any of the parameters
associated with the mitochondrial oxidation of glutamate-malate (Site I) and succinate (Site II)
were seen in the three time points in the control group fed ad libitum (Figure 2, Table II). No
changes were either detected when the 24 h fasting control group was compared with the rats fed
ad libitum. Substrates oxidation for Site II, did not present any changes in all experimental
conditions (Figure 2, panel B). In contrast, the RFS group exhibiting FAA (sacrificed at 11:00 h),
presented striking modifications. In comparison to the ad libitum control rats, the RFS group at
11:00 h showed a significant increase (27%) in the respiratory control with substrates of Site I
(Figure 2, Panel A), largely attributable to an elevation of oxygen consumption in the
phosphorylating condition of the state 3. In this group, the ATP synthesis and the maximal
velocity of oxidation promoted by DNP were also enhanced (Table II). The synthesis of ATP
increased 136% for Site I and 167% for Site II. Substrate oxidation in presence of DNP increased
22% for Site I and II among FRS-ad libitum groups at 11:00 h and 36% among FRS and fasted
24 h group. ADP/O values did not change in any experimental condition.

12
Taken together, these results indicate a higher oxidative capacity of the liver mitochondria
coincident with the FAA, and support the finding previously reported by our group of an
enhancement in hepatic ATP levels previous to food presentation in RFS (Díaz-Muñoz et al.,
2000).
Mitochondrial Shuttles Activity. The mitochondrial shuttles are a set of metabolic
reactions that allow the introduction of NADH molecules from the cytoplasm into the
mitochondria (Figure 1). Two shuttles are important to introduce NADH into the mitochondria:
one that handles malate and aspartate, and another that uses α-glycerophosphate. Each of them
can be studied with the studied in a basal or reconstituted state. Figure 4 depicts the modifications
in the activities of both mitochondrial shuttles associated to RFS. No differences were observed
in the group fed ad libitum in the basal and reconstituted malate-aspartate shuttle (Figure 3, Panel
A and B). Similarly, no changes in the malate-aspartate shuttle were observed between the 24 h
fasting group and the ad libitum group of rats at 11:00 h. In contrast, RFS group presented
significant enhancements in the basal and reconstituted activities of the malate-aspartate shuttle
(Panel A and B). At 08:00 h (before FAA), there was a significant augmentation (20%) in the
endogenous and reconstituted activities of both mitochondrial shuttles. Major changes were
observed again at 11:00 h (during the FAA) and 14:00 h (after feeding), with an increase in the
NADH oxidation of more than 300% (endogenous) and 200% (reconstituted), respectively.
The profile of activation in the endogenous and reconstituted malate-aspartate shuttle
induced by the RFS, was also observed in the α-glycerophosphate shuttle (Panel C and D).
These results further corroborate the enhanced oxidative capacity of the liver
mitochondria induced by the RFS, specially in the time when FAA is expressed, and after the
meal time.

13
Mitochondrial Membrane Potential. Transfer of reducing equivalents from NADH or
FADH2 to molecular oxygen is coupled to the pumping of protons across the inner mitochondrial
membrane. This transport of protons generates an electrochemical gradient (∆µ) that has two
components: 1) A pH gradient resulting in a pH difference (∆pH) across de inner membrane of
approximately 1.4, and 2) a membrane potential (∆Ψ), due to the charge separation, of about 175
mV (Heales et al., 2002). Figure 4 shows the modifications in hepatic mitochondrial ∆pH
promoted by RFS. In the group fed ad libitum ∆Ψ did not change in any of the three time points
tested (Table III). Fasting of 24 h did not produced modifications in ∆Ψ. In contrast, the RFS
group presented an increase of ≈40% in the three explored time points. In relation to the group
fed ad libitum, ∆pH presented the same pattern as ∆Ψ and the 24 h fasting group (Table III). In
the RFS group, ∆pH showed a significant increase (15%) at 11:00 h, coincident with the FAA.
Figure 4 shows that the pattern displayed by ∆µ is very similar to the one presented for ∆Ψ in all
the experimental groups tested (Table III). No significant changes are observed in the ad libitum
fed rats, and no effect of the 24 h fasting, but there was a ≈29% augmentation in the RFS groups
in the three times studied. The higher ∆µ observed in the RFS group did not correlate with the
fasting (08:00 and 11:00 h) or fed (14:00 h) conditions, and it seems to be a characteristic
associated with the RFS condition.
Taken together, the data are suggestive of significant modifications in the functioning of
the oxidative phosphorylation in the liver mitochondria of rats under RFS and expressing the
FEO.
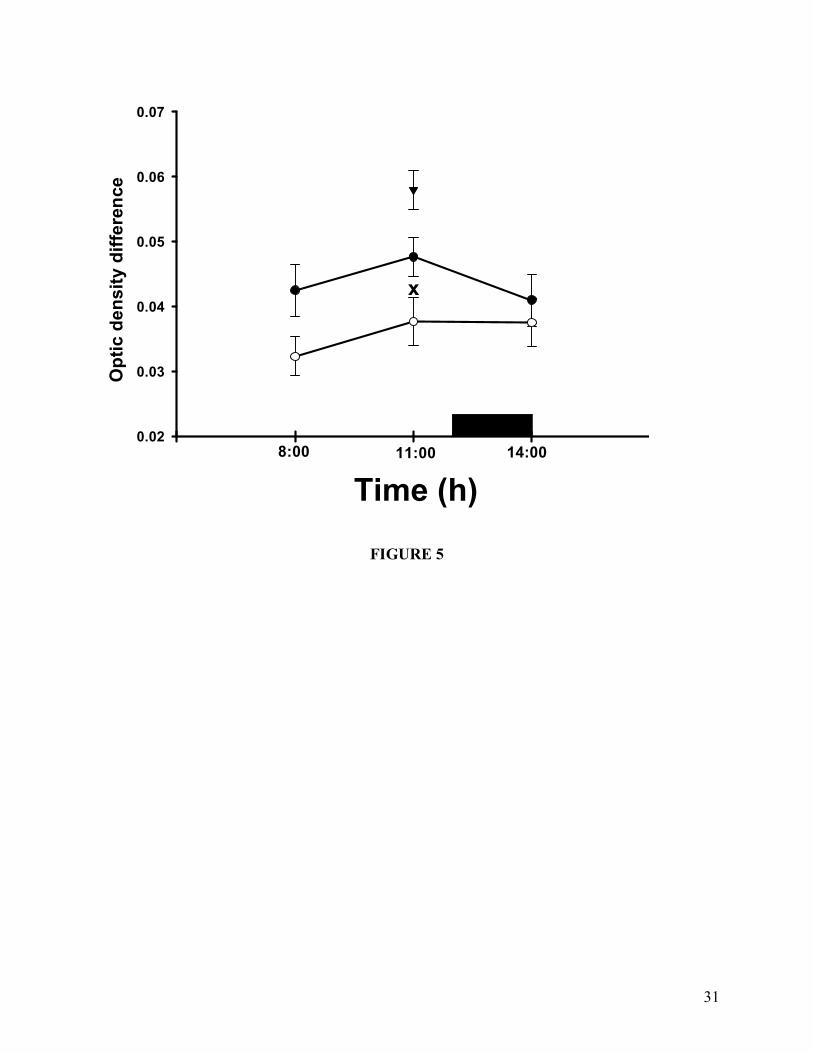
Mitochondrial Swelling. Mitochondria present osmotic responses associated with
physiological and pathological conditions (Zoratti and Szabo, 1995). The osmotic responses can
be energy-linked or energy-independent, and in some cases they can be considered as signs of

14
disturbances of the mitochondrial membrane (Hernández-Muñoz et al., 1992). Mitochondrial
swelling did not show any modification within the three experimental points in the group fed ad
libitum and in the RFS group. In the same token, no changes were detected in the comparison
within these experimental groups. The only significant difference observed in this set of data was
an increase in the rats with 24 h fasting of 40% and 15% in relation with the ad libitum and RFS
groups, respectively (Figure 5).
The two-way ANOVA analysis applied in the comparison of RFS and ad-libitum groups,
indicated significant effects of feeding conditions, time points, and their interaction for
mitochondrial yield, respiratory control for site I and II, reconstituted activity of malate-aspartate
and α-glycerophosphate shuttles and ∆µH+. For swelling, the significant effect was detected only
for time point (Table IV). The same results, with the exception of the effect in swelling, were
obtained with the one-way ANOVA analysis applied for the 24 h fasting group. In this case, the
significant changes were detected exclusively when the comparison was done between the 24 h
fasting and the RFS (at 11:00 h) groups (Table IV).
DISCUSSION
In this study, we examined the effect of food restriction and a 24 h fast on the biochemical
properties of liver mitochondria, one of the most influential parameters in the bioenergetic status
of the cell (Heales et al., 2002). Our results indicate that the mitochondrial yield, calculated per
gram of liver, was consistently higher when the experimental animals were under restricted
feeding schedules (Table I). The higher mitochondrial yields were associated with a tendency to
present elevated protein content in liver homogenates in all the three temporal points in which the
food-restricted rats were studied. An interpretation of these results should consider if the water

15
content of the liver could decrease during the feeding restricted schedules. Indeed, we have seen
that rats entrained by feeding present a lower water content in the liver during the FAA (data not
shown, manuscript in preparation). Cellular fractionation to obtain a mitochondrial-enriched
fraction usually involve a recovery of ≈20% (Hernández-Muñoz et al., 1992; Lanni et al., 1996).
Prudence should be taken into account since mitochondrial compartment is highly dynamic and
heterogeneous, i.e., several sub-population of liver mitochondria showing different respiratory,
enzymatic and swelling properties have been reported by Lanni et al., 1996). In the present
experiments, we can not rule out the possibility that food restricted schedules could influence the
kind of mitochondrial sub-population obtained after liver fractionation. The exploration of this
interesting possibility is beyond the aim of this manuscript.
Strengthening the notion of biochemical adaptations of liver mitochondria during the
expression of the OSA, several genes related with mitochondrial physiology were detected to be
up-regulated by DNA microarrays experiments in the livers of rats presenting FAA: the subunits
I, II, III and IV of the cytochrome oxidase complex (COX), diverse subunits of the F0/F1 proton
ATPase and the surfeit locus protein 1 that is localized in mitochondrial inner membrane and is
involved in the cytochrome oxidase complex assemblage (Báez-Ruiz et al., 2005).
Liver Mitochondria Activity in Food-Restricted Rats. Data obtained in this study support
a direct role of hepatic mitochondria in the augmentation of ATP levels, previously measured by
HPLC, and coincident with the FAA (Díaz-Muñoz et al., 2000). At this time (11:00 h), hepatic
mitochondria from RFS group presented a significant increment in the response to ADP (State 3,
Site I), corroborating by polarographically oxymetry, an enhanced mitochondrial capacity of
phosphorylation (Figure 2, Table II). This higher capacity for ATP synthesis was accompanied
by a more effective respiratory control with oxidation of substrates for site I, of the ETC (Figure

16
2). In addition of the enhanced substrate utilization, liver mitochondria during FAA present an
elevated oxidative power for reducing equivalents, as it is shown by the higher activity of
NADH-shuttle systems (Figure 3). Both endogenous and reconstituted shuttle systems presented
significant increased activity during the expression of the FEO. The latter is a direct measurement
of the optimal cytosolic NADH oxidative capacity by the liver mitochondria, whereas the
significance of the former must consider alternative routes to transport NADH into the
mitochondria, since hepatic mitochondria is not able to accomplish this process. A possibility in
our experimental protocol is the activation of the fatty acid shuttle, since the expression of the
OSA during the times tested promotes an intense fatty acids mobilization and high synthesis of
ketone bodies (Escobar et al., 1999). The fatty acid shuttle can function in absence of any
cytoplasmic component (Cederbaum et al, (19732).
Mitochondrial swelling is a parameter that depends on ion transport and on the flow of
energy from the ETC. Changes in this activity are suggestive of alterations in membrane
permeability and are predictive of structural modifications in mitochondrial membranes
(Hernández-Muñoz et al., 1992). As to mitochondrial swelling, the only alteration detected in our
experimental protocol was the augmentation in the group of 24 h fasted rats (Figure 5). The
modification involved a difference of 40% and 15% in relation to the ad-libitum and RFS gropus,
which are much lower that the change in mitochondrial swelling induced by chronic CCl4
administration (100%) (Hernández-Muñoz et al., 1992). We do not have an explanation regarding
the modification shown by the 24 h fasted rats. Both parameters, oxidative capacity and
phospholipid and acyl composition in liver mitochondria have been demonstrated to be altered in
fasting conditions (Vendemiale et al., 2001). However, it is interesting to consider that the
increase in mitochondrial swelling was not present in the rats with food restriction at 11:00 h, in

17
particular when this group has a 23 h fasting.
One evidence that RFS produced a new biochemical status in the liver mitochondria, was
the persistent increase in mitochondrial ∆ψ, and hence ∆µ, in the three experimental time points
considered in this study (Table III). Among the parameters that increase the mitochondrial ∆ψ
(Kadenbach, 2003), and compatible with the metabolic adaptations present in the liver during the
expression of the FEO, are: 1) High ATP/ADP ratio; 2) Dephosphorylation of cytochrome c
oxidase at subunit I; 3) presence of 3,5-diiodo-L-thyronine and 4) high levels of palmitate.
Hyperthyroidism induces an enhancement in the energetic status of the mitochondria by
incrementing the ADP/ATP and by stimulating lipid catabolism in the liver (Goglia et al, 1999).
More experiments are needed to define the exact mechanism responsible of the increase in the
liver mitochondrial ∆ψ in our experimental protocol. Taken together, these results are a sign of
an activation in the oxidative and phosphorylative activities of liver mitochondria in rats under
RFS. Remarkably, the activation of the mitochondrial metabolism takes place previous to meal
time, when the FAA is vigorous, and confirms the notion of “biochemical anticipation” of hepatic
physiology before feeding, consisting in a glucogen decrease and an enhancement of lipids
catabolism and mobilization as described by Díaz-Muñoz et al (2000).
Food-entrainment Promotes Rheostatic Adaptation in the Liver. The whole set of
physiological, endocrine, and biochemical changes that have been reported in a variety of tissues
in organisms under food-entrainment (Stephan 2002), are highly suggestive of rheostatic
adaptation. Rheostasis, formally homeorhesis, was originally defined as the orchestrated changes
for priorities of a physiological state (Bauman and Currie, 1980). Rheostatic control involves the
coordination of metabolism resulting in the direct portioning of nutrient utilization for
physiological processes such as lactation, pregnancy and growth (Bauman and Currie, 1980).

18
Thus, rheostatic mechanisms provide regulation during changes of state, while homeostatic
control operates on an acute minute-by-minute basis to maintain steadiness of the steady state.
RFS forced experimental animals to ingest in a small interval of two hours, the food that
they usually eat in longer periods,. This situation requires behavioral, physiological, and
metabolic adjustments to permit the organisms to succeed. For this reason, and with a rheostatic
perspective, it could be postulated that during food-entrainment there is a shift in the use of
nutrients in support of a new physiological state, and the implementation of mechanisms by
which nutrient handling and partitioning are modified with the ultimate aim to reach a new
energetic steady state.
It was pertinent in our experimental protocol to include a 24 h fasting control, since the
RFS rats spend 22 h without food. Therefore, RFS rats alternate between a brief state of very
intense food ingestion, and a larger state of total food deprivation. As a matter of fact, rats under
RFS show a metabolic and physiological pattern that is very different from those present in the
ad libitum fed and 24 h fasting groups (Díaz-Muñoz et al., 2000, Aceves et al., 2003, and
Martínez-Merlos et al., 2004). One of the key points to explain these dissimilarities is the extreme
hyperphagia developed in the 2 h interval in which the RFS rats consume food.
The great hyperphagia measured in rats under RFS, represents an adaptative process of
the stomach that makes it possible to store large quantities of food and provide uninterrupted
nutrient supply to the organism in spite of the 22 h fasting interval (Martínez-Merlos et al., 2004).
The emptying of the stomach approximately 3 h prior to the food access (in our experimental
protocol between 09:00 and 10:00 h), is coincident with a modification in the bioenergetics of the
liver, since it is a change from handling of sugars to lipids as hepatic metabolic fuels (Escobar et
al., 1998). The decrease in liver glycogen and the increase of circulating free fatty acids and
ketone bodies, are concurrent with an augmentation of peroxisomal and mitochondrial catabolic
19
activities for lipids (Báez-Ruiz et al., 2005). These physiological and metabolic adaptations
acting for days and weeks, could operate in conjunction to induce the new rheostatic handling of
nutrients by the liver.
It is widely accepted that behavioral, physiological and biochemical adaptations induced
by RFS reflect a food entrained oscillator (FEO), independent of the SCN. The anatomical
location of the FEO is still uncertain. So far, the more accepted hypothesis is the one that
postulates the FEO as an emerging system based in the metabolic and/or neural communication
between peripheral organs and selective brain areas (Stephan 2002).
Independently of the controversy about the precise relevance about the role that the liver
plays in the physiology of the FEO (Davidson et al., 2003, Escobar et al., 2002, Mistlberger
1994, Stephan 2002), it is out of question that food-entrainment depends on the availability of
energy metabolites and that food processing is largely influenced by the metabolic activity of the
liver. Some of the findings reported by our group regarding hepatic metabolic adaptations during
food-entrainment such as increment of ATP, enhancement of acetoacetate indicating an oxidized
redox state, and modulation in the hepatic thyroideal status, point to a direct role played by the
liver mitochondria in the liver physiology of food-restricted rats (Díaz-Muñoz et al., 2000, and
Aceves et al., 2003).
In conclusion, present results provide evidence that liver mitochondrial activity is
modulated by restricted feeding schedules, showing an enhanced oxidative and phosphorylative
capacity specially during the onset of food anticipatory activity. The data also straighten the
anticipatory role of liver as the principal organ in charge of the handling and distribution of
nutrients, in the 2 h interval of food availability. It remains to postulate a model in which all the
biochemical, physiological and endocrinological modifications accounted to RFS induces the
onset of FEO.

20
ACKNOWLEDGMENTS
Authors want to thank to Ms. Fátima Escalera, Maya Rocha and Sabina Wischin for help
and participation in some experiments and statistical analysis, and Dr. Rolando Hernández-
Muñoz (Instituto de Fisiología Celular, UNAM), for technical advice and provision of reactants.
Financial support was obtained from project IN 222102 from DGAPA, PAPIIT, UNAM.
REFERENCES
- Aceves C, Escobar C, Rojas-Huidobro R, Vázquez-Martínez O, Martínez-Merlos T,
Aguilar-Roblero R., Díaz-Muñoz, M. 2003. The liver 5´deiodinase activity is modified in
rats under restricted feeding schedules. Evidence for a traductional regulation. J
Endocrinol 179: 91-96.
- Ángeles-Castellanos M, Aguilar-Roblero R, Escobar C. 2004. c-Fos expression in
hypothalamic nuclei of food-entrained rats. Am J Physiol Regul Integr Comp Physiol
286: R158-R165.
- Báez-Ruiz A, Moreno-Luna D, Vázquez-Martínez O, Ramírez J, Díaz-Muñoz M. 2005.
The food entrainable oscillator studied by DNA microarrays: What is he liver doing
during the food anticipatory activity? Biol Rhythm Res 36(1-2): 83-97.
- Bauman DE, Currie WB. 1980. Partitioning of nutrients during pregnancy and lactation: a
review of mechanisms involving homeostasis and homeorhesis. J Dairy Sci 63: 1514-
1521.
- Cederbaum AI, Lieber CS, Rubin E. 1973. Effect of acetaldehyde on activity of shuttles
for the transport of reducing equivalents into the mitochondria. FEBS 37: 89-92.1

21
- Cederbaum AI, Lieber CS, Beattie D, and Rubin E. 1973. Effect of ethanol and fat on the
transport of reducing equivalents into rat liver mitochondria. J Biol Chem 248: 4977-
4986.2
- Damiola F, Le Minh N, Preitner N, Kornmann B, Fleury-Olela F, Schibler U. 2000.
Restricted feeding uncouples circadian oscillators in peripheral tissues from the central
pacemaker in the suprachiasmatic nucleus. Genes Dev 14: 2950-2961.
- Davidson AJ, Stephan FK. 1999. Plasma glucagons, glucose, insulin and motilin in rats
anticipating daily meals. Physiol Behav 66: 309-315.
- Davidson AJ, Poole AS, Yamazaki S, Menaker M. 2003. Is the food-entrainable oscillator
in the digestive system? Genes Brain Behav 2: 32-39.
- Díaz-Muñoz M, Vázquez-Martínez O, Aguilar-Aguilar R, Escobar, C. 2000. Anticipatory
changes of liver metabolism and entrainment of insulin, glucagon and corticosterone in
food-restricted rats. Am J Physiol Regul Integr Comp Physiol 279: R48-R56.
- Dumas JF, Roussel D, Simard G, Douay O, Foussard F, Malthiery Y and Ritz P. 2004.
Food restriction affects energy metabolism in rat liver mitochondria. Biochem Biophys
Acta 1670: 126-131.
- Escobar C, Díaz-Muñoz M, Encinas F, Aguilar-Roblero R. 1998. Persistence of metabolic
rhythmicity during fasting and its entrainment by restricted feeding schedules in rats. Am
J Physiol Regul Integr Comp Physiol 274: R1309-R1316.
- Escobar C, Mendoza J, Salazar-Juárez A, Ávila J, Hernández-Muñoz R, Díaz-Muñoz M,
Aguilar-Roblero R. 2002. Rats made cirrhotic by chronic CCl4 treatment still exhibit
anticipatory activity to a restricted feeding schedule. Chronobiol Int 19: 1073-1086.
- Goglia F, Moreno M and Lanni A. 1999. Action of thyroid hormones ate the cellular
levels: the mitochondrial target. FEBS Lett 452: 115-120.

22
- Gornall AG, Bradwill CJ, David MM. 1949. Determination of serum proteins by means
of the Biuret reaction. J Biol Chem 177, 751-766.
- Heales SJR, Gegg ME, Clark JB. 2002. Oxidative phosphorylation: Structure, function,
and intermediary metabolism. Int Rev Neurobiol 53: 25-56.
- Hernández-Muñoz R, Díaz-Muñoz M, Chagoya de Sánchez V. 1987. In vivo and in vitro
adenosine stimulation of ethanol oxidation by hepatocytes, and the role of the malate-
aspartate shuttle. Biochem Biophys Acta 930: 254-263.
- Hernández-Muñoz R, Díaz-Muñoz M, Chagoya de Sánchez V. 1992. Effects of adenosine
administration on the function and membrane composition of liver mitochondria in
carbon tetrachloride-induced cirrhosis. Arch Biochem Biophys 294: 160-167.
- Idell-Wenger JA, Grotyohann LW and Neely JR. 1982. An improved method for isolation
of mitochondria in high yields from normal, ischemic, and autolysed rat hearts. Ann
Biochem 125: 269-276.
- Kadenbach, B. 2003. Intrinsic and extrinsic uncoupling of oxidative phosphorylation.
Biochim Biophys Acta 604:77-94.
- Kamo N, Muratsugu M, Hongoh R, Kobatake, Y. 1979. Membrane potential of
mitochondrial measured with an electrode sensitive to tetraphenylphosphonium and
relationship between proton electrochemical potential and phosphorylation potential in
steady state. J Membr Biol 49; 105-121.
- Klein DC, Moore RY, Reppert SM. 1991. Suprachiasmatic Nucleus: The Mind’s Clock.
In: Kossar HT, editor. Chronobiology in Medicine. Oxford Univ. Press, New York. p
176-188.
- Klingenberg M. 1965. Diphosphopyridine Nucleotide (DPN). In: Bergmeyer HU, editor.
Methods of Ezymatic Analysis. Academic Press, New York. p 528-530.

23
- Langhans W. 1996. Role of the liver in the metabolic control of eating: What we know –
and what we do not know. Neurosci Biobehav Rev 29: 145-153.
- Lanni A, Moreno M, Lombardi A and Goglia F. 1996. Biochemical and functional
differences in rat liver mitochondrial subpopulations obtained at different gravitational
forces. Int J Biochem Cell Biol 28(3): 337-343.
- Martínez-Merlos MT, Ángeles-Castellanos M, Díaz-Muñoz M, Aguilar-Roblero R,
Mendoza J, Escobar C. 2004. Dissociation between adipose tissue signals, behavior and
the food-entrained oscillator. J Endocrinol 181: 53-63.
- Mistlberger RE. 1994. Circadian food anticipatory activity: formal models and
physiological mechanisms. Neurosci Biobehav Rev 18: 171-195.
- Nicholls DG. 1982. Redox. In Nicholls DG. Editor. Bioenergetics. Academic Press,
London. p 41-63.
- Packer L. 1967. Energy linked low amplitude mitochondrial swelling. In Estabrook RW,
Pullman ME. editors Methods in Enzymology. Vol. 10. Academic Press, New York. p
685-689.
- Scheffler IE. 2001. A century of mitochondrial research: achievements and perspectives.
Mitochondrion 1, 3-31.
- Schneider WC, Hogeboon GG. 1950. Intracellular distribution of marker enzymatic
activities. J Biol Chem 183, 123-128
- Stephan FK. 2002. The “other” circadian system: food as a zeitgeber. J Biol Rhythms 17:
284-292.
- Stokkan KA, Yamazaki S, Tei H, Sakaki Y, Menaker M. 2001. Entrainment of the
circadian clock in the liver by feeding. Science 291: 490-493

24
- Valcarce C, Navarrete RM, Encabo P, Loeches E, Satrústegui, J, Cuezva, JM. 1988.
Postnatal development of rat liver mitochondrial functions. J Biol Chem 263: 7767-7775.
- Vandemiale G, Grattagliano I, Caraceri P, Caraccio G, Dominicali M, Dall′Agata M,
Trevisani F, Guerrieri F, Bernardi M, Altomare E. 2001. Mitochondrial oxidative injury
and energy metabolism alteration in fatty liver: Effect of the nutritional status.
Hepatology 33: 808-815.
- Yamazaki S, Numano R, Abe M, Hida A, Takahashi R, Ueda M, Block GD, Sakaki Y,
Menaker M, Tei H. 2000. Resetting central and peripheral circadian oscillators in
transgenic rats. Science 288: 682-685.
- Zoratti M, Szabó I. 1995. The mitocondrial permeability transition. Biochim Biophys
Acta 1241: 139-176.

25
FIGURE LEGENDS
Figure 1
Scheme with the principal mitochondrial metabolic pathways related to ATP synthesis.
See text for explanation.
Figure 2
Mitochondrial Respiratory Control
Mitochondrial respiratory control (state3 / state4) of rats under restricted feeding schedule. Panel
A, respiratory control obtained with glutamate-malate as substrate (10 and 1 mM, respectively)
for site I. Panel B, respiratory control obtained with succinate (5 mM) as substrate for site II. Rats
maintained under a restricted feeding schedule (�), ad-libitum controls (○), and 24 h fasting
(▼). Experimental groups were killed before (08:00 h), during FAA (11:00 h) and 2 h after meal
time (14:00 h). The control group with a 24 h fast was killed at 11:00 h. Results are expressed as
mean + SEM of 6 independent determinations. Significant difference between RFS and ad-
libitum groups (*) and different from 24 h fasting group (x). Tukey´s post hoc test, α = 0.05.
Figure 3
Mitochondrial Shuttles Activities
Mitochondrial NADH-shuttle activities of rats under restricted feeding schedule. Panel A and B,
endogenous and reconstituted aspartate-malate shuttle activity. Panel C and D, endogenous and
reconstituted α-glyserophosphate shuttle activity. White bar, ad-libitum group, black bar, RFS
group, and gray bar 24 h fasting group. Experimental groups were killed before (08:00 h), during
FAA (11:00 h) and 2 h after meal time (14:00 h). Results are expressed as mean + SEM of 6
independent determinations. Significant difference between RFS and ad-libitum groups (*),

26
within the same experimental group (+), and different from 24 h fasting group (x). Tukey´s post
hoc test, α = 0.05.
Figure 4
Mitochondrial Membrane Potential
Mitochondrial ∆µ of rats under restricted feeding schedule. ∆µ was calculated according to ∆µH+
= ∆Ψ + 2.303RT ∆pH /F. Rats maintained under a restricted feeding schedule (�), ad-libitum
controls (○), and 24 h fasting (▼). Experimental groups were killed before (08:00 h), during
FAA (11:00 h) and 2 h after meal time (14:00 h). Results are expressed as mean + SEM of 6
independent determinations. Significant difference between RFS and ad-libitum groups (*) and
different from 24 h fasting group (x). Tukey´s post hoc test, α = 0.05.
Figure 5
Mitochondrial Swelling
Mitochondrial swelling of rats under restricted feeding schedule. Swelling was determined by the
difference between initial and final readings at 546 nm after 5 min of recording. Rats maintained
under a restricted feeding schedule (�), ad-libitum controls (○), and 24 h fasting (▼).
Experimental groups were killed before (08:00 h), during FAA (11:00 h) and 2 h after meal time
(14:00 h). Results are expressed as mean + SEM of 6 independent determinations. Significant
difference from 24 h fasting group (x). Tukey´s post hoc test, α = 0.05.

27
FIGURE 1

28
FIGURE 2 Time (h)
8:00 11:00 14:00
Res
pira
tory
Con
trol
Site
II(s
tate
3/s
tate
4)
3
4
5
6
B8:00 11:00 14:00
Res
pira
tory
Con
trol
Site
I(s
tate
3/s
tate
4)
3
4
5
6
x* A

29
Time (h)
FIGURE 3
0
5
10
15
20
25
30
08:00 11:00 14:00Fast
*+
+*
+
xA
0
30
60
90
120
150
180
08:00 11:00 14:00Fast
B x*+
*+
+
0
5
10
15
20
25
30
08:00 11:00 14:00Fast
*+
Cx*+
*x
0
30
60
90
120
150
180
08:00 11:00 14:00Fast
D
*
+
x*+
+
NA
DH
decr
ease
(nm
oles
/mg
prot
ein
/h)

30
Time (h)
FIGURE 4
Prot
on-m
otiv
efo
rce
(mV)
8:00 11:00 14:00180
200
220
240
260
280
300x** *
31
Time (h)
FIGURE 5
8:00 11:00 14:00
Opt
icde
nsity
diffe
renc
e
0.02
0.03
0.04
0.05
0.06
0.07
x

32
TABLE 1
Parameters of mitochondrial recovery from rat liver
CONDITION
PARAMETER TISSUE FRACTIONS ad lib 8:00
ad lib 11:00
ad lib 14:00
Fasting (24 h)
FRS 8:00
FRS 11:00
FRS 14:00
Homogenate U/mg/min 13 + 1.0 14 + 1.0 13 + 1.2 12 + 1.3 15 + 1.4 15 + 1.6 14 + 1.7
Citrate synthase activity Mitochondria
U/mg/min 71 + 10.4 72 + 2.9 70 + 8.5 75 + 2.0 76 + 3.7 78 + 3.8 77 + 1.9
Homogenate mg/g of wet tissue 206 + 11 205 + 21 200 + 21 210 + 20 221 + 18 238 + 25 236 + 26
Mitochondrial (yield) mg/g of wet tissue 6.8 + 0.4 7.6 + 0.5 6.9 + 0.1 7.0 + 0.5 7.8 + 0.4* 8.7 + 0.5* + 7.7 + 0.5*
Mitochondrial (calculated total)
mg/g of wet tissue 37.7 + 3.9 39.9 + 2.4 37.3 + 5.9 33.6 + 3.8 43.6 + 4.1 46 + 4.2 43 + 4.7
Protein content
Recovery (%) 18 + 1.7 19 + 1.3 18 + 2.8 18 + 1.9 18 + 2.0 19 + 2.2 18 + 2.1
Results are expressed as mean + SEM of 6 independent determinations. Enzyme activities were calculated as described in methodology. Total calculated mitochondrial protein and mitochondrial yield were calculated according to Idell-Wenger, et al (1982). *P< 0.05 versus ad lib controls; +P< 0.05 against fasted group.
33
TABLE 2
Parameters of mitochondrial oxidation of substrates for sites I and II in rats under food-restricted schedules.
SITE I
DNP (natoms
O2/min/mg)
ADP/O
ATP Synthesis(nmol/min/mg)
Fast (24h) 108 + 2.5 2.4 + 0.1 140 + 22
08:00 95.3 + 3.5 2.5 + 0.1 136 + 7.8 11:00 95.0 + 3.6 2.6 + 0.1 128 + 8.8 ad lib14:00 96.4 + 4.3 2.5 + 0.1 129 + 4.2
08:00 108 + 2.5 2.6 + 0.1 147 + 3.4
11:00 122 + 3.6* 2.7 + 0.1 214 + 20* +RFS
14:00 103 + 1.5 2.6 + 0.1 151 + 13
SITE II DNP
(natoms O2/min/mg)
ADP/O ATP Synthesis(nmol/min/mg)
Fast (24h) 100 + 2.6 1.5 + 0.2 104 + 1.9
08:00 124 + 2.6 1.7 + 0.1 126 + 3.2 11:00 123 + 2.5 1.6 + 0.1 121 + 4.6 ad lib14:00 127 + 4.3 1.6 + 0.1 120 + 6.2
08:00 148 + 3 1.8 + 0.1 159 + 13
11:00 156 + 15* + 1.8 + 0.2 197 + 14* +RFS
14:00 134 + 2.4 1.7 + 0.1 130 + 10
Experimental groups were killed before (08:00 h), during FAA (11:00 h) and 2 h after meal (14:00 h). Results are expressed as mean + SEM of 6 independent determinations. Uncoupled state obtained with dinitrophenol (+DNP). ADP/O ratio and ATP synthesis calculations were done as described in Experimental Design section. *P < 0.05 against control group; +P< 0.05 against fasted group.

34
TABLE 3
Modifications of the membrane electrical potential (∆Ψ) and ∆pH from liver mitochondria during FEO expression
∆Ψ ∆pH
Fasted 24 h 194.8 + 1.8 102 + 1.8
08:00 191.2 + 1.2 99 + 5.6
11:00 204.2 + 1.7 102 + 2.6 ad lib
14:00 205.8 + 1.5 105 + 3.2
08:00 281.2 + 3.0* 103 + 2.3
11:00 284 + 1.2* + 117 + 1.8* +RFS 14:00 278.2 + 1.3* 110 + 2.3
NOTE: ∆ψ and ∆pH were calculated by radiometric assays (See Experimental Design section). The ∆Ψ was calculated from the distribution of (TPP+2) as the ∆pH from [14C]acetate distribution, according to the Nernst equation (see Calculations and statistics). *P < 0.05 against control group; +P< 0.05 against fasted group.

35
TABLE 4
F values obtained with the two-way ANOVA for independent measures, for main metabolic parameters for RFS group and its ad libitum controls.
Feeding Condition Time Interaction
F(1,16) P F(3,16) P F(3,16) PMitochondrial protein 63.7 <0.001 4.1 NS 0.63 NS
R..C. Site I 20.3 <0.001 4 NS 6.2 NS
R C. Site II 33.5 <0.001 29.3 NS 14.2 <0.001 Swelling 8.1 NS 0.85 <0.05 0.43 NS
Mal-asp. Shuttle* 34.8 <0.001 9.4 <0.05 8.6 <0.05
α-gly. Shuttle* 233 <0.001 28 <0.001 18.8 <0.001
∆µH+ 10 <0.001 7.3 <0.001 9318 <0.001
R.C. = respiratory control; * = reconstituted activity, and NS = not significant

36
TABLE 5
F values obtained with the one-way ANOVA for comparison between the 24 h fasted and the RFS-11:00 h groups
F(2,15) P Mitochondrial protein 14.15 <0.05
R.. C. Site I 17.08 NS R.. C. Site II 40 <0.001
Swelling 6.2 NS
Mal-asp. shuttle* 15.5 <0.001
α-gly. shuttle* 62 <0.001
∆µH+ 941 <0.001
R.C. = respiratory control; * = reconstituted activity, and NS = not significant