
SEC UBP SRC Rule 68 Schedules ...
366
-
Upload
khangminh22 -
Category
Documents
-
view
3 -
download
0
Transcript of SEC UBP SRC Rule 68 Schedules ...


UnionBank Plaza, Meralco Avenue cor Onyx
& Sapphire Roads Ortigas Center Pasig City 1605
unionbankph.com
PROXY
KNOW ALL MEN BY THESE PRESENTS: That I, the undersigned, a shareholder of UNION BANK OF THE PHILIPPINES (“UnionBank”), do hereby nominate, constitute and appoint the Chairman of the meeting, with power of substitution, as my Attorney and Proxy to represent me and vote all shares registered in my name in the books of UnionBank or owned by me, at the Annual Meeting of Stockholders of UnionBank to be held on Friday, 22 April 2022 at 1:00 P.M. by remote communication via UnionBank’s secure Annual Stockholders’ Meeting Portal (“ASM Portal”) at https://asm.unionbankph.com, as fully to all intents and purposes as I might or could lawfully do if present and acting in person, and hereby ratifying and confirming any and all matters which may properly come before said meeting, or adjournment thereof. In case of the non-attendance of my Attorney and Proxy above-named at said meeting, I hereby authorize and empower the Corporate Secretary to fully exercise all rights as my Attorney or Proxy at said meeting. This Proxy authorizes my Attorney to act among other things on the following matters: (Please read the instruction below) INSTRUCTION: Mark the box under “Vote in Favor” to vote for any nominee. If the votes will be cumulated, write the number of votes desired to be given to a nominee beside its corresponding box. Mark the box under “Do not Vote” if the nominee will not be voted under this Proxy. 1. Election of Directors
Nominees: Vote in Favor Do Not Vote Number of Votes
Erramon I. Aboitiz □ □ ______________ Justo A. Ortiz □ □ ______________ Sabin M. Aboitiz □ □ ______________ Manuel R. Lozano □ □ ______________ Samel A. Aboitiz □ □ ______________ Ana Maria A. Delgado □ □ ______________ Nina D. Aguas □ □ ______________ Michael G. Regino □ □ ______________ Atty. Ricardo L. Moldez □ □ ______________ Edwin R. Bautista □ □ ______________
2. Election of Independent Directors
Nominees: Vote in Favor Do Not Vote Number of Votes
Roberto G. Manabat □ □ ______________ Ron Hose □ □ ______________ Manuel D. Escueta □ □ ______________ Josiah L. Go □ □ ______________ Atty. Francisco Ed. Lim □ □ ______________
3. Other Items
INSTRUCTION: Please check the appropriate column; otherwise, you shall be deemed to have conferred discretionary authority in favor of the Chairman of the meeting, or in his absence, the Corporate Secretary, to vote your shares in favor of the approval of the above matters.

UnionBank Plaza, Meralco Avenue cor Onyx
& Sapphire Roads Ortigas Center Pasig City 1605
unionbankph.com
Vote for Approval
Vote Against
Abstain
a. Approval of the Minutes of the Annual Stockholders’ Meeting held on April 23, 2021 and Special Stockholders’ Meeting held on August 11, 2021
b. Annual Report of Management on Operations for 2021 and approval of the Audited Financial Statements as of December 31, 2021
c. Ratification of Past Actions of the Board of Directors, Board Committees, and Management
d. Appointment of External Auditor for the year 2022 4. Revocability of Proxy
I have the right to revoke the proxy by participating in the meeting by remote communication and voting in absentia, or by execution of another proxy at a later date, subject to the pertinent requirements of law and SEC Circular No. 5, Series of 1996.
5. Persons Making the Solicitation
1. This solicitation is made solely by the registrant Bank. 2. There are no participants in the solicitation other than by the registrant Bank itself. 3. The solicitation is made through a courier service company, and by registered mail in cases of post office box
addresses. 4. The cost of solicitation will be borne by the registrant Bank.
6. Interest of Certain Persons in Matters to be Acted Upon
Other than the election of Directors and the Annual Report of Management on Operations for 2021, there are no substantial interests, by security holdings or otherwise, of UnionBank, any Director or Officer thereof, nominee for election as Director, participant in the solicitation, or associate of any of the foregoing persons, in any matter to be acted upon at the Annual Meeting.
The power and authority hereby granted shall remain valid and effective until such time that the same is withdrawn by me through notice in writing delivered to the Corporate Secretary before the date of any such meeting or adjournment(s) thereof. Likewise, the said authority is effective for subsequent annual meetings within a period of five (5) years from the date of this Proxy unless otherwise instructed, as follows:
[ ] THIS PROXY IS TO BE USED ONLY FOR THE 2022 ANNUAL STOCKHOLDERS’ MEETING OF UNIONBANK.
In case the security holder fails to indicate a vote on the matters in the Agenda by placing the corresponding marks on the columns provided therein, the same is considered a waiver of the security holder’s right to manifest his or her vote thereon and management can exercise its discretion in voting on such matters. Important: The Office of the Corporate Secretary must receive this Proxy not later than 12 April 2022. You may also send the scanned copy of this Proxy through e-mail at [email protected].
THIS PROXY IS BEING SOLICITED ON BEHALF OF MANAGEMENT
_______________________________ _____________________________ PRINTED NAME OF SHAREHOLDER SIGNATURE OF SHAREHOLDER
Dated this ______ day of ____, 2022 OR AUTHORIZED SIGNATORY


Annex "D"

Annex "D"


Annex "E"


*SGVFS162380*
C O V E R S H E E Tfor
AUDITED FINANCIAL STATEMENTS
SEC Registration Number
3 6 7 0 3
C O M P A N Y N A M E
U N I O N B A N K O F T H E P H I L I P P I N E S
PRINCIPAL OFFICE ( No. / Street / Barangay / City / Town / Province )
U N I O N B A N K P L A Z A M E R A L C O A V E N U E
C O R O N Y X A N D S A P P H I R E S T R E E T S
O R T I G A S C E N T E R , P A S I G C I T Y
Form Type Department requiring the report Secondary License Type, If Applicable
A A F S
C O M P A N Y I N F O R M A T I O N
Company’s Email Address Company’s Telephone Number Mobile Number
www.unionbankph.com 8667-6388
No. of Stockholders Annual Meeting (Month / Day) Fiscal Year (Month / Day)
4,949 April 23 December 31
CONTACT PERSON INFORMATION
The designated contact person MUST be an Officer of the Corporation
Name of Contact Person Email Address Telephone Number/s Mobile Number
FRANCIS B. ALBALATE [email protected] (632) 8667-6388
CONTACT PERSON’s ADDRESS
UnionBank Plaza Bldg, Meralco Ave. cor. Onyx and Sapphire Streets, Ortigas Center, Pasig City
NOTE 1 : In case of death, resignation or cessation of office of the officer designated as contact person, such incident shall be reported to the Commissionwithin thirty (30) calendar days from the occurrence thereof with information and complete contact details of the new contact person designated.
2 : All Boxes must be properly and completely filled-up. Failure to do so shall cause the delay in updating the corporation’s records with
the Commission and/or non-receipt of Notice of Deficiencies. Further, non-receipt of Notice of Deficiencies shall not excuse the corporation from liability for itsdeficiencies.

*SGVFS162380*
INDEPENDENT AUDITOR’S REPORT
The Board of Directors and StockholdersUnion Bank of the PhilippinesUnionBank PlazaMeralco Avenue corner Onyx street and Sapphire Road,Ortigas Center, Pasig City
Report on the Consolidated and Parent Bank Financial Statements
Opinion
We have audited the consolidated financial statements of Union Bank of the Philippines and itssubsidiaries (the Group) and the parent bank financial statements of Union Bank of the Philippines (theParent Bank), which comprise the consolidated and parent bank statements of financial position as atDecember 31, 2021 and 2020, and the consolidated and parent bank statements of income, consolidatedand parent bank statements of comprehensive income, consolidated and parent bank statements ofchanges in capital funds and consolidated and parent bank statements of cash flows for each of the threeyears in the period ended December 31, 2021, and notes to the consolidated and parent bank financialstatements, including a summary of significant accounting policies.
In our opinion, the accompanying consolidated and parent bank financial statements present fairly, in allmaterial respects, the financial position of the Group and the Parent Bank as at December 31, 2021 and2020, and their financial performance and their cash flows for each of the three years in the period endedDecember 31, 2021 in accordance with Philippine Financial Reporting Standards (PFRSs).
Basis for Opinion
We conducted our audits in accordance with Philippine Standards on Auditing (PSAs). Ourresponsibilities under those standards are further described in the Auditor’s Responsibilities for the Audit
of the Consolidated and Parent Bank Financial Statements section of our report. We are independent ofthe Group and the Parent Bank in accordance with the Code of Ethics for Professional Accountants in thePhilippines (Code of Ethics) together with the ethical requirements that are relevant to our audit of theconsolidated and parent bank financial statements in the Philippines, and we have fulfilled our otherethical responsibilities in accordance with these requirements and the Code of Ethics. We believe that theaudit evidence we have obtained is sufficient and appropriate to provide a basis for our opinion.
Key Audit Matters
Key audit matters are those matters that, in our professional judgment, were of most significance in ouraudit of the consolidated and parent bank financial statements of the current period. These matters wereaddressed in the context of our audit of the consolidated and parent bank financial statements as a whole,and in forming our opinion thereon, and we do not provide a separate opinion on these matters. For eachmatter below, our description of how our audit addressed the matter is provided in that context.
SyCip Gorres Velayo & Co.6760 Ayala Avenue1226 Makati CityPhilippines
Tel: (632) 8891 0307Fax: (632) 8819 0872ey.com/ph
A member firm of Ernst & Young Global Limited

*SGVFS162380*
- 2 -
We have fulfilled the responsibilities described in the Auditor’s Responsibilities for the Audit of the
Consolidated and Parent Bank Financial Statements section of our report, including in relation to thesematters. Accordingly, our audit included the performance of procedures designed to respond to ourassessment of the risks of material misstatement of the consolidated and parent bank financial statements.The results of our audit procedures, including the procedures performed to address the matters below,provide the basis for our audit opinion on the accompanying consolidated and parent bank financialstatements.
Applicable to the Audit of the Consolidated and Parent Bank Financial Statements
Allowance for expected credit loss (ECL)
The Group’s and the Parent Bank’s application of the expected credit loss (ECL) model in calculatingthe allowance for credit losses on loans and receivables is significant to our audit as it involves theexercise of significant management judgment. Key areas of judgment include: segmenting the Group’sand the Parent Bank’s credit risk exposures; determining the method to estimate ECL; definingdefault; identifying exposures with significant deterioration in credit quality, taking into accountextension of payment terms and payment holidays provided as a result of the coronavirus pandemic;determining assumptions used in the ECL model such as the counterparty credit risk rating, theexpected life of the financial asset, expected recoveries from defaulted accounts, and impact of creditenhancements extended by any party; and incorporating forward-looking information, including theimpact of the coronavirus pandemic, in calculating ECL.
Refer to Notes 4 and 20 of the consolidated and parent bank financial statements for the disclosures onthe details of the allowance for credit losses using the ECL model.
Audit Response
We obtained an understanding of the methodologies and models used for the Group’s and the ParentBank’s different credit exposures and assessed whether these considered the requirements of PFRS 9,Financial Instruments (PFRS 9), to reflect an unbiased and probability-weighted outcome, and toconsider time value of money and the best available forward-looking information. We also inspected andconsidered the results of the model validation on the risk rating performed by management’s specialist.
We (a) assessed the Group’s and the Parent Bank’s segmentation of its credit risk exposures based onhomogeneity of credit risk characteristics; (b) tested the definition of default and significant increase incredit risk criteria against historical analysis of accounts, credit risk management policies and practices inplace, and management’s assessment of the impact of the coronavirus pandemic on the counterparties;(c) tested the Group’s and the Parent Bank’s application of internal credit risk rating system, including theimpact of the coronavirus pandemic on the borrowers, by reviewing the ratings of sample creditexposures; (d) tested loss given default by inspecting historical recoveries and related costs, write-offsand collateral valuations, and the effects of credit enhancements provided by any party; (e) testedexposure at default considering outstanding commitments and repayment scheme; (f) checked theforward-looking information used for overlay through statistical test and corroboration using publiclyavailable information and our understanding of the Group’s and the Parent Bank’s lending portfolios andbroader industry knowledge, including the impact of the coronavirus pandemic; and (g) tested theeffective interest rate used in discounting the expected credit loss.

*SGVFS162380*
- 3 -
Further, we checked the data used in the ECL models by reconciling data from source system reports tothe data warehouse and from the data warehouse to the loss allowance models and financial reportingsystems. To the extent that the loss allowance analysis is based on credit exposures that have beendisaggregated into subsets of debt financial assets with similar risk characteristics, we traced or re-performed the disaggregation from source systems to the loss allowance analysis.
We recalculated impairment provisions on a sample basis. We reviewed the completeness of thedisclosures made in the consolidated and parent bank financial statements.
We involved our internal specialists in the performance of the above procedures.
Accounting for Disposals of Investment Securities held under the Hold-to-Collect (HTC) Business Model
In 2021, the Parent Bank disposed of investment securities managed under the hold-to-collect (HTC)business model. Investment securities held under a hold-to-collect business model, which are classifiedas ‘Investment securities at amortized cost’, are managed to realize cash flows by collecting contractualpayments over the life of the instrument.
The accounting for the disposals is significant to our audit because the amounts involved are material tothe consolidated and parent bank financial statements. Moreover, it involves the exercise of significantjudgment by management in assessing that the disposals are consistent with the HTC business model andthat it would not impact the measurement of the remaining securities in the affected portfolios.
The disclosures relating to the disposals from the HTC portfolio are included in Note 3 to theconsolidated and parent bank financial statements.
Audit Response
We obtained an understanding of the Parent Bank’s objectives for disposals of investment securities atamortized cost through inquiries with management and review of approved internal documentations,including governance over the disposals. We evaluated management’s assessment of the impact of thedisposals on the affected portfolios in reference to the Parent Bank’s business models and the provisionsof the relevant accounting standards and regulatory issuances. We also reviewed the calculation of thegains on the disposals and the measurement of the remaining securities in the affected portfolios.
We reviewed the disclosures related to the disposals based on the requirements of PFRS 7, Financial
Instruments: Disclosures, PFRS 9 and Philippine Accounting Standard 1, Presentation of Financial
Statements.
Applicable to the Audit of the Consolidated Financial Statements
Impairment testing of goodwill
Under PFRS, the Group and the Parent Bank perform testing of goodwill for impairment annually ormore frequently if events or changes in circumstances indicate that the carrying values may be impaired.The Group’s and the Parent Bank’s goodwill attributable to the various cash generating units (CGUs) isconsidered significant to the consolidated and parent bank financial statements. The Group’s and theParent Bank’s impairment assessment requires significant judgement and is based on assumptions whichare subject to higher level of estimation uncertainty due to the current economic conditions which havebeen impacted by the coronavirus pandemic, specifically on loan growth rate, deposit growth rate and
A member firm of Ernst & Young Global Limited

*SGVFS162380*
- 4 -
discount rate. The disclosures in relation to the CGUs to which the goodwill is allocated and the Group’sand the Parent Bank’s impairment assessment are included in Notes 3 and 18 to the consolidated andparent bank financial statements.
Audit Response
We involved our internal specialist in evaluating the methodologies and the assumptions used incalculating the value-in-use (VIU) of the CGUs. We compared the key assumptions used such as loangrowth rate and deposit growth rate against the historical financial performance and the specific plans forthe CGUs and other relevant external data, taking into consideration the impact associated withcoronavirus pandemic. We tested the parameters used in the determination of the discount rate againstmarket data. We also reviewed the Group’s and the Parent Bank’s disclosures about those assumptions towhich the outcome of the impairment test is most sensitive; specifically those that have the mostsignificant effect on the determination of the recoverable amount of goodwill.
Other Information
Management is responsible for the other information. The other information comprises the informationincluded in the SEC Form 20-IS (Definitive Information Statement), SEC Form 17-A and Annual Reportfor the year ended December 31, 2021, but does not include the consolidated and parent bank financialstatements and our auditor’s report thereon. The SEC Form 20-IS (Definitive Information Statement),SEC Form 17-A and Annual Report for the year ended December 31, 2021 are expected to be madeavailable to us after the date of this auditor’s report.
Our opinion on the consolidated and parent bank financial statements does not cover the otherinformation and we will not express any form of assurance conclusion thereon.
In connection with our audit of the consolidated and parent bank financial statements, our responsibility isto read the other information identified above when it becomes available and, in doing so, considerwhether the other information is materially inconsistent with the consolidated and parent bank financialstatements or our knowledge obtained in the audits, or otherwise appears to be materially misstated.
Responsibilities of Management and Those Charged with Governance for the Consolidated and
Parent Bank Financial Statements
Management is responsible for the preparation and fair presentation of the consolidated and parent bankfinancial statements in accordance with PFRSs, and for such internal control as management determinesis necessary to enable the preparation of consolidated and parent bank financial statements that are freefrom material misstatement, whether due to fraud or error.In preparing the consolidated and parent bankfinancial statements, management is responsible for assessing the Group’s and Parent Bank’s ability tocontinue as a going concern, disclosing, as applicable, matters related to going concern and using thegoing concern basis of accounting unless management either intends to liquidate the Group and the ParentBank or to cease operations, or has no realistic alternative but to do so.Those charged with governance areresponsible for overseeing the Group’s and Parent Bank’s financial reporting process.
A member firm of Ernst & Young Global LimitedA member firm of Ernst & Young Global Limited

*SGVFS162380*
- 5 -
Auditor’s Responsibilities for the Audit of the Consolidated and Parent Bank Financial Statements
Our objectives are to obtain reasonable assurance about whether the consolidated and parent bankfinancial statements as a whole are free from material misstatement, whether due to fraud or error, and toissue an auditor’s report that includes our opinion. Reasonable assurance is a high level of assurance, butis not a guarantee that an audit conducted in accordance with PSAs will always detect a materialmisstatement when it exists. Misstatements can arise from fraud or error and are considered material if,individually or in the aggregate, they could reasonably be expected to influence the economic decisions ofusers taken on the basis of these consolidated and parent bank financial statements.
As part of an audit in accordance with PSAs, we exercise professional judgment and maintainprofessional skepticism throughout the audit. We also:
Identify and assess the risks of material misstatement of the consolidated and parent bank financialstatements, whether due to fraud or error, design and perform audit procedures responsive to thoserisks, and obtain audit evidence that is sufficient and appropriate to provide a basis for our opinion.The risk of not detecting a material misstatement resulting from fraud is higher than for one resultingfrom error, as fraud may involve collusion, forgery, intentional omissions, misrepresentations, or theoverride of internal control.
Obtain an understanding of internal control relevant to the audit in order to design audit proceduresthat are appropriate in the circumstances, but not for the purpose of expressing an opinion on theeffectiveness of the Group’s and Parent Bank’s internal control.
Evaluate the appropriateness of accounting policies used and the reasonableness of accounting
estimates and related disclosures made by management.
Conclude on the appropriateness of management’s use of the going concern basis of accounting and,based on the audit evidence obtained, whether a material uncertainty exists related to events orconditions that may cast significant doubt on the Group’s and Parent Bank’s ability to continue as agoing concern. If we conclude that a material uncertainty exists, we are required to draw attention inour auditor’s report to the related disclosures in the consolidated and parent bank financial statementsor, if such disclosures are inadequate, to modify our opinion. Our conclusions are based on the auditevidence obtained up to the date of our auditor’s report. However, future events or conditions maycause the Group and the Parent Bank to cease to continue as a going concern.
Evaluate the overall presentation, structure and content of the consolidated and parent bank financialstatements, including the disclosures, and whether the consolidated and parent bank financialstatements represent the underlying transactions and events in a manner that achieves fairpresentation.
Obtain sufficient appropriate audit evidence regarding the financial information of the entities orbusiness activities within the Group to express an opinion on the consolidated financial statements.We are responsible for the direction, supervision and performance of the audit. We remain solelyresponsible for our audit opinion.
We communicate with those charged with governance regarding, among other matters, the planned scopeand timing of the audit and significant audit findings, including any significant deficiencies in internalcontrol that we identify during our audit.
A member firm of Ernst & Young Global Limited

*SGVFS162380*
- 6 -
We also provide those charged with governance with a statement that we have complied with relevantethical requirements regarding independence, and to communicate with them all relationships and othermatters that may reasonably be thought to bear on our independence, and where applicable, relatedsafeguards.
From the matters communicated with those charged with governance, we determine those matters thatwere of most significance in the audit of the consolidated and parent bank financial statements of thecurrent period and are therefore the key audit matters. We describe these matters in our auditor’s reportunless law or regulation precludes public disclosure about the matter or when, in extremely rarecircumstances, we determine that a matter should not be communicated in our report because the adverseconsequences of doing so would reasonably be expected to outweigh the public interest benefits of suchcommunication.
Report on the Supplementary Information Required Under Bangko Sentral ng Pilipinas (BSP)
Circular No. 1074 and Revenue Regulations 15-2010
Our audit was conducted for the purpose of forming an opinion on the basic financial statements taken asa whole. The supplementary information required under BSP Circular No. 1074 in Note 37 to thefinancial statements and Revenue Regulations 15-2010 in Note 38 to the financial statements is presentedfor purposes of filing with the BSP and the Bureau of Internal Revenue, respectively, and is not a requiredpart of the basic financial statements. Such information is the responsibility of the management of UnionBank of the Philippines. The information has been subjected to the auditing procedures applied in ouraudit of the basic financial statements. In our opinion, the information is fairly stated, in all materialrespects, in relation to the basic financial statements taken as a whole.
The engagement partner on the audit resulting in this independent auditor’s report is Janet A. Paraiso.
SYCIP GORRES VELAYO & CO.
Janet A. ParaisoPartnerCPA Certificate No. 92305Tax Identification No. 193-975-241BOA/PRC Reg. No. 0001, August 25, 2021, valid until April 15, 2024SEC Partner Accreditation No. 92305-SEC (Group A)
Valid to cover audit of 2021 to 2025 financial statements of SEC covered institutionsSEC Firm Accreditation No. 0001-SEC (Group A)
Valid to cover audit of 2021 to 2025 financial statements of SEC covered institutionsBIR Accreditation No. 08-001998-062-2020, December 3, 2020, valid until December 2, 2023PTR No. 8853462, January 3, 2022, Makati City
February 24, 2022
A member firm of Ernst & Young Global Limited

*SGVFS162380*
UNION BANK OF THE PHILIPPINES AND SUBSIDIARIES
STATEMENTS OF FINANCIAL POSITIONDecember 31, 2021 and 2020
(Amounts are presented in thousands of Philippine Pesos)
Group Parent Bank
December 31 December 31
2021 2020 2021 2020
RESOURCES
Cash and Other Cash Items (Note 8) P=8,904,903 P=8,958,042 P=7,988,517 P=7,814,917Due from Bangko Sentral ng Pilipinas (Note 8) 103,407,946 103,869,770 67,478,389 83,867,434
Due from Other Banks (Note 9) 54,258,465 68,532,218 51,308,983 64,763,768Interbank Loans Receivable (Note 10) 17,492,657 − 17,492,657 −Trading and Investment Securities
At fair value through profit or loss (Note 11) 5,640,005 18,448,649 5,571,270 18,411,304At amortized cost (Note 12) 166,362,179 155,810,967 162,139,448 153,171,111At fair value through other comprehensive income (Note 13) 65,672,610 31,190,259 65,370,691 31,009,041
Loans and Other Receivables - net (Note 14) 359,774,631 339,536,830 291,118,202 273,339,863Investment in Subsidiaries and Associates (Note 15) 142,355 255,342 23,082,955 21,867,987Bank Premises, Furniture, Fixtures and Equipment - net (Note 16) 6,765,771 6,894,768 5,336,326 5,525,366
Investment Properties (Note 17) 8,673,344 8,922,366 7,435,877 7,662,547Goodwill (Note 18) 14,818,932 15,348,531 7,886,898 7,886,898Other Resources - net (Note 19) 19,181,663 16,691,495 15,308,078 13,559,769
TOTAL RESOURCES P=831,095,461 P=774,459,237 P=727,518,291 P=688,880,005
LIABILITIES AND CAPITAL FUNDS
LIABILITIES
Deposit Liabilities (Note 21)Demand P=204,560,986 P=159,783,546 P=206,254,190 P=160,883,453Savings 136,430,021 98,957,845 132,074,831 93,564,392
Time 226,509,885 266,043,635 151,730,160 207,780,774Long-term negotiable certificate of deposits 3,000,000 3,000,000 3,000,000 3,000,000
570,500,892 527,785,026 493,059,181 465,228,619
Bills Payable (Note 22) 51,168,138 54,223,543 28,577,774 34,502,421Notes and Bonds Payable (Note 23) 69,853,986 59,853,656 69,789,836 59,746,857Other Liabilities (Note 24) 27,359,217 27,444,610 24,432,809 24,838,361
718,882,233 669,306,835 615,859,600 584,316,258
CAPITAL FUNDS
Capital funds attributable to the Parent Bank’s stockholders (Note 25)Common stock 12,193,628 12,184,715 12,193,628 12,184,715Additional paid-in capital 14,214,551 14,214,983 14,214,551 14,214,983
Stock dividend distributable 3,048,388 − 3,048,388 −Surplus free 82,122,752 77,096,218 82,754,489 77,697,363Surplus reserves 2,798,673 2,645,080 2,323,934 2,171,842
Net unrealized fair value gains (losses) on investmentsecurities at FVOCI (Note 13) (1,448,457) 55,384 (1,447,065) 46,845
Remeasurements of defined benefit plans (Note 29) (1,507,361) (1,815,784) (1,449,181) (1,741,389)
Other reserves 13,754 (18,886) 19,947 (10,612)
Total capital funds attributable to the Parent Bank’s stockholders 111,435,928 104,361,710 111,658,691 104,563,747Non-controlling interests 777,300 790,692 − −
112,213,228 105,152,402 111,658,691 104,563,747
TOTAL LIABILITIES AND CAPITAL FUNDS P=831,095,461 P=774,459,237 P=727,518,291 P=688,880,005
See accompanying Notes to Financial Statements.

*SGVFS162380*
UNION BANK OF THE PHILIPPINES AND SUBSIDIARIES
STATEMENTS OF INCOMEFor the Years Ended December 31, 2021, 2020 and 2019
(Amounts are presented in thousands of Philippine Pesos, Except Earnings per Share)
Group Parent Bank
Years Ended December 31 Years Ended December 31
2021 2020 2019 2021 2020 2019
INTEREST INCOME ON
Loans and other receivables (Note 14) P=27,673,213 P=28,850,939 P=28,004,013 P=17,701,642 P=20,076,020 P=19,237,123Investment securities at amortized cost
and FVOCI (Notes 12 and 13) 7,706,773 8,084,663 9,491,890 7,610,675 7,937,196 9,491,890Cash and cash equivalents (Notes 8 and 9) 679,740 1,021,974 188,086 332,870 756,035 127,654Trading securities at FVTPL (Note 11) 244,587 524,261 423,688 244,587 524,261 423,688
Interbank loans receivable (Note 10) 23,256 95,857 247,478 22,170 95,451 247,039
36,327,569 38,577,694 38,355,155 25,911,944 29,388,963 29,527,394
INTEREST EXPENSE ON
Deposit liabilities (Note 21) 2,967,692 5,616,821 10,160,322 1,805,424 4,256,480 8,069,749Bills payable and other liabilities
(Notes 22, 23, 24 and 29) 3,544,787 4,230,619 5,859,148 2,446,570 3,262,923 4,847,211
6,512,479 9,847,440 16,019,470 4,251,994 7,519,403 12,916,960
NET INTEREST INCOME 29,815,090 28,730,254 22,335,685 21,659,950 21,869,560 16,610,434
PROVISION FOR CREDIT
LOSSES (Note 20) 5,811,398 8,381,856 1,857,347 4,657,731 7,450,171 1,548,187
NET INTEREST INCOME AFTER
PROVISION FOR CREDIT
LOSSES 24,003,692 20,348,398 20,478,338 17,002,219 14,419,389 15,062,247
OTHER INCOME
Gains on sale of investment securities atamortized cost (Note 12) 8,447,595 5,111,793 7,074,044 8,447,595 5,111,793 7,074,044
Service charges, fees andcommissions (Note 27) 3,773,311 2,346,639 1,956,218 2,492,356 1,723,620 1,422,716
Gains on trading and investment
securities at FVTPL and FVOCI(Notes 11 and 13) 217,943 3,829,710 2,347,389 217,533 3,831,674 2,348,971
Miscellaneous (Note 28) 2,861,815 2,078,996 2,967,381 3,542,828 2,565,048 3,592,846
15,300,664 13,367,138 14,345,032 14,700,312 13,232,135 14,438,577
TOTAL OPERATING INCOME 39,304,356 33,715,536 34,823,370 31,702,531 27,651,524 29,500,824
OTHER EXPENSES
Salaries and employee benefits (Note 29) 8,646,702 7,809,204 8,070,248 6,591,420 5,910,981 6,434,752Taxes and licenses (Note 17) 2,881,458 3,503,233 3,052,481 1,929,202 2,597,693 2,239,684
Depreciation and amortization (Note 16) 1,623,679 1,406,900 1,378,194 1,146,458 1,008,907 904,950Occupancy (Note 16) 890,645 904,750 962,275 674,342 674,692 676,207Miscellaneous (Note 28) 10,277,070 7,749,066 6,862,168 7,147,271 6,126,463 5,333,354
24,319,554 21,373,153 20,325,366 17,488,693 16,318,736 15,588,947
PROFIT BEFORE TAX 14,984,802 12,342,383 14,498,004 14,213,838 11,332,788 13,911,877
INCOME TAX EXPENSE
(BENEFIT) (Note 30) 2,407,069 781,380 494,494 1,688,462 69,365 (114,242)
NET PROFIT P=12,577,733 P=11,561,003 P=14,003,510 P=12,525,376 P=11,263,423 P=14,026,119
Attributable to:
Parent Bank’s stockholders P=12,525,376 P=11,553,430 P=14,026,128 P=12,525,376 P=11,263,423 P=14,026,119
Non-controlling interests 52,357 7,573 (22,618) − − −P=12,577,733 P=11,561,003 P=14,003,510 P=12,525,376 P=11,263,423 P=14,026,119
Basic/Diluted Earnings per Share
(Note 33) P=8.22 P=7.58 P=9.21 P=8.22 P=7.39 P=9.21
See accompanying Notes to Financial Statements.

*SGVFS162380*
UNION BANK OF THE PHILIPPINES AND SUBSIDIARIES
STATEMENTS OF COMPREHENSIVE INCOMEFor the Years Ended December 31, 2021, 2020 and 2019
(Amounts are presented in thousands of Philippine Pesos)
Group Parent Bank
Years Ended December 31 Years Ended December 31
2021 2020 2019 2021 2020 2019
NET PROFIT FOR THE YEAR P=12,577,733 P=11,561,003 P=14,003,510 P=12,525,376 P=11,263,423 P=14,026,119
OTHER COMPREHENSIVE
INCOME (LOSS)
Items that may be reclassified to profit or
loss in subsequent periods:
Unrealized mark-to-market gains (losses) on investment securities at FVOCI (845,911) 2,997,404 1,075,277 (835,790) 2,989,316 1,074,826
Realized gains on sale of investment securities at FVOCI recognized in profit or loss (Note 13) (657,987) (3,020,457) (1,072,005) (657,987) (3,020,457) (1,072,005)
Cumulative translation adjustment 32,640 (15,337) (3,549) 30,559 (10,612) − Share in unrealized mark-to-market loss on investment securities at FVOCI
of subsidiaries (Note 15) − − − (133) − −Items that will not be reclassified to
profit or loss in subsequent periods:
Remeasurement gains (losses) ondefined benefit plan (Note 29) 502,675 (634,623) (562,373) 427,890 (588,767) (336,186)
Income tax benefit (expense) (Note 30) (193,286) 190,387 168,712 (174,589) 176,630 100,856
Share in changes in remeasurementgains (losses) of subsidiaries (Note 15) − − − 38,907 (21,228) (87,086)
TOTAL OTHER COMPREHENSIVE
LOSS FOR THE YEAR (1,161,869) (482,626) (393,938) (1,171,143) (475,118) (319,595)
TOTAL COMPREHENSIVE INCOME
FOR THE YEAR P=11,415,864 P=11,078,377 P=13,609,572 P=11,354,233 P=10,788,305 P=13,706,524
Attributable to:
Parent Bank’s stockholders P=11,362,598 P=11,078,413 P=13,632,190 P=11,354,233 P=10,788,305 P=13,706,524Non-controlling interests 53,266 (36) (22,618) − − −
P=11,415,864 P=11,078,377 P=13,609,572 P=11,354,233 P=10,788,305 P=13,706,524
See accompanying Notes to Financial Statements.

*SGVFS162380*
UNION BANK OF THE PHILIPPINES AND SUBSIDIARIES
STATEMENTS OF CHANGES IN CAPITAL FUNDSFor the Years Ended December 31, 2021, 2020 and 2019
(Amounts are presented in thousands of Philippine Pesos)
Group
Equity Attributable to Equity Holders of the Parent Bank
Capital Stock
Additional
Paid-in Capital
Stock Dividend
Distributable Surplus Free Surplus Reserves
Net Unrealized
Fair Value
Gains (Losses) on
Investment
Securities at
FVOCI
Remeasurements
of Defined
Benefit Plan Other Reserves Total
Non-controlling
Interests
Total Capital
Funds
Balances as at January 1, 2021 P=12,184,715 P=14,214,983 P=− P=77,096,218 P=2,645,080 P=55,384 (1,815,784) (P=18,886) P=104,361,710 P=790,692 P=105,152,402
Total comprehensive income (loss) for the year − − − 12,525,376 − (1,503,841) 308,423 32,640 11,362,598 53,266 11,415,864
Issuance of new shares (Note 25) 8,913 54,684 − − − − − − 63,597 − 63,597
Stock dividends (Note 25) − (55,116) 3,048,388 (3,048,388) − − − − (55,116) − (55,116)
Cash dividends (Note 25) − − − (4,267,770) − − − − (4,267,770) − (4,267,770)
Appropriations during the year (Note 25) − − − (153,593) 153,593 − − − − − −Dividends of subsidiaries to non-controlling
interests − − − − − − − − − (59,300) (59,300)
Subscription of shares by non-controlling interest − − − − − − − − − 10,000 10,000
Acquisition of non-controlling interest − − − (29,091) − − − − (29,091) (17,358) (46,449)
Balances as at December 31, 2021 P=12,193,628 P=14,214,551 P=3,048,388 P=82,122,752 P=2,798,673 (P=1,448,457) (P=1,507,361) P=13,754 P=111,435,928 P=777,300 P=112,213,228
Balances as at January 1, 2020 P=12,176,096 P=14,172,060 P=− P=67,851,771 P=4,600,747 P=78,437 (P=1,379,157) (P=3,549) P=97,496,405 P=520,560 P=98,016,965Total comprehensive income (loss) for the year − − − 11,553,430 − (23,053) (436,627) (15,337) 11,078,413 (36) 11,078,377Issuance of new shares (Note 25) 8,619 42,923 − − − − − − 51,542 − 51,542Cash dividends (Note 25) − − − (4,264,650) − − − − (4,264,650) − (4,264,650)Effect of business combination (Note 15) − − − − − − − − − 270,168 270,168Reversal of appropriations during the year -net
(Note 25) − − − 1,955,667 (1,955,667) − − − − − −Balances as at December 31, 2020 P=12,184,715 P=14,214,983 P=− P=77,096,218 P=2,645,080 P=55,384 (1,815,784) (P=18,886) P=104,361,710 P=790,692 P=105,152,402
Balances as at January 1, 2019 P=12,171,495 P=14,146,988 P=− P=57,236,205 P=3,502,769 P=75,165 (P=985,496) P=− P=86,147,126 P=543,178 P=86,690,304Total comprehensive income (loss) for the year − − − 14,026,128 − 3,272 (393,661) (3,549) 13,632,190 (22,618) 13,609,572Issuance of new shares (Note 25) 4,601 25,072 − − − − − − 29,673 − 29,673Cash dividends (Note 25) − − − (2,312,584) − − − − (2,312,584) − (2,312,584)Appropriations during the year (Note 25) − − − (1,097,978) 1,097,978 − − − − − −Balances as at December 31, 2019 P=12,176,096 P=14,172,060 P=− P=67,851,771 P=4,600,747 P=78,437 (P=1,379,157) (P=3,549) P=97,496,405 P=520,560 P=98,016,965

*SGVFS162380*
- 2 -
Parent Bank
Capital Stock
Additional
Paid-in Capital
Stock Dividend
Distributable Surplus Free Surplus Reserves
Net Unrealized
Fair Value
Gains (Losses) on
Investment
Securities at FVOCI
Remeasurements
of Defined
Benefit Plan Other Reserves
Total Capital
Funds
Balances as at January 1, 2021 P=12,184,715 P=14,214,983 P=− P=77,697,363 P=2,171,842 P=46,845 (P=1,741,389) (P=10,612) P=104,563,747
Total comprehensive income (loss) for the year − − − 12,525,376 − (1,493,910) 292,208 30,559 11,354,233
Issuance of new shares (Note 25) 8,913 54,684 − − − − − − 63,597
Stock dividends (Note 25) − (55,116) 3,048,388 (3,048,388) − − − − (55,116)
Cash dividends (Note 25) − − − (4,267,770) − − − − (4,267,770)
Appropriations during the year – net (Note 25) − − − (152,092) 152,092 − − − −Balances as at December 31, 2021 P=12,193,628 P=14,214,551 P=3,048,388 P=82,754,489 P=2,323,934 (P=1,447,065) (P=1,449,181) P=19,947 P=111,658,691
Balances as at January 1, 2020 P=12,176,096 P=14,172,060 P=− P=70,201,147 P=2,669,285 P=77,986 (P=1,308,024) P=− P=97,988,550Total comprehensive income (loss) for the year − − − 11,263,423 − (31,141) (433,365) (10,612) 10,788,305Issuance of new shares (Note 25) 8,619 42,923 − − − − − − 51,542Cash dividends (Note 25) − − − (4,264,650) − − − − (4,264,650)Reversals of appropriations during the year – net
(Note 25) − − − 497,443 (497,443) − − − −Balances as at December 31, 2020 P=12,184,715 P=14,214,983 P=− P=77,697,363 P=2,171,842 P=46,845 (P=1,741,389) (P=10,612) P=104,563,747
Balances as at January 1, 2019 P=12,171,495 P=14,146,988 P=− P=59,281,830 P=1,875,067 P=75,165 (P=985,608) P=− P=86,564,937Total comprehensive income (loss) for the year − − − 14,026,119 − 2,821 (322,416) − 13,706,524Issuance of new shares (Note 25) 4,601 25,072 − − − − − − 29,673Cash dividends (Note 25) − − − (2,312,584) − − − − (2,312,584)Appropriations during the year (Note 25) − − − (794,218) 794,218 − − − −Balances as at December 31, 2019 P=12,176,096 P=14,172,060 P=− P=70,201,147 P=2,669,285 P=77,986 (P=1,308,024) P=− P=97,988,550
See accompanying Notes to Financial Statements.

*SGVFS162380*
UNION BANK OF THE PHILIPPINES AND SUBSIDIARIES
CONSOLIDATED STATEMENTS OF CASH FLOWSFor the Years Ended December 31, 2021, 2020 and 2019
(Amounts are presented in thousands of Philippine Pesos)
GROUP PARENT BANK
Years Ended December 31 Years Ended December 31
2021 2020 2019 2021 2020 2019
CASH FLOWS FROM OPERATING
ACTIVITIES
Profit before tax P=14,984,802 P=12,342,383 P=14,498,004 P=14,213,838 P=11,332,788 P=13,911,877
Adjustments for: Gains on sale of investment securities
at amortized cost (Note 12) (8,447,595) (5,111,793) (7,074,044) (8,447,595) (5,111,793) (7,074,044)Provision for credit losses (Note 20) 5,811,398 8,381,856 1,857,347 4,657,731 7,450,171 1,548,187
Amortization of premium and discount offinancial assets and liabilities 2,269,357 633,893 975,812 2,220,141 635,120 953,206
Depreciation and amortization (Note 16) 2,221,316 1,928,421 1,883,035 1,557,053 1,447,218 1,308,500 Unrealized foreign exchange loss
(gains) - net (876,088) 45,873 (785,049) (909,334) 45,882 (775,871) Gain on sale of investment securities at
FVOCI (Note 13) (657,987) (3,020,457) (1,072,005) (657,987) (3,020,457) (1,072,005)
Impairment of goodwill and investment insubsidiaries (Notes 15 and 18) 529,599 223,172 − − 290,002 −
Gain on sale of investments in associates(Note 15) (167,332) − − − − −
Gains on foreclosure of investmentproperties (Note 17) (135,309) (153,876) (221,213) (135,309) (153,876) (208,233)
Reversal of impairment on investmentproperties (Note 17) (64,649) − − (64,649) − −
Losses (gains) on sale of investmentproperties (Note 17) 43,689 (229,148) (200,079) (207,360) (195,471) (251,696)
Losses (gains) on disposal of property andequipment (Note 16) (18,108) 8,641 (679,298) (1,900) (6,236) (616,137)
Share in net loss (profit) of subsidiaries and
associates (Notes 15 and 28) 4,135 3,665 464 (1,173,016) (953,082) (1,222,595)Changes in operating assets and liabilities:
Decreases (increases) in:Loans and other receivables (19,355,679) 29,147,657 (52,976,314) (17,497,222) 33,878,915 (57,372,464)
Trading securities at FVTPL 12,670,664 (10,582,248) 417,294 12,840,034 (10,593,749) 408,014Other resources (6,328,757) (28,285) (1,200,710) (4,114,905) (1,175,000) (1,754,855)
Increases (decreases) in:Deposit liabilities 42,715,866 46,590,101 66,633,507 27,830,562 32,349,777 61,243,986
Other liabilities 2,905,804 (6,953,527) 5,672,031 1,533,845 (4,817,926) 6,191,690
Net cash provided by operations 48,105,126 73,226,328 27,728,782 31,643,927 61,402,283 15,217,560
Income taxes paid (2,171,465) (2,155,071) (1,703,147) (1,260,561) (1,296,905) (1,055,476)
Net cash provided by operating activities 45,933,661 71,071,257 26,025,635 30,383,366 60,105,378 14,162,084
CASH FLOWS FROM INVESTING
ACTIVITIES
Acquisitions of:
Investment securities at amortized cost (125,796,399) (65,958,555) (26,829,682) (124,111,014) (63,475,137) (26,829,682)
Investment securities at FVOCI (78,214,061) (97,655,465) (54,459,546) (78,214,061) (97,655,465) (54,459,546) Bank premises, furniture, fixtures and
equipment (Note 16) (505,605) (1,026,363) (934,553) (317,391) (867,690) (810,243) Investments in subsidiaries and
associates (Notes 1 and 15) (109,608) − − (1,500,000) − −Proceeds from maturities/sale of:
Investment securities at amortized cost 122,933,196 71,519,901 71,355,242 122,903,200 71,519,901 71,355,242Investment securities at FVOCI 46,097,932 72,201,864 59,623,639 46,067,931 72,201,864 59,623,188
Investment properties (Note 17) 464,361 410,787 254,865 407,214 273,676 220,404 Bank premises, furniture, fixtures and
equipment (Note 16) 52,920 12,418 803,666 15,543 18,138 700,894Dividends received from a subsidiary − − − 1,496,811 − −Investments in associates (Note 15) 313,012 − − − − −
Acquisition of subsidiaries, net of cash acquired(Notes 1 and 15) − 54,241 (130,000) − (702,502) (487,500)
Dissolution of subsidiaries (Notes 1 and 15) − − − 11 − −Net cash provided by (used in)
investing activities (34,764,252) (20,441,172) 49,683,631 (33,251,756) (18,687,215) 49,312,757
(Forward)

*SGVFS162380*
- 2 -
GROUP PARENT BANK
Years Ended December 31 Years Ended December 31
2021 2020 2019 2021 2020 2019
CASH FLOWS FROM FINANCING
ACTIVITIES
Payments of:Bills payable (P=131,247,110) (P=609,512,421) (P=2,291,736,846) (P=69,805,980) (P=565,341,774) (P=2,235,935,766)
Cash dividends (Note 25) (4,267,770) (4,264,650) (2,312,584) (4,267,770) (4,264,650) (2,312,584)Notes and bonds payable (3,473,520) (21,171,857) (3,426,766) − (18,200,000) −Lease liabilities (Note 24) (579,064) (613,498) (527,633) (446,112) (477,197) (426,711)
Dividends of subsidiaries to NCI (59,300) − − − − − Cash for fractional shares related to stock
Dividends (Note 25) (55,116) − − (55,116) − − Long term negotiable certificate of
deposits (Note 21) − − (3,000,000) − − (3,000,000)Proceeds from:
Bills payable 127,075,530 558,732,399 2,305,932,334 62,765,158 507,779,097 2,263,433,630Notes payable (Note 23) 11,057,895 33,135,900 9,199,139 7,650,000 30,206,900 5,800,000
Issuance of new shares (Note 25) 63,597 51,542 29,673 63,597 51,542 29,673Subscription of shares by NCI 10,000 − − − − −
Net cash provided by (used in)
financing activities (1,474,858) (43,642,585) 14,157,317 (4,096,223) (50,246,082) 27,588,242
EFFECT OF CHANGES IN FOREIGN
CURRENCY EXCHANGE RATES (44,958) (145,377) (125,033) (44,958) (140,652) (121,484)
NET INCREASE (DECREASE) IN CASH
AND CASH EQUIVALENTS 9,649,593 6,842,123 89,741,550 (7,009,571) (8,968,571) 90,941,599
CASH AND CASH EQUIVALENTS AT
BEGINNING OF THE YEAR
Cash and other cash items 8,958,042 8,580,709 10,916,533 7,814,917 7,832,302 10,334,793Due from Bangko Sentral ng Pilipinas (BSP) 103,869,770 73,749,813 56,510,701 83,867,434 67,798,418 52,961,426
Due from other banks 68,532,218 73,675,709 14,942,213 64,763,768 71,497,226 11,550,166Interbank loans receivable − 213,062 − − 213,062 −Securities purchased under repurchase agreement
(SPURA) 16,475,090 34,773,704 18,882,000 10,373,294 28,446,976 10,000,000
197,835,120 190,992,997 101,251,447 166,819,413 175,787,984 84,846,385
CASH AND CASH EQUIVALENTS AT END
OF YEAR
Cash and other cash items 8,904,903 8,958,042 8,580,709 7,988,517 7,814,917 7,832,302Due from BSP 103,407,946 103,869,770 73,749,813 67,478,389 83,867,434 67,798,418
Due from other banks 54,258,465 68,532,218 73,675,709 51,308,983 64,763,768 71,497,226Interbank loans receivable 17,492,657 − 213,062 17,492,657 − 213,062
SPURA 23,420,742 16,475,090 34,773,704 15,541,296 10,373,294 28,446,976
P=207,484,713 P=197,835,120 P=190,992,997 P=159,809,842 P=166,819,413 P=175,787,984
OPERATIONAL CASH FLOWS FROM
INTERESTS AND DIVIDENDS
Interest received P=38,840,197 P=38,292,850 P=38,784,259 P=28,048,227 P=29,188,963 P=29,387,709Interest paid 6,482,612 10,304,166 16,173,752 4,250,186 7,976,641 12,942,912
Dividends received 145,789 200,671 202,888 145,789 200,671 201,858
See accompanying Notes to Financial Statements.

*SGVFS162380*
UNION BANK OF THE PHILIPPINES AND SUBSIDIARIES
NOTES TO FINANCIAL STATEMENTS
1. Corporate Information
Incorporation and OperationsUnion Bank of the Philippines (the Bank, UnionBank or the Parent Bank) was incorporated in thePhilippines on August 16, 1968 and operates as a universal bank through its universal bankinglicense acquired in July 1992.
The Bank provides expanded commercial banking products and services such as loans anddeposits, cash management, retail banking, foreign exchange, capital markets, corporate andconsumer finance, investment management and trust banking. As of December 31, 2021, theBank and its subsidiaries (collectively referred to as the “Group”) has 385 branches and 398 on-site and 99 off-site automated teller machines (ATMs), located nationwide.
The Bank’s common shares are listed in the Philippine Stock Exchange (PSE). The Bank iseffectively 49.66% owned by Aboitiz Equity Ventures, Inc. (AEVI), a company incorporated anddomiciled in the Philippines. AEVI is the holding and management company of the AboitizGroup of Companies.
The Bank’s subsidiaries (all incorporated in the Philippines, except for UBX SG and UBXRemit), effective percentage of ownership and the nature of the subsidiaries’ businesses as ofDecember 31, 2021 and 2020 are as follows:
Percentage of ownership
Name of Subsidiary 2021 2020 Nature of Business
City Savings Bank, Inc. (CSB) 99.79% 99.79% Thrift bankPetNet, Inc. (PETNET) 51.00% 51.00% Remittances/ money transferFirst-Agro Industrial Rural Bank, Inc. (FAIR Bank) (a) 100.00% 93.33% Rural bankUBP Investments Corporation (UIC) 100.00% 100.00% Holding companyFirst Union Plans, Inc. (FUPI) (b) 100.00% 100.00% Pre-needFirst Union Direct Corporation (FUDC) (b) 100.00% 100.00% Financial products marketingFirst Union Insurance and Financial Agencies, Inc.
(FUIFAI) (b)100.00% 100.00% Agent for insurance and
financial productsUBP Securities, Inc. (UBPSI) 100.00% 100.00% Securities brokerageUnionBank Currency Brokers Corporation (UCBC) 100.00% 100.00% Foreign currency brokerageUnionDataCorp (UDC) 100.00% 100.00% Data processingInterventure Capital Corporation (IVCC) 60.00% 60.00% Venture capitalUBX Philippines Corporation (UBX) 100.00% 100.00% Investment holding and
innovation companyUBX Private Ltd. (UBX SG) (c) 100.00% 100.00% Holding companyUBX Remit Pte. Ltd. (UBX Remit) (d) 100.00% 100.00% Remittance companyBangko Kabayan, Inc. (A Private Development Bank)
(Bangko Kabayan) (e) 70.00% 70.00% Private development bankProgressive Bank, Inc. (PBI) (f) 100.00% 75.00% Rural bankUnion Digital Bank (UnionDigital) (g) 100.00% − Digital bank(a) On July 8, 2021, UIC acquired the shares of non-controlling interest of FAIR Bank
(b) FUPI, FUDC and FUIFAI are wholly-owned subsidiaries of UIC
(c) Wholly owned subsidiary of UBX
(d) Wholly owned subsidiary of UBX SG
(e) Acquired on March 12, 2020 through CSB and UIC, with 49% and 21% share in ownership, respectively
(f) Acquired on July 13, 2020 through CSB and UIC, with 49% and 51% share in ownership, respectively
(g) Incorporated on November 25, 2021

Corporate Information - 2 -
*SGVFS162380*
Other relevant information about the subsidiaries’ nature of businesses and their status ofoperations are discussed in the sections that follow:
(a) CSB was incorporated and registered with the SEC on December 9, 1965. It is a thrift bankspecializing in granting teacher’s loans under the Department of Education’s AutomaticPayroll Deduction System. CSB has 149 branches as of December 31, 2021.
On July 5, 2018 and July 10, 2018, the BOD and the stockholders, respectively, of CSBapproved the plan of merger with PR Savings Bank, with CSB as the surviving entity. OnDecember 20, 2018, the Monetary Board (MB) of the BSP approved the merger subject tocertain conditions, including completion of the merger within one year from the date ofreceipt of the BSP approval and that the merger should be effective on the date the SECissues the certificate of merger. On December 27, 2018 and February 28, 2019, the BSP andthe SEC, respectively, approved the merger between CSB and PR Savings Bank, with CSBas the surviving entity.
PR Savings Bank was the 14th largest thrift bank in the country. Most of its 102 offices arelocated in Luzon offering motorcycle, agri-machinery, and salary loans to over 131,000borrowers, mostly from the mass market segment. The transaction enabled CSB to expandits reach in Luzon, and enter into new market segments, such as motorcycle and agri-machinery financing.
On December 20, 2018, the MB of BSP granted certain merger incentives, includingtemporary relief from compliance with the minimum CAR of 10% on solo basis for both theCSB and PRSB from June 2018 until the effectivity of the merger, provided that the CSB’sCAR shall not fall below 7%; ten-year amortization of the goodwill from July 2018 to June2028, and staggered booking of loan impairment determined based on BSP’s examinationof PR Savings Bank as of June 30, 2018 over a period of 5 years to start on the year themerger becomes effective. Subsequently, CSB recognized the required loan impairmentamount outright as part of the determination of the final fair value of assets acquired at thedate of the business combination.
CSB’s CAR, after the effectivity of the merger, increased from 8.9% in December 2018 to11.9% in March 2019. For prudential reporting, the Bank is amortizing the goodwillapproved by the BSP for the next 10 years. The required annual amortization of goodwill forprudential reporting purposes of CSB is P=272.94 million. The difference between the finalgoodwill under PFRS and the BSP approved goodwill was reflected as a reduction inRetained Earnings for prudential reporting to the BSP.
(b) PETNET, more widely-known by its retail brand name PERA HUB, has the largest networkof Western Union outlets in the Philippines. PETNET has over 3,714 outlets nationwide. Itoffers a variety of cash-based services including remittance, currency exchange and billspayment.
(c) FAIR Bank was registered with the SEC on September 15, 1998 primarily to engage in thebusiness of extending rural credit to small farmers and tenants and to deserving ruralindustries or enterprises. FAIR Bank has one (1) banking office and ten (10) brancheslocated all over Cebu and Negros Occidental areas.
In 2020, CSB and UIC further infused additional capital amounting to P=41.45 million(equivalent to 414,543 common shares at P=100 par value) and P=43.15 million (equivalent to431,157 common shares at P=100 par value), respectively, or a total of P=84.60 million. Theaggregate additional infusion in 2020 resulted in UIC’s ownership in FAIR Bank furtherincreasing to 44.33%, while CSB’s ownership remained the same at 49%.

Corporate Information - 3 -
*SGVFS162380*
On July 8, 2021, UIC acquired the remaining 199,998 shares held by the non-controllinginterest of FAIR Bank for P=50.15 per share (P=10.2 million), further increasing the percentageof ownership of UIC from 44.33% to 51%, while CSB’s ownership interest stood at 49%.
(d) UIC was incorporated and registered with the SEC on December 20, 1993. It is presentlyengaged in business as a holding company authorized to hold investments of real andpersonal properties, including shares of stocks, bonds, debentures, notes and other securitiesand obligations, without engaging in business of an investment company or broker or dealerin securities of stocks.
UIC holds investments of the Group’s thrift banks, rural banks and remittance companies. Inaddition, through its wholly-owned subsidiaries, FUPI, FUDC and FUIFAI, UIC is alsoengaged in the servicing of existing pre-need plans, and being an agent for life and non-lifeinsurance products.
(e) On February 11, 2019, the BSP approved the Parent Bank’s incorporation of UBXPhilippines Corporation (UBX). UBX was incorporated to invest in, hold, own, purchase,lease manage, sell or otherwise dispose of real and personal properties of every kind anddescription. It shall also engage in the development of financial technology innovations andengage in electronic commerce business.
In October 2018, UIC incorporated UBX SG. On March 21, 2019, UBX then entered into anSPA with UIC to purchase 100 ordinary shares of UBX SG, a Singapore-based entityincorporated by UIC in October 2018, for a total consideration amounting to SGD100.Similar to UBX, UBX SG is incorporated to engage in the development of financialtechnology innovations and engage in electronic commerce business.
On November 27, 2020, the Parent Bank’s BOD approved the additional capital infusion ofP=500 million into UBX. The capital infusion was approved by the BSP on February 15,2021. The additional capital is intended to grow UBX’ business operations and ventureplatforms.
(f) In February 2019, CSB and UIC acquired 70% ownership of Bangko Kabayan, with CSBowning 49% and UIC owning 21%. The transaction was approved by BSP and PhilippineCompetition Commission (PCC) on September 19, 2019 and January 9, 2020, respectively.On March 12, 2020, the parties executed the Deed of Absolute Sale, which is determined tobe the Group’s acquisition date. On the same date, CSB and UIC paid 70% of the totalpurchase price, bringing the total payment to 90% of the purchase price. The remaining 10%deposited as a retention amount in an escrow account has been released to the sellers inNovember 2021.
Bangko Kabayan is authorized to engage in the business of extending financial services tofarmers, employees, entrepreneurs, commercial, manufacturing and industrial enterprises andto such other persons or entities that require financial intermediation, and to have and toexercise all authority and powers, and to do and perform all acts, and to transact all businesswhich may legally be done by thrift banks organized under and in accordance with theexisting New Thrift Banks Act of 1995 (Republic Act No. 7906). It converted its existingmicrofinance banking office to a branch-lite unit and has 23 branches, including the headoffice, in the areas of Batangas, Laguna and Quezon (Southern Luzon), and one branch-litein Lobo, Batangas.

Corporate Information - 4 -
*SGVFS162380*
(g) On January 5, 2018, CSB and UIC executed an SPA to acquire 75% ownership interest ofPBI through a combination of (a) subscription to 18,000,000 new shares and (b) purchase of11,980,916 common shares from the major stockholders. On February 24, 2020, the BSPapproved the application of CSB and UIC to acquire 75% ownership of PBI.
On July 13, 2020, BSP noted a clarification made by the PCC in its acknowledgement letterindicating that PCC does not categorically declare that the acquisition does not breach thethresholds prescribed by PCC and its IRR, leaving the parties involved with the responsibilityto ensure that they fully comply with the notification requirement. The PCC issued a Letterof Non-Coverage declaring that the transaction is not subject to compulsory notification onAugust 5, 2020. For convenience purposes, the Group used July 31, 2020 as the date ofbusiness combination.
On October 7, 2021, UIC acquired the remaining 19,993,640 shares held by thenon-controlling interest of PBI for P=1.80 per share (P=36.0 million), further increasing thepercentage of ownership of UIC from 26% to 51%, while CSB’s ownership interest stoodat 49%.
PBI is authorized to engage in the business of extending credit to farmers, tenants, and ruralindustries or enterprises, and to transact all business that may be legally done by rural banksformed under and in accordance with the existing Rural Banks Act (Republic Act No. 7353).The principal office address of PBI is located at Del Rosario St., Poblacion, Balasan, lloilo,and operates an extension office in Pototan, lloilo, for the purpose of providing microfinanceloans along with its primary banking services, and a branch atNo. 243 E. Lopez St., Brgy. Lourdes, Jaro, lloilo City.
(h) In its letter dated July 19, 2021, the BSP approved the application for authority to establish adigital bank, to be known as Union Digital Bank (UnionDigital), a wholly-owned subsidiaryof the Bank, subject to regulatory conditions. The BSP subsequently granted the Authority toRegister with the SEC. On November 25, 2021, the SEC approved UnionDigital's Articles ofIncorporation and its By-Laws and issued its Certificate of Incorporation. The Parent Banksubscribed to 100,000,000 new common shares of UnionDigital at par value P=10 per sharetotaling P=1.0 billion.
Non-operating subsidiaries
(a) UBPSI was incorporated and registered with the SEC on March 2, 1993. It was organized toengage in the business of buying, selling or dealing in stocks and other securities. In January1995, as approved by UBPSI’s stockholders and BOD, UBPSI sold its stock exchange seat inthe PSE. Accordingly, UBPSI ceased its stock brokerage activities.
(b) UCBC was registered in the SEC on June 14, 1994. It was organized to engage in the foreigncurrency brokerage business. On March 23, 2001, the BOD of UCBC approved the cessationof its business operations effective on April 16, 2001. Since then, UCBC’s activities weresignificantly limited to the settlement of its liabilities. The BOD and the stockholders ofUCBC have approved to shorten UCBC’s corporate term to December 31, 2016. UCBC hassecured a tax clearance from the Bureau of Internal Revenue (BIR) in 2018. UCBC has anapplication for dissolution currently pending with the SEC.

Corporate Information and
Summary of Significant Accounting Policies - 5 -
*SGVFS162380*
(c) UDC was registered with the SEC on September 8, 1998. It was organized to handle thecentralized branch accounting services as well as the processing of credit card applicationforms of the Parent Bank and the entire backroom operations of FUPI. On July 1, 2003, theBOD of UDC approved the cessation of its business operations effective on August 30, 2003,and subsequently shortened its corporate term to December 31, 2017 by amending itsArticles of Incorporation. The services previously handled by UDC are now undertaken bythe Financial Services Group of the Parent Bank. UDC is still in process of securing the taxclearance from the BIR.
(d) IVCC was incorporated and registered with the SEC on October 10, 1980. It was organizedto develop, promote, aid and assist financially any small or medium scale enterprises and topurchase, receive, take or grant, hold, convey, sell, lease, pledge, mortgage and otherwisedeal with such real and personal property, including securities and bonds of othercorporations as the transaction of the lawful business of the corporation may reasonably andnecessarily require, subject to the limitations prescribed by law. IVCC has ceased operationssince 1992.
The total assets, liabilities and capital funds of these non-operating subsidiaries amounted toP=5,011, P=3,158 and P=1,853, respectively, as of December 31, 2021 and P=5,032, P=3,158 andP=1,874, respectively, as of December 31, 2020.
The Bank’s registered address, which is also its principal place of business, is at UnionBankPlaza, Meralco Avenue corner Onyx Street and Sapphire Road, Ortigas Center, Pasig City.AEVI’s registered address is located at NAC Tower, 32nd Street, Bonifacio Global City, TaguigCity, Metro Manila.
Approval of Financial StatementsThe consolidated financial statements of UnionBank and Subsidiaries (the Group) and thefinancial statements of the Parent Bank as of and for each of the three years in the period endedDecember 31, 2021 were authorized for issue by the Bank’s BOD on February 24, 2022.
2. Summary of Significant Accounting Policies
The significant accounting policies that have been used in the preparation of these financialstatements are summarized below. These policies have been consistently applied to all the yearspresented, unless otherwise stated.
Basis of Preparation of Financial Statements
(a) Statement of Compliance with Philippine Financial Reporting Standards
The consolidated financial statements of the Group and the financial statements of the Bankhave been prepared in accordance with Philippine Financial Reporting Standards (PFRS).PFRSs are adopted by the Financial Reporting Standards Council (FRSC) from thepronouncements issued by the International Accounting Standards Board (IASB), andapproved by the Philippine Board of Accountancy.
The financial statements have been prepared using the measurement bases specified by PFRSfor each type of resource, liability, income and expense.
The measurement bases are more fully described in the accounting policies that follow.

Summary of Significant Accounting Policies - 6 -
*SGVFS162380*
(b) Presentation of Financial Statements
The financial statements are presented in accordance with Philippine Accounting Standards(PAS 1), Presentation of Financial Statements. The Group presents statement ofcomprehensive income separate from the statement of income.
(c) Functional and Presentation Currency
The financial statements of the Group include the accounts maintained in the RegularBanking Unit (RBU) and Foreign Currency Deposit Unit (FCDU). The functional currencyof RBU and FCDU is Philippine Peso (PHP) and United States Dollar (USD), respectively.For financial reporting purposes, FCDU accounts and foreign currency-denominatedaccounts in the RBU are translated into their equivalents in PHP (see accounting policyon Foreign Currency Translation).
The financial statements of these units are combined after eliminating inter-unit accounts.These are presented in Philippine pesos, and all values are presented in thousands ofPhilippine Pesos except when otherwise indicated.
Items included in the financial statements of the Group are measured using its functional currency,the currency of the primary economic environment in which the Group operates.
Adoption of New and Amended PFRS
The accounting policies adopted are consistent with those of the previous financial year, exceptthat the Bank has adopted the following new accounting pronouncements starting January 1, 2021.Adoption of these pronouncements did not have any significant impact on the Bank’s financialposition or performance unless otherwise indicated.
(a) Effective in 2021 that are relevant to the Group
Amendments to PFRS 9, PFRS 7, PFRS 4 and PFRS 16, Interest Rate BenchmarkReform – Phase 2
The amendments provide the following temporary reliefs which address the financialreporting effects when an interbank offered rate (IBOR) is replaced with an alternativenearly risk-free interest rate (RFR):• Practical expedient for changes in the basis for determining the contractual cash
flows as a result of IBOR reform• Relief from discontinuing hedging relationships• Relief from the separately identifiable requirement when an RFR instrument is
designated as a hedge of a risk component
The Group shall also disclose information about:• The nature and extent of risks to which the entity is exposed arising from financial
instruments subject to IBOR reform, and how the entity manages those risks; and• Their progress in completing the transition to alternative benchmark rates, and how
the entity is managing that transition.
The amendments are effective for annual reporting periods beginning on or afterJanuary 1, 2021 and apply retrospectively, however, the Group is not required to restateprior periods.

Summary of Significant Accounting Policies - 7 -
*SGVFS162380*
Covid-19-Related Rent Concessions beyond June 30, 2021, Amendments to IFRS 16
The amendment extended the period of application of the practical expedient to providerelief to lessees from applying IFRS 16 guidance on lease modification accounting forrent concessions arising as a direct consequence of the Covid-19 pandemic until June 30,2022. The amendment applies to annual reporting periods beginning on or after April 1,2021.
(b) Standards Issued but not yet Effective
Pronouncements issued but not yet effective are listed below. Unless otherwise indicated, theGroup does not expect that the future adoption of the said pronouncements will have asignificant impact on its consolidated financial statements. The Group intends to adopt thefollowing pronouncements when they become effective.
Effective beginning on or after January 1, 2022
Amendments to PFRS 3, Reference to the Conceptual Framework
Amendments to PAS 16 , Plant and Equipment: Proceeds before Intended Use
Amendments to PAS 37, Onerous Contracts – Costs of Fulfilling a Contract
Annual Improvements to PFRSs 2018-2020 Cycle• Amendments to PFRS 1, First-time Adoption of Philippines Financial Reporting
Standards, Subsidiary as a first-time adopter• Amendments to PFRS 9, Financial Instruments, Fees in the ’10 per cent’ test for
derecognition of financial liabilities
• Amendments to PAS 41, Agriculture, Taxation in fair value measurements
Effective beginning on or after January 1, 2023
Amendments to PAS 1, Classification of Liabilities as Current or Non-current
PFRS 17, Insurance Contracts
Deferred effectivity
Amendments to PFRS 10, Consolidated Financial Statements, and PAS 28, Sale or
Contribution of Assets between an Investor and its Associate or Joint Venture
Basis of Consolidated Financial StatementsThe Group’s financial statements comprise the accounts of the Parent Bank and its subsidiaries,as enumerated in Note 1 and as disclosed under Note 15, after the elimination of materialintercompany transactions. All intercompany resources and liabilities, equity, income, andexpenses and cash flows relating to transactions with subsidiaries are eliminated in full.Unrealized profits and losses from intercompany transactions that are recognized in the separatefinancial statements are also eliminated in full. Intercompany losses that indicate impairment arerecognized in the Group’s financial statements.
The financial statements of the subsidiaries are prepared in the same reporting period as theParent Bank using consistent accounting policies.
Non-controlling InterestsNon-controlling interest represents the portion of profit or loss and net assets not owned, directlyor indirectly, by the Parent Bank.

Summary of Significant Accounting Policies - 8 -
*SGVFS162380*
The Group’s transactions with non-controlling interests that do not result in loss of control areaccounted for as equity transactions - that is, as transaction with the owners of the Group in theircapacity as owners. The difference between the fair value of any consideration paid and therelevant share acquired of the carrying value of the net assets of the subsidiary is recognized incapital funds. Disposals of equity investments to non-controlling interests may result in gainsand losses for the Group that are also recognized in capital funds.
When the Group ceases to have control over a subsidiary, any retained interest in the entity isremeasured to its fair value at the date when control is lost, with the change in carrying amountrecognized in the statement of income. The fair value is the initial carrying amount for thepurposes of subsequently accounting for the retained interest as an associate, joint venture orfinancial asset. In addition, any amounts previously recognized in other comprehensive incomein respect of that entity are accounted for as if the Group had directly disposed of the relatedresources or liabilities. This may mean that amounts previously recognized in othercomprehensive income are reclassified to profit or loss.
Investment in SubsidiariesSubsidiaries are entities (including structured entities) over which the Group has control. TheGroup controls an entity when it has the power over the entity, it is exposed, or has rights to,variable returns from its involvement with the entity, and it has the ability to affect those returnsthrough its power over the entity. Subsidiaries are consolidated from the date the Group obtainscontrol.
The Group reassesses whether or not it controls an entity if facts and circumstances indicate thatthere are changes to one or more of the three elements of controls indicated above. Accordingly,entities are deconsolidated from the date that control ceases.
In the Parent Bank’s separate financial statements, investments in subsidiaries are initiallyrecognized at cost and subsequently accounted for using the equity method (see Note 15).
All subsequent changes to the share in the equity of the subsidiaries are recognized in thecarrying amount of the Parent Bank’s investment. Changes resulting from the profit or lossgenerated by the subsidiaries are reported as Share in net profit of subsidiaries underMiscellaneous income account in the Parent Bank’s separate statement of income.
Changes resulting from other comprehensive income of the subsidiaries are recognized in othercomprehensive income of the Parent Bank. Any distributions received from the subsidiaries(e.g., dividends) are recognized as reduction in the carrying amount of investment in subsidiaries.However, when the Parent Bank’s share of losses in a subsidiary equals or exceeds its interest inthe subsidiary, including any other unsecured receivables, the Parent Bank does not recognizefurther losses, unless it has incurred obligations or made payments on behalf of the subsidiary. Ifthe subsidiary subsequently reports profits, the Parent Bank recognizes its share on those profitsonly after its share of the profits exceeds the accumulated share of losses that has previously notbeen recognized.
In computing the Parent Bank’s share in net profit or loss of subsidiaries, unrealized gains orlosses on transactions between the Parent Bank and its subsidiaries are eliminated to the extent ofthe Parent Bank’s interest in the subsidiaries. Where unrealized losses are eliminated, theunderlying asset is also tested for impairment from a group perspective.
The Parent Bank holds interests in various subsidiaries as presented in Notes 1 and 15.

Summary of Significant Accounting Policies - 9 -
*SGVFS162380*
Investment in AssociatesAssociates pertain to all entities over which the Group and the Parent Bank have significantinfluence. Significant influence is the power to participate in the financial and operating policydecisions of the investee, but is not control or joint control over those policies. Investment inassociates is accounted for under the equity method of accounting.
Business Combinations and GoodwillBusiness acquisitions are accounted for using the acquisition method of accounting. Thisrequires recognizing and measuring the identifiable assets acquired, the liabilities assumed andany non-controlling interest in the acquiree. The consideration transferred for the acquisition of asubsidiary is the fair value of the assets transferred, the liabilities incurred and the equity interestsissued by the Group, if any. The consideration transferred also includes the fair value of anyasset or liability resulting from a contingent consideration arrangement.
Acquisition-related costs are expensed as incurred and subsequent change in the fair value ofcontingent consideration is recognized directly in the statement of income.
Identifiable assets acquired and liabilities and contingent liabilities assumed in a businesscombination are measured initially at their fair values at the acquisition date. On an acquisition-by-acquisition basis, the Group recognizes any non-controlling interest in the acquiree, either atfair value or at the non-controlling interest’s proportionate share of the recognized amounts ofacquiree’s identifiable net assets.
Goodwill represents the excess of the cost of an acquisition over the fair value of the Group’sshare of the net identifiable assets of the acquired subsidiary at the date of acquisition.Subsequent to initial recognition, goodwill is measured at cost less any accumulated impairmentlosses. Goodwill is tested annually for impairment. Impairment losses on goodwill are notreversed.
Gain on bargain purchase which is the excess of the Group’s interest in the net fair value of netidentifiable assets acquired over acquisition cost is recognized directly to profit.
For the purpose of impairment testing, goodwill is allocated to cash-generating units or groups ofcash-generating units that are expected to benefit from the business combination in which thegoodwill arose.
Gains and losses on the disposal of an interest in a subsidiary include the carrying amount ofgoodwill relating to it.
If the business combination is achieved in stages, the acquirer is required to remeasure itspreviously held equity interest in the acquiree at its acquisition-date fair value and recognize theresulting gain or loss, if any, in the statement of income, as appropriate.
Any contingent consideration to be transferred by the Group is recognized at fair value at theacquisition date. Subsequent changes to the fair value of the contingent consideration that isdeemed to be an asset or liability is recognized in accordance with PAS 37, Provisions,
Contingent Liabilities and Contingent Assets, either in the statement of income or as a charge toother comprehensive income. Contingent consideration that is classified as capital funds is notremeasured, and its subsequent settlement is accounted for within capital funds.

Summary of Significant Accounting Policies - 10 -
*SGVFS162380*
Fair Value MeasurementThe Group measures financial instruments such as financial assets at fair value through profit orloss (FVTPL) and fair value through other comprehensive income (FVOCI) at fair value at eachreporting date. Also, fair values of financial instruments measured at amortized cost andinvestment properties are disclosed in Note 7.
Fair value is the price that would be received to sell an asset or paid to transfer a liability in anorderly transaction between market participants at the measurement date. The fair valuemeasurement is based on the presumption that the transaction to sell the asset or transfer theliability takes place either:
in the principal market for the asset or liability, or
in the absence of a principal market, in the most advantageous market for the asset orliability.
The principal or the most advantageous market must be accessible to the Group. The fair valueof an asset or a liability is measured using the assumptions that market participants would usewhen pricing the asset or liability, assuming that market participants act in their economic bestinterest.
If an asset or a liability measured at fair value has a bid price and ask price, the price within thebid-ask spread is the most representative of fair value in the circumstance shall be used tomeasure fair value regardless of where the input is categorized within the fair value hierarchy.The fair value measurement of a nonfinancial asset takes into account the market participant'sability to generate economic benefits by using the asset in its highest and best use or by selling itto another market participant that would use the asset in its highest and best use.
The Group uses valuation techniques that are appropriate in the circumstances and for whichsufficient data are available to measure fair value, maximizing the use of relevant observableinputs and minimizing the use of unobservable inputs.
All assets and liabilities for which fair value is measured or disclosed in the financial statementsare categorized within the fair value hierarchy, described in Note 7, based on the lowest levelinput that is significant to the fair value measurement as a whole.
For assets and liabilities that are recognized in the financial statements on a recurring basis, theGroup determines whether transfers have occurred between levels in the hierarchy byre-assessing categorization (based on the lowest level input that is significant to the fair valuemeasurement as a whole) at the end of each reporting period.
Financial Instruments - Initial Recognition and Subsequent MeasurementDate of recognitionFinancial assets and liabilities, with the exception of loans and advances to customers andbalances due to customers, are initially recognised on the trade date, i.e., the date that the Groupbecomes a party to the contractual provisions of the instrument. This includes regular way trades:purchases or sales of financial-assets that require delivery of assets within the time framegenerally established by regulation or convention in the market place. Loans and advances tocustomers are recognised when funds are transferred to the customers’ accounts. The Grouprecognises balances due to customers when funds are transferred to the Group.

Summary of Significant Accounting Policies - 11 -
*SGVFS162380*
Initial measurement of financial instruments
The classification of financial instruments at initial recognition depends on their contractualterms and the business model for managing the instruments, as described below. Financialinstruments are initially measured at their fair value; except in the case of financial assets andfinancial liabilities recorded at FVTPL, transaction costs are added to, or subtracted from, thisamount. When the fair value of financial instruments at initial recognition differs from thetransaction price, the Group accounts for the Day 1 profit or loss, as described below.
‘Day 1’ differenceWhere the transaction price in a non-active market is different from the fair value based on otherobservable current market transactions in the same instrument or based on a valuation techniquewhose variables include only data from observable market, the Group recognizes the differencebetween the transaction price and the fair value (a ‘Day 1’difference) in the statement of incomeunless it qualifies for recognition as some other type of asset. In cases where transaction priceused is made of data which is not observable, the difference between the transaction price andmodel value is only recognized in the statement of income when the inputs become observable orwhen the instrument is derecognized. For each transaction, the Group determines the appropriatemethod of recognizing the ‘Day 1’ difference amount.
Measurement categories of financial assets and liabilitiesThe Group classifies all of its financial assets based on the business model for managing theassets and the asset’s contractual terms, measured either at amortized cost, at FVOCI or atFVTPL.
The Group classifies and measures its derivative and trading portfolio at FVTPL. The Groupmay designate financial instruments at FVTPL, if so doing eliminates or significantly reducesmeasurement or recognition inconsistencies.
Financial AssetsFinancial assets are recognized when the Group becomes a party to the contractual terms of the
financial instrument. For purposes of classifying financial assets, an instrument is considered as
an equity instrument if it is non-derivative and meets the definition of equity for the issuer in
accordance with the criteria under PAS 32, Financial Instruments: Presentation. All other
non-derivative financial instruments are treated as debt instruments.
(a) Classification, Measurement and Reclassification of Financial Assets
Under PFRS 9, the classification and measurement of financial assets is driven by the entity’scontractual cash flow characteristics of the financial assets and business model for managingthe financial assets.
As part of its classification process, the Group assesses the contractual terms of financialassets to identify whether they meet the SPPI test. ‘Principal’ for the purpose of this test isdefined as the fair value of the financial asset at initial recognition and may change over thelife of the financial asset (e.g. if there are repayments of principal or amortization of thepremium or discount).
The most significant elements of interest within a lending arrangement are typically theconsideration for the time value of money and credit risk. To make the SPPI assessment, theGroup applies judgement and considers relevant factors such as the currency in which thefinancial asset is denominated, and the period for which the interest rate is set.

Summary of Significant Accounting Policies - 12 -
*SGVFS162380*
In contrast, contractual terms that introduce a more than de minimis exposure to risks orvolatility in the contractual cash flows that are unrelated to a basic lending arrangement donot give rise to contractual cash flows that are solely payments of principal and interest onthe amount outstanding. In such cases, the financial asset is required to be measured atFVTPL.
The Group determines its business model at the level that best reflects how it managesgroups of financial assets to achieve its business objective.
The Group's business model is not assessed on an instrument-by-instrument basis, but at ahigher level of aggregated portfolios and is based on observable factors such as:
how the performance of the business model and the financial assets held within thatbusiness model are evaluated and reported to the entity's key management personnel
the risks that affect the performance of the business model (and the financial assets heldwithin that business model) and, in particular, the way those risks are managed
how managers of the business are compensated (for example, whether the compensationis based on the fair value of the assets managed or on the contractual cash flowscollected)
the expected frequency, value and timing of sales are also important aspects ofthe Group’s assessment.
The business model assessment is based on reasonably expected scenarios without taking'worst case' or 'stress case’ scenarios into account. If cash flows after initial recognition arerealized in a way that is different from the Group's original expectations, the Group does notchange the classification of the remaining financial assets held in that business model, butincorporates such information when assessing newly originated or newly purchased financialassets going forward.
The Group’s measurement categories are described below:
Financial Assets at Amortized Cost
Financial assets are measured at amortized cost if both of the following conditions are met:
the asset is held within the Group’s business model whose objective is to hold financialassets in order to collect contractual cash flows; and,
the contractual terms of the instrument give rise, on specified dates, to cash flows that areSPPI on the principal amount outstanding.
Financial assets meeting these criteria are measured initially at fair value plus transactioncosts. They are subsequently measured at amortized cost using the effective interest method,less any impairment in value.
The Group’s financial assets at amortized cost are presented in the statement of financialposition as Due from BSP, Due from other banks, Interbank loans receivable, Financialassets at amortized cost under Trading and investment securities, Loans and other receivablesand certain accounts under Other resources.
For purposes of cash flows reporting and presentation, cash and cash equivalents compriseaccounts with original maturities of three months or less, including Cash and other cashitems, non-restricted balances of Due from BSP, Due from other banks, Interbank loansreceivable and Securities purchased under repurchase agreements included in Loans and
Summary of Significant Accounting Policies - 13 -
*SGVFS162380*
other receivables. These generally include cash on hand, demand deposits and short-term,highly liquid investments readily convertible to known amounts of cash and which aresubject to insignificant risk of changes in value.
The Group may irrevocably elect at initial recognition to classify a financial asset that meetsthe amortized cost criteria above as at FVTPL if that designation eliminates or significantlyreduces an accounting mismatch had the financial asset been measured at amortized cost.
Financial Assets at FVTPL
Debt instruments that do not meet the amortized cost criteria, or that meet the criteria but theGroup has chosen to designate as at FVTPL at initial recognition, are classified as financialassets at FVTPL. Equity investments are classified as financial assets at FVTPL, unless theGroup designates an equity investment that is not held for trading as at FVOCI at initialrecognition. The Group’s financial assets at FVTPL include government securities,corporate bonds and equity securities which are held for trading purposes.
A financial asset is considered as held for trading if:
it has been acquired principally for the purpose of selling it in the near term;
on initial recognition, it is part of a portfolio of identified financial instruments that theGroup manages together and has evidence of a recent actual pattern of short-term profit-taking; or,
it is a derivative that is not designated and effective as a hedging instrument or financialguarantee.
Financial assets at FVTPL are measured at fair value. Related transaction costs arerecognized directly as expense in the statement of income. Unrealized gains and lossesarising from changes (mark-to-market) in the fair value of the financial assets at FVTPLcategory and realized gains or losses arising from disposals of these instruments are includedin Gains (losses) on trading and investment securities at FVTPL and FVOCI account in thestatement of income.
Interest earned on these investments is reported in the statement of income under Interestincome account while dividend income is reported in the statement of income underMiscellaneous income account when the right of payment has been established.
Financial Assets at FVOCI - Equity InvestmentsAt initial recognition, the Group can make an irrevocable election (on an instrument-by-instrument basis) to designate equity investments as at FVOCI; however, such designation isnot permitted if the equity investment is held by the Group for trading. The Group hasdesignated certain equity instruments as at FVOCI on initial application of PFRS 9.
Equity financial assets at FVOCI are initially measured at fair value plus transaction costs.Subsequently, they are measured at fair value, with no deduction for any disposal costs.Gains and losses arising from changes in fair value are recognized in other comprehensiveincome and accumulated in Net unrealized fair value gains (losses) on investment securitiesin the statement of financial position. When the asset is disposed of, the cumulative gain orloss previously recognized in the Net unrealized fair value gains (losses) on investmentsecurities account is not reclassified to profit or loss, but is reclassified directly to Surplusfree account.

Summary of Significant Accounting Policies - 14 -
*SGVFS162380*
Any dividends earned on holding these equity instruments are recognized in the statement ofincome under Miscellaneous income account.
Financial Assets at FVOCI - Debt InstrumentsThe Group classifies debt instruments measured at FVOCI when both of the followingconditions are met:
the instrument is held within a business model, the objective of which is achieved byboth collecting contractual cash flows and selling financial assets, and
the contractual terms of the financial asset meet the SPPI test.
FVOCI debt instruments are subsequently measured at fair value with gains and lossesarising due to changes in fair value being recognized in OCI. Interest income and foreignexchange gains and losses are recognized in the statement of income in the same manner asfor financial assets measured at amortized cost. The Expected Credit Loss (ECL) calculationfor financial assets at FVOCI is explained in the ‘Impairment of Financial Assets’ section.
On derecognition, cumulative gains or losses previously recognized in OCI are reclassifiedfrom OCI to the statement of income.
Reclassification of financial assets
The Group can only reclassify financial assets if the objective of its business model formanaging those financial assets changes. Accordingly, the Group is required to reclassifyfinancial assets: (i) from amortized cost to FVTPL, if the objective of the business modelchanges so that the amortized cost criteria are no longer met; and, (ii) from FVTPL toamortized cost, if the objective of the business model changes so that the amortized costcriteria start to be met and the characteristic of the instrument’s contractual cash flows meetthe amortized cost criteria.
A change in the objective of the Group’s business model will be effected only at thebeginning of the next reporting period following the change in the business model.
(b) Impairment of Financial Assets
The Group recognizes the allowance for expected credit losses for all loans and other debtfinancial assets carried at amortized cost, together with loan commitments and financialguarantee contracts. Equity instruments are not subject to impairment underPFRS 9.
ECL represent possible credit losses that reflect an unbiased and probability-weightedamount which is determined by evaluating a range of possible outcomes, the time value ofmoney and reasonable and supportable information about past events, current conditions andforecasts of future economic conditions. ECL allowances are measured at amounts equal toeither (i) 12-month ECL or (ii) lifetime ECL for those financial instruments which haveexperienced a significant increase in credit risk (SICR) since initial recognition (GeneralApproach). The 12-month ECL is the portion of lifetime ECL that results from defaultevents on a financial instrument that are possible within the 12 months after the reportingdate. Lifetime ECL are credit losses that results from all possible default events over theexpected life of a financial instrument.

Summary of Significant Accounting Policies - 15 -
*SGVFS162380*
The Group has established a policy to perform an assessment, at the end of each reportingperiod, of whether a financial instrument’s credit risk has increased significantly since initialrecognition, by considering the change in the risk of default occurring over the remaining lifeof the financial instrument.
For non-credit-impaired financial instruments:
Stage 1 consists of all non-impaired financial instruments which have not experienced aSICR since initial recognition. The Group and the Parent Bank recognizes a 12-monthECL for Stage 1 financial instruments.
Stage 2 consists of all non-impaired financial instruments which have experienced aSICR since initial recognition. The Group and the Parent Bank recognizes a lifetimeECL for Stage 2 financial instruments.
For credit-impaired financial instruments:
Financial instruments are classified as Stage 3 when there is objective evidence ofimpairment as a result of one or more loss events that have occurred after initialrecognition with a negative impact on the estimated future cash flows of a loan or aportfolio of loans. The ECL model requires that lifetime ECL be recognized forimpaired financial instruments.
The Group uses internal credit assessment and approvals at various levels to determine thecredit risk of exposures at initial recognition. Assessment can be quantitative or qualitativeand depends on the materiality of the facility or the complexity of the portfolio to beassessed.
The Group defines a financial instrument as in default, which is fully aligned with thedefinition of credit impaired, in all cases when the borrower becomes more than 90 days pastdue on its contractual payments. As part of a qualitative assessment of whether a customer isin default, the Group also considers a variety of instances that may indicate unlikeliness topay. When such events occur, the Group carefully considers whether the event should resultin treating the customer as defaulted. An instrument is considered to be no longer in default(i.e., to have cured) when it no longer meets any of the default criteria for a consecutiveperiod of 180 days (i.e. consecutive payments from the borrowers for 180 days).
The criteria for determining whether credit risk has increased significantly vary by portfolioand include quantitative changes in probabilities of default and qualitative factors such asdowngrade in the credit rating of the borrowers and a backstop based on delinquency. Thecredit risk of a particular exposure is deemed to have increased significantly since initialrecognition if, based on the Group’s internal credit assessment, the borrower or counterpartyis determined to require close monitoring or with well-defined credit weaknesses. Days pastdue are determined by counting the number of days since the earliest elapsed due date inrespect of which full payment has not been received. In subsequent reporting periods, if thecredit risk of the financial instrument improves such that there is no longer a SICR sinceinitial recognition, the Group shall revert to recognizing a 12-month ECL. All exposures aretherefore provided with ECLs, in the context of SICR status.
ECL is a function of the Probability of Default (PD), Exposure at Default (EAD) and LossGiven Default (LGD), with the timing of the loss also considered, and is estimated byincorporating forward-looking economic information and through the use of experiencedcredit judgment.

Summary of Significant Accounting Policies - 16 -
*SGVFS162380*
The PD represents the likelihood that a credit exposure will not be repaid and will go intodefault in either a 12-month horizon for Stage 1 or lifetime horizon for Stage 2. The PD foreach individual instrument is modelled based on historical data and is estimated based oncurrent market conditions and reasonable and supportable information about future economicconditions. The Group segmented its credit exposures and developed a corresponding PDmethodology for each portfolio. The PD methodology for each relevant portfolio isdetermined based on the underlying nature or characteristic of the portfolio, behavior of theaccounts and materiality of the segment as compared to the total portfolio.
EAD is modelled on historic data and represents an estimate of the outstanding amount ofcredit exposure at the time a default may occur. For off-balance sheet and undrawn amounts,EAD includes an estimate of any further amounts that may be drawn at the time of default.LGD is the amount that may not be recovered in the event of default and is modelled basedon historical cash flow recovery and reasonable and supportable information about futureeconomic conditions, where appropriate. LGD takes into consideration the amount andquality of any collateral held.
(c) Derecognition of Financial Assets
A financial asset (or where applicable, a part of a financial asset or part of a group offinancial assets) is derecognized when the contractual rights to receive cash flows from thefinancial instruments expire, or when the financial assets and all substantial risks and rewardsof ownership have been transferred to another party. If the Group neither transfers norretains substantially all the risks and rewards of ownership and continues to control thetransferred asset, the Group recognizes its retained interest in the asset and an associatedliability for amounts it may have to pay. If the Group retains substantially all the risks andrewards of ownership of a transferred financial asset, the Group continues to recognize thefinancial asset and also recognizes a collateralized borrowing for the proceeds received.
In certain circumstances, the Group modifies the original terms and conditions of a creditexposure to form a new loan agreement or payment schedule. The modifications can begiven depending on the borrower’s or counterparty’s current or expected financial difficulty.The modifications may include, but are not limited to, change in interest rate and terms,principal amount, maturity date, date and amount of periodic payments and accrual ofinterest and charges.
The Group derecognizes a financial asset when the terms and conditions have beenrenegotiated to the extent that, substantially, it becomes a new asset, with the differencebetween its carrying amount and the fair value of the new asset recognized as aderecognition gain or loss in profit or loss, to the extent that an impairment loss has notalready been recorded.
The Group also performs a quantitative assessment similar to that being performed formodification of financial liabilities. In performing the quantitative assessment, the Groupconsiders the new terms of a financial asset to be substantially different if the present valueof the cash flows under the new terms, including any fees paid net of any fees received anddiscounted using the original effective interest rate, is at least 10% different from the presentvalue of the remaining cash flows of the original financial asset.
When the modification of a financial asset results in the derecognition of the existingfinancial asset and the subsequent recognition of a new financial asset, the modified asset isconsidered a 'new ' financial asset. Accordingly, the date of the modification shall be treated

Summary of Significant Accounting Policies - 17 -
*SGVFS162380*
as the date of initial recognition of that financial asset when applying the impairmentrequirements to the modified financial asset. The newly recognized financial asset isclassified as Stage 1 for ECL measurement purposes, unless the new financial asset isdeemed to be originated as credit impaired (POCI). Distressed restructuring with indicationsof unlikeliness to pay are categorized as impaired accounts and are moved to Stage 3.
When the contractual cash flows of a financial asset are renegotiated or otherwise modifiedand the renegotiation or modification does not result in the derecognition of that financialasset, the Group recalculates the gross carrying amount of the financial asset as the presentvalue of the renegotiated or modified contractual cash flows discounted at the original EIR(or credit-adjusted EIR for purchased or originated credit-impaired financial assets) andrecognizes a modification gain or loss in the statement of income.
Derivative Financial InstrumentsThe Group is a counterparty to derivatives contracts, such as forwards, swaps and warrants.These contracts are entered into as a means of reducing or managing the Group’s foreignexchange and interest rate exposures as well as those of its customers.
Derivatives are initially recognized at fair value on the date on which the derivative contract isentered into and are subsequently measured at their fair values. Fair values are obtained fromquoted market prices in active markets, including recent market transactions. All derivatives arecarried as resources when fair value is positive and as liabilities when fair value is negative.
The best evidence of the fair value of a derivative at initial recognition is the transaction price(the fair value of the consideration given or received) unless the fair value of that instrument isevidenced by comparison with other observable current market transactions in the sameinstrument. When such evidence exists, which indicates a fair value different from thetransaction price, the Group recognizes a gain or loss at initial recognition.
Changes in the fair value of derivatives are recognized in the statement of income.
Financial LiabilitiesFinancial liabilities which include deposit liabilities, bills payable, notes and bonds payable, andother liabilities (except tax-related payables, pre-need reserves and post-employment definedbenefit obligation) are recognized when the Group becomes a party to the contractual terms ofthe instrument.
Financial liabilities are recognized initially at their fair value and subsequently measured atamortized cost using the effective interest method, for those with maturities beyond one year, lesssettlement payments. All interest-related charges incurred on financial liabilities are recognizedas an expense in the statement of income under Interest expense.
Deposit liabilities are stated at amounts in which they are to be paid. Interest is accruedperiodically and recognized in a separate liability account before recognizing as part of depositliabilities.
Bills payable and Notes and bonds payable are recognized initially at fair value, which is theissue proceeds (fair value of consideration received) less any issuance costs. These aresubsequently measured at amortized cost; any difference between the proceeds net of transactioncosts and the redemption value is recognized in the statement of income over the period of theborrowings using the effective interest method.

Summary of Significant Accounting Policies - 18 -
*SGVFS162380*
Derivative liabilities, which are included as part of Other Liabilities, are recognized initially andsubsequently measured at fair value with changes in fair value recognized in the statement ofincome.
Other liabilities, apart from derivative liabilities, are recognized initially at their fair value andsubsequently measured at amortized cost, using effective interest method for maturities beyondone year, less settlement payments.
Financial liabilities are derecognized from the statement of financial position only when theobligations are extinguished either through discharge, cancellation or expiration. Where anexisting financial liability is replaced by another from the same lender on substantially differentterms, or if the terms of an existing liability are substantially modified, such an exchange ormodification is treated as a derecognition of the original liability and a recognition of the newliability, and the difference in the respective carrying amounts is recognized in the statement ofincome.
Offsetting Financial InstrumentsFinancial resources and liabilities are offset and the resulting net amount, considered as a singlefinancial asset or financial liability, is reported in the statement of financial position when there isa legally enforceable right to offset the recognized amounts and there is an intention to settle on anet basis, or realize the asset and settle the liability simultaneously. The right of set-off must beavailable at the end of the reporting period, that is, it is not contingent on future event. It mustalso be enforceable in the normal course of business, in the event of default, and in the event ofinsolvency or bankruptcy; and must be legally enforceable for both entity and all counterpartiesto the financial instruments.
Bank Premises, Furniture, Fixtures and EquipmentBank premises, furniture, fixtures and equipment are carried at acquisition cost less accumulateddepreciation and amortization, and any impairment in value.
The cost of an asset comprises its purchase price and directly attributable costs of bringing theasset to working condition for its intended use. Expenditures for additions, major improvementsand renewals are capitalized, while expenditures for repairs and maintenance are charged toexpense as incurred.
Depreciation is computed on a straight-line basis over the estimated useful lives of thedepreciable assets as follows:
Buildings 25 - 50 yearsFurniture, fixtures and equipment 5 - 10 years
Leasehold rights and improvements are amortized over the term of the lease or the estimateduseful lives of the improvements of five to ten years, whichever is shorter.
An asset’s carrying amount is written down immediately to its recoverable amount if the asset’scarrying amount is greater than its estimated recoverable amount.
The residual values, estimated useful lives and method of depreciation and amortization of bankpremises, furniture, fixtures and equipment (except land) are reviewed and adjusted ifappropriate, at the end of each reporting period.

Summary of Significant Accounting Policies - 19 -
*SGVFS162380*
If a change in use requires an item of bank premises, furniture, fixtures and equipment to bereclassified to investment properties, the difference between the carrying amount of such assetand its fair value as of the date of change in use is recognized in other comprehensive income andaccumulated in equity under the Other reserves account. If the asset is subsequently retired ordisposed of, the related revaluation surplus is transferred directly to Surplus free account.
An item of bank premises, furniture, fixtures and equipment, including the related accumulateddepreciation, amortization and impairment losses, is derecognized upon disposal or when nofuture economic benefits are expected to arise from the continued use of the asset. Any gain orloss arising on derecognition of the asset (calculated as the difference between the net disposalproceeds and the carrying amount of the item) is included in the statement of income in the yearthe item is derecognized.
The Group classifies ROU assets as part of property and equipment. The Group recognizes ROUassets at the commencement date of the lease (i.e., the date the underlying asset is available foruse). ROU assets are initially measured at cost, less any accumulated depreciation andimpairment losses, and adjusted for any remeasurement of lease liabilities. The initial cost ofROU assets includes the amount of lease liabilities recognized, initial direct costs incurred, leasepayments made at or before the commencement date less any lease incentives received andestimate of costs to be incurred by the lessee in dismantling and removing the underlying asset,restoring the site on which it is located or restoring the underlying asset to the condition requiredby the terms and conditions of the lease, unless those costs are incurred to produce inventories.
Unless the Group is reasonably certain to obtain ownership of the leased asset at the end of thelease term, the recognized ROU assets are depreciated on a straight-line basis over the shorter oftheir estimated useful life and lease term. ROU assets are subject to impairment.
Investment PropertiesInvestment properties are properties held either to earn rental income or for capital appreciationor for both, but not for sale in the ordinary course of business, use in the production or supply ofgoods or services or for administrative purposes. These include parcels of land and buildings andrelated improvements acquired by the Group from defaulting borrowers.
Investment properties are measured initially at cost, including transaction costs. An investmentproperty acquired through an exchange transaction is initially measured at fair value of the assetacquired unless the fair value of such an asset cannot be measured in which case the investmentproperty acquired is measured at the carrying amount of the asset given up. Foreclosedproperties are classified under Investment properties from foreclosure date. Gain or loss fromforeclosure is included as part of Gain or loss on foreclosure account under MiscellaneousIncome section of the statement of income.
Subsequent to initial recognition, depreciable investment properties are carried at cost lessaccumulated depreciation and amortization and impairment. Depreciation is computed using thestraight line method over the useful life of 50 years and 10 years for building held for lease andother foreclosed properties, respectively. Land is carried at cost less any impairment in value.
Investment properties are derecognized when they have either been disposed of or when theinvestment property is permanently withdrawn from use and no future benefit is expected fromits disposal. Any gains or losses on the retirement or disposal of an investment property arerecognized in the statement of income in the year of retirement or disposal. Expendituresincurred after the investment properties have been put into operations, such as repairs and

Summary of Significant Accounting Policies - 20 -
*SGVFS162380*
maintenance costs and real estate taxes, are normally charged against income in the period inwhich costs are incurred.
Transfers are made to investment properties when, and only when, there is a change in useevidenced by ending of owner occupation, commencement of an operating lease to another partyor ending of construction or development. Transfers are made from investment properties when,and only when, there is a change in use evidenced by commencement of owner occupation orcommencement of development with a view to sale.
Intangible AssetsIntangible assets include goodwill and acquired computer software. Goodwill represents theexcess of the acquisition cost over the fair value of the net identifiable assets arising from theacquisition of a business. Goodwill has indefinite useful life and, thus, not subject toamortization but requires an annual test for impairment. Goodwill is subsequently carried at costless accumulated impairment losses.
Goodwill is allocated to cash-generating units for the purpose of impairment testing. Goodwillsometimes cannot be allocated on a non-arbitrary basis to individual cash-generating units, butonly to groups of cash-generating units. As a result, the lowest level within the Group at whichgoodwill is monitored for internal management purposes sometimes comprises a number of cash-generating units. The Group’s cash-generating unit represents major business segments of theParent Bank and the subsidiaries of the Group.
Computer software used in administration is accounted for under the cost model. The cost of theasset is the amount of cash or cash equivalents paid or the fair value of the other considerationsgiven up to acquire an asset at the time of its acquisition or production.
Computer software are capitalized on the basis of the costs incurred to acquire, develop, andinstall the specific software. These costs are amortized on a straight-line basis over the expecteduseful lives ranging from five to ten years, as the lives of these intangible assets are consideredfinite. These costs are recognized as part of Depreciation and amortization in the statement ofincome. Costs associated with maintaining computer software are expensed as incurred. Inaddition, intangible assets are subject to impairment testing.
When an intangible asset is disposed of, the gain or loss on disposal is determined as thedifference between the proceeds and the carrying amount of the asset and is recognized in thestatement of income.
Other ResourcesOther resources pertain to resources controlled by the Group as a result of past events. These arerecognized in the financial statements only if recognition of that asset and of any resultingincome or expenses is a faithful representation of the resources and provides relevant informationabout the resources.
Provisions and ContingenciesProvisions are recognized when present obligations will probably lead to an outflow of economicresources and they can be estimated reliably even if the timing or amount of the outflow may stillbe uncertain. A present obligation arises from the presence of a legal or constructive obligationthat has resulted from past events (e.g., legal dispute or onerous contracts).

Summary of Significant Accounting Policies - 21 -
*SGVFS162380*
Provisions are measured at the estimated expenditure required to settle the present obligation,based on the most reliable evidence available at the end of the reporting period, including therisks and uncertainties associated with the present obligation. Any reimbursement expected to bereceived in the course of settlement of the present obligation is recognized, if virtually certain asa separate asset, at an amount not exceeding the balance of the related provision. Where there area number of similar obligations, the likelihood that an outflow will be required in settlement isdetermined by considering the class of obligations as a whole. When time value of money ismaterial, long-term provisions are discounted to their present values using a pretax rate thatreflects market assessment and the risks specific to the obligation. The increase in the provisiondue to passage of time is recognized as interest expense. Provisions are reviewed at the end ofeach reporting period and adjusted to reflect the current best estimate.
In those cases where the possible outflow of economic resource as a result of present obligationsis considered improbable or remote, or the amount to be provided for cannot be measuredreliably, no liability is recognized in the financial statements. Similarly, possible inflows ofeconomic benefits that do not yet meet the recognition criteria of an asset are consideredcontingent assets, hence, are not recognized in the financial statements.
Pre-Need Reserves and Insurance Premium Reserves
(a) Pre-need Reserves
In the Group’s consolidated financial statements, pre-need reserves (PNR), presented as partof Other liabilities in the consolidated statement of financial position, are recognized for allpre-need benefits guaranteed and payable by FUPI as defined in the pre-need pension plancontracts.
PNR for pension plans are determined using the requirements on provisioning of PAS 37 andthe specific method of computation required by the Insurance Commission (IC) as describedbelow.
The amount recognized as a provision to cover the PNR is the best estimate of theexpenditure required to settle the present obligation at the end of the reporting period. Therisks and uncertainties that inevitably surround many events and circumstances were takeninto account in reaching the best estimate of a provision.
PNR is computed based on the following considerations:
On actively paying plans, provision is equivalent to the present value of future planbenefits reduced by the present value of future trust fund contributions required perproduct model discounted using the transitory discount rate which does not exceed thelower of the attainable rate as certified by the Trustee, and the discount rate prescribed bythe IC in accordance with IC Circular Letter No. 23-2012, Valuation of TransitoryPre-need Reserves, for old basket of plans previously approved by the SEC.
On lapsed plans, provision is equivalent to the present value of future plan benefitsreduced by the present value of future trust fund contributions at lapse date, multiplied bythe reinstatement rate.
On fully paid plans, provision is equivalent to the present value of future plan benefitsdiscounted using the transitory discount rate.

Summary of Significant Accounting Policies - 22 -
*SGVFS162380*
Future events that may affect the foregoing amounts are reflected in the amount of theprovision for PNR where there is sufficient objective evidence that they will occur.
The rates of surrender, cancellation, reinstatement, utilization and inflation, whenapplied, represent the actual experience of FUPI in the last three years, or the industry, inthe absence of a reliable experience.
The probability of pre-termination or surrender of fully paid plans are considered indetermining the PNR of fully paid plans. A pre-termination experience on fully paidplans of 5% and below are considered insignificant. In such cases, derecognition ofliability shall be recorded at pre-termination date.
The computation of the foregoing assumptions is validated by the IC-accredited actuaryof FUPI.
Any excess in the amount of the trust fund as a result of the revised reservingrequirement shall neither be released from the fund nor be credited/set-off to futurerequired contributions.
(b) Insurance Premium Reserves
Insurance premium reserves for pension plans represents FUPI’s actuarially-determinedliability in accordance with PAS 37 to guarantee the benefits provided in the plan inconsideration of the insurance premium funds assigned for this purpose as determined andcertified by the IC-accredited actuary.
Capital FundsCommon stock represents the nominal value of shares that have been issued.
Additional paid-in capital includes any premiums received on the issuance of common stock.Any transaction costs associated with the issuance of shares are deducted from additional paid-incapital, net of any related income tax benefits.
Surplus free includes all current and prior period results as reported in the statement of incomeand which are available and not restricted for use by the Group, reduced by the amounts ofdividend declared, if any.
Surplus reserves pertains to the following:
(a) Portion of the Group’s income from trust operations set-up on a yearly basis in compliancewith BSP regulations. The surplus set-up is equal to 10% of the net profit accruing from thetrust business until the surplus shall amount to 20% of authorized capital stock. The reserveshall not be paid out as dividends, but losses accruing in the course of the trust business maybe charged against this account.
(b) Accumulated trust fund income of FUPI that is automatically restricted to payments ofbenefits of planholders and releases from appropriation representing the amounts of trustfund income that pertains to the matured and pre-terminated plans of planholders which havebeen withdrawn from the trust fund during the year, in accordance with the amended Pre-need Uniform Chart of Accounts (PNUCA).

Summary of Significant Accounting Policies - 23 -
*SGVFS162380*
(c) The difference of the 1% required General Loan Loss Provision on Stage 1 on-balance sheetloans over the computed allowance for credit losses on Stage 1 accounts as required by theBSP Circular No. 1011 - Guidelines on the Adoption of the Philippine Financial ReportingStandard (PFRS) 9 - Financial Instruments.
Net unrealized fair value gains (losses) on investment securities pertains to cumulativemark-to-market valuation of financial assets at FVOCI.
Remeasurements of defined benefit plan refer to accumulated actuarial losses, net of gains, as aresult of remeasurements of post-employment defined benefit plan and return on plan assets(excluding amount included in net interest).
Other reserves pertains to exchange differences arising from the translation of the Parent Bank’sForeign Currency Deposit Unit (FCDU) operations and UBX SG, which is taken to the statementof comprehensive income.
Non-controlling interests represent the portion of the net resources and profit or loss notattributable to the Group which are presented separately in the Group’s statement of income andwithin the capital funds in the Group’s statements of financial position and changes in capitalfunds.
Revenue Recognition
Revenue from contracts with customers is recognised when control of the goods or services aretransferred to the customer at an amount that reflects the consideration to which the Groupexpects to be entitled in exchange for those goods or services. Expenses are recognized in thestatement of income upon utilization of the resources or services or at the date these are incurred.All finance costs are reported on an accrual basis. The following specific recognition criteria ofincome and expenses must also be met before income or expense is recognized:
(a) Interest income recognized using the effective interest rate method - Interest income isrecognized in the statement of income for all instruments measured at amortized cost anddebt instruments classified as financial assets at FVOCI using the effective interest method.
The effective interest method is a method of calculating the amortized cost of a financialasset or a financial liability and of allocating the interest income or interest expense over therelevant period. The effective interest rate is the rate that exactly discounts estimated futurecash payments or receipts through the expected life of the financial instrument or, whenappropriate, a shorter period to the net carrying amount of the financial asset or financialliability. When calculating the effective interest rate, the Group estimates cash flowsconsidering all contractual terms of the financial instrument but does not consider futurecredit losses. The calculation includes all fees paid or received between parties to thecontract that are an integral part of the effective interest rate, transaction costs and all otherpremiums or discounts.
(b) Other interest income - Interest income on all trading assets and financial assets mandatorilyrequired to be measured at FVTPL is recognized using the contractual interest rate and isincluded under Interest Income on financial assets at fair value through profit or loss.
(c) Service charges, fees and commissions - Service charges, fees and commissions are generallyrecognized when the service has been provided. Loan commitment fees are earned asservices are provided, recognized as other income on a time proportion basis over thecommitment period.

Summary of Significant Accounting Policies - 24 -
*SGVFS162380*
The Group has a loyalty points programme as part of its credit cards business which allowscustomers to accumulate points that can be redeemed for free products. The loyalty pointsgive rise to a separate performance obligation as they provide a material right to thecustomer.
A portion of the interchange fee is allocated to the loyalty points awarded to customers basedon relative stand-alone selling price and recognised as a contract liability until the points areredeemed. Revenue is recognised upon redemption of products by the customer.
(d) Gain (loss) on trading and investment securities - Gain (loss) on trading and investmentsecurities is recognized when the contractual rights on the securities is transferred to thebuyer (at an amount equal to the difference of the selling price and the carrying amount ofsecurities) and as a result of the mark-to market valuation of outstanding securities classifiedas FVTPL at year-end.
(e) Miscellaneous income includes the following accounts:
Commissions earned on credit cards - Commissions earned on credit cards arerecognized as income upon receipt from member establishments of charges arising fromcredit availments by credit cardholders. These commissions are computed based oncertain agreed rates and are deducted from amounts remittable to memberestablishments. Purchases by the credit cardholders, collectible on installment basis, arerecorded at the cost of the items purchased. Interest income is recognized on every termof installment billed to the cardholders and computed using the effective interest method.
Gain (loss) from assets sold or exchanged - Profit or loss from assets sold or exchangedis recognized when the control of the assets is transferred to the buyer or when thecollectibility of the entire sales price is reasonably assured.
Rental - Rental income arising from leased properties is accounted for on a straight-linebasis over the lease terms on ongoing leases.
Income from bancassurance business - Exclusive access fee (EAF) related to thebancassurance partnership is recognized as revenue by reference to the completion rateof the target cumulative annualized premium earned.
Dividend - Dividend income is recognized when the Group’s right to receive payment isestablished.
Income from trust operations - Trust fees related to investment funds are recognized inreference to the net asset value of the funds. The same principle is applied for wealthmanagement, financial planning and custody services that are continuously provided overan extended period of time.
LeasesThe Group assesses at contract inception whether a contract is, or contains, a lease. That is, if thecontract conveys the right to control the use of an identified asset for a period of time inexchange for consideration.

Summary of Significant Accounting Policies - 25 -
*SGVFS162380*
The Group as Lessee accounts for its leases as follows:
Group as LessorLeases, which do not transfer to the lessee substantially all the risks and benefits of ownership ofthe asset, are classified as operating leases. Lease income from operating leases is recognized asincome in the statement of income on a straight-line basis over the lease term.
The Group determines whether an arrangement is, or contains a lease based on the substance ofthe arrangement. It makes an assessment of whether the fulfilment of the arrangement isdependent on the use of a specific asset or assets and the arrangement conveys a right to use theasset.
Group as a lessee
The Group applies a single recognition and measurement approach for all leases, except forshort-term leases and leases of low-value assets. The Group recognizes lease liabilities to makelease payments and ROU assets representing the right to use the underlying assets.
i. Right-of-use assets
The Group recognizes ROU assets at the commencement date of the lease (i.e., the date theunderlying asset is available for use). ROU assets are measured at cost, less any accumulateddepreciation and impairment losses, and adjusted for any remeasurement of lease liabilities.The cost of ROU assets includes the amount of lease liabilities recognized, initial direct costsincurred, and lease payments made at or before the commencement date less any leaseincentives received.
ii. Lease liabilities
At the commencement date of the lease, the Group recognizes lease liabilities measured atthe present value of lease payments to be made over the lease term. The lease paymentsinclude fixed payments (including in-substance fixed payments) less any lease incentivesreceivable, variable lease payments that depend on an index or a rate, and amounts expectedto be paid under residual value guarantees. The lease payments also include the exerciseprice of a purchase option reasonably certain to be exercised by the Group and payments ofpenalties for terminating a lease, if the lease term reflects the Group exercising the option toterminate. Variable lease payments that do not depend on an index or a rate are recognizedas expense (unless they are incurred to produce inventories) in the period on which the eventor condition that triggers the payment occurs.
In calculating the present value of lease payments, the Group uses its incremental borrowingrate at the lease commencement date because the interest rate implicit in the lease is notreadily determinable. After the commencement date, the amount of lease liabilities isincreased to reflect the accretion of interest recognized under Interest expense of billspayable and other liabilities and reduced for the lease payments made. In addition, thecarrying amount of lease liabilities is remeasured if there is a modification, a change in thelease term, a change in the lease payments (e.g., changes to future payments resulting from achange in an index or rate used to determine such lease payments) or a change in theassessment of an option to purchase the underlying asset.
iii. Short-term leases and leases of low-value assets
The Group applies the short-term lease recognition exemption to its short-term leases forsome branches and the related parking spaces, stalls used for specific events and severaloffice equipment (i.e., those leases that have a lease term of 12 months or less from thecommencement date and do not contain a purchase option). It also applies the lease of low-

Summary of Significant Accounting Policies - 26 -
*SGVFS162380*
value assets recognition exemption to leases of ATM offsite locations, signages and severalitems of office equipment that are considered of low value (i.e. P=250,000 and below). Leasepayments on short-term leases and leases of low-value assets are recognized as expense on astraight-line basis over the lease term as is recognized as part of ‘Occupancy’ in the statementof income.
Foreign Currency Transactions and TranslationsThe accounting records of the Group are maintained in Philippine pesos except for the FCDU ofthe Parent Bank which are maintained in United States (U.S.) dollars. Foreign currencytransactions during the period are translated into the functional currency at exchange rates whichapproximate those prevailing on transaction dates.
For financial reporting purposes, the accounts of the FCDU are translated into their equivalents inPhilippine pesos based on the Philippine Dealing System closing rates (PDSCR) prevailing at theend of the period (for resources and liabilities) and at the average PDSCR for the period (forincome and expenses).
Foreign exchange gains and losses resulting from the settlement of foreign currency transactionsand from the translation at period-end exchange rates of monetary assets and liabilitiesdenominated in foreign currencies are recognized in the statement of income.
Changes in the fair value of monetary financial assets denominated in foreign currency areanalyzed between translation differences resulting from changes in the amortized cost of thesecurity and other changes in the carrying amount of the security. Translation differences relatedto changes in amortized cost are recognized in the statement of income, and other changes in thecarrying amount are recognized in other comprehensive income.
Impairment of Non-financial AssetsThe Group’s intangible assets (consisting of goodwill and computer software recorded as part ofOther resources), bank premises, furniture, fixtures and equipment, investment properties,investments in subsidiaries (for Parent Bank only) and other non-financial assets are subject toimpairment testing. Intangible assets with an indefinite useful life, such as goodwill, are testedfor impairment at least annually. All other individual assets or cash-generating units are testedfor impairment whenever events or changes in circumstances indicate that the carrying amountmay not be recoverable.
For purposes of assessing impairment, assets are grouped at the lowest levels for which there areseparately identifiable cash flows (cash-generating units). As a result, some assets are testedindividually for impairment and some are tested at cash-generating unit level.
Impairment loss is recognized in the statement of income for the amount by which the asset’s orcash-generating unit’s carrying amount exceeds its recoverable amount, which is the higher offair value, reflecting market conditions, less costs to sell and value in use. In determining valuein use, management estimates the expected future cash flows from each cash-generating unit anddetermines the suitable interest rate in order to calculate the present value of those cash flows.The data used for impairment testing procedures are directly linked to the Group’s latestapproved budget, adjusted as necessary to exclude the effects of asset enhancements. Discountfactors are determined individually for each cash-generating unit and reflect management’sassessment of respective risk profiles, such as market and asset-specific risk factors.

Summary of Significant Accounting Policies - 27 -
*SGVFS162380*
All assets are subsequently reassessed for indications that an impairment loss previouslyrecognized may no longer exist and the carrying amount of the asset is adjusted to therecoverable amount resulting in the reversal of the impairment loss, except for goodwill.
Employee BenefitsThe Group’s employment benefits to employees are as follows:
(a) Post-employment Defined Benefit Plan
A defined benefit plan is a post-employment plan that defines an amount of post-employmentbenefit that an employee will receive on retirement, usually dependent on one or more factorssuch as age, years of service and salary. The legal obligation for any benefits from this kindof post-employment plan remains with the Group, even if plan assets for funding the definedbenefit plan have been acquired. Plan assets may include assets specifically designated to along-term benefit fund, as well as qualifying insurance policies. The Group’s defined benefitpost-employment plan covers all regular full-time employees. The pension plan istax-qualified, noncontributory and administered by a trustee.
The liability recognized in the statement of financial position for a defined benefit plan(included as part of Other Liabilities) is the present value of the defined benefit obligation(DBO) at the end of the reporting period less the fair value of plan assets. The DBO iscalculated annually by independent actuaries using the projected unit credit method. Thepresent value of the DBO is determined by discounting the estimated future cash outflowsarising from expected benefit payments using a discount rate derived from the interest ratesof a zero coupon government bond as published by Philippine Dealing & Exchange Corp.,that are denominated in the currency in which the benefits will be paid and that have terms tomaturity approximating to the terms of the related post-employment liability.
Remeasurements, comprising of actuarial gains and losses arising from experienceadjustments and changes in actuarial assumptions and the return on plan assets (excludingamount included in net interest) are reflected immediately in the statement of financialposition with a charge or credit recognized in other comprehensive income in the period inwhich they arise. Net interest is calculated by applying the discount rate at the beginning ofthe period to the net defined benefit liability or asset and is included as part of Interestexpense or Interest income in the statement of income.
Past-service costs are recognized immediately in the statement of income in the period of aplan amendment or curtailment.
(b) Post-employment Defined Contribution Plan
A defined contribution plan is a post-employment plan under which the Group pays fixedcontributions into an independent entity, such as the Social Security System. The Group hasno legal or constructive obligations to pay further contributions after payment of the fixedcontribution. The contributions recognized in respect of defined contribution plans areexpensed as they fall due. Liabilities and assets may be recognized if underpayment orprepayment has occurred.
(c) Termination Benefits
Termination benefits are payable when employment is terminated by the Group before thenormal retirement date, or whenever an employee accepts voluntary redundancy in exchangefor these benefits. The Group recognizes termination benefits at the earlier of when it can nolonger withdraw the offer of such benefits and when it recognizes costs for a restructuringthat is within the scope of PAS 37 and involves the payment of termination benefits. In the

Summary of Significant Accounting Policies - 28 -
*SGVFS162380*
case of an offer made to encourage voluntary redundancy, the termination benefits aremeasured based on the number of employees expected to accept the offer. Benefits fallingdue more than 12 months after the end of the reporting period are discounted to their presentvalue.
(d) Profit-Sharing and Bonus Plans
The Group recognizes a liability and an expense for bonuses and profit-sharing, based on aformula that takes into consideration the profit attributable to the Parent Bank’s shareholders,as indicated in the statement of income, after certain regulatory adjustments. The Grouprecognizes a provision where it is contractually obliged to pay the bonus plans. The Groupalso recognizes a provision for profit-sharing and bonus plans where there is a past practicethat has created a constructive obligation, whether paid in cash or in the form of shares of theParent Bank to be issued under the Employee Stock Plan.
(e) Compensated Absences
Compensated absences are recognized for the number of paid leave days (including holidayentitlement) remaining at the end of the reporting date.
They are included as part of Accrued taxes and other expenses under the Other liabilitiesaccount in the statement of financial position at the undiscounted amount that the Groupexpects to pay as a result of the unused entitlement.
Income TaxesTax expense recognized in the statement of income comprises the sum of deferred tax and currenttax not recognized in other comprehensive income or directly in capital funds, if any.
Current tax assets or liabilities comprise those claims from, or obligations to, fiscal authoritiesrelating to the current or prior reporting period, that are uncollected or unpaid at the end of thereporting period. They are calculated using the tax rates and tax laws applicable to the fiscalperiods to which they relate, based on the taxable profit for the year. All changes to current taxassets or liabilities are recognized as a component of tax expense in the statement of income.Management periodically evaluates positions taken in the tax returns with respect to situations inwhich applicable tax regulations are subject to interpretations and establishes provisions whereappropriate.
Deferred tax is accounted for using the liability method on temporary differences at the end ofthe reporting period between the tax base of assets and liabilities and their carrying amounts forfinancial reporting purposes. Under the liability method, with certain exceptions, deferred taxliabilities are recognized for all taxable temporary differences and deferred tax assets arerecognized for all deductible temporary differences and the carryforward of unused tax losses andunused tax credits to the extent that it is probable that taxable profit will be available againstwhich the deferred tax assets can be utilized. Unrecognized deferred tax assets are reassessed atthe end of each reporting period and are recognized to the extent that it has become probable thatfuture taxable profit will be available to allow such deferred tax assets to be recovered.
Deferred tax assets and liabilities are measured at the tax rates that are expected to apply to theperiod when the asset is realized or the liability is settled, based on tax rates and tax laws thathave been enacted or substantively enacted at the end of the reporting period.
The carrying amount of deferred tax assets is reviewed at the end of each reporting period andreduced to the extent that it is probable that sufficient taxable profit will be available to allow allor part of the deferred tax assets to be utilized.

Summary of Significant Accounting Policies - 29 -
*SGVFS162380*
The measurement of deferred tax liabilities and assets reflects the tax consequences that wouldfollow from the manner in which the Group expects, at the end of the reporting period, to recoveror settle the carrying amount of its assets and liabilities.
Most changes in deferred tax assets or liabilities are recognized as a component of tax expense inthe statement of income, except to the extent that it relates to items recognized in othercomprehensive income or directly in capital funds. In this case, the tax is also recognized inother comprehensive income or directly in capital funds, respectively.
Deferred tax assets and deferred tax liabilities are offset if the Group has a legally enforceableright to set off current tax assets against current tax liabilities and the deferred taxes relate to thesame entity and the same taxation authority.
Related Party Relationships and TransactionsRelated Party Transactions are transactions or dealings with related parties, regardless of whethera price is charged. These covers all types of transactions both on and off-balance sheet andregardless of which side of the transaction/deal of the bank is acting.
Parties are said to be related if one has direct or indirect control as well as significant influenceover the other. Related Parties of the Bank include, but is not limited to: (a) DOSRI, subsidiaries,affiliates, and any party that directly or indirectly has control over or is subjected to the control ofthe Bank as well as those with direct and indirect linkages to it, (b) the Bank's and its affiliatedcompanies' directors, officers, stockholders, and their related interests and close family members,and (c) other persons and juridical entities whose interests may pose potential conflict with theBank.
In considering each possible related party relationship, attention is directed to the substance ofthe relationship and not merely on the legal form.
Earnings Per ShareBasic earnings per share are determined by dividing the net profit for the year attributable tocommon shareholders by the weighted average number of common shares outstanding during theyear, after retroactive effect to any stock dividends declared in the current year.
Diluted earnings per common share are also computed by dividing net profit by the weightedaverage number of common shares subscribed and outstanding at the end of the reporting period,after making adjustments to reflect the effects of any potentially dilutive preferred shares, stockoptions and warrants.
Trust and Fiduciary ActivitiesThe Group commonly acts as trustee and in other fiduciary capacities that result in the holding orplacing of assets on behalf of individuals, trusts, retirement benefit plans and other institutions.These resources and the related income arising thereon are excluded from these financialstatements, as they are neither resources nor income of the Group.
Segment ReportingOperating segments are reported in a manner consistent with the internal reporting provided tothe Group’s chief operating decision-maker. The chief operating decision-maker is responsiblefor allocating resources and assessing performance of the operating segments.

Summary of Significant Accounting Policies and
Summary of Accounting Judgments and Estimates - 30 -
*SGVFS162380*
In identifying its operating segments, management generally follows the Group’s products andservices as disclosed in Note 6, which represent the main products and services provided by theGroup.
Each of these operating segments is managed separately as each of these services requiredifferent technologies and other resources as well as marketing approaches. All inter-segmenttransfers are carried out at arm’s length prices.
The measurement policies the Group uses for segment reporting under PFRS 8, Operating
Segments, are the same as those used in its consolidated financial statements in arriving at theoperating profit of the operating segments.
In addition, corporate assets which are not directly attributable to the business activities of anyoperating segment are not allocated to a particular segment.
There have been no changes from prior periods in the measurement methods used to determinereported segment profit or loss.
The Group’s operations are organized according to the nature of the products and servicesprovided. Financial information on business segments is presented in Note 6.
Events After the End of the Reporting PeriodAny post-year-end event that provides additional information about the Group’s position at thestatement of financial position date (adjusting event) is reflected in the financial statements.Post-year-end events that are not adjusting events, if any, are disclosed when material to thefinancial statements.
3. Summary of Accounting Judgments and Estimates
The preparation of the Group’s financial statements in accordance with PFRS requiresmanagement to make judgments and estimates that affect the amounts reported in the financialstatements and related notes. Judgments and estimates are continually evaluated and are basedon historical experience and other factors, including expectations of future events that arebelieved to be reasonable under the circumstances. Actual results may ultimately differ fromthese estimates.
Unless otherwise stated, below significant judgments and estimates apply as of December 31,2021 and 2020 and for each of the three years in the period ended December 31, 2021.

Summary of Accounting Judgments and Estimates - 31 -
*SGVFS162380*
Critical Management Judgments in Applying Accounting PoliciesIn the process of applying the Group’s accounting policies, management has made the followingjudgments, apart from those involving estimation, which have the most significant effect on theamounts recognized in the financial statements:
Evaluation of business model in managing financial instrumentsThe Group manages its financial assets based on business models that maintain adequate level offinancial assets to match its expected cash outflows, largely arising from customers’ withdrawalsand continuing loan disbursements to borrowers, while maintaining a strategic portfolio offinancial assets for investment and trading activities consistent with its risk appetite.
In determining the classification of a financial instrument under PFRS 9, the Group developedbusiness models which reflect how it manages its portfolio of financial instruments. The Group’sbusiness models need not be assessed at entity level or as a whole but applied at the level of aportfolio of financial instruments (i.e., group of financial instruments that are managed togetherby the Group) and not on an instrument-by-instrument basis (i.e., not based on intention orspecific characteristics of individual financial instrument). The Group evaluates in whichbusiness model a financial instrument or a portfolio of financial instruments belong to taking intoconsideration the objectives of each business model established by the Group.
PFRS 9 emphasizes that if more than an infrequent and more than an insignificant sale is madeout of a portfolio of financial assets carried at amortized cost, an entity should assess whether andhow such sales are consistent with the objective of collecting contractual cash flows. In makingthis judgment, the Group considers certain circumstances documented in its business modelmanual to assess that an increase in the frequency or value of sales of financial instruments in aparticular period is not necessarily inconsistent with a held-to-collect business model if the Groupcan explain the reasons for those sales and why those sales do not reflect a change in the Group’sobjective for the business model.
In December 2020, the BOD of the Parent Bank approved to sell a third of the securities fromHTC FCDU subportfolio. The BOD also approved for the Parent Bank to be ready to sell theremaining securities under this HTC subportfolio to strengthen the financial position of theParent Bank for the expected effects of the Covid 19 pandemic and increase capital allocation toclient based business i.e. lending business. The Parent Bank assessed that these changesrepresent change in intention for the securities under the HTC FCDU subportfolio as a responseto the current and expected changes in market conditions and did not constitute a change in thebusiness model under PFRS 9. In 2021, the Parent Bank sold investment securities under theHTC FCDU sub portfolio with carrying amount of P=47.4 billion, resulting in Gain on sale ofinvestment securities at amortized cost totaling P=8.5 billion. The carrying amounts of theremaining Investment securities at amortized cost in the FCDU subportfolio amounted toP=32.5 billion and P=76.6 billion, while fair values amounted to P=33.5 billion and P=98.9 billion, asof December 31, 2021 and 2020, respectively.
In 2020, the Parent Bank sold investment securities classified as Investment securities atamortized cost with total carrying amount of P=57.8 billion, resulting in Gain on sale ofinvestment securities at amortized cost totaling P=5.1 billion. These sales were made in responseto regulatory changes and unanticipated significant changes in the current market conditionswhich the Parent Bank assessed to have significant impact on its operations. Certain investmentswere sold in order to shorten the duration of financial assets and reduce interest rate risk of theParent Bank necessary as a response to significant changes in current market conditions.

Summary of Accounting Judgments and Estimates - 32 -
*SGVFS162380*
The Parent Bank has assessed that the sales in 2021 and 2020 do not reflect a change in thebusiness model of the Group. Accordingly, the remaining investment securities in the affectedhold-to-collect subportfolio are continued to be measured at amortized cost.
Testing the cash flow characteristics of financial assets
In determining the classification of financial assets under PFRS 9, the Group assesses whetherthe contractual terms of the financial assets give rise on specified dates to cash flows that areSPPI on the principal outstanding, with interest representing time value of money and credit riskassociated with the principal amount outstanding. The assessment as to whether the cash flowsmeet the test is made in the currency in which the financial asset is denominated. Any othercontractual term that changes the timing or amount of cash flows (unless it is a variable interestrate that represents time value of money and credit risk) does not meet the amortized cost criteria.In cases where the relationship between the passage of time and the interest rate of the financialinstrument may be imperfect, known as modified time value of money, the Group assesses themodified time value of money feature to determine whether the financial instrument still meetsthe SPPI criterion. The objective of the assessment is to determine how different theundiscounted contractual cash flows could be from the undiscounted cash flows that would ariseif the time value of money element was not modified (the benchmark cash flows). If theresulting difference is significant, the SPPI criterion is not met.
In view of this, the Group considers the effect of the modified time value of money element ineach reporting period and cumulatively over the life of the financial instrument
Determining the lease term of contracts with renewal and termination options - Group as lessee
The Group determines the lease term as the non-cancellable term of the lease, together with anyperiods covered by an option to extend the lease if it is reasonably certain to be exercised, or anyperiods covered by an option to terminate the lease, if it is reasonably certain not to be exercised.
The Group has several lease contracts that include extension and termination options. The Groupdetermined that generally, the options to extend or terminate the lease are not included in thedetermination of the lease term. These optional periods are not enforceable, as the Group cannotenforce the extension of the lease without the agreement from the lessor, and therefore, the Groupdoes not have the right to use the asset beyond the non-cancellable period.
Key Sources of Estimation UncertaintyThe following are the key assumptions concerning the future, and other key sources of estimationuncertainty at the end of the reporting period, that have a significant risk of causing a materialadjustment to the carrying amounts of assets and liabilities within the next reporting period:
Estimation of impairment losses on Loans and other receivables, Financial assets at amortized
cost and Financial assets at FVOCI
The measurement of impairment losses under PFRS 9 across all categories of financial assetsrequires judgment, in particular, the estimation of the amount and timing of future cash flows andcollateral values when determining impairment losses and the assessment of a significantincrease in credit risk. These estimates are driven by a number of factors, changes in which canresult in different levels of allowances.

Summary of Accounting Judgments and Estimates - 33 -
*SGVFS162380*
The Group’s ECL calculations are outputs of complex models with a number of underlyingassumptions regarding the choice of variable inputs and their interdependencies. Significantfactors affecting the estimates on the ECL model include:
The Group’s internal grading model, which assigns PDs to individual grades. In 2021 and2020, account level and portfolio credit risk rating assessments, which considered howclients are being affected by and are responding to COVID-19- related challenges, have beenapplied to the scorecards. Sensitivities were applied to consider uncertainties on availableeconomic forecasts.
The Group’s criteria for assessing if there has been a SICR is the basis for measuringallowances for financial assets on a Lifetime Expected Credit Loss (LTECL). There are alsoqualitative assessments to consider significant increase in credit risk based on the identifiedrisk profiles of their accounts and portfolios.
The Group’s definition of default, which considers the regulatory requirement and the Bank’sindicators of loss events.
In 2021 and 2020, the accounts are further segmented, and the Group identified specificaccounts and portfolios that are considered severely affected by the challenges related toCOVID-19.
Development of ECL models, including the various formulas and the choice of inputs.Similar to prior years including 2021, models have been reviewed and revised as appropriatebased on latest reviews, economic outlook, and studies from external sources.
Determination of associations between macroeconomic scenarios and economic inputs, suchas unemployment levels, level of government spending, and collateral values, and their effecton PDs, EADs and LGDs. As the pandemic progresses, lockdown measures were imposedand public health policy changed, the macroeconomic associations were reviewed in-depthand updated frequently. Because of the uncertainties surrounding the business landscapeduring the period, the quantitative overlays were complemented by experience-based expertjudgment inputs through management discretion overlays considered integral to thesystematic process.
The carrying amount of loans and other receivables and the related allowance are disclosed inNotes 14 and 20, while the carrying amount of debt financial assets classified under amortizedcost and fair value through other comprehensive income and the related allowances are disclosedin Notes 12 and 20.
Fair value of derivatives
Management applies valuation techniques to determine the fair value of derivatives that are notquoted in active markets. This requires management to develop estimates and assumptions basedon market inputs, using observable data that market participants would use in pricing theinstrument. Where such data is not observable, management uses its best estimate. Estimatedfair values of financial instruments may vary from the actual prices that would be achieved in anarm’s length transaction at the reporting date.
Valuation techniques are used to determine fair values which are validated and periodicallyreviewed. To the extent practicable, models use observable data, however, areas such as creditrisk (both own and counterparty), volatilities and correlations require management to makeestimates. Changes in assumptions could affect reported fair value of financial instruments.The Group uses judgment to select a variety of methods and make assumptions that are mainlybased on market conditions existing at the end of each reporting period.
The fair values of derivatives as of December 31, 2021 and 2020 are presented and grouped intothe fair value hierarchy in Note 7.

Summary of Accounting Judgments and Estimates - 34 -
*SGVFS162380*
Recognition of deferred tax assets
Deferred tax assets are recognized for all unused tax losses and temporary differences to theextent that it is probable that future taxable profit will be available against which the losses canbe utilized. Significant management judgment is required to determine the amount of deferredtax assets that can be recognized, based upon the likely timing and level of future taxable incometogether with future tax planning strategies.
As of December 31, 2021, the Group recognized deferred tax assets amounting to P=7.05 billion,including the Parent Bank’s deferred tax assets amounting to P=1.03 billion related to NOLCOwhich can be carried as a deduction from gross income from taxable years 2022 to 2026 andP=0.59 billion related to MCIT which can be applied against corporate income tax liability, untiltaxable years 2022 to 2024. Based on management forecast, management assessed that it isprobable that future taxable income will be available to utilize these deferred tax assets.
Based on forecast, management assessed that it is probable that future taxable income will beavailable to utilize the deferred tax assets. The carrying value of recognized deferred tax assets isdisclosed in Note 30.
Impairment of goodwill
The Group conducts an annual review for any impairment in the value of goodwill. Goodwill iswritten down for impairment where the recoverable amount of the related CGU is insufficient tosupport its carrying value. The Group determines the recoverable value of goodwill bydiscounting the estimated excess earnings using the weighted-average cost of capital (WACC) asthe discount rate. The Group estimates the discount rate used for the computation of the netpresent value by reference to industry cost of capital.
The recoverable amount of the CGU is determined based on a value-in-use calculation using cashflow projections from financial budgets covering a five-year period. Financial budget for theimmediately succeeding year is approved by senior management and BOD of the Parent Bank,while the financial budgets for the other years of cash flow projections are determined bycorporate planning group and the relevant business units. In 2021, the key assumptions used inthe calculation of value-in-use, including loan and deposit growth rates, net interest margin, havebeen updated to consider the effect of the pandemic. The discount rates used for the computationof the value in use for various CGUs (see Note 18) are based on the pre-tax discount ratesranging from 9.12% to 11.91% and from 6.69% to 11.10% as of December 31, 2021 and 2020,respectively. The long-term growth rates used range from nil to 11.2%as of December 31, 2021and 2020.
As a result of the ongoing economic uncertainty brought about by the COVID-19 pandemic, theresults of the motorcycle lending business was lower than expected. The volume of loan releaseswas lower and the motorcycle loans reported higher NPLs, indicating a potential impairment ofgoodwill.
This setback on the business plans for motorcycle lending business resulted in the recognition ofimpairment of goodwill on CSB’s motorcycle loan business amounting to P=529.60 million andP=223.17 million for the years ended December 31, 2021 and 2020, respectively, related to a CGUwhere the calculated value in use is below the carrying amount, while the other remaining CGUsremain unimpaired. The impairment charge is recorded under Miscellaneous expenses in thestatement of income.
Though management believes that the assumptions used in the estimation of fair values reflectedin the financial statements are appropriate and reasonable, significant changes in theseassumptions may materially affect the assessment of recoverable values and any resultingimpairment loss could have a material adverse effect on the results of operations.

Summary of Accounting Judgments and Estimates and
Risk Management Objectives and Policies - 35 -
*SGVFS162380*
The carrying amount of goodwill is disclosed in Note 18.
Valuation of post-employment and other benefits
The determination of the Group’s obligation and cost of pension and other post-employmentbenefits is dependent on the selection of certain assumptions used by actuaries in calculating suchamounts. Those assumptions include, among others, discount rates, expected rates of salaryincrease, and employee turnover rate. A significant change in any of these actuarial assumptionsmay generally affect the recognized expense, other comprehensive income or loss and thecarrying amount of the post-employment benefit obligation in the next reporting period.
The Group also estimates other employee benefit obligations and expenses, including the cost ofpaid leaves based on historical leave availments of employees, subject to the Group and theParent Bank policies. These estimates may vary depending on future changes in salaries andactual experiences during the year.
The amounts of post-employment defined benefit obligation and expense and an analysis of themovements in the estimated present value of post-employment defined benefit obligation, as wellas significant assumptions such as salary rate increase, discount rates, and turnover rates used inestimating such obligation are presented in Note 29.
Fair value determination of assets acquired and liabilities assumed from business combinations
In 2021, the Group finalized the determination of the fair values of the assets acquired andliabilities assumed from the acquisitions of Bangko Kabayan and PBI (see Note 15). The Groupdetermines the acquisition-date fair values of identifiable assets acquired and liabilities assumedfrom the acquiree without quoted market prices based on the following:
For assets and liabilities that are short term in nature, carrying values approximate fairvalues;
For financial assets and liabilities that are long-term in nature, fair values are estimatedthrough the discounted cash flow methodology, using the appropriate market rates (e.g.,current lending rates);
For nonfinancial assets such as property and equipment and investment properties, fair valuesare determined based on an appraisal which follows sales comparison approach anddepreciated replacement cost approach depending on the highest and best use of the assets;and
For intangible assets, these are determined based on discounted cash flow over the benefitsand liabilities of ownership over the asset acquired, including an exit or terminal value.
4. Risk Management Objectives and Policies
Risks are inherent in the business activities of the Group. Among its identified risks are creditrisk, liquidity risk, market risk, interest rate risk, foreign exchange risk, operational risk,information security risk, legal risk, and regulatory risk. These are managed through a riskmanagement framework and governance structure that provides comprehensive controls andmanagement of major risks on an ongoing basis.
Risk management is the process by which the Group identifies its key risks, collects consistentand understandable risk measures, decides which risks to take on or reduce and establishesprocedures for monitoring the resulting risk positions. The objective of risk management is toensure that the Group conducts its business within the risk levels set by the BOD while businessunits pursue their objective of maximizing returns.

Risk Management Objectives and Policies - 36 -
*SGVFS162380*
Risk Management StrategiesThe Group maintains a prudent risk management strategy to ensure the soundness andprofitability of its operations and sustained profitability. Business units are held accountable forall the risks and related returns, and ensure that decisions are consistent with business objectivesand risk tolerance. Strategies and limits are reviewed regularly and updated to ensure that risksare well-diversified and risk mitigation measures are in place. A system for managing andmonitoring risks is in place so that all relevant issues are identified at an early stage andappropriate actions are taken on a timely basis. Risk reporting is done on a regular basis, eitherdaily, monthly or quarterly.
Although the BOD is primarily responsible for the overall risk management of the Group’sactivities, the responsibility rests with all levels of the organization. The risk appetite is definedand communicated, including parameters and limits, through an enterprise-wide risk policyframework.
Risk Management StructureThe BOD of the Parent Bank exercises oversight over the Parent Bank’s risk managementprocess as a whole and through its various risk committees. For the purpose of day-to-daymanagement of risks, the Parent Bank has established independent Risk Management Units(RMUs) that objectively review and ensure compliance with the risk parameters set by the BOD.The RMUs are responsible for the monitoring and reporting of risks to senior management andthe various committees of the Parent Bank.
On the other hand, the risk management processes of its subsidiaries are handled separately bytheir respective BODs.
The Parent Bank’s BOD is primarily responsible for setting the risk appetite, approving riskparameters, proposed credit policies, and investment guidelines, as well as establishing theoverall risk-taking capacity of the Parent Bank. To fulfill its responsibilities in risk management,the BOD has established the following committees, whose functions are described below.
(a) The Executive Committee (EXCOM), composed of seven (7) members of the BOD,exercises certain functions as delegated by the BOD including, among others, the approval ofcredit proposals, asset recovery and real and other properties acquired (ROPA) sales withinits delegated limits.
(b) The Risk Management Committee (RMC) is composed of seven (7) non-executive directorsof the BOD, majority of whom are independent directors, including the Chairman. The RMCadvises the BOD regarding the Parent Bank’s overall current and future risk appetite,oversees Senior Management’s adherence to the risk appetite statement, and reports on thestate of risk culture of the Parent Bank. The RMC oversees the Parent Bank’s riskmanagement framework and the risk management function. The RMC also providesoversight, direction, and guidance to the other risk committees, specifically the Market RiskCommittee (MRC) and the Operations Risk Management Committee (ORMC).
(c) The MRC is composed of nine (9) members of the BOD, majority of whom are independentdirectors, including the Chairman. The MRC is primarily responsible for reviewing the riskmanagement policies and practices relating to market risk including interest rate risk in thebanking book and liquidity risk.

Risk Management Objectives and Policies - 37 -
*SGVFS162380*
(d) The ORMC is composed of at least three (3) members of the BOD, with a majority of theORMC’s membership comprised of independent directors, including the Chairman. TheORMC reviews various operational risk policies and practices and approves the operationalrisk management framework which forms part of the Bank’s enterprise risk managementsystem and covers all business lines and functions of the Bank, including outsourced servicesand services provided to external parties. The ORMC also provides oversight on theimplementation of a sound business continuity management framework.
(e) The Audit Committee is composed of seven (7) members, all non-executive and majority ofwhom are independent, including the Chairman, most of whom are with accounting, auditing,or related financial management expertise or experience. The skills, qualifications, andexperience of the committee members are appropriate for them to perform their duties as laiddown by the BOD.
The Audit Committee serves as principal agent of the BOD in ensuring independence ofthe Parent Bank’s external auditors and the internal audit function, the integrity ofmanagement, and the adequacy of disclosures and reporting to stockholders. It also overseesthe Parent Bank’s financial reporting process on behalf of the BOD. It assists the BOD infulfilling its fiduciary responsibilities as to accounting policies, reporting practices and thesufficiency of auditing relative thereto, and regulatory compliance.
To effectively perform these functions, the Audit Committee has a good understanding of theParent Bank’s business including the following: Parent Bank’s structure, businesses,controls, and the types of transactions or other financial reporting matters applicable to theParent Bank as well as to determine whether the controls are adequate, functioning asdesigned, and operating effectively. It also considers the potential effects of emergingbusiness risks and their impact on the Parent Bank’s financial position and results ofoperations.
Among the responsibilities of the Audit Committee are:
Oversight of the financial reporting process. The Audit Committee ensures thatthe Parent Bank has a high-quality reporting process that provides transparent, consistentand comparable financial statements. In this regard, the Audit Committee works closelywith management especially the Office of the Financial Controller, the Internal AuditGroup (IAG), as well as the external auditors, to effectively monitor the financialreporting process and the existence of significant financial reporting issues and concerns.
Monitoring and evaluation of internal control. The Audit Committee, through the IAG,monitors and evaluates the adequacy and effectiveness of the Parent Bank’s internalcontrol framework, integrity of financial reporting, and security of physical assets. TheAudit Committee ensures that a proactive and forward-looking approach on evaluation ofrisks and controls is taken. The Audit Committee also ensures that periodic assessmentof the internal control system is conducted to identify weaknesses and evaluates itsrobustness considering the risk profile and strategic direction of the Parent Bank.
Oversight of the audit process. The Audit Committee is knowledgeable on auditfunction and the audit process. The Audit Committee maintains supportive, trusting andinquisitive relationships with both internal and external auditors to enhance itseffectiveness.

Risk Management Objectives and Policies - 38 -
*SGVFS162380*
Oversight of the outsourced internal audit activities. The Audit Committee oversees theperformance of the internal audit service provider, whenever such service is obtained,and ensures that they comply with sound internal auditing standards and othersupplemental standards issued by regulatory authorities/government agencies, as well aswith relevant code of ethics.
Oversees the implementation of Group Internal Audit Policy. The Audit Committeeoversees the implementation of the policy through the periodic reports on oversight ofthe Group Internal Audit, and takes appropriate action on any group internal oversightissues identified. The Audit Committee reviews and evaluates the group internal auditpolicy, and any amendments thereto, and endorse the same to the Parent Bank forapproval.
Oversight of the whistle-blowing mechanism. The Audit Committee oversees theestablishment of a whistle-blowing mechanism in the Parent Bank by which officers andstaff shall in confidence raise concerns about possible improprieties or malpractices inmatters of financial reporting, internal control, auditing or other issues to persons orentities that have the power to take corrective action. It also ensures that independentinvestigation, appropriate follow-up, action and subsequent resolution of complaints arein place.
In the performance of these functions, the Audit Committee is supported by the IAG. TheChief Audit Executive derives authority from and is directly accountable to the AuditCommittee. However, administratively, the Chief Audit Executive reports to the President ofthe Parent Bank.
The IAG is entirely independent from all the other organizational units of the Parent Bank, aswell as from the personnel and work that are to be audited. It operates under the directcontrol of the Audit Committee and is given an appropriate standing within the Parent Bankto be free from bias and interference. The IAG is free to report its findings and appraisalsinternally at its own initiative to the Audit Committee.
The IAG is authorized by the Audit Committee to have unrestricted access to all functions,records, property, and personnel of the Bank subject to existing mandate and applicable laws.This includes the authority to allocate resources, set audit frequencies, select subjects,determine scope of work, and apply the techniques required to accomplish the auditengagement objectives.
The IAG is also authorized to obtain the necessary assistance from personnel within theParent Bank units where they perform audits, as well as other specialized services within oroutside the Parent Bank.
The IAG presents its risk-based rolling 1 year audit plan that is forward-looking andconsistent with the Parent Bank’s strategic plans and priorities every quarter for approval bythe Audit Committee.
At least once a month, the Audit Committee meets to discuss the results of the assurance andconsulting engagements, and case investigations by IAG. Financial reporting andControllership related topics are also included as needed. The results of these meetings areregularly reported by the Audit Committee Chairman to the BOD in its monthly meetings.

Risk Management Objectives and Policies - 39 -
*SGVFS162380*
As the Bank continuously evolves towards its digitization strategy, IAG has undertakeninitiatives to adapt and expand its processes, and to provide relevant and timelyrecommendations to the Bank. IAG has implemented continuous auditing process that aimsto provide assurance on high-risk, high-volume areas/process, on a real time, or near-realtime basis.
IAG adopted the GRC system which aims to integrate the operational risk managementacross the Parent Bank. IAG also uses it as an audit management system to aid in ensuringquality and completeness of documentation across its different engagements. IAG alsoimplemented remote auditing and leveraged on the document management system of theBank.
(f) The Corporate Governance Committee (CGC) is primarily responsible for helping the BODfulfill its corporate governance and compliance responsibilities. It is responsible for ensuringthe BOD’s effectiveness and due observance of corporate governance principles and ofoversight over the compliance risk management. It assists in the establishment of acompliance program that facilitates the escalation and resolution of compliance issuesexpeditiously.
The CGC is composed of nine (9) members of the BOD, all non-executive, majority ofwhom, including its Chairman, are independent directors. Its specific duties include, amongothers, making recommendations to the BOD regarding continuing education of directors,overseeing the periodic performance evaluation of the 1) Board; 2) Board Committees;3) Chariman and the Individual Directors; 4) Management-level Committees (through theCompliance and Corporate Governance Office; and 5) Chief Compliance and CorporateGovernance Officer (CCCGO).
The CGC also performs oversight functions over the Compliance and Corporate GovernanceOffice (CCGO) and the following management-level committees: 1) Anti-Money LaunderingCommittee and 2) Discipline Committee.
Senior management, through the CCCGO, periodically reports to the CGC the status ofregulatory audit and compliance testing findings until their closure. Any material breaches ofthe compliance program are reported to and promptly addressed by the CCCGO within themechanisms defined by the Compliance Manual.
The Parent Bank’s CCCGO defines the Group’s minimum governance and compliancerequirements and works closely with the subsidiaries’ and affiliates’ Chief ComplianceOfficers in the execution of these standards.
The CGC assumed the functions of the Nominations Committee (NomCom) and theCompensation and Remuneration Committee (CompRem) upon the latter Committees’dissolution. The NomCom review the qualifications of and screens candidates for the boardincluding nominees for independent directors and key officers of the Parent Bank. As part ofits added function, it also reviews the implementation of programs for identifying, retainingand developing critical officers and the succession plan for various units in the organization.
The functions of the CompRem includes overseeing implementation of the programs forremuneration and benefits of directors and senior management, and monitoring that theperformance scorecards for the Parent Bank and its officers are comprehensive and balanced,and assessing the adequacy and, effectiveness for driving performance and consistency of theParent Bank’s total compensation program vis-à-vis corporate philosophy and strategy.

Risk Management Objectives and Policies - 40 -
*SGVFS162380*
The Parent Bank’s CCCGO assists the CGC in fulfilling its functions by apprising the sameof (1) pertinent regulations and other issuances relating to compliance or corporategovernance, and (2) status of the implementation of the Bank’s Compliance Program, raisingrelated regulatory issues and compliance initiatives affecting the various units and the statusof the latter’s corrective action plans. In addition, the CCO keeps the CGC abreast of bestgovernance practices and discusses issues being brought up among private organizations andindividuals advocating good governance philosophy.
(g) The Related Party Transaction Committee is a board-level committee composed of three (3)members, all of whom are independent directors, including its Chairman. The Committeeassists the BOD in the fulfillment of its corporate governance responsibilities on related partytransactions by ensuring that these are transacted on arm’s length terms. The Committeereviews and endorses the related party transactions to the BOD for approval or confirmation,depending on the amounts involved.
The major risk types identified by the Group are discussed in the following sections:
Credit RiskCredit risk is the risk of loss resulting from the failure of a borrower or counterparty to honor itsfinancial or contractual obligation to the Group. The risk may arise from lending, trade finance,treasury, investments, derivatives and other activities undertaken by the Group. Credit risk ismanaged through strategies, policies and limits that are approved by the respective BOD of thevarious companies within the Group. With respect to the Parent Bank, it has a well-structuredand standardized credit approval process and credit scoring system for each of its business and/orproduct segments.
The RMU undertakes several functions with respect to credit risk management. The RMUindependently performs credit risk assessment, evaluation and review for its retail, commercialand corporate financial products to ensure consistency in the Parent Bank’s risk assessmentprocess. It also ensures that the Parent Bank’s credit policies and procedures are adequate andare constantly updated to meet the changing demands or risk profiles of the business units. TheRMU also reported to the Board’s Risk Management Committee the COVID-19-related overlaysas well as their impact on credit impairment and credit portfolio’s credit risk profiles.
In 2021 and 2020, there were enhancements in the risk rating and SICR parameters in certainportfolios to consider the effects of COVID-19.
The RMU’s portfolio management function involves the review of the Parent Bank’s loanportfolio, including the portfolio risks associated with particular industry sectors, regions, loansize and maturity, and the development of a strategy for the Parent Bank to achieve its desiredportfolio mix and risk profile. The RMU reviews the Parent Bank’s loan portfolio quality in linewith the Parent Bank’s policy of avoiding significant concentrations of exposure to specificindustries or groups of borrowers. Concentrations arise when a number of counterparties areengaged in similar business activities, or activities in the same geographic region, or have similareconomic features. Concentrations indicate the relative sensitivity of the Parent Bank’sperformance to developments affecting a particular industry or geographical location.
The Group and the Parent Bank consider concentration risk to be present when the total exposureto a particular industry exceeds 30.0% of the total exposure, which is similar to the BSPrequirement. As of December 31, 2021 and 2020, the Group and the Parent Bank did not exceedthe limit in any of its industry concentration.

Risk Management Objectives and Policies - 41 -
*SGVFS162380*
In order to avoid excessive concentrations of risk, the Parent Bank’s policies and proceduresinclude guidelines for maintaining a diversified portfolio mix (e.g., concentration limits).Identified concentrations of credit risks are controlled and managed accordingly. The RMU alsomonitors compliance to the BSP’s limit on exposures.
The table below shows the breakdown of the Group’s and the Parent Bank’s exposure onreceivable from customers and investments and placements as of December 31, 2021 and 2020:
2021
Group Parent Bank
Corporate loans P=118,674,586 P=118,674,586
Commercial loans 69,942,747 69,942,747
Home loans 58,214,670 58,214,670
CSB salary loans 45,625,092 −Other retail products 18,119,653 18,119,653
Other receivables from customers* 29,311,418 14,022,203
Total receivables from customers 339,888,166 278,973,859
Investments and placements 410,298,448 366,933,320
P=750,186,614 P=645,907,179
*Comprised of HR loans, quick loans and Home Credit receivables
2020
Group Parent Bank
Corporate loans P=116,736,437 P=116,736,437Commercial loans 64,469,337 64,469,337Home loans 56,749,179 56,749,179CSB salary loans 47,918,513 −Other retail products 18,917,409 18,917,409Other receivables from customers* 21,351,225 8,574,923
Total receivables from customers 326,142,100 265,447,285Investments and placements 361,513,930 334,852,459
P=687,656,030 P=600,299,744
*Comprised of HR loans, quick loans and Home Credit receivables
Investments and placements include financial assets at amortized cost, debt securities classifiedas financial assets at FVOCI, due from other banks, due from BSP and interbank loans receivableand the related accrued interest receivable amounting to P=2.91 billion and P=2.49 billion as ofDecember 31, 2021 and 2020, respectively.
The following summarizes the Group’s credit risk management practices and the relevantquantitative and qualitative financial information regarding the credit exposure according toportfolios:
Credit risk management practices and credit quality disclosures
Corporate LoansCorporate lending activities are undertaken by the Parent Bank’s Corporate Banking Center. Thecustomer accounts under this group belong to the top tier corporations, conglomerates and largemultinational companies.

Risk Management Objectives and Policies - 42 -
*SGVFS162380*
The Parent Bank undertakes a comprehensive procedure for the credit evaluation and riskassessment of large corporate borrowers based on its obligor risk rating master scale.
The Parent Bank currently utilizes the same single rating system for both Corporate andCommercial accounts. In addition, the result on the latter is further refined through a secondmodel to take more careful account of the nuances between the commercial bank portfolio withthat of the corporate loan book.
The rating system assesses default risk based on financial profile, management capacity, industryperformance, and other factors deemed relevant. Significant changes in the credit riskconsidering movements in credit rating, among other account-level profile and performancefactors, define whether the accounts are classified in either Stage 1, Stage 2, or Stage 3 perPFRS 9 loan impairment standards.
Based on foregoing factors, each borrower is assigned a Borrower Risk Rating (BRR), fromAAA to D. In addition to the BRR, the Parent Bank assigns a loan exposure rating (LER),a 100-point system which consists of a Facility Tenor Rating (FTR) and a Security Risk Rating(SRR). The FTR measures the maturity risk based on the length of loan exposure, while the SRRmeasures the quality of the collateral and risk of its potential deterioration over the term of theloan. The FTR and the SRR, each a 100-point scoring system, are given equal weight indetermining the LER.
Once the BRR and the LER have been determined, the credit limit to a borrower is determinedunder the Risk Asset Acceptance Criteria (RAAC) which is a range of acceptable combinationsof the BRR and the LER. Under the RAAC system, a borrower with a high BRR will have abroader range of acceptable LERs.
The credit rating for each borrower is reviewed annually or earlier when there are extraordinaryor adverse developments affecting the borrower, the industry and/or the Philippine economy suchas the COVID-19 pandemic. Any major change in the credit scoring system, the RAAC rangeand/or the risk-adjusted pricing system is presented to and approved by the RMC.
The description of each credit quality grouping for the credit scores is explained further asfollows:
High Quality Grade - These accounts are of the highest quality and are likely to meet financialobligations.
Standard Grade - These accounts may be vulnerable to adverse business, financial and economicconditions but are expected to meet financial obligations.
Substandard Grade - These accounts are vulnerable to non-payment but for which default has notyet occurred.
Non-Performing - These refer to accounts which are in default or those that demonstrateobjective evidence of impairment.

Risk Management Objectives and Policies - 43 -
*SGVFS162380*
Below is the breakdown of the Group and Parent Bank’s corporate loans exposure (outstandingbalance and accrued interest receivable) by masterscale rating as of December 31, 2021 and2020:
December 31, 2021
Amounts
Credit Score Masterscale Stage 1 Stage 2 Stage 3 Total
High Quality Grade
AAA to A- 1 P=− P=− P=− P=−BBB+ 2 5,273,588 − − 5,273,588
BBB 3 1,500,229 − − 1,500,229
BBB- to BB+ 4 37,128,851 − − 37,128,851
Standard GradeBB to BB- 5 22,818,612 25,040 − 22,843,652
B+ 6 9,550,333 8,824,869 − 18,375,202
B to B- 7 13,085,912 12,160,653 − 25,246,565
CCC+ to CCC 8 5,326,535 − − 5,326,535
Substandard Grade
Lower than CCC 9 1,516,904 12,866 − 1,529,770
Non-Performing
Default 10 − − 1,450,194 1,450,194
P=96,200,964 P=21,023,428 P=1,450,194 P=118,674,586
December 31, 2020
Amounts
Credit Score Masterscale Stage 1 Stage 2 Stage 3 Total
High Quality Grade
AAA to A- 1 P=− P=− P=− P=−BBB+ 2 6,462,028 − − 6,462,028BBB 3 4,349,295 − − 4,349,295BBB- to BB+ 4 38,939,318 − − 38,939,318
Standard Grade
BB to BB- 5 22,605,080 30,023 − 22,635,103B+ 6 3,769,148 8,996,172 − 12,765,320B to B- 7 26,230,439 87,065 − 26,317,504CCC+ to CCC 8 2,336,568 − − 2,336,568
Substandard Grade
Lower than CCC 9 1,643,232 120,587 − 1,763,819Non-Performing
Default 10 − − 1,167,482 1,167,482
P=106,335,108 P=9,233,847 P=1,167,482 P=116,736,437
Commercial LoansThe Group and Parent Bank’s commercial banking activities are undertaken by its CommercialBanking Center (ComBank). These consist of banking products and services rendered tocustomers which are entities that are predominantly middle market companies. These productsand services are similar to those provided to large corporate customers, with the predominance oftrade finance-related products and services.

Risk Management Objectives and Policies - 44 -
*SGVFS162380*
The non-financial ComBank accounts use an adjusted obligor rating scale derived from the oneapplied for corporate loans, and follows the same RAAC framework, while ComBank accountsclassified as banks and non-bank financial institutions are still rated using the 2018 rating scale.
Below is the breakdown of the Group and Parent Bank’s commercial loans exposure (outstandingbalance and accrued interest receivable) by masterscale rating as of December 31, 2021 and 2020for financial and non-financial institutions:
Financial InstitutionsDecember 31, 2021
Amounts
Credit Score Masterscale Stage 1 Stage 2 Stage 3 Total
High Quality Grade
AAA to A- 1 P=− P=− P=− P=−BBB+ 2 − − − −BBB- 3 − − − −BBB- to BB+ 4 2,123,845 − − 2,123,845
Standard GradeBB to BB- 5 1,124,053 − − 1,124,053
B+ 6 1,274,683 − − 1,274,683
B to B- 7 11,449,999 − − 11,449,999
CCC+ to CCC 8 4,675,900 − − 4,675,900
Substandard Grade
Lower than CCC 9 133,301 − − 133,301
Non-Performing
Default 10 − − − −P=20,781,781 P=− P=− P=20,781,781
December 31, 2020
Amounts
Credit Score Masterscale Stage 1 Stage 2 Stage 3 Total
High Quality Grade
AAA to A- 1 P=− P=− P=− P=−BBB+ 2 − − − −BBB- 3 − − − −BBB- to BB+ 4 1,652,689 − − 1,652,689
Standard GradeBB to BB- 5 1,871,417 − − 1,871,417B+ 6 472,654 − − 472,654B to B- 7 11,861,087 − − 11,861,087CCC+ to CCC 8 2,845,549 − − 2,845,549
Substandard Grade
Lower than CCC 9 25,028 − − 25,028Non-Performing
Default 10 − − − −P=18,728,424 P=− P=− P=18,728,424

Risk Management Objectives and Policies - 45 -
*SGVFS162380*
Non-financial InstitutionsDecember 31, 2021
Amounts
Masterscale Stage 1 Stage 2 Stage 3 Total
1 P=− P=− P=− P=−2 10,006 − − 10,006
3 1,414,153 − − 1,414,153
4 2,863,325 − − 2,863,325
5 8,886,779 389,130 − 9,275,909
6 8,909,247 557,834 − 9,467,081
7 17,654,256 1,024,579 − 18,678,835
−8 2,057,062 232,643 − 2,289,705
9 323,119 1,465,013 − 1,788,132
10 − − 3,373,820 3,373,820
P=42,117,947 P=3,669,199 P=3,373,820 P=49,160,966
December 31, 2020
Amounts
Masterscale Stage 1 Stage 2 Stage 3 Total
1 P=− P=− P=− P=−2 1,030,925 − − 1,030,9253 1,993,546 − − 1,993,5464 2,761,225 9,933 − 2,771,158
5 6,790,031 470,368 − 7,260,3996 8,082,868 − − 8,082,8687 14,453,915 112,404 − 14,566,319
8 4,304,086 132,311 − 4,436,3979 809,459 1,482,787 − 2,292,246
10 − − 3,307,055 3,307,055
P=40,226,055 P=2,207,803 P=3,307,055 P=45,740,913
Retail and Small and Medium Enterprise (SME) Financial ProductsThe Retail loan portfolio of the Parent Bank is composed of four main product lines, namely:Home Loans, Credit Cards, Auto Loans, and Quick Loans. SME portfolio is composed ofBusiness Line Loans and a small portion from emerging products. Each of these products hasestablished credit risk guidelines and systems for managing credit risk across all businesses.Scoring models have been revised and fine-tuned while data analytics have been enhanced toimprove portfolio quality and product offers.
On the other hand, CSB, an accredited lending institution of the Department of Education(DepEd), provides salary loans to teachers under an agreement with DepEd for payrolldeductions. CSB also provides motorcycle loans as a result of its acquisition and subsequentmerger with PR Savings Bank.
Exposure to credit risk is managed through diligent assessment upon onboarding and regularportfolio and segment analysis of the ability of borrowers to meet interest and capital repaymentobligations and by changing these lending limits when appropriate.

Risk Management Objectives and Policies - 46 -
*SGVFS162380*
The Retail products’ respective masterscale is defined by the credit scoring models, whichconsider demographic variables and behavioral performance, to segment the portfolio accordingto risk masterscale per product. The stages are defined by the approved SICR for Retail whichtakes into account the following: NPL status, months on books, and credit score rating forApplication Score (point of application) and Behavior Score (monthly credit performance).
For 2021, both Home Loans (except Contract to Sell) and Cards use rating scale 1 to 6. CTSutilizes the Corporate ratings ranging from 1 to 7. Meanwhile, Auto Loans and SME products userating scale 1 to 5.
Below is the breakdown of the Group’s and the Parent Bank’s major retail portfolio loansexposure (outstanding balance and accrued interest receivable) by masterscale rating as ofDecember 31, 2021 and 2020:
Home LoansDecember 31, 2021
Amounts
Masterscale Stage 1 Stage 2 Stage 3 Total
1 P=– P=– P=– P=–
2 6,332,609 – – 6,332,609
3 9,820,451 – – 9,820,451
4 6,032,565 – – 6,032,565
5 9,361,213 – – 9,361,213
6 9,798,388 26,515 – 9,824,903
7 8,680,489 1,318,139 – 9,998,628
Default – – 6,844,301 6,844,301
P=50,025,715 P=1,344,654 P=6,844,301 P=58,214,670
December 31, 2020
Amounts
Masterscale Stage 1 Stage 2 Stage 3 Total
1 P=– P=– P=– P=–2 – 2,334 – 2,334
3 170,091 14,963 – 185,054
4 314,229 42,589 – 356,8185 719,677 33,337 – 753,0146 5,654,606 218,120 – 5,872,7267 40,178,679 1,450,627 – 41,629,306
Default − – 7,949,927 7,949,927
P=47,037,282 P=1,761,970 P=7,949,927 P=56,749,179

Risk Management Objectives and Policies - 47 -
*SGVFS162380*
Other Retail Products (Credit Cards, Mass Market Loans, and Auto Loans)
December 31, 2021
Amounts
Masterscale Stage 1 Stage 2 Stage 3 Total
1 P=– P=– P=– P=–
2 506,863 1,758 – 508,621
3 848,950 1,263 – 850,213
4 2,422,892 4,235 5,488 2,432,615
5 3,578,278 19,584 335,136 3,932,998
6 5,188,727 14,986 80 5,203,793
7 2,636,174 112,085 – 2,748,259
Default – – 2,443,154 2,443,154
P=15,181,884 P=153,911 P=2,783,858 P=18,119,653
December 31, 2020
Amounts
Masterscale Stage 1 Stage 2 Stage 3 Total
1 P=2,871,498 P=440 P=− P=2,871,9382 1,166,753 1,300 − 1,168,0533 2,336,036 783 − 2,336,8194 3,064,846 14,179 − 3,079,0255 2,439,425 39,363 − 2,478,7886 1,565,438 18,222 − 1,583,6607 2,369,551 127,076 − 2,496,627
Default − − 2,902,499 2,902,499
P=15,813,547 P=201,363 P=2,902,499 P=18,917,409
CSB Salary Loans
For CSB salary loans, which relates to the DepEd loans of CSB, each borrower is assigned acredit score with E as minimal risk, D as low risk, C as moderate risk, B as average risk and A ashigh risk.
The description of each credit quality grouping for the credit scores is explained further asfollows:
High grade (minimal to low risk) - These are receivables which have a high probability ofcollection. The counterparty has the apparent ability to satisfy its obligation and the security onthe receivables is readily enforceable.
Standard grade (moderate to average risk) - These are receivables where collections are probabledue to the reputation and the financial ability of the counterparty to pay but with experience ofdefault.
Substandard (high risk) - Accounts classified as “Substandard” are individual credits or portionsthereof which appear to involve a substantial and unreasonable degree of risk to the Bankbecause of unfavorable record or unsatisfactory characteristics. There exists in such accounts thepossibility of future loss to the Bank unless given closer supervision. Those classified as“Substandard” must have a well-defined weakness or weaknesses that jeopardize theirliquidation. Such well-defined weaknesses may include adverse trends or development offinancial, managerial, economic or political nature, or a significant weakness in collateral.

Risk Management Objectives and Policies - 48 -
*SGVFS162380*
Below is the breakdown of CSB’s salary loans exposure (outstanding balance and accruedinterest receivable) by credit score as of December 31, 2021 and 2020:
December 31, 2021
Amounts
Credit Score Stage 1 Stage 2 Stage 3 Total
D to E P=11,280,004 P=− P=1,532 P=11,281,536
B to C 29,110,475 743,633 16,337 29,870,445
A 411,034 723,386 19,766 1,154,186
Default − − 3,318,925 3,318,925
P=40,801,513 P=1,467,019 P=3,356,560 P=45,625,092
December 31, 2020
Amounts
Credit Score Stage 1 Stage 2 Stage 3 Total
D to E P=45,247,019 P=341,563 P=− P=45,588,582B to C 46,215 111,706 − 157,921A − 120,974 − 120,974Default − − 2,051,036 2,051,036
P=45,293,234 P=574,243 P=2,051,036 P=47,918,513
Other receivables from customersOther receivables from customers of the Group and the Parent Bank include small portfolios suchas, with respect to the Parent Bank, (i) personal loans, (ii) HR loans, (iii) bills purchase and(iv) customer liabilities under acceptance, (v) home credit receivables, and, with respect to thesubsidiaries, (i) personal loans, and (ii) motorcycle loans. Each of these products has establishedcredit risk guidelines and systems for managing credit risk across all businesses.
Exposure to credit risk is managed through regular analysis of the ability of borrowers andpotential borrowers to meet interest and capital repayment obligations and by changing theselending limits when appropriate.
Each product was risk rated using techniques appropriate to the Group’s and Parent Bank’s creditexperience. Such methods consider the payment history that are reflected in aging, delinquency,and/or change in rating. These provide the bases for the ECL stage determination.
The description of each groupings according to stage is explained further as follows:
Stage 1 - those that are considered current and up to 30 days past due, and based on change inrating, delinquencies and payment history, does not demonstrate significant increase in creditrisk.
Stage 2 - those that are considered more than 30 days past due but does not demonstrate objectiveevidence of impairment as of reporting date, and, based on change in rating, delinquencies andpayment history, demonstrates significant increase in credit risk.
Stage 3 - Those that are considered default or demonstrates objective evidence of impairment asof reporting date.

Risk Management Objectives and Policies - 49 -
*SGVFS162380*
Below is a summary as of December 31, 2021 and 2020 of the Group’s and Parent Bank’s otherreceivables from customers.
December 31, 2021
Amounts
Stage 1 Stage 2 Stage 3 Total
Group P=24,383,986 P=695,966 P=4,231,466 P=29,311,418
Parent Bank 13,074,318 137,222 810,663 14,022,203
December 31, 2020
Amounts
Stage 1 Stage 2 Stage 3 Total
Group P=17,255,611 P=1,168,124 P=2,927,490 P=21,351,225Parent Bank 7,791,314 120,023 663,586 8,574,923
Investments and PlacementsInvestments and placements include financial assets at amortized cost, debt financial assetsthrough other comprehensive income, due from BSP, interbank loans receivable and due fromother banks. Each has established credit risk guidelines and systems for managing credit riskacross all businesses.
Below is a breakdown of the Group’s and the Parent Bank’s investments and placements(outstanding balance and accrued interest receivable) by masterscale rating as of December 31,2021 and 2020:
Sovereign - Group
December 31, 2021
Amounts
Masterscale Stage 1 Stage 2 Stage 3 Total
1 P=6,027,263 P=− P=− P=6,027,263
2 − − − −3 − − − −4 255,911 − − 255,911
5 35,929,557 − − 35,929,557
6 1,585,739 − − 1,585,739
7 − − − −8 2,409,655 − − 2,409,655
9 179,529,674 − − 179,529,674
10 − − − −11 3,747,351 − − 3,747,351
12 1,855,068 723,018 − 2,578,086
13 − − − −14 − 2,055,879 − 2,055,879
15 − − − −16 − − − −Default − − − −
P=231,340,218 P=2,778,897 P=− P=234,119,115

Risk Management Objectives and Policies - 50 -
*SGVFS162380*
December 31, 2020
Amounts
Masterscale Stage 1 Stage 2 Stage 3 Total
1 P=7,180,893 P=− P=− P=7,180,8932 ‒ ‒ ‒ ‒3 ‒ ‒ ‒ ‒4 6,907,611 ‒ ‒ 6,907,6115 20,688,846 ‒ ‒ 20,688,8466 11,562,861 ‒ ‒ 11,562,8617 ‒ ‒ ‒ ‒8 2,315,919 ‒ ‒ 2,315,9199 97,070,517 ‒ ‒ 97,070,51710 2,942,981 ‒ ‒ 2,942,98111 − − ‒ −12 7,877,205 681,565 ‒ 8,558,77013 − − ‒ −14 ‒ 2,787,314 ‒ 2,787,31415 ‒ ‒ ‒ ‒16 ‒ ‒ ‒ ‒Default ‒ ‒ ‒ ‒
P=156,546,833 P=3,468,879 P=‒ P=160,015,712
Corporate – Group
December 31, 2021
Amounts
Masterscale Stage 1 Stage 2 Stage 3 Total
1 P=1,738,518 P=− P=− P=1,738,518
2 54,117,106 − − 54,117,106
3 15,510,463 − − 15,510,463
4 997,706 − − 997,706
5 76,243,614 − − 76,243,614
6 6,904,179 − − 6,904,179
7 5,365,779 − − 5,365,779
8 3,456,594 − − 3,456,594
9 9,072,351 − − 9,072,351
10 − − − −11 2,732,528 − − 2,732,528
12 40,495 − − 40,495
13 − − − −Default − − − −
P=176,179,333 P=− P=− P=176,179,333

Risk Management Objectives and Policies - 51 -
*SGVFS162380*
December 31, 2020
Amounts
Masterscale Stage 1 Stage 2 Stage 3 Total
1 P=− P=− P=− P=−2 49,299,628 − − 49,299,6283 17,560,176 − − 17,560,1764 466,863 − − 466,8635 102,481,183 − − 102,481,1836 16,538,843 − − 16,538,8437 154,698 − − 154,6988 10,729,439 − − 10,729,4399 25 − − 2510 1,700,043 − − 1,700,04311 2,567,320 − − 2,567,32012 − − − −13 − − − −Default − − − −
P=201,498,218 P=− P=− P=201,498,218
Sovereign – Parent Bank
December 31, 2021
Amounts
Masterscale Stage 1 Stage 2 Stage 3 Total
1 P=6,027,263 P=− P=− P=6,027,263
2 − − − −3 − − − −4 255,911 − − 255,911
5 − − − −6 1,585,739 − − 1,585,739
7 − − − −8 2,409,655 − − 2,409,655
9 175,346,683 − − 175,346,683
10 − − − −11 3,747,351 − − 3,747,351
12 1,855,068 723,018 − 2,578,086
13 − − − −14 − 2,055,879 − 2,055,879
15 − − − −16 − − − −Default − − − −
P=191,227,670 P=2,778,897 P=− P=194,006,567

Risk Management Objectives and Policies - 52 -
*SGVFS162380*
December 31, 2020
Amounts
Masterscale Stage 1 Stage 2 Stage 3 Total
1 P=7,180,893 P=− P=− P=7,180,8932 ‒ ‒ ‒ ‒3 ‒ ‒ ‒ ‒4 6,907,611 ‒ ‒ 6,907,6115 686,510 ‒ ‒ 686,5106 11,562,861 ‒ ‒ 11,562,8617 ‒ ‒ ‒ ‒8 2,315,919 ‒ ‒ 2,315,9199 94,430,661 ‒ ‒ 94,430,66110 2,942,981 ‒ ‒ 2,942,98111 − − ‒ −12 7,877,205 681,565 ‒ 8,558,77013 − − ‒ −14 ‒ 2,787,314 ‒ 2,787,31415 ‒ ‒ ‒ ‒16 ‒ ‒ ‒ ‒Default ‒ ‒ ‒ ‒
P=133,904,641 P=3,468,879 P=‒ P=137,373,520
Corporate – Parent Bank
December 31, 2021
Amounts
Masterscale Stage 1 Stage 2 Stage 3 Total
1 P=1,738,518 P=− P=− P=1,738,518
2 54,117,106 − − 54,117,106
3 15,510,463 − − 15,510,463
4 997,706 − − 997,706
5 73,176,780 − − 73,176,780
6 6,904,179 − − 6,904,179
7 5,305,511 − − 5,305,511
8 3,400,537 − − 3,400,537
9 9,072,351 − − 9,072,351
10 − − − −11 2,703,602 − − 2,703,602
12 − − − −13 − − − −Default − − − −
P=172,926,753 P=− P=− P=172,926,753

Risk Management Objectives and Policies - 53 -
*SGVFS162380*
December 31, 2020
Amounts
Masterscale Stage 1 Stage 2 Stage 3 Total
1 P=− P=− P=− P=−2 49,299,628 − − 49,299,6283 17,560,176 − − 17,560,1764 466,863 − − 466,8635 98,461,904 − − 98,461,9046 16,538,843 − − 16,538,8437 154,698 − − 154,6988 10,729,439 − − 10,729,4399 25 − − 2510 1,700,043 − − 1,700,04311 2,567,320 − − 2,567,32012 − − − −13 − − − −Default − − − −
P=197,478,939 P=− P=− P=197,478,939
Analysis of movements of gross carrying amountsMovements in 2021 and 2020 for total receivables from customers follow. The balancespresented include the related accrued interest receivables:
Group
2021
Stage 1 Stage 2 Stage 3 Total
Balances at beginning of year P=290,689,261 P=15,147,350 P=20,305,489 P=326,142,100
Newly originated assets that remained inStage 1 as at December 31, 2021 140,224,284 − − 140,224,284
Newly originated assets that moved to Stage 2
and Stage 3 as at December 31, 2021 − 1,809,525 3,181,392 4,990,917
Movements in receivable balance (excluding
write-offs) (133,921,880) 3,174,859 937,243 (129,809,778)
Transfers to Stage 1 5,909,599 (1,495,971) (4,413,628) −Transfers to Stage 2 (16,053,691) 17,125,223 (1,071,532) −Transfers to Stage 3 (3,894,455) (796,564) 4,691,019 −Amounts written-off − − (1,659,357) (1,659,357)
Balance at end of year P=282,953,118 P=34,964,422 P=21,970,626 P=339,888,166
2020
Stage 1 Stage 2 Stage 3 Total
Balances at beginning of year P=343,745,565 P=2,387,632 P=11,675,758 P=357,808,955
Newly originated assets that remained in
Stage 1 as at December 31, 2020 123,248,369 − − 123,248,369
Newly originated assets that moved to Stage 2and Stage 3 as at December 31, 2020 − 2,554,867 1,992,551 4,547,418
Effects of business combination
(see Note 15) 2,158,105 6,453 41,321 2,205,879
Movements in receivable balance (excludingwrite-offs) (156,406,473) (1,798,042) 1,416,635 (156,787,880)
Transfers to Stage 1 918,573 (279,228) (639,345) −Transfers to Stage 2 (13,434,159) 13,489,708 (55,549) −Transfers to Stage 3 (9,540,719) (1,214,040) 10,754,759 −Amounts written-off − − (4,880,641) (4,880,641)
Balance at end of year P=290,689,261 P=15,147,350 P=20,305,489 P=326,142,100

Risk Management Objectives and Policies - 54 -
*SGVFS162380*
Parent Bank
2021
Stage 1 Stage 2 Stage 3 Total
Balances at beginning of year P=235,931,730 P=13,525,006 P=15,990,549 P=265,447,285
Newly originated assets that remained inStage 1 as at December 31, 2021 102,781,134 − − 102,781,134
Newly originated assets that moved toStage 2 and Stage 3 as atDecember 31, 2021 − 248,257 1,925,154 2,173,411
Movements in receivable balance(excluding write-offs) (92,124,823) 4,603,341 (2,372,790) (89,894,272)
Transfers to Stage 1 4,018,364 (1,111,321) (2,907,043) −Transfers to Stage 2 (15,967,686) 16,424,625 (456,939) −Transfers to Stage 3 (3,796,782) (751,249) 4,548,031 −Amounts written-off − − (1,533,699) (1,533,699)
Balance at end of year P=230,841,937 P=32,938,659 P=15,193,263 P=278,973,859
2020
Stage 1 Stage 2 Stage 3 Total
Balances at beginning of year P=293,988,151 P=1,607,784 P=9,014,158 P=304,610,093Newly originated assets that remained in
Stage 1 as at December 31, 2020 90,902,328 − − 90,902,328Newly originated assets that moved to
Stage 2 and Stage 3 as atDecember 31, 2020 − 2,469,468 1,959,239 4,428,707
Movements in receivable balance(excluding write-offs) (126,359,237) (2,645,913) (705,728) (129,710,878)
Transfers to Stage 1 362,979 (182,235) (180,744) −Transfers to Stage 2 (13,433,644) 13,484,627 (50,983) −Transfers to Stage 3 (9,528,847) (1,208,725) 10,737,572 −Amounts written-off − − (4,782,965) (4,782,965)
Balance at end of year P=235,931,730 P=13,525,006 P=15,990,549 P=265,447,285
The breakdown of movements in 2021 and 2020 for total receivables from customers follow:
Corporate Loans - Group and Parent Bank
2021
Stage 1 Stage 2 Stage 3 Total
Balances at beginning of year P=106,335,108 P=9,233,847 P=1,167,482 P=116,736,437
Newly originated assets thatremained in Stage 1 as atDecember 31, 2021 23,115,419 − − 23,115,419
Movements in receivable balance(excluding write-offs)
(25,511,459) 4,051,477 282,712 (21,177,270)
Transfers to Stage 2 (14,312,641) 14,344,066 (31,425) −Transfers to Stage 3 − − − −Amounts written off − − − −Balance at end of year P=89,626,427 P=27,629,390 P=1,418,769 P=118,674,586

Risk Management Objectives and Policies - 55 -
*SGVFS162380*
2020
Stage 1 Stage 2 Stage 3 Total
Balances at beginning of year P=148,535,434 P=− P=87,569 P=148,623,003Newly originated assets that
remained in Stage 1 as atDecember 31, 2020 22,584,311 − − 22,584,311
Newly originated assets that moved toStage 2 and Stage 3 as atDecember 31, 2020 − 237,675 149,252 386,927
Movements in receivable balance(excluding write-offs) (52,401,863) (2,329,494) (76,952) (54,808,309)
Transfers to Stage 2 (11,325,666) 11,325,666 − −Transfers to Stage 3 (1,057,108) − 1,057,108 −Amounts written off − − (49,495) (49,495)
Balance at end of year P=106,335,108 P=9,233,847 P=1,167,482 P=116,736,437
Commercial Loans - Group and Parent Bank
2021
Stage 1 Stage 2 Stage 3 Total
Balances at beginning of year P=58,954,479 P=2,207,803 P=3,307,055 P=64,469,337
Newly originated assets thatremained in Stage 1 as atDecember 31, 2021 54,340,243 − − 54,340,243
Movements in receivable balance(excluding write-offs) (49,351,343)
861,783 (332,276) (48,821,836)
Transfers to Stage 1 102,123 (36,451) (65,672) −Transfers to Stage 2 (723,888) 723,888 − −Transfers to Stage 3 (421,886) (87,824) 509,710 −Amounts written-off − − (44,997) (44,997)
Balances at end of year P=62,899,728 P=3,669,199 P=3,373,820 P=69,942,747
2020
Stage 1 Stage 2 Stage 3 Total
Balances at beginning of year P=64,344,757 P=11,469 P=2,703,175 P=67,059,401Newly originated assets that
remained in Stage 1 as atDecember 31, 2020 48,664,247 − − 48,664,247
Newly originated assets that moved toStage 2 and Stage 3 as atDecember 31, 2020 − 1,968,142 806,375 2,774,517
Movements in receivable balance(excluding write-offs) (52,317,599) (40,435) (365,945) (52,723,979)
Transfers to Stage 2 (280,096) 280,096 − −Transfers to Stage 3 (1,456,830) (11,469) 1,468,299 −Amounts written-off − − (1,304,849) (1,304,849)
Balances at end of year P=58,954,479 P=2,207,803 P=3,307,055 P=64,469,337

Risk Management Objectives and Policies - 56 -
*SGVFS162380*
Home Loans - Group and Parent Bank
2021
Stage 1 Stage 2 Stage 3 Total
Balances at beginning of year P=47,037,282 P=1,761,970 P=7,949,927 P=56,749,179
Newly originated assets that remainedin Stage 1 as at December 31,2021 16,285,786 − − 16,285,786
Newly originated assets that moved toStage 2 and Stage 3 as atDecember 31, 2021 − 159,704 307,106 466,810
Movements in receivable balance(excluding write-offs) (13,655,902) (210,604) (1,365,347) (15,231,853)
Transfers to Stage 1 3,582,771 (954,653) (2,628,118) −Transfers to Stage 2 (795,608) 1,150,360 (354,752) −Transfers to Stage 3 (2,428,614) (562,123) 2,990,737 −Amounts written off − − (55,252) (55,252)
Balances at end of year P=50,025,715 P=1,344,654 P=6,844,301 P=58,214,670
2020
Stage 1 Stage 2 Stage 3 Total
Balances at beginning of year P=47,458,702 P=1,193,833 P=2,141,689 P=50,794,224Newly originated assets that remained
in Stage 1 as at December 31,2020 13,685,023 − − 13,685,023
Newly originated assets that moved toStage 2 and Stage 3 as atDecember 31, 2020 − 222,899 423,436 646,335
Movements in receivable balance(excluding write-offs) (7,701,560) (126,192) (487,775) (8,315,527)
Transfers to Stage 1 225,770 (125,558) (100,212) −Transfers to Stage 2 (1,565,462) 1,591,172 (25,710) −Transfers to Stage 3 (5,065,191) (994,184) 6,059,375 −Amounts written off − − (60,876) (60,876)
Balances at end of year P=47,037,282 P=1,761,970 P=7,949,927 P=56,749,179
Other Retail Products - Group and Parent Bank
2021
Stage 1 Stage 2 Stage 3 Total
Balance at beginning of year P=15,813,547 P=201,363 P=2,902,499 P=18,917,409
Newly originated assets that remainedin Stage 1 as at December 31,2021 2,639,472 − − 2,639,472
Newly originated assets that moved toStage 2 and Stage 3 as atDecember 31, 2021 − 40,703 1,470,415 1,511,118
Movements in receivable balance(excluding write-offs) (2,692,576) (55,380) (779,121) (3,527,077)
Transfers to Stage 1 270,142 (72,844) (197,298) −Transfers to Stage 2 (85,997) 100,658 (14,660) −Transfers to Stage 3 (728,839) (56,306) 785,144 −Amounts written-off − − (1,421,269) (1,421,269)
Balance at end of year P=15,215,749 P=158,194 P=2,745,710 P=18,119,653

Risk Management Objectives and Policies - 57 -
*SGVFS162380*
2020
Stage 1 Stage 2 Stage 3 Total
Balance at beginning of year P=17,357,463 P=360,013 P=2,935,755 P=20,653,231Newly originated assets that remained
in Stage 1 as at December 31,2020 2,423,613 − − 2,423,613
Newly originated assets that moved toStage 2 and Stage 3 as atDecember 31, 2020 − 27,318 507,949 535,267
Movements in receivable balance(excluding write-offs) (2,439,557) (121,610) 346,744 (2,214,423)
Transfers to Stage 1 130,955 (50,423) (80,532) −Transfers to Stage 2 (143,577) 163,312 (19,735) −Transfers to Stage 3 (1,515,350) (177,247) 1,692,597 −Amounts written-off − − (2,480,279) (2,480,279)
Balance at end of year P=15,813,547 P=201,363 P=2,902,499 P=18,917,409
CSB Salary Loans - Group
2021
Stage 1 Stage 2 Stage 3 Total
Balance at beginning of year P=45,293,234 P=574,243 P=2,051,036 P=47,918,513
Newly originated assets that remainedin Stage 1 as at December 31,2021 30,147,310 − − 30,147,310
Newly originated assets that moved toStage 2 and Stage 3 as atDecember 31, 2021 − 1,255,137 659,369 1,914,506
Movements in receivable balance(excluding write-offs) (35,452,586) (369,310) 1,582,285 (34,239,611)
Transfers to Stage 1 911,862 (194,859) (717,003) −Transfers to Stage 2 (37,811) 215,465 (177,654) −Transfers to Stage 3 (60,496) (13,657) 74,153 −Amounts written-off − − (115,626) (115,626)
Balance at end of year P=40,801,513 P= 1,467,019 P=3,356,560 P=45,625,092
2020
Stage 1 Stage 2 Stage 3 Total
Balance at beginning of year P=42,618,304 P=248,767 P=1,436,076 P=44,303,147Newly originated assets that remained
in Stage 1 as at December 31,2020 32,346,041 − − 32,346,041
Newly originated assets that moved toStage 2 and Stage 3 as atDecember 31, 2020 − 85,399 33,312 118,711
Movements in receivable balance(excluding write-offs) (30,214,318) 337,304 1,125,304 (28,751,710)
Transfers to Stage 1 555,594 (96,993) (458,601) −Transfers to Stage 2 (515) 5,081 (4,566) −Transfers to Stage 3 (11,872) (5,315) 17,187 −Amounts written-off − − (97,676) (97,676)
Balance at end of year P=45,293,234 P=574,243 P=2,051,036 P=47,918,513

Risk Management Objectives and Policies - 58 -
*SGVFS162380*
Other Receivables from CustomersOther receivables from customers include HR loans, quick loans and home credit receivables.
Group
2021
Stage 1 Stage 2 Stage 3 Total
Balance at beginning of year P=17,255,611 P=1,168,124 P=2,927,490 P=21,351,225
Newly originated assets that remained inStage 1 as at December 31, 2021 13,696,054 − − 13,696,054
Newly originated assets that moved toStage 2 and Stage 3 as atDecember 31, 2021 − 353,981 744,502 1,098,483
Movements in receivable balance(excluding write-offs)
(7,258,012) (1,103,107) 1,548,988 (6,812,131)
Transfers to Stage 1 1,042,701 (237,164) (805,537) −Transfers to Stage 2 (97,747) 590,787 (493,040) −Transfers to Stage 3 (254,621) (76,655) 331,276 −Amounts written-off − − (22,213) (22,213)
Balance at end of year P=24,383,986 P=695,966 P=4,231,466 P=29,311,418
2020
Stage 1 Stage 2 Stage 3 Total
Balance at beginning of year P=23,430,905 P=573,550 P=2,371,494 P=26,375,949Newly originated assets that remained in
Stage 1 as at December 31, 2020 3,545,134 − − 3,545,134Newly originated assets that moved to
Stage 2 and Stage 3 as atDecember 31, 2020 − 13,434 72,227 85,661
Effects of business combination (Note 15) 2,158,105 6,453 41,321 2,205,879Movements in receivable balance
(excluding write-offs) (11,331,576) 482,385 875,259 (9,973,932)Transfers to Stage 1 6,254 (6,254) − −Transfers to Stage 2 (118,843) 124,381 (5,538) −Transfers to Stage 3 (434,368) (25,825) 460,193 −Amounts written-off − − (887,466) (887,466)
Balance at end of year P=17,255,611 P=1,168,124 P=2,927,490 P=21,351,225
Parent Bank
2021
Stage 1 Stage 2 Stage 3 Total
Balance at beginning of year P=7,791,314 P=120,023 P=663,586 P=8,574,923
Newly originated assets that remained inStage 1 as at December 31, 2021 6,400,214 − − 6,400,214
Newly originated assets that moved toStage 2 and Stage 3 as atDecember 31, 2021 − 47,850 147,633 195,483
Movements in receivable balance(excluding write-offs) (913,541) (43,935) (178,760) (1,136,236)
Transfers to Stage 1 63,328 (47,373) (15,955) −Transfers to Stage 2 (49,553) 105,654 (56,101) −Transfers to Stage 3 (217,444) (44,997) 262,441 −Amounts written-off − − (12,181) (12,181)
Balance at end of year P=13,074,318 P=137,222 P=810,663 P=14,022,203

Risk Management Objectives and Policies - 59 -
*SGVFS162380*
2020
Stage 1 Stage 2 Stage 3 Total
Balance at beginning of year P=16,291,795 P=42,469 P=1,145,970 P=17,480,234Newly originated assets that remained in
Stage 1 as at December 31, 2020 3,545,134 − − 3,545,134Newly originated assets that moved to
Stage 2 and Stage 3 as atDecember 31, 2020 − 13,434 72,227 85,661
Movements in receivable balance(excluding write-offs) (11,498,658) (28,182) (121,800) (11,648,640)
Transfers to Stage 1 6,254 (6,254) −Transfers to Stage 2 (118,843) 124,381 (5,538) −Transfers to Stage 3 (434,368) (25,825) 460,193 −Amounts written-off − − (887,466) (887,466)
Balance at end of year P=7,791,314 P=120,023 P=663,586 P=8,574,923
Investments and PlacementsMovements in 2021 and 2020 for investments and placements follow. The balances presentedinclude accrued interest receivables:
Group
2021
Stage 1 Stage 2 Stage 3 Total
Balance at beginning of year P=358,045,051 P=3,468,879 P=− P=361,513,930
Newly originated assets that remained inStage 1 as at December 31, 2021 183,649,821 − − 183,649,821
Newly originated assets that moved toStage 2 as at December 31, 2021 − 2,778,897 − 2,778,897
Movements in the balance (excludingwrite-offs) (134,175,321) (3,468,879) − (137,644,200)
Balance at end of year P=407,519,551 P=2,778,897 P=− P=410,298,448
2020
Stage 1 Stage 2 Stage 3 Total
Balance at beginning of year P=313,685,985 P=3,658,807 P=− P=317,344,792Newly originated assets that remained in
Stage 1 as at December 31, 2020 78,803,785 − − 78,803,785Effects of business combination (Note 15) 1,148,525 − − 1,148,525Movements in the balance (excluding
write-offs) (35,593,244) (189,928) − (35,783,172)
Balance at end of year P=358,045,051 P=3,468,879 P=− P=361,513,930
Parent2021
Stage 1 Stage 2 Stage 3 Total
Balance at beginning of year P=331,383,580 P=3,468,879 P=− P=334,852,459
Newly originated assets that remained inStage 1 as at December 31, 2021 167,543,598 − − 167,543,598
Movements in the balance (excludingwrite-offs) (134,772,755) (689,982) − (5,462,737)
Balance at end of year P=364,154,423 P=2,778,897 P=− P=367,933,320

Risk Management Objectives and Policies - 60 -
*SGVFS162380*
2020
Stage 1 Stage 2 Stage 3 Total
Balance at beginning of year P=305,551,425 P=3,658,807 P=− P=309,210,232Newly originated assets that remained in
Stage 1 as at December 31, 2020 76,492,061 − − 76,492,061Movements in the balance (excluding
write-offs) (50,659,906) (189,928) − (50,849,834)
Balance at end of year P=331,383,580 P=3,468,879 P=− P=334,852,459
ModificationIn certain circumstances, the Group modifies the original terms and conditions of a credit exposureto form a new loan agreement or payment schedule. The modifications can be given depending onthe borrower’s or counterparty’s current or expected financial circumstance. The modifications mayinclude, but are not limited to, change in interest rate and terms, principal amount, maturity date,date and amount of periodic payments and accrual of interest and charges.
On March 24, 2020, Republic Act No. 11469 or the “Bayanihan to Heal as One Act” (Bayanihan1) was enacted declaring a state of national emergency over the entire country to control thespread of the Coronavirus Disease 2019 (COVID-19). Among the provisions of Bayanihan 1 isthe implementation of a 30-day grace period for all loans with principal and/or interest fallingdue within the period of the Enhanced Community Quarantine without incurring interest oninterest, penalties, fees and other charges. Further, on September 11, 2020, Republic ActNo. 11494 or the “Bayanihan to Recover as One Act” (Bayanihan 2) was enacted and providedfor the implementation of a one-time 60-day grace period to be granted for the payment of allexisting, current and outstanding loans falling due, or any part thereof, on or beforeDecember 31, 2020, without incurring interest on interest, penalties, fees and other charges,thereby extending the maturity of said loans. In addition, Bayanihan 2 allows loans and interestdue during the Bayanihan 2 period to be settled on a staggered basis without interest on interests,penalties, fees or other charges until December 31, 2020 or as may be agreed upon by bothparties. The Bank also provided additional grace period to the borrowers .
In 2020, the impact of loan modifications as a result of the Bayanihan 1 and Bayanihan 2 Actsamounted to a loss of P=506.70 million for the Group and P=377.08 million for the Parent Bank.For the years ended December 31, 2021 and 2020, the net impact of the loan modifications (i.e.,after subsequent accretion of the modified loans) amounted to income of P=101.37 million andloss of P=423.87 million for the Group , respectively, and income of P=51.84 million and loss ofP=346.01 million for the Parent Bank, respectively.
Collateral Held as Security and Other Credit EnhancementsThe Group holds collateral against loans and other receivables from customers in order tomitigate risk. The collateral may be in the form of mortgages over real estate property, chattels,inventory, cash, securities and/or guarantees. The Bank regularly monitors and updates the fairvalue of the collateral depending on the type of credit exposure. Estimates of the fair value ofcollateral are considered in the review and assessment of the adequacy of allowance for creditlosses. In general, the Bank does not require collateral for loans and advances to other banks,except when securities are held as part of reverse repurchase agreements.

Risk Management Objectives and Policies - 61 -
*SGVFS162380*
An estimate of the fair value of collateral and other security enhancements held by the Group andthe Parent Bank against loans and other receivables as of December 31, 2021 and 2020 is shownbelow:
Group
Exposure beforecollateral Property Deposits Others
Exposure afterfinancial effect of
collateral
As of December 31, 2021 P=375,124,575 P=29,047,280 P=652,973 P=31,995,877 P=313,428,445
As of December 31, 2020 P=352,583,919 P=31,294,142 P=658,275 P=15,629,399 P=305,002,103
Parent Bank
Exposure beforecollateral Property Deposits Others
Exposure afterfinancial effect of
collateral
As of December 31, 2021 P=301,776,749 P=27,477,392 P=617,608 P=30,759,192 P=242,922,557
As of December 31, 2020 P=282,176,601 P=29,642,564 P=619,434 P=14,801,878 P=237,112,725
The Group’s manner of disposing the collateral for impaired loans and receivables is normallythrough sale of the assets after foreclosure proceedings have taken place.
Liquidity RiskLiquidity risk is the risk that there are insufficient funds available to adequately meet the creditdemands of the Group’s customers and repay deposits on maturity. The Asset and LiabilityCommittee (ALCO) and the Treasurer of the Group ensure that sufficient liquid assets areavailable to meet short-term funding and regulatory requirements. Liquidity is monitored by theGroup on a daily basis and under stressed situations. A contingency plan is formulated to set outthe amount and the sources of funds (such as unused credit facilities) that are available to theGroup and the circumstances under which the Group may use such funds.
Liquidity ratios are used to monitor and manage the Bank’s liquidity. The MRC approves theratios to be used for monitoring the performance of the Bank and for mapping out areas whereimprovements are needed. These ratios include Liquid Assets to Deposits Ratio, Liquidity ratio,Leverage Ratio and Intermediation Ratio.
The Group also manages its liquidity risks through the use of a Maximum Cumulative Outflow(MCO) limit which regulates the outflow of cash on a cumulative basis and on a tenor basis. Tomaintain sufficient liquidity in foreign currencies, the Group has also set an MCO limit forcertain designated foreign currencies. The MCO limits are endorsed by the MRC and approvedby the BOD. The Bank has separate limits for the short term (generally less than 30 days) andthe medium term tenor (from 30 days to one year).

Risk Management Objectives and Policies - 62 -
*SGVFS162380*
The table below shows the financial assets and financial liabilities’ liquidity information whichincludes coupon cash flows categorized based on the contractual date on which the asset will berealized and the liability will be settled. For financial assets at FVTPL, the analysis into maturitygrouping is based on the remaining period from the end of the reporting period to the expecteddate the assets will be realized (amounts in millions).
Group
2021
On
Demand
Up to
1 month
1 to 3
Months
3 to 6
Months
6 to 12
Months
Beyond
1 year Total
Financial assets
Cash and other cash items P=8,905 P=‒ P=‒ P=‒ P=‒ P=‒ P=8,905
Due from BSP 47,439 55,981 ‒ ‒ ‒ ‒ 103,420
Due from other banks 54,258 ‒ ‒ ‒ ‒ ‒ 54,258
Interbank loans receivable ‒ 17,495 ‒ ‒ ‒ ‒ 17,495
110,602 73,476 ‒ ‒ ‒ ‒ 184,078
Financial assets at FVTPLDerivative assets ‒ 85 239 253 139 677 1,393
Debt securities ‒ 4,575 ‒ ‒ ‒ ‒ 4,575
Equity securities ‒ ‒ ‒ ‒ ‒ ‒ ‒Financial assets at FVOCI
Debt securities ‒ 25,000 26,695 32,734 22 275 84,726
Equity securities ‒ ‒ ‒ ‒ ‒ 42 42
Financial assets at amortizedcost 186 3,117 1,087 1,005 3,853 225,532 234,780
186 32,777 28,021 33,992 4,014 226,526 325,516
Loans and other receivables 2,704 74,117 34,881 19,958 29,879 266,905 428,444
Other receivablesAccounts receivable ‒ ‒ ‒ ‒ ‒ 10,326 10,326
Accrued interest receivable ‒ 7,276 ‒ ‒ ‒ ‒ 7,276
Sales contract receivable ‒ 41 70 95 141 2,075 2,422
2,704 81,434 34,951 20,053 30,020 279,306 448,468
Other financial assets
Returned checks and othercash items ‒ 169 ‒ ‒ ‒ ‒ 169
Sundry debits ‒ 432 ‒ ‒ ‒ ‒ 432
‒ 601 ‒ ‒ ‒ ‒ 601
Total assets P=113,492 P=188,288 P=62,972 P=54,045 P=34,034 P=505,832 P=958,663
Non-derivative liabilities
Deposit liabilitiesDemand P=204,561 P=‒ P=‒ P=‒ P=‒ P=‒ P=204,561
Savings 136,430 ‒ ‒ ‒ ‒ ‒ 136,430
Time and LTNCD 2,796 131,090 30,147 4,077 12,678 53,842 234,630
343,787 131,090 30,147 4,077 12,678 53,842 575,621
Bills payable ‒ 8,551 12,475 1,475 15,380 15,152 53,033
Notes and bonds payable ‒ 432 239 6,635 26,842 46,179 80,327
Manager’s checks 6,864 ‒ ‒ ‒ ‒ ‒ 6,864
Accrued interest payable ‒ 787 ‒ ‒ ‒ ‒ 787
Accounts payable ‒ 5,799 ‒ ‒ ‒ ‒ 5,799
Other liabilities ‒ 8,775 ‒ ‒ ‒ 1,081 9,856
350,651 155,434 42,861 12,187 54,900 116,254 732,287
Derivative Liabilities 1 383 94 106 129 598 1,311
Total liabilities P=350,652 P=155,817 P=42,955 P=12,293 P=55,029 P=116,852 P=733,598
Group
2020
OnDemand
Up to1 month
1 to 3Months
3 to 6Months
6 to 12Months
Beyond1 year Total
Financial assets
Cash and other cash items P=8,958 P=‒ P=‒ P=‒ P=‒ P=‒ P=8,958 Due from BSP 43,972 59,913 ‒ ‒ ‒ ‒ 103,885
Due from other banks 68,532 ‒ ‒ ‒ ‒ ‒ 68,532Interbank loans receivable ‒ ‒ ‒ ‒ ‒ ‒ ‒
121,462 59,913 ‒ ‒ ‒ ‒ 181,375
Financial assets at FVTPLDerivative assets ‒ 145 60 196 213 573 1,187
Debt securities ‒ 15,050 ‒ ‒ ‒ ‒ 15,050
Equity securities ‒ 2,754 ‒ ‒ ‒ ‒ 2,754Financial assets at FVOCI
Debt securities ‒ 21,830 18,032 ‒ 20 162 40,044Equity securities ‒ ‒ ‒ ‒ ‒ 42 42
Financial assets at amortizedcost ‒ 4,982 1,579 1,539 4,636 235,912 248,648
‒ 44,761 19,671 1,735 4,869 236,689 307,725
(Forward)

Risk Management Objectives and Policies - 63 -
*SGVFS162380*
Group
2020
OnDemand
Up to1 month
1 to 3Months
3 to 6Months
6 to 12Months
Beyond1 year Total
Loans and other receivables P=145 P=67,357 P=35,251 P=21,919 P=30,426 P=230,262 P=385,360 Other receivables ‒ ‒ ‒ ‒ ‒ ‒ ‒
Accounts receivable ‒ ‒ ‒ ‒ ‒ 5,416 5,416Accrued interest receivable ‒ 6,912 ‒ ‒ ‒ ‒ 6,912
Sales contract receivable ‒ 51 90 99 134 2,052 2,426
145 74,320 35,341 22,018 30,560 237,730 400,114
Other financial assets Returned checks and other
cash items ‒ 249 ‒ ‒ ‒ ‒ 249Sundry debits ‒ (13) ‒ ‒ ‒ ‒ (13)
‒ 236 ‒ ‒ ‒ ‒ 236
Total assets P=121,607 P=179,230 P=55,012 P=23,753 P=35,429 P=474,419 P=889,450
Non-derivative liabilities
Deposit liabilitiesDemand P=159,784 P=‒ P=‒ P=‒ P=‒ P=‒ P=159,784Savings 98,958 ‒ ‒ ‒ ‒ ‒ 98,958
Time and LTNCD 1,718 155,721 74,158 6,823 4,046 33,140 275,606
260,460 155,721 74,158 6,823 4,046 33,140 534,348Bills payable ‒ 15,695 13,350 5,719 4,083 16,583 55,430Notes and bonds payable ‒ ‒ 239 826 1,073 64,146 66,284Manager’s checks 6,925 ‒ ‒ ‒ ‒ ‒ 6,925Accrued interest payable ‒ 758 ‒ ‒ ‒ ‒ 758
Accounts payable ‒ 5,028 ‒ ‒ ‒ ‒ 5,028
Other liabilities ‒ 9,323 ‒ ‒ ‒ 1,081 10,404
267,385 186,525 87,747 13,368 9,202 114,950 679,177
Derivative Liabilities ‒ 73 123 205 261 484 1,146
Total liabilities P=267,385 P=186,598 P=87,870 P=13,573 P=9,463 P=115,434 P=680,323
Parent Bank
2021
On
Demand
Up to
1 month
1 to 3
Months
3 to 6
Months
6 to 12
Months
Beyond
1 year Total
Financial assets
Cash and other cash items P=7,989 P=‒ P=‒ P=‒ P=‒ P=‒ P=7,989
Due from BSP 45,228 22,253 ‒ ‒ ‒ ‒ 67,481
Due from other banks 51,309 ‒ ‒ ‒ ‒ ‒ 51,309
Interbank loans receivable ‒ 17,495 ‒ ‒ ‒ ‒ 17,495
104,526 39,748 ‒ ‒ ‒ ‒ 144,274
Financial assets at FVTPLDerivative assets ‒ 85 239 253 139 677 1393
Debt securities ‒ 4,506 ‒ ‒ ‒ ‒ 4,506
Equity securities ‒ ‒ ‒ ‒ ‒ ‒ ‒Financial assets at FVOCI
Debt securities ‒ 25,000 26,678 32,733 ‒ ‒ 84,411
Equity securities ‒ ‒ ‒ ‒ ‒ 42 42
Financial assets at amortizedcost 186 3,058 968 874 3,623 221,731 230,440
186 32,649 27,885 33,860 3,762 222,450 320,792
Loans and other receivables ‒ 66,028 33,975 18,913 25,499 199,943 344,358
Other receivables
Accounts receivable ‒ ‒ ‒ ‒ ‒ 5,948 5,948
Accrued interest receivable ‒ 5,396 ‒ ‒ ‒ 5,396
Sales contract receivable ‒ 33 65 90 130 2,008 2,326
‒ 71,457 34,040 19,003 25,629 207,899 358,028
Other financial assets Returned checks and other
cash items
‒ 169 ‒ ‒ ‒ ‒ 169
Sundry debits ‒ 431 ‒ ‒ ‒ ‒ 431
‒ 600 ‒ ‒ ‒ ‒ 600
Total assets P=104,712 P=144,454 P=61,925 P=52,863 P=29,391 P=430,349 P=823,694
Non-derivative liabilities
Deposit liabilitiesDemand P=206,254 P=‒ P=‒ P=‒ P=‒ P=‒ P=206,254
Savings 132,075 ‒ ‒ ‒ ‒ ‒ 132,075
Time and LTNCD 67 78,729 23,604 1,741 9,532 45,205 158,878
338,396 78,729 23,604 1,741 9,532 45,205 497,207
Bills payable ‒ 5,546 10,468 30 7,726 5,295 29,065
Notes and bonds payable ‒ 432 239 6,635 26,842 46,179 80,327
Manager’s checks 6,864 ‒ ‒ ‒ ‒ ‒ 6,864
Accrued interest payable ‒ 627 ‒ ‒ ‒ ‒ 627
Accounts payable ‒ 4,827 ‒ ‒ ‒ ‒ 4,827
Other liabilities ‒ 7,627 ‒ ‒ ‒ 1,081 8,708
345,260 97,788 34,311 8,406 44,100 97,760 627,625
Derivative liabilities 1 383 94 106 129 598 1311
Total liabilities P=345,261 P=98,171 P=34,405 P= 8,512 P=44,229 P=98,358 P=628,936

Risk Management Objectives and Policies - 64 -
*SGVFS162380*
Parent Bank
2020
OnDemand
Up to1 month
1 to 3Months
3 to 6Months
6 to 12Months
Beyond1 year Total
Financial assets
Cash and other cash items P=7,815 P=‒ P=‒ P=‒ P=‒ P=‒ P=7,815
Due from BSP 42,167 41,711 ‒ ‒ ‒ ‒ 83,878Due from other banks 64,764 ‒ ‒ ‒ ‒ ‒ 64,764
114,746 41,711 ‒ ‒ ‒ ‒ 156,457
Financial assets at FVTPL Derivative assets ‒ 145 60 196 213 573 1187
Debt securities ‒ 15,012 ‒ ‒ ‒ ‒ 15,012Equity securities ‒ 2,716 ‒ ‒ ‒ ‒ 2,716
Financial assets at FVOCIDebt securities ‒ 21,829 18,032 ‒ ‒ ‒ 39,861Equity securities ‒ ‒ ‒ ‒ ‒ 42 42
Financial assets at amortized cost ‒ 4,980 1,578 1,448 4,636 231,922 244,564
‒ 44,682 19,670 1,644 4,849 232,537 303,382
Loans and other receivables ‒ 60,447 34,229 20,241 25,145 177,032 317,094Other receivables
Accounts receivable ‒ ‒ ‒ ‒ ‒ 2,251 2,251 Accrued interest receivable ‒ 5,591 ‒ ‒ ‒ ‒ 5,591
Sales contract receivable ‒ 42 84 86 125 2,006 2,343
‒ 66,080 34,313 20,327 25,270 181,289 327,279
Other financial assets Returned checks and other
cash items‒ 249 ‒ ‒ ‒ ‒ 249
Sundry debits ‒ 11 ‒ ‒ ‒ ‒ 11
‒ 260 ‒ ‒ ‒ ‒ 260
Total assets P=114,746 P=152,733 P=53,983 P=21,971 P=30,119 P=413,826 P=787,378
Non-derivative liabilities
Deposit liabilitiesDemand P=160,883 P=‒ P=‒ P=‒ P=‒ P=‒ P=160,883Savings 93,564 ‒ ‒ ‒ ‒ ‒ 93,564Time and LTNCD 66 118,775 68,651 2,756 2,061 21,310 213,619
254,513 118,775 68,651 2,756 2,061 21,310 468,066
Bills payable ‒ 15,695 8,841 582 70 10,420 35,608Notes and bonds payable ‒ ‒ 239 801 1,049 64,078 66,167Manager’s checks 6,925 ‒ ‒ ‒ ‒ ‒ 6,925Accrued interest payable ‒ 625 ‒ ‒ ‒ ‒ 625Accounts payable ‒ 3,949 ‒ ‒ ‒ ‒ 3,949Other liabilities ‒ 8,428 ‒ ‒ ‒ 1,081 9,509
261,438 147,472 77,731 4,139 3,180 96,889 590,849
Derivative liabilities ‒ 73 123 205 261 484 1,146
Total liabilities P=261,438 P=147,545 P=77,854 P=4,344 P=3,441 P=97,373 P=591,995
BSP ReportingLiquidity Coverage Ratio (LCR)
BSP Circular No. 905 provides the implementing guidelines on LCR and disclosure standardsthat are consistent with Basel III framework. The LCR is calculated as the ratio of stock of highquality liquid assets (HQLA) over the total net cash outflows over the next 30 calendar days,which should not be lower than 100%. Compliance with the LCR minimum requirementcommenced on January 1, 2018 with the prescribed minimum ratio of 90.00% for 2018 and100.00% effective January 1, 2019. The Group is required to disclose information related to theliquidity coverage ratio (LCR) in a single currency and on solo and consolidated basis starting2019.
The Group’s and the Parent Bank’s LCR as of December 31, 2021 and 2020 follows (amounts inmillions):
December 31, 2021
Group Parent Bank
Total HQLA P=296,558 P=247,494
Total net cash outflows 109,038 79,124
LCR Ratio 271.98% 312.79%

Risk Management Objectives and Policies - 65 -
*SGVFS162380*
December 31, 2020
Group Parent Bank
Total HQLA P=246,291 P=216,505Total net cash outflows 118,718 97,842
LCR Ratio 207.46% 221.28%
Net Stable Funding Ratio (NSFR)
On June 6, 2018, the BSP issued BSP Circular No.1007 covering the implementing guidelines onthe adoption of the Basel III Framework on Liquidity Standards – Net Stable Funding Ratio(NSFR). The NSFR is aimed to promote long-term resilience against liquidity risk by requiringbanks to maintain a stable funding profile in relation to the composition of its assets andoff-balance sheet activities. It complements the LCR, which promotes short term resilience of abank's liquidity profile. Banks shall maintain an NSFR of at least 100 percent (100%) at alltimes. The implementation of the minimum NSFR shall be phased in to help ensure that coveredbanks can meet the standard through reasonable measures without disrupting credit extension andfinancial market activities. An observation period was set from July 1 to December 31, 2018.Effective, January 1, 2019, banks shall comply with the prescribed minimum ratio of 100%. Asof December 31, 2021 and 2020, the NSFR was at 148.88% and 133.22%, respectively, for theGroup, and 150.21% and 135.97%, respectively, for the Parent Bank.
Market RiskMarket risk is the risk that the fair value or future cash flows of financial instruments willfluctuate due to changes in market variables such as interest rate, foreign exchange rates andequity prices. The Group classifies exposures to market risk into either trading book or bankingbook. The market risk for the trading portfolio is managed and monitored based on a Value-at-Risk (VaR) methodology. Meanwhile, the market risk for the non-trading positions are managedand monitored using other sensitivity analyses.
The Parent Bank applies a VaR methodology to assess the market risk of positions held and toestimate the potential economic loss based upon a number of parameters and assumptions forvarious changes in market conditions. VaR is a method used in measuring financial risk byestimating the potential negative change in the market value of a portfolio at a given confidencelevel and over a specified time horizon.
The Parent Bank uses the historical VaR approach in assessing the possible changes in the marketvalue of investment securities based on historical data for a rolling one-year period. The VaRmodels are designed to measure market risk in a normal market environment. The modelsassume that any changes occurring in the risk factors affecting the normal market environmentwill have the same distribution as they had in the past. This involves running the portfolio acrossa set of historical price changes, thus creating a distribution of changes in portfolio value whichmay or may not be normal. The historical approach does not make any assumptions regarding thedistribution of the risk factors and therefore can accommodate any type of distribution. TheBank uses the maximum between the 1st and 99th percentile of historical changes in asset returnsin the calculation of volatility as this is a more conservative approach as any potential gain mayreverse to a loss.

Risk Management Objectives and Policies - 66 -
*SGVFS162380*
VaR may also be underestimated or overestimated due to the assumptions placed on risk factorsand the relationship between such factors for specific instruments. Even though positions maychange throughout the day, the VaR only represents the risk of the portfolios at the close of eachbusiness day, and it does not account for any losses that may occur beyond the 99% confidencelevel.
The VaR figures are backtested daily against actual and hypothetical profit and loss of the tradingbook to validate the robustness of the VaR model. To supplement the VaR, the Parent Bankperforms stress tests wherein the trading portfolios are valued under extreme market scenariosnot covered by the confidence interval of the Parent Bank’s VaR model.
Since VaR is an integral part of the Parent Bank’s market risk management, VaR limits areestablished annually for all financial trading activities and exposures against the VaR limits andare monitored on a daily basis. Limits are based on the tolerable risk appetite of the Parent Bank.
A summary of the Parent Bank’s VaR position at December 31, 2021 and 2020 follows (amountsin millions of Philippine pesos)
Foreign
Exchange Interest Rate Equity Total VaR
2021 P=24.6 P=2,868.8 P=‒ P=2,893.4
Average daily 35.9 3,025.5 116.9 3,178.3
Highest 103.8 6,694.7 176.8 6,916.3
Lowest 8.3 1,962.0 ‒ 2,139.0
2020 P=23.7 P=5,675.8 P=142.5 P=5,842.0Average daily 29.1 4,212.6 149.4 4,391.0Highest 69.6 6,248.7 160.9 6,422.3Lowest 7.5 285.8 141.0 447.7
The high and low of the total portfolio may not equal to the sum of the individual components asthe highs and lows of the individual portfolios may have occurred on different trading days.
Interest Rate RiskInterest rate risk in the banking book (IRRBB) is the current and prospective risk to earnings andcapital arising from adverse movements in interest rates that affect the bank’s banking bookpositions. When interest rates change, the present value and timing of future cash flows change.This, in turn, changes the underlying value of the Bank’s assets, liabilities and off-balance sheetitems, and hence its economic value. On the other hand, changes in interest rates also affect theBank’s earnings by altering interest rate-sensitive income and expenses, affecting its net interestincome (NII). The ALCO establishes appropriate asset and liability pricing in support of theBank’s balance sheet objectives.
The Group employs “gap analysis” to measure rate-sensitivity of the income and expenses, alsoknown as Earnings-at-Risk (EaR). This sensitivity analysis is performed at least every month.The EaR measures the impact on the net interest income for any mismatch between the amountsof interest-earning assets and interest-bearing liabilities within a one-year period. The EaR iscalculated by first distributing the interest sensitive assets and liabilities into tenor buckets basedon time remaining to the next repricing date or the time remaining to maturity if there is norepricing and then subtracting the liabilities from the assets to obtain the repricing gap. Therepricing gap per tenor bucket is then multiplied by the assumed interest rate movement andappropriate time factor to derive the EaR per tenor. The Bank uses one-year differences in theterm structure of the different benchmark curves as the bases for the calculation of interest raterisk factor across all currencies. The total EaR is computed as the sum of the EaR per tenor

Risk Management Objectives and Policies - 67 -
*SGVFS162380*
within one year. To manage the interest rate risk exposure, BOD-approved EaR limits wereestablished.
Non-maturing or repricing assets or liabilities are considered to be non-interest rate sensitive andare not included in the measurement.
A positive gap occurs when the amount of interest rate sensitive assets exceeds the amount ofinterest rate sensitive liabilities while a negative gap occurs when the amount of interest ratesensitive liabilities exceeds the amount of interest rate sensitive assets. Accordingly, during aperiod of rising interest rates, an entity with a positive gap will have more interest rate sensitiveassets repricing at a higher interest rate than interest rate sensitive liabilities which will befavorable to it. During a period of falling interest rates, an entity with a positive gap will havemore interest rate sensitive assets repricing at a lower interest rate than interest rate sensitiveliabilities, which will be unfavorable to it.
The asset-liability gap position of the Group and Parent Bank at carrying amounts follows(amounts in millions of Philippine pesos):
Group
2021
Up to
Six Months
Beyond
Six Months
To One Year
Beyond
One Year Total
Resources
Loans P=161,687 P=39,162 P=158,926 P=359,775
Placements 127,719 ‒ 47,439 175,158
Investments 1,544 2,448 232,617 236,609
290,950 41,610 438,982 771,542
Liabilities
Deposit liabilities 167,478 11,577 388,445 567,500
Bills payable 29,303 7,582 14,283 51,168
Notes and bonds payable 13,380 25,500 30,975 69,855
210,161 44,659 433,703 688,523
Asset-Liability Gap P=80,789 (P=3,049) P=5,279 P=83,019
Group
2020
Up to
Six Months
Beyond
Six Months
To One Year
Beyond
One Year Total
Resources
Loans P=118,867 P=24,860 P=195,490 P=339,217
Placements 128,429 – 43,972 172,401
Investments 4,448 1,040 199,279 204,767
251,744 25,900 438,741 716,385
Liabilities
Deposit liabilities 238,353 7,941 281,491 527,785
Bills payable 39,099 7,656 7,468 54,223
Notes and bonds payable – 107 59,747 59,854
277,452 15,704 348,706 641,862
Asset-Liability Gap (P=25,708) P=10,196 P=90,035 P=74,523

Risk Management Objectives and Policies - 68 -
*SGVFS162380*
Parent Bank
2021
Up to
Six Months
Beyond
Six Months
To One Year
Beyond
One Year Total
Resources
Loans P=142,490 P=28,877 P=119,680 P=291,047
Placements 91,052 – 45,228 136,280
Investments 1,450 2,428 228,138 232,016
234,992 31,305 393,046 659,343
Liabilities
Deposit liabilities 104,038 8,472 380,549 493,059
Bills payable 23,011 1 5,566 28,578
Notes and bonds payable 13,380 25,500 30,910 69,790
140,429 33,973 417,025 591,427
Asset-Liability Gap P=94,563 (P=2,668) (P=23,979) P=67,916
Parent Bank
2020
Up to
Six Months
Beyond
Six Months
To One Year
Beyond
One Year Total
Resources
Loans P=104,811 P=21,422 P=146,880 P=273,113
Placements 106,464 – 42,167 148,631
Investments 4,354 1,020 196,535 201,909
215,629 22,442 385,582 623,653
Liabilities
Deposit liabilities 190,042 1,930 273,257 465,229
Bills payable 33,183 1 1,319 34,503
Notes and bonds payable – – 59,747 59,747
223,225 1,931 334,323 559,479
Asset-Liability Gap (P=7,596) P=20,511 P=51,259 P=64,174
EAR is complemented by stress tests which are conducted quarterly. It involves subjecting thetotal interest rate sensitive assets and liabilities within one year to probable short-term andmedium-term interest rate movements, assuming parallel and non-parallel (flatteners andsteepeners) in the yield curve.
Additionally, the Bank also monitors long-term sensitivity to interest rate risk of the Bank’sbalance sheet through the Economic Value of Equity (EVE) method. EVE measures theeconomic value which provides a more comprehensive view of potential long-term effects ofchanges in interest rates.
The Bank’s interest rate sensitive asset and liability positions are analyzed based on its cashflows, and its present value are computed using appropriate market rates which include thecurrent risk-free rate plus the corresponding margin. On the other hand, the present values ofnon-interest sensitive assets and liabilities will be kept at their carrying values.
The Bank’s risk management program includes measuring and monitoring the risks associatedwith fluctuations in market interest rates on its net interest income and capital ensuring that theexposures in interest rates are kept within acceptable limits.

Risk Management Objectives and Policies - 69 -
*SGVFS162380*
The following table sets out the impact of changes in interest rates on the Group’s and ParentBank’s net interest income (amounts in millions of Philippine pesos):
Group Parent Bank
Increase (decrease) in interest rates(in basis points) 100 (100) 100 (100)
2021
Change in annualized net interest income (P=346) P=346 (P=173.4) P=173.4
As a percentage of net interest income (0.95%) 0.95% (0.67%) 0.67%
2020
Change in annualized net interest income (P=711) P=711 (P=710) P=710As a percentage of net interest income (1.84%) 1.84% (2.42%) 2.42%
This sensitivity analysis is performed for risk management purposes and assumes no otherchanges in the repricing structure. Actual changes in net interest income may vary from theBank’s internal model.
Foreign Exchange RiskForeign exchange risk is the risk to earnings or capital arising from changes in foreign exchangerates.
The Group’s net foreign exchange exposure, taking into account any spot or forward exchangecontracts, is computed as foreign currency assets less foreign currency liabilities. The foreignexchange exposure is limited to the day-to-day, over-the-counter buying and selling of foreignexchange in the Group’s branches, as well as foreign exchange trading with corporate accountsand other financial institutions. The Group is permitted to engage in proprietary trading to takeadvantage of foreign exchange fluctuations.
The breakdown of the financial resources and financial liabilities of the Group and the ParentBank as to foreign currency-denominated balances (excluding FCDU USD-denominatedfinancial resources and liabilities, which functional currency is in USD), translated to Philippinepesos as of December 31, 2021 and 2020 is shown below:
Group
2021
U.S. Dollars
Other
Foreign
Currencies Total
Resources:Cash and other cash items P=– P=155,222 P=155,222
Due from other banks 3,534,375 2,068,406 5,602,781
Financial assets at FVTPL 296,385 297 296,682
Financial assets at amortized cost – 1,819,081 1,819,081
Loans and other receivables 3,596,552 77,288 3,673,840
7,427,312 4,120,294 11,547,606
Liabilities:Deposit liabilities – 11,214,955 11,214,955
Bills payable 17,533,771 2,617 17,536,388
Notes and bonds payable 6,363,928 – 6,363,928
Derivative liabilities 282,180 1,621 283,801
Accrued interest and other expenses 34,781 308 35,089
Other liabilities 71 78,055 78,126
24,214,731 11,297,556 35,512,287
Currency swaps and forwards 6,811,745 (401,366) 6,410,379
Net exposure (P=9,975,674) (P=7,578,628) (P=17,554,302)

Risk Management Objectives and Policies - 70 -
*SGVFS162380*
Group
2020
U.S. Dollars
OtherForeign
Currencies Total
Resources:
Cash and other cash items P=− P=87,819 P=87,819Due from other banks 2,449,894 2,240,902 4,690,796Financial assets at FVTPL 263,732 1,695 265,427Financial assets at amortized cost − 1,839,183 1,839,183Loans and other receivables 1,580,907 99,932 1,680,839
4,294,533 4,269,531 8,564,064
Liabilities:
Deposit liabilities − 2,895,830 2,895,830Bills payable 22,031,028 24,276 22,055,304Derivative liabilities 263,958 763 264,721Accrued interest and other expenses 32,417 305 32,722Other liabilities 120,079 171,085 291,164
22,447,482 3,092,259 25,539,741
Currency swaps and forwards 12,861,233 (959,562) 11,901,671
Net exposure (P=5,291,716) P=217,710 (P=5,074,006)
Parent Bank
2021
U.S. Dollars
Other
Foreign
Currencies Total
Resources:Cash and other cash items P=− P=155,222 P=155,222
Due from other banks 3,404,899 2,068,406 5,473,305
Financial assets at FVTPL 296,385 297 296,682
Financial assets at amortized cost − 1,819,081 1,819,081
Loans and other receivables 3,593,305 77,288 3,670,593
7,294,589 4,120,294 11,414,883
Liabilities:Deposit liabilities − 11,214,955 11,214,955
Bills payable 17,533,771 2,617 17,536,388
Notes and bonds payable 6,363,928 − 6,363,928
Derivative liabilities 282,180 1,621 283,801
Accrued interest and other expenses 34,781 308 35,089
Other liabilities 71 78,055 78,126
24,214,731 11,297,556 35,512,287
Currency swaps and forwards 6,811,745 (401,366) 6,410,379
Net exposure (P=10,108,397) (P=7,578,628) (P=17,687,025)

Risk Management Objectives and Policies - 71 -
*SGVFS162380*
Parent Bank
2020
U.S. Dollars
OtherForeign
Currencies Total
Resources:
Cash and other cash items P=– P=87,819 P=87,819Due from other banks 1,942,160 2,240,902 4,183,062Financial assets at FVTPL 263,732 1,695 265,427Financial assets at amortized cost – 1,839,183 1,839,183Loans and other receivables 1,580,583 99,932 1,680,515
3,786,475 4,269,531 8,056,006
Liabilities:
Deposit liabilities – 2,895,830 2,895,830Bills payable 22,031,028 24,276 22,055,304Derivative liabilities 263,958 763 264,721Accrued interest and other expenses 32,417 305 32,722Other liabilities 15,606 171,085 186,691
22,343,009 3,092,259 25,435,268
Currency swaps and forwards 12,861,233 (959,562) 11,901,671
Net exposure (P=5,695,301) P=217,710 (P=5,477,591)
The Parent Bank’s policy is to maintain foreign currency exposure within acceptable limits andwithin existing regulatory guidelines. The Parent Bank believes that its profile of foreigncurrency exposure on its assets and liabilities is within conservative limits for a financialinstitution engaged in the type of business in which the Parent Bank is involved.
The following table illustrates the sensitivity of the net results and capital funds to the changes inforeign exchange rates on the Parent Bank’s financial assets and financial liabilities in the RBU.The percentages change (increase and decrease) have been determined based on the averagemarket volatility in exchange rates in the previous 12 months, using a confidence level of 99%.The sensitivity analysis is based on the Parent Bank’s foreign currency-denominated financialinstruments held at each reporting date, including currency swaps and forwards.
2021 2020
% Change
Effect on
Net Profit
For the Year % Change
Effect onNet Profit
For the Year
U.S. dollars 1.0% (182,679) 1.0% (51,581)Japanese yen 2.5% 822 2.5% (6,292)Euros 2.0% 2,122 2.0% 4,540Others 1.6% 1,384 1.6% 4,711
Operational RiskBSP Circular 900, Guidelines on Operational Risk Management, serve as the groundwork for theBank’s Operational Risk Management (ORM) framework. This is to standardize the approachundertaken by the Bank in order to facilitate consistently strong ORM practices across theorganization.
Operational risk is defined as the risk of loss arising from direct or indirect loss from inadequateor failed internal processes, people and systems or from external events. This definition includeslegal risk, but excludes strategic and reputational risk. Direct loss being the result primarily froman operational failure while an indirect loss relates to the impact of operational risk on other riskssuch as market, credit or liquidity risk.

Risk Management Objectives and Policies - 72 -
*SGVFS162380*
Each specific unit of the Bank has its roles and responsibilities in the management of operationalrisk and these are clearly stated in the ORM framework. At the BOD level, an ORMC wasformed to provide overall direction in the management of operational risk, aligned with theoverall business objectives. Key to the effective implementation of the operational riskmanagement framework is a governance structure that transparently defines the lines ofresponsibility from the BOD down to the Business and Functional Units level.
The ORMC was formed and given the mandate to build and lead the roadmap in developing thefoundations and systems necessary for the effective implementation of an Operational RiskManagement Framework. The ORM, together with all other Risk Units, reports directly to theChief Risk Officer.
In managing products, services and systems, these are implemented only after a thoroughoperational risk evaluation. As part of the product and systems approval process, product ownersand managers ensure that risks are clearly identified and adequately controlled and mitigated.For existing products, services and systems, regular reviews are conducted and controls areassessed to determine continued effectiveness. The Parent Bank, as part of its continuing effortto manage operational risk, has ensured that the basic controls to manage exposure to operationalrisk have been embedded in its processes.
Legal Risk and Regulatory Risk ManagementLegal risk pertains to the Parent Bank’s exposure to losses arising from cases decided not infavor of the Parent Bank where significant legal costs have already been incurred, or in someinstances, where the Parent Bank may be required to pay damages. The Parent Bank is ofteninvolved in litigation in enforcing its collection rights under loan agreements in case of borrowerdefault. The Parent Bank may incur significant legal expenses as a result of these events, but theParent Bank may still end up with non-collection or non-enforcement of claims. The ParentBank has established measures to avoid or mitigate the effects of these adverse decisions andengages several qualified legal advisors, who were endorsed to and carefully approved by seniormanagement. At year-end, the Parent Bank also ensures that material adjustments or disclosuresare made in the financial statements for any significant commitments or contingencies which mayhave arisen from legal proceedings involving the Parent Bank.
Regulatory risk refers to the potential risk for the Parent Bank and its subsidiaries to sufferfinancial loss due to changes in the laws, monetary, tax, or other governmental regulations of thecountry. Compliance risk is the Bank’s potential exposure to legal penalties, financial forfeitureand material loss, resulting from its failure to act in accordance with industry laws andregulations, internal policies or prescribed best practices. The monitoring of the Parent Bank’sand subsidiaries’ compliance with these regulations is the primary responsibility of the entity’sCCO. The study of the potential impact of new laws and regulations is coordinated by the CCOwith the Legal Group. The CCO is responsible for communicating and disseminating new rulesand regulations to all units, analyzing and addressing compliance issues, performing periodiccompliance testing, and regularly reporting to the CGC and the BOD.

Capital Management - 73 -
*SGVFS162380*
5. Capital Management
Regulatory CapitalAs the Parent Bank’s regulator, the BSP sets and monitors capital requirements of the ParentBank.
In implementing current capital requirements, the BSP requires the Group and the Parent Bank tomaintain a minimum capital amount and a prescribed ratio of qualifying capital to risk-weightedassets, known as the “capital adequacy ratio” (CAR). Risk-weighted assets is the aggregate valueof assets weighted by credit risk, market risk, and operational risk, based on BSP-prescribedformula provided under BSP Circular No. 360 and BSP Circular No. 538 which contain theimplementing guidelines for the revised risk-based capital adequacy framework to conform toBasel II recommendations.
Effective January 1, 2014, the BSP has adopted the new risk-based capital adequacy frameworkparticularly on the minimum capital and disclosure requirements for the Philippine bankingsystem in accordance with the Basel III standards through BSP Circular No. 781. The adoptedBasel III risk-based capital adequacy framework requires the Group to maintain:
(a) Common Equity Tier 1 (CET1) of at least 6.0% of risk-weighted assets;(b) Tier 1 Capital of at least 7.5% of risk-weighted assets;(c) Qualifying Capital (Tier 1 plus Tier 2 Capital) of at least 10.0% of risk-weighted assets;
and,(d) Capital Conservation Buffer of 2.5% of risk-weighted assets, comprised of CET1 Capital.
On November 29, 2018, the BSP amended the requirements of Subsection X115.1 of the Manualfor Regulations for Banks (MORB) through BSP Circular No. 1024. The amendment requiresthe Group and the Parent Bank to maintain, with respect to the CET 1 requirement, in addition tothe minimum, the following capital buffers:
(a) Capital conservation buffer (CCB) of 2.5%; and(b) Countercyclical capital buffer (CCyB) of 0% subject to upward adjustment to a rate
determined by the MB when systemic conditions warrant but not to exceed to 2.5%.
The Group’s and the Parent Bank’s regulatory capital position as of December 31, 2021 and2020, as reported to the BSP, follow (amounts in millions):
Group Parent Bank
2021 2020 2021 2020
Common Equity Tier 1 CapitalPaid-up common stock P=12,194 P=12,185 P=12,194 P=12,185
Common stock dividends distributable 3,048 – 3,048 –
Additional paid in capital 14,215 14,215 14,215 14,215Surplus free 68,301 63,778 69,543 65,216Undivided profits 12,913 11,671 12,754 11,513
Other comprehensive income/(loss) (2,887) (1,806) (2,807) (1,658)Minority interest in financial allied subsidiary 796 802 – –
Sub-total 108,580 100,845 108,947 101,471
Less Regulatory Adjustments:Total outstanding unsecured credit accommodations,
both direct and indirect, to DOSRI, and unsecuredloans, other credit accommodations and guaranteesgranted to subsidiaries and affiliates 441 378 330 267
Deferred income tax 6,478 6,970 5,172 5,858Goodwill 13,936 13,377 7,887 7,887Other intangible assets 2,233 1,554 1,723 1,013
(Forward)

Capital Management - 74 -
*SGVFS162380*
Group Parent Bank
2021 2020 2021 2020Defined benefit pension fund assets P=15 P=8 P=– P=–
Un-booked valuation reserves 2,435 2,318 2,019 1,888Investments in equity of consolidated subsidiary banksand quasi banks, and other financial allied undertakings – – 22,722 21,777
Other equity investments in non-financial allied andnon-allied undertakings – – – –
Total regulatory adjustments to Common Equity
Tier 1 capital 25,538 24,605 39,853 38,690
Total Common Equity Tier 1 capital 83,042 76,240 69,094 62,781
Total Tier 1 capital P=83,042 P=76,240 P=69,094 P=62,781
Tier 2 CapitalGeneral loan loss provision P=3,820 P=3,627 P=2,588 P=2,602Unsecured subordinated debt 6,800 6,800 6,800 6,800
Total Tier 2 capital 10,620 10,427 9,388 9,402
Net Tier 1 capital 83,042 76,240 69,094 62,781Net Tier 2 capital 10,620 10,427 9,388 9,402
Total qualifying capital 93,662 86,667 78,482 72,183
Credit risk-weighted assets 451,323 451,416 381,172 381,932
Market risk-weighted assets 4,619 12,046 4,361 12,046Operational risk-weighted assets 52,642 46,175 40,009 33,903
Total risk-weighted assets P=508,584 P=509,637 P=425,542 P=427,881
Capital ratios:Total regulatory capital expressed as percentage of total
risk weighted assets 18.42% 17.01% 18.44% 16.87%Total Tier 1 expressed as percentage of total
risk-weighted assets 16.33% 14.96% 16.24% 14.67%
Total Common Equity Tier 1 expressed as percentage
of total risk-weighted assets 16.33% 14.96% 16.24% 14.67%
Conservation buffer 10.33% 8.96% 10.24% 8.67%
The Group and the Parent Bank have fully complied with the CAR requirements of the BSP.
The breakdown of credit risk-weighted assets, market risk-weighted assets and operationalrisk-weighted assets follow (amounts in millions):
Group Parent Bank
2021 2020 2021 2020
On-books assets P=436,531 P=439,066 P=366,398 P=369,587Off-books assets 10,699 8,196 10,681 8,191Counterparty risk-weighted
assets in the banking books 2,830 3,383 2,830 3,383assets in the trading books 1,263 771 1,263 771
Total Credit Risk-Weighted Assets P=451,323 P=451,416 P=381,172 P=381,932
Capital Requirements P=45,132 P=45,142 P=38,117 P=38,193
Interest rate exposures P=3,511 P=6,261 P=3,511 P=6,261Equity exposures – 5,156 – 5,156Foreign exchange exposures 1,108 629 850 629
Total Market Risk-Weighted Assets P=4,619 P=12,046 P=4,361 P=12,046
Capital Requirements P=462 P=1,205 P=436 P=1,205
Total Operational Risk-Weighted Assets - Basicindicator P=52,642 P=46,175 P=40,009 P=33,903
Capital Requirements P=5,264 P=4,618 P=4,001 P=3,390

Capital Management - 75 -
*SGVFS162380*
The total credit exposure broken down by type of exposures and risk weights follow (amounts inmillions):
Group
2021
Credit Risk
Total Credit
Risk Exposure
Total
Credit Risk
Exposure
after Risk
Mitigation 0%-50% 75%-100% 150%
Total
Weighted
Assets
Risk-Weighted On-Books Assets
Cash on hand P=8,893 P=8,893 P=8,893 P= – P= – P= –
Checks and other cash items 10 10 10 – – 2
Due from BSP 103,413 103,413 103,413 – – –
Due from other banks 54,287 54,287 52,378 1,909 – 27,510
Financial assets at FVTPL 38 38 38 – 38
Financial assets at FVOCI 66,230 48,510 27,306 21,204 – 21,925
Financial assets at amortized cost 169,602 169,602 150,330 19,272 – 26,753
Loans and receivables 340,587 340,465 44,197 288,980 7,288 318,599
SPURRA 23,421 4,684 4,684 – – –
Sales contract receivable (SCR) 1,421 1,421 – 134 1,286 2,064
ROPA 5,891 5,891 – – 5,891 8,837
Other assets 27,058 27,058 2 27,056 – 27,056
Total risk-weighted on-books assets notcovered by CRM 800,851 764,272 391,213 358,593 14,465 432,784
Total risk-weighted on-books assets
covered by CRM – 36,579 36,579 1 – 3,747
P=800,851 P=800,851 P=427,792 P=358,594 P=14,465 P=436,531
Risk-Weighted Off-Books Assets
Direct credit substitutes (e.g., generalguarantee of indebtedness and
acceptances) P=2,884 P=– P=– P=2,884 P=– P=2,884
Transaction-related contingencies(e.g., performance bonds, bid
bonds, warrantees and stand-byLCs related to particulartransactions) 2,656 – – 1,328 – 1,328
Trade-related contingencies arisingfrom movements of goods(e.g., documentary credits
collateralized by the underlyingshipments) and commitments withan original maturity of up to one
year 32,436 – – 6,487 – 6,487
P=37,976 P=– P=– P=10,699 P=– P=10,699
Counterparty Risk-Weighted Assets
in the Banking Books
Repo-style Exposure P=23,575 P=4,902 P=4,144 P=758 P=– P=2,830
Counterparty Risk-Weighted Assets
in the Trading Books
Interest Rate Contracts P=2,550 P=– P=– P=– P=– P=–
Exchange Rate Contracts 59,150 1,764 1,010 754 – 1,249
Credit Derivatives 512 27 27 – – 14
Total P=62,212 P=1,791 P=1,037 P=754 P=– P=1,263

Capital Management - 76 -
*SGVFS162380*
Group
2020
Credit RiskTotal Credit
Risk Exposure
Total
Credit RiskExposure
after Risk
Mitigation 0%-50% 75%-100% 150%
TotalWeighted
Assets
Risk-Weighted On-Books AssetsCash on hand P=8,755 P=8,755 P=8,755 P= – P= – P= –
Checks and other cash items 30 30 30 – – 6Due from BSP 103,879 103,879 103,879 – – –Due from other banks 68,723 68,723 66,663 2,060 – 31,492
Financial assets at FVTPL 37 37 – 37 – 37Financial assets at FVOCI 31,174 28,645 16,740 11,905 – 12,554Financial assets at amortized cost 165,005 164,234 124,601 39,633 – 54,557
Loans and receivables 311,159 311,013 23,192 279,348 8,473 303,654SPURRA 16,745 3,349 3,349 – – –Sales contract receivable (SCR) 1,443 1,443 – 113 1,330 2,108
ROPA 5,619 5,619 – – 5,619 8,428Other assets 24,937 24,937 157 24,780 – 24,781
Total risk-weighted on-books assets notcovered by CRM 737,506 720,664 347,366 357,876 15,422 437,617
Total risk-weighted on-books assetscovered by CRM – 16,841 16,837 4 – 1,449
P=737,506 P=737,505 P=364,203 P=357,880 P=15,422 P=439,066
Risk-Weighted Off-Books AssetsDirect credit substitutes (e.g., general
guarantee of indebtedness and
acceptances) P=1,357 P=– P=– P=1,357 P=– P=1,357Transaction-related contingencies
(e.g., performance bonds, bid
bonds, warrantees and stand-byLCs related to particulartransactions) 3,330 – – 1,665 – 1,665
Trade-related contingencies arisingfrom movements of goods(e.g., documentary credits
collateralized by the underlyingshipments) and commitments withan original maturity of up to one
year 25,870 – – 5,174 – 5,174
P=30,557 P=– P=– P=8,196 P=– P=8,196
Counterparty Risk-Weighted Assets inthe Banking Books
Repo-style Exposure P=30,745 P=6,421 P=5,615 P=806 P=– P=3,383
Counterparty Risk-Weighted Assets inthe Trading Books
Interest Rate Contracts P=4,010 P=550 P=278 P=272 P=– P=411Exchange Rate Contracts 47,517 576 387 189 – 360
Total P=51,527 P=1,126 P=665 P=461 P=– P=771

Capital Management - 77 -
*SGVFS162380*
Parent Bank
2021
Credit Risk
Total Credit
Risk Exposure
Total
Credit Risk
Exposure
after Risk
Mitigation 0%-50% 75%-100% 150%
Total
Weighted
Assets
Risk-Weighted On-Books Assets
Cash on hand P=7,989 P=7,989 P=7,989 P= – P= – P= –
Due from BSP 67,480 67,480 67,480 – – –
Due from other banks 51,337 51,337 50,924 413 – 25,287
Financial assets through other
comprehensive income 66,083 48,363 27,159 21,204 – 21,906
Financial assets at amortized cost 165,377 165,377 146,105 19,272 – 26,735
Loans and receivables 284,490 284,424 42,890 237,699 3,834 261,484
SPURRA 15,541 3,108 3,108 – – –
SCR 1,352 1,352 – 101 1,251 1,977
ROPA 4,359 4,359 – – 4,359 6,538
Other assets 18,731 18,731 – 18,731 – 18,731
Total risk-weighted on-books assets not
covered by CRM 682,739 652,520 345,655 297,420 9,444 362,658
Total risk-weighted on-books assetscovered by CRM – 30,220 30,219 1 – 3,740
P=682,739 P=682,740 P=375,874 P=297,421 P=9,444 P=366,398
Risk-Weighted Off-Books Assets
Direct credit substitutes (e.g., generalguarantee of indebtedness andacceptances) P=2,884 P=– P=– P=2,884 P=– P=2,884
Transaction-related contingencies (e.g.,performance bonds, bid bonds,warrantees and stand-by LCs
related to particular transactions) 2,656 – – 1,328 – 1,328
Trade-related contingencies arisingfrom movements of goods (e.g.,
documentary credits collateralizedby the underlying shipments) andcommitments with an original
maturity of up to one year 32,345 – – 6,469 – 6,469
P=37,885 P=– P=– P=10,681 P=– P=10,681
Counterparty Risk-Weighted Assets
in the Banking Books
Repo-style Exposure P=23,575 P=4,902 P=4,144 P=758 P=– P=2,830
Counterparty Risk-Weighted Assets
in the Trading Books
Interest Rate Contracts P=2,550 P=– P=– P=– P=– P=–
Exchange Rate Contracts 59,150 1,764 1,010 754 – 1,249
Credit Derivatives 512 27 27 – – 14
Total P=62,212 P=1,791 P=1,037 P=754 P=– P=1,263

Capital Management - 78 -
*SGVFS162380*
Parent Bank
2020
Credit RiskTotal Credit
Risk Exposure
Total
Credit RiskExposure
after Risk
Mitigation 0%-50% 75%-100% 150%
Total
Weighted
Assets
Risk-Weighted On-Books AssetsCash on hand P=7,815 P=7,815 P=7,815 P= – P= – P= –
Due from BSP 83,875 83,875 83,875 – – –Due from other banks 64,783 64,783 64,463 320 – 28,652Financial assets through other
comprehensive income 30,983 28,454 16,558 11,896 – 12,519Financial assets at amortized cost 162,363 161,592 121,959 39,633 – 54,549Loans and receivables 255,260 255,171 21,938 227,728 5,505 246,955
SPURRA 10,373 2,075 2,075 – – –SCR 1,364 1,364 – 73 1,291 2,010ROPA 4,038 4,038 – – 4,038 6,057
Other assets 17,400 17,400 – 17,400 – 17,400
Total risk-weighted on-books assets not
covered by CRM 638,254 626,567 318,683 297,050 10,834 368,142Total risk-weighted on-books assets
covered by CRM – 11,687 11,683 4 – 1,445
P=638,254 P=638,254 P=330,366 P=297,054 P=10,834 P=369,587
Risk-Weighted Off-Books Assets
Direct credit substitutes (e.g., generalguarantee of indebtedness andacceptances) P=1,357 P=– P=– P=1,357 P=– P=1,357
Transaction-related contingencies (e.g.,performance bonds, bid bonds,warrantees and stand-by LCs
related to particular transactions) 3,330 – – 1,665 – 1,665Trade-related contingencies arising
from movements of goods (e.g.,
documentary credits collateralizedby the underlying shipments) andcommitments with an original
maturity of up to one year 25,841 – – 5,169 – 5,169
P=30,528 P=– P=– P=8,191 P=– P=8,191
Counterparty Risk-Weighted Assets inthe Banking Books
Repo-style Exposure P=30,745 P=6,421 P=5,615 P=806 P=– P= 3,383
Counterparty Risk-Weighted Assets inthe Trading Books
Interest Rate Contracts P=4,010 P=550 P=278 P=272 P=– P=411Exchange Rate Contracts 47,517 576 387 189 – 360
Total P=51,527 P=1,126 P=665 P=461 P=– P=771
Risk weighted on-balance sheet assets covered by credit risk mitigants were based oncollateralized transactions as well as guarantees by the Philippine National Government andthose guarantors and exposures with the highest credit rating.
Standardized credit risk weights were used in the credit assessment of asset exposures. Thirdparty credit assessments were based on the ratings by Standard & Poor’s, Moody’s, Fitch andPhilratings on exposures to Sovereigns, Multilateral Development Banks, Banks, LocalGovernment Units, Government Corporations and Corporates.
Minimum Capital RequirementUnder the relevant provisions of current BSP regulations, the required minimum capitalization ofa universal bank is P=20.0 billion both as of December 31, 2021 and 2020. As of those dates, theBank is in compliance with these regulations.

Capital Management - 79 -
*SGVFS162380*
Basel III Leverage Ratio (BLR)BSP Circular Nos. 881 and 990 cover the implementing guidelines on the BLR frameworkdesigned to act as a supplementary measure to the risk-based capital requirements and shall notbe less than 5.00%. The monitoring period has been set every quarter starting December 31,2014 and extended until June 30, 2018. Effective July 1, 2018, the monitoring of the leverageratio was implemented as a Pillar I minimum requirement.
The details of the BLR as of December 31, 2021 and 2020 follow (amounts in millions, exceptfor percentages):
Consolidated Parent Bank
2021 2020 2021 2020
Tier 1 Capital P=83,042 P=76,240 P=69,094 P=62,780Exposure Measure 820,457 763,706 702,738 664,873BLR 10.12% 9.98% 9.83% 9.44%
Under the framework, BLR is defined as the capital measure divided by the exposure measure.Capital measure is Tier 1 capital. Exposure measure is the sum of on-balance sheet exposures,derivative exposures, security financing exposures and off-balance sheet items.
Ensuring Sufficient CapitalOn January 15, 2009, the BSP issued Circular No. 639, which articulates the need for banks toadopt and document an Internal Capital Adequacy Assessment Process (ICAAP). All universaland commercial banks are expected to perform a thorough assessment of all their material risks,as well as maintain capital adequate to support these risks. This is intended to complement thecurrent regulatory capital requirement of at least 10% of risk assets, which only covers credit,market and operational risks. On December 29, 2009, the BSP issued Circular No. 677 thateffectively extends the implementation of the ICAAP from January 2010 to January 2011.
Cognizant of the importance of a strong capital base to meet strategic and regulatoryrequirements, the Parent Bank has adopted a robust ICAAP on a group-wide level that isconsistent with its risk philosophy and risk appetite. The ICAAP Document embodies theGroup’s risk philosophy, risk appetite, and risk governance framework and structure, andintegrates these with: (a) the Group’s strategic objectives and long-term strategies; (b) thefive-year financial and business plans; and,(c) the capital plan and dividend policy.
The ICAAP’s objective is to ensure that the BOD and senior management actively and promptlyidentify and manage the material risks arising from the general business environment, and that anappropriate level of capital is maintained to cover these risks.
On January 4, 2018, the BSP issued Circular No. 989 which mandates the conduct of stresstesting exercise of banks. The Group’s ICAAP Document considered the impact of severe butplausible scenarios on the Group’s capital position. The results are thoroughly discussed duringRMC meetings, and reported to the Board. In the course of its discussions, the BOD and seniormanagement may request for additional stress testing scenarios or revisions to the testassumptions in order to better align these to current trends and forecasts.
The Group has a cross-functional ICAAP technical team, comprised of representatives from thecore risk management units - credit, market, operational, information technology, and emergingrisks; corporate planning; financial controllership; treasury; internal audit; and compliance. Thisensures a well-coordinated approach to the development, documentation, implementation,review, improvement, and maintenance of the various sub-processes included in the ICAAP.

Capital Management and
Segment Reporting - 80 -
*SGVFS162380*
The key members of the ICAAP technical team are enrolled in further training as well as variousfora and briefings to enhance their knowledge and expertise particularly on the subjects ofICAAP, Basel III, and their interface with PFRS.
The Group’s ICAAP Document is subjected each year to an independent review by the InternalAudit Division (IAD) to provide reasonable assurance that the Group has met the regulatoryrequirements. For the 2022 ICAAP Document submission, the results of the audit assessmentwere presented to the Audit Committee and the BOD.
Based on IAD’s assessment of the ICAAP document, its related supporting documents, andexisting processes and structures, IAD reported that the Group has satisfactorily complied withthe minimum requirements prescribed in BSP Circular No. 639. Presence of a proper governanceand oversight function of the ICAAP, comprehensive risk management framework, and soundcapital management process were verified in the audit process. For 2021, the Group and ParentBank’s ICAAP Document was submitted to the BSP on April 6, 2021.
6. Segment Reporting
Business SegmentsThe Group’s main operating businesses are organized and managed separately according to thenature of products and services provided and the different markets served, with each segmentrepresenting a strategic business unit. These are also the basis of the Group in reporting to itschief operating decision-maker for its strategic decision-making activities. The Group’s mainbusiness segments are presented below.
(a) Consumer BankingThis segment principally handles individual customers’ deposits and provides consumer typeloans, such as automobiles and mortgage financing, credit card facilities and funds transferfacilities.
(b) Corporate and Commercial BankingThis segment principally handles loans and other credit facilities and deposit and currentaccounts for corporate, institutional, small and medium enterprises, and middle marketcustomers.
(c) Treasury and Trust
This segment is principally responsible for managing the Bank’s liquidity and fundingrequirements, and handling transactions in the financial markets covering foreign exchange,fixed income trading and investments, and derivatives. The segment also includes trust, assetmanagement and fiduciary services provided by the Bank to its customers.
(d) Headquarters
This segment includes corporate management, support and administrative units notspecifically identified with Consumer Banking, Corporate and Commercial Banking orTreasury.
These segments are the basis on which the Group reports its primary segment information.Transactions between segments are conducted at estimated market rates on an arm’s lengthbasis.
Segment resources and liabilities comprise operating resources and liabilities including itemssuch as taxation and borrowings. Revenues and expenses that are directly attributable to aparticular business segment and the relevant portions of the Group’s revenues and expensesthat can be allocated to that business segment are accordingly reflected as revenues andexpenses of that business segment.

Segment Reporting - 81 -
*SGVFS162380*
Analysis of Segment InformationSegment information of the Group as of and for the years ended December 31, 2021, 2020 and2019 follow (amounts in millions):
Consumer
Banking
Corporate and
Commercial
Banking Treasury Headquarters Total
December 31, 2021
Results of operationsNet interest income and
other income P=19,574 P=10,070 P=14,078 P=1,394 P=45,116
Other expenses (11,314) (2,754) (1,870) (8,382) (24,320)
Income before creditlosses and income tax P=8,260 P=7,316 P=12,208 (P=6,988) 20,796
Provision for credit losses (5,811)
Tax expense (2,407)
Net income P=12,578
Segment resources P=225,696 P=211,258 P=343,716 P=50,425 P=831,095
Segment liabilities P=397,983 P=132,848 P=121,784 P=66,267 P=718,882
Other information:Depreciation and amortization P=995 P=9 P=9 P=611 ₱1,624
Capital expenditures 398 342 7 2,583 3,330
ConsumerBanking
Corporate andCommercial
Banking Treasury Headquarters Total
December 31, 2020Results of operations
Net interest income andother income P=17,244 P=10,776 P=14,558 (P=481) P=42,097
Other expenses (9,839) (2,556) (2,046) (6,932) (21,373)
Income before creditlosses and income tax P=7,405 P=8,220 P=12,512 (P=7,413) 20,724
Provision for credit losses (8,382)Tax expense (781)
Net income P=11,561
Segment resources P=198,004 P=191,700 P=263,197 P=121,558 P=774,459
Segment liabilities P=325,529 P=142,167 P=137,240 P=64,371 P=669,307
Other information:Depreciation and amortization P=984 P=3 P=7 P=413 ₱1,407Capital expenditures 370 163 19 1,030 1,582
ConsumerBanking
Corporate andCommercial
Banking Treasury Headquarters Total
December 31, 2019Results of operations
Net interest income andother income P=15,279 P=6,810 P=14,476 P=116 P=36,681
Other expenses (8,813) (2,044) (1,687) (7,781) (20,325)
Income before creditlosses and income tax P=6,466 P=4,766 P=12,789 (P=7,665) 16,356
Provision for credit losses (1,857)Tax expense (495)
Net income P=14,004
Segment resources P=177,147 P=255,308 P=279,820 P=58,513 P=770,788
Segment liabilities P=283,771 P=135,677 P=183,904 P=69,419 P=672,771
Other information:Depreciation and amortization P=714 P=14 P=15 P=635 ₱1,378Capital expenditures 377 491 12 1,667 2,547

Fair Value Measurement and Offsetting of Financial Assets and Financial Liabilities - 82 -
*SGVFS162380*
7. Fair Value Measurement and Offsetting of Financial Assets and Financial Liabilities
Fair Value HierarchyIn accordance with PFRS 13, Fair Value Measurement, the fair value of financial assets andliabilities and non-financial assets which are measured at fair value on a recurring ornon-recurring basis and those assets and liabilities not measured at fair value but for which fairvalue is disclosed in accordance with other relevant PFRS, are categorized into three levels basedon the significance of inputs used to measure the fair value. The fair value hierarchy has thefollowing levels:
Level 1: quoted prices (unadjusted) in active markets for identical assets or liabilities;
Level 2: inputs other than quoted prices included within Level 1 that are observable for theresource or liability, either directly (i.e. as prices) or indirectly (i.e. derived from prices); and,
Level 3: inputs for the asset or liability that are not based on observable market data(unobservable inputs).
The level within which the financial asset or liability is classified is determined based on thelowest level of significant input to the fair value measurement.
For purposes of determining the market value at Level 1, a market is regarded as active if quotedprices are readily and regularly available from an exchange, dealer, broker, industry group,pricing service, or regulatory agency, and those prices represent actual and regularly occurringmarket transactions on an arm’s length basis.
For investments which do not have quoted market price, the fair value is determined by usinggenerally acceptable pricing models and valuation techniques or by reference to the currentmarket of another instrument which is substantially the same after taking into account the relatedcredit risk of counterparties, or is calculated based on the expected cash flows of the underlyingnet asset base of the instrument.
When the Group uses valuation technique, it maximizes the use of observable market data whereit is available and relies as little as possible on entity specific estimates. If all significant inputsrequired to determine the fair value of an instrument are observable, the instrument is included inLevel 2. Otherwise, it is included in Level 3.
For assets and liabilities that are recognized at fair value in the statement of financial position ona recurring basis, the Group determines whether transfers have occurred between Levels in thehierarchy by reassessing categorization (based on the lowest level input that is significant to thefair value measurement as a whole) at the end of each reporting period.

Fair Value Measurement and Offsetting of Financial Assets and Financial Liabilities - 83 -
*SGVFS162380*
The financial assets and financial liabilities measured at fair value in the consolidated statementsof financial position are grouped into the fair value hierarchy as follows:
a) Financial instruments measured at fair value
Group
December 31, 2021
Level 1 Level 2 Level 3 Total
Resources
Financial assets at FVTPL
Debt securities P=4,334,697 P=30,343 P=– P=4,365,040
Equity securities 37,735 140,800 31,000 209,535
Derivative assets − 1,017,236 48,194 1,065,430
Trust fund assets 62,802 − − 62,802
Financial assets at FVOCIDebt securities 65,475,025 − − 65,475,025
Equity securities − − 197,585 197,585
Liabilities
Derivative liabilities − 750,009 − 750,009
December 31, 2020
Level 1 Level 2 Level 3 Total
Resources
Financial assets at FVTPL
Debt securities P=15,012,469 P=– P=– P=15,012,469Equity securities 2,586,451 138,490 28,775 2,753,716Derivative assets − 637,082 45,382 682,464
Trust fund assets 65,833 − − 65,833Financial assets at FVOCI
Debt securities 31,148,586 − − 31,148,586
Equity securities − − 41,673 41,673Liabilities
Derivative liabilities − 747,310 − 747,310
Parent Bank
December 31, 2021
Level 1 Level 2 Level 3 Total
Resources
Financial assets at FVTPL
Debt securities P=4,334,697 P=30,343 P=– P=4,365,040
Equity securities − 140,800 − 140,800
Derivative assets − 1,017,236 48,194 1,065,430
Financial assets at FVOCIDebt securities 65,329,018 − − 65,329,018
Equity securities − − 41,673 41,673
Liabilities
Derivative liabilities − 750,009 − 750,009
December 31, 2020
Level 1 Level 2 Level 3 Total
Resources
Financial assets at FVTPL
Debt securities P=15,012,469 P=– P=– P=15,012,469Equity securities 2,577,881 138,490 − 2,716,371Derivative assets − 637,082 45,382 682,464
Financial assets at FVOCIDebt securities 30,967,368 − − 30,967,368Equity securities − − 41,673 41,673
Liabilities
Derivative liabilities − 747,310 − 747,310

Fair Value Measurement and Offsetting of Financial Assets and Financial Liabilities - 84 -
*SGVFS162380*
b) Financial instruments measured at amortized cost and investment properties for which fair
value is disclosed
GroupDecember 31, 2021
Carrying Value Level 1 Level 2 Level 3 Total
Resources
Financial Assets
Financial assets at amortized cost P=166,362,179 P=164,087,461 P=– P=– P=164,087,461
Loans and other receivables 359,774,631 − − 368,384,627 368,384,627
Nonfinancial Assets
Investment properties 8,673,344 − − 17,735,995 17,735,995
Liabilities
Financial Liabilities
Deposit liabilities 570,500,892 − – 570,599,091 570,599,091
Bills payable 51,168,138 – 50,737,318 − 50,737,318
Notes and bonds payable 69,853,986 – 70,223,779 − 70,223,779
December 31, 2020
Carrying Value Level 1 Level 2 Level 3 Total
Resources
Financial Assets
Financial assets at amortized cost P=155,810,967 P=176,826,261 P=– P=– P=176,826,261
Loans and other receivables 339,536,830 − − 344,060,281 344,060,281Nonfinancial Assets
Investment properties 8,922,366 − − 15,052,499 15,052,499
Liabilities
Financial Liabilities
Deposit liabilities 527,785,026 − – 527,967,468 527,967,468
Bills payable 54,223,543 – 54,550,042 − 54,550,042Notes and bonds payable 59,853,656 – 72,725,976 − 72,725,976
Parent Bank
December 31, 2021
Carrying Value Level 1 Level 2 Level 3 Total
Resources
Financial assets at amortized cost P=162,139,448 P=159,885,712 P=– P=– P=159,885,712
Loans and other receivables 291,118,202 − − 299,728,198 299,728,198
Investment properties 7,435,877 − − 16,498,528 16,498,528
Liabilities
Deposit liabilities 493,059,181 − – 493,157,380 493,157,380
Bills payable 28,577,774 – 28,146,954 − 28,146,954
Notes and bonds payable 69,789,836 – 70,159,629 − 70,159,629
December 31, 2020
Carrying Value Level 1 Level 2 Level 3 Total
Resources
Financial assets at amortized cost P=153,171,111 P=176,223,481 P=– P=– P=176,223,481
Loans and other receivables 273,339,863 − − 277,863,314 273,284,331Investment properties 7,662,547 − − 13,792,680 13,792,680
Liabilities
Deposit liabilities 465,228,619 − – 465,411,061 465,411,061
Bills payable 34,502,421 – 34,828,920 − 34,828,920Notes and bonds payable 59,746,857 – 72,619,177 − 72,619,177
There were neither transfers between Levels 1 and 2 nor changes in Level 3 instruments in bothyears. Certain disclosures required for financial instruments measured at fair value and classifiedas Level 3 are not presented as these financial instruments are comprised of derivative assets andunquoted equity securities that are not material to the financial statements.

Fair Value Measurement and Offsetting of Financial Assets and Financial Liabilities - 85 -
*SGVFS162380*
Below information provided about how the fair values of the Group’s classes of financialinstruments are determined.
(a) For Cash and other cash items, Due from BSP and other banks, Interbank loans receivable,
SPURRA (included under loans and other receivable) and Returned checks and other cash
items, and Other liabilities such as Manager’s checks, Bills purchased, Accounts payable,Accrued interest payable, Payment orders payable and Due to Treasurer of the Philippines
Management considers that the carrying amounts approximate their fair value due to theirshort-term nature. Accordingly, these are not presented in the tables above.
(b) Debt securities
Fair values of debt securities under Level 1, composed of government securities issued by thePhilippine government and other foreign governments and private debt securities, aredetermined based on quoted prices at the close of business as appearing on Bloomberg. Fairvalues of debt securities under Level 2 composed of government securities, determined basedon observable input prices of similar securities appearing on Bloomberg.
(c) Derivatives
The fair values of derivative financial instruments that are not quoted in an active market aredetermined through valuation techniques using the net present value computation (seeNote 3). The inputs to these models are taken from observable markets where possible, butwhere this is not feasible, a degree of judgment is required in establishing fair values.
(d) Equity securities
Instruments included in Level 1 comprise equity securities classified as financial assets atFVTPL. These securities are valued based on their closing prices published by the PhilippineStock Exchange.
Club shares classified as financial assets at FVTPL are included in Level 2 as their prices arenot derived from market considered as active due to lack of trading activities among marketparticipants at the end or close to the end of the reporting period.
Equity instruments included in Level 3 are UIC’s investment in unquoted equity securitiesvalued using the adjusted net asset method. The adjusted net asset method involves derivingthe fair value of the investee’s equity instruments by reference to the fair value of its assetsand liabilities. Adjustments in the fair value of the investee’s net assets, such as discount forthe lack of liquidity, were also considered in the valuation. The Level 3 unquoted equityinstruments are not material to the consolidated financial statements.
(e) Loans and receivables, Deposit liabilities and Bills payableThe Group maximizes the use of observable market data where it is available and rely aslittle as possible on entity specific estimates. If all significant inputs required to determinethe fair value of an instrument are observable, the instrument is included in Level 2.Otherwise, it is included in Level 3.
(f) Notes and bonds payableFair values of notes and bonds payable under Level 2 are determined based on quoted pricesat the close of business as appearing on PDEx and Bloomberg. These are classified asLevel 2 due to absence of an active market.

Fair Value Measurement and Offsetting of Financial Assets and Financial Liabilities - 86 -
*SGVFS162380*
(g) Investment properties
The fair values of the Group’s investment properties are determined on the basis of theappraisals performed by internal appraisers (for investment properties with values belowP=5 million) and independent appraisal companies acceptable to the BSP (for investmentproperties with fair values above P=5 million), with appropriate qualifications and recentexperience in the valuation of similar properties in the relevant locations. The valuationprocess is conducted by the appraisers with respect to the determination of the inputs such asthe size, age, and condition of the land and buildings, and the comparable prices in thecorresponding property location.
In estimating the fair value of these properties, appraisal companies take into account themarket participant’s ability to generate economic benefits by using the assets in their highestand best use. Based on management’s assessment, the best use of the Group’s non-financialassets indicated above is their current use.
The fair values of investment properties are determined using the market data approach thatreflects observable and recent transaction prices for similar properties in nearby locations.Under this approach, when sales prices of comparable property in close proximity are used inthe valuation of the subject property with no adjustment on the price, fair value is included inLevel 2. On the other hand, if the observable and recent prices of the reference propertieswere adjusted for differences in key attributes such as property size, zoning, andaccessibility, the fair value will be the lower level of the hierarchy or Level 3. The mostsignificant input into this valuation approach is the price per square meter, hence, the higherthe price per square meter, the higher the fair value.
There has been no change to the valuation techniques used by the Group during the year forits investment properties.
Offsetting Financial Assets and Financial LiabilitiesCertain financial assets and financial liabilities of the Group and the Parent Bank with amountspresented in the statements of financial position as of December 31, 2021 and 2020 are subject tooffsetting, enforceable master netting arrangements and similar agreements. However, therewere no financial assets and financial liabilities presented at net in the statements of financialposition.
Presented below is the financial assets and financial liabilities subject to offsetting but the relatedamounts are not set-off in the statements of financial position.
Group
December 31, 2021 December 31, 2020
Net amount
presented
in the statement
Related amounts not set off
in the statement of
financial position
Net amount
presentedin the statement
Related amounts not set
off in the statement offinancial position
of financial
position
Financial
Instruments
Collateral
Received Net Exposure
of financialposition
FinancialInstruments
CollateralReceived Net Exposure
Financial assets
Derivative assets
Currency forwards P=468,358 P=344,744 P=− P=123,614 P=104,488 P=40,800 P=− P=63,688 Cross currency interest
rate swaps 547,012 88,973 − 458,039 532,594 488,217 − 44,377Loans and receivables 23,841,824 − 24,096,716 − 17,902,216 − 16,796,554 1,105,662
Total financial assets P=24,857,194 P=433,717 P=24,096,716 P=581,653 P=18,539,298 P=529,017 P=16,796,554 P=1,213,727
Financial liabilities
Derivative liabilities
Currency forwards P=260,235 P=344,744 P=− (P=84,509) P=258,434 P=40,800 P=− P=217,634
Cross currency swaps 489,774 88,973 − 400,801 488,876 488,217 − 659Deposit liabilities 585,863 421,082 − 164,781 1,649,048 1,157,126 − 491,922Bills Payable 23,420,742 23,697,462 − − 16,745,090 16,745,090 − −Total financial liabilities P=24,756,614 P=24,552,261 P=− P=481,073 P=19,141,448 P=18,431,233 P=− P=710,215

Fair Value Measurement, Offsetting of Financial Assets and Financial Liabilities and
Cash and Balances with the BSP - 87 -
*SGVFS162380*
Parent Bank
December 31, 2021 December 31, 2020
Net amount
presented
in the statement
Related amounts not set off
in the statement of
financial position
Net amountpresented
in the statement
Related amounts not setoff in the statement of
financial position
of financial
position
Financial
Instruments
Collateral
Received Net Exposure
of financialposition
FinancialInstruments
CollateralReceived Net Exposure
Financial assets
Derivative assets
Currency forwards P=468,358 P=344,744 P=− P=123,614 P=104,488 P=40,800 P=− P=63,688 Cross currency interest
rate swaps 547,012 88,973 − 458,039 532,594 488,217 − 44,377Loans and receivables 15,964,079 − 16,222,799 − 11,497,771 − 10,424,758 1,073,013
Total financial assets P=16,979,449 P=433,717 P=16,222,799 P=581,653 P=12,134,853 P=529,017 P=10,424,758 P=1,181,078
Financial liabilities
Derivative liabilities
Currency forwards P=260,235 P=344,744 P=− (P=84,509) P=258,434 P=40,800 P=− P=217,634 Cross currency swaps 489,774 88,973 − 400,801 488,876 488,217 − 659
Deposit liabilities 564,035 404,783 − 159,252 1,595,483 1,124,477 − 471,006Bills Payable 15,541,296 15,541,296 − − 10,373,294 10,373,294 − −Total financial liabilities P=16,855,340 P=16,379,796 P=− P=475,544 P=12,716,087 P=12,026,788 P=− P=689,299
8. Cash and Balances with the BSP
These accounts are composed of the following as of December 31:
Group Parent Bank
2021 2020 2021 2020
Cash and other cash items P=8,904,903 P=8,958,042 P=7,988,517 P=7,814,917
Due from BSPMandatory reserves P=46,511,088 P=42,730,160 P=44,334,946 P=40,953,821Non-mandatory reserves 56,896,858 61,139,610 23,143,443 42,913,613
P=103,407,946 P=103,869,770 P=67,478,389 P=83,867,434
Cash consists primarily of funds in the form of Philippine currency notes and coins in the Groupand the Parent Bank’s vault and those in the possession of tellers, including ATMs. Other cashitems include cash items (other than currency and coins on hand) such as checks drawn on otherbanks or other branches that were received after the Group and the Parent Bank’s clearing cut-offtime until the close of the regular banking hours.
Mandatory reserves represent the balance of the deposit account maintained with the BSP to meetreserve requirements and to serve as clearing account for interbank claims (see Note 21). Duefrom BSP bears annual interest rates ranging from 1.50% to 2.00% in 2021, from 1.50% to4.30% in 2020, from 3.50% to 5.15% in 2019, except for the amounts within the required reserveas determined by the BSP. Total interest income on Due from BSP recognized by the Groupamounted to P=665,311, P=962,515, and P=63,730, in 2021, 2020, and 2019 respectively, while thetotal interest income on Due from BSP recognized by the Parent Bank amounted to P=325,236,P=709,244, and P=38,644, in 2021, 2020, and 2019, respectively.
Under Section 254 of the MORB, a bank shall keep its required reserves in the form of depositsplaced in the bank’s demand deposit account with the BSP. Section 254.1 of the MORB furtherprovides that such deposit account with the BSP is not considered as a regular current account asdrawings against such deposits shall be limited to: (a) settlement of obligation with the BSP, and(b) withdrawals to meet cash requirements.

Due from Other Banks, Interbank Loans Receivable and
Financial Assets at Fair Value through Profit or Loss - 88 -
*SGVFS162380*
9. Due from Other Banks
The balance of this account consists of regular deposits with the following:
Group Parent Bank
2021 2020 2021 2020
Foreign banks P=51,138,501 P=64,419,921 P=51,009,025 P=64,419,921Local banks 3,119,964 4,112,297 299,958 343,847
P=54,258,465 P=68,532,218 P=51,308,983 P=64,763,768
The breakdown of this account as to currency follows:
Group Parent Bank
2021 2020 2021 2020
U.S. dollars P=48,927,115 P=62,691,820 P=48,946,007 P=62,184,086Philippine pesos 3,262,944 3,599,496 294,570 338,779Other currencies 2,068,406 2,240,902 2,068,406 2,240,903
P=54,258,465 P=68,532,218 P=51,308,983 P=64,763,768
Annual interest rates on these deposits range from 0.00% to 2.00% in 2021, from 0.00% to 3.00%in 2020, and from 0.80% to 6.13% in 2019. Total interest income on Due from other banksearned by the Group amounted to P=14,429, P=59,459, and P=124,356 in 2021, 2020, and 2019,respectively, while total interest income earned by the Parent Bank amounted to P=7,634,P=46,791, and P=89,010 in 2021, 2020 and 2019, respectively.
Due from other banks is net of allowance for credit losses amounting to P=32,407 and P=23,108, asof December 31, 2021 and 2020, respectively.
10. Interbank Loans Receivable
Interbank loans receivable consists of foreign currency-denominated loans granted to other bankswith terms ranging from 3 to 63 days in 2021 and from 1 to 67 days in 2020.
Interest income on interbank loans amounted to P=23,256, P=95,857, and P=247,478, in 2021, 2020,and 2019, respectively, for the Group, and P=22,170, P=95,451, and P=247,039, in 2021, 2020, and2019, respectively, for the Parent Bank. Annual interest rates on interbank loans receivable rangefrom 0.01% to 2.00% in 2021, 0.01% to 4.00% in 2020, and from 0.60% to 4.69% in 2019.
11. Financial Assets at Fair Value through Profit or Loss
The Group’s and Parent Bank’s financial assets at FVTPL as of December 31, 2021 and 2020consist of the following:
Group Parent Bank
2021 2020 2021 2020
Debt securities held for trading P=4,365,040 P=15,012,469 P=4,365,040 P=15,012,469
Equity securities designated
at FVTPL 209,535 2,753,716 140,800 2,716,371
Derivative assets 1,065,430 682,464 1,065,430 682,464
P=5,640,005 P=18,448,649 P=5,571,270 P=18,411,304

Financial Assets at Fair Value through Profit or Loss - 89 -
*SGVFS162380*
The breakdown of this account as to currency follows:
Group Parent Bank
2021 2020 2021 2020
U.S. dollars P=4,514,447 P=3,468,444 P=4,514,447 P=3,468,444Philippine pesos 1,125,261 14,978,510 1,056,526 14,941,165Others 297 1,695 297 1,695
P=5,640,005 P=18,448,649 P=5,571,270 P=18,411,304
The Group recognized fair value gains (losses) on financial assets at FVTPL amounting to(P=440,044), P=809,253, and P=1,275,384 in 2021, 2020, and 2019, respectively, while the ParentBank recognized fair value gains (losses) on financial assets at FVTPL amounting to (P=440,453),P=811,217, and P=1,276,966 in 2021, 2020, and 2019, respectively, and included as part of Gains(losses) on trading and investment securities at FVTPL and FVOCI in the statement of income.
Interest income generated from these financial assets amounted to P=244,587, P=524,261, andP=423,688, in 2021, 2020, and 2019, respectively, of both the Group and the Parent Bank. In2021, annual interest rates on these financial assets range from 2.38% to 4.62% and from 1.38%to 10.63% for securities denominated in Philippine peso and U.S. dollars, respectively. In 2020,annual interest rates on these financial assets range from 1.38% to 5.88% and from 0.96% to7.03% for securities denominated in Philippine peso and U.S. dollars, respectively.
Derivative instruments include foreign exchange forwards and swaps and cross-currency interestrate swaps. These derivative instruments represent commitments to purchase/sell/exchangeforeign currency or bonds on a future date at an agreed price, exchange rate and/or interest rates.
Equity securities include PSE listed securities, club shares and unquoted equity securities.
The aggregate contractual or notional amount of derivative financial instruments and the total fairvalues of derivative financial assets and liabilities of the Group and the Parent Bank(see Note 24) are set out below.
December 31, 2021
Notional Fair Values
Amount Assets Liabilities
Currency forwardsBought P=31,946,925 P= 466,591 P=36,806
Sold 22,392,884 1,767 223,429
Cross currency interest rate swapsPayer 2,548,063 296,467 207,593
Receiver 2,540,260 250,545 282,181
Warrants 7,649,850 50,060 –
P=67,077,982 P=1,065,430 P=750,009
December 31, 2020
Notional Fair Values
Amount Assets Liabilities
Currency forwardsBought P=30,396,594 P=1,066 P=130,134Sold 19,533,966 103,422 128,300
Cross currency interest rate swapsPayer 1,738,473 268,843 263,956Receiver 1,738,673 263,751 224,920
Warrants 4,322,070 45,382 –
P=57,729,776 P=682,464 P=747,310

Financial Assets at Amortized Cost - 90 -
*SGVFS162380*
12. Financial Assets at Amortized Cost
The Group’s and the Parent Bank’s financial assets at amortized cost as of December 31, 2021and 2020 consist of the following:
Group Parent Bank
2021 2020 2021 2020
Government bonds and other
debt securities P=163,748,924 P=151,811,690 P=159,616,193 P=149,211,834
Private bonds and commercial
papers 2,862,393 4,338,979 2,772,393 4,298,979
166,611,317 156,150,669 162,388,586 153,510,813
Allowance for impairment
(Note 20) (249,138) (339,702) (249,138) (339,702)
P=166,362,179 P=155,810,967 P=162,139,448 P=153,171,111
Investment securities of both the Group and the Parent Bank with an aggregate principal amountof P=23,664,920 and P=26,606,840 as of December 31, 2021 and 2020, respectively, were pledgedas collaterals for bills payable under repurchase agreements (see Note 22).
The breakdown of this account as to currency as of December 31, 2021 and 2020 follows:
Group Parent Bank
2021 2020 2021 2020
Philippine pesos P=133,898,721 P=79,245,005 P=129,675,990 P=76,605,149U.S. dollars 30,644,377 74,726,779 30,644,377 74,726,779Others 1,819,081 1,839,183 1,819,081 1,839,183
P=166,362,179 P=155,810,967 P=162,139,448 P=153,171,111
Financial assets at amortized cost denominated in Philippine pesos have fixed interest ratesranging from 1.03% to 18.25% per annum in 2021, from 1.69% to 18.25% per annum in 2020,and from 3.38% to 18.25% per annum in 2019, while financial assets at amortized costdenominated in U.S. dollars and Euros have fixed interest rates ranging from 3.25% to 9.5% perannum in 2021, from 2.31% to 7.11% per annum in 2020, and from 2.25% to 9.63% per annumin 2019. These bonds have remaining maturities of 1 year to 31 years and 1 year to 29 years as atDecember 31, 2021 and 2020, respectively.
Interest income generated from these financial assets, including amortization of premium ordiscount, amounted to P=5,865,798, P=7,202,846, and P=9,138,830 in 2021, 2020, and 2019,respectively, by the Group, and P=5,777,352, P=7,061,489, and P=9,138,830 in 2021, 2020, and2019, respectively, by the Parent Bank. This is shown as part of Interest income on investmentsecurities at amortized cost and FVOCI account in the statement of income.
The Parent Bank sold investment securities classified as Investment securities at amortized costwith carrying amount of P=47.4 billion, P=57.8 billion and P=53.5 billion in 2021, 2020, and 2019,respectively, resulting in gains totaling P=8.45 billion, P=5.11 billion and P=7.07 billion in 2021,2020, and 2019, respectively (see Note 3).

Financial Assets at Amortized Cost and
Financial Assets at Fair Value Through Other Comprehensive Income - 91 -
*SGVFS162380*
Government bonds with aggregate face value of P=1,000,000 and P=800,000 as ofDecember 31, 2021, and 2020, respectively, are deposited with BSP as security for the Bank’sfaithful compliance with its fiduciary obligations (see Note 31).
13. Financial Assets at Fair Value Through Other Comprehensive Income
The Group’s and the Parent Bank’s financial assets at FVOCI as of December 31, 2021 and 2020consist of the following:
Group Parent Bank
2021 2020 2021 2020
Debt securities:Government bonds P=47,097,138 P=20,237,695 P=47,046,877 P=20,185,986
Private bonds and
commercial papers 18,377,887 10,910,891 18,282,141 10,781,382Equity securities 197,585 41,673 41,673 41,673
P=65,672,610 P=31,190,259 P=65,370,691 P=31,009,041
The breakdown of this account as to currency as of December 31, 2021 and 2020 follows:
Group Parent Bank
2021 2020 2021 2020
U.S. dollars P=46,793,028 P=22,949,310 P=46,637,115 P=22,949,310Philippine pesos 18,879,582 8,240,949 18,733,576 8,059,731
P=65,672,610 P=31,190,259 P=65,370,691 P=31,009,041
The Group has designated the above equity securities as at FVOCI because they are held forlong-term investments and are neither held-for-trading nor designated as at FVTPL. Unquotedequity securities pertain to golf club shares and investments in non-marketable equity securities.
Debt securities denominated in Philippine pesos have interest rates ranging from 2.88% to 6.88%per annum for 2021, from 3.70% to 5.33% per annum for 2020, and from 5.75% to 8.00% perannum for 2019, while debt securities denominated in U.S. dollars have interest rates rangingfrom 1.13% to 9.63% per annum in 2021, from 1.03% to 8.43% per annum in 2020, and from1.63% to 7.38% per annum in 2019. Interest income, including amortization of premium ordiscount, amounted to P=1,840,975 and P=1,833,323 in 2021 for the Group and Parent Bank,respectively, P=881,817 and P=875,707 in 2020 for the Group and Parent Bank, respectively, andP=353,060 in 2019 for both the Group and Parent Bank, and is shown as part of Interest income oninvestment securities at amortized cost and FVOCI account in the statement of income.
In 2021, 2020 and 2019, the Group and the Parent Bank recognized gains from the sale ofinvestments securities at FVOCI amounting to P=0.66 billion, P=3.0 billion, and P=1.1 billion,respectively. The amounts are included under Gains on trading and investments securities atFVTPL and FVOCI in the statement of income.
As of December 31, 2021 and 2020, allowance for credit losses credited against othercomprehensive income amounted to P=12,031 and P=4,928, respectively.

Loans and Other Receivables - 92 -
*SGVFS162380*
14. Loans and Other Receivables
The Group’s and the Parent Bank’s loans and other receivables as of December 31, 2021 and2020 consist of the following:
Group Parent Bank
December 31 December 31
2021 2020 2021 2020
Receivables from customers:Loans and discounts P=325,222,919 P=313,440,863 P=265,140,532 P=253,976,998
Customers’ liabilities underacceptances and trust receipts 11,051,652 7,525,880 11,051,652 7,525,880
Bills purchased 458,312 1,002,263 458,312 1,002,263Accrued interest receivable 3,155,283 4,173,094 2,323,363 2,942,144
339,888,166 326,142,100 278,973,859 265,447,285Unearned discounts (1,417,089) (1,529,187) (158,506) (133,458)
Allowance for impairment(Note 20) (13,435,022) (10,473,864) (10,035,885) (7,691,647)
325,036,055 314,139,049 268,779,468 257,622,180
Other receivables:SPURRA 23,420,742 16,745,090 15,541,296 10,373,294Accounts receivable 7,106,075 5,416,251 2,742,044 2,251,211Accrued interest receivable 3,186,024 2,739,153 3,072,794 2,648,608Sales contracts receivable 1,518,579 1,536,891 1,446,756 1,456,203
Unquoted debt securitiesclassified as loans 1,538 191 – –
Installment contracts receivable 3,451 4,243 – –
35,236,409 26,441,819 22,802,890 16,729,316 Allowance for impairment
(Note 20) (497,833) (1,044,038) (464,156) (1,011,633)
34,738,576 25,397,781 22,338,734 15,717,683
P=359,774,631 P=339,536,830 P=291,118,202 P=273,339,863
As of December 31, 2021 and 2020, SPURRA that were classified as cash and cash equivalentsamounted to P=23,420,742 and P=16,745,090, respectively, for the Group, and P=15,541,296 andP=10,373,294, respectively, for the Parent Bank.
Restructured loans amounted to P=1,307,006 and P=756,326 as of December 31, 2021 and 2020,respectively, for the Group, and P=1,250,276 and P=653,761 as of December 31, 2021 and 2020,respectively, for the Parent Bank. Interest income on these restructured loans amounted toP=38,733, P=9,067, and P=11,942 in 2021, 2020, and 2019, respectively, for the Group, and P=25,189,P=6,126, and P=9,796 in 2021, 2020, and 2019, respectively, for the Parent Bank.
The maturity profile of loans and other receivables (net of unearned discounts) follows:
Group Parent Bank
2021 2020 2021 2020
Less than one year P=126,166,158 P=111,744,275 P=105,451,961 P=90,445,312One year to less than five years 147,755,010 132,122,394 97,636,022 84,911,197Beyond five years 99,786,318 107,188,063 98,530,260 106,686,634
P=373,707,486 P=351,054,732 P=301,618,243 P=282,043,143
Loans and other receivables bear annual interest ranging from 4.00% to 14.00% in 2021 and2020, and from 4.00% to 18.00% in 2019.

Loans and Other Receivables and
Investments in Subsidiaries and Associates - 93 -
*SGVFS162380*
The breakdown of loans (receivable from customers excluding accrued interest receivable) as totype of interest rate follows:
Group Parent Bank
2021 2020 2021 2020
Variable interest rates P=248,928,907 P=239,823,493 P=248,924,378 P=239,823,493Fixed interest rates 87,803,976 82,145,513 27,726,118 22,681,648
P=336,732,883 P=321,969,006 P=276,650,496 P=262,505,141
The amounts of interest income per type of loans and receivables for each reporting period are asfollows:
Group
2021 2020 2019
Receivables from customers P=24,686,931 P=28,287,521 P=27,391,437Other receivables:
SPURRA 300,764 444,275 439,331Sales contracts receivable 101,402 118,611 172,600Installment contracts receivable 318 514 614Others 2,583,798 18 31
P=27,673,213 P=28,850,939 P=28,004,013
Parent Bank
2021 2020 2019
Receivables from customers P=17,402,061 P=19,689,313 P=18,885,639Other receivables:
SPURRA 204,381 273,324 185,145Sales contracts receivable 95,200 113,383 166,339
P=17,701,642 P=20,076,020 P=19,237,123
15. Investments in Subsidiaries and Associates
Investment in Subsidiaries
This account in the Parent Bank’s financial statements pertains to investments in the followingsubsidiaries, which are accounted for using the equity method:
% Interest 2021 2020
Acquisition costs:CSB 99.79% P=6,746,861 P=6,746,861UBX 100% 1,100,000 600,000Union Digital (Note 1) 100% 1,000,000 –UIC 100% 924,861 924,861FUPI 100% 290,002 290,002UBPSI 100% 5,000 5,000UDC 100% 3,125 3,125UBPIBI – – 2,500UCBC – – 1,000
P=10,069,849 P=8,573,349

Investments in Subsidiaries and Associates - 94 -
*SGVFS162380*
The movement of investments in subsidiaries is shown below:
2021 2020 2019
Acquisition costs:Beginning balances P=8,573,349 P=7,870,847 P=7,383,347Additional investments (Note 1) 1,500,000 702,502 487,500Others (3,500) − −
10,069,849 8,573,349 7,870,847
Accumulated equity in total comprehensiveincome:Beginning balances 13,294,638 12,652,786 11,517,277Share in net profit (Note 28)* 1,173,016 953,082 1,222,595Dividends (1,496,811) − −
Impairment on investment in FUPI(Note 28) − (290,002) −
Share in other comprehensiveincome (loss) (Note 29) 38,774 (21,228) (87,086)
Others 3,489 − −13,013,106 13,294,638 12,652,786
Net investment in subsidiaries P=23,082,955 P=21,867,987 P=20,523,633
*The share in net profit for CSB in 2021 and 2020 is net of goodwill impairment charge of P=529.6 million andP=223.2 million, respectively.
The Parent Bank’s direct subsidiaries are all incorporated in the Philippines. The principal placeof business of these subsidiaries is in Metro Manila, Philippines except for CSB, which has itsprincipal place of operations in Cebu, Philippines.
Purchase of preferred shares issued by FUPI
In October 2020, the Parent Bank subscribed to FUPI’s non-voting, non-cumulative andredeemable preferred shares for a total consideration of P=290 million. The subscription was usedto support FUPI in meeting its maturing pre-need plans during 2020. As of December 31, 2020,the Parent Bank assessed that the preferred shares will not be redeemed or settled in theforeseeable future, as FUPI will not be generating additional income or revenues movingforward. In 2020, the Parent Bank provided a full valuation allowance of P=290 million,presented under Miscellaneous expense (see Note 28). This transaction is eliminated in theconsolidation and has no impact on the consolidated financial statements.
Acquisition of Bangko Kabayan
In February 2019, CSB and UIC acquired 70% ownership, with CSB owning 49% and UICowning 21% (See Note 1). For convenience purposes, the Group used March 31, 2020 as thedate of business combination.
The fair values of the identifiable assets and liabilities acquired at the date of acquisition are asfollows (amounts in thousands):
Final fair values
Assets
Cash and other cash items P=70,628Due from BSP 323,440Due from other banks 325,770Investment securities 328,132Loans and receivables 1,953,472
(Forward)
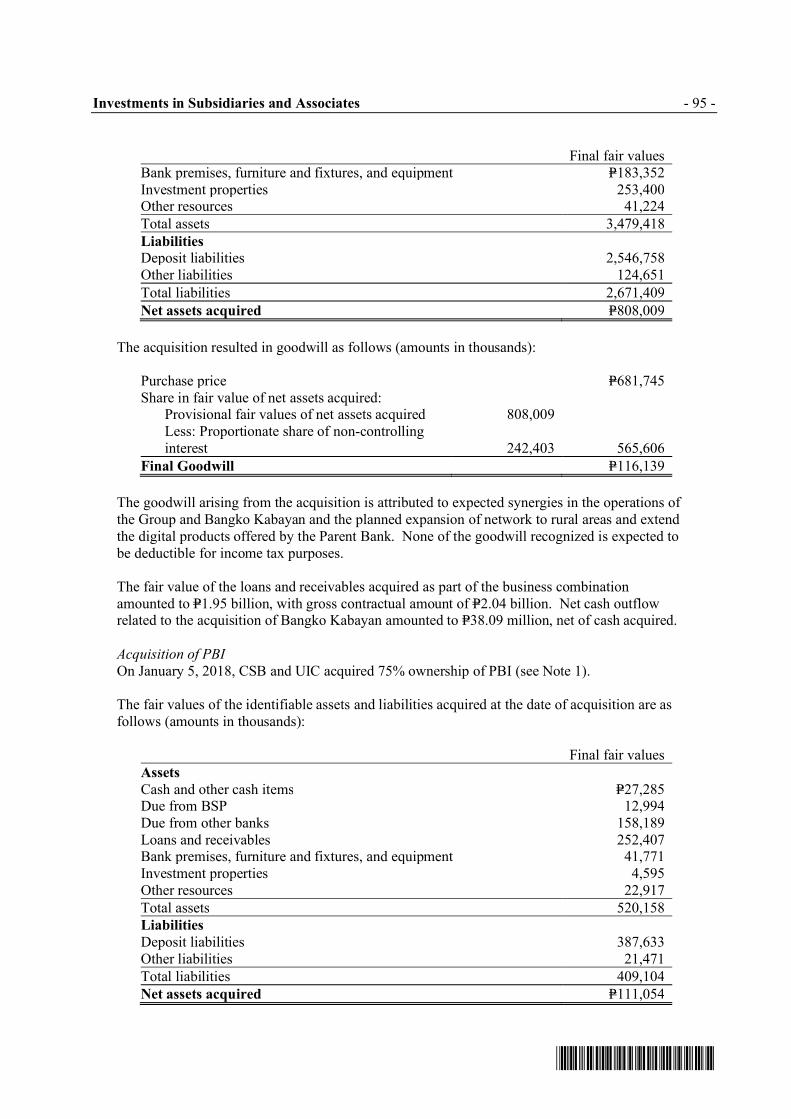
Investments in Subsidiaries and Associates - 95 -
*SGVFS162380*
Final fair valuesBank premises, furniture and fixtures, and equipment P=183,352Investment properties 253,400Other resources 41,224
Total assets 3,479,418
Liabilities
Deposit liabilities 2,546,758Other liabilities 124,651
Total liabilities 2,671,409
Net assets acquired P=808,009
The acquisition resulted in goodwill as follows (amounts in thousands):
Purchase price P=681,745Share in fair value of net assets acquired:
Provisional fair values of net assets acquired 808,009 Less: Proportionate share of non-controlling
interest 242,403 565,606
Final Goodwill P=116,139
The goodwill arising from the acquisition is attributed to expected synergies in the operations ofthe Group and Bangko Kabayan and the planned expansion of network to rural areas and extendthe digital products offered by the Parent Bank. None of the goodwill recognized is expected tobe deductible for income tax purposes.
The fair value of the loans and receivables acquired as part of the business combinationamounted to P=1.95 billion, with gross contractual amount of P=2.04 billion. Net cash outflowrelated to the acquisition of Bangko Kabayan amounted to P=38.09 million, net of cash acquired.
Acquisition of PBI
On January 5, 2018, CSB and UIC acquired 75% ownership of PBI (see Note 1).
The fair values of the identifiable assets and liabilities acquired at the date of acquisition are asfollows (amounts in thousands):
Final fair values
Assets
Cash and other cash items P=27,285Due from BSP 12,994Due from other banks 158,189Loans and receivables 252,407Bank premises, furniture and fixtures, and equipment 41,771Investment properties 4,595Other resources 22,917
Total assets 520,158
Liabilities
Deposit liabilities 387,633Other liabilities 21,471
Total liabilities 409,104
Net assets acquired P=111,054

Investments in Subsidiaries and Associates - 96 -
*SGVFS162380*
The acquisition resulted in a gain on bargain purchase as follows (amounts in thousands):
Purchase price P=58,000Share in fair value of net assets acquired:
Provisional fair values of net assets acquired P=111,054 Less: Proportionate share of non-controlling
interest 27,763 83,291
Gain on Bargain Purchase (Note 28) P=25,291
The fair value of the loans and receivables acquired as part of the business combinationamounted to P=252.41 million, with gross contractual amount of P=360.56 million. Net cash inflowrelated to the acquisition of PBI amounted to P=140.47 million, net of cash acquired.
Union Digital BankOn July 19, 2021, the BSP approved the application for authority to establish a digital bank, to beknown as Union Digital Bank (UnionDigital), a wholly-owned subsidiary of the Bank, subject toregulatory conditions. On November 25, 2021, SEC approved UnionDigital's Articles ofIncorporation and its By-Laws and issued its Certificate of Incorporation. The Parent Banksubscribed to 100,000,000 new common shares of UnionDigital at par value P=10 per sharetotaling P=1.0 billion.
UBX and UBX SG Investment TransactionsOn February 11, 2019, the BSP approved the Parent Bank’s incorporation of UBX. The ParentBank subscribed and paid P=400.0 million for the capital stock of UBX.
In October 2018, UIC incorporated UBX SG. UBX then entered into a share purchase agreementwith UIC, also a wholly owned subsidiary of the Parent Bank, to purchase 100 ordinary shares ofUBX SG for a total consideration amounting to SGD100.
On November 27, 2020, the Parent Bank’s BOD approved the additional capital infusion ofP=500 million into UBX. The capital infusion was approved by the BSP on February 15, 2021.The additional capital is intended to grow UBX’ business operations and venture platforms.
Investments in Shiptek Solutions CorporationOn May 9, 2019, UBX acquired 30% of Shiptek Solutions Corporation's (Shiptek) outstandingcapital stock for a total consideration amounting to P=80.0 million. Shiptek is incorporated in thePhilippines to operate, conduct and maintain the business of developing, marketing, selling,distributing and/or licensing the logistics solution technology known as XLOG. Shiptek isaccounted for as an investment in associate in the Group’s financial statements.
Investments in Pacific Payments Pte. LtdOn February 21, 2020, UBX SG acquired 25% of Pacific Payments Pte. Ltd. (PPPL)’soutstanding capital for a total consideration amounting to $1.6 million (P=50.0 million). PPPL is aholding company that was incorporated in Singapore in November 2014.
On June 18, 2021, UBX SG sold its 25% stake in PPPL for a total consideration of $5.4 million(P=262.4 million) resulting in a gain on sale of investment in associate amounting to $3 million(P=156.0 million). UBX SG will use the proceeds to pursue growth and investmentsopportunities.

Investments in Subsidiaries and Associates - 97 -
*SGVFS162380*
Investments in Integra Partners’ FundOn January 31, 2021, UBX SG subscribed $2.5 million in Integra Partners’ Fund II as a LimitedPartner. Out of the $2.5 million subscribed, UBX SG has paid $286 thousands (P=13.7 million) oraround 10% ownership. Integra Partners is a venture Capital (VC) firm based out of Singaporeand is considered one of SE Asia’s premier Fintech and Healthtech VC funds. UBX SG’sinvestment in the fund indicates its commitment to invest in the fintech space and drivehealthcare and financial inclusion in Southeast Asia. Additionally, the partnership furthercements the existing strategic relationship with Integra Partners.
Investments in CC Mobile Financial Services Philippines, Inc.On September 6, 2019, UBX acquired 35% of CC Mobile Financial Services Philippines, Inc.(CCPH) outstanding capital stock for a total consideration amounting to P=50.0 million. CCPHwas incorporated in the Philippines to engage in the business of a financing company byextending credit facilities, by discounting or factoring commercial paper or accounts receivable,by sales finance, by buying and selling contracts, leases, chattel mortgages, or other evidences ofindebtedness, or by financial or operating leasing of movable as well as immovable property, andreal estate mortgages, without engaging in quasi-banking functions or trust operations. CCPH isaccounted for as an investment in associate in the Group’s financial statements.
On June 11, 2021, UBX sold its 35% equity ownership in CC Mobile Financial ServicesPhilippines, Inc. to Fintech Platform Ventures Pte Ltd. (FPV) pursuant to a corporaterestructuring of the Finscore Group intended to consolidate the ownership of all its subsidiariesunder one Singaporean holding company – FPV. UBX PH has agreed to assign the receivablefrom FPV arising from the sale to UBX SG. In exchange, UBX SG issued 64,760 Class ARedeemable Preferred Shares (RPS) (“UBX shares”) at an issue price of $1.04 million(P=53.03 million) to UBX PH. UBX SG has, in turn, entered into a Subscription andShareholders’ Agreement dated June 4, 2021 wherein it subscribed to 1,350,000 shares (31.98%equity ownership) in FPV, free from any encumbrances, for the aggregate subscriptionconsideration of $1.39 million (P=70.88 million). As of December 31, 2021, UBX SG has 31.98%ownership in FPV, which in turn has 100% ownership in CC Mobile Financial ServicesPhilippines, Inc.
Investments with NYK Ventures Pte Ltd.On August 2, 2021, UBX SG subscribed to 811 non-cumulative, non-convertible preferenceshares of NYK Ventures Pte Ltd. (NYK) at a price of $317.79 per share or a total of$0.26 million (P=12.80 million) in addition to its exiting interest in NYK. This additionalsubscription was an exercise of UBX SG’s pro rata rights to maintain an equity stake in NYK’swholly-owned subsidiary, PDAX, Inc. of 2.58%.
Investment in AssociatesAs of December 31, 2021 and 2020, the Group has investment in associates with aggregatecarrying amounts of P=142,355 and P=255,342, respectively. The aggregate share in losses onthese associates amounted to P=14,186, P=3,665, and P=464 for the years ended December 31, 2021,2020, and 2019, respectively.

Investments in Subsidiaries and Associates and
Bank Premises, Furniture, Fixtures and Equipment - 98 -
*SGVFS162380*
Summarized Financial Information
The following table presents the financial information for CSB, FAIR Bank, PETNET, UIC andUBX, Bangko Kabayan and PBI as of and for the years ended December 31, 2021 and 2020:
Assets Liabilities Revenues
Net Profit
(Loss)
2021
CSB P=119,142,549 P=102,472,266 P=10,748,877 P=1,142,631
FAIR Bank 359,699 244,493 70,863 (28,314)
PETNET 1,323,318 221,018 762,178 125,231
UIC 1,134,027 128,363 134,682 53,708
UBX 1,034,660 170,004 338,857 64,032
Bangko Kabayan 3,357,782 2,870,298 336,203 46,706
PBI 243,553 289,492 70,698 (114,293)
Union Digital 1,000,000 29,000 − (29,000)
2020CSB P=99,152,408 P=82,144,535 P=9,262,926 P=1,229,886FAIR Bank 414,799 270,220 81,701 (78,111)PETNET 1,444,374 456,684 581,823 17,278UIC 1,313,549 318,940 153,123 (19,467)UBX 406,144 107,602 86,761 (206,660)Bangko Kabayan 3,477,142 2,854,077 274,504 23,165PBI 423,972 355,310 78,293 (19,090)
16. Bank Premises, Furniture, Fixtures and Equipment
The gross carrying amounts and accumulated depreciation and amortization of bank premises,furniture, fixtures and equipment as of December 31, 2021 and 2020 are shown below.
Group
Land Buildings
Furniture,
Fixtures and
Equipment
Right-of-use
Asset
Leasehold
Rights and
Improvements Total
December 31, 2021
Cost P=850,660 P=3,061,143 P=4,946,472 P=2,817,848 P=1,748,553 P=13,424,676
Accumulated depreciation andamortization − (814,284) (3,095,504) (1,623,221) (1,125,896) (6,658,905)
Net carrying amounts P=850,660 P=2,246,859 P=1,850,968 P=1,194,627 P=622,657 P=6,765,771
December 31, 2020Cost P=859,082 P=3,090,141 P=4,644,666 P=2,160,838 P=1,646,529 P=12,401,256
Accumulated depreciation andamortization − (758,245) (2,713,265) (1,034,218) (1,000,760) (5,506,488)
Net carrying amounts P=859,082 P=2,331,896 P=1,931,401 P=1,126,620 P=645,769 P=6,894,768

Bank Premises, Furniture, Fixtures and Equipment - 99 -
*SGVFS162380*
Parent Bank
Land Buildings
Furniture,
Fixtures and
Equipment
Right-of-use
Asset
Leasehold
Rights and
Improvements Total
December 31, 2021
Cost P=248,301 P=2,621,552 P=3,650,598 P=2,177,921 P=824,212 P=9,522,584
Accumulated depreciation and
amortization – (596,994) (2,027,948) (1,221,229) (340,087) (4,186,258)
Net carrying amounts P=248,301 P=2,024,558 P=1,622,650 P=956,692 P=484,125 P=5,336,326
December 31, 2020
Cost P=248,301 P=2,621,552 P=3,470,711 P=1,746,750 P=792,390 P=8,879,704
Accumulated depreciation andamortization – (537,368) (1,738,353) (810,804) (267,813) (3,354,338)
Net carrying amounts P=248,301 P=2,084,184 P=1,732,358 P=935,946 P=524,577 P=5,525,366
A reconciliation of the carrying amounts at the beginning and end of 2021 and 2020 of thisaccount (including right-of-use assets) is shown below:
Group
Land Buildings
Furniture,
Fixtures and
Equipment
Right-of-Use
Assets
Leasehold
Rights and
Improvements Total
Balances at January 1, 2021, net of
accumulated depreciation andamortization P=859,082 P=2,331,896 P=1,931,401 P=1,126,620 P=645,769 P=6,894,768
Additions – 2,202 400,807 666,029 102,596 1,171,634
Disposals (8,422) (9,833) (19,024) – – (37,279)
Reclassifications/adjustments – (12,761) (4,003) (385) (572) (17,721)
Depreciation and amortization
charges for the year – (64,645) (458,213) (597,637) (125,136) (1,245,631)
Balances at December 31, 2021,net of accumulated
depreciation and amortization P=850,660 P=2,246,859 P=1,850,968 P=1,194,627 P=622,657 P=6,765,771
Balances at January 1, 2020, net of
accumulated depreciation andamortization P=765,374 P=2,157,306 P=1,837,504 P=1,261,207 P=479,252 P=6,500,643
Additions – 153,345 582,113 386,508 290,905 1,412,871
Disposals – – (21,058) − – (21,058)Reclassifications/adjustments – 15,312 (29,718) (23,118) (4,960) (42,484)Depreciation and amortization
charges for the year – (60,910) (466,683) (521,521) (131,213) (1,180,327)Effect of business combinations
(Note 15) 93,708 66,843 29,243 23,544 11,785 225,123
Balances at December 31, 2020,net of accumulateddepreciation and amortization P=859,082 P=2,331,896 P=1,931,401 P=1,126,620 P=645,769 P=6,894,768

Bank Premises, Furniture, Fixtures and Equipment - 100 -
*SGVFS162380*
Parent Bank
Land Buildings
Furniture,
Fixtures and
Equipment
Right-of-Use
Assets
Leasehold
Rights and
Improvements Total
Balances at January 1, 2021, net ofaccumulated depreciation and
amortization P=248,301 P=2,084,184 P=1,732,358 P=935,946 P=524,577 P=5,525,366
Additions – – 285,567 431,171 31,824 748,562
Disposals – – (13,643) – – (13,643)
Reclassifications/adjustments – (15,062) – 170 – (14,892)
Depreciation and amortizationcharges for the year – (44,564) (381,632) (410,595) (72,276) (909,067)
Balances at December 31, 2021,net of accumulateddepreciation and amortization P=248,301 P=2,024,558 P=1,622,650 P=956,692 P=484,125 P=5,336,326
Balances at January 1, 2020, net ofaccumulated depreciation andamortization P=248,301 P=1,959,388 P=1,695,872 P=1,029,614 P=361,420 P=5,294,595
Additions – 152,528 479,720 376,639 235,442 1,244,329Disposals – – (11,903) – – (11,903)Reclassifications/adjustments – 15,275 (47,434) (31,996) – (64,155)
Depreciation and amortizationcharges for the year – (43,007) (383,897) (438,311) (72,285) (937,500)
Balances at December 31, 2020,
net of accumulateddepreciation and amortization P=248,301 P=2,084,184 P=1,732,358 P=935,946 P=524,577 P=5,525,366
The Group has leases for branch offices, parking lots, stalls for specific events, signage and
computer equipment. With the exception of short-term leases and leases of low-value underlying
assets, each lease is reflected on the consolidated statement of financial position as a ROU asset and
a lease liability.
Generally, the Group is restricted from assigning and subleasing the leased assets. The lease
contracts are cancellable upon mutual agreement of the parties or renewable under certain terms
and conditions. Various lease contracts include escalation clauses, most of which bear an annual
rent increase of 5% to 10%. As of December 31, 2021 and 2020, the Group has neither a
contingent rent payable nor an asset restoration obligation in relation with these lease agreements.
The Group’s leasing activities qualified to recognize ROU assets mainly comprise of branch officesand parking lots with remaining lease terms ranging from 1 to 10 years.
The details of depreciation and amortization in the consolidated statements of income follow:
Group
2021 2020 2019
Bank premises, furniture, fixtures and equipment* P=647,994 P=658,806 P=707,917Investment properties (Note 17) 406,421 358,351 371,529Computer software (Note 19) 405,150 286,680 216,112Foreclosed machineries and chattel 164,114 103,063 82,636
P=1,623,679 P=1,406,900 P=1,378,194*Excluding depreciation of ROU asset presented in Occupancy amounting to P=597,637 and P=521,521 in 2021 and 2020, respectively.
Parent Bank
2021 2020 2019
Bank premises, furniture, fixtures and equipment* P=498,472 P=499,189 P=414,629Investment properties (Note 17) 394,241 350,290 356,583Computer software (Note 19) 253,745 159,428 133,738
P=1,146,458 P=1,008,907 P=904,950*Excluding depreciation of ROU asset presented in Occupancy amounting to P=410,595 and P=438,311 in 2021 and 2020, respectively.

Bank Premises, Furniture, Fixtures and Equipment and
Investment Properties - 101 -
*SGVFS162380*
In 2021, 2020 and 2019 depreciation charges amounted to P=597.64 million, P=521.52 million and
P=504.84 million, respectively, for the ROU asset of the Group and P=410.60 million, P=438.31
million, P=403.55 million, respectively, for ROU of the Parent Bank. This is shown as part of
Occupancy in the consolidated and parent bank statements of income.
Under BSP rules, investments in bank premises, furniture, fixtures and equipment should notexceed 50% of the Parent Bank’s unimpaired capital. As of December 31, 2021 and 2020, theParent Bank has satisfactorily complied with this requirement.
17. Investment Properties
The Group’s and the Parent Bank’s investment properties include several parcels of land andbuildings held for rentals and foreclosed properties. The composition of and movements in thisaccount under the cost model are shown below.
Group Parent
As at December 31 As at December 31
2021 2020 2021 2020
Cost P=11,700,174 P=11,723,974 P=10,288,745 P=10,299,738
Accumulated depreciation (2,930,403) (2,640,589) (2,756,443) (2,476,117)Accumulated impairment loss (96,427) (161,019) (96,425) (161,074)
Net carrying amounts P=8,673,344 P=8,922,366 P=7,435,877 P=7,662,547
The movements in the Group’s and the Parent Bank’s investment properties are shown below.
Group
2021
Building Held
for Lease
Foreclosed
Properties Total
Cost
Balances at January 1 P=2,506,566 P=9,217,408 P=11,723,974
Reclassifications / adjustments − (785) (785)
Additions 27,000 303,167 330,167
Disposals − (353,182) (353,182)
Balances at December 31 2,533,566 9,166,608 11,700,174
Accumulated depreciation and amortization
Balances at January 1 684,038 1,956,551 2,640,589
Reclassifications / adjustments (20) (66) (86)
Depreciation 52,535 353,886 406,421
Disposals − (116,521) (116,521)
Balances at December 31 736,553 2,193,850 2,930,403
Accumulated impairment losses
Balance at January 1 − 161,019 161,019
Reclassifications / adjustments − 57 57
Reversals on provision for impairment − (64,649) (64,649)
Balances at December 31 − 96,427 96,427
Net book values P=1,797,013 P=6,876,331 P=8,673,344

Investment Properties - 102 -
*SGVFS162380*
Group
2020
Building Heldfor Lease
ForeclosedProperties Total
CostBalances at January 1 P=2,505,383 P=9,117,501 P=11,622,884Effects of business combination (Note 15) 893 257,102 257,995Reclassifications / adjustments 290 (290) −Additions − 201,247 201,247Disposals − (358,152) (358,152)
Balances at December 31 2,506,566 9,217,408 11,723,974
Accumulated depreciation and amortizationBalances at January 1 632,008 1,683,737 2,315,745Reclassifications / adjustments (290) 16,549 16,259Depreciation 52,320 306,031 358,351Disposals − (49,766) (49,766)
Balances at December 31 684,038 1,956,551 2,640,589
Accumulated impairment lossesBalance at January 1 − 179,558 179,558Disposals − (18,539) (18,539)
Balances at December 31 − 161,019 161,019
Net book values P=1,822,528 P=7,099,838 P=8,922,366
Parent Bank
2021
Building Held
for Lease
Foreclosed
Properties Total
Cost
Balances at January 1 P=2,171,110 P=8,128,628 P=10,299,738
Additions 27,000 261,438 288,438
Disposals − (299,431) (299,431)
Balances at December 31 2,198,110 8,090,635 10,288,745
Accumulated depreciation and amortization
Balances at January 1 557,796 1,918,321 2,476,117
Depreciation 45,631 348,610 394,241
Disposals − (113,915) (113,915)
Balances at December 31 603,427 2,153,016 2,756,443
Accumulated impairment losses
Balances at January 1 and December 31 − 161,074 161,074
Reversals on provision for impairment − (64,649) (64,649)
Balances at December 31 − 96,425 96,425
Net book values P=1,594,683 P=5,841,194 P=7,435,877
Parent Bank
2020
Building Heldfor Lease
ForeclosedProperties Total
CostBalances at January 1 P=2,171,110 P=8,209,141 P=10,380,251Additions − 189,929 189,929Disposals − (270,442) (270,442)
Balances at December 31 2,171,110 8,128,628 10,299,738
Accumulated depreciation and amortizationBalances at January 1 512,610 1,662,448 2,175,058Depreciation 45,186 305,104 350,290Disposals − (49,231) (49,231)
Balances at December 31 557,796 1,918,321 2,476,117
Accumulated impairment lossesBalances at January 1 and December 31 − 161,074 161,074
Net book values P=1,613,314 P=6,049,233 P=7,662,547

Investment Properties and
Goodwill - 103 -
*SGVFS162380*
Real property taxes related to these investment properties paid by the Group and recognized asexpense for the years ended December 31, 2021, 2020, and 2019 totaled P=33,676, P=44,653, andP=34,110, respectively, and are presented as part of Taxes and licenses account under Otherexpenses in the statements of income.
Rent income earned by the Group on its investment properties under operating leases amountedto P=108,047, P=142,033, and P=156,407 in 2021, 2020, and 2019, respectively, and is included aspart of Rental account under Miscellaneous income in the statements of income (see Note 28).
The gain from foreclosure of loan collaterals, presented as part of Miscellaneous income in thestatements of income (see Note 28), amounted to P=135.31 million, P=153.88 million, andP=221.21 million in 2021, 2020, and 2019, respectively, for the Group, and P=135.31 million,P=153.88 million, and P=208.23 million in 2021 2020, and 2019, respectively, for the Parent Bank.
The gain (loss) on disposal of foreclosed properties, presented as part of Miscellaneous income inthe statements of income (see Note 28), amounted to (P=43.69 million), P=229.15 million, andP=200.08 million in 2021, 2020, and 2019, respectively, for the Group, and P=207.36 million,P=195.47 million, and P=251.70 million in 2021, 2020, and 2019, respectively, for the Parent Bank.
Information about the fair value of investment properties is presented in Note 7.
18. Goodwill
Goodwill represents the excess of the acquisition cost over the fair value arising from theacquisitions of (a) former iBank’s in April 2006; (b) CSB in January 2013, (c) PR Savings Bankby CSB in June 2018, (d) PETNET in December 2018 and (e) Bangko Kabayan in March 2020(see Note 1).
None of the goodwill recognised is expected to be deductible for income tax purposes.
For impairment testing purposes, the goodwill of the Group acquired through businesscombination is allocated to the following CGUs:
a. With respect to acquisition of iBank, to the Parent Bank’s Consumer Banking and ParentBank’s Corporate and Commercial Banking.
b. With respect to the goodwill from the acquisition of CSB and PR Savings Bank, to CSB’sDepEd salary loans business and motorcycle loans business, respectively;
c. With respect to the goodwill from the acquisition of PETNET, the separate cash generatingunit of PETNET at entity level; and,
d. With respect to the goodwill from the acquisition of Bangko Kabayan, the separate cashgenerating unit of Bangko Kabayan at entity level.
The following presents the movement of goodwill of the Group for 2021 and 2020:
Group
2021 2020
Beginning balance P=15,348,531 P=15,455,564Acquisition of subsidiaries (Note 15)* − 116,139Impairment during the year (Note 28) (529,599) (223,172)
Ending balance P=14,818,932 P=15,348,531
*Based on final fair values of Bangko Kabayan

Goodwill - 104 -
*SGVFS162380*
The goodwill of the Group is allocated to the following CGUs:
Group Parent Bank
2021 2020 2021 2020
iBank Parent Bank’s Corporate and
Commercial Banking P=3,208,998 P=3,208,998 P=3,208,998 P=3,208,998Parent Bank’s Consumer Banking 4,677,900 4,677,900 4,677,900 4,677,900
7,886,898 7,886,898 7,886,898 7,886,898CSB
CSB’s DepEd Salary Loans Business* 3,371,353 3,371,353 − − CSB’s Motorcycle Loans Business** 2,729,424 3,259,023 − −
6,100,777 6,630,376 − −PETNET 715,118 715,118 − −Bangko Kabayan 116,139 116,139 − −
P=14,818,932 P=15,348,531 P=7,886,898 P=7,886,898
*Arising from the acquisition of CSB amounting to P=3.37 billion
**Arising from the acquisition of PR Savings Bank amounting to P=3.48 billion. Goodwill impairment recognized for CBS’s
motorcycle loans business amounted to P529.60 million and P223.17 million in 2021 and 2020, respectively.
Refer to Note 15 for the discussions on the acquisition of and merger with PR Savings Bank and acquisition of Bangko Kabayan.
The Group performed its annual impairment test in December of each year, unless indicators forimpairment warrant earlier reassessment. The Group considers various internal and externalsources of information in assessing whether there is any indication that goodwill is impairedincluding if there are significant changes with an adverse effect on the CGUs that have takenplace during the period in the technological, market, economic or legal environment in which theGroup operates. As a result of the ongoing economic uncertainty brought about by the COVID-19 pandemic, the results of the motorcycle lending business were lower than expected. Thevolume of loan releases was lower and the motorcycle loans reported higher NPLs, indicating apotential impairment of goodwill.
The recoverable amount of the motorcycle loans CGU has been determined based on a value inuse calculation using cash flow projections from financial budgets approved by seniormanagement covering a five-year period. Key assumptions in VIU calculation of CGUs are mostsensitive to loan growth rate and discount rate. Future cash flows and growth rates were based onhistorical experiences and strategies developed, including assessment of impact of the COVID-19pandemic. The discount rate used for the computation of the net present value is the weightedaverage cost of capital and was determined by reference to a comparable entity, marketobservable inputs and assumptions consistent with the valuation practice. Refer to Note 3 for thedisclosure of assumptions used in the impairment assessment.
As a result of this analysis, management has recognized an impairment charge of P=529.6 millionagainst goodwill with a carrying amount of P=3,259.0 million as of December 31, 2020 andP=223.2 million against goodwill with a carrying amount of P=3,482.2 million as of December 31,2019, for the years ended December 31, 2021 and 2020, respectively. The impairment charge isrecorded under Miscellaneous expenses in the statement of income.

Other Resources - 105 -
*SGVFS162380*
19. Other Resources
The composition of Other resources account as of December 31 follows:
Group Parent Bank
2021 2020 2021 2020
Deferred tax assets (Note 30) P=7,046,605 P=7,453,580 P=5,677,282 P=6,256,296Software under development 3,366,928 2,710,227 3,366,928 2,710,227Computer software – net 2,335,558 1,495,492 1,722,139 1,013,475Advances and other investments 1,640,920 1,135,403 1,597,023 1,090,830Creditable withholding taxes 1,114,195 861,860 1,061,256 808,283Prepaid expenses 701,181 340,911 427,183 228,012Documentary stamps 406,610 229,881 222,117 221,598Deferred charges 378,832 217,950 – –Non-current assets held for sale 333,917 370,333 – –Returned checks and other cash items 169,164 248,744 169,164 248,744Net retirement asset (Note 29) 62,899 70,411 – –Trust fund assets 62,802 66,164 – –Miscellaneous 1,628,501 1,586,449 1,091,950 1,043,475
19,248,112 16,787,405 15,335,042 13,620,940Allowance for impairment (Note 20) (66,449) (95,910) (26,964) (61,171)
P=19,181,663 P=16,691,495 P=15,308,078 P=13,559,769
Trust fund assets are maintained to cover pre-need liabilities of FUPI for pre-need planscomputed based on the provisions of PAS 37 as required by the IC and validated by a qualifiedactuary in compliance with the rules and regulations of the IC based on the amended PNUCA.The trust fund assets are managed by the Parent Bank’s Trust and Investment Services Group(TISG).
The details of FUPI’s trust fund assets as of December 31 follow:
2021 2020
Due from other banks* P=16,241 P=−Financial assets at FVTPL 33,519 50,314Financial assets at FVOCI 14,450 15,882Financial assets at amortized cost – 318Miscellaneous – net (1,408) (350)
P=62,802 P=66,164*As of December 31, 2021 and 2020, due from other banks included under trust fund assets comprising placements with the Parent Bank
and not included in the above amounted to P=17.05 million and P=0.94 million, respectively.
Financial assets at FVTPL comprise of investments in shares of listed companies, governmentsecurities and other corporate debt instruments. The trust fund generated income (loss) ofP=0.21 million, (P=15.0 million), and P=72.5 million in 2021, 2020, and 2019, respectively(see Note 28).
The movements in the Computer software account follow:
Group Parent Bank
2021 2020 2021 2020
Balance at beginning of year P=1,495,492 P=1,238,896 P=1,013,475 P=1,084,355Additions 1,255,269 551,490 962,409 93,596
Amortization charges for the year (405,150) (286,680) (253,745) (159,428)Effect of business combinations
(Note 15) − 2,370 − −Reclassifications (10,053) (10,584) − (5,048)
Balance at end of year P=2,335,558 P=1,495,492 P=1,722,139 P=1,013,475

Other Resources and
Allowance for Impairment - 106 -
*SGVFS162380*
Miscellaneous includes foreclosed machineries, chattels, motorcycle and automobiles, securitydeposits and ongoing improvements on the Group’s and the Parent Bank’s branches and offices.
20. Allowance for Impairment
The breakdown of allowance for impairment is shown in the table below:
Group Parent Bank
2021 2020 2021 2020
Receivable from customers (Note 14) P=13,435,022 P=10,473,864 P=10,035,885 P=7,691,647Other receivables (Note 14) 497,833 1,044,038 464,156 1,011,633Investments and placements
(Note12) 293,576 367,738 289,455 363,617Others 162,876 256,929 123,389 222,245
P=14,389,307 P=12,142,569 P=10,912,885 P=9,289,142
Allowance for impairment of investments and placements include the Group’s and the ParentBank’s financial assets at amortized cost, debt financial assets at FVOCI, due from other banksand interbank loans receivable. The ECL allowance for financial assets at FVOCI amounted toP=12.03 million and P=4.93 million as of December 31, 2021 and 2020, respectively. Others referto allowance for impairment of investment properties and other resources.
With the foregoing level of allowance for impairment and credit losses, management believesthat the Group has sufficient allowance for any losses that the Group may incur from the non-collection or nonrealization of its receivables and other risk assets.
The reconciliation of allowance for the total receivables from customers follows.
Total Receivables from Customers - Group
2021
Stage 1 Stage 2 Stage 3 Total
Balances at beginning of year P=1,789,161 P=784,234 P=7,900,469 P=10,473,864
Newly originated assets that remained in
Stage 1 as at December 31, 2021 969,433 − − 969,433
Newly originated assets that moved to Stage 2
and Stage 3 as at December 31, 2021 − 101,461 1,927,323 2,028,784
Effect of collections and other movements in
receivable balance (excluding write-offs),and impact of changes in ECL model and
assumptions (1,922,757) (400,158) 2,445,450 122,535
Amounts written-off − − (1,659,357) (1,659,357)
Transfers to Stage 1 1,383,303 (61,985) (1,321,318) −Transfers to Stage 2 (32,285) 490,466 (458,181) −Transfers to Stage 3 (88,197) (59,047) 147,244 −Impact on ECL of exposures transferred
between stages (637,731) 6,942 2,130,552 1,499,763
Balances at end of year P=1,460,927 P=861,913 P=11,112,182 P=13,435,022

Allowance for Impairment - 107 -
*SGVFS162380*
2020
Stage 1 Stage 2 Stage 3 Total
Balances at beginning of year P=1,328,881 P=100,502 P=5,442,522 P=6,871,905
Newly originated assets that remained inStage 1 as at December 31, 2020 735,703 − − 735,703
Newly originated assets that moved to Stage 2
and Stage 3 as at December 31, 2020 − 150,948 1,046,269 1,197,217Effect of collections and other movements in
receivable balance (excluding write-offs),
and impact of changes in ECL model and
assumptions
(442,643) 35,075 3,208,586 2,801,018
Transfers to Stage 1 347,466 (64,376) (283,090) −Transfers to Stage 2 (13,532) 147,232 (133,700) −Transfers to Stage 3 (109,928) (118,547) 228,475 −Impact on ECL of exposures transferred
between stages (56,244) 577,026 2,792,012 3,312,794
Amounts written-off (542) (43,626) (4,400,605) (4,444,773)
Balances at end of year P=1,789,161 P=784,234 P=7,900,469 P=10,473,864
Total Receivables from Customers – Parent Bank
2021
Stage 1 Stage 2 Stage 3 Total
Balances at beginning of year P=695,641 P=696,176 P=6,299,830 P=7,691,647
Newly originated assets that remained inStage 1 as at December 31, 2021 421,378 − − 421,378
Newly originated assets that moved to Stage 2
and Stage 3 as at December 31, 2021 − 4,296 1,381,647 1,385,943
Effect of collections and other movements inreceivable balance (excluding write-offs),
and impact of changes in ECL model and
assumptions (537,120) 22,868 1,085,105 570,853
Transfers to Stage 1 639,247 (55,944) (583,303) −Transfers to Stage 2 (31,408) 126,184 (94,776) −Transfers to Stage 3 (27,600) (42,423) 70,023 −Impact on ECL of exposures transferred
between stages (637,732) 6,942 2,130,553 1,499,763
Amounts written-off − − (1,533,699) (1,533,699)
Balances at end of year P=522,406 P=758,099 P=8,755,380 P=10,035,885
2020
Stage 1 Stage 2 Stage 3 Total
Balances at beginning of year P=746,340 P=62,225 P=4,498,625 P=5,307,190
Newly originated assets that remained in
Stage 1 as at December 31, 2020 356,525 − − 356,525
Newly originated assets that moved to Stage 2and Stage 3 as at December 31, 2020 − 79,376 886,468 965,844
Effect of collections and other movements in
receivable balance (excluding write-offs),
and impact of changes in ECL model andassumptions
(287,668) 127,235 2,325,418 2,164,985
Transfers to Stage 1 57,453 (16,039) (41,414) −Transfers to Stage 2 (11,516) 28,006 (16,490) −Transfers to Stage 3 (108,707) (118,027) 226,734 −Impact on ECL of exposures transferred
between stages (56,244) 577,026 2,792,012 3,312,794
Amounts written-off(542) (43,626) (4,371,523) (4,415,691)
Balances at end of year P=695,641 P=696,176 P=6,299,830 P=7,691,647

Allowance for Impairment - 108 -
*SGVFS162380*
Reconciliation of the allowance for impairment by class follows:
Corporate Loans - Group and Parent Bank
2021
Stage 1 Stage 2 Stage 3 Total
Balances at beginning of year P=120,932 P=511,583 P=781,968 P=1,414,483
Newly originated assets that remained inStage 1 as at December 31, 2021 89,983 − − 89,983
Newly originated assets that moved toStage 3 as at December 31, 2021 − − − −
Effect of collections and othermovements in receivable balance(excluding write-offs), and impact ofchanges in ECL model andassumptions (73,593) (35,708) 401,514 292,213
Transfers to Stage 1 − − − −Transfers to Stage 2 (27,478) 49,144 (21,666) −Transfers to Stage 3 (20) − 20 −Impact on ECL of exposures transferred
between stages − 70,290 275,156 345,446
Amounts written-off − − − −Balances at end of year P=109,824 P=595,309 P=1,436,992 P=2,142,125
2020
Stage 1 Stage 2 Stage 3 Total
Balances at beginning of year P=267,666 P=− P=78,358 P=346,024Newly originated assets that remained in
Stage 1 as at December 31, 2020 79,466 − − 79,466Newly originated assets that moved to
Stage 3 as at December 31, 2020 − 4,561 50,269 54,830Effect of collections and other movements in
receivable balance (excluding write-offs),
and impact of changes in ECL model andassumptions
(198,742) (1)8,759 (189,984)
Transfers to Stage 1 − − − −Transfers to Stage 2 (4,116) 4,116 − −Transfers to Stage 3 (23,342) − 23,342 −Impact on ECL of exposures transferred
between stages − 502,907 670,735 1,173,642Amounts written-off − − (49,495) (49,495)
Balances at end of year P=120,932 P=511,583 P=781,968 P=1,414,483
In 2021, there were no write-offs for corporate loans.

Allowance for Impairment - 109 -
*SGVFS162380*
Commercial Loans - Group and Parent Bank
2021
Stage 1 Stage 2 Stage 3 Total
Balances at beginning of year P=171,096 P=60,333 P=1,808,878 P=2,040,307
Newly originated assets that remained inStage 1 as at December 31, 2021 230,047 − − 230,047
Newly originated assets that moved toStage 3 as at December 31, 2021 − − − −
Effect of collections and othermovements in receivable balance(excluding write-offs), and impact ofchanges in ECL model andassumptions (163,661) 81,053 191,398 108,790
Transfers to Stage 1 28,653 (15) (28,638) −Transfers to Stage 2 (57) 57 −Transfers to Stage 3 (1,183) (953) 2,136 −Impact on ECL of exposures transferred
between stages (28,295) 62 273,770 245,537
Amounts written-off − − (44,997) (44,997)
Balances at end of year P=236,600 P=140,537 P=2,202,547 P=2,579,684
2020
Stage 1 Stage 2 Stage 3 Total
Balances at beginning of year P=188,656 P=54 P=1,890,935 P=2,079,645Newly originated assets that remained in
Stage 1 as at December 31, 2020 164,461 − − 164,461Newly originated assets that moved to
Stage 3 as at December 31, 2020 − 59,278 351,591 410,869Effect of collections and other movements in
receivable balance (excluding write-offs),and impact of changes in ECL model and
assumptions)(175,198) 90,346 371,521 286,669
Transfers to Stage 1 3 (3) − −Transfers to Stage 2 − − − −Transfers to Stage 3 (6,824) (89,342) 96,166 −Impact on ECL of exposures transferred
between stages (2) − 403,514 403,512Amounts written-off − − (1,304,849) (1,304,849)
Balances at end of year P=171,096 P=60,333 P=1,808,878 P=2,040,307

Allowance for Impairment - 110 -
*SGVFS162380*
Home Loans - Group and Parent Bank
2021
Stage 1 Stage 2 Stage 3 Total
Balances at beginning of year P=44,774 P=49,512 P=1,503,801 P=1,598,087
Newly originated assets that remained inStage 1 as at December 31, 2021 18,009 − − 18,009
Newly originated assets that moved toStage 3 as at December 31, 2021 − 1,470 49,035 50,505
Effect of collections and othermovements in receivable balance(excluding write-offs), and impact ofchanges in ECL model andassumptions (33,025) (5,794) 336,434 297,615
Transfers to Stage 1 509,549 (26,268) (483,281) −Transfers to Stage 2 (376) 63,544 (63,168) −Transfers to Stage 3 (1,877) (16,321) 18,198 −Impact on ECL of exposures transferred
between stages (508,891) (52,633) 841,529 280,005
Amounts written-off − − (55,252) (55,252)
Balances at end of year P=28,163 P=13,510 P=2,147,296 P=2,188,969
2020
Stage 1 Stage 2 Stage 3 Total
Balances at beginning of year P=9,301 P=10,764 P=88,056 P=108,121Newly originated assets that remained in
Stage 1 as at December 31, 2020 29,515 − − 29,515Newly originated assets that moved to
Stage 3 as at December 31, 2020 − 10,482 80,313 90,795Effect of collections and other movements in
receivable balance (excluding write-offs),and impact of changes in ECL model and
assumptions8,711 (5,832) 776,740 779,619
Transfers to Stage 1 19,674 (2,590) (17,084) −Transfers to Stage 2 (879) 5,043 (4,164) −Transfers to Stage 3 (1,959) (1,925) 3,884 −Impact on ECL of exposures transferred
between stages (19,589) 33,570 634,636 648,617Amounts written-off − − (58,580) (58,580)
Balances at end of year P=44,774 P=49,512 P=1,503,801 P=1,598,087
Other Retail Products - Group and Parent BankOther Retail Products include auto loans, business line, and credit cards.
2021
Stage 1 Stage 2 Stage 3 Total
Balances at beginning of year P=286,507 P=64,162 P=1,699,675 P=2,050,344
Newly originated assets that remained inStage 1 as at December 31, 2021 6,257 − − 6,257
Newly originated assets that moved toStage 3 as at December 31, 2021 − 256 1,257,487 1,257,743
Effect of collections and othermovements in receivable balance(excluding write-offs), and impact ofchanges in ECL model andassumptions (249,073) (15,855) 217,392 (47,536)
(Forward)

Allowance for Impairment - 111 -
*SGVFS162380*
2021
Stage 1 Stage 2 Stage 3 Total
Transfers to Stage 1 P=94,047 (P=25,223) (P=68,823) P=−Transfers to Stage 2 (2,165) 8,374 (6,209) −Transfers to Stage 3 (17,393) (20,053) 37,445 −Impact on ECL of exposures transferred
between stages (93,858) (6,929) 646,997 546,210
Amounts written-off − − (1,421,269) (1,421,269)
Balances at end of year P=24,322 P=4,732 P=2,362,695 P=2,391,749
2020
Stage 1 Stage 2 Stage 3 Total
Balances at beginning of year P=184,610 P=49,977 P=1,385,272 P=1,619,859Newly originated assets that remained in
Stage 1 as at December 31, 2020 68,674 − − 68,674Newly originated assets that moved to
Stage 3 as at December 31, 2020 − 3,377 307,615 310,992Effect of collections and other movements in
receivable balance (excluding write-offs),
and impact of changes in ECL model andassumptions
98,547 43,558 1,078,119 1,220,224
Transfers to Stage 1 37,561 (13,231) (24,330) −Transfers to Stage 2 (2,708) 14,988 (12,280) −Transfers to Stage 3 (63,137) (26,454) 89,591 −Impact on ECL of exposures transferred
between stages (36,498) 35,573 966,047 965,122Amounts written-off (542) (43,626) (2,090,359) (2,134,527)
Balances at end of year P=286,507 P=64,162 P=1,699,675 P=2,050,344
CSB Salary Loans – Group
2021
Stage 1 Stage 2 Stage 3 Total
Balances at beginning of year P=84,326 P=23,036 P=272,213 P=379,575
Newly originated assets that remained inStage 1 as at December 31, 2021 128,013 − − 128,013
Newly originated assets that moved toStage 2 and Stage 3 as atDecember 31, 2021 − 85,014 120,267 205,281
Effect of collections and other movementsin receivable balance (excluding write-
offs), and impact of changes in ECLmodel and assumptions (150,515) (47,869) 489,963 291,579
Transfers to Stage 1 153,373 (1,469) (151,904) −Transfers to Stage 2 (428) 40,567 (40,139) −Transfers to Stage 3 (56,966) (12,601) 69,567 −Amounts written-off − − (115,626) (115,626)
Balances at end of year P=157,803 P=86,678 P=644,341 P=888,822

Allowance for Impairment - 112 -
*SGVFS162380*
2020
Stage 1 Stage 2 Stage 3 Total
Balances at beginning of year P=150,341 P=5,824 P=262,206 P=418,371Newly originated assets that remained in
Stage 1 as at December 31, 2020 135,336 − − 135,336Newly originated assets that moved to
Stage 2 and Stage 3 as atDecember 31, 2020 − 6,437 4,211 10,648
Effect of collections and other movements in
receivable balance (excluding write-offs),
and impact of changes in ECL model andassumptions (136,878) 5,325 (40,924) (172,477)
Transfers to Stage 1 (64,243) 6,276 57,967 −Transfers to Stage 2 6 (583) 577 −Transfers to Stage 3 (236) (243) 479 −Amounts written-off − − (12,303) (12,303)
Balances at end of year P=84,326 P=23,036 P=272,213 P=379,575
Other Receivables from Customers
Group
2021
Stage 1 Stage 2 Stage 3 Total
Balances at beginning of year P=1,081,526 P=75,608 P=1,833,934 P=2,991,068
Newly originated assets that remained inStage 1 as at December 31, 2021 497,124 − − 497,124
Newly originated assets that moved toStage 3 as at December 31, 2021 − 14,720 500,534 515,254
Effect of collections and other movementsin receivable balance (excluding write-
offs), and impact of changes in ECLmodel and assumptions (1,252,889) (375,985) 808,748 (820,126)
Transfers to Stage 1 597,683 (9,010) (588,673) −Transfers to Stage 2 (1,782) 328,780 (326,998) −Transfers to Stage 3 (10,759) (9,119) 19,878 −Impact on ECL of exposures transferred
between stages (6,688) (3,849) 93,103 82,566
Amounts written-off − − (22,213) (22,213)
Balances at end of year P=904,215 P=21,145 P=2,318,313 P=3,243,673
2020
Stage 1 Stage 2 Stage 3 Total
Balances at beginning of year P=528,307 P=33,883 P=1,737,695 P=2,299,885Newly originated assets that remained in
Stage 1 as at December 31, 2020 258,251 − − 258,251Newly originated assets that moved to
Stage 3 as at December 31, 2020 − 66,813 252,270 319,083Effect of collections and other movements in
receivable balance (excluding write-offs),
and impact of changes in ECL model and
assumptions(39,083) (98,321) 1,014,371 876,967
Transfers to Stage 1 354,471 (54,828) (299,643) −Transfers to Stage 2 (5,835) 123,668 (117,833) −Transfers to Stage 3 (14,430) (583) 15,013 −Impact on ECL of exposures transferred
between stages (155) 4,976 117,080 121,901Amounts written-off − − (885,019) (885,019)
Balances at end of year P=1,081,526 P=75,608 P=1,833,934 P=2,991,068

Allowance for Impairment - 113 -
*SGVFS162380*
Parent Bank
2021
Stage 1 Stage 2 Stage 3 Total
Balances at beginning of year P=72,332 P=10,586 P=505,508 P=588,426
Newly originated assets that remained inStage 1 as at December 31, 2021 77,082 − − 77,082
Newly originated assets that moved toStage 3 as at December 31, 2021 − 2,569 75,125 77,694
Effect of collections and other movementsin receivable balance (excluding write-
offs), and impact of changes in ECLmodel and assumptions (17,766) (828) (61,635) (80,229)
Transfers to Stage 1 6,999 (4,438) (2,561) −Transfers to Stage 2 (1,333) 5,065 (3,732) −Transfers to Stage 3 (7,128) (5,096) 12,224 −Impact on ECL of exposures transferred
between stages (6,688) (3,849) 93,103 82,566
Amounts written-off − − (12,181) (12,181)
Balances at end of year P=123,498 P=4,009 P=605,851 P=733,358
2020
Stage 1 Stage 2 Stage 3 Total
Balances at beginning of year P=96,107 P=1,430 P=1,056,004 P=1,153,541Newly originated assets that remained in
Stage 1 as at December 31, 2020 14,409 − − 14,409Newly originated assets that moved to
Stage 3 as at December 31, 2020 − 1,678 96,680 98,358Effect of collections and other movements in
receivable balance (excluding write-offs),
and impact of changes in ECL model and
assumptions(20,986) (836) 90,279 68,457
Transfers to Stage 1 215 (215) − −Transfers to Stage 2 (3,813) 3,859 (46) −Transfers to Stage 3 (13,445) (306) 13,751 −Impact on ECL of exposures transferred
between stages (155) 4,976 117,080 121,901Amounts written-off − − (868,240) (868,240)
Balances at end of year P=72,332 P=10,586 P=505,508 P=588,426
Investments and Placements
Group
2021
Stage 1 Stage 2 Stage 3 Total
Balances at beginning of year P=47,489 P=320,249 P=− P=367,738
Newly originated assets that remained inStage 1 as at December 31, 2021 22,046 − − 22,046
Effect of collections and othermovements in receivable balance(excluding write-offs) − 235,311 − 235,311
Impact of changes in ECL model andassumptions (11,270) (320,249) − (331,519)
Balances at end of year P=58,265 P=235,311 P=− P=293,576

Allowance for Impairment - 114 -
*SGVFS162380*
2020
Stage 1 Stage 2 Stage 3 Total
Balances at beginning of year P=11,878 P=102,033 P=− P=113,911Newly originated assets that remained in
Stage 1 as at December 31, 2020 7,788 − − 7,788Effect of collections and other
movements in receivable balance(excluding write-offs) 35,189 218,216 − 253,405
Impact of changes in ECL model andassumptions (7,366) − − (7,366)
Balances at end of year P=47,489 P=320,249 P=− P=367,738
Parent Bank
2021
Stage 1 Stage 2 Stage 3 Total
Balances at beginning of year P=43,368 P=320,249 P=− P=363,617
Newly originated assets that remained inStage 1 as at December 31, 2021 22,046 − − 22,046
Newly originated assets that moved toStage 2 as at December 31, 2021 − 235,311 − 235,311
Effect of collections and othermovements in receivable balance(excluding write-offs) (11,270) (320,249) − (331,519)
Amounts written-off − − − −Impact of changes in ECL model and
assumptions − − − −Balances at end of year P=54,144 P=235,311 P=− P=289,455
2020
Stage 1 Stage 2 Stage 3 Total
Balances at beginning of year P=11,878 P=102,033 P=− P=113,911Newly originated assets that remained in
Stage 1 as at December 31, 2020 7,788 − − 7,788Effect of collections and other
movements in receivable balance(excluding write-offs) 31,068 218,216 − 249,284
Amounts written-off − − − −Impact of changes in ECL model and
assumptions (7,366) − − (7,366)
Balances at end of year P=43,368 P=320,249 P=− P=363,617
In 2021 and 2020, there were no transfers to Stage 1 and Stage 3. There were also no write-offsfor investments and placements during the year.

Deposit Liabilities - 115 -
*SGVFS162380*
21. Deposit Liabilities
The breakdown of deposit liabilities account follows:
Group Parent Bank
2021 2020 2021 2020
Due to banks:Demand P=1,678,258 P=1,194,495 P=1,677,428 P=1,194,495Savings 248,022 306,575 218,560 306,575Time 283,161 1,492,866 241,148 1,438,700Long-term certificate of deposits 10,000 10,000 10,000 10,000
2,219,441 3,003,936 2,147,136 2,949,770Due to customers:
Demand 202,882,728 158,589,051 204,576,762 159,688,958Savings 136,181,999 98,651,270 131,856,271 93,257,817Time 226,226,724 264,550,769 151,489,012 206,342,074Long-term certificate of deposits 2,990,000 2,990,000 2,990,000 2,990,000
568,281,451 524,781,090 490,912,045 462,278,849
P=570,500,892 P=527,785,026 P=493,059,181 P=465,228,619
The breakdown of deposit liabilities account as to currency follows:
Group Parent Bank
2021 2020 2021 2020
Philippine pesos P=474,511,262 P=403,740,094 P=397,069,551 P=341,183,687Foreign currencies 95,989,630 124,044,932 95,989,630 124,044,932
P=570,500,892 P=527,785,026 P=493,059,181 P=465,228,619
Deposit liabilities bear annual interest at rates ranging from 0.00% to 8.00% in 2021, from 0.00%to 9.5% in 2020, and from and 0.00% to 8.5% in 2019 for the Group and from 0.00% to 5.75% in2021, from 0.39% to 1.65% in 2020, and from 0.0% to 5.54% in 2019 for the Parent Bank.Demand and savings deposits usually have either fixed or variable interest rates while timedeposits have fixed interest rates.
Long Term Negotiable Certificate of Deposits (LTNCD)
On December 12, 2017, the MB of the BSP approved the Parent Bank’s issuance of up toP=20,000,000 of Long-term Negotiable Certificate of Deposits (LTNCD). Out of the approvedamount, P=3,000,000 were issued on February 21, 2018 at a fixed coupon rate of 4.375% perannum, payable quarterly and will mature on August 21, 2023. The net proceeds were utilized tofurther improve the Parent Bank’s maturity profile and support business expansion plans.
Interest expense on the deposit liabilities amounted to P=2,967,692, P=5,616,821, and P=10,160,322in 2021, 2020, and 2019, respectively, in the Group's statements of income, and P=1,805,424,P=4,256,480, and P=8,069,749 in 2021, 2020, and 2019, respectively, in the Parent Bank'sstatements of income.
Under existing BSP regulations, non-FCDU deposit liabilities of the Bank are subject to unifiedreserve requirement equivalent to 14.0% (under BSP Circulars 1041, 1056 and 1063) as atDecember 31, 2019. In 2020, BSP Circulars 1082 and 1092 were issued reducing the reserverequirement to 12.0%, 3.0% and 2.0% for universal and commercial banks, thrift banks, and ruralbanks, respectively. BSP Circulars 1083, 1087, and 1100 were issued in 2020 to provideguidelines allowing the use of eligible loans to MSME and large enterprises for alternativecompliance to required reserves for deposit liabilities.
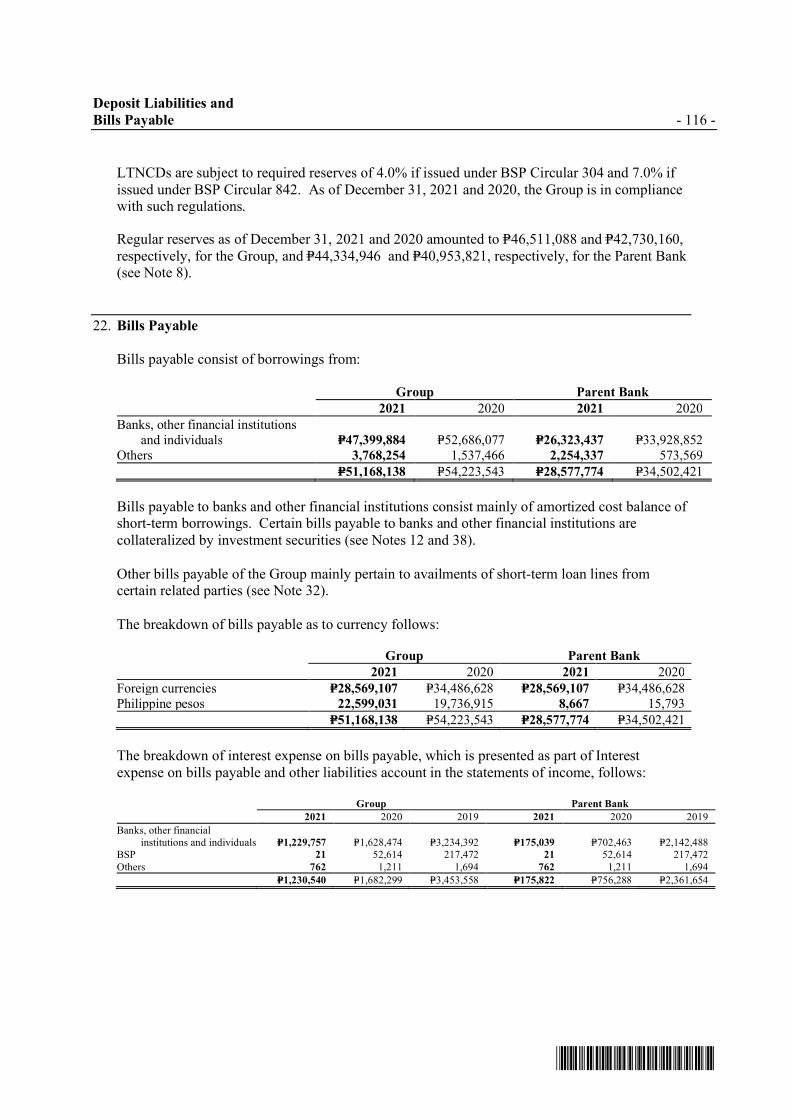
Deposit Liabilities and
Bills Payable - 116 -
*SGVFS162380*
LTNCDs are subject to required reserves of 4.0% if issued under BSP Circular 304 and 7.0% ifissued under BSP Circular 842. As of December 31, 2021 and 2020, the Group is in compliancewith such regulations.
Regular reserves as of December 31, 2021 and 2020 amounted to P=46,511,088 and P=42,730,160,respectively, for the Group, and P=44,334,946 and P=40,953,821, respectively, for the Parent Bank(see Note 8).
22. Bills Payable
Bills payable consist of borrowings from:
Group Parent Bank
2021 2020 2021 2020
Banks, other financial institutionsand individuals P=47,399,884 P=52,686,077 P=26,323,437 P=33,928,852
Others 3,768,254 1,537,466 2,254,337 573,569
P=51,168,138 P=54,223,543 P=28,577,774 P=34,502,421
Bills payable to banks and other financial institutions consist mainly of amortized cost balance ofshort-term borrowings. Certain bills payable to banks and other financial institutions arecollateralized by investment securities (see Notes 12 and 38).
Other bills payable of the Group mainly pertain to availments of short-term loan lines fromcertain related parties (see Note 32).
The breakdown of bills payable as to currency follows:
Group Parent Bank
2021 2020 2021 2020
Foreign currencies P=28,569,107 P=34,486,628 P=28,569,107 P=34,486,628Philippine pesos 22,599,031 19,736,915 8,667 15,793
P=51,168,138 P=54,223,543 P=28,577,774 P=34,502,421
The breakdown of interest expense on bills payable, which is presented as part of Interestexpense on bills payable and other liabilities account in the statements of income, follows:
Group Parent Bank
2021 2020 2019 2021 2020 2019
Banks, other financialinstitutions and individuals P=1,229,757 P=1,628,474 P=3,234,392 P=175,039 P=702,463 P=2,142,488
BSP 21 52,614 217,472 21 52,614 217,472
Others 762 1,211 1,694 762 1,211 1,694
P=1,230,540 P=1,682,299 P=3,453,558 P=175,822 P=756,288 P=2,361,654

Bills Payable and
Notes and Bonds Payable - 117 -
*SGVFS162380*
The range of interest rates of bills payable per currency follows:
Group and Parent Bank
2021 2020 2019
Philippine pesos 1.00% to 8.28% 3.34% to 4.50% 3.75% to 8.28%Foreign currencies 0.10% to 3.05% 0.04% to 3.05% 1.69% to 3.35%
23. Notes and Bonds Payable
The Group’s and the Parent Bank’s notes and bonds payable as of December 31, 2021 and 2020consist of the following:
Coupon Principal Outstanding Balance
Interest AmountDecember 31,
2021
December 31,2020 Issue Date Maturity Date Redemption Date
USD Senior Medium Term
Notes Due 2022 3.369% P=25,499,500 P=25,488,553 P=23,983,972 November 29, 2017 November 29, 2022USD Senior Medium Term
Notes Due 2025 2.125% 15,299,700 15,219,465 14,311,227 October 22, 2020 October 22, 2025Peso Senior Series C Bonds
Due 2023 2.75% 8,115,000 8,073,690 8,055,828 December 9, 2020 December 9, 2023 December 9, 2023USD Social Bonds Due
2028 1.154% 7,649,850 7,589,032 – July 23, 2021 July 23, 2028Unsecured Subordinated
Tier 2 Notes Due 2030Callable in 2025 5.250% 6,800,000 6,750,838 6,745,110 February 24, 2020 May 24, 2030 May 24, 2030
Peso Senior Series B BondsDue 2022 6.000% 5,800,000 5,790,951 5,772,252 June 3, 2019 June 3, 2022 June 3, 2022
Peso Senior Series D Bonds
Due 2026 3.375% 885,000 877,307 878,468 December 9, 2020 March 9, 2026 March 9, 2026
Total for Parent Bank 70,049,050 69,789,836 59,746,857
Loans payable 5.750% 150,000 64,150 106,799 May 31, 2018 May 31, 2023
Total for Group P=70,199,050 P=69,853,986 P=59,853,656
USD Senior Medium Term Notes Due 2022
The USD500 million Senior Medium Term Notes Due 2022 were issued under the Parent Bank’sUSD One Billion Medium Term Note (MTN) Programme and were rated Baa2 by Moody’s.
The Notes were listed on the Singapore Exchange Securities Trading Limited (SGX-ST) andconstitute direct, unconditional, unsubordinated and unsecured obligations of the Parent Bankand will rank pari passu among themselves and equally with all other unsecured obligations ofthe Parent Bank from time to time outstanding.
USD Senior Medium Term Notes Due 2025
These USD300 million Senior Medium Term Notes Due 2025 were issued under the updatedUSD 2 Billion MTN Programme of the Parent Bank and were also rated Baa2 by Moody’s. TheNotes were also listed on the SGX-ST.
The Notes will constitute direct, unconditional, unsubordinated and (subject to the Terms andConditions of the issuance) unsecured obligations of the Parent Bank and will rank pari passu
among themselves and (save for certain obligations required to be preferred by law) equally withall other unsecured obligations (other than subordinated obligations, if any) of the Parent Bankfrom time to time outstanding.

Notes and Bonds Payable - 118 -
*SGVFS162380*
Peso Senior Series C Bonds Due 2023
The P=8.12 billion worth of fixed rate Senior Series C Bonds were issued as part of the dual-tranche issuance of the Bank on December 9, 2020 under its existing P=39 Billion BondProgram. The bonds were listed on the PDEx.
The Bank may, at its sole option and subject to the Terms and Conditions of the issuance,redeem the Bonds at par plus accrued interest (if any), without premium or penalty, as of butexcluding the Early Redemption Date.
The Bonds constitute direct, unconditional, unsecured, and unsubordinated peso-denominatedobligations of the Bank, enforceable according to the Terms and Conditions of the Bonds, andshall at all times rank pari passu and ratably without any preference or priority amongstthemselves, and at least pari passu with all other present and future direct, unconditional,unsecured, and unsubordinated peso-denominated obligations of the Bank, except for anyobligation enjoying a statutory preference or priority established under Philippine laws.
USD Social Bonds Due 2028
The International Finance Corporation (IFC) invested in a USD 150 million social bond issuedby the Bank under its sustainable finance framework. The social bond carries an interest rate of1.15% and is unsecured. It is the first social bond by the Parent Bank and its longest-term USD-denominated bond to date. Proceeds from the bond will be used to finance loans to micro, smalland medium-sized enterprises (MSMEs).
The Parent Bank shall at all times maintain, and abstain from any action which may result in thebreach of, several financial parameters provided in the subscription agreement with IFC.
Unsecured Subordinated Tier 2 Notes Due 2030 Callable in 2025
The Basel III-compliant Unsecured Subordinated Tier 2 Notes were issued by the Parent Bankunder its BSP-approved issuance of ₱20.0 Billion Unsecured Subordinated Notes Qualifying asTier 2 Capital.
Unless the Notes are previously redeemed, the Initial Interest Rate will be reset at the equivalentof the Initial Spread per annum plus the Benchmark as of Reset Date as defined in the Termsand Conditions of the Notes. Subject to certain conditions, the BSP Guidelines, and the Termsand Conditions, the Parent Bank may redeem the Notes in whole and not only in part on theRedemption Option Date at 100% of the face value of the Notes, plus accrued and unpaidinterest as of but excluding the Redemption Option Date.
The Notes have a loss absorption feature which means the Notes are subject to a Non-ViabilityWrite-Down in case of a Non- Viability Trigger Event. A Non-Viability Trigger Event isdeemed to have occurred when the Issuer is considered non-viable as determined by the BSP.

Notes and Bonds Payable - 119 -
*SGVFS162380*
The Tier II Notes constitute a direct, unconditional, fixed, unsecured and subordinatedobligation of the Bank. Claims in respect of the Tier II Notes will rank: (a) junior to the claimsof holders of all deposits and general creditors of the Bank; (b) pari passu with obligations ofthe Bank that are, expressly or by applicable laws, subordinated so as to rank pari passu withclaims in respect of securities constituting “Tier 2” capital of the Bank; and (c) senior to (i) theclaims for payment of any obligation that, expressly or by applicable law, is subordinated to theTier II Notes, (ii) the claims in respect of securities constituting “Tier 1” capital of the Bank,and (iii) the rights and claims of holders of equity shares of the Bank.
Peso Senior Series B Bonds Due 2022
These P=5.8 Billion worth of Senior Corporate Series B Bonds were issued under the ParentBank’s P=39 Billion Corporate Bonds Program. These fixed rate Bonds were issued in scriplessform and were listed in the PDEx.
The Bonds constitute direct, unconditional, unsecured, and unsubordinated peso-denominatedobligations of the Bank, enforceable according to the Terms and Conditions of the Bonds, andshall at all times rank pari passu and ratably without any preference or priority amongstthemselves, and at least pari passu with all other present and future direct, unconditional,unsecured, and unsubordinated peso-denominated obligations of the Bank, except for anyobligation enjoying a statutory preference or priority established under Philippine laws.
The Bonds shall be redeemed at par on maturity date which is on June 3, 2022. The Bank mayredeem the Bonds in whole and not only in part on the Early Redemption Date at the face valueof the Bonds, plus accrued and unpaid interest as of but excluding the Early Redemption Date.
Peso Senior Series D Bonds Due 2026
These fixed rate Senior Series Bonds Due 2026 worth P=885.0 million formed part of the Bank’sdual-tranche issuance on December 9, 2020. The Bonds were issued under the existingP=39 Billion Corporate Bonds Program of the Bank.
The Bank may, at its sole option and subject to the Terms and Conditions of the issuance,redeem the Bonds at par plus accrued interest (if any), without premium or penalty, as of butexcluding the Early Redemption Date.
The Bonds constitute direct, unconditional, unsecured and unsubordinated obligations of theBank.
Loans PayableOn May 31, 2018, UIC availed of a term loan in the amount of P=150,000 with a certain localbank. The loan is unsecured and carries a fixed interest rate of 5.75% per annum payablesemi-annually. The term of the loan is five (5) years and is payable in seven (7) equalsemi-annual amortization commencing at the end of the second year from availment.
The interest expense on notes and bonds payable amounted to P=2,197,668, P=2,431,837, andP=2,314,974 in 2021, 2020, and 2019, respectively, for the Group, and P=2,173,188, P=2,408,257,and P=2,294,444 in 2021, 2020, and 2019, respectively, for the Parent Bank. These are includedunder Interest Expense on Bills payable and other liabilities account in the statements of income.
As of December 31, 2021 and 2020, the Group is in compliance with all the debt covenants onthe above notes and bonds.

Other Liabilities - 120 -
*SGVFS162380*
24. Other Liabilities
Other liabilities consist of the following as of December 31:
Group Parent Bank
2021 2020 2021 2020
Manager’s checks P=6,894,499 P=6,925,159 P=6,894,499 P=6,925,159Accounts payable 5,799,285 5,027,797 4,827,329 3,949,136Accrued taxes and other expenses 5,663,843 5,277,334 4,611,427 4,326,945Other dormant credits 2,330,284 1,437,600 2,235,569 1,409,147Lease liabilities 1,382,880 1,219,584 1,043,850 1,004,057Post-employment defined benefit
obligation (Note 29) 1,026,250 1,181,752 893,028 1,105,044Derivative liabilities (Note 11) 750,009 747,310 750,009 747,310Unearned income - bancassurance (Note 32) 733,333 733,333 733,333 733,333Payment orders payable 485,268 2,343,479 485,268 2,343,479Bills purchased - domestic and foreign 458,312 1,002,263 458,312 1,002,263Withholding taxes payable 183,284 209,751 142,249 170,523Pre-need reserves 15,127 26,710 – –Miscellaneous 1,636,843 1,312,538 1,357,936 1,121,965
P=27,359,217 P=27,444,610 P=24,432,809 P=24,838,361
The unearned income represents the unamortized portion of the Exclusive Access Fees (EAF)arising from the Parent Bank’s bancassurance agreement with a related party (see Note 32).
Set out below is the carrying amount of lease liabilities and the movements during the year:
Group Parent Bank
2021 2020 2021 2020
As at January 1 P=1,219,584 P=1,337,296 P=1,004,057 P=1,064,941Additions 673,608 392,602 431,142 348,608Effect of business combination (Note 15) – 22,933 – –Payments (579,065) (613,498) (446,112) (477,197)Accretion of interest (Note 34) 68,753 80,251 54,763 67,705
As at December 31 P=1,382,880 P=1,219,584 P=1,043,850 P=1,004,057
Accretion of interest is included as part of Interest expense on bills payable and other liabilitiesaccount in the statements of income.
As at December 31, 2021 and 2020, the Group has not committed to leases which had not yetcommenced.
The breakdown of Accrued taxes and other expenses account follows:
Group Parent Bank
2021 2020 2021 2020
Accrued interest payable P=787,447 P=757,580 P=626,544 P=624,736Accrued income and other taxes 613,119 711,003 330,028 386,730Accrued sick and vacation leave benefits 465,964 574,160 464,222 573,308Other accruals 3,797,313 3,234,591 3,190,633 2,742,171
P=5,663,843 P=5,277,334 P=4,611,427 P=4,326,945
Other accruals represent mainly fringe and other personnel benefits.

Capital Funds - 121 -
*SGVFS162380*
25. Capital Funds
Capital Stock
The Parent Bank’s capital stock as of December 31, 2021 and 2020 consists of the following:
Shares Amount
2021 2020 2021 2020
Common – P=10 par valueAuthorized 2,530,785,238 1,311,422,420 P=25,307,852 P=13,114,224Issued and outstanding 1,219,362,818 1,218,471,467 12,193,628 12,184,715
Preferred – P=100 par value, non-voting
Authorized 100,000,000 100,000,000 P=10,000,000 P=10,000,000
Issued and outstanding – – – –
On June 29, 1992, the Parent Bank was originally listed with the then Makati Stock Exchange,now PSE. A total of 89.7 million shares were issued at an issue price of P=22.50. As ofDecember 31, 2021 and 2020, there are 1,219.4 million shares and 1,218.5 million shares listed atthe PSE. The number of holders and the closing price of the said shares is 4,949 and P=99.50 pershare as of December 31, 2021, respectively, and 4,953 and P=71.90 per share as of December 31,2020, respectively.
On January 29, 2021, January 24, 2020 and March 1, 2019, the Parent Bank issued 891,351,861,906 and 460,049 common shares to qualified employees under the Parent Bank’s EmployeeStock Payment Plan, respectively.
Surplus Free
On August 11, 2021, the Parent Bank held a special stockholders meeting and approved thefollowing matters:
a. Amendment of the Parent Bank’s Articles of Incorporation (AOI) to increase the authorizedcapital stock from P=23.1 billion to P=35.3 billion, with the increase of P=12.2 billion equivalentto 1,219,362,818 common shares with a par value of P=10.00.
b. Declaration of 25% stock dividends in the amount of P=3.0 billion equivalent to 304,840,705common shares with a par value of P=10.00, to comply with the required 25% subscription ofthe increase in authorized capital stock.
The stock dividend is presented as Stock dividend distributable in the statement of financialposition as of December 31, 2021.
On October 14, 2021 and November 17, 2021, the Parent Bank obtained the BSP and the SECapproval, respectively, for the increase in the authorized capital stock and for the issuance ofcommon shares to stockholders of record as of December 9, 2021 and payment date onJanuary 5, 2022 (see Note 36).

Capital Funds - 122 -
*SGVFS162380*
Fractional shares resulting from the stock dividend declaration will be paid in cash based on theclosing rate of P=74.90 as of June 25, 2021, the date of approval by the BOD of the stock dividenddeclaration and computed up to two (2) decimal places.
The following is a summary of the cash dividends declared and distributed by the Parent Bank in2021, 2020, and 2019:
Date of
Declaration Date of Record
Date of BSP
Approval
Date of
Payment
Dividend per
Share
Outstanding
Shares Total Amount
January 29, 2021 February 15, 2021 N/A March 4, 2021 P=3.50 1,219,362,818 P=4,267,770
January 24, 2020 February 7, 2020 N/A February 24, 2020 3.50 1,218,471,467 4,264,650January 25, 2019 February 11, 2019 N/A February 28, 2019 1.90 1,217,149,512 2,312,584
In compliance with BSP regulations, the Parent Bank ensures that adequate reserves are in placefor future bank expansion requirements. The foregoing cash dividend declarations were madewithin the BSP’s allowable limit of dividends.
Surplus ReservesThe amended PNUCA requires that the portion of retained earnings representing Trust fundincome of FUPI be automatically restricted to payments of benefits of plan holders and relatedpayments as allowed in the amended PNUCA. The accumulated Trust Fund income, net ofreleases representing the amount of Trust fund income that pertains to the matured and pre-terminated plans of planholders which have been withdrawn from the trust fund during the year,should be appropriated and presented separately as Surplus Reserves in the statements of changesin capital funds. FUPI transferred out P=0.66 million, P=1,458.7 million, and P=112.1 million fromappropriated reserves for the years ended December 31, 2021, 2020, and 2019, respectively.
In compliance with BSP regulations, a portion of the Group’s income from trust operations issetup as Surplus Reserves. For the years ended December 31, 2021, 2020, and 2019, the Groupand the Parent Bank appropriated P=24.0 million, P=17.1 million, and P=16.1 million, respectively.
Included in this account is the difference between the 1% general loan loss provision (GLLP)over the computed ECL allowance for credit losses related to Stage 1 accounts, as a required BSPappropriation. As of December 31, 2021 and 2020, surplus reserves related to the differencebetween GLLP over ECL allowance amounted to P=2.44 billion and P=2.30 billion, respectively,for the Group and, P=2.02 billion and P=1.89 billion, respectively, for the Parent Bank.

Maturity Profile of Assets and Liabilities - 123 -
*SGVFS162380*
26. Maturity Profile of Assets and Liabilities
The following tables show an analysis of assets and liabilities analyzed according to whether theyare expected to be recovered or settled within one year and beyond one year from the statementof financial position date:
Group
2021 2020
Due within
one year
Due beyond
one year Total
Due withinone year
Due beyondone year Total
Financial Assets
Cash and other cash items P=8,904,903 P=− P=8,904,903 P=8,958,042 P=− P=8,958,042
Due from BSP 103,407,946 − 103,407,946 103,869,770 − 103,869,770Due from other banks 54,290,872 − 54,290,872 68,555,326 − 68,555,326IBLR 17,492,657 − 17,492,657 − − −Trading and investment securities
at FVTPL 5,640,005 − 5,640,005 18,448,649 − 18,448,649at amortized cost - gross 3,956,003 162,655,314 166,611,317 3,542,411 152,608,258 156,150,669
at FVOCI 36,405 65,636,205 65,672,610 19,522 31,170,737 31,190,259Loans and receivables - net of
unearned discounts 126,166,158 247,541,328 373,707,486 111,744,275 239,310,457 351,054,732
Other resources 233,374 1,702,411 1,935,785 314,939 1,205,783 1,520,722
320,128,323 477,535,258 797,663,581 315,452,934 424,295,235 739,748,169
Nonfinancial Assets
Investment in associates − 142,355 142,355 − 255,342 255,342Bank premises, furniture, fixtures
and equipment − 13,424,676 13,424,676 − 12,401,256 12,401,256
Investment properties − 11,700,174 11,700,174 − 11,723,974 11,723,974Goodwill − 14,818,932 14,818,932 − 15,348,531 15,348,531Other resources 2,653,680 14,658,647 17,312,327 1,419,237 13,847,447 15,266,684
2,653,680 54,744,784 57,398,464 1,419,237 53,576,550 54,995,787
P=322,782,003 P=532,280,042 P=855,062,045 P=316,872,171 P=477,871,785 P=794,743,956
Allowance for credit losses andimpairment (Notes 20) 14,377,276 12,137,642
Accumulated depreciation(Notes 16 and 17) 9,589,308 8,147,077
23,966,584 20,284,719
P=831,095,461 P=774,459,237
Financial Liabilities
Deposit liabilities P=509,088,972 P=61,411,920 P=570,500,892 P=504,349,110 P=23,435,916 P=527,785,026Bills payable 37,518,356 13,649,782 51,168,138 35,631,769 18,591,774 54,223,543
Notes and bonds payable 31,279,504 38,574,482 69,853,986 − 59,853,656 59,853,656Other liabilities 20,074,647 1,787,707 21,862,354 21,381,423 1,711,596 23,093,019
597,961,479 115,423,891 713,385,370 561,362,302 103,592,942 664,955,244Nonfinancial Liabilities
Accrued income and other taxes 613,119 − 613,119 711,003 − 711,003
Other liabilities 183,284 4,700,460 4,883,744 209,751 3,430,837 3,640,588
796,403 4,700,460 5,496,863 920,754 3,430,837 4,351,591
P=598,757,882 P=120,124,351 P=718,882,233 P=562,283,056 P=107,023,779 P=669,306,835

Maturity Profile of Assets and Liabilities and
Service Charges, Fees and Commissions - 124 -
*SGVFS162380*
Parent Bank
2021 2020
Due within
one year
Due beyond
one year Total
Due withinone year
Due beyondone year Total
Financial Assets
Cash and other cash items P=7,988,517 P=− P=7,988,517 P=7,814,917 P=− P=7,814,917Due from BSP 67,478,389 − 67,478,389 83,867,434 − 83,867,434
Due from other banks 51,337,269 − 51,337,269 64,782,755 − 64,782,755IBLR 17,492,657 − 17,492,657 − − −Trading and investment securities
at FVTPL 5,571,270 − 5,571,270 18,411,304 − 18,411,304at amortized cost - gross 3,877,699 158,510,888 162,388,587 3,450,996 150,059,817 153,510,813at FVOCI − 65,370,691 65,370,691 − 31,009,041 31,009,041
Loans and receivables - net ofunearned discounts 105,451,961 196,166,281 301,618,242 90,445,312 191,597,831 282,043,143
Other resources 169,164 1,597,023 1,766,187 248,744 1,090,830 1,339,574
259,366,926 421,644,883 681,011,809 269,021,462 373,757,519 642,778,981
Nonfinancial Assets
Investment in subsidiaries − 23,082,955 23,082,955 − 21,867,987 21,867,987Bank premises, furniture, fixtures
and equipment − 9,522,584
9,522,584
− 8,879,704 8,879,704
Investment properties − 10,288,745 10,288,745 − 10,299,738 10,299,738Goodwill − 7,886,898 7,886,898 − 7,886,898 7,886,898Other resources 2,141,413 11,427,442 13,568,855 1,269,214 11,012,152 12,281,366
2,141,413 62,208,624 64,350,037 1,269,214 59,946,479 61,215,693
P=261,508,339 P=483,853,507 P=745,361,846 P=270,290,676 P=433,703,998 P=703,994,674
Allowance for credit losses andimpairment 10,900,854 9,284,214
Accumulated depreciation
(Notes 16 and 17) 6,942,701 5,830,455
17,843,555 15,114,669
P=727,518,291 P=688,880,005
Financial Liabilities
Deposit liabilities 443,573,142 49,486,039 P=493,059,181 P=445,768,872 P=19,459,747 P=465,228,619Bills payable 23,646,105 4,931,669 28,577,774 22,060,529 12,441,892 34,502,421Notes and bonds payable 31,279,504 38,510,332 69,789,836 − 59,746,857 59,746,857
Other liabilities 18,271,686 1,362,008 19,633,694 19,579,840 1,436,824 21,016,664
516,770,437 94,290,048 611,060,485 487,409,241 93,085,320 580,494,561Nonfinancial Liabilities
Accrued income and other taxes 330,028 - 330,028 386,730 − 386,730Other liabilities 142,249 4,326,838 4,469,087 170,523 3,264,444 3,434,967
472,277 4,326,838 4,799,115 557,253 3,264,444 3,821,697
P=517,242,714 P=98,616,886 P=615,859,600 P=487,966,494 P=96,349,764 P=584,316,258
27. Service Charges, Fees and Commissions
This account is broken down as follows:
Group Parent Bank
2021 2020 2019 2021 2020 2019
Service charges P=2,817,479 P=1,402,768 P=1,169,886 P=1,850,655 P=1,040,199 P=1,000,367
Bank commissions 189,630 190,677 206,408 157,510 128,194 143,569Others 766,202 753,194 579,924 484,191 555,227 278,780
P=3,773,311 P=2,346,639 P=1,956,218 P=2,492,356 P=1,723,620 P=1,422,716
Others include commission income and other fees earned by the Parent Bank on the insurancepolicies sold under the bancassurance deal with Insular Life (see Note 32).

Miscellaneous Income and Expenses - 125 -
*SGVFS162380*
28. Miscellaneous Income and Expenses
Miscellaneous Income
Miscellaneous income is composed of the following:
Group
2021 2020 2019
Foreign exchange gains - net P=1,295,539 P=535,536 P=682,371
Income from trust operations (Note 31) 239,994 171,271 160,929
Fines and penalties 175,877 209,382 131,537Gain on sale of investments in associates and
subsidiary (Note 15) 167,332 − −Recoveries from charged-off assets 164,270 94,523 143,781
Dividend 145,789 200,671 202,888Gain on foreclosure of investment properties (Note 17) 135,309 153,876 221,213
Rental (Notes 17 and 34) 116,450 154,077 163,730
Gain (loss) on sale of investment properties (Note 17) (43,689) 229,148 200,079
Gain (loss) on sale of property and equipment 18,108 (8,641) 679,298Trust fund income (loss) (Note 19) 212 (14,976) 72,534
Gain from bargain purchase (Note 15) − 25,291 −Others 446,624 328,838 309,021
P=2,861,815 P=2,078,996 P=2,967,381
Parent Bank
2021 2020 2019
Share in net profit of subsidiaries (Note 15) P=1,173,016 P=953,082 P=1,222,595Foreign exchange gains – net 869,122 242,388 398,739
Income from trust operations (Note 31) 239,994 171,271 161,078
Gain on sale of investment properties (Note 17) 207,360 195,471 251,696Dividend 145,789 200,671 201,858
Gain on foreclosure of investment properties (Note 17) 135,309 153,876 208,233
Rental (Notes 17 and 34) 132,734 164,177 165,523
Gain on sale of property and equipment 1,900 6,236 616,137Others 637,604 477,876 366,987
P=3,542,828 P=2,565,048 P=3,592,846
Miscellaneous Expenses
The breakdown of miscellaneous expenses follows:
Group
2021 2020 2019
Information technology P=1,559,722 P=1,072,710 P=617,882Outside services 1,304,352 882,658 829,185
Insurance 1,095,425 1,085,667 912,531
Advertising and publicity 1,078,193 657,220 765,796
Supervision and compliance costs 597,197 579,870 541,818Impairment on goodwill (Note 18) 529,599 223,172 −Card related expenses 493,255 326,021 253,815
Communication 434,029 279,268 418,923
Management and professional fees 424,333 421,616 502,090Stationery and supplies 369,415 221,047 169,668
Provision for impairment of non-current assets held for sale 383,288 181,410 −Transportation and travel 175,810 177,591 276,988Repairs and maintenance 129,711 168,584 262,496
Litigation 73,377 189,844 148,568
Fines and penalties 65,679 49,665 40,873
Reversal of impairment on investment properties (Note 17) (64,649) − (13,173)Representation and entertainment 43,165 39,516 57,529
Others 1,585,169 1,193,207 1,077,179
P=10,277,070 P=7,749,066 P=6,862,168

Miscellaneous Income and Expenses and
Salaries and Employee Benefits - 126 -
*SGVFS162380*
Parent Bank
2021 2020 2019
Information technology P=1,475,863 P=1,015,784 P=600,133Advertising and publicity 1,052,145 619,558 719,042
Insurance 952,327 967,995 811,700
Outside services 706,927 607,103 647,026Supervision and compliance costs 517,116 553,058 453,467
Card related expenses 493,255 326,021 253,815
Management and professional fees 337,332 320,891 417,295
Stationery and supplies 322,034 173,489 122,257Communication 287,329 143,293 291,884
Repairs and maintenance 92,144 122,550 212,122
Transportation and travel 80,497 92,934 137,353
Litigation 69,306 189,347 145,785Reversal of impairment on investment properties (Note 17) (64,649) − (10,873)
Representation and entertainment 36,471 34,107 52,093
Provision for impairment of investment insubsidiaries (Note 15) − 290,002 −
Others 789,174 670,331 480,255
P=7,147,271 P=6,126,463 P=5,333,354
29. Salaries and Employee Benefits
Salaries and Employee Benefits Expense
Expenses recognized for employee benefits are as follows:Group
2021 2020 2019
Short-term benefits:Salaries and wages P=4,378,637 P=4,042,160 P=3,956,706Bonuses and fringe benefits 3,279,091 2,964,199 3,455,521
Social security costs 209,543 172,358 194,438Other benefits 250,263 175,912 126,626
Post-employment and other long-term benefits 529,168 454,575 336,957
P=8,646,702 P=7,809,204 P=8,070,248
Parent Bank
2021 2020 2019
Short-term benefits:Salaries and wages P=3,167,844 P=2,958,540 P=2,836,275Bonuses and fringe benefits 2,712,001 2,359,984 3,150,263Social security costs 123,634 101,542 93,198Other benefits 160,551 114,174 107,215
Post-employment and other long-term benefits 427,390 376,741 247,801
P=6,591,420 P=5,910,981 P=6,434,752
Post-employment Defined Benefit Plan
(a) Characteristics of the Defined Benefit Plan
The Group maintains funded, tax-qualified, noncontributory pension plans covering allregular full-time employees that are being administered by appointed trustee banks, includingthe Parent Bank’s TISG, for the Parent Bank, UIC, CSB for FUIFAI, PR Savings Bank andPETNET. Under these pension plans, all covered employees are entitled to cash benefitsafter satisfying certain age and service requirements.

Salaries and Employee Benefits - 127 -
*SGVFS162380*
The Group maintains seven separate retirement plans. Two of which are being maintainedfor UnionBank and former iBank employees, hence, the Parent Bank presents pensioninformation in its financial statements separately for the two plans. The other five pensionplans are for UIC, CSB, FUIFAI, PR Savings Bank and PETNET employees.
UnionBank PlanThe normal retirement age is 60. The plan also provides for an early retirement at age 55, orage 50 with the completion of at least ten years of service. However, late retirement issubject to the approval of the Parent Bank’s BOD. Normal retirement benefit is an amountequivalent to 150% of the final monthly salary for each year of credited service.
Former iBank PlanThe normal retirement age is 60 with a minimum of five years of credited service. The planalso provides for an early retirement at age 50 with the completion of at least ten years ofservice and late retirement subject to the approval of the Parent Bank’s BOD on a case-to-case basis. Normal retirement benefit is an amount equivalent to 125% of the final monthlycovered compensation for every year of credited service.
UIC PlanThe optional retirement age is 60 and the compulsory retirement age is 65. Both must have aminimum of five years of credited service. Both have retirement benefit equal to one-halfmonth’s salary as of the date of retirement multiplied by the employee’s year of service.Upon retirement of an employee, whether optional or compulsory, his services may becontinued or extended on a case to case basis upon agreement of management and employee.
This is based on the retirement plan benefits provided in the Retirement Law(R.A. No. 7641).
Under the law, unless the parties provide for broader inclusions, the term one-half (1/2)month salary shall mean fifteen (15) days plus one-twelfth (1/12) of the 13th month pay andthe cash equivalent of not more than (5) days of service incentive leaves.
CSB PlanThe normal retirement age is 60 or completion of 30 years of service whichever is earlier.The service of any member, however, may be extended from year to year beyond the normalretirement date, provided such an extension of service is with the consent of the member andthe express approval of CSB. The plan also provides for an early retirement after completionof at least ten years of service. Normal retirement benefit is an amount equivalent to 100%of the final basic monthly salary multiplied by the number of years of service prior toJanuary 1, 2008 and 150% of the final basic monthly salary for services rendered startingJanuary 1, 2008.
PR Savings Bank PlanThe normal retirement age is 60. Retirement benefit is an amount equivalent to 100%, 150% or200% of the latest basic monthly salary for each year of credited service if the years of serviceis 10 years but less than 15 years, 15 years but less than 20 years and 20 years or more,respectively.

Salaries and Employee Benefits - 128 -
*SGVFS162380*
FUIFAI PlanThe normal retirement age is 60 with a minimum of five years of credited service. The planalso provides for an early retirement at age 50 with a minimum of five years of credited serviceand late retirement after age 60, both subject to the approval of FUIFAI’s BOD. Normalretirement benefit is an amount equivalent to 150% of the final monthly covered compensation(average monthly basic salary during the last 12 months of credited service) for every year ofcredited service.
PETNET PlanThe normal retirement age is 60. The plan also provides for an early retirement at age 50 withthe completion of at least ten years of service and late retirement beyond age 60. However,early and late retirement are subject to the approval of the company. Retirement benefit is anamount equivalent to 92% of the final monthly salary for each year of continuous service.
Bangko Kabayan PlanThe normal retirement age is 60 with at least five years of credited service. Retirement benefitis an amount equivalent to 100%, 125% or 150% of the latest basic monthly salary for eachyear of credited service if the years of service is 10 years but less than 15 years, 15 years butless than 20 years, and 20 years or more, respectively.
PBI PlanThe normal retirement age is 60 with at least five years of credited service. Retirement benefitis an amount equivalent to 22.5 days pay for every year of credited service.
(b) Analysis of Amounts Presented in the Financial Statements
Actuarial valuations are made annually to update the retirement benefit costs and the amountof contributions. All amounts presented in the subsequent pages are based on the actuarialvaluation reports obtained from independent actuaries in 2021 and 2020.
The amounts of post-employment defined benefit obligation (net retirement asset) recognizedin the statements of financial position are determined as follows (see Notes 19 and 24):
Group
2021 2020
Present value of the obligation P=5,285,027 P=5,225,149Fair value of plan assets 4,321,676 4,113,808
P=963,351 P=1,111,341
As of December 31, 2021 and 2020, the net retirement obligation amounting toP=963,351 and P=1,111,341 is separately shown as Net retirement asset of P=62,899 andP=70,411, respectively (see Note 19), and as Post-employment defined benefit obligation ofP=1,026,250 and P=1,181,752, respectively (see Note 24).
Parent Bank – UnionBank Plan
2021 2020
Present value of the obligation P=3,876,193 P=3,861,379Fair value of plan assets 3,017,887 2,857,169
P=858,306 P=1,004,210

Salaries and Employee Benefits - 129 -
*SGVFS162380*
Parent Bank – Former iBank Plan
2021 2020
Present value of the obligation P=638,772 P=683,325Fair value of plan assets 604,050 582,491
P=34,722 P=100,834
The movements in the present value of the post-employment benefit obligation recognized inthe financial statements are as follows:
Group
2021 2020 2019
Balance at beginning of year P=5,225,149 P=3,912,530 P=3,344,042Current service cost 529,168 456,544 307,103Interest expense 158,374 182,222 226,273Past service cost − (1,969) 29,854Remeasurements:
Actuarial losses (gains) arising from Changes in financial assumptions (524,992) 747,764 376,639
Experience adjustments 60,611 (190) (25,206)Changes in demographic assumptions 977 4,095 (7,483)
Benefits paid (164,260) (157,627) (338,692)Effects of business combinations (Note 15) − 81,780 −Balance at end of year P=5,285,027 P=5,225,149 P=3,912,530
Parent Bank - UnionBank Plan
2021 2020 2019
Balance at beginning of year P=3,861,379 P=2,862,263 P=2,363,016Current service cost 393,374 347,923 220,321Interest expense 135,011 126,301 162,028Remeasurements:
Actuarial losses (gains) arising fromChanges in financial assumptions (400,963) 601,247 270,193Experience adjustments 74,233 7,076 24,637Changes in demographic assumptions − 7,660 (3,097)
Benefits paid (186,841) (91,091) (174,835)
Balance at end of year P=3,876,193 P=3,861,379 P=2,862,263
Parent Bank - Former iBank Plan
2021 2020 2019
Balance at beginning of year P=683,325 P=550,665 P=482,049Current service cost 34,016 28,818 27,480Interest expense 22,387 24,807 32,881Remeasurements:
Actuarial losses (gains) arising fromChanges in financial assumptions (71,578) 108,630 55,384Experience adjustments 6,241 1,006 (5,842)Changes in demographic assumptions 1,134 (5,280) 1,157
Benefits paid (36,753) (25,321) (42,444)
Balance at end of year P=638,772 P=683,325 P=550,665

Salaries and Employee Benefits - 130 -
*SGVFS162380*
The movements in the fair value of plan assets are presented below.
Group
2021 2020 2019
Balance at beginning of year P=4,113,808 P=3,572,539 P=3,380,329Interest income 118,247 167,778 235,128Return on plan asset (excluding amounts included
in net interest) 39,271 117,046 (218,422)Contributions to the plan 219,028 353,473 514,196Benefits paid (168,678) (157,625) (338,692)
Effects of business combinations (Note 15) − 60,597 −Balance at end of year P=4,321,676 P=4,113,808 P=3,572,539
Parent Bank - UnionBank Plan
2021 2020 2019
Balance at beginning of year P=2,857,169 P=2,471,361 P=2,339,889Interest income 96,851 111,781 168,308Return on plan asset (excluding amounts included
in net interest) 20,665 109,553 (12,610)Contributions to the plan 230,043 255,565 150,609Benefits paid (186,841) (91,091) (174,835)
Balance at end of year P=3,017,887 P=2,857,169 P=2,471,361
Parent Bank - Former iBank Plan
2021 2020 2019
Balance at beginning of year P=582,491 P=541,311 P=499,545Interest income 18,888 24,212 35,088Return on plan asset (excluding amounts included
in net interest) 16,291 22,019 18,856Contributions to the plan 23,133 20,270 30,266Benefits paid (36,753) (25,321) (42,444)
Balance at end of year P=604,050 P=582,491 P=541,311
The composition of the fair value of plan assets at the end of the reporting period by categoryand risk characteristics is shown below.
Group
2021 2020
Bank deposits P=453,805 P=446,015
Quoted equity securities:Financial and insurance activities 2,114,621 1,733,124Real estate activities 159,786 34,346Electricity, gas and water 15,192 44,267Wholesale and retail trade 7,366 2,841
Others 160,451 71,261
2,457,416 1,885,839
Debt securities:Corporate bonds 1,123,070 1,175,874Philippine government bonds 132,660 425,128
1,255,730 1,601,002
Others 154,725 180,952
P=4,321,676 P=4,113,808

Salaries and Employee Benefits - 131 -
*SGVFS162380*
Parent Bank - UnionBank Plan
2021 2020
Bank deposits P=382,607 P=426,857
Quoted equity securities:Financial and insurance activities 1,408,610 1,006,638Real estate activities 130,001 25,722Electricity, gas and water 7,264 37,214Wholesale and retail trade 5,815 9,030
Others 137,445 54,637
1,689,135 1,133,241
Debt securities:Corporate bonds 867,833 912,134Philippine government bonds 65,640 369,733
933,473 1,281,867
Others 12,672 15,204
P=3,017,887 P=2,857,169
Parent Bank - Former iBank Plan
2021 2020
Bank deposits P=39,799 P=2,328
Quoted equity securities:Financial intermediation 350,903 413,478Real estate activities 29,781 −Wholesale and retail trade 1,551 −
Others 22,916 −405,151 413,478
Debt securities:Corporate bonds 150,598 152,295Philippine government bonds 7,508 12,062
158,106 164,357
Others 994 2,328
P=604,050 P=582,491
Equity securities under the fund are primarily investments in corporations listed in the PSE,which include P=277,114 and P=186,210 investments in the shares of stocks of the Parent Bankas of December 31, 2021 and 2020, respectively, while debt securities represent investmentsin government and corporate bonds, which include P=479,891 and P=444,099 investment in thenotes of the Parent Bank as of December 31, 2021 and 2020, respectively (see Note 32).
The fair values of the above equity and debt securities are determined based on quotedmarket prices in active markets (classified as Level 1 of the fair value hierarchy). Theretirement fund neither provides any guarantee or surety for any obligation of the ParentBank nor its investments in the Bank’s shares of stocks covered by any restriction and liens.Bank deposits are maintained with reputable financial institutions, which include P=394,281and P=353,597 deposits with the Parent Bank as of December 31, 2021 and 2020, respectively(see Note 32).
Actual returns on plan assets amounted to P=157,518 in 2021, P=284,824 in 2020, and P=16,706in 2019 for the Group. Actual returns on plan assets amounted to P=117,517 in 2021,P=221,334 in 2020, and P=155,698 in 2019 for UnionBank Plan and P=35,179 in 2021, P=46,231in 2020, and P=53,944 in 2019 for Former iBank Plan.

Salaries and Employee Benefits - 132 -
*SGVFS162380*
The amounts recognized in the statements of income in respect of the post-employmentdefined benefit plan are as follows:
Group
2021 2020 2019
Current service cost P=529,168 P=456,544 P=307,103Past service cost − (1,969) 29,854Net interest expense (income) 40,127 14,444 (8,855)
P=569,295 P=469,019 P=328,102
Parent Bank - UnionBank Plan
2021 2020 2019
Current service cost P=393,374 P=347,923 P=220,321Net interest expense (income) 38,160 14,520 (6,280)
P=431,534 P=362,443 P=214,041
Parent Bank - Former iBank Plan
2021 2020 2019
Current service cost P=34,016 P=28,818 P=27,480Net interest expense (income) 3,499 595 (2,207)
P=37,515 P=29,413 P=25,273
The amounts recognized in other comprehensive income in respect of the post-employmentdefined benefit plan are as follows:
Group
2021 2020 2019
Actuarial losses (gains) arising from changes in:Financial assumption (P=524,992) P=747,764 P=376,639Experience adjustments 60,611 (190) (25,206)Demographic assumptions 977 4,095 (7,483)
Return on plan assets (excluding amountsincluded in net interest) (39,271) (117,046) 218,423
(P=502,675) P=634,623 P=562,373
Parent Bank - UnionBank Plan
2021 2020 2019
Actuarial losses (gains) arising from changes in:Financial assumption (P=400,963) P=601,247 P=270,193Experience adjustments 74,233 7,076 24,637
Demographic assumptions − 7,660 (3,097) Return on plan assets (excluding amounts
included in net interest) (20,665) (109,553) 12,610
(P=347,395) P=506,430 P=304,343
Parent Bank - Former iBank Plan
2021 2020 2019
Actuarial losses (gains) arising from changes in:Financial assumption (P=71,578) P=108,630 P=55,384Experience adjustments 6,241 1,006 (5,842)Demographic assumptions 1,134 (5,280) 1,157
Return on plan assets (excluding amountsincluded in net interest) (16,291) (22,019) (18,856)
(P=80,494) P=82,337 P=31,843

Salaries and Employee Benefits - 133 -
*SGVFS162380*
In addition to the above items, the Parent Bank also recognized its share of the othercomprehensive income of subsidiaries in respect of the post-employment defined benefit planamounting to P=38,907 gain, P=21,228 loss, and P=87,086 loss in 2021, 2020, and 2019,respectively (see Note 15).
The Group and the Parent Bank expects to contribute P=494,970 and P=392,251, respectively,in 2022.
In determining the retirement benefits, the following actuarial assumptions were used:
Group
2021 2020 2019
Retirement age 60 60 60Average remaining working life 6-27 years 6-19 years 6-19 yearsDiscount rate 3.88%-5.15% 3.37%-3.98% 4.62%-5.21%Expected rate of salary increase 2.00%-6.00% 3.50%-6.00% 4.00%-10.00%Employee turnover rate 0%-22% 0%-22% 0%-22%
Parent Bank - UnionBank Plan
2021 2020 2019
Retirement age 60 60 60Average remaining working life 10 years 10 years 9 yearsDiscount rate 5.02% 3.80% 4.87%Expected rate of salary increase 6.00% 6.00% 5.00%Employee turnover rate 0%-18% 0%-18% 0%-14%
Parent Bank - Former iBank Plan
2021 2020 2019
Retirement age 60 60 60Average remaining working life 9 years 9 years 10 yearsDiscount rate 4.87% 3.47% 4.71%Expected rate of salary increase 6.00% 6.00% 5.00%Employee turnover rate 0%-15% 0%-16% 0%-12%
Assumptions regarding future mortality and disability are based on published statistics andmortality tables. These assumptions were developed by management with the assistance ofan independent actuary. Discount factors are determined close to the end of each reportingperiod by reference to the interest rates of a zero coupon government bond with terms tomaturity approximating to the terms of the retirement obligation. Other assumptions arebased on current actuarial benchmarks and management’s historical experience.
(c) Risk Associated with the Retirement Plan
The plans expose the Group to actuarial risks such as investment risk, interest rate risk,longevity risk and salary risk.
Investment and Interest Risk
The present value of the defined benefit obligation is calculated using a discount ratedetermined by reference to market yields of government bonds. Generally, a decrease inthe interest rate of a reference government bonds will increase the plan obligation.However, this will be partially offset by an increase in the return on the plan’sinvestments in debt securities and if the return on plan asset falls below this rate, it willcreate a deficit in the plan. Currently, the plans are mostly invested in equity securities.Due to the long-term nature of plan obligation, a level of continuing equity investments

Salaries and Employee Benefits - 134 -
*SGVFS162380*
is an appropriate element of the Group’s long-term strategy to manage the plansefficiently.
Longevity and Salary Risks
The present value of the defined benefit obligation is calculated by reference to the bestestimate of the mortality of the plan participants both during and after their employmentand to their future salaries. Consequently, increases in the life expectancy and salary ofthe plan participants will results in an increase in the plan obligation.
(d) Other Information
The information on the sensitivity analysis for certain significant actuarial assumptions, theGroup’s asset-liability matching strategy, and the timing and uncertainty of future cash flowsrelated to the retirement plan are described below and in the succeeding pages.
Sensitivity Analysis
The following table summarizes the effects of changes in the significant actuarialassumptions used in the determination of the defined benefit obligation as ofDecember 31:
Group
Impact on Post-Employment Defined
Benefit Obligation
Change in
Assumption
Increase in
Assumption
Decrease in
Assumption
December 31, 2021
Discount rate +/-1.0% (P=380,097) P=445,039
Salary growth rate +/-1.0% 485,262 (441,600)
Turn-over rate +/-20.0% (77,292) 86,152
December 31, 2020Discount rate +/-1.0% (P=420,091) P=497,098Salary growth rate +/-1.0% 530,980 (461,934)Turn-over rate +/-10.0% (70,426) 76,221
UnionBank Plan
Impact on Post-Employment Defined
Benefit Obligation
Change in
Assumption
Increase in
Assumption
Decrease in
Assumption
December 31, 2021
Discount rate +/-1.0% (P=277,799) P=322,564
Salary growth rate +/-1.0% 334,843 (293,992)
Turn-over rate +/-20.0% (30,641) 32,356
December 31, 2020Discount rate +/-1.0% (P=306,244) P=358,795Salary growth rate +/-1.0% 366,336 (319,319)Turn-over rate +/-10.0% (47,717) 51,093

Salaries and Employee Benefits - 135 -
*SGVFS162380*
Former iBank Plan
Impact on Post-Employment Defined
Benefit Obligation
Change in
Assumption
Increase in
Assumption
Decrease in
Assumption
December 31, 2021
Discount rate +/-1.0% (P=43,844) P=49,790
Salary growth rate +/-1.0% 51,843 (46,517)
Turn-over rate +/-20.0% (2,388) 2,568
December 31, 2020Discount rate +/-1.0% (P=51,296) P=58,722Salary growth rate +/-1.0% 59,982 (53,481)Turn-over rate +/-10.0% (3,841) 4,025
The above sensitivity analysis is based on a change in an assumption while holding allother assumptions constant. This analysis may not be representative of the actual changein the defined benefit obligation as it is unlikely that the change in assumptions wouldoccur in isolation of one another as some of the assumptions may be correlated.
Furthermore, in presenting the above sensitivity analysis, the present value of the definedbenefit obligation has been calculated using the projected unit credit method at the end ofthe reporting period, which is the same as that applied in calculating the defined benefitobligation recognized in the statements of financial position.
Asset-liability Matching Strategies
To efficiently manage the retirement plan, the Group through its Retirement Committee,ensures that the investment positions are managed in accordance with its asset-liabilitymatching strategy to achieve that long-term investments are in line with the obligationsunder the retirement scheme. This strategy aims to match the plan assets to theretirement obligations by investing in long-term fixed interest securities (i.e., governmentor corporate bonds) with maturities that match the benefit payments as they fall due andin the appropriate currency. The Group actively monitors how the duration and theexpected yield of the investments are matching the expected cash outflows arising fromthe retirement obligations. In view of this, investments are made in reasonablydiversified portfolio, such that the failure of any single investment would not have amaterial impact on the overall level of assets.
A large portion of assets as of December 31, 2021 and 2020 consists of equity securitiesand bonds, although the Group also invests in bank deposits. The Group believes thatequity securities offer the best returns over the long term with an acceptable level of risk.The majority of equities are in a diversified portfolio of investments in corporationslisted in the PSE.
There has been no change in the Group’s strategies to manage its risks from previousperiods.

Salaries and Employee Benefits - 136 -
*SGVFS162380*
Funding Arrangements and Expected Contributions
There is no minimum funding requirement in the country.
The maturity profile of undiscounted expected benefits payments from the plan follows:
Group
2021 2020
Within one year P=829,934 P=738,615More than one year to five years 1,732,138 1,665,568More than five years to ten years 2,900,740 2,488,465More than ten years to 15 years 3,232,845 3,099,137More than 15 years to 20 years 3,803,723 3,194,127More than 20 years 8,990,049 7,793,315
P=21,489,429 P=18,979,227
UnionBank Plan
2021 2020
Within one year P=680,507 P=616,892More than one year to five years 1,364,443 1,279,552More than five years to ten years 2,296,339 1,971,473More than ten years to 15 years 2,425,424 2,333,867More than 15 years to 20 years 2,586,973 2,204,613More than 20 years 6,584,739 5,817,413
P=15,938,425 P=14,223,810
Former iBank Plan
2021 2020
Within one year P=92,016 P=76,355More than one year to five years 215,090 235,414More than five years to ten years 345,267 299,880More than ten years to 15 years 328,879 343,087More than 15 years to 20 years 286,944 265,216More than 20 years 156,389 188,241
P=1,424,585 P=1,408,193
The weighted average duration of the defined benefit obligation is 19 years both in 2021and 2020.

Income Taxes - 137 -
*SGVFS162380*
30. Income Taxes
Current and Deferred Income TaxesThe components of income tax expense (benefit) for the years ended December 31, 2021, 2020,and 2019 are as follows:
Group
2021 2020 2019
Reported in profit or loss
Current tax expense:Final tax P=1,269,860 P=1,162,262 P=878,067
Regular corporate income tax(RCIT) 826,288 706,944 580,264
MCIT 74,426 295,570 225,424
2,170,574 2,164,776 1,683,755 Deferred tax expense (benefit)
relating to origination and reversal of temporary
differences 236,495 (1,383,396) (1,189,261)
P=2,407,069 P=781,380 P=494,494
Reported in other comprehensive
income
Deferred tax expense (benefit) relating to origination and
reversal of actuarial gains orlosses P=193,286 (P=190,387) (P=168,712)
Parent Bank
2021 2020 2019
Reported in profit or loss
Current tax expense:Final tax P=1,158,225 P=991,134 P=813,187MCIT 74,108 292,860 221,523RCIT 35,941 18,358 17,488
1,268,274 1,302,352 1,052,198Deferred tax expense (benefit) relating to origination and reversal of temporary
differences 420,188 (1,232,987) (1,166,440)
P=1,688,462 P=69,365 (P=114,242)
Reported in other comprehensive
income
Deferred tax expense (benefit) relating to origination and
reversal of actuarial gains orlosses P=174,589 (P=176,630) (P=100,856)

Income Taxes - 138 -
*SGVFS162380*
The reconciliation of the statutory income tax rate and the effective income tax rate follows:
Group
2021 2020 2019
Statutory income tax rate 25.00% 30.00% 30.00%Adjustment for income subjected to
lower income tax rates (2.11) (3.04) (3.13)CREATE related adjustments 6.25
Tax effects of:FCDU income before tax (17.72) (15.04) (24.17)Non-taxable income (0.76) (17.04) (5.64)Non-deductible expenses 3.06 5.77 2.86Others 2.34 5.69 3.48
Effective income tax rate 16.06% 6.34% 3.40%
Parent Bank
2021 2020 2019
Statutory income tax rate 25.00% 30.00% 30.00%Adjustment for income subjected to
lower income tax rates (1.97) (2.94) (2.45)CREATE related adjustments 5.68
Tax effects of:FCDU income before tax (18.79) (16.38) (25.18)Non-taxable income (0.27) (18.56) (5.69)Non-deductible expenses 2.07 5.69 2.82Others (0.23) 2.80 (0.31)
Effective income tax rate 11.90% 0.61% (0.81%)
The components of the net deferred tax assets presented under Other resources (see Note 19) asof December 31, 2021, and 2020 follow:
Group
2021 2020
Deferred tax assets:Allowance for impairment P=3,154,151 P=3,128,789Net operating loss carry over (NOLCO) 1,031,132 1,285,608Accrued other expenses 844,124 883,613Excess MCIT 589,621 528,488Deferred service fees 313,598 411,482Unrealized foreign exchange loss 107,845 399,795Investment properties 312,034 319,366Others 860,670 990,050
7,213,175 7,947,191
Deferred tax liabilities:Unrealized foreign exchange gain 66,705 377,630Capitalized interest 21,965 27,456Others 77,900 88,525
166,570 493,611
Net deferred tax assets P=7,046,605 P=7,453,580

Income Taxes - 139 -
*SGVFS162380*
Parent Bank
2021 2020
Deferred tax assets:Allowance for credit losses P=2,359,049 P=2,542,622Net operating loss carry-over (NOLCO) 1,025,934 1,273,912Accrued other expenses 814,379 830,886Excess MCIT 588,491 514,383Unrealized foreign exchange loss 103,683 394,868
Investment properties 301,229 303,195Others 614,327 830,484
5,807,092 6,690,350
Deferred tax liabilities:Unrealized foreign exchange gain 66,705 377,630Capitalized interest 21,965 27,456Others 41,140 28,968
129,810 434,054
Net deferred tax assets P=5,677,282 P=6,256,296
Other deferred tax asset includes post-retirement obligation and other future deductible items.
The Parent Bank’s NOLCO follows:
Year incurred Amount Expired Balances Availment period
2018 P=644,228 P=644,228 P=− 2019-20212019 1,736,818 – 1,736,818 2020-20222020 2,211,455 – 2,211,455 2021-2025*2021 155,461 – 155,461 2022-2026*
P=4,747,962 P=644,228 P=4,103,734*The NOLCO can be carried over as a deduction from gross income for the next five consecutive taxable years from the year it was
incurred pursuant to Revenue Regulations No. 25-2020 (RR 25-2020), implementing Section 4(bbbb) of Republic Act No. 11494 or
the Bayanihan to Recover as One Act.
The Parent Bank’s MCIT:Year incurred Amount Expired Balances Availment period
2018 P=182,501 P=182,501 P=− 2019-20212019 221,523 – 221,523 2020-20222020 214,453 – 214,453 2021-20232021 152,515 – 152,515 2022-2024
P=770,992 P=182,501 P=588,491
The Parent Bank’s MCIT can be applied against regular corporate income tax liability for thenext three consecutive years after the MCIT was incurred.
Relevant Tax RegulationsCorporate Recovery and Tax Incentives for Enterprises (CREATE) Bill
As a result of the changes brought about by CREATE, applicable tax rates for future taxable anddeductible amounts for purposes of deferred tax measurement were reduced from 30% to 25%.

Income Taxes - 140 -
*SGVFS162380*
This resulted in a reduction in the provision for current income tax in 2021 by P=156.36 millionand by P=78.41 million for the Group and the Parent Bank, respectively, that is recognized in the2021 statement of income. In addition, as a result of the change in the tax rate, the deferred taxbalances have been remeasured from 30% to 25%, resulting in reduction in net deferred tax assetof P=1,156.01 million and P=948.86 million for the Group and the Parent Bank, respectively,increase in provision for deferred income tax by P=1,088.04 million and P=881.24 million for theGroup and the Parent Bank, respectively, in the 2021 statement of income, and decrease in othercomprehensive income by P=68.01 million and P=67.62 million for the Group and the Parent Bank,respectively, in the 2021 statement of comprehensive income.
The following are the relevant tax regulations affecting the Group:
Income Tax(a) MCIT, computed at 1% gross income from July 1, 2020 to June 30, 2023, net of allowable
deductions as defined under the tax regulations, or to RCIT of 25% effective July 1, 2020,whichever is higher;
(b) FCDU transactions with non-residents of the Philippines are tax-exempt, while interestincome on foreign currency loans from residents other than depository banks under theexpanded system is subject to 10% income tax;
(c) Withholding tax of 15% is imposed on interest earned under the expanded foreign currencydeposit system; and,
(d) NOLCO can be claimed as deductions against taxable income within three years afterNOLCO is incurred. The excess of the MCIT over income tax due may be carried over to thethree succeeding taxable years and credited against income tax due provided the Bank is inRCIT position. On September 30, 2020, the BIR issued Revenue Regulations No. 25-2020implementing Section 4(bbbb) of Bayanihan to Recover as One Act which states that theNOLCO incurred for taxable years 2020 and 2021 can be carried over and claimed as adeduction from gross income for the next five (5) consecutive taxable years immediatelyfollowing the year of such loss.
Gross Receipts Tax
Banks are subject to gross receipts tax under Sec. 121 of the National Internal Revenue Code asamended.
Documentary Stamp Tax
Documentary stamp taxes (DST) (at varying rates) are imposed on the following:(a) Bank checks, drafts, or certificate of deposit not bearing interest, and other instruments;(b) Bonds, loan agreements, promissory notes, bills of exchange, drafts, instruments and
securities issued by the Government of any of its instrumentalities, deposit substitute debtinstruments, certificates of deposits bearing interest and other not payable on sight ordemand;

Income Taxes and
Trust Operations - 141 -
*SGVFS162380*
(c) Acceptance of bills of exchange and letters of credit; and,(d) Bills of lading or receipt.
The significant provisions relating to DST under TRAIN are summarized below:(a) On every original issue of debt instruments, there shall be collected a DST of 1.50 on each
200 or fractional part thereof of the issue price of any such debt instrument; provided, that forsuch debt instruments with terms of less than one year, the DST to be collected shall be of aproportional amount in accordance with the ratio of its term in number of days to 365 days;provided further that only one DST shall be imposed on either loan agreement or promissorynotes to secure such loan.
(b) On all sales or transfer of shares or certificates of stock in any corporation, there shall becollected a DST of 1.50 on each 200, or fractional part thereof, of the par value of such stock.
(c) On all bills of exchange (between points within the Philippines) or drafts, there shall becollected a DST of 0.60 on each 200, or fractional part thereof, of the face value of any suchbill of exchange or draft.
(d) The following instruments, documents and papers shall be exempt from DST:
Borrowings and lending of securities executed under the Securities Borrowing andLending Program of a registered exchange, or in accordance with regulations prescribedby the appropriate regulatory authority;
Loan agreements or promissory notes, the aggregate of which does not exceed 250,000or any such amount as may be determined by the Secretary of Finance, executed by anindividual for his purchase on installment for his personal use;
Sale, barter or exchange of shares of stock listed and traded through the local stockexchange (as amended by RA No. 9648);
Fixed income and other securities traded in the secondary market or through anexchange;
Derivatives including repurchase agreements and reverse repurchase agreements;
Bank deposit accounts without a fixed term or maturity; and,
Interbank call loans with maturity of not more than seven days to cover deficiency inreserve against deposit liabilities.
Itemized DeductionIn 2021, 2020 and 2019, the Parent Bank opted to claim itemized deductions.
31. Trust Operations
The following securities and other properties held by the Parent Bank in fiduciary or agencycapacity (for a fee) for its customers are not included in the accompanying statement of financialposition since these are not properties of the Parent Bank.
2021 2020
Investments P=86,667,533 P=69,674,637Others 3,308,879 4,794,912
P=89,976,412 P=74,469,549

Trust Operations and
Related Party Transactions - 142 -
*SGVFS162380*
In compliance with the requirements of the General Banking Act relative to the Parent Bank’strust functions:
(a) Investment in government securities with a total face value of P=1,000,000 and P=800,000 as ofDecember 31, 2021 and 2020, respectively, are deposited with BSP as security for the ParentBank’s faithful compliance with its fiduciary obligations (see Note 12); and,
(b) Ten percent of the Parent Bank’s trust income is transferred to Surplus reserves. This yearlytransfer is required until the surplus reserves for trust function is equivalent to 20% of theParent Bank’s authorized capital stock. No part of such reserves shall at anytime be paid outas dividends, but losses accruing in the course of business may be charged against suchsurplus. As of December 31, 2021 and 2020, the reserve for trust functions amounted toP=304,961 and P=280,961, respectively, and is included as part of Surplus reserves in thestatements of financial position (see Note 25).
Income from trust operations of the Group and the Parent Bank amounted to P=239,994,P=171,271, and P=160,929 in 2021, 2020 and 2019, respectively. These are shown as Income fromtrust operations account under Miscellaneous income in the statements of income (see Note 28).
32. Related Party Transactions
The Group’s and Parent Bank’s related parties include subsidiaries, stockholders, keymanagement personnel and others as described below.
The summary of the Group’s significant transactions with its related parties as of and for theyears ended December 31, 2021 and 2020 are as follows:
2021 2020
Related Party Category
Amount
of Transaction
Outstanding
Balance
Amount
of Transaction
Outstanding
Balance Terms and Conditions/Nature
Applicable to the Parent Bank
Subsidiaries
Lease of properties:
Lease income P=34,069 P=− P=30,017 P=− Lease renewed every 5 yearswith 5% escalation rateRefundable deposits 1,959 1,959 4,853 4,853
Management services 51,660 − 19,027 −
Project management fee,
management services,commission and servicecharges paid to/by subsidiaries
Deposit liabilities:
Outstanding balance − 3,202,201 − 1,422,254
With interest rate based onaverage daily bank deposit rate.
Net movements 1,779,947 − 227,099 −
Interest expense on deposits 2,530 − 5,025 −
Interbank borrowing
Net movements − − 55,000,000 − Short term borrowing withannual fixed rate ranging from
3.34% to 3.78% in 2020.Interest expense − − 8,529 −
(Forward)

Related Party Transactions - 143 -
*SGVFS162380*
2021 2020
Related Party CategoryAmount
of Transaction
Outstanding
Balance
Amountof Transaction
OutstandingBalance Terms and Conditions/Nature
Advances:
Outstanding balance P=− P=71,201 P=− P=16,295Various expenses advanced bythe Bank
Net movements 54,906 − (32,880) −
Other liabilities − 38,411 − 11,757
Various expenses and variablefee for credit card related
services and security depositspaid
Applicable to the Group and the
Parent Bank
Stockholders and related parties
under common ownership
Deposit liabilities:Outstanding balance − 25,459,765 − 6,286,620 With interest rate based on
average daily bank deposit rateNet movements 19,173,145 − 170,187 −Interest expense on deposits 12,714 − 68,676 −
Bills payable:
Outstanding balance − 13,916 − 13,897 Long term liability with annualfixed rate of 4%Net movements 19 − (1,063,180) −
Interest expense 64,428 − 150,539 −
Income from bancassurancebusiness:
Commission income 230,570 − 148,338 −
Income recognized on sale ofinsurance policies inaccordance with the
bancassurance agreement
Unearned income − 733,333 − 733,333
Unearned income fromExclusive Access Fees arising
from the bancassuranceagreement
Loans receivable 9,738 9,738 11,016 11,016
Secured borrowings with
annual interest rate of 8.0% and12% in 2021 and 9.0% in 2020
Key management personnel 2,460,301 − 2,213,938 −Employee benefits related to
key management personnel.Directors, officers and other
related interests:
Loans 535,780 535,780 538,888 538,888
Employee fringe benefit loanswith annual fixed interest ratefrom 0.00% to 8.0% in 2021
and 0.00% to 6.01% in 2020
Accounts receivable 144,509 144,509 121,730 121,730Fringe benefits related toemployee cars and laptop lease.
Others − − 10,514 − Standby LCs
Outstanding receivables from and payables to related parties, if any, arising from lease ofproperties, management services and advances are unsecured, noninterest-bearing and generallysettled in cash within 12 months or upon demand.

Related Party Transactions - 144 -
*SGVFS162380*
Lease of PropertiesIn February 2014, the Parent Bank entered into a lease agreement with UIC, whereby the latter,as a lessee, leases one of the Parent Bank’s investment properties for a period of five years. InOctober 2019, the lease agreement was amended to reduce the area of UIC’s leased premisesupon the renewal of the lease agreement. UIC pays the Parent Bank a monthly rent of P=109 with5% annual escalation rate, exclusive of VAT.
CSB leases certain investment properties with the Parent Bank with lease term covering fiveyears. CSB pays the Parent Bank a fixed monthly rent for its leases with 5% annual escalationrate. In May 2020, CSB renewed one of its lease agreements for another five years.
In June 2019, the Parent Bank entered into a lease agreement with UBX for a period of fiveyears. UBX pays the Parent Bank a fixed monthly rent with 5% annual escalation rate.
Management ServicesThe Parent Bank entered into a sales management agreement with FUDC whereby the latter sellsUnionBank Visa Credit Cards through its direct selling network. In July 2019, the agreementwas amended to pay a fixed monthly service fee of P=5.6 million plus fixed commission perapproved principal credit card (net of applicable taxes and service charges).
In September 2020, the terms of the service agreement were amended to expand the scope ofwork and services to be provided by FUDC. This also amended the terms to set a fixed monthlyservice fee of P=1.1 million, variable fees per sales officer and fixed commission per approvedcard (net of all applicable taxes).
On May 10, 2021, the Parent Bank and FUDC agreed to terminate the service agreementeffective April 1, 2021.
Deposit Liabilities and Interest ExpenseThe deposit accounts of subsidiaries and stockholders with the Parent Bank generally earninterest based on daily bank deposit rates.
AdvancesThe Parent Bank also has advances to CSB, FUDC, FUIFAI, Union Digital and UBX as ofDecember 31, 2021 and 2020. These are generally settled in cash upon demand.
Bills Payable and Interest ExpenseIn 2020, CSB availed of a loan with Aboitiz Foundation, Inc., amounting to P=14 million which ispayable in five years and bears an annual interest rate of 4.0%. This borrowing had anoutstanding balance of P=13.92 million and P=13.90 million (net of unamortized debt issue costs)as of December 31, 2021 and 2020, respectively.
In 2021 and 2020, CSB availed of short-term borrowings from AEVI, Aboitiz PowerCorporation, and Aboitiz and Co., Inc., related parties under common ownership, amounting toP=3.35 billion, P=31.87 billion, and P=12.64 billion, respectively, and P=5.73 billion, P=13.44 billionand P=12.26 billion, respectively. Availments have been paid in full as of end of the reportingperiod.
Bancassurance AgreementOn January 27, 2017, the Parent Bank and its subsidiary, CSB, entered into a bancassurancepartnership (the Agreement) with Insular Life Assurance Company, Ltd. (Insular Life). Underthe Agreement, Insular Life paid the Parent Bank an amount representing Exclusive Access Fee

Related Party Transactions - 145 -
*SGVFS162380*
(EAF) with a term of 15 years. In the event that the cumulative annualized premium earned(APE) sold during the first five year period is less than the agreed minimum amount, the ParentBank shall refund the proportion of EAF that equals the proportion by which the cumulative APEis less the minimum amount. EAF recognized for 2018 is presented as Income frombancassurance business under Miscellaneous Income account in the statements of income.Unearned income arising from this transaction is presented as part of Miscellaneous under Otherliabilities account in the statements of financial position (see Note 24).
Under the distribution agreement, Insular Life will have exclusive access to the branch networkof the Parent Bank and CSB. Additionally, the Parent Bank’s sales force, composed ofrelationship managers and financial advisors, shall be trained and licensed to sell life insuranceproducts. Under the same Agreement, the Parent Bank shall earn commissions on all insurancepolicies sold by the Parent Bank. Commissions earned for the years ended December 31, 2021and 2020 are presented as part of Others under Service charges, fees and commissions account inthe statements of income (see Note 27).
Key Management Personnel CompensationThe compensation of key management personnel for the Group and Parent Bank follows:
Group
2021 2020 2019
Short-term benefits P=2,298,705 P=2,097,510 P=1,729,322Post-employment benefits 91,915 103,265 70,011Other long-term benefits 69,681 13,163 27,233
P=2,460,301 P=2,213,938 P=1,826,566
Parent Bank
2021 2020 2019
Short-term benefits P=1,885,566 P=1,783,964 P=1,466,293Post-employment benefits 74,477 87,882 58,879Other long-term benefits 63,703 7,786 21,306
P=2,023,746 P=1,879,632 P=1,546,478
Directors’ fees incurred by the Group amounted to P=141,415, P=91,830 and P=80,948 in 2021,2020 and 2019, respectively, and by the Parent Bank amounted to P=118,039, P=80,010 andP=69,274 in 2021, 2020 and 2019, respectively, and are included as part of Salaries and employeebenefits account in the statements of income.
Loans and Other TransactionsIn the ordinary course of business, the Group has loans, deposits and other transactions with itsrelated parties and with certain DOSRI. Under the Group’s existing policies, these transactionsare made substantially on the same terms and conditions as transactions with other individualsand businesses of comparable risks. The amount of individual loans to DOSRI, of which 70%must be secured, should not exceed the amount of the deposit and book value of their investmentin the Group. In the aggregate, loans to DOSRI generally should not exceed the total equity or15% of the total loan portfolio of the Group, whichever is lower.

Related Party Transactions - 146 -
*SGVFS162380*
The following additional information is presented relative to DOSRI loans:
Group Parent Bank
2021 2020 2021 2020
Total DOSRI loans P=545,518 P=549,904 P=507,225 P=430,097Unsecured DOSRI loans 247,341 201,038 223,880 106,837% of DOSRI loans to total loan portfolio 0.16% 0.17% 0.18% 0.16%% of unsecured DOSRI loans
to total DOSRI loans –% –% –% –%% of past due DOSRI loans
to total DOSRI loans –% –% –% –%% of non-accruing DOSRI accounts to total
DOSRI loans –% –% –% –%
The total unsecured DOSRI loans above represent fringe benefits that are excluded indetermining the compliance with the individual ceiling under subsection X330.1 of the MORB.Accordingly, the percentage of unsecured DOSRI loans to total DOSRI loans as presented aboveis nil.
On January 31, 2007, BSP issued Circular No. 560 which provides the rules and regulations thatgovern loans, other credit accommodations and guarantees granted to subsidiaries and affiliatesof banks and quasi-banks. Under the said circular, the total outstanding exposures to each of theParent Bank’s subsidiaries and affiliates shall not exceed 10% of bank’s net worth, the unsecuredportion of which shall not exceed 5% of such net worth. Further, the total outstanding exposuresto subsidiaries and affiliates shall not exceed 20% of the net worth of the lending bank.
Transactions with the Retirement PlanThe retirement fund of the Group covered under defined benefit post-employment planmaintained for qualified employees is administered by the Retirement Committee. The membersof the Retirement Committee are Senior Executives and officers of the Parent Bank as approvedby the Chairman/Chief Executive Officer. Through its Retirement Committee, it has appointedTISG as one of its trustees for the retirement fund which is covered by trust agreements.
The composition of the retirement plan assets in the actuarial valuation reports of the Parent Bankand its subsidiaries as of December 31, 2021 and 2020 are disclosed in Note 29. As ofDecember 31, 2021 and 2020, total assets of the retirement plan managed by the TISG of theParent Bank as contained in the actuarial valuation reports amounted to P=4.16 billion andP=3.95 billion, respectively.
As of December 31, 2021 and 2020, the carrying value of the fund is equivalent to its fair value.

Related Party Transactions and
Earnings Per Share - 147 -
*SGVFS162380*
The Parent Bank and its subsidiaries’ retirement plans have transactions directly and indirectlywith the Parent Bank as of December 31, 2021 and 2020 as follows:
2021 2020
Amount
of Transaction
Outstanding
Balance
Amountof Transaction
OutstandingBalance
Investment in Parent Bank shares P=90,904 P=277,114 P=31,985 P=186,210Investments in Parent Bank notes payable:
Outstanding balance − 479,891 − 444,099Net movements 35,792 − 245,099 −Interest income 23,393 − 37,007 −Accrued interest income − 2,232 − 3,987
Deposit liabilities:Outstanding balance − 394,281 − 353,597Net movements 40,684 − 11,188 −Interest income on deposits 12,427 − 13,676 −
Dividend income 9,064 − 9,064 −
The investment in Parent Bank shares are primarily held for re-sale and the Group’s retirementfund does not intend to exercise its voting rights over those shares. The terms of the investmentin notes payable are discussed in Note 23.
Group Health Insurance from a Related PartyThe Parent Bank entered into a contract with Insular Life for its group health insurance. Thegroup health insurance package covering January 2021 to December 2021 amounted toP=122,774 and the group health insurance package from October 2019 to December 2020amounted to P=123,190.
Receivable from Kingswood ProjectUIC acts as the project and fund manager of Kingswood Project. As fund manager, UIC isresponsible for the treasury and money management as well as arranging the necessary facilitiesand accounting for the development of the project. UIC also receives a certain percentage of thesales price related to Kingswood Project as sales commission and to compensate for themarketing expenses incurred. As of December 31, 2021 and 2020, the receivable of UIC fromKingswood Project amounted to P=29.30 million and P=31.45 million, respectively.
33. Earnings Per Share
In 2021, 2020 and 2019, the Group and the Parent Bank have no outstanding potentially dilutivesecurities, hence, basic earnings per share are equal to diluted earnings per share.
As a result of the stock dividends declared by the Parent Bank on August 11, 2021 tostockholders of record as of December 9, 2021 and paid on January 5, 2022 (see Notes 25 and36), the weighted average number of outstanding common shares have been adjustedretrospectively. As required under PFRS, the Bank is required to adjust the weighted averagenumber of shares for purposes of computing the basic earnings per share for all periods presentedwhen there are stock dividends are issued after reporting period but before the financialstatements have been authorized for issue.

Earnings per Share and
Commitments and Contingent Liabilities - 148 -
*SGVFS162380*
The basic and diluted earnings per share were computed as follows:
Group
2021 2020 2019
Net profit attributable to ParentBank’s stockholders P=12,525,376 P=11,553,430 P=14,026,128
Divided by: Weighted average number of
outstanding common shares 1,219,289 1,218,400 1,217,605 Adjustment related to stock
dividend 304,839 304,839 304,839
Weighted average number ofoutstanding common shares,after adjustment for stockdividends 1,524,128 1,523,239 1,522,444
Basic and diluted earningsper share P=8.22 P=7.58 P=9.21
Parent Bank
2021 2020 2019
Net profit P=12,525,376 P=11,263,423 P=14,026,119
Divided by: Weighted average number of
outstanding common shares 1,219,289 1,218,400 1,217,605 Adjustment related to stock
dividend 304,839 304,839 304,839
Weighted average number ofoutstanding common shares,after adjustment for stockdividends 1,524,128 1,523,239 1,522,444
Basic and diluted earningsper share P=8.22 P=7.39 P=9.21
34. Commitments and Contingent Liabilities
LeasesGroup as Lessee
The Group leases various branch premises for an average period of seven years. The leasecontracts are cancellable upon mutual agreement of the parties or renewable at the Parent Bank’soption under certain terms and conditions. Various lease contracts include escalation clauses,most of which bear an annual rent increase of 5%. Some leases include a clause to enableadjustment of the rental charge on an annual basis based on prevailing market rates. As ofDecember 31, 2021 and 2020, the Parent Bank has neither a contingent rent payable nor an assetrestoration obligation in relation with these lease agreements.

Commitments and Contingent Liabilities - 149 -
*SGVFS162380*
Shown below is the maturity analysis of the undiscounted lease payments as of December 31,2021 and 2020 as required by PFRS 16:
Group Parent Bank
2021 2020 2021 2020
1 year or less P=544,131 P=515,081 P=422,382 P=413,646more than 1 years to 2 years 432,768 385,692 335,421 320,727more than 2 years to 3 years 280,220 270,194 214,405 238,370more than 3 years to 4 years 81,764 136,626 49,877 126,699more than 5 years 33,895 54,139 324 30,461
The following are the amounts recognized in profit or loss for the years ended December 31,2021 and 2020:
Group Parent Bank
2021 2020 2021 2020
Amortization expense of ROU assets(Note 16) P=597,637 P=521,521 P=410,595 P=438,311
Interest expense on lease liabilities(Note 24) 68,753 80,251 54,763 67,705
Expenses relating to short term – leases 130,223 231,821 152,513 133,720
Total amount recognized in profit or loss P=796,613 P=833,593 P=617,871 P=639,736
Group as LessorThe Group has entered into commercial property leases on the Group’s surplus offices. Thesenon-cancellable leases have remaining non-cancellable lease terms of one to four years.
Total rent income earned included under Miscellaneous income account in the statements ofincome (see Note 28) by the Group and the Parent Bank for the years ended December 31, 2021,2020 and 2019 are as follows:
2021 2020 2019
Group P=116,450 P=154,077 P=163,730Parent Bank 132,734 164,177 165,523
The estimated minimum future annual rentals receivable under non-cancellable operating leasesfollows:
Group
2021 2020
Within one year P=121,058 P=97,880Beyond one year but within five years 242,240 145,439
P=363,298 P=243,319
Parent Bank
2021 2020
Within one year P=107,316 P=92,196Beyond one year but within five years 229,575 134,932
P=336,891 P=227,128

Commitments and Contingent Liabilities and
Notes to the Statements of Cash Flows - 150 -
*SGVFS162380*
OthersIn the normal course of the Group’s operations, there are various outstanding commitments andcontingent liabilities such as guarantees, commitments to extend credit, which are not reflected inthe accompanying financial statements. The Group recognizes in its books any losses andliabilities incurred in the course of its operations as soon as these become determinable andquantifiable. Management believes that, as of December 31, 2021, no additional material lossesor liabilities are required to be recognized in the accompanying financial statements as a result ofthe above commitments and transactions.
There are several suits, assessments or notices and claims that remain unsettled. Managementbelieves, based on the opinion of its legal counsels, that the ultimate outcome of such suits,assessments and claims will not have a material effect on the Group’s and the Parent Bank’sfinancial position and results of operations.
35. Notes to the Statements of Cash Flows
Presented below is the supplemental information on the Group’s and the Parent Bank’s liabilitiesarising from financing activities:
Group
LTNCD Bills Payable
Notes and Bonds
Payable
Lease
Liabilities* Total
Balances at January 1, 2021 P=3,000,000 P=54,223,543 P=59,853,656 P=1,219,584 P=118,296,783
Cash flows from financing activities: Additions − 127,075,530 11,057,895 673,608 138,807,033
Repayment of borrowings − (131,247,110) (3,473,520) (579,065) (135,299,695)
Non-cash financing activities: Effects of foreign exchange rate
changes − 1,116,175 2,403,418 − 3,519,593
Amortization of debt issue costs and accretion of interest − 12,537 68,753 81,290
Balances as of December 31, 2021 P=3,000,000 P=51,168,138 P=69,853,986 P=1,382,880 P=125,405,004
*additions to lease liabilities arising from initial recognition of ROU assets are considered non-cash financingactivities
Group
LTNCD Bills PayableNotes and Bonds
PayableLease
Liabilities Total
Balances at January 1, 2020 P=3,000,000 P=105,087,722 P=49,331,506 P=1,337,296 P=158,756,524Cash flows from financing activities: Additions − 558,732,399 33,135,900 392,602 592,260,901
Repayment of borrowings − (609,512,421) (21,171,857) (613,498) (631,297,776)Effect of business combination − − − 22,933 22,933
Non-cash financing activities:
Effects of foreign exchange ratechanges − (84,157) (1,360,890) − (1,445,047)
Amortization of debt issue costs
and accretion of interest − − (81,003) 80,251 (752)
Balances as of December 31, 2020 P=3,000,000 P=54,223,543 P=59,853,656 P=1,219,584 P=118,296,783

Notes to the Statements of Cash Flows and
Events After the End of the Reporting Period - 151 -
*SGVFS162380*
Parent Bank
LTNCD Bills Payable
Notes and Bonds
Payable
Lease
Liabilities Total
Balances at January 1, 2021 P=3,000,000 P=34,502,422 P=59,746,856 P=1,004,057 P=98,253,335
Cash flows from financing activities:Additions − 62,765,158 7,650,000 431,142 70,846,300
Repayment of borrowings − (69,805,980) − (446,112) (70,252,092)
Non-cash financing activities: Effects of foreign exchange rate
changes − 1,116,174 2,380,651 − 3,496,825
Amortization of debt issue costsand accretion of interest − − 12,329 54,763 67,092
Balances as of December 31, 2021 P=3,000,000 P=28,577,774 P=69,789,836 P=1,043,850 P=102,411,460
Parent Bank
LTNCD Bills Payable
Notes and Bonds
Payable
Lease
Liabilities Total
Balances at January 1, 2020 P=3,000,000 P=92,149,256 P=49,182,061 P=1,064,941 P=145,396,258Cash flows from financing activities:
Additions − 507,779,097 30,206,900 348,608 538,334,605Repayment of borrowings − (565,341,774) (18,200,000) (477,197) (584,018,971)
Non-cash financing activities:
Effects of foreign exchange ratechanges − (84,157) (1,360,890) − (1,445,047)
Amortization of debt issue costs
and accretion of interest − − (81,215) 67,705 (13,510)
Balances as of December 31, 2020 P=3,000,000 P=34,502,422 P=59,746,856 P=1,004,057 P=98,253,335
Non-cash investing activities of the Group for the years ended December 31, 2021 and 2020include additions to investment properties in settlement of loans and receivables amounting toP=245.00 million and P=201.25 million, respectively, acquisition by the Group of investment inFintech Platform Ventures, Inc., and associate, through an assignment of receivable from sale ofinvestment in CC Mobile Financial Services Philippines, Inc., also an associate, with a carryingvalue of P=47 million and disposals of properties with carrying values of P=87.63 million andP=167.73 million, respectively, through sales contract receivables.
36. Events After the End of the Reporting Period
Acquisition of Citigroup Inc.’s Consumer Banking Business in the PhilippinesIn a special meeting held on December 23, 2021, the Bank’s BOD approved the acquisition ofCitigroup Inc.’s consumer banking business in the Philippines. The transaction includes theacquisition of Citigroup’s credit card, personal loans, wealth management, and retail depositbusinesses, as well as the real estate interests in Citibank Square in Eastwood, 3 full-service bankbranches, and 5 wealth centers in the Philippines.
To fund the acquisition, the BOD approved the raising of additional capital of up to P=40.0 billionthrough the issuance of additional shares from the Bank’s unissued authorized capital stock via astock rights offering (SRO) to all existing shareholders. The acquisition is conditional upon theregulatory approvals from the BSP, Philippine Competition Commission, Philippine DepositInsurance Corporation, SEC, and Insurance Commission.

Events After the End of the Reporting Period and
Supplementary Information Required Under Revenue Regulations 15-2010 - 152 -
*SGVFS162380*
Stock Dividends DistributionOn January 5, 2022, the Bank issued 304,838,842 common shares at par value of P=10 for wholeshares and paid P=0.14 million for 1,862.50 fractional shares in relation to the 25% stockdividends approved by the Bank’s BOD and stockholders on June 25, 2021 and August 11, 2021,respectively.
Dividend DeclarationOn January 28, 2022, the Parent Bank’s BOD approved the declaration of cash dividends atP=2.80 per share or a total of P=4,269,771 based on the outstanding common stock of1,524,918,059 shares as of January 28, 2022. Record date for stockholders entitled to the cashdividend is February 14, 2022 and payment is expected to be made on March 2, 2022.
Employee Stock PlanThe Parent Bank issued 199,964 and 516,435 common shares to qualified employees under theParent Bank’s Employee Stock Plan on January 28, 2022 and February 4, 2022, respectively.
37. Supplementary Information Required Under Revenue Regulations 15-2010
Presented below is the supplementary information required by the Bureau of Internal Revenue(BIR) under RR 15-2010 to be disclosed as part of the notes to financial statements. Thissupplementary information is not a required disclosure under PFRS.
Gross Receipts TaxIn lieu of the value-added tax (VAT), the Parent Bank is subject to the GRT imposed on all banksand non-bank financial intermediaries pursuant to Section 121 of the Tax Code.
The Parent Bank reported total GRT amounting to P=1.09 billion in 2021 as shown under Taxesand Licenses account. Total GRT payable as of December 31, 2021 amounted to P=0.30 billionand is included as part of Accrued taxes and other expenses under Other liabilities account in the2021 statement of financial position.
Documentary Stamp TaxThe Bank is enrolled under the Electronic DST System. In general, the Parent Bank’s DSTtransactions arise from the execution of debt instruments, security documents, and bills ofexchange.
For the year ended December 31, 2021, DST affixed amounted to P=1.83 billion.
Withholding TaxesThe details of total withholding taxes for the year ended December 31, 2021 are shown below:
Final P=496,433Expanded 236,942
Compensation and benefits 977,844
P=1,711,219

Supplementary Information Required Under Revenue Regulations 15-2010 - 153 -
*SGVFS162380*
Taxes and LicensesThe details of taxes and licenses in 2021 of the Parent Bank are as follows:
GRT P=1,086,124DST 757,790Real property tax 36,370Fringe benefit tax (FBT) 42,511Local and business permits 39,939Miscellaneous 8,979Less:
FBT charged to employee benefits 42,511
P=1,929,202
Excise TaxesThe Parent Bank does not have excise taxes accrued since it did not have any transactions subjectto excise tax.
Claim for RefundOn August 5, 2013, the CTA granted the Bank's claim for refund amounting to P=90,923 arisingfrom the BIR's denial of the Bank's applications for administrative abatement in 2007. The CTAen banc affirmed this decision in 2014.
In July 2018, the Supreme Court affirmed the CTA decision granting the Bank’s claim forrefund. The BIR's Motion for Reconsideration of the Supreme Court’s Resolution was denied onSeptember 4, 2019.
In September 2020, the CTA granted the Bank's Motion for Issuance of Writ of Execution. TheBank filed with the BIR a claim for refund to execute the judgment in its favor.
Other Required Tax InformationThe Parent Bank has not paid or accrued any excise taxes or customs’ duties and tariff fees as ithad no importation for the year ended December 31, 2021.
The Parent Bank has no pending tax assessment and case in courts or other regulatory bodiesoutside of the BIR as at and for the year ended December 31, 2021.

Supplementary Information Required Under BSP Circular 1074 - 154 -
*SGVFS162380*
38. Supplementary Information Required Under BSP Circular 1074
Presented below is the supplementary information required by the BSP under BSP Circular 1074.
Basic quantitative indicators of financial performance
Group 2021 2020 2019
Return on average capital funds:
Net profit11.6% 11.5% 15.3%
Average total capital funds*
Return on average resources:
Net profit 1.6% 1.5% 1.9%
Average total resources*
Net interest margin:
Net interest income 4.6% 4.5% 3.6%
Average interest-earning resources*
Liquidity ratio:
Current Assets53.9% 56.3% 56.4%
Current Liabilities
Debt-to-equity ratio:
Liabilities 6.4:1 6.4:1 6.9:1
Equity
Asset-to-equity ratio:
Asset 7.4:1 7.4:1 7.9:1
Equity
Interest rate coverage ratio:
Earnings before interestsand taxes 3.3:1 2.2:1 1.9:1
Interest expense*Average amount is calculated based on current year-end and previous year-end balances

Supplementary Information Required Under BSP Circular 1074 - 155 -
*SGVFS162380*
Parent Bank 2021 2020 2019
Return on average capital funds:
Net profit 11.6% 11.1% 15.3%
Average total capital funds*
Return on average resources:
Net profit 1.6% 1.6% 2.2%
Average total resources*
Net interest margin:
Net interest income 3.9% 4.0% 3.1%
Average interest-earning resources*
Liquidity ratio:
Current Assets 50.6% 55.4% 53.9%
Current Liabilities
Debt-to-equity ratio:
Liabilities 5.5:1 5.6:1 6.2:1
Equity
Asset-to-equity ratio:
Asset 6.5:1 6.6:1 7.2:1
Equity
Interest rate coverage ratio:
Earnings before interestsand taxes 4.3:1 2.5:1 2.1:1
Interest expense*Average amount is calculated based on current year-end and previous year-end balances
Capital instruments issuedThe Parent Bank’s capital instruments consist of the following:
Capital stock
As of December 31, 2021 and 2020, the Parent Bank has outstanding capital stock shown below(peso amounts in thousands):
Shares Amounts
2021 2020 2021 2020
Common – P=10 par valueAuthorized 2,530,785,238 1,311,422,420 P=25,307,852 P=13,114,224Issued and outstanding 1,219,362,818 1,218,471,467 12,193,628 12,184,715
Preferred – P=100 par value, non-voting Authorized 100,000,000 100,000,000 P=10,000,000 P=10,000,000
Issued and outstanding – – – –

Supplementary Information Required Under BSP Circular 1074 - 156 -
*SGVFS162380*
Unsecured Subordinated Tier 2 Notes Due 2030 Callable in 2025
The Basel III-compliant Unsecured Subordinated Tier 2 Notes were issued by the Parent Bankunder its BSP-approved issuance of ₱20.0 Billion Unsecured Subordinated Notes Qualifying asTier 2 Capital.
Unless the Notes are previously redeemed, the Initial Interest Rate will be reset at the equivalentof the Initial Spread per annum plus the Benchmark as of Reset Date as defined in the Termsand Conditions of the Notes. Subject to certain conditions, the BSP Guidelines, and the Termsand Conditions, the Parent Bank may redeem the Notes in whole and not only in part on theRedemption Option Date at 100% of the face value of the Notes, plus accrued and unpaidinterest as of but excluding the Redemption Option Date.
The Notes have a loss absorption feature which means the Notes are subject to a Non-ViabilityWrite-Down in case of a Non- Viability Trigger Event. A Non-Viability Trigger Event isdeemed to have occurred when the Issuer is considered non-viable as determined by the BSP.
The Tier II Notes constitute a direct, unconditional, fixed, unsecured and subordinatedobligation of the Bank. Claims in respect of the Tier II Notes will rank: (a) junior to the claimsof holders of all deposits and general creditors of the Bank; (b) pari passu with obligations ofthe Bank that are, expressly or by applicable laws, subordinated so as to rank pari passu withclaims in respect of securities constituting “Tier 2” capital of the Bank; and (c) senior to (i) theclaims for payment of any obligation that, expressly or by applicable law, is subordinated to theTier II Notes, (ii) the claims in respect of securities constituting “Tier 1” capital of the Bank,and (iii) the rights and claims of holders of equity shares of the Bank.
Unsecured Subordinated Tier 2 Notes Due 2025 Callable in 2020
The P=7.2 Billion Unsecured Subordinated Tier 2 Notes were issued with a loss absorptionfeature, which means the Notes were subject to a non-viability write-down in case of a non-viability trigger event.
The Notes constitute direct, unconditional, unsecured and subordinated obligations of the ParentBank and shall at all times rank pari passu and without any preference among themselves.
On February 20, 2020, the Parent Bank exercised its Voluntary Redemption Option to earlyredeem the Notes in accordance with its Terms and Conditions.

Supplementary Information Required Under BSP Circular 1074 - 157 -
*SGVFS162380*
Concentration of credit exposuresAn analysis of concentrations of credit risk for loans and other receivables and investmentsecurities (grossed up for any allowance for credit losses and unearned discounts) of the Groupand the Parent Bank by industry and by geographic location as of December 31, 2021 and 2020 isshown below (amounts in thousands):
Group
2021
Loans and Other Receivables
Trading and
Investment
Amount % Securities Total
Concentration by industry
Real estate activities P=71,096,154 19.11 P=7,938,117 P=79,034,271
Information and communication 39,474,234 10.61 – 39,474,234
Wholesale and retail trade, repair ofmotor vehicles 31,380,275 8.44 – 31,380,275
Financial and insurance activities 31,360,342 8.43 369,049,548 400,409,890
Manufacturing 27,322,891 7.34 2,531,824 29,854,715
Transportation and storage 18,861,331 5.07 2,204,090 21,065,421
Arts, entertainment and recreation 14,639,649 3.94 – 14,639,649
Electricity, gas steam and air conditioning supply 13,690,875 3.68 25,214,821 38,905,696
Other service activities 7,918,474 2.13 7,918,474
Construction 4,337,687 1.17 – 4,337,687
Activities of households as employers andundifferentiated goods and services 2,384,261 0.64 – 2,384,261
Agriculture, forestry and fishing 1,679,982 0.45 – 1,679,982
Accommodation and food service activities 1,455,059 0.39 – 1,455,059
Professional, scientific and technical activities 702,425 0.19 – 702,425
Others 105,701,512 28.41 3,360,048 109,061,560
P=372,005,151 100.00 P=410,298,448 P=782,303,599
Concentration by location
Philippines P=372,005,151 100.00 P=298,874,158 P=670,879,309
Others - Asia – – 29,545,178 29,545,178
South America – – 5,622,054 5,622,054
North America – – 9,725,349 9,725,349
United States – – 54,686,572 54,686,572
Europe – – 11,845,137 11,845,137
P=372,005,151 100.00 P=410,298,448 P=782,303,599
Group
2020
Loans and Other ReceivablesTrading andInvestment
Amount % Securities Total
Concentration by industry
Real estate activities P=73,062,424 20.72 P=7,554,184 P=80,616,608Financial and insurance activities 58,326,035 16.54 320,993,329 379,319,364Information and communication 38,844,291 11.02 – 38,844,291Wholesale and retail trade, repair of
motor vehicles 26,265,571 7.45 – P=26,265,571Electricity, gas steam and air conditioning supply 18,299,725 5.19 28,535,139 46,834,864Manufacturing 11,720,242 3.32 – 11,720,242Accommodation and food service activities 1,663,091 0.47 – 1,663,091Transportation and storage 11,891,455 3.37 745,580 12,637,035Activities of households as employers and
undifferentiated goods and services2,950,691 0.84 – 2,950,691
Construction 10,158,902 2.88 – 10,158,902Other service activities 7,986,955 2.27 – 7,986,955Agriculture, forestry and fishing 2,553,855 0.72 – 2,553,855Professional, scientific and technical activities 538,980 0.15 – 538,980Arts, entertainment and recreation 12,730,967 3.61 – 12,730,967
Others 75,590,735 21.44 4,653,837 80,244,572
P=352,583,919 100.00 P=362,482,069 P=715,065,988

Supplementary Information Required Under BSP Circular 1074 - 158 -
*SGVFS162380*
Group
2020
Loans and Other ReceivablesTrading andInvestment
Amount % Securities Total
Concentration by location
Philippines P=351,318,265 99.67 P=217,694,681 P=569,012,946
Others - Asia 703,182 0.20 51,574,765 52,277,947
South America 213,281 0.07 13,900,473 14,113,754
North America 275,925 0.05 7,890,150 8,166,075
United States 43,041 0.01 67,977,986 68,021,027
Europe 30,225 – 3,444,014 3,474,239
P=352,583,919 100.00 P=362,482,069 P=715,065,988
Parent Bank
2021
Trading and
Loans and Other Receivables Investment
Amount % Securities Total
Concentration by industry
Real estate activities P=70,604,445 23.63 P=7,938,117 P=78,542,562
Information and communication 39,469,530 13.21 – 39,469,530
Financial and insurance activities 31,284,376 10.47 325,797,652 357,082,028
Wholesale and retail trade, repair ofmotor vehicles 30,431,511 10.19 – 30,431,511
Manufacturing 27,198,763 9.10 2,531,824 29,730,587
Transportation and storage 18,718,271 6.27 2,204,090 20,922,361
Arts, entertainment and recreation 14,638,343 4.90 – 14,638,343
Electricity, gas steam and air conditioningsupply 13,690,729 4.58 25,214,821 38,905,550
Other service activities 7,730,986 2.59 7,730,986
Construction 4,251,467 1.42 – 4,251,467
Activities of households as employers andundifferentiated goods and services 2,325,684 0.78 – 2,325,684
Accommodation and food service activities 1,285,301 0.43 – 1,285,301
Professional, scientific and technical activities 700,048 0.23 – 700,048
Agriculture, forestry and fishing 372,018 0.12 – 372,018
Others 36,069,083 12.08 3,246,816 39,315,899
P=298,770,555 100.00 P=366,933,320 P=665,703,875
Concentration by location
Philippines P=298,770,555 100.00 P=255,509,030 P=554,279,585
Others - Asia – – 29,545,178 29,545,178
South America – – 5,622,054 5,622,054
North America – – 9,725,349 9,725,349
United States – – 54,686,572 54,686,572
Europe – – 11,845,137 11,845,137
P=298,770,555 100.00 P=366,933,320 P=665,703,875
Parent Bank
2020
Trading andLoans and Other Receivables Investment
Amount % Securities Total
Concentration by industry
Real estate activities P=72,713,675 25.77 P=7,554,184 P=80,267,859
Financial and insurance activities 45,862,261 16.25 293,363,719 339,225,980Information and communication 38,840,892 13.76 – 38,840,892
Wholesale and retail trade, repair ofmotor vehicles
25,325,189 8.97 – 25,325,189
Electricity, gas steam and air conditioning supply 18,298,033 6.48 28,535,139 46,833,172Manufacturing 11,601,427 4.11 – 11,601,427
Accommodation and food service activities 1,527,243 0.54 – 1,527,243Transportation and storage 11,698,372 4.15 745,580 12,443,952
Activities of households as employers andundifferentiated goods and services
2,871,791 1.02 – 2,871,791
Construction 10,082,353 3.57 – 10,082,353
Other service activities 7,814,034 2.77 7,814,034Agriculture, forestry and fishing 1,377,150 0.49 – 1,377,150
Professional, scientific and technical activities 533,400 0.19 – 533,400Arts, entertainment and recreation 12,729,254 4.51 – 12,729,254
Others 20,901,527 7.41 4,653,837 25,555,364
P=282,176,601 100.00 P=334,852,459 P=617,029,060

Supplementary Information Required Under BSP Circular 1074 - 159 -
*SGVFS162380*
Parent Bank
2020
Trading and
Loans and Other Receivables Investment
Amount % Securities Total
Concentration by location
Philippines P=280,910,947 99.55 P=190,065,071 P=470,976,018Others - Asia 703,182 0.25 51,574,765 52,277,947
South America 213,281 0.08 13,900,473 14,113,754North America 275,925 0.10 7,890,150 8,166,075
United States 43,041 0.02 67,977,986 68,021,027Europe 30,225 0.01 3,444,014 3,474,239
P=282,176,601 100.00 P=334,852,459 P=617,029,060
Breakdown of total loans as to security and statusAs to security
The breakdown of total loans and other receivables (net of unearned discounts) as to secured,with corresponding collateral types, and unsecured loans follows (amounts in thousands):
Group Parent Bank
2021 2020 2021 2020
Secured:Real estate P=10,306,870 P=13,380,387 P=8,781,142 P=11,616,290Deposit hold-out 441,795 1,189,484 404,783 1,124,477
Government securities – 859,245 – –
Chattel mortgage 484,577 507,018 430,580 –
Others 35,608,038 60,642,661 35,572,532 50,109,596
46,841,280 76,578,795 45,189,037 62,850,363Unsecured 326,866,206 274,475,937 256,429,206 219,192,780
P=373,707,486 P=351,054,732 P=301,618,243 P=282,043,143
The breakdown as to secured and unsecured of non-accruing loans of the Group and the ParentBank as of December 31 follows:
Group Parent Bank
2021 2020 2021 2020
Secured P=4,657,991 P=6,825,461 P=4,310,580 P=6,627,263Unsecured 14,291,767 10,217,302 8,564,337 5,665,926
P=18,949,758 P=17,042,763 P=12,874,917 P=12,293,189
As to status
Non-performing loans (NPLs) of the Group and the Parent Bank as of December 31, 2021 and2020 are presented below, net of the related allowance for credit losses in compliance with BSPCircular 855, respectively (amounts in thousands).
Group Parent Bank
2021 2020 2021 2020
Gross NPLs P=18,949,758 P=17,042,763 P=12,874,917 P=12,293,189Specific allowance for credit losses on NPLs (10,072,401) (6,324,528) (7,529,574) (4,726,650)
P=8,877,357 P=10,718,235 P=5,345,343 P=7,566,539

Supplementary Information Required Under BSP Circular 1074 - 160 -
*SGVFS162380*
Under BSP Circular 941, an account or exposure is considered non-performing, even without anymissed contractual payments, when it is deemed impaired under existing applicable accountingstandards, classified as doubtful or loss, in litigation, and/or there is evidence that full repaymentof principal and interest is unlikely without foreclosure of collateral, in the case of securedaccounts. All other accounts, even if not considered impaired, shall be considered non-performing if any contractual principal and/or interest are past due for more than ninety (90)days, or accrued interests for more than 90 days have been capitalized, refinanced, or delayed byagreement.
Microfinance and other small loans with similar credit characteristics shall be considered non-performing after contractual due date or after it has become past due. Restructured loans shall beconsidered non-performing. However, if prior to restructuring, the loans were categorized asperforming, such classification shall be retained.
Non-performing loans, investment, receivables, or any financial asset (and/or any replacementloan) shall remain classified as such until (a) there is a sufficient evidence to support that fullcollection of principal and interests is probable and payments of interest and/or principal arereceived for at least six (6) months; or (b) written-off.
Information on the amounts of performing and non-performing loans and receivables (gross ofallowance for impairment and credit losses) per product line of the Group and Parent Bank are asfollows:
Group
2021 2020
PerformingNon-Performing Total Performing Non-Performing Total
Corporate loans P=117,506,723 P=1,167,863 P=118,674,586 P=116,712,143 P=24,294 P=116,736,437Commercial loans 66,908,763 3,033,984 69,942,747 61,881,173 2,588,164 64,469,337Home loans 52,407,938 5,806,732 58,214,670 49,866,024 6,883,155 56,749,179
CSB salary loans 42,268,532 3,356,560 45,625,092 45,867,477 2,051,036 47,918,513Other retail products 15,700,041 2,419,612 18,119,653 16,420,153 2,497,256 18,917,409Other receivables from
customers* 26,146,411 3,165,007 29,311,418 18,352,367 2,998,858 21,351,225
Total receivables fromcustomers P=320,938,408 P=18,949,758 P=339,888,166 P=309,099,337 P=17,042,763 P=326,142,100
*Comprised of HR loans, quick loans and Home Credit receivables
Parent Bank
2021 2020
PerformingNon-Performing Total Performing Non-Performing Total
Corporate loans P=117,506,723 P=1,167,863 P=118,674,586 P=116,712,143 P=24,294 P=116,736,437Commercial loans 66,908,763 3,033,984 69,942,747 61,881,173 2,588,164 64,469,337Home loans 52,407,938 5,806,732 58,214,670 49,866,024 6,883,155 56,749,179
Other retail products 15,700,041 2,419,612 18,119,653 16,420,153 2,497,256 18,917,409Other receivables from
customers* 13,575,477 446,726 14,022,203 8,274,603 300,320 8,574,923
Total receivables fromcustomers P=266,098,942 P=12,874,917 P=278,973,859 P=253,154,096 P=12,293,189 P=265,447,285
*Comprised of HR loans, quick loans and Home Credit receivables

Supplementary Information Required Under BSP Circular 1074 - 161 -
*SGVFS162380*
Related party loansAs of December 31, 2021 and 2020, the Group’s and the Parent Bank’s related party loans solelyconsist of DOSRI loans, as shown below (peso amounts in thousands):
Group Parent Bank
2021 2020 2021 2020
Total DOSRI loans P=545,518 P=549,904 P=507,225 P=430,097Unsecured DOSRI loans 247,341 201,038 223,880 106,837% of DOSRI loans to total loan
portfolio 0.16% 0.17% 0.18% 0.16%% of unsecured DOSRI loans
to total DOSRI loans –% –% –% –%% of past due DOSRI loans
to total DOSRI loans –% –% –% –%% of non-accruing DOSRI accounts to
total DOSRI loans –% –% –% –%
The total unsecured DOSRI loans above represent fringe benefits that are excluded indetermining the compliance with the individual ceiling under subsection X330.1 of the MORB.Accordingly, the percentage of unsecured DOSRI loans to total DOSRI loans as presented aboveis nil.
Secured liability and assets pledged as securityThe Group’s and the Parent Bank’s bills payable under repurchase agreements amounted toP=18.67 billion and P=24.32 billion as of December 31, 2021 and 2020, respectively.
Investment securities of both the Group and the Parent Bank with carrying values ofP=23.47 million and P=28.82 million as of December 31, 2021 and 2020, respectively, werepledged against bills payable under repurchase agreement.
Commitments and contingenciesFollowing is a summary of the Parent Bank’s commitments and contingent accounts (amounts inthousands):
Group Parent Bank
2021 2020 2021 2020
Trust department accounts P=89,976,413 P=74,469,549 P=89,976,413 P=74,469,549Commitments 61,930,576 59,653,709 61,840,156 59,624,188Forward exchange bought 31,946,925 30,396,594 31,946,925 30,396,594Forward exchange sold 22,392,884 19,533,966 22,392,884 19,533,966Inward bills for collections 13,342,960 25,694,563 13,342,960 25,694,563Other derivatives 12,738,173 7,799,215 12,738,173 7,799,215Unused standby letters of credit 5,849,338 6,724,426 5,849,338 6,724,426Spot exchange bought 1,332,437 3,135,021 1,332,437 3,135,021Spot exchange sold 4,086,222 2,095,779 4,086,222 2,095,779Outstanding guarantees issued 1,208,727 405,927 1,208,675 405,927Other commitment and contingent accounts 64,607 72,127 10,910 16,236

A. Statement of Management’s Responsibility for Financial Statements
B. Independent Auditors’ Report on the SEC Supplementary SchedulesFiled Separately from the Basic Financial Statements
C. List of Supplementary Information
Supplementary Schedules to Financial Statements (Form 17-A, Item 7)
Schedule Page
A Financial Assets 1Financial Assets at Fair Value Through Profit or LossFinancial Assets at Amortized CostFinancial Assets at Fair Value Through Other Comprehensive Income
(Annex 68-J, A)B Amounts Receivable from Directors, Officers, Employees, Related Parties
and Principal Stockholders (Other than Related Parties) 10(Annex 68-J, B)
C Amounts Receivable from Related Parties which are Eliminated during the Consolidation of Financial Statements 11
(Annex 68-J, C) D Long-term Debt 12
(Annex 68-J, D) E Indebtedness to Related Parties (Long-term Loans from Related Companies) *
(Annex 68-J, E) F Guarantees of Securities of Other Issuers *
(Annex 68-J, F) G Capital Stock 13
(Annex 68-J, G)
I Reconciliation of Retained Earnings Available for Dividend Declaration 14(Annex 68-D)
II Map Showing the Relationship Between and Among the Bank and its Related Entities 15
D. Schedule of Financial Soundness Indicators for December 31, 2021 and 2020 (Annex 68-E) 16
E. Schedule for Listed Companies with a Recent Offering of Securities to the Public 17
* These schedules and supplementary information are not included as these are not applicable to Group.
UNION BANK OF THE PHILIPPINES AND SUBSIDIARIESINDEX TO SUPPLEMENTARY SCHEDULES
DECEMBER 31, 2021
Content

*SGVFS162380*
INDEPENDENT AUDITOR’S REPORT
ON SUPPLEMENTARY SCHEDULES
The Stockholders and the Board of Directors
Union Bank of the Philippines
UnionBank PlazaMeralco Avenue corner Onyx street and Sapphire Road,
Ortigas Center, Pasig City
We have audited in accordance with Philippine Standards on Auditing, the consolidated financial
statements of Union Bank of the Philippines and its Subsidiaries (the Group) and the parent bank
financial statements of Union Bank of the Philippines (the Parent Bank) as at December 31, 2021 and foreach of the three years in the period ended December 31, 2021, included in this Form 17-A, and have
issued our report thereon dated February 24, 2022. Our audits were made for the purpose of forming an
opinion on the basic consolidated and parent bank financial statements taken as a whole. The scheduleslisted in the Index to the Supplementary Schedules are the responsibility of the Bank’s management.
These schedules are presented for purposes of complying with the Revised Securities Regulation Code
Rule 68, and are not part of the basic consolidated and parent bank financial statements. These schedules
have been subjected to the auditing procedures applied in the audit of the basic consolidated and parentbank financial statements and, in our opinion, fairly state, in all material respects, the financial
information required to be set forth therein in relation to the basic consolidated and parent bank financial
statements taken as a whole.
SYCIP GORRES VELAYO & CO.
Janet A. Paraiso
Partner
CPA Certificate No. 92305Tax Identification No. 193-975-241
BOA/PRC Reg. No. 0001, August 25, 2021, valid until April 15, 2024
SEC Partner Accreditation No. 92305-SEC (Group A)
Valid to cover audit of 2021 to 2025 financial statements of SEC covered institutionsSEC Firm Accreditation No. 0001-SEC (Group A)
Valid to cover audit of 2021 to 2025 financial statements of SEC covered institutions
BIR Accreditation No. 08-001998-062-2020, December 3, 2020, valid until December 2, 2023PTR No. 8853462, January 3, 2022, Makati City
February 24, 2022
SyCip Gorres Velayo & Co.6760 Ayala Avenue1226 Makati CityPhilippines
Tel: (632) 8891 0307Fax: (632) 8819 0872ey.com/ph
A member firm of Ernst & Young Global Limited

UNION BANK OF THE PHILIPPINES
INDEX TO THE SUPPLEMENTARY SCHEDULES
Annex 68-D (Index D): Reconciliation of Retained Earnings Available for Dividend Declaration
Rule 68-4.H (Index C-II): Map Showing the Relationships Between and Among the Company and its
Ultimate Parent Company, Middle Parent, Subsidiaries or Co-subsidiaries,
Associates, Wherever Located or Registered
Annex 68-J (Index C): Supplementary Schedules Required by Annex 68-J
Schedule A. Financial Assets
Schedule B. Amounts Receivable from Directors, Officers, Employees,
Related Parties, and Principal Stockholders (Other than Related Parties)
Schedule C. Amounts Receivable from Related Parties which areEliminated During the Consolidation of Financial Statements
Schedule D. Long-term Debt
Schedule G. Capital Stock

Number of Shares or Principal Amount of
Bonds and Notes
Amount Shown in the Statement Financial Position
Value Based on Market Quotation at Statement of
Condition Date
Income Received and Accrued
FINANCIAL ASSETS AT FAIR VALUE THROUGH PROFIT OR LOSS
Debt SecuritiesAsia United Bank Corporation - - - 21,641 P Banco De Oro 15,044,705 15,317,917 15,317,917 449,083 Bharat Petroleum Corp. Ltd. - - - 21,784,483 Bureau of Treasury 2,670,514,526 2,711,941,485 2,711,941,485 107,366,165 Energy Development Corporation - - - 24,741 Filinvest Development Corporation 1,427,972 1,507,224 1,507,224 176,636 FPT FINANCE LTD 66,298,700 69,815,183 69,815,183 7,133,880 International Container Terminal Services, Inc. 51,406,992 56,116,578 56,116,578 3,879,070 Indian Railway Finance Corp. Ltd. - - - 876,574 Indonesian Government - - - 865,011 JG Summit Holdings 40,799,200 42,888,527 42,888,527 3,235,081 Manila Water Company, Inc. - - - 1,015,757 Metropolitan Bank and Trust Company - - - 1,050,747 Megaworld Corporation 150,447,050 157,827,982 157,827,982 4,766,741 Petroleos Mexicanos - - - 3,454,303 Philippine National Bank 50,846,003 51,645,302 51,645,302 3,049,080 Power Finance Corporation Ltd. 152,997,000 157,059,070 157,059,070 5,703,205 Power Sector Asset and Liabilities Management Corp 256,983,961 366,402,592 366,402,592 23,941,657 PT Indonesia Asahan Aluminium (Persero) 305,994,000 328,328,502 328,328,502 22,847,272 PT Pertamina(Persero) - - - 4,502,015 Republic of Philippines 10,199,800 10,004,474 10,004,474 8,868,961
December 31, 2021
Union Bank of the Philippines and SubsidiariesSEC Released Amended SRC Rule 68
Annex 68-JSchedule A - Financial Assets
PP
1

Number of Shares or Principal Amount of
Bonds and Notes
Amount Shown in the Statement Financial Position
Value Based on Market Quotation at Statement of
Condition Date
Income Received and Accrued
December 31, 2021
Union Bank of the Philippines and SubsidiariesSEC Released Amended SRC Rule 68
Annex 68-JSchedule A - Financial Assets
Rizal Commercial Banking Corporation 210,982,863 217,027,943 P 217,027,943 P 5,746,961 P San Miguel Corp - - - 93,425 Saudi Arabia Sovereign Group - - - 2,307,121 Saudi Arabian Oil Company - - - 463,772 US Treasury/Sovereign Group - - - 12,457 Vista Land and Lifescapes, Inc.(Vista Land) 173,906,590 179,156,559 179,156,559 10,951,158
Total Debt Securities 4,365,039,338 P 4,365,039,338 P 244,586,995 P
Equity SecuritiesSMC Series 2C - - - 145,788,806 P Alta Vista Golf & Country Club 1 300,000 300,000 - Cebu Country Club (certified true copy only) 1 6,500,000 6,500,000 - Cebu Country Club 1 6,500,000 6,500,000 - Celebrity (Sports) Plaza, Inc. 1 300,000 300,000 - Manila Polo Club 5 120,000,000 120,000,000 - The Metropolitan Club, Inc. - A 10 2,000,000 2,000,000 - The Metropolitan Club, Inc. - B 13 5,200,000 5,200,000 -
140,800,000 P 140,800,000 P -
EMPIRE EAST 5,857,808 1,493,741 P 1,493,741 P - ABACORE CAPITAL (ABACUS) 200,000 184,000 184,000 - GLOBAL ESTATES RESORT (formerly Fil-Estate Land) 760,500 768,105 768,105 - REPUBLIC GLASS 733,000 2,199,000 2,199,000 - ANSCOR 31,250 248,438 248,438 - PETRON 249,100 789,647 789,647 - SHANG PROP (formerly KOUK) 147,142 384,041 384,041 - METRO ALLIANCE (formerly Marsman & Company, Inc.) 645,000 767,550 767,550 -
PP
PP
PP
PP
PP
2

Number of Shares or Principal Amount of
Bonds and Notes
Amount Shown in the Statement Financial Position
Value Based on Market Quotation at Statement of
Condition Date
Income Received and Accrued
December 31, 2021
Union Bank of the Philippines and SubsidiariesSEC Released Amended SRC Rule 68
Annex 68-JSchedule A - Financial Assets
PROJECT QUEST 8,750,000 29,102,174 P 29,102,174 P - PHILIPPINE DEPOSITORY & TRUST CORP. (formely Phil. Central Depository, Inc.) 5,228 959,171 959,171 - ABACORE CAPITAL 256,000 235,520 235,520 - ASIA BEST GROUP INTERNATIONAL, INC.. formerly AGP INDUSTRIAL CORP. - A (Halted – Prev. Close 10/24/01) 4 24 24 - COSCO Capital formerly ALCORN GOLD RESOURCES – B 99,000 514,800 514,800 - ARANETA PROP( INT. CHROME) A 544 495 495 - BENGUET CORP. -A 355 1,811 1,811 - BENGUET CORP. -B 1,702 8,238 8,238 - BDO - Equitable PCI Inc 72 8,690 8,690 - LEISURE & RESORTS WORLD CORP – A 166 247 247 - IMPERIAL RESOURCES INC – A 30 42 42 - KEPPEL PHIL. PROPERTIES - A 593 1,785 1,785 - MABUHAY HOLDINGS, INC. 170,000 63,750 63,750 - OMICO MINING & INDUSTRIAL CORP. 800 276 276 - PHILODRILL CORP.- B (CLASS A and B are considered the same) 280,554 2,806 2,806 - PRIME MEDIA HOLDINGS (FIRST E BANK) 939 1,099 1,099 - WELLEX INDS., INC.(REPUBLIC RESOURCES) 333 77 77 - SHIPTEK SOLUTIONS CORP PH - 31,000,000 31,000,000 -
68,735,524 P 68,735,524 P -
Total Equity Securities 209,535,524 P 209,535,524 P 145,788,806 P
PPP
P
3

Number of Shares or Principal Amount of
Bonds and Notes
Amount Shown in the Statement Financial Position
Value Based on Market Quotation at Statement of
Condition Date
Income Received and Accrued
December 31, 2021
Union Bank of the Philippines and SubsidiariesSEC Released Amended SRC Rule 68
Annex 68-JSchedule A - Financial Assets
Derivative AssetsAffinity Express Philippines 706,969 P 706,969 P - Australia New Zealand Bank 27,380,632 27,380,632 - Banco De Oro 93,431,269 93,431,269 - Bank of the Philippine Islands 19,297,493 19,297,493 - Barclays Bank 75,940.58 75,940.58 - BNP Paribas 1,914,692.33 1,914,692.33 - China Banking Corporation 2,937,822 2,937,822 - Citibank N A 418,250 418,250 - Deutsche Bank 6,799,649 6,799,649 - East West Banking Corporation 21,134 21,134 - EPL Propack Philippines. Inc. 6,030 6,030 - INDIVIDUALS 296,467,041 296,467,041 - ING BANK NV 84,447,311 84,447,311 - JP Morgan Bank 10,412,586 10,412,586 - Land Bank of the Philippines 29,888,234 29,888,234 - Malayan Bank Savings & Mortgage Bank 876,076 876,076 - Mandarin Securities Corp. 1,474 1,474 - MayBank Philippines Inc 28,653,423 28,653,423 - Metropolitan Bank and Trust Company 49,264,076 49,264,076 - Micro Mechanics Technology International Inc 134,586 134,586 - Monark Equipment Corporation 13,858 13,858 -
P
P
4

Number of Shares or Principal Amount of
Bonds and Notes
Amount Shown in the Statement Financial Position
Value Based on Market Quotation at Statement of
Condition Date
Income Received and Accrued
December 31, 2021
Union Bank of the Philippines and SubsidiariesSEC Released Amended SRC Rule 68
Annex 68-JSchedule A - Financial Assets
Morgan Stanley Dean Witter and Company 81,774 P 81,774 P - MUFG Bank, Ltd. 8,664,873 8,664,873 - Philippine National Bank 22,278,284 22,278,284 - Republic of the Philippines 48,194,055 48,194,055 - Rizal Commercial Banking Corporation 27,300,952 27,300,952 - Security Bank Corporation 25,149,551 25,149,551 - Standard Chartered Bank 106,919,372 106,919,372 - Sutherland Global Services Philippines, Inc. 173,617,233 173,617,233 - Union Bank of Switzerland 53,931 53,931 - Wells Fargo Bank, NA 21,804 21,804 -
Total Derivative Asssets 1,065,430,376 P 1,065,430,376 P -
Total - Financial Assets at Fair Value through Profit or Loss 5,640,005,238 P 5,640,005,238 P 390,375,802 P
FINANCIAL ASSETS AT AMORTIZED COST
Government bonds and other debt securitiesAbu Dhabi National Energy Co.(TAQA) 407,992,000 409,007,773 P 409,007,773 P 13,620,039 P Bangko Sentral ng Pilipinas 999,424,332 999,424,332 999,424,332 - Bharat Petroleum Corp. Ltd. 3,187,437,500 3,089,286,830 3,089,286,830 99,023,730 Brazil Sovereign Group 1,529,970,000 1,805,802,369 1,805,802,369 135,635,331 Bureau of Treasury 132,640,726,911 133,299,463,224 133,299,463,224 4,508,795,996 Colombia Sovereign Group 917,982,000 1,196,157,064 1,196,157,064 36,904,330 Indonesian Government 5,620,089,800 6,051,728,284 6,051,728,284 182,059,732 NTPC Limited 1,019,980,000 1,004,293,709 1,004,293,709 43,835,933 Peru Sovereign Group 1,631,968,000 2,393,788,660 2,393,788,660 41,519,387 Perusahaan Perseroan(Persero) PT Perusahaan Listrik Negara 764,985,000 987,075,090 987,075,090 29,301,290
P
P
5

Number of Shares or Principal Amount of
Bonds and Notes
Amount Shown in the Statement Financial Position
Value Based on Market Quotation at Statement of
Condition Date
Income Received and Accrued
December 31, 2021
Union Bank of the Philippines and SubsidiariesSEC Released Amended SRC Rule 68
Annex 68-JSchedule A - Financial Assets
Petroleos Mexicanos 6,809,182,484 6,738,826,820 P 6,738,826,820 P 387,638,184 P Petroliam Nasional Berhad(Petronas) 509,990,000 509,790,688 509,790,688 10,041,961 Power Finance Corporation Ltd. - - - 43,290,348 Qatar Sovereign Group 254,995,000 255,243,586 255,243,586 17,052,725 Saudi Arabia Sovereign Group 356,993,000 379,546,517 379,546,517 37,320,059 Saudi Arabian Oil Company 1,733,966,000 1,744,860,363 1,744,860,363 35,336,647 Sultanate of Oman Sovereign Group 662,987,000 709,490,565 709,490,565 25,203,065 Turkey Sovereign Group 2,039,960,000 2,037,036,812 2,037,036,812 56,980,451 Uruguay Sovereign Group 101,998,000 138,101,046 138,101,046 7,146,071
Total Government bonds and other debt securities 163,748,923,733 P 163,748,923,733 P 5,710,705,281 P
Private bonds and commercial papersHindustan Petroleum Corp. Ltd. 764,985,000 738,175,673 P 738,175,673 P 33,210,271 P JG Summit Holdings 132,597,400 132,597,400 132,597,400 7,209,582 STI Education Services Group, Inc. 45,370,000 45,370,000 45,370,000 2,892,610 Vista Land and Lifescapes, Inc.(Vista Land) 1,856,250,000 1,856,250,000 1,856,250,000 154,935,352 Aboitiz Power Corporation 50,000,000 50,000,000 50,000,000 1,562,845 SMC Bonds 40,000,000 40,000,000 40,000,000 2,304,520
Total Private bonds and commercial papers 2,862,393,073 P 2,862,393,073 P 202,115,180 P
Less: Allowance for credit losses 249,138,042 )( 0
Total - Financial Assets at Amortized Cost 166,362,178,764 P 166,611,316,806 P 5,912,820,461 P
6

Number of Shares or Principal Amount of
Bonds and Notes
Amount Shown in the Statement Financial Position
Value Based on Market Quotation at Statement of
Condition Date
Income Received and Accrued
December 31, 2021
Union Bank of the Philippines and SubsidiariesSEC Released Amended SRC Rule 68
Annex 68-JSchedule A - Financial Assets
FINANCIAL ASSETS AT FAIR VALUE THROUGH OTHER COMPREHENSIVE INCOME
Government and private bonds and other debt securitiesAbu Dhabi National Energy Co.(TAQA) - - - 2,960,998 P Banco De Oro - - - 170,282 Bharat Petroleum Corp. Ltd. - - - 13,153,243 Brazil Sovereign Group - - - 29,793,059 Bureau of Treasury 28,891,704,212 28,896,114,127 28,896,114,127 578,634,472 Chile Sovereign Group - - - 556,277 China Petrochemical Corporation Group(SINOPEC) - - - 1,968,338 Colombia Sovereign Group - - - 8,910,659 Del Monte Pacific Limited 2,549,950,000 2,525,980,470 2,525,980,470 5,843,635 Filinvest Development Corporation 2,014,460,500 2,126,263,058 2,126,263,058 101,362,346 FPT FINANCE LTD 1,587,649,869 1,671,858,818 1,671,858,818 122,062,603 Hindustan Petroleum Corp. Ltd. - - - 5,436,783 Indonesian Government 509,990,000 505,588,786 505,588,786 30,970,609 International Container Terminal Services, Inc. 2,121,558,400 2,196,947,774 2,196,947,774 32,980,188 PT Indonesia Asahan Aluminium (Persero) - - - 1,248,932 Indian Railway Finance Corp. Ltd. - - - 2,178,229 JG Summit Holdings 2,642,309,189 2,777,621,843 2,777,621,843 65,841,682 Manila Water Company, Inc. 3,036,582,458 3,140,646,139 3,140,646,139 105,072,923 Megaworld Corporation 2,892,306,287 3,034,202,833 3,034,202,833 89,958,470
PP
7

Number of Shares or Principal Amount of
Bonds and Notes
Amount Shown in the Statement Financial Position
Value Based on Market Quotation at Statement of
Condition Date
Income Received and Accrued
December 31, 2021
Union Bank of the Philippines and SubsidiariesSEC Released Amended SRC Rule 68
Annex 68-JSchedule A - Financial Assets
Metropolitan Bank and Trust Company 407,992,000 408,640,707 P 408,640,707 P 10,497,283 P Mexico Sovereign Group - - - 4,022,937 NTPC Limited - - - 8,869,837 Sultanate of Oman Sovereign Group - - - 3,122,973 Petroleos Mexicanos - - - 31,087,587 Peru Sovereign Group - - - 6,844,082 Petroliam Nasional Berhad(Petronas) - - - 1,416,975 Perusahaan Perseroan(Persero) PT Perusahaan Listrik Negara - - - 14,530,941 Philippine National Bank 414,978,863 421,502,331 421,502,331 8,826,399 Power Finance Corporation Ltd. 1,580,969,000 1,553,475,949 1,553,475,949 59,528,899 Power Sector Asset and Liabilities Management Corp 5,411,605,888 7,419,465,453 7,419,465,453 155,209,956 PT Pertamina(Persero) 652,583,204 666,705,672 666,705,672 11,476,117 Qatar Sovereign Group - - - 14,067,124 Republic of Philippines - - - 44,131,250 Saudi Arabia Sovereign Group 1,223,976,000 1,191,540,636 1,191,540,636 40,328,289 Saudi Arabian Oil Company - - - 5,744,696 Turkey Sovereign Group - - - 12,417,004 Uruguay Sovereign Group - - - 1,009,137 US Treasury/Sovereign Group 6,884,865,000 5,996,366,797 5,996,366,797 167,230,427 Vista Land and Lifescapes, Inc.(Vista Land) 764,985,000 796,096,940 796,096,940 33,858,585 Aboitiz 10,000,000 10,267,537 10,267,537 527,570 Ayala Land 20,000,000 20,399,442 20,399,442 778,300 Bureau of Treasury 50,000,000 50,260,570 50,260,570 1,925,000 Petron 20,000,000 20,095,564 20,095,564 1,564,908 San Miguel Inc. 16,000,000 16,057,046 16,057,046 1,128,719 Vista Land and Lifescapes, Inc.(Vista Land) 30,000,000 28,925,841 28,925,841 1,725,360
Total Government and private bonds and other debt securities 65,475,024,333 P 65,475,024,333 P 1,840,974,083 P
8

Number of Shares or Principal Amount of
Bonds and Notes
Amount Shown in the Statement Financial Position
Value Based on Market Quotation at Statement of
Condition Date
Income Received and Accrued
December 31, 2021
Union Bank of the Philippines and SubsidiariesSEC Released Amended SRC Rule 68
Annex 68-JSchedule A - Financial Assets
Equity SecuritiesBANCNET 50,000 5,000,000 P 5,000,000 P - BAP CONSULTING , INC. 12,500 1,250,000 1,250,000 - BAP-Credit Bureau - 50,000 50,000 - Coop Society Swift - 3,139 3,139 - Cruztelco 90 9,000 9,000 - Eastern Visayas Tel Co. 100 5,000 5,000 - Fixed Income Exchange 125,000 1,250,000 1,250,000 - Local Government Unit Guaranty Corporation 50,000 5,000,000 5,000,000 - Local Government Unit Guaranty Corporation 50,000 5,000,100 5,000,100 - Makati Executive Center 1 31,500 31,500 - Meralco 21,934 219,340 219,340 - Metropolitan Threater 1 40,000 40,000 - NAWASA - 150 150 - PHIL. CLEARING HOUSE CORP. 21,000 5,000,000 5,000,000 - PHILAM 2 1,000,000 1,000,000 - Philam Properties Corp. - 500,000 500,000 - Philippine Dealing System Holdings Corporation (formerly Philippine Central Depository Incorporated) 31,690 3,169,000 3,169,000 - PILTEL 75 6,000 6,000 - Rockwell Land Corporation 2 700,000 700,000 - Steel Asia - 13,439,870 13,439,870 - Integra Fund LLP 25,291,497 25,291,497 - NYK Ventures Pte. Ltd. 4,459 30,921,271 30,921,271 - Consensys Software Inc. 29,240 99,700,000 99,700,000 - Total Equity Securities 197,585,867 P 197,585,867 P -
Total - Financial Assets at Fair value through OCI 65,672,610,200 P 65,672,610,200 P 1,840,974,083 P
GRAND TOTAL 237,674,794,202 P 237,923,932,244 P 8,144,170,345 P
P
P
9

Amounts Collected Amounts Written-off Current Not Current
Union Bank of the Philippines and SubsidiariesSEC Released Amended SRC Rule 68
Annex 68-JSchedule B - Amounts Receivable from Directors, Officers, Employees, Related Parties and Principal Stockholders (Other than Related Parties)
December 31, 2021
RECEIVABLES FROM DIRECTORS, OFFICERS, EMPLOYEES, RELATED PARTIES AND PRINCIPAL STOCKHOLDERS ARE WITHIN THE ORDINARY COURSE OF BUSINESS OF THE BANK
Deductions Ending Balance Balance at End of YearName and Designation of Debtor Balance at Beginning
of Year Additions
10

Amounts Collected/ Paid Amounts Written-off Current Not Current
Accounts Receivable from Related PartiesCity Savings Bank, Inc. (Subsidiary) - 37,631,396 P - - 37,631,396 P - 37,631,396 P Union Digital Bank (Subsidiary) - 29,000,000 - - 29,000,000 - 29,000,000 UBX Philippines Corporation (Subsidiary) 16,160,946 56,433,189 68,045,891 - 4,548,243 - 4,548,244 First Union Insurance and Financial Agencies, Inc. (Subsidiary) 134,212 369,588 482,804 - 20,995 - 20,995
16,295,158 P 123,434,173 P 68,528,695 P - 71,200,634 P - 71,200,635 P
Accounts Payable to Related PartiesUBX Philippines Corporation (Subsidiary) 3,602,369 P 57,433,284 P 23,246,360 P - 37,789,293 P - 37,789,293 P UBP Investments Corporation (Subsidiary) 396,967 - - - 396,967 - 396,967 First Union Direct Corporation (Subsidiary) 376,750 - 376,750 - - - - Bangko Kayaban, Inc. (Bangko Kabayan) (Subsidiary) 7,380,806 21,899,999 29,056,115 - - - 224,690
11,756,891 P 79,333,283 P 52,679,225 P - 38,186,259 P - 38,410,949 P
Balance at End of Year
Union Bank of the Philippines and SubsidiariesSEC Released Amended SRC Rule 68
Annex 68-JSchedule C - Amounts Receivable from Related Parties which are Eliminated during the Consolidation of Financial Statements
December 31, 2021
Name and Designation of Debtor Balance at Beginning of Year Additions
Deductions Ending Balance
P
P P
PP
P
P P
P P
11

Title of Issue and Type of Obligation Amount Authorized by IndentureAmount Shown Under Caption"Current Portion of Long-term Debt" in Related
Statement of Financial Position
Amount Shown Under Caption"Long-term Debt" in related Statement of
Financial Condition
USD Senior Medium Term Notes Due 2022 101,998,000,000 25,488,553,316 - USD Senior Medium Term Notes Due 2025 - 15,219,464,722 Peso Senior Series B Bonds Due 2022 5,790,950,815 - Peso Senior Series C Bonds Due 2023 - 8,073,690,106 Peso Senior Series D Bonds Due 2026 - 877,306,624 IFC Social Bonds 7,649,850,000 - 7,589,032,826 Unsecured Subordinated Tier 2 Notes Due 2030 Callable in 2025 20,000,000,000 - 6,750,837,761 Long Term Negotiable Certificate of Deposit 2023 20,000,000,000 - 3,000,000,000 Loans Payable 150,000,000 - 64,149,563
Details:Maturity Date Interest Rate
USD Senior Medium Term Notes Due 2022 November 29, 2022 3.369%USD Senior Medium Term Notes Due 2025 October 22, 2025 2.125%Peso Senior Series B Bonds Due 2022 June 3, 2022 6.000%Peso Senior Series C Bonds Due 2023 December 9, 2023 2.750%Peso Senior Series D Bonds Due 2026 March 9, 2026 3.375%IFC Social Bonds July 23, 2028 1.154%*Unsecured Subordinated Tier 2 Notes Due 2030 Callable in 2025 May 24, 2030 5.250%Long Term Negotiable Certificate of Deposit 2023 August 21, 2023 4.375%Loans Payable May 31, 2023 5.750%
*floating rate
39,000,000,000
Union Bank of the Philippines and SubsidiariesSEC Released Amended SRC Rule 68
Annex 68-JSchedule D - Long-term Debt
December 31, 2021
PPP
12

Related Parties Directors, Officers and Employees Others
Common Stock 2,530,785,238 1,219,362,818 5,000,000 772,903,912 28,447,372 418,011,534
Preferred Stock 100,000,000 - - - - -
Number of Shares Held byNumber of Shares Reserved for Options, Warrants, Conversion
and Other Rights
Number of Shares Issued and Outstanding as Shown
Under the Related Statement of Condition
Caption
Number of Shares AuthorizedTitle of Issue
Annex 68-JSEC Released Amended SRC Rule 68
Union Bank of the Philippines and Subsidiaries
Schedule G - Capital StockDecember 31, 2021
13

Unappropriated Retained Earnings at Beginning of Year, as Previously Reported 77,697,363 P
Prior Years’ Outstanding Reconciling Items, net of taxAccumulated equity in net profit of subsidiaries 14,515,305 )( Deferred tax assets 6,284,649 )(
Unappropriated Retained Earnings, as Adjusted to Available for Dividend Distribution, Beginning of Year 56,897,409
Add: Net Profit Actually Earned/Realized during the Year
Net profit during the period closed to Retained Earnings 12,525,376 P
Less: Non-actual/unrealized income, net of tax Benefit from deferred tax asset 129,329 Share in net profit of subsidiaries, net of dividends received 1,173,016 Unrealized fair value gains on foreign exchange revaluation 337,774 Unrealized fair value gains on financial assets at fair value
through profit or loss 11,151 Unrealized gain on foreclosure of investment properties 101,482
Subtotal 1,752,752 )(
Net Profit Actually Earned/Realized during the Year 10,772,624
Add (Less): Dividend declarations during the period 7,316,158 )( Appropriation of Retained Earnings during the period 152,092 )( 7,468,250 )(
Total Retained Earnings, End of the Year Available for Dividend Declaration 60,201,783 P
Ortigas Center, Pasig City
Annex 68 -D
Reconciliation of Retained Earnings Available for Dividend DeclarationFor the Year Ended December 31, 2021
(Amounts in Thousands of Philippine Pesos)
UNION BANK OF THE PHILIPPINESUnionBank Plaza, Meralco Avenue corner Onyx Street and Sapphire Road
14

Aboitiz Equity Ventures, Inc.
Union Bank of the Philippines*
UnionDigital Bank, Inc.
100%
UnionBank Currency Brokers
Corporation100%
UBP Securities, Inc.
100%
UnionData Corp. 100%
Interventure Capital Corporation
60%
dormant dormant dormant dormant
First Union Plans, Inc.
100%
First Union Insurance and
Financial Agencies, Inc. 100%
First Union Direct Corporation
100%
First-Agro Industrial Rural
Bank, Inc. 51%
Bangko Kabayan, Inc. 21%
Progressive Bank, Inc. 51%
PetNet, Inc. 11%
First-Agro Industrial Rural
Bank, Inc. 49%
Bangko Kabayan, Inc. 49%
Progressive Bank, Inc. 49%
PetNet, Inc. 40%
Shiptek Solutions Corporation
30%
UBX Remit Pte Ltd. 100%
Shiptek Solutions Pte Ltd.
30%
* Union Bank of the Philippines (UBP) is effectively 49.66% owned by Aboitiz Equity Ventures, Inc. (AEVI); hence, UBP is an associate of AEVI in accordance with PAS 28, Investments in Associates .
** Required by Securities and Exchange Commssion, Revised Securities Regulation Code Rule 68, as revised, dated January 6, 2022.
Fintech Platform Ventures Ltd. 31.98%
UNION BANK OF THE PHILIPPINES AND SUBSIDIARIESUnionBank Plaza, Meralco Avenue corner Onyx Street and Sapphire Road,
Ortigas Center, Pasig City
Map Showing the Relationship Between and Among the Bankand its Related Entities**
December 31, 2021
C O N G L O M E R A T E M A P P I N G
UBP Investments Corporation (formerly Union Properties, Inc.)100%
City Savings Bank, Inc.99.79%
UBX Philippines Corporation 100%
UBX Private Ltd.100%
15

*SGVFS162380*
INDEPENDENT AUDITOR’S REPORT ON
COMPONENTS OF FINANCIAL SOUNDNESS INDICATORS
The Stockholders and the Board of Directors
Union Bank of the PhilippinesUnionBank Plaza
Meralco Avenue corner Onyx street and Sapphire Road,
Ortigas Center, Pasig City
We have audited in accordance with Philippine Standards on Auditing, the consolidated financial
statements of Union Bank of the Philippines (the Bank) and its Subsidiaries (together with the Bank, theGroup) and the parent bank financial statements of Union Bank of the Philippines (the Parent Bank) as at
December 31, 2021 and for each of the years in the period ended December 31, 2021 and have issued our
report thereon dated February 24, 2022. Our audits were made for the purpose of forming an opinion onthe basic consolidated and parent bank financial statements taken as a whole. The Supplementary
Schedule on Financial Soundness Indicators, including their definitions, formulas, calculation, and their
appropriateness or usefulness to the intended users, are the responsibility of the Bank’s management.
These financial soundness indicators are not measures of operating performance defined by PhilippineFinancial Reporting Standards (PFRS) and may not be comparable to similarly titled measures presented
by other companies. This schedule is presented for the purpose of complying with the Revised Securities
Regulation Code Rule 68 issued by the Securities and Exchange Commission and is not a required part ofthe basic consolidated and parent bank financial statements prepared in accordance with PFRS. The
components of these financial soundness indicators have been traced to the Bank’s consolidated and
parent bank financial statements as at December 31, 2021 and for each of the three years in the periodended December 31, 2021 and no material exceptions were noted.
SYCIP GORRES VELAYO & CO.
Janet A. Paraiso
PartnerCPA Certificate No. 92305
Tax Identification No. 193-975-241
BOA/PRC Reg. No. 0001, August 25, 2021, valid until April 15, 2024
SEC Partner Accreditation No. 92305-SEC (Group A)Valid to cover audit of 2021 to 2025 financial statements of SEC covered institutions
SEC Firm Accreditation No. 0001-SEC (Group A)
Valid to cover audit of 2021 to 2025 financial statements of SEC covered institutionsBIR Accreditation No. 08-001998-062-2020, December 3, 2020, valid until December 2, 2023
PTR No. 8853462, January 3, 2022, Makati City
February 24, 2022
SyCip Gorres Velayo & Co.6760 Ayala Avenue1226 Makati CityPhilippines
Tel: (632) 8891 0307Fax: (632) 8819 0872ey.com/ph
A member firm of Ernst & Young Global Limited

Ratio Formula Current Year Prior YearCurrent ratio Current Assets/ Current Liabilities 53.9% 56.3%Acid test ratio Current Assets/ Current Liabilities 53.9% 56.3%
Solvency ratiosNet Profit After Tax, Before Non-cash
Expenses/ Liabilities 3.2% 3.2%Debt-to-equity ratio Liabilities/ Equity 6.4:1 6.4:1Asset-to-equity ratio Asset/ Equity 7.4:1 7.4:1
Interest rate coverage ratio Earnings before interests and taxes/
Interest expense 3.3:1 2.2:1
Return on equity Net Profit/ Average Total Capital Funds* 11.6% 11.5%Return on assets Net Profit/ Average Total Resources* 1.6% 1.5%
Net interest marginNet Interest Income/ Average Interest-
earning Resources* 4.6% 4.5%
*Average amount is calculated based on current year-end and previous year-end balances.
Annex 68 -E
SCHEDULE OF FINANCIAL SOUNDNESS INDICATORS
Union Bank of the Philippines and SubsidiariesAs of December 31, 2021
16

1. Gross and net proceeds as disclosed in the final prospectus
Nil
2. Actual gross and net proceeds
Nil
3. Each expenditure item where the proceeds were used
Nil
4. Balance of the proceeds as at end of reporting period
Nil
Note: No offering of securities to the public for the period ended December 31, 2021.
ANNEX 68-I
SCHEDULE FOR LISTED COMPANIES WITH A RECENT OFFERING OF SECURITIES TO THEPUBLIC
Union Bank of the PhilippinesFor the Period Ended December 31, 2021
17