
1870 Non-Population Census Schedules for Idaho Last Name ...
Upload
khangminh22Category
view
0download
0
Intrastock differences in maturation schedules of Atlantic cod,Gadus morhua
Peter J. Wright*, Colin P. Millar , and Fiona M. GibbMarine Scotland Science, Marine Laboratory, PO Box 101, 375 Victoria Road, Aberdeen AB11 9DB, UK
*Corresponding Author: tel: +44 1224 295436; fax: +44 1224 295511; e-mail: [email protected]
Wright, P. J., Millar, C. P., and Gibb, F. M. 2011. Intrastock differences in maturation schedules of Atlantic cod, Gadus morhua. – ICES Journal ofMarine Science, 68: 1918–1927.
Received 4 February 2011; accepted 31 May 2011; advance access publication 25 July 2011.
Differences in maturation schedules from three subpopulations of North Sea cod (Gadus morhua) were examined using the demo-graphic probabilistic maturation reaction norm (PMRN) approach. Declines in maturation probability with size and age were evidentwithin the North Sea cod stock, but the magnitude of decline differed among subpopulations. The difference in the rate of decline ledto significant spatial differences in recent times. Changes in maturation probability could not be explained by colonization from adja-cent regions indicating a local response to conditions. The greatest decline in maturation probability followed the near collapse ofregional spawning biomass during the 1980s and 1990s. A new methodology was developed to integrate the effects of temperatureand competitive biomass into the estimation of the PMRN. Temperature had a positive effect on maturation probability, but couldonly partially explain the decreasing trend in PMRN midpoints. Consequently, regional selection for early maturing genotypesprovides the most parsimonious explanation for the declines in maturation probability observed. The difference in maturation prob-ability among North Sea cod subpopulations, and the additive contribution of temperature to the estimation of change, underscoresthe need to account for population structuring and to incorporate temperature as a covariate in future applications of the PMRN.
Keywords: Bayesian analysis, cod, life-history traits, North Sea, PMRN, survival analysis, temperature.
IntroductionMarked declines in size and age at maturity have been reportedwidely in many exploited fish stocks (Law, 2000; Jørgensen et al.,2007). Such changes in maturation schedules may arise from thereduced intraspecific competition associated with a decliningstock, because fish growing faster will attain the size and conditionrequired for maturation at an earlier age (Trippel, 1995; Grift et al.,2007). However, such a compensatory response does not explainwhy there is often a downward shift in the size-at-age trajectoryof maturity. Indeed, in some cases, earlier maturation has beenassociated with a reduction in growth and condition (Morganet al., 1994; Yoneda and Wright, 2004). Genetic selection hasbeen implicated in such shifts in the size and age at maturity,because there is a heritable component to both (Gjerde, 1984).Fishing is probably an important contributing factor to thisgenetic change (Trippel, 1995; Law, 2000; Jørgensen et al., 2007)because the mortality it imposes can be considerably greaterthan natural mortality (Olsen and Moland, 2011) and may evenchange the pattern of selection from juveniles to adults(Conover, 2007). Life-history theory predicts that such changesin mortality schedules should select for earlier maturation,increased reproductive investment, and a change in growth rate(Roff, 1992; Law, 2000).
There is little direct genetic evidence for changes in maturationschedules, and attempts to identify such a response have looked fortrends in traits that appear to counter that predicted from plasticresponses alone (i.e. counter-trend variation; Dieckmann and
Heino, 2007). Most such indirect evidence has come from appli-cations of the probabilistic maturation reaction norm (PMRN)that describes the probability of immature fish maturing at acertain age and size (Heino et al., 2002) and condition (Griftet al., 2007). This maturation probability is expected to be inde-pendent of the variations in growth and mortality that confounddescriptions of change based on maturity ogives. Nevertheless,interpretation of trends in PMRN reaction norm midpointsrequires caution, because the method can be confounded by unac-counted for environmental influences on maturation, such as thegrowth-independent effect of temperature on the maturation-decision process (Dhillon and Fox, 2004; Tobin and Wright,2011). Past studies have only considered the significance of suchenvironmental influences from an analysis of the Lp50 cohortregression (e.g. Mollet et al., 2007). However, incorporatingenvironmental factors into the estimation of PMRN, in additionto cohort, is the only statistically sound approach to the identifi-cation and disentanglement of additional plastic effects on matu-ration (Dieckmann and Heino, 2007). Moreover, as fieldapplications are limited by a need to characterize gonad develop-ment macroscopically, reported midpoints reflect the energeticoutcome of the continued gonadal development of a fish ratherthan its state when the physiological decision to continue gameto-genesis was made (Wright, 2007).
The Atlantic cod (Gadus morhua) has been central to the debateover fisheries-induced genetic selection of life-history traits,because there have been rapid declines in PMRN reaction
Crown copyright # 2011. Published by Oxford Journals. All rights reserved.
ICES Journal of Marine Science (2011), 68(9), 1918–1927. doi:10.1093/icesjms/fsr111
Dow
nloaded from https://academ
ic.oup.com/icesjm
s/article/68/9/1918/666918 by guest on 22 June 2022
midpoints in some of the most heavily exploited stocks, such as thenorthern (Olsen et al., 2004) and Georges Bank (Barot et al.,2004a) populations. Like a number of marine fish species, stocksof Atlantic cod often consist of both resident and migratory sub-populations (Wright et al., 2006; Righton et al., 2007; Olsenet al., 2008). The North Sea cod stock was once one of the mostproductive (Brander, 1994), but is now highly depleted (ICES,2009), with most of it now concentrated in the northern NorthSea (Hedger et al., 2004; ICES, 2009). Studies of maturity in thisstock have demonstrated that the mean age at first maturity hasdeclined considerably over the past century (Holt, 1893;Oosthuizen and Daan, 1974; Rijnsdorp et al., 1991; Yoneda andWright, 2004). More recently, Yoneda and Wright (2004)showed that since the last period of high spawning-stock size inthe late 1960s, spatial differences in reproductive investmenthave developed, with cod from the northwest inshore (NW)region of the North Sea now maturing smaller and having agreater fecundity than those in the deeper northeastern NorthSea. Differences in maturity at size were also detected betweencod from this NW region and the southern (S) North Sea inboth the field and under a common environment (Harraldet al., 2010). These regional differences in maturity reflect spatially(Wright et al., 2006; Righton et al., 2007) and genetically segre-gated spawning populations of the species in the North Sea(Hutchinson et al., 2001; Nielsen et al., 2009). Given regionaldifferences in sea temperature and its recent rate of warming(Elliot et al., 1991; Sharples et al., 2006), the spatial pattern ofmaturation in the North Sea may reflect counter-gradient selec-tion, fish tending to mature smaller in order to compensate fora less-favourable environment (Conover et al., 2006).Conversely, as North Sea fisheries targeting cod have tended tomove from coastal to offshore waters over the past five decades(Jennings et al., 1999; Greenstreet et al., 2009), the currentspatial variability in life-history traits could reflect divergentresponses to local selective pressures. Any analysis of temporalchanges in reproductive investment should therefore be con-sidered in relation to population structure and environmentalforcing, because failure to account for an appropriate spatialscale could lead to erroneous conclusions on the magnitude ofthe change.
In this study, trends in maturation schedules from three sub-populations of North Sea cod were examined using the demo-graphic PMRN approach (Barot et al., 2004b). As maturationappears to be influenced by the state of the fish during criticalperiods of the year (Wright, 2007), which may in turn be influ-enced by temperature (Dhillon and Fox, 2004), trends in PMRNwere examined in relation to the biomass of conspecifics andbottom sea temperature around the summer maturation decisionphase (Davie et al., 2007). A methodology was developed to inte-grate these potential explanatory influences into the estimation ofthe PMRN. Unexplained trends in reaction norm midpoints werethen considered in relation to predictions about geneticallyinduced changes in life-history traits.
Material and methodsData on sex, maturity, age, and length were extracted from the firstquarter ICES (International Council for the Exploration of theSea) International Bottom Trawl SMALK (sex–maturity–age–length keys) database (DATRAS), for the years 1971–2009.These bottom trawl surveys were undertaken between Januaryand March, i.e. within 1 month of cod spawning (Hislop, 1984).
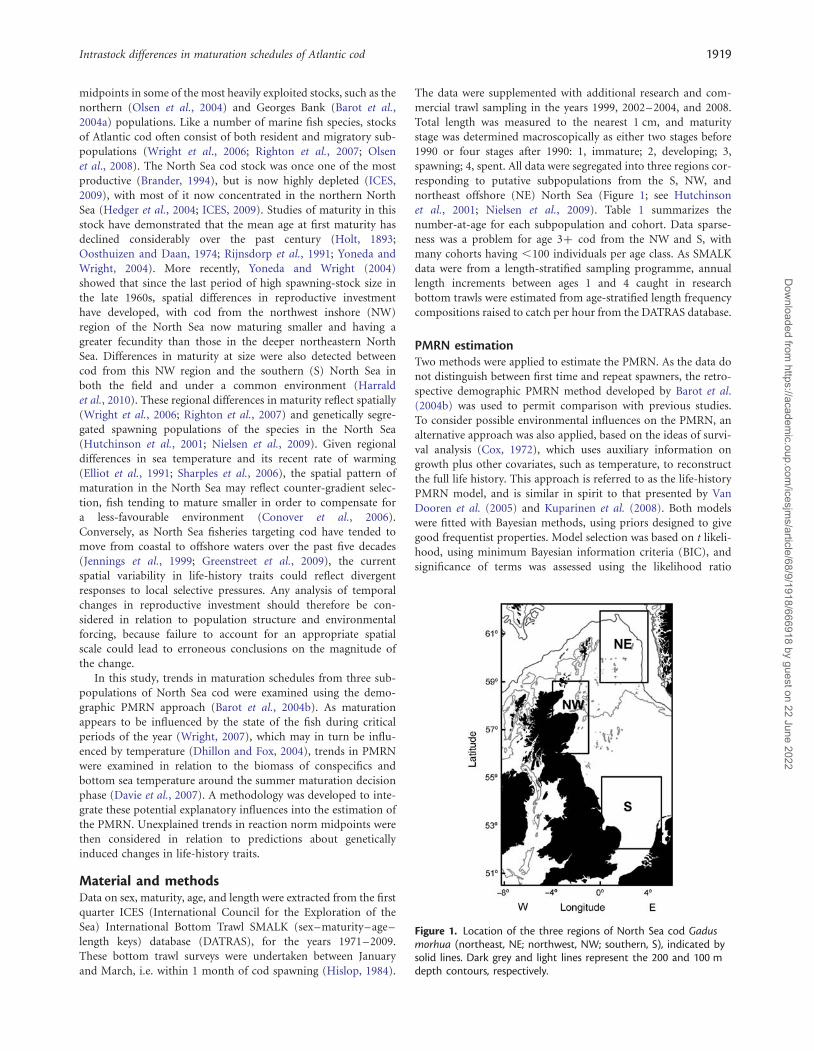
The data were supplemented with additional research and com-mercial trawl sampling in the years 1999, 2002–2004, and 2008.Total length was measured to the nearest 1 cm, and maturitystage was determined macroscopically as either two stages before1990 or four stages after 1990: 1, immature; 2, developing; 3,spawning; 4, spent. All data were segregated into three regions cor-responding to putative subpopulations from the S, NW, andnortheast offshore (NE) North Sea (Figure 1; see Hutchinsonet al., 2001; Nielsen et al., 2009). Table 1 summarizes thenumber-at-age for each subpopulation and cohort. Data sparse-ness was a problem for age 3+ cod from the NW and S, withmany cohorts having ,100 individuals per age class. As SMALKdata were from a length-stratified sampling programme, annuallength increments between ages 1 and 4 caught in researchbottom trawls were estimated from age-stratified length frequencycompositions raised to catch per hour from the DATRAS database.
PMRN estimationTwo methods were applied to estimate the PMRN. As the data donot distinguish between first time and repeat spawners, the retro-spective demographic PMRN method developed by Barot et al.(2004b) was used to permit comparison with previous studies.To consider possible environmental influences on the PMRN, analternative approach was also applied, based on the ideas of survi-val analysis (Cox, 1972), which uses auxiliary information ongrowth plus other covariates, such as temperature, to reconstructthe full life history. This approach is referred to as the life-historyPMRN model, and is similar in spirit to that presented by VanDooren et al. (2005) and Kuparinen et al. (2008). Both modelswere fitted with Bayesian methods, using priors designed to givegood frequentist properties. Model selection was based on t likeli-hood, using minimum Bayesian information criteria (BIC), andsignificance of terms was assessed using the likelihood ratio
Figure 1. Location of the three regions of North Sea cod Gadusmorhua (northeast, NE; northwest, NW; southern, S), indicated bysolid lines. Dark grey and light lines represent the 200 and 100 mdepth contours, respectively.
Intrastock differences in maturation schedules of Atlantic cod 1919
Dow
nloaded from https://academ
ic.oup.com/icesjm
s/article/68/9/1918/666918 by guest on 22 June 2022
statistic. The demographic PMRN approach of Barot et al. (2004b)is presented along with the life-history PMRN model.
The retrospective demographic PMRN approach of Barot et al.(2004b) requires (for each sex, cohort, and subpopulation) esti-mates of the probability of being mature o(a, s) at each age aand size s, and estimates of the increase in size over the previousyear, Dsa,s, of a fish that is currently at age a and size s. The differ-ence o(a, s) − o(a − 1, s − Dsa,s) is the probability that a fish of agea and size s matures at age a. Scaling by the probability that the fishis immature at age a–1 gives the probability of maturing at age a,conditional on being immature the previous year:
m(a, s) = o(a, s) − o(a − 1, s − Dsa,s)1 − o(a − 1, s − Dsa,s)
. (1)
For each age a, the PMRN midpoint (or Lp50) is the size s at whichm(a, s) ¼ 0.5. The method assumes that immature and mature fishhave the same rates of survival and growth; however, PMRN esti-mates are relatively robust to a relaxation of this assumption(Barot et al., 2004b).
Maturity ogives were estimated by logistic regression of indi-vidual maturity state (immature or mature) on length, age, sex,cohort, and subpopulation, and their interactions, with age andcohort treated as categorical variables. There were insufficientdata to fit a full model, i.e. to estimate a separate maturity ogivefor each combination of age, sex, cohort, and subpopulation, soa more parsimonious model was sought. This was chosen byforward and backward stepwise selection using the BIC to penalizemodels with many parameters. The final model was
logit(o) � (age × length + cohort) × subpopulation + sex, (2)
which has a different slope (length effect) for each combination ofage and subpopulation, and a different intercept for each combi-nation of age and subpopulation, and each sex. Maturity ogiveestimation was limited to ages at first maturity, i.e. 2–4, sorequiring cod of age 1 to estimate growth increments.
Annual increases in size were estimated by fitting the growthmodel:
la,r,c � exp(fr,c + gr,c log a), (3)
on the log link and assuming g errors with constant coefficient ofvariation (CV), where l denotes length, a the age, and f (the logmean length-at-age 1) and g (a parameter that modifies thegrowth rate) are specific parameters of cohort, c, and subpopu-lation, r. Numbers at length were weighted by the catch perhour. Based on this model, the length in the previous year of an
age a and length l fish was estimated to be (a − 1/a)gr,c l, givingsize increments
Dsa,l = 1 − a − 1
a
( )gr,c( )
l. (4)
Inference about the Lp50 estimates is non-trivial, because the esti-mates are complicated functions of the maturity ogive and growthmodel parameter estimates, and are correlated because of thestructure of the ogive model [Equation (2)]. Other authors (e.g.Barot et al., 2004a, b) have conditioned on the growth incrementsand used bootstrap methods and randomization tests to makeinferences about PMRN and Lp50. A Bayesian approach wasused here because it provides a more direct method to makinginferences about a variety of PMRN quantities, including Lp50s.The attractiveness of the approach is its simplicity: given a drawfrom the posterior distribution of the ogive model parameters,and a draw from the posterior distribution of the growth modelparameters, then assuming that the growth model is independentof the maturity model, a draw from the posterior distribution ofany function of these parameters is computed easily, forexample, an Lp50, or the slope between two Lp50s.
Markov chain Monte Carlo methods (MCMC; Gelman andCarlin, 2004) were used to sample from the posterior distributionof the growth and maturity model parameters. Specifically, singleblock update random walk Metropolis–Hastings algorithms wereused where the variance matrix of the random walk was 2.42/nS, Sbeing the variance matrix of the associated maximum likelihoodestimates (attainable from standard software) and n the dimensionof S; an additional row and column was added to S for the log CVof the growth model, which was assumed to be independent of allother estimates. The random walk is design to provide the chainoptimal properties (Gelman and Carlin, 2004). Both chains wereinitiated at the maximum likelihood estimates and ran for 5000iterations as a burn in, after which every fifth iteration wasrecorded to remove autocorrelation, until 1000 samples hadbeen obtained. Credible intervals (the Bayesian equivalent of con-fidence intervals) for the Lp50s were then obtained as the 2.5th and97.5th percentiles of the simulated distributions of each Lp50.
The posterior distributions were also used to test for an effect ofsex or subpopulation on Lp50 and for a trend in Lp50 with cohort.The sex effect was measured by the mean difference in Lp50between males and females, averaged across ages, cohorts, and sub-populations. A 95% credible interval for the mean difference wascomputed from the posterior distribution of the Lp50s, with sexhaving a significant effect if zero lay outside the credible interval.Similarly, the subpopulation effect was tested by calculating atwo-dimensional 95% credible region for the mean differences
Table 1. Number of cod at age (1–4) for each North Sea region (northeast, NE; northwest inshore, NW; southern, S), and the meannumber per cohorts, 1976–2005.
Region Data type, cohorts
Age (years)
% female aged 2– 41 2 3 4 Total
NE Total, 1976– 2005 168 2 310 2 061 1 092 5 631 49.5Mean per cohort 6 80 71 37 – –
NW Total, 1977– 2005 2 001 2 641 1 330 454 6 426 46.0Mean per cohort 71 94 48 16 – –
S Total, 1976– 2005 1 392 4 190 1 262 258 7 398 49.0Mean per cohort 48 144 43 9 – –
1920 P. J. Wright et al.
Dow
nloaded from https://academ
ic.oup.com/icesjm
s/article/68/9/1918/666918 by guest on 22 June 2022
in Lp50 (averaged across ages, cohorts, and sexes) between the NEand NW subpopulations, and between the NW and S subpopu-lations, and examining whether zero lay within that region.Finally, cohort trends in Lp50 for each sex, age, and subpopulationwere assessed by smoothing the estimates of Lp50s and calculatingthe difference in the smoothed values Lp1 and Lp2 at the start andend of the time-series (1979 and 2005, corresponding to the short-est time-series). Again, a 95% credible interval was computed forthis difference.
In addition, the magnitude of change was calculated as
m = Lp2 − Lp1
Lp1
, (5)
and the apparent rate of evolutionary change, in the standard unit“darwin”, was calculated as
d = ln(Lp2/Lp1)Dt × 10−6
. (6)
Incorporating explanatory variables in the estimationof maturation probabilityEnvironmental covariates were integrated into the estimation ofPMRN, in addition to cohort, because this is the only statisticallysound approach to the identification and disentanglement ofadditional plastic effects on maturation (Dieckmann and Heino,2007). One solution to achieving this is to model the probabilitiesof maturing and to use these estimates to build a cumulative prob-ability of maturation to test against data. This is related to theapproach taken by Van Dooren et al. (2005) and Kuparinenet al. (2008), in that the probabilities of maturing or the so-calledhazard function is the focus. However, those approaches requireknowledge of the time of first maturation, whereas the approachpresented here does not. Also, discrete time is used here ratherthan continuous time.
Let the random variable T be the event that a fish maturestaking values t1 , t2 , · · ·, which happens once at any time-stepwith probability fj = Pr[T = tj]. The so-called survivor function isthe probability that a fish has remained immature(Sj = Pr[T ≥ tj]), and the hazard function is the conditional prob-ability of maturing given immaturity up to that point(hj = Pr[T = tj|T ≥ tj]). The survivor function can be written interms of the hazard function Sj = (1 − h1)(1 − h2) · · · (1 − h j−1),and the distribution of T can be expressed as fj = Sjhj. In a survivalanalysis, such as that of Kuparinen et al. (2008), data are availablethat can be described directly by the probabilities Sj and fj.However, in data available from field studies, there are no directobservations of fj, but rather the cumulative probabilityFj = Pr[T ≤ tj] =
∑ji=1 fi. This provides an indirect way to
model data such as those described above in terms of h, the prob-ability of maturing. The latter is modelled on a logistic scale; thesimplest model is
log it(h) � 1. (7)
This model assumes that the probability of maturing is con-stant for all ages, lengths, cohorts, and subpopulations. Modelselection can proceed using BIC, and the significance of termscan be assessed using likelihood ratio tests. The covariates used
were length, age, sex, subpopulation, summer temperature, andcompetitive biomass. To incorporate covariates correctly, esti-mates back to the youngest age in the data are required. Forexample, the probability of being mature at age 3 by the 1992spawning season could depend on the length of the fish and thesummer temperature in 1991 and 1990. That the probability ofbeing mature depends on the conditions experienced at everyperiod of maturation labiality, rather than just at one time-point,is an important feature of the model, and for this reason, themethod is referred to as the life-history PMRN approach.
Summer temperature was estimated as the number ofdegree-days in July and August derived from monthly meanNorth Sea bottom temperatures predicted from theNORWECOM model (Skogen et al., 1995; see ftp.imr.no/morten/WGOOFE_ hindcast). Competitive biomass was esti-mated from numbers-at-age by length in the first quarter IBTSsurvey, raised to biomass using a length–weight relationship forcod aged 1–4. The temperature and biomass estimates were delim-ited to the three regions used to define the subpopulations(Figure 1).
The preceding length measurements of a fish were estimated byassuming that the mean length followed a power relationship withage, as in Equation (3). This results in predicted lengths of
li =i
a
( )g
la, (8)
where a is the observed age, la the observed length of the fish, and ithe age at which length is being predicted. As in Equation (3), adifferent g was estimated for each subpopulation and cohort.
Values of Lp50 can be estimated if length is a covariate in themodel. For any set of covariate values other than length (age,cohort, subpopulation, temperature), the probability of maturingcan be written in the form logit(p) � a+ bl, from which the Lp50is estimated to be −a/b. A Bayesian approach, incorporating errorfrom both the growth and maturity models (following Dellaportasand Stephens, 1995), was used to estimate the uncertainty in theLp50 estimates. The MCMC algorithm had three steps:
(i) sample g∗ from the posterior distribution of the g values ofEquation (3) using the method described previously (in prac-tice, 10 000 values were simulated and stored separately);
(ii) propose a plausible set of parameter values from the distri-bution of the PMRN model parameters conditional on g∗;
(iii) accept or reject the set of parameters with the appropriateprobability.
This was repeated 10 000 times: a burn in of 5000 then every fifthiteration from 5000 was stored to provide 1000 draws from theposterior distribution of the Lp50 values. This distribution wasthen used to obtain 95% credible intervals by taking 2.5 and97.5% quantiles.
The following base model was used to define average trends inLp50 with cohort and subpopulation region:
logit(p) � population × [length + age + s(cohort)], (9)
where s(.) denotes a smooth function modelled as a piecewisepolynomial with four interior knots placed evenly (Hastie, 1992)and × denotes a main effect and interaction. On the logistic
Intrastock differences in maturation schedules of Atlantic cod 1921
Dow
nloaded from https://academ
ic.oup.com/icesjm
s/article/68/9/1918/666918 by guest on 22 June 2022
scale, this allows the probability of maturation to have a differentlength slope for each subpopulation, while the level can changewith age, population, age within population, and smoothly withcohort within population.
The additional effect of preceding summer temperature (T)and competitive biomass (C) on trends in cohort was fittedusing the model
logit(p) � population × (length + age + s(cohort) + T
+ C). (10)
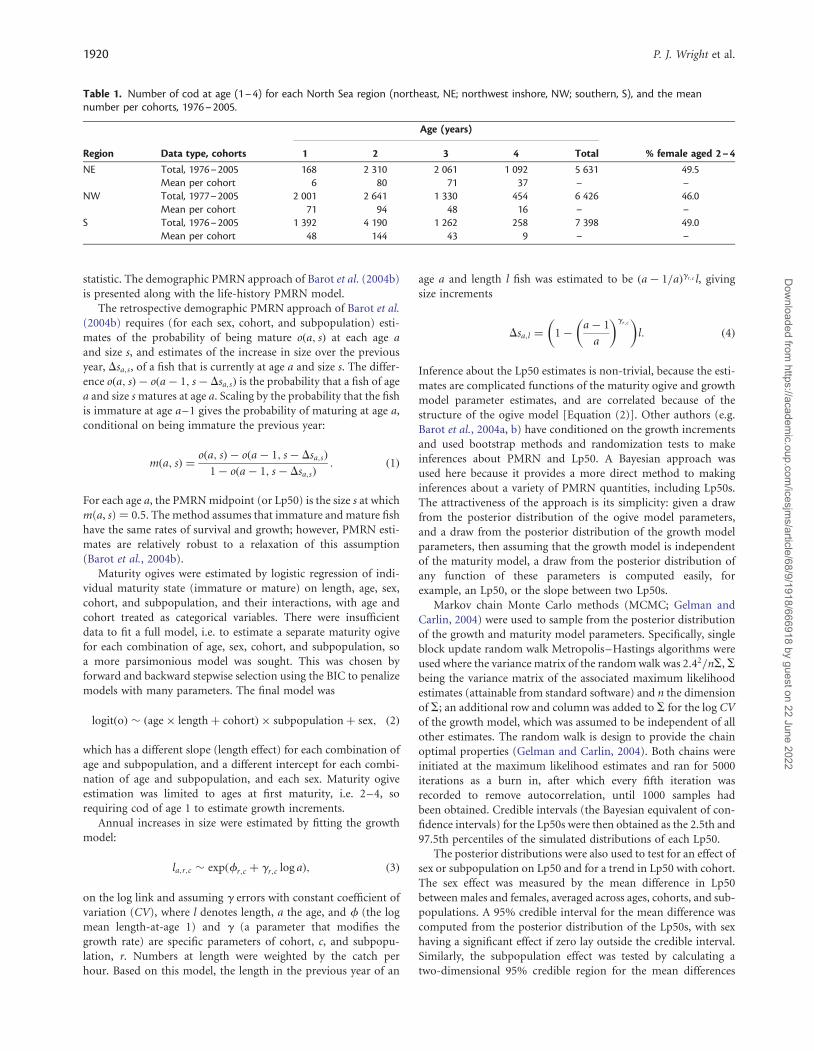
ResultsLength-at-ageAge, cohort, subpopulation, and all interactions had a significanteffect on length (analysis of variance, p , 0.001). Cod from theNE subpopulation were the smallest at age, and those from the Swere the largest. There was a significant positive temporal trendin length-at-age in the S subpopulation, but a negative althoughsmall decline in the other subpopulations. The average annualgrowth increment for ages 2–3 was 15.8, 16.0, and 18.0 cm inthe NE, NW, and S subpopulations, respectively (Figure 2).
Probabilistic maturation reaction normsThere was a significant effect of sex, with mean Lp50 for femalesbeing on average 6.4 cm (95% confidence interval 5.5–7.6 cm)greater than for males. There was a significant effect of subpopu-lation, with the mean Lp50 for NW (44.7 cm; 39.7–48.9 cm) beingsignificantly less than the mean Lp50 value for NE (64.9 cm; 63.2–66.5 cm) and S (62.1 cm; 54.8–75.2 cm). As NE cod only start to
mature by age 3 and most NW and S cod were mature at this age bythe end of the study period, trends in Lp50 for this age class arepresented (Figure 3). The negative trend in Lp50 values in age 3cod with cohort was significant for both sexes in all three subpopu-lations, except males in the S subpopulation (p , 0.05; Table 2).These trends corresponded to magnitudes of change of the orderof 8, 30, and 20% within 26 years, for the NE, NW, and S subpopu-lations, respectively. As a result, although the Lp50 for NE cod was�7 cm greater at the start of the study than other subpopulations,by the end of the study, the difference had increased to between 29and 14 cm. For males and females, respectively, the changes inLp50 values corresponded to an estimated 3.5 and 3.3 k darwinsin the NE subpopulation, 14.9 and 12.0 k darwins in the NW sub-population, and 7.5 and 10.1 k darwins in the S subpopulation.
Trends in potential explanatory factorsThe significance of temperature to the spatial differences in matu-ration probability was partially confounded by the lack of overlapin ranges between the three subpopulation regions (Figure 4).There were weak but significant positive linear temperaturetrends in the NE and NW (t-test; p , 0.05), and a highly signifi-cant trend in the S (t-test; p , 0.0001), so tests were based on ageneralized linear model fit using g errors and an identity linkfunction. Biomass aged 1–3 in the first quarter survey also differedamong regions, although the only subpopulation with a significantdeclining trend with year was the NW subpopulation (t-test; p ,
0.01).The life-history PMRN approach found a significant (p ,
0.001) effect of sex, and sex interacting with subpopulation, age,and cohort within subpopulation. Given the significant effect ofsex, subsequent analyses were conducted on males and femalesseparately.
Linear effects of temperature and cod biomass were significantadditions to the base model [Equation (10)], and were selected asthe final models for both males and females (Table 3). The Lp50values from these models are shown in Figure 5. Maturation prob-abilities were greater for ages 3 and 4 than for age 2. The averageLp50 was higher in the NE subpopulation, followed by NW,then S. The effect of length on maturation probability followedthe same pattern. Temperature had a consistent significant positiveeffect in all subpopulations and sexes, except for females in the NE.Cod biomass did not have a consistent effect across populationregions, but was consistent across sexes, having a positive effectin NE and a negative effect in the NW and S subpopulation. Thecombined effect of temperature and cod biomass can be seen inFigure 5 as additions to the cohort effect. This shows that theaddition of temperature and cod biomass explains some of thedecline in Lp50 values; this is due to a positive effect of tempera-ture along with a generally increasing temperature trend experi-enced by the subpopulations. Figure 5 also shows that neithercovariate explains the increasing positive trend in maturationprobability, but that temperature increases the apparent magni-tude of the trend.
DiscussionAlthough past estimates of Lp50 values have often considered sea-sonal or annual temperature variation when considering the causesof shifts in maturation reaction norms (Barot et al., 2004b; Molletet al., 2007; Pardoe et al., 2009), the life-history PMRN approachpresented here provides the first method of integrating potentialenvironment effects over the years that a cohort matures. The
Figure 2. Average estimated growth increments. As a power modelfor growth was used, length increases with constant proportion fromyear to year. The lines represent the growth of an average fish takendirectly from the growth model [Equation (3)]: solid line, NE; dashedline, NW; dotted line, S.
1922 P. J. Wright et al.
Dow
nloaded from https://academ
ic.oup.com/icesjm
s/article/68/9/1918/666918 by guest on 22 June 2022

need for PMRN models to include temperature experiencedduring the maturation decision phase, rather than annual temp-erature, was demonstrated experimentally by Tobin and Wright(2011). The Lp50 estimates from both the demographic (Barotet al., 2004b) and the new life-history PMRN approaches werebroadly consistent. The difference was greatest in the S subpopu-lation after 1995, with estimates from the life-history approachlying below and with smaller credible intervals than the retrospec-tive demographic approach. There were several contributingfactors to the difference in the size of credible intervals, onebeing that smoothing was used in the life-history approach, asopposed to treating cohort as a factor. The difference in levels ispossibly due to a combination of factors. Very few immaturefish were sampled at ages 3 and 4 in the S after 1999. Most age 3and 4 fish are .35 cm and very few are ,30 cm, so the datawere extreme with respect to the parameters being estimated,although this is complicated by the fact that information onslopes and intercepts in both models were shared across agesand cohorts. Indeed, the approaches were modelling differentthings: the retrospective demographic approach assumed thatthe maturity ogives are linear with length on the logistic scale;
this gives rise to PMRNs that tend to be non-linear on the logisticscale. The life-history approach assumed that PMRNs were linearwith length on the logistic scale; this results typically in asymme-trical maturity ogives.
Declines in the values of Lp50 were evident within the NorthSea cod stock, but the magnitude of decline differed among thethree subpopulations examined. Although age and size close to
Figure 3. PMRN midpoints (Lp50s) for age 3 male and female North Sea cod from the NE (cohorts 1976–2005), NW (cohorts 1979–2005),and S (cohorts 1976–2005) subpopulations. The 95% credible intervals are shown as horizontal bars and incorporate error from the growthmodel.
Table 2. Estimated change (weighted additive regression) ofestimates in PMRN midpoints (Lp50s) between the 1979 and 2005cohorts, with asterisks denoting values significantly different fromzero with a probability of 0.95.
Subpopulation Sex Change in Lp50 (cm)
NE F –6.1*NE M –5.9*NW F –17.3*NW M –18.3*S F –16.3*S M –11.5
Figure 4. Time-trends by biomass and degree-days in summer byyear by subpopulation region (stippled line, S; solid line, NW; dottedline, NE).
Intrastock differences in maturation schedules of Atlantic cod 1923
Dow
nloaded from https://academ
ic.oup.com/icesjm
s/article/68/9/1918/666918 by guest on 22 June 2022
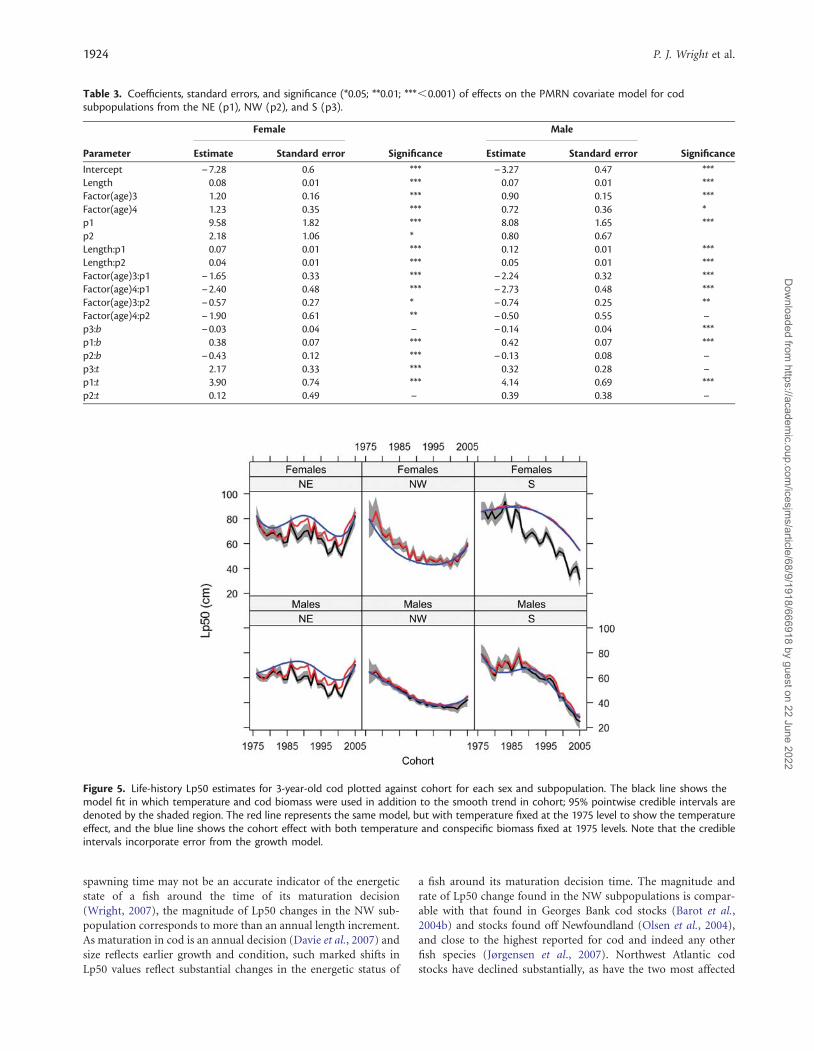
spawning time may not be an accurate indicator of the energeticstate of a fish around the time of its maturation decision(Wright, 2007), the magnitude of Lp50 changes in the NW sub-population corresponds to more than an annual length increment.As maturation in cod is an annual decision (Davie et al., 2007) andsize reflects earlier growth and condition, such marked shifts inLp50 values reflect substantial changes in the energetic status of
a fish around its maturation decision time. The magnitude andrate of Lp50 change found in the NW subpopulations is compar-able with that found in Georges Bank cod stocks (Barot et al.,2004b) and stocks found off Newfoundland (Olsen et al., 2004),and close to the highest reported for cod and indeed any otherfish species (Jørgensen et al., 2007). Northwest Atlantic codstocks have declined substantially, as have the two most affected
Table 3. Coefficients, standard errors, and significance (*0.05; **0.01; ***,0.001) of effects on the PMRN covariate model for codsubpopulations from the NE (p1), NW (p2), and S (p3).
Parameter
Female
Significance
Male
SignificanceEstimate Standard error Estimate Standard error
Intercept – 7.28 0.6 *** – 3.27 0.47 ***Length 0.08 0.01 *** 0.07 0.01 ***Factor(age)3 1.20 0.16 *** 0.90 0.15 ***Factor(age)4 1.23 0.35 *** 0.72 0.36 *p1 9.58 1.82 *** 8.08 1.65 ***p2 2.18 1.06 * 0.80 0.67Length:p1 0.07 0.01 *** 0.12 0.01 ***Length:p2 0.04 0.01 *** 0.05 0.01 ***Factor(age)3:p1 – 1.65 0.33 *** – 2.24 0.32 ***Factor(age)4:p1 – 2.40 0.48 *** – 2.73 0.48 ***Factor(age)3:p2 – 0.57 0.27 * – 0.74 0.25 **Factor(age)4:p2 – 1.90 0.61 ** – 0.50 0.55 –p3:b – 0.03 0.04 – – 0.14 0.04 ***p1:b 0.38 0.07 *** 0.42 0.07 ***p2:b – 0.43 0.12 *** – 0.13 0.08 –p3:t 2.17 0.33 *** 0.32 0.28 –p1:t 3.90 0.74 *** 4.14 0.69 ***p2:t 0.12 0.49 – 0.39 0.38 –
Figure 5. Life-history Lp50 estimates for 3-year-old cod plotted against cohort for each sex and subpopulation. The black line shows themodel fit in which temperature and cod biomass were used in addition to the smooth trend in cohort; 95% pointwise credible intervals aredenoted by the shaded region. The red line represents the same model, but with temperature fixed at the 1975 level to show the temperatureeffect, and the blue line shows the cohort effect with both temperature and conspecific biomass fixed at 1975 levels. Note that the credibleintervals incorporate error from the growth model.
1924 P. J. Wright et al.
Dow
nloaded from https://academ
ic.oup.com/icesjm
s/article/68/9/1918/666918 by guest on 22 June 2022
North Sea subpopulations (Holmes et al., 2008). In contrast, thesmall change in Lp50 found in the NE subpopulation is more inline with the low rates of change in the Northeast Arctic (Heinoet al., 2002) and Icelandic cod stocks (Pardoe et al., 2009).Assuming that genetic selection is involved, a downward trendin the reaction norm is expected to stop once it falls below thesize threshold at which selection no longer has any effect(Ernande et al., 2004), i.e. below the minimum size of capturethat is close to the minimum landing size of 35 cm. In NW sub-populations, the Lp50 of all age groups came close to thisthreshold, so the trend might weaken in future.
The proportion maturing at age would be expected to differamong subpopulations even if they all had the same PMRN,because of differences in growth rate. However, this study indicatesthat most of the reported change in age at maturity of North Seacod (Oosthuizen and Daan, 1974; Rijnsdorp et al., 1991; Yonedaand Wright, 2004) can be explained by the marked downwardshift in PMRN midpoints from what were historically importantcomponents of the stock. Hence, the primary cause of changesin maturity at age was neither a density-dependent compensatoryresponse nor an effect of a more favourable environment forsomatic growth. In the NW population, there has also been areduction in prespawning condition and an increase in weight-specific fecundity (Yoneda and Wright, 2004), contrary to expec-tations of a compensatory response (Trippel, 1995).
In the period before this study, cod throughout the North Seamatured much larger (L50 . 64 cm; Holt, 1893) than currentlyfound in the southern and northwestern North Sea. Even by the1970s, Oosthuizen and Daan (1974) found that cod lengths at50% maturity for the S subpopulation had decreased. At thattime, there was no evidence for a regional difference in length atmaturity between cod from the NW and S, with 50% maturityat around 59 cm and age 3 in the late 1960s (Oosthuizen andDaan, 1974; Yoneda and Wright, 2004). However, the presentstudy indicates that the rate of decline in maturation probabilitysince the 1980s was greater in the NW subpopulation. Thiswould explain why differences in the size at maturity were foundin age 2 cod from the NW and S, in a recent common environmentexperiment (Harrald et al., 2010). Although a large proportion ofcod from the NW and S subpopulation now spawn at age 2, this isnot the case in the NE. Moreover, cod in the NE still maturearound a size similar to that in the 1970s and more than acentury ago (see Holt, 1893). Even smaller differences in matu-ration reaction norms over spatial scales have been found in age2 coastal cod inhabiting fjords along the Skagerrak coast (Olsenet al., 2008). The proximity between the Skagerrak and the late-maturing NE subpopulation region further highlights the finescale of adaptive structuring in cod.
As applications of PMRN focus on a specific geographic region,it is important to consider whether apparent changes in Lp50values could have arisen through colonization of early maturinggenotypes from other areas (Andersen and Brander, 2009).Comparison of maturity–size relationships in areas next to theNorth Sea indicates that colonization is unlikely to have beenimportant. Although some juveniles from the NE may intermixwith coastal subpopulations in the Skagerrak before returning tothe North Sea (Svedang and Svenson, 2006), they mature atmuch greater sizes and ages (Olsen et al., 2008). Moreover,recent Lp50 values of first-maturing cod in the NW were lowerthan those found in cod off the Scottish west coast in the 1970s(Yoneda and Wright, 2004). This is not to say that collapse and
recolonization of cod spawning areas in the North Sea cannothappen, because there is genetic evidence for this in one smallregion of the North Sea (Hutchinson et al., 2003). Nevertheless,tagging studies suggest that the relatively limited home ranges ofthe three subpopulations investigated have not changed duringthe period of this study (Wright et al., 2006; Righton et al.,2007). Therefore, differences in Lp50 values among subpopu-lations found in the present study are likely to reflect an adaptiveresponse to local conditions rather than the confounding effect ofcolonization.
The rapid decline in maturation probability in the NW and Ssubpopulations took place following the near collapse of spawningbiomass in these regions during the 1980s (Holmes et al., 2008). Inthe previous two decades, fishing mortality on ages 2–10 exceeded1.0, and nearly all demersal fishing effort was concentrated in thecoastal NW and southern North Sea (Jennings et al., 1999;Greenstreet et al., 2009; ICES, 2009). Conversely, until thecurrent decade, spawning biomass remained high (Holmes et al.,2008), and fishing effort was low (Greenstreet et al., 2009) in theone region where the change in PMRN midpoints has been negli-gible. Catch curves derived from the first 10 years of survey dataused in the present study similarly indicate a regional differencein total mortality, with Z ¼ 0.7 for ages 2–5 in the NE comparedwith 1.1 in the NW and S subpopulations. Consequently, itappears that mortality was historically much higher on the twosubpopulations that have undergone the greatest change, so selec-tion for early maturity would be expected to have been higher.
Summer temperature also explained some of the variation inmaturation probability. Temperature can have a direct positiveeffect on gametogenesis during the maturation decision phase(Dhillon and Fox, 2004; Tobin and Wright, 2011), which wouldexplain the positive effect on maturation probability found here.However, temporal trends in temperature within populationregions were small or insignificant, and they did not explain thehighly significant negative trends in PMRN midpoints. Theregional difference in temperature range may have contributedto the difference among subpopulations, but the lack of overlapin temperature ranges confounds analysis of such an effect. Thesignificant effect of competitive biomass was difficult to explainbecause it was both positive and negative, depending on subpopu-lation. Significant interactions in the life-history PMRN modelwere also not consistent among subpopulations. Modelling inter-actions as random effects would be an appropriate means of exam-ining the significance of these terms more fully, and thedevelopment of such a model has started.
The different trends in maturation probability among sub-populations of North Sea cod underscores the need to accountfor population structuring in assessing maturation changes.Stock-level sampling may become biased towards the most abun-dant subpopulation as fish from areas declining in abundancebecome too scarce to be included in stratified sampling pro-grammes. Consequently, if rapid declines in PMRN reflect a col-lapsing stock component, as found here, stock-level estimateswill tend to underestimate the magnitude of change. Few otherPMRN studies have tested for substock variation in maturationreaction norms. Mollet et al. (2007) found no difference in thematuration reaction norms of sole (Solea solea) between spawningareas in the German Bight and Dutch–Belgian coastal areas.Pardoe et al. (2009) attempted to consider population structurein their application of PMRN by weighting samples from differentcomponents of the Icelandic cod stock. However, weighting could
Intrastock differences in maturation schedules of Atlantic cod 1925
Dow
nloaded from https://academ
ic.oup.com/icesjm
s/article/68/9/1918/666918 by guest on 22 June 2022

still give a misleading trend if life-history responses to environ-mental change or selective pressures diverged between differentsubpopulations comprising that stock.
In conclusion, although one cannot be certain of the causes ofthe changes in maturation probability observed, it is possible torule out some explanations. The slowest-growing subpopulationmatured larger, contrary to expectations from counter-gradientselection (Conover et al., 2006). Further, neither regional tempera-ture nor conspecific biomass could fully account for the highly sig-nificant negative trends in Lp50 values. Therefore, given the likelyintense periods of size-selection mortality in the NW and S sub-populations, selection for early maturing genotypes appears tobe the most parsimonious explanation for the temporal changesin maturation probability. Recent debate on fisheries-inducedevolution has focused on the apparent rate of evolution estimatedfrom PMRN studies and the lower rates expected from the esti-mation of selection differentials (Andersen and Brander, 2009).The results of the present study indicate that the combinedeffects of phenotypic response to temperature and genetic selec-tion for earlier and smaller size at maturation could be additive,leading to bias in the estimate of evolutionary rates based onPMRN alone. Given that warming trends are evident in many ofthe regions where changes in fish maturation schedules havebeen reported, there is a need to revisit the potential contributionof temperature on the apparent rate of evolution inferred from thedemographic PMRN approach.
AcknowledgementsThis study was carried out with financial support from theEuropean Commission, as part of the Specific Targeted ResearchProject Fisheries-induced Evolution (FinE, contract numberSSP-2006-044276) under the Scientific Support to Policies cross-cutting activities of the European Community’s SixthFramework Programme. It does not necessarily reflect the viewsof the European Commission, and does not anticipate theCommission’s future policy in the area. The work was also sup-ported by Scottish Government ROAME MF 0764. We alsoacknowledge the contribution of the ICES IBTS survey and staffon the FRV “Clupea” and FVs “Auriga”, “Charisma”, “Falcon”,“Genesis”, “Helenus”, “Jasper”, “Sunbeam”, “Tranquility”,“Veracious”, and “Zenith” for samples. Rob Fryer providedhelpful comments on the statistical analysis and manuscript.
ReferencesAndersen, K. H., and Brander, K. 2009. Expected rate of
fisheries-induced evolution is slow. Proceedings of the NationalAcademy of Sciences of the United States of America, 106:11657–11660.
Barot, S., Heino, M., O’Brien, L., and Dieckmann, U. 2004a.Estimating reaction norms for age and size at maturation whenage at first reproduction is unknown. Evolutionary EcologyResearch, 6: 659–678.
Barot, S., Heino, M., O’Brien, L., and Dieckmann, U. 2004b.Long-term trend in the maturation reaction norm of two codstocks. Ecological Applications, 14: 1257–1271.
Brander, K. M. 1994. The location and timing of cod spawning aroundthe British Isles. ICES Journal of Marine Science, 51: 71–89.
Conover, D. O. 2007. Fisheries—nets versus nature. Nature, 450:179–180.
Conover, D. O., Clarke, L. M., Munch, S. B., and Wagner, G. N. 2006.Spatial and temporal scales of adaptive divergence in marine fishes
and the implications for conservation. Journal of Fish Biology, 69:21–47.
Cox, D. R. 1972. Regression models and life tables (with discussion).Journal of the Royal Statistical Society Series B, 34: 187–220.
Davie, A., Mazorra de Quero, C., Bromage, N., Treasurer, J., andMigaud, H. 2007. Inhibition of sexual maturation in tank rearedhaddock (Melanogrammus aeglefinus) through the use of constantlight photoperiods. Aquaculture, 270: 379–389.
Dellaportas, P., and Stephens, D. A. 1995. Bayesian analysis oferrors-in-variables regression models. Biometrics, 51: 1085–1095.
Dhillon, R. S., and Fox, M. G. 2004. Growth-independent effects oftemperature on age and size at maturity in Japanese medaka(Oryzias latipes). Copeia, 2004: 37–45.
Dieckmann, U., and Heino, M. 2007. Probabilistic maturation reac-tion norms: their history, strengths, and limitations. MarineEcology Progress Series, 335: 253–269.
Elliot, A. J., Clarke, T., and Li, Z. 1991. Monthly distributions ofsurface and bottom temperatures in the northwest Europeanshelf seas. Continental Shelf Research, 11: 454–466.
Ernande, B., Dieckmann, U., and Heino, M. 2004. Adaptive changes inharvested populations: plasticity and evolution of age and size atmaturation. Proceedings of the Royal Society Series B, 271:415–423.
Gelman, A., and Carlin, J. B. 2004. Bayesian Data Analysis, 2nd edn,Chapter 11, pp. 283–310. Chapman and Hall/CRC Press, London.
Gjerde, B. 1984. Response to individual selection for age at sexualmaturity in Atlantic salmon. Aquaculture, 38: 229–240.
Greenstreet, S. P. R., Holland, G. J., Fraser, T. W. K., and Allen, V. J.2009. Modelling demersal fishing effort based on landings anddays absence from port, to generate indicators of “activity”. ICESJournal of Marine Science, 66: 886–901.
Grift, R. E., Heino, M., Rijnsdorp, A. D., Kraak, S. B. M., andDieckmann, U. 2007. Three-dimensional maturation reactionnorms for North Sea plaice. Marine Ecology Progress Series, 334:213–224.
Harrald, M., Wright, P. J., and Neat, F. C. 2010. Substock variation inreproductive traits in North Sea cod (Gadus morhua). CanadianJournal of Fisheries and Aquatic Sciences, 67: 866–876.
Hastie, T. J. 1992. Generalized additive models. In Statistical Models inS, pp. 249–307. Ed. by J. M. Chambers, and T. J. Hastie. Chapmanand Hall, London.
Hedger, R., McKenzie, E., Wright, P., Scott, B., Gallego, A., andAndrews, J. 2004. Analysis of the spatial distributions of maturecod (Gadus morhua) and haddock (Melanogrammus aeglefinus)abundance in the North Sea (1980–1999) using generalised addi-tive models. Fisheries Research, 70: 17–25.
Heino, M., Dieckmann, U., and Godø, O. R. 2002. Measuring prob-abilistic reaction norms for age and size at maturation.Evolution, 56: 669–678.
Hislop, J. R. G. 1984. A comparison of the reproductive tactics andstrategies of cod, haddock, whiting and Norway pout in theNorth Sea. In Fish Reproduction: Strategies and Tactics, pp.311–329. Ed. by G. W. Potts, and R. J. Wootton. AcademicPress, London.
Holmes, S. J., Wright, P. J., and Fryer, R. J. 2008. Evidence from surveydata for regional variability in cod dynamics in the North Sea andwest coast of Scotland. ICES Journal of Marine Science, 65:206–215.
Holt, E. W. L. 1893. North Sea Investigations. Journal of the MarineBiological Association of the UK, 3: 78–106.
Hutchinson, W. F., Carvalho, G. R., and Rogers, S. I. 2001. Markedgenetic structuring in localised spawning populations of codGadus morhua in the North Sea and adjoining waters as revealedby microsatellites. Marine Ecology Progress Series, 223: 251–260.
Hutchinson, W. F., van Oosterhout, C., and Rogers, S. I. 2003.Temporal analysis of archived samples indicates marked genetic
1926 P. J. Wright et al.
Dow
nloaded from https://academ
ic.oup.com/icesjm
s/article/68/9/1918/666918 by guest on 22 June 2022

changes in declining North Sea cod (Gadus morhua). Proceedingsof the Royal Society Series B, 270: 2125–2132.
ICES. 2009. Report of the Working Group on the Assessment ofDemersal Stocks in the North Sea and Skagerrak—CombinedSpring and Autumn (WGNSSK), 6–12 May 2009, Copenhagen.ICES Document CM 2009/ACOM: 10. 1028 pp.
Jennings, S. A., Alvsvaag, J., Cotter, A. J. R., Ehrich, S., Greenstreet,S. P. R., Jarre-Teichmann, A., Mergardt, N., et al. 1999. Fishingeffects in northeast Atlantic shelf seas: patterns in fishing effort,diversity and community structure. 3. International trawlingeffort in the North Sea: an analysis of spatial and temporaltrends. Fisheries Research, 40: 125–134.
Jørgensen, C., Enberg, K., Dunlop, E. S., Arlinghaus, R., Boukal, D. S.,Brander, K., Ernande, B., et al. 2007. Ecology—managing evolvingfish stocks. Science, 318: 1247–1248.
Kuparinen, A., O’Hara, R. B., and Merila, J. 2008. Probabilistic modelsfor continuous ontogenetic transition processes. PLoS One 3:e3677.
Law, R. 2000. Fishing, selection, and phenotypic evolution. ICESJournal of Marine Science, 57: 659–668.
Mollet, F. M., Kraak, S. B. M., and Rijnsdorp, A. D. 2007.Fisheries-induced evolutionary changes in maturation reactionnorms in North Sea sole Solea solea. Marine Ecology ProgressSeries, 351: 189–199.
Morgan, M. J., Bishop, C. A., and Baird, J. W. 1994. Temporal andspatial variation in age and length at maturity in cod inDivisions 2J and 3KL. Northwest Atlantic Fisheries OrganisationScience Council Studies, 21: 83–89.
Nielsen, E. E., Wright, P. J., Hemmer-Hansen, J., Poulsen, N. A., Gibb,I. M., and Meldrup, D. 2009. Microgeographical population struc-ture of cod Gadus morhua in the North Sea and west of Scotland:the role of sampling loci and individuals. Marine Ecology ProgressSeries, 376: 213–225.
Olsen, E. M., Heino, M., Lilly, G. R., Morgan, M. J., Brattey, J.,Ernande, B., and Dieckmann, U. 2004. Maturation trends indica-tive of rapid evolution preceded the collapse of northern cod.Nature, 428: 932–935.
Olsen, E. M., Knutsen, H., Gjøsæter, J., Jorde, P. E., Knutsen, J. A., andStenseth, N. Ch. 2008. Small-scale biocomplexity in coastalAtlantic cod supporting a Darwinian perspective on fisheries man-agement. Evolutionary Applications, 1: 524–533.
Olsen, E. M., and Moland, E. 2011. Fitness landscape of Atlantic codshaped by harvest selection and natural selection. EvolutionaryEcology, 25: 695–710.
Oosthuizen, E., and Daan, N. 1974. Egg fecundity and maturity ofNorth Sea cod, Gadus morhua. Netherlands Journal of SeaResearch, 8: 378–397.
Pardoe, H., Vainikka, A., Thordarson, G., Marteinsdottir, G., andHeino, M. 2009. Temporal trends in probabilistic maturation reac-tion norms and growth of Atlantic cod (Gadus morhua) on theIcelandic shelf. Canadian Journal of Fisheries and AquaticSciences, 66: 1719–1733.
Righton, D., Quayle, V. A., Hetherington, S., and Burt, G. 2007.Movements and distribution of cod (Gadus morhua L.) in thesouthern North Sea and English Channel: results from convention-al and electronic tagging experiments. Journal of the MarineBiological Association of the UK, 87: 599–613.
Rijnsdorp, A. D., Daan, N., van Beek, F. A., and Heessen, H. J. L. 1991.Reproductive variability in North Sea plaice, sole, and cod. ICESJournal of Marine Science, 47: 352–375.
Roff, D. A. 1992. The Evolution of Life Histories, Theory and Analysis.Chapman and Hall, New York.
Sharples, J., Ross, O. N., Scott, B. E., Greenstreet, S. P. R., and Fraser,H. 2006. Inter-annual variability in the timing of stratification andthe spring bloom in a temperate shelf sea. Continental ShelfResearch, 26: 733–751.
Skogen, M. D., Svendsen, E., Berntsen, J., Aksnes, D., and Ulvestad, K.B. 1995. Modelling the primary production in the North Sea usinga coupled 3 dimensional physical chemical biological ocean model.Estuarine, Coastal and Shelf Science, 41: 545–565.
Svedang, H., and Svenson, A. 2006. Cod (Gadus morhua L.) popu-lations as behavioural units: inference from time series on juvenilecod abundance in the Skagerrak. Journal of Fish Biology, 69:151–164.
Tobin, D., and Wright, P. J. 2011. Temperature effects on maturationin a temperate marine fish. Journal of Experimental MarineBiology and Ecology, 403: 9–13.
Trippel, E. A. 1995. Age at maturity as a stress indicator in fisheries.BioScience, 45: 759–771.
Van Dooren, T. J. M., Tully, T., and Ferriere, R. 2005. The analysis ofreaction norms for age and size at maturity using maturation ratemodels. Evolution, 59: 500–506.
Wright, P. J. 2007. Understanding the maturation process for fieldinvestigations of fisheries-induced evolution. Marine EcologyProgress Series, 335: 279–283.
Wright, P. J., Neat, F. C., Gibb, F. M., Gibb, I. M., and Thordarson, H.2006. Evidence for metapopulation structuring in cod from thewest of Scotland and North Sea. Journal of Fish Biology, 69:181–199.
Yoneda, M., and Wright, P. J. 2004. Temporal and spatial variation inreproductive investment of Atlantic cod Gadus morhua in thenorthern North Sea and Scottish west coast. Marine EcologyProgress Series, 276: 237–248.
Intrastock differences in maturation schedules of Atlantic cod 1927
Dow
nloaded from https://academ
ic.oup.com/icesjm
s/article/68/9/1918/666918 by guest on 22 June 2022
Copyright © 2022 FDOKUMEN