Work strain in midlife and 28-year work ability trajectories
10
Print ISSN: 0355-3140 Electronic ISSN: 1795-990X Copyright (c) Scandinavian Journal of Work, Environment & Health Downloaded from www.sjweh.fi on January 15, 2012 Original article Scand J Work Environ Health 2011;37(6):455-463 doi:10.5271/sjweh.3177 Work strain in midlife and 28-year work ability trajectories by von Bonsdorff ME, Kokko K, Seitsamo J, von Bonsdorff MB, Nygård C-H, Ilmarinen J, Rantanen T Affiliation: Gerontology Research Centre, Department of Health Sciences, University of Jyväskylä, PO Box 35 (Viveca), FI-40014 University of Jyväskylä, Finland. [email protected] Refers to the following texts of the Journal: 2010;36(5):404-412 1991;17 suppl 1:12-29 1991;17 suppl 1:128-134 1991;17 suppl 1:48-57 1991;17 suppl 1:67-74 1991;17 suppl 1:7-11 1991;17 suppl 1:87-93 2009;35(5):325-333 2009;35(1):1-5 2009;35(1):37-47 2008;0 suppl 6:33-40 2004;30(2):85-128 1997;23(6):403-413 2001;27(4):268-278 1997;23 suppl 1:49-57 The following article refers to this text: 2011;37(6):451-453 Key terms: ageing; development trajectory; mental work strain; physical work strain; work ability; work strain This article in PubMed: www.ncbi.nlm.nih.gov/pubmed/21695372
-
Upload
independent -
Category
Documents
-
view
4 -
download
0
Transcript of Work strain in midlife and 28-year work ability trajectories

Print ISSN: 0355-3140 Electronic ISSN: 1795-990X Copyright (c) Scandinavian Journal of Work, Environment & Health
Downloaded from www.sjweh.fi on January 15, 2012
Original articleScand J Work Environ Health 2011;37(6):455-463
doi:10.5271/sjweh.3177
Work strain in midlife and 28-year work ability trajectoriesby von Bonsdorff ME, Kokko K, Seitsamo J, von Bonsdorff MB,Nygård C-H, Ilmarinen J, Rantanen T
Affiliation: Gerontology Research Centre, Department of HealthSciences, University of Jyväskylä, PO Box 35 (Viveca), FI-40014University of Jyväskylä, Finland. [email protected]
Refers to the following texts of the Journal: 2010;36(5):404-412 1991;17 suppl 1:12-29 1991;17 suppl 1:128-134 1991;17 suppl1:48-57 1991;17 suppl 1:67-74 1991;17 suppl 1:7-11 1991;17suppl 1:87-93 2009;35(5):325-333 2009;35(1):1-5 2009;35(1):37-47 2008;0 suppl 6:33-40 2004;30(2):85-128 1997;23(6):403-413 2001;27(4):268-278 1997;23 suppl 1:49-57
The following article refers to this text: 2011;37(6):451-453
Key terms: ageing; development trajectory; mental work strain;physical work strain; work ability; work strain
This article in PubMed: www.ncbi.nlm.nih.gov/pubmed/21695372
Scand J Work Environ Health 2011, vol 37, no 6 455
Original articleScand J Work Environ Health. 2011;37(6):455–463. doi:10.5271/sjweh.3177
Work strain in midlife and 28-year work ability trajectoriesby Monika E von Bonsdorff, PhD,1, 2 Katja Kokko, PhD,3 Jorma Seitsamo, PhD,1 Mikaela B von Bonsdorff, PhD,2 Clas-Håkan Nygård, PhD,4 Juhani Ilmarinen, PhD,1 Taina Rantanen, PhD 2
von Bonsdorff ME, Kokko K, Seitsamo J, von Bonsdorff MB, Nygård C-H, Ilmarinen J, Rantanen T. Work strain in midlife and 28-year work ability trajectories. Scand J Work Environ Health. 2011;37(6):455–463. doi:10.5271/sjweh.3177
Objectives We investigated the 28-year development trajectories of work ability among initially middle-aged male and female municipal employees and the association of perceived mental and physical work strain in midlife by work ability trajectory groups.
Methods The baseline data of the Finnish longitudinal study of municipal employees (FLAME) were collected in 1981 (N=6257) with follow-ups in 1985, 1992, 1997, and 2009. Work ability was assessed in all the waves as present perceived work ability relative to lifetime best. Altogether, N=2690 had work ability data in 1981 and 2009, and at least for one wave in between these years, and were included in group-based semi-parametric mixture modeling trajectory analyses. Baseline differences in mental and physical work strain according to the work ability trajectories were assessed with MANCOVA (multivariate analysis of covariance).
Results A five-group work ability trajectory model was identified for men and a four-group model for women. For the majority, a linear decline from excellent to moderate or moderate to poor work ability was observed while non-linear trajectories with sudden collapse and, in some cases, modest subsequent recovery of work ability were also observed. Individuals who maintained their work ability on an excellent-to-moderate level throughout the follow-up more often reported low mental and physical work strain in midlife.
Conclusions A substantial proportion of individuals seem to maintain their work ability on a moderate level from midlife to old age. Work strain may have far-reaching negative effects on individuals’ work ability from midlife to old age, warranting vigilance in maintaining and promoting work ability throughout the lifespan.
Key terms ageing; development trajectory; mental work strain; physical work strain.
1 Finnish Institute of Occupational Health, Helsinki, Finland.2 Gerontology Research Centre, Department of Health Sciences, University of Jyväskylä, Jyväskylä, Finland.3 Department of Psychology, University of Jyväskylä, Jyväskylä, Finland.4 Tampere School of Public Health, University of Tampere, Tampere, Finland.
Correspondence to: Monika von Bonsdorff, Gerontology Research Centre, Department of Health Sciences, University of Jyväskylä, PO Box 35 (Viveca), FI-40014 University of Jyväskylä, Finland. [E-mail: [email protected]]
Work is a central activity in adult life and a resource for satisfying economic and social needs. Physical and psychological job demands influence our health, well-being, and longevity in many ways (1, 2). Physical job demands, such as repetitive movements, awkward posture, and pace have been associated with morbid-ity (3–5), disability retirement (6), and even mortality (7, 8). According to recent Finnish research, a fourth of employees rate their work as physically demanding (9). Psychological job strain has been linked to an early exit from working life (10) and mortality (11, 12), and jobs characterized by high demands and low control and social support are significant predictors of coronary heart disease (13, 14).
Work ability, a concept based on the stress–strain model (15, 16) and developed by Finnish occupational health specialists, can be defined as equilibrium between employees’ perception of the demands of his or her job and his or her ability and resources to cope with those demands (17). Individual factors, health and fitness, lifestyle, and work demands are the strongest predic-tors of work ability (18–20). Earlier analyses based on a shorter follow-up of current data have shown that work ability declines from midlife onwards (21) and decreased work ability predicts work disability, spells of sickness absence, and early retirement from employment (22–24). Only little is known about the changes in work ability during retirement. However, midlife work ability
456 Scand J Work Environ Health 2011, vol 37, no 6
Midlife work strain according to work ability trajectories
was found to correlate with old age disability among women and with mortality among men (25).
Studying age-related changes using development trajectories requires prospective data on the same indi-viduals with at least three follow-ups. This type of an analytical approach brings about features such as attri-tion due to selective mortality and non-linear changes that are typical for aging studies. In this study, we used development trajectories to capture the possible non-linear changes in work ability during the 28-year follow-up. Only people who survived the entire follow-up were included in analyses. Development trajectories group individuals into different latent groups based on similarity of observed changes over time (26–28). Our second aim was to investigate the association of perceived mental and physical work strain in midlife with subsequent work ability trajectories stretching over 28 years.
Methods
The Finnish longitudinal study on municipal employ-ees (FLAME) by the Finnish Institute of Occupational Health (29) targeted 7344 municipal employees aged 44–58 years chosen randomly from all persons working in municipal occupations in Finland at baseline in 1981. The baseline cohort consisted of 6257 employees. Data on work ability were available for 5971 respondents (81.3% out of the target population, 45.4% men). Since the first questionnaire on various work, health, and lifestyle factors was sent out in 1981, four consecutive follow-up data collections have taken place: in 1985, 1992, 1997, and 2009. The Ethical Committee of the Finnish Institute of Occupational Health approved the follow-up study among ageing municipal employees. Data on mortality was obtained from the Population Register Centre in 2009.
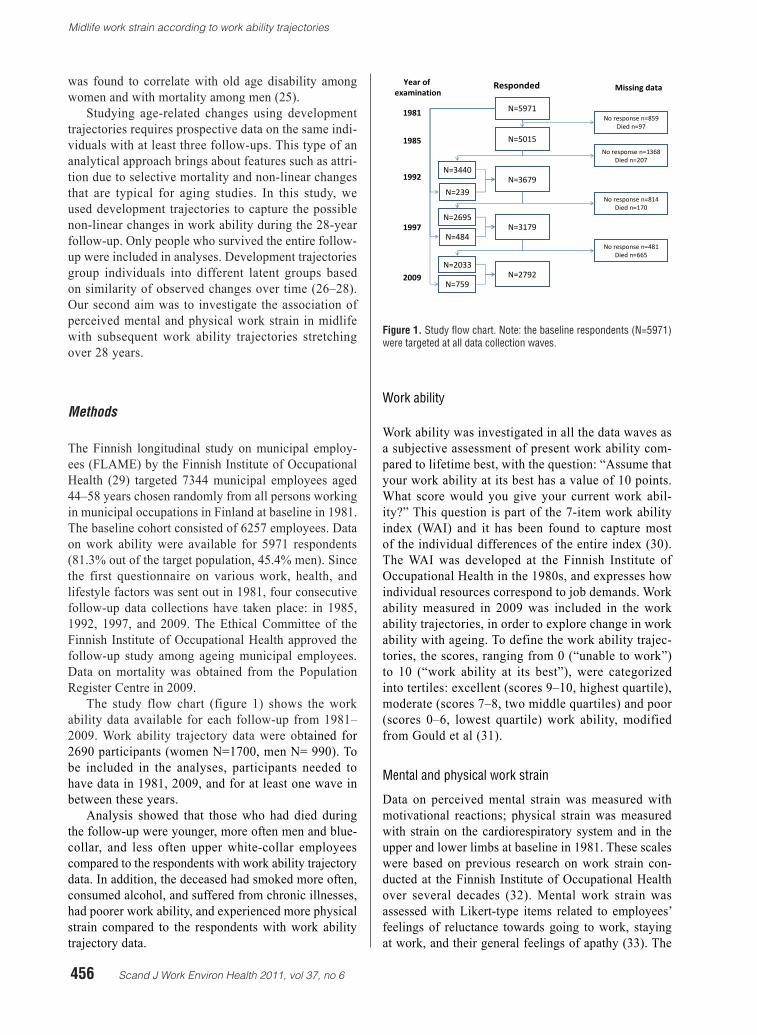
The study flow chart (figure 1) shows the work ability data available for each follow-up from 1981–2009. Work ability trajectory data were obtained for 2690 participants (women N=1700, men N= 990). To be included in the analyses, participants needed to have data in 1981, 2009, and for at least one wave in between these years.
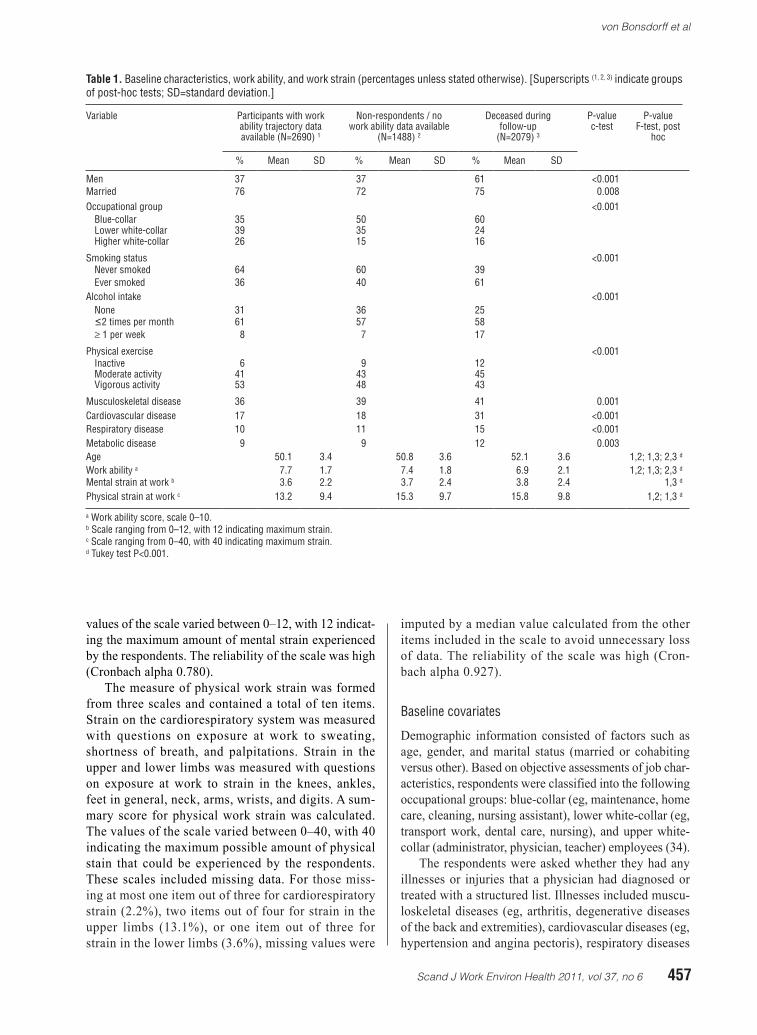
Analysis showed that those who had died during the follow-up were younger, more often men and blue-collar, and less often upper white-collar employees compared to the respondents with work ability trajectory data. In addition, the deceased had smoked more often, consumed alcohol, and suffered from chronic illnesses, had poorer work ability, and experienced more physical strain compared to the respondents with work ability trajectory data.
Work ability
Work ability was investigated in all the data waves as a subjective assessment of present work ability com-pared to lifetime best, with the question: “Assume that your work ability at its best has a value of 10 points. What score would you give your current work abil-ity?” This question is part of the 7-item work ability index (WAI) and it has been found to capture most of the individual differences of the entire index (30). The WAI was developed at the Finnish Institute of Occupational Health in the 1980s, and expresses how individual resources correspond to job demands. Work ability measured in 2009 was included in the work ability trajectories, in order to explore change in work ability with ageing. To define the work ability trajec-tories, the scores, ranging from 0 (“unable to work”) to 10 (“work ability at its best”), were categorized into tertiles: excellent (scores 9–10, highest quartile), moderate (scores 7–8, two middle quartiles) and poor (scores 0–6, lowest quartile) work ability, modified from Gould et al (31).
Mental and physical work strain
Data on perceived mental strain was measured with motivational reactions; physical strain was measured with strain on the cardiorespiratory system and in the upper and lower limbs at baseline in 1981. These scales were based on previous research on work strain con-ducted at the Finnish Institute of Occupational Health over several decades (32). Mental work strain was assessed with Likert-type items related to employees’ feelings of reluctance towards going to work, staying at work, and their general feelings of apathy (33). The
N=5015
N=3679
N=5971
No response n=1368Died n=207
No response n=814Died n=170
No response n=481Died n=665
No response n=859Died n=97
1981
1985
1992
1997
2009
Year of examination
Responded Missing data
Note. The baseline respondents (N=5971) were targeted at all data collection waves.
N=239
N=3440
N=3179N=484
N=2695
N=2792N=759
N=2033
Figure 1. Study flow chart
Figure 1. Study flow chart. Note: the baseline respondents (N=5971) were targeted at all data collection waves.
Scand J Work Environ Health 2011, vol 37, no 6 457
von Bonsdorff et al
values of the scale varied between 0–12, with 12 indicat-ing the maximum amount of mental strain experienced by the respondents. The reliability of the scale was high (Cronbach alpha 0.780).
The measure of physical work strain was formed from three scales and contained a total of ten items. Strain on the cardiorespiratory system was measured with questions on exposure at work to sweating, shortness of breath, and palpitations. Strain in the upper and lower limbs was measured with questions on exposure at work to strain in the knees, ankles, feet in general, neck, arms, wrists, and digits. A sum-mary score for physical work strain was calculated. The values of the scale varied between 0–40, with 40 indicating the maximum possible amount of physical stain that could be experienced by the respondents. These scales included missing data. For those miss-ing at most one item out of three for cardiorespiratory strain (2.2%), two items out of four for strain in the upper limbs (13.1%), or one item out of three for strain in the lower limbs (3.6%), missing values were
imputed by a median value calculated from the other items included in the scale to avoid unnecessary loss of data. The reliability of the scale was high (Cron-bach alpha 0.927).
Baseline covariates
Demographic information consisted of factors such as age, gender, and marital status (married or cohabiting versus other). Based on objective assessments of job char-acteristics, respondents were classified into the following occupational groups: blue-collar (eg, maintenance, home care, cleaning, nursing assistant), lower white-collar (eg, transport work, dental care, nursing), and upper white-collar (administrator, physician, teacher) employees (34).
The respondents were asked whether they had any illnesses or injuries that a physician had diagnosed or treated with a structured list. Illnesses included muscu-loskeletal diseases (eg, arthritis, degenerative diseases of the back and extremities), cardiovascular diseases (eg, hypertension and angina pectoris), respiratory diseases
Table 1. Baseline characteristics, work ability, and work strain (percentages unless stated otherwise). [Superscripts (1, 2, 3) indicate groups of post-hoc tests; SD=standard deviation.]
Variable Participants with work ability trajectory data available (N=2690) 1
Non-respondents / no work ability data available
(N=1488) 2
Deceased during follow-up
(N=2079) 3
P-value c-test
P-value F-test, post
hoc
% Mean SD % Mean SD % Mean SD
Men 37 37 61 <0.001Married 76 72 75 0.008Occupational group <0.001
Blue-collar 35 50 60Lower white-collar 39 35 24Higher white-collar 26 15 16
Smoking status <0.001Never smoked 64 60 39Ever smoked 36 40 61
Alcohol intake <0.001None 31 36 25≤2 times per month 61 57 58≥ 1 per week 8 7 17
Physical exercise <0.001Inactive 6 9 12Moderate activity 41 43 45Vigorous activity 53 48 43
Musculoskeletal disease 36 39 41 0.001Cardiovascular disease 17 18 31 <0.001Respiratory disease 10 11 15 <0.001Metabolic disease 9 9 12 0.003Age 50.1 3.4 50.8 3.6 52.1 3.6 1,2; 1,3; 2,3 d
Work ability a 7.7 1.7 7.4 1.8 6.9 2.1 1,2; 1,3; 2,3 dMental strain at work b 3.6 2.2 3.7 2.4 3.8 2.4 1,3 d
Physical strain at work c 13.2 9.4 15.3 9.7 15.8 9.8 1,2; 1,3 d
a Work ability score, scale 0–10.b Scale ranging from 0–12, with 12 indicating maximum strain.c Scale ranging from 0–40, with 40 indicating maximum strain.d Tukey test P<0.001.
458 Scand J Work Environ Health 2011, vol 37, no 6
Midlife work strain according to work ability trajectories
(eg, chronic obstructive pulmonary disease and asthma), and metabolic diseases (eg, diabetes and obesity). Life-style factors such as smoking (never smoked or ever smoked), alcohol consumption (never, twice a month at most, or at least once a week), and physical activity during previous year (inactive, moderate activity once a week at most, or vigorous activity at least once a week) were also raised in the questionnaires. These variables were considered as potential confounders when explor-ing differences in the work ability trajectories according to work-related physical and mental strain.
Statistical analysis
Differences in descriptive statistics and work strain at baseline according to study participation were tested with χ2-test or, by two-tailed analysis of covariance (ANOVA) using SPSS 18.0 (IBM Corporation, Somers, NY, USA) with a significance level of P<0.05. Trajec-tories of work ability for the 28-year follow-up were analyzed using group-based semi-parametric mixture modeling (26, 27). This method of analysis allows researchers to identify distinct subgroups of individu-als following different latent development trajectories among the study population. In addition, it enables estimation of the proportion of the study population following each trajectory, as well as the assessment of which of the trajectory groups each individual is most likely to belong. The trajectories could vary in level of work ability, as well as in the shape of its development course, which meant that we could identify development trajectories (eg, with quadratic forms).
To be included in the trajectory analyses, participants needed to have data in 1981, 2009, and for at least one wave (1985, 1992 or 1997) in between (N=2690). The Bayesian information criterion (BIC) was used to deter-mine the optimal number of groups when estimating the model for the work ability trajectories. In accordance with Nagin’s suggestion (26–27), the model with the lowest BIC value was selected out of the different tra-jectory models. According to the maximum likelihood probability rule, individuals on a given trajectory should have a higher mean probability of assignment to this group than to any of the other groups. A mean value of 0.80 or higher is generally considered to indicate good model fit to the data (27). In this study, all of the mean values levels were satisfactory. Besides being selected purely on the basis of statistical criteria, the model should capture the unique features of the data in as parsi-monious a way as possible (27). Hence, we selected the final models based on the BIC value and the size and the interpretability. The trajectory analysis was performed with an SAS 9.1-based TRAJ procedure (SAS Institute, Cary, NC, USA).
Baseline differences in mental and physical work
strain according to the work ability trajectory groups were determined by using multivariate analysis of cova-riance (MANCOVA, SPSS 18.0). This test allowed us to explore whether statistically significant between-group differences in work strain could be detected. The work ability trajectory was set as a fixed factor. As we were interested in baseline differences in the work ability tra-jectories according to work strain, the age, marital status, occupational group, illnesses, and lifestyle factors acted as covariates in the analysis (35, 36). Separate models were estimated for men and women. In order to meet the homogeneity of variance assumption in MANCOVA, a square root transformation was performed for both the mental and physical work strain variables. In accordance with the MANCOVA assumptions, a sufficient correla-tion existed between the dependent variables (r=0.255).
Results
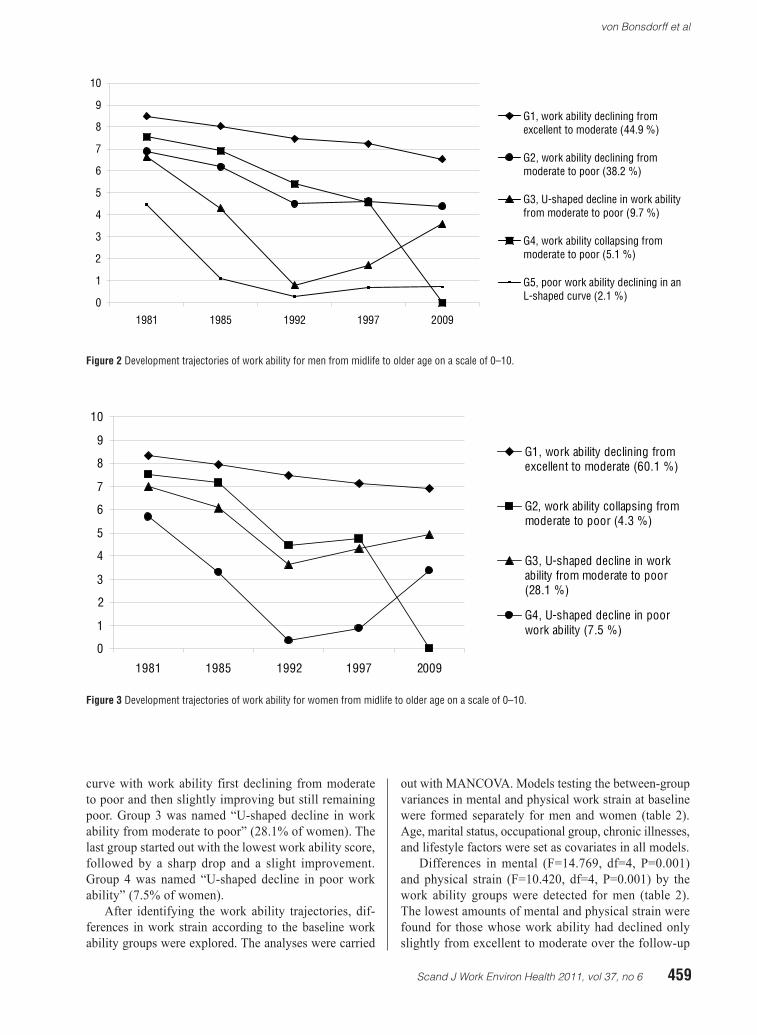
A five-group trajectory model on work ability was selected for the men (figure 2). All of the trajectories followed a quadratic shape. The first group consisted of men with excellent work ability declining slightly and reaching moderate work ability during the follow-up. Group 1 was named “work ability declining from excellent to moderate” (44.9% of men). In the second group, work ability declined slightly from moderate, flattening out as poor. Group 2 was named “work ability declining from moderate to poor” (38.2% of men). In the third group work ability had started out as moderate and then declined rapidly, ending up as poor even after a slight improvement after the initial decline. Group 3 was named “U-shaped decline in work ability from moder-ate to poor” (9.7% of men). In the fourth group, work ability showed a dramatic drop from the starting level of moderate to poor by the end of the follow-up. Group 4 was named “work ability collapsing from moderate to poor” (5.1% of men). In the final group, we found a rapid decline in work ability from the starting level of poor and finally reaching a plateau. Group 5 was named “poor work ability declining in an L-shaped curve” (2.1% of men).
For women, a four-group trajectory model on work ability was selected (figure 3). As with the men, the women’s work ability trajectories also took quadratic forms. In the first group, we found excellent work abil-ity slightly declining to moderate during the follow-up. Group 1 was named “work ability declining from excel-lent to moderate” (60.1% of women). In the second group, we found a dramatic drop in work ability from moderate to poor during the follow-up. Group 2 was named “work ability collapsing from moderate to poor” (4.3% of women). The third group showed a U-shaped
Scand J Work Environ Health 2011, vol 37, no 6 459
von Bonsdorff et al
curve with work ability first declining from moderate to poor and then slightly improving but still remaining poor. Group 3 was named “U-shaped decline in work ability from moderate to poor” (28.1% of women). The last group started out with the lowest work ability score, followed by a sharp drop and a slight improvement. Group 4 was named “U-shaped decline in poor work ability” (7.5% of women).
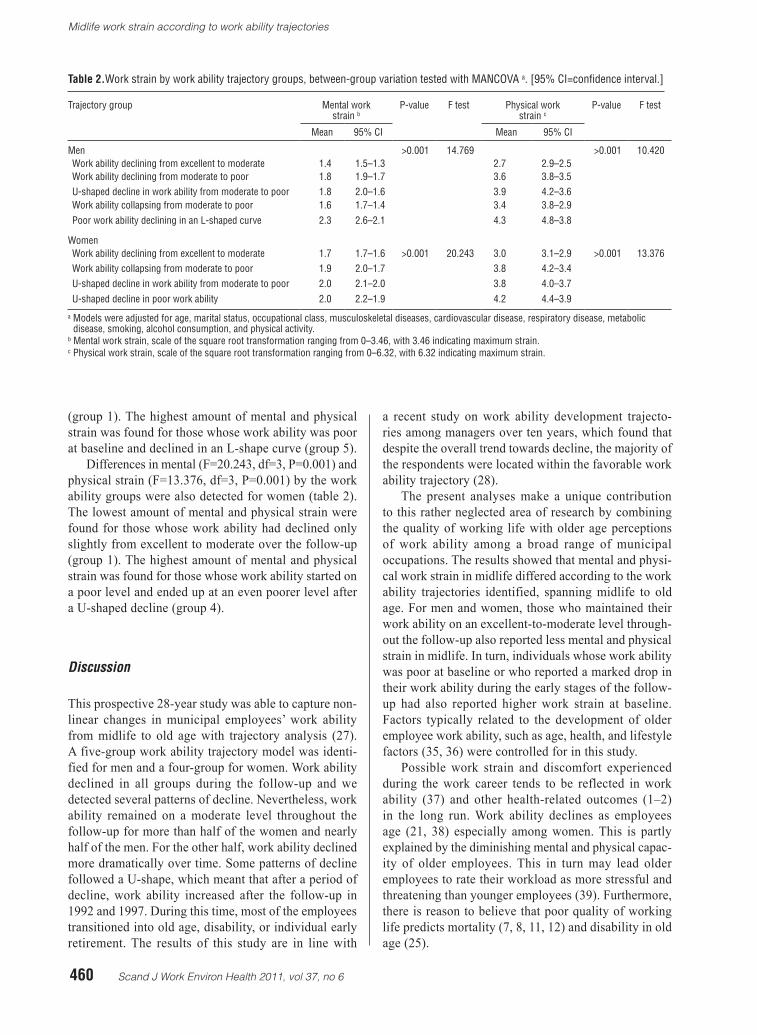
After identifying the work ability trajectories, dif-ferences in work strain according to the baseline work ability groups were explored. The analyses were carried
out with MANCOVA. Models testing the between-group variances in mental and physical work strain at baseline were formed separately for men and women (table 2). Age, marital status, occupational group, chronic illnesses, and lifestyle factors were set as covariates in all models.
Differences in mental (F=14.769, df=4, P=0.001) and physical strain (F=10.420, df=4, P=0.001) by the work ability groups were detected for men (table 2). The lowest amounts of mental and physical strain were found for those whose work ability had declined only slightly from excellent to moderate over the follow-up
Figure 2 Development trajectories of work ability for men from midlife to older age on a scale of 0–10.
Figure 3 Development trajectories of work ability for women from midlife to older age on a scale of 0–10.
0
1
2
3
4
5
6
7
8
9
10
1981 1985 1992 1997 2009
G1, work ability declining fromexcellent to moderate (44.9 %)
G2, work ability declining frommoderate to poor (38.2 %)
G3, U-shaped decline in work abilityfrom moderate to poor (9.7 %)
G4, work ability collapsing frommoderate to poor (5.1 %)
G5, poor work ability declining in anL-shaped curve (2.1 %)
0
1
2
3
4
5
6
7
8
9
10
1981 1985 1992 1997 2009
G1, work ability declining fromexcellent to moderate (60.1 %)
G2, work ability collapsing frommoderate to poor (4.3 %)
G3, U-shaped decline in workability from moderate to poor(28.1 %)
G4, U-shaped decline in poorwork ability (7.5 %)
460 Scand J Work Environ Health 2011, vol 37, no 6
Midlife work strain according to work ability trajectories
(group 1). The highest amount of mental and physical strain was found for those whose work ability was poor at baseline and declined in an L-shape curve (group 5).
Differences in mental (F=20.243, df=3, P=0.001) and physical strain (F=13.376, df=3, P=0.001) by the work ability groups were also detected for women (table 2). The lowest amount of mental and physical strain were found for those whose work ability had declined only slightly from excellent to moderate over the follow-up (group 1). The highest amount of mental and physical strain was found for those whose work ability started on a poor level and ended up at an even poorer level after a U-shaped decline (group 4).
Discussion
This prospective 28-year study was able to capture non-linear changes in municipal employees’ work ability from midlife to old age with trajectory analysis (27). A five-group work ability trajectory model was identi-fied for men and a four-group for women. Work ability declined in all groups during the follow-up and we detected several patterns of decline. Nevertheless, work ability remained on a moderate level throughout the follow-up for more than half of the women and nearly half of the men. For the other half, work ability declined more dramatically over time. Some patterns of decline followed a U-shape, which meant that after a period of decline, work ability increased after the follow-up in 1992 and 1997. During this time, most of the employees transitioned into old age, disability, or individual early retirement. The results of this study are in line with
a recent study on work ability development trajecto-ries among managers over ten years, which found that despite the overall trend towards decline, the majority of the respondents were located within the favorable work ability trajectory (28).
The present analyses make a unique contribution to this rather neglected area of research by combining the quality of working life with older age perceptions of work ability among a broad range of municipal occupations. The results showed that mental and physi-cal work strain in midlife differed according to the work ability trajectories identified, spanning midlife to old age. For men and women, those who maintained their work ability on an excellent-to-moderate level through-out the follow-up also reported less mental and physical strain in midlife. In turn, individuals whose work ability was poor at baseline or who reported a marked drop in their work ability during the early stages of the follow-up had also reported higher work strain at baseline. Factors typically related to the development of older employee work ability, such as age, health, and lifestyle factors (35, 36) were controlled for in this study.
Possible work strain and discomfort experienced during the work career tends to be reflected in work ability (37) and other health-related outcomes (1–2) in the long run. Work ability declines as employees age (21, 38) especially among women. This is partly explained by the diminishing mental and physical capac-ity of older employees. This in turn may lead older employees to rate their workload as more stressful and threatening than younger employees (39). Furthermore, there is reason to believe that poor quality of working life predicts mortality (7, 8, 11, 12) and disability in old age (25).
Table 2.Work strain by work ability trajectory groups, between-group variation tested with MANCOVA a. [95% CI=confidence interval.]
Trajectory group Mental work strain b
P-value F test Physical work strain c
P-value F test
Mean 95% CI Mean 95% CI
Men >0.001 14.769 >0.001 10.420Work ability declining from excellent to moderate 1.4 1.5–1.3 2.7 2.9–2.5Work ability declining from moderate to poor 1.8 1.9–1.7 3.6 3.8–3.5U-shaped decline in work ability from moderate to poor 1.8 2.0–1.6 3.9 4.2–3.6Work ability collapsing from moderate to poor 1.6 1.7–1.4 3.4 3.8–2.9Poor work ability declining in an L-shaped curve 2.3 2.6–2.1 4.3 4.8–3.8
WomenWork ability declining from excellent to moderate 1.7 1.7–1.6 >0.001 20.243 3.0 3.1–2.9 >0.001 13.376Work ability collapsing from moderate to poor 1.9 2.0–1.7 3.8 4.2–3.4U-shaped decline in work ability from moderate to poor 2.0 2.1–2.0 3.8 4.0–3.7U-shaped decline in poor work ability 2.0 2.2–1.9 4.2 4.4–3.9
a Models were adjusted for age, marital status, occupational class, musculoskeletal diseases, cardiovascular disease, respiratory disease, metabolic disease, smoking, alcohol consumption, and physical activity.
b Mental work strain, scale of the square root transformation ranging from 0–3.46, with 3.46 indicating maximum strain.c Physical work strain, scale of the square root transformation ranging from 0–6.32, with 6.32 indicating maximum strain.
Scand J Work Environ Health 2011, vol 37, no 6 461
von Bonsdorff et al
Baseline differences in work strain according to work ability in this study may indicate that employees in low-strain work are likely to report better subsequent work ability and that those experiencing high work strain in midlife are likely to report poor work ability in later life. This interpretation would hold true especially for those individuals whose work ability remained excellent or moderate from midlife to old age and for those whose work ability improved after retirement at the follow-ups in 1992 and 1997. Previous studies have found that work demands and physical condition are some of the strongest predictors of work ability (18–20) and that work-related musculoskeletal and mental strain predict poor work ability, especially in the presence of disease and high workload among middle-aged employ-ees (37). The alternative explanation of the current findings would be that consistently good work ability in midlife protects individuals from experiencing men-tal or physical work-related strain in midlife. However, the latter explanation is not the most likely one, since the effects of ageing on work ability argue against it. In addition, in the previous phases of the follow-up, the present participants have reported increasing levels of mental and physical work strain (40).
Evaluation of the study
The strengths of this study include the long prospective follow-up in a large population-based dataset consisting of a wide variety of municipal occupations. Men and women were both represented in the study. In addition, work ability is a validated measure, which has been described as activity that is the result of the balance achieved between work demands and strain and the individual’s resources and ability to cope with these fac-tors (17). As the data were reported by the employees themselves, some self-report bias might have influenced the results. Furthermore, it can be argued that work abil-ity measured in old age is not a valid measure for the resource-demand equilibrium. However, the participants were asked to evaluate their current work ability against their lifetime best. All of the respondents have been in working life for many years and can be assumed to be familiar with what paid employment entails. However, we do not know whether the person would consider being able to work in the same profession as before. Our conclu-sion is that a substantial proportion of the retired partici-pants considered their work ability to be moderate. This evaluation corresponds to a situation where middle-aged people generally are capable to perform their work tasks.
Another potential limitation in the analyses is the selective dropout from the study, which is inevitable in long-term prospective designs. The “healthy worker survivor effect” is an ongoing process where those who stay in a specific occupation tend to be healthier than
those who exit employment (41). The attrition analysis showed that respondents who were included in the trajectory analysis were slightly younger, more often upper white-collar employees, had slightly better work ability, and experienced less work-related physical strain at baseline compared to those who died during the follow-up or did not respond to the questionnaire. As a result of this selection in the data, our results may be an underestimation of the individuals with declining work ability trajectories over time as well as those who at baseline experienced physical work strain.
Caution must be taken when generalizing the results to the population level, as occupational groups tend to be healthier than the general population, which includes persons outside the workforce. Hence, our findings are applicable to municipal settings in Western countries. This study did not explore the potential effect transi-tioning into retirement may have on the development of work ability. Pre- and post-retirement work ability data, combined with register-based retirement data could help us understand the effect retirement has on individuals work ability and their capacity to function in old age.
Concluding remarks
Our study showed that work ability remained on a mod-erate level throughout the follow-up for more than half of the women and nearly half of the men. This number equaled more than 16% of the men and 31% of the women out of the baseline cohort. Perceived mental and physi-cal work strain in midlife differed according to the work ability trajectories identified. Those who maintained their work ability on an excellent-to-moderate level throughout the follow-up had reported less mental and physical work-related strain in midlife. It is plausible that employees in low-stress occupations experience better subsequent work ability and that those reporting high work strain in midlife are more likely to suffer from poor work ability in later life. Work strain may have far-reaching negative effects on individuals’ work ability from midlife to old age, warranting vigilance in maintaining and promoting work ability throughout the lifespan.
Acknowledgements
We thank Markku Kauppinen, MSc, for providing assis-tance with the statistics. ME von Bonsdorff was funded by the University Alliance Finland, University of Jyväs-kylä. MB von Bonsdorff was funded by Academy of Finland (grant 132597). K Kokko was funded by the Academy of Finland (grants 118316 and 135347).
The Local Government Pension Institution contrib-uted to the gathering of the data.
462 Scand J Work Environ Health 2011, vol 37, no 6
Midlife work strain according to work ability trajectories
References
1. Pavalko EK, Elder GH, Clipp EC. Worklives and longevity: Insights from a life course perspective. J Health Soc Behav. 1993;34:363–80. doi:10.2307/2137373
2. Amick BC, McDonough P, Chang H, Rogers WH, Pieper CF, Duncan G. Relationship between all-cause mortality and cumulative working life course psychosocial and physical exposures in the United States labor market from 1968 to 1992. Psychosom Med. 2002;64:370–81.
3. Buckle P. Upper limb disorders and work: The importance of physical and psychosocial factors. J Psychosom Res. 1997;43:17–25. doi:10.1016/S0022-3999(96)00394-7.
4. Leclerc A, Landre M-F, Chastang J-F, Niedhammer I, Roquelaure Y, the Study Group on Repetitive work. Upper-limb disorders in repetitive work. Scand J Work Environ Health. 2001;27:268–78.
5. Melchior M, Roquelaure B, Evanoff B, Chastang J-F, Ha C, Imbernon E, et al. Why are manual workers at risk of upper limb disorders? The role of physical work factors in a random sample of workers in France (the Pays de la Loire study). Occup Environ Med. 2006;63:754–61. doi:10.1136/oem.2005.025122.
6. Krause N, Lynch J, Kaplan GA, Cohen RD, Goldberg DF, Salonen JT. Predictors of disability retirement. Scand J Work Environ Health. 1997;23:403–13.
7. Kristal-Boneh E, Harari G, Melamed S, Froom P. Association of physical activity at work with mortality in Israeli industrial employees: the CORDIS study. J Occup Environ Med. 2000;42:127–35. doi:10.1097/00043764-200002000-00005.
8. Bourgkard E, Wild P, Massin N, Meyer J-P, Otero Sierra C, Fontana J-M, et al. Association of physical job demands, smoking and alcohol abuse with subsequent premature mortality: A 9-year follow-up population-based study. J Occup Health. 2008;50:31–40. doi:10.1539/joh.50.31.
9. Perkkiö-Mäkelä M, Hirvonen M, Elo A-L, Kandolin I, Kauppinen K, Kauppinen T, et al. Työ ja Terveys Haastattelututkimus 2009 [The Work and Health Interview Study 2009]. Helsinki: The Finnish Institute of Occupational Health. 2010. Available from: http://www.ttl.fi/fi/verkkokirjat/tyo_ja_terveys_suomessa/Sivut/default.aspx
10. Laine S, Gimeno D, Virtanen M, Oksanen T, Vahtera J, Elovainio M, et al. Job strain as a predictor of disability pension: The Finnish public sector study. J Epidemiol Community Health. 2009;63:24–30. doi:10.1136/jech.2007.071407.
11. Kivimäki M, Leino-Arjas P, Luukkonen R, Riihimäki H, Vahtera J, Kirjonen J. Work stress and risk of cardiovascular mortality: Prospective cohort study of industrial employees. BMJ. 2002;325:857. doi:10.1136/bmj.325.7369.857.
12. Niedhammer I, Bourgkard E, Chau N, The Lorhandicap Study Group. Occupational and behavioural factors in the explanation of social inequalities in premature and total mortality: a 12.5-year follow-up in the Lorhandicap study. Eur J Epidemiol. 2011 Jan;26(1):1–12.
13. Belkic KL, Landsbergis PA, Schnall PL, Baker D. Is job strain a major source of cardiovascular disease risk? Scand J Work Environ Health. 2004;30:85–128.
14. Kivimäki M, Vahtera J, Elovainio M, Keltikangas-Järvinen L, Virtanen M, Hintsanen M, et al. What are the next steps for research on work stress and coronary heart disease? SJWEH Supplements 2008;(no 6):33–40
15. Rutenfranz J, Hettinger T, Ilmarinen J, Klimmer F. Beurtailung der eignung zu schwerer körperlicher arbeit. [Evaluating employees suitableness to heavy manual labor]. In H Drasche, H-G Essing H-J Florian et al. (eds). Ökologischer Kurs [Ecology course]; Teil Arbitsmedizin. Stuttgart: Enke. 1976; p12–24.
16. Rutenfranz J. Arbeitspsychologie [Work Psychology ]. In H Valentin, G Lehnert, H Petry. (eds). Arbeitspsychologie und Arbeitshygiene. Grundlagen für Prävention und Begutachtung. 3 auflage [Work psychology and work hygienic. Basics for prevention and evaluation. Third edition.]. Stuttgart – New York: Thieme. 1985; p22-144.
17. Ilmarinen J. Work ability - a comprehensive concept for occupational health research and prevention. Scand J Work Environ Health. 2009;35:1–5.
18. Ilmarinen J, Tuomi K, Klockars M. Changes in work ability of active employees over an 11-year period. Scand J Work Environ Health. 1997;23 Suppl 1:49–57.
19. Alavinia SM, de Boer AGEM, van Duivenbooden JC, Frings-Dresen MHW, Burdorf A. Determinants of work ability and its predictive value for disability. Occup Med. 2009;59:32–7.doi:10.1093/occmed/kqn148.
20. van den Berg TIJ, Elders LAM, de Zwart BCH, Burdorf A. The effects of work-related and individual factors on the Work Ability Index: A systematic review. Occup Environ Med. 2009;66:211–20. doi:10.1136/oem.2008.039883.
21. Ilmarinen J, Tuomi K. Past, present and future of work ability. People and Work research reports. Helsinki: Finnish Institute of Occupational Health. 2004;65:1–25.
22. Alavinia S, van den Berg TIJ, van Duivenbooden C, Elders LAM, Burdorf A. Impact of work-related factors, lifestyle, and work ability on sickness absence among Dutch construction workers. Scand J Work Environ Health 2009;35:325–33.
23. Sell L, Bultmann U, Rugulies R, Villadsen E, Faber A, Sogaard K. Predicting long-term sickness absence and early retirement pension from self-reported work ability. Int Arch Occup Environ Health. 2009;82:1133–8. doi:10.1007/s00420-009-0417-6.
24. Ahlstrom L, Grimby-Ekman A, Hagberg M, Dellve L. The work ability index and single-item question: associations with sick leave, symptoms, and health – a prospective study of women on long-term sick leave. Scand J Work Environ Health. 2010;36:404–12.
25. von Bonsdorff MB, Seitsamo J, Ilmarinen J, Nygård C-H, von Bonsdorff ME, Rantanen T. Midlife work ability as a predictor of mortality and late-life disability: A 28-year prospective study. CMAJ. 2011;183:E235–42. doi:10.1503/cmaj.100713.
26. Nagin DS. Analyzing development trajectories: a semi-
Scand J Work Environ Health 2011, vol 37, no 6 463
von Bonsdorff et al
parametric, group-based approach. Psychol Methods. 1999;4:139–77. doi:10.1037/1082-989X.4.2.139.
27. Nagin DS. Group-based modeling of development. Boston MA: Harvard University Press; 2005.
28. Feldt T, Hyvönen K, Mäkikangas A, Kinnunen U, Kokko K. Development trajectories of Finnish managers’ work ability over a 10-year follow-up period. Scand J Work Environ Health. 2009;35:37–47.
29. Ilmarinen J, Tuomi K, Eskelinen L, Nygård C-H, HuuhtanenP, Klockars M. Background and objectives of the Finnish research project on aging workers in municipal occupations. Scand J Work Environ Health 1991;17 Suppl 1:7–11.
30. Tuomi K, Ilmarinen J, Eskelinen L, Järvinen E, Toikkanen J, Klockars M. Prevalence and incidence rates of diseases and work ability in different work categories of municipal occupations. Scand J Work Environ Health 1991;17 Suppl 1:67–74.
31. Gould R, Koskinen S, Seitsamo J, Tuomi K, Polvinen A, Sainio P. Data and methods. In: Gould R, Ilmarinen J, Järvisalo J et al., editors. Dimensions of work ability. Results from the Health 2000 Survey. Helsinki: Finnish Centre for Pensions; 2008. p. 25–34.
32. Eskelinen L, Toikkanen J, Tuomi K, Mauno I, Nygård C-H, Klockars M, et al. Work-related stress symptoms of ageing employees in municipal occupations. Scand J Work Environ Health. 1991;17 Suppl 1:87–93.
33. von Bonsdorff ME, Huuhtanen P, Tuomi K, Seitsamo J. Predictors of employees’ early retirement intentions: an 11-year longitudinal study. Occup Med (Lond). 2010 Mar;60(2):94–100.
34. Ilmarinen J, Suurnäkki T, Nygard CH, Landau K. Classification of municipal occupations. Scand J Work Environ Health. 1991;17 Suppl 1:12–29.
35. World Health Organization (WHO). Aging and working capacity: report of a WHO study group. WHO technical series 835. Geneva: WHO. 1993.
36. Tuomi K, Ilmarinen J, Klockars M, Nygård C-H, Seitsamo J, Huuhtanen P, et al. Finnish research project on aging workers in 1981-1992. Scand J Work Environ Health. 1997;17 Suppl 1:7–12.
37. Tuomi K, Eskelinen L, Toikkanen J, Jarvinen E, Ilmarinen J, Klockars M. Work load and individual factors affecting work ability among municipal employees. Scand J Work Environ Health. 1991;17 Suppl 1:128–34
38. Gould R, Polvinen A. Work ability in late career. In Gould R, Ilmarinen J, Järvisalo J, Koskinen S, editors. Dimensions of work ability. Results of the Health 2000 survey. Helsinki: Finnish Centre of Pensions, The Social Insurance Institution, National Public Health Institute and Finnish Institute of Occupational Health; 2008. p. 139–50.
39. Wang M, Shultz KS. Employee retirement: A review and recommendations for future investigation. J Manag. 2010;36:172–206. doi:10.1177/0149206309347957.
40. Huuhtanen P, Nygård CH, Tuomi K, Martikainen R. Changes in stress symptoms and their relationship to changes at work in 1981-1992 among elderly workers in municipal occupations. Scand J Work Environ Health. 1997;17 Suppl 1:48–57.
41. Wunsch G, Duchene J, Thiltges E, Salhi M. Socio-economic differences in mortality. A life course approach. Eur J Popul. 1996;12:167–85. doi:10.1007/BF01797082.
Received for publication: 21 March 2011