Gender and life course occupational social class differences in trajectories of functional...
10
Journal of Gerontology: MEDICAL SCIENCES Published by Oxford University Press on behalf of The Gerontological Society of America 2011. Cite journal as: J Gerontol A Biol Sci Med Sci. 2011 December;66A(12):1350–1359 Advance Access published on August 22, 2011 doi:10.1093/gerona/glr139 1350 T HE aging of the world’s population is a large challenge facing government health and welfare agencies (1). Policy makers recognize that the promotion of healthy active aging could help relieve the social and economic costs of an aging population (2,3). Older women consistently make up a larger portion of the disabled population than older men because of lower mortality, higher incidence of disability, and lower recovery rates from disability (4,5). Functional limita- tions, or restrictions in the performance of a person (6), have been shown to be good predictors of the onset of disability later in life and, hence, a good point in the disease process to intervene (7,8). Gender differences in functional limitations have been observed in older populations (9), but no study has examined whether these differences are present at midlife. Additionally, the Marmot Review of health inequalities in England (10) reports that people in manual occupations have declines in physical functioning that begin on average 12 years earlier than those in non-manual occupations. Most studies have documented that adult socioeconomic position (SEP) is inversely related to functional limitations (11–13). A few studies (14–16), including two from the same cohort examined in this paper (14,16), have shown that childhood SEP was independently associated with functional limitations in midlife when genders were com- bined. Only one study that we are aware of has investigated both childhood and adult SEP on functional limitations with analyses stratified on gender but may not be comparable to previous studies as it was conducted in an elderly Latin American population (17). Questions remain as to whether gender differences can be explained by SEP differences of men and women or whether the actual effects of SEP are different by gender. Using data from the MRC National Survey of Health and Development, we examined gender, childhood, and adulthood Gender and Life Course Occupational Social Class Differences in Trajectories of Functional Limitations in Midlife: Findings From the 1946 British Birth Cohort Emily T. Murray, 1,2 Rebecca Hardy, 1 Bjørn Heine Strand, 1,2 Rachel Cooper, 1 Jack M. Guralnik, 2 and Diana Kuh 1 1 MRC Unit for Lifelong Health and Ageing, University College London, UK. 2 Laboratory of Epidemiology, Demography, and Biometry, National Institute on Aging, National Institutes of Health, Bethesda, Maryland. Address correspondence to Emily T. Murray, PhD, MRC Unit for Lifelong Health and Ageing, Division of Population Health, University College London, UK. Email: [email protected] Background. Older women and those of lower socioeconomic position (SEP) consistently constitute a larger portion of the disabled population than older men or those of higher SEP, yet no studies have examined when in the life course these differences emerge. Methods. Prevalence of self-reported limitations in the upper body (gripping or reaching) and lower body (walking or stair climbing) at 43 and 53 years were utilized from 1,530 men and 1,518 women from the British 1946 birth cohort. Generalized linear models with a binomial distribution were used to examine the effects of gender, childhood and adult SEP, and the differences in the SEP effects by gender on the prevalence of limitations at age 43 years and changes in prevalence from 43 to 53 years. Results. For both genders, the prevalence of upper and lower body limitations were reported at 3%–5% at age 43 years. However, by age 53 years, women’s upper body limitations had increased to 28% and lower body limitations to 21%, whereas men’s limitations had only increased to 12% and 11%, respectively. Men and women whose father’s occupation was manual or whose adult head of household occupation was manual had higher prevalence of both limitations com- pared with those with non-manual backgrounds. These differences widened with age, especially in women. The effect of adult SEP on the prevalence of limitations was stronger than that of childhood SEP and was partly mediated by educa- tional attainment. Conclusion. Our findings provide the first evidence that prevention of disability in old age should begin early in midlife, especially for women from manual occupation households. Key Words: Gender—Social class—Functional limitations—Longitudinal studies—Middle aged. Received November 15, 2010; Accepted July 16, 2011 Decision Editor: Luigi Ferrucci, MD, PhD by guest on April 24, 2012 http://biomedgerontology.oxfordjournals.org/ Downloaded from
-
Upload
independent -
Category
Documents
-
view
4 -
download
0
Transcript of Gender and life course occupational social class differences in trajectories of functional...
Journal of Gerontology: MEDICAL SCIENCES Published by Oxford University Press on behalf of The Gerontological Society of America 2011.Cite journal as: J Gerontol A Biol Sci Med Sci. 2011 December;66A(12):1350–1359 Advance Access published on August 22, 2011doi:10.1093/gerona/glr139
1350
THE aging of the world’s population is a large challenge facing government health and welfare agencies (1).
Policy makers recognize that the promotion of healthy active aging could help relieve the social and economic costs of an aging population (2,3). Older women consistently make up a larger portion of the disabled population than older men because of lower mortality, higher incidence of disability, and lower recovery rates from disability (4,5). Functional limita-tions, or restrictions in the performance of a person (6), have been shown to be good predictors of the onset of disability later in life and, hence, a good point in the disease process to intervene (7,8). Gender differences in functional limitations have been observed in older populations (9), but no study has examined whether these differences are present at midlife.
Additionally, the Marmot Review of health inequalities in England (10) reports that people in manual occupations have declines in physical functioning that begin on average
12 years earlier than those in non-manual occupations. Most studies have documented that adult socioeconomic position (SEP) is inversely related to functional limitations (11–13). A few studies (14–16), including two from the same cohort examined in this paper (14,16), have shown that childhood SEP was independently associated with functional limitations in midlife when genders were com-bined. Only one study that we are aware of has investigated both childhood and adult SEP on functional limitations with analyses stratified on gender but may not be comparable to previous studies as it was conducted in an elderly Latin American population (17). Questions remain as to whether gender differences can be explained by SEP differences of men and women or whether the actual effects of SEP are different by gender.
Using data from the MRC National Survey of Health and Development, we examined gender, childhood, and adulthood
Gender and Life Course Occupational Social Class Differences in Trajectories of Functional Limitations in Midlife: Findings From the 1946 British Birth Cohort
Emily T. Murray,1,2 Rebecca Hardy,1 Bjørn Heine Strand,1,2 Rachel Cooper,1 Jack M. Guralnik,2 and Diana Kuh1
1MRC Unit for Lifelong Health and Ageing, University College London, UK. 2Laboratory of Epidemiology, Demography, and Biometry, National Institute on Aging, National Institutes of Health, Bethesda, Maryland.
Address correspondence to Emily T. Murray, PhD, MRC Unit for Lifelong Health and Ageing, Division of Population Health, University College London, UK. Email: [email protected]
Background. Older women and those of lower socioeconomic position (SEP) consistently constitute a larger portion of the disabled population than older men or those of higher SEP, yet no studies have examined when in the life course these differences emerge.
Methods. Prevalence of self-reported limitations in the upper body (gripping or reaching) and lower body (walking or stair climbing) at 43 and 53 years were utilized from 1,530 men and 1,518 women from the British 1946 birth cohort. Generalized linear models with a binomial distribution were used to examine the effects of gender, childhood and adult SEP, and the differences in the SEP effects by gender on the prevalence of limitations at age 43 years and changes in prevalence from 43 to 53 years.
Results. For both genders, the prevalence of upper and lower body limitations were reported at 3%–5% at age 43 years. However, by age 53 years, women’s upper body limitations had increased to 28% and lower body limitations to 21%, whereas men’s limitations had only increased to 12% and 11%, respectively. Men and women whose father’s occupation was manual or whose adult head of household occupation was manual had higher prevalence of both limitations com-pared with those with non-manual backgrounds. These differences widened with age, especially in women. The effect of adult SEP on the prevalence of limitations was stronger than that of childhood SEP and was partly mediated by educa-tional attainment.
Conclusion. Our findings provide the first evidence that prevention of disability in old age should begin early in midlife, especially for women from manual occupation households.
Key Words: Gender—Social class—Functional limitations—Longitudinal studies—Middle aged.
Received November 15, 2010; Accepted July 16, 2011
Decision Editor: Luigi Ferrucci, MD, PhD
by guest on April 24, 2012
http://biomedgerontology.oxfordjournals.org/
Dow
nloaded from
GENDER AND LIFE COURSE OCCUPATIONAL SOCIAL CLASS DIFFERENCES 1351
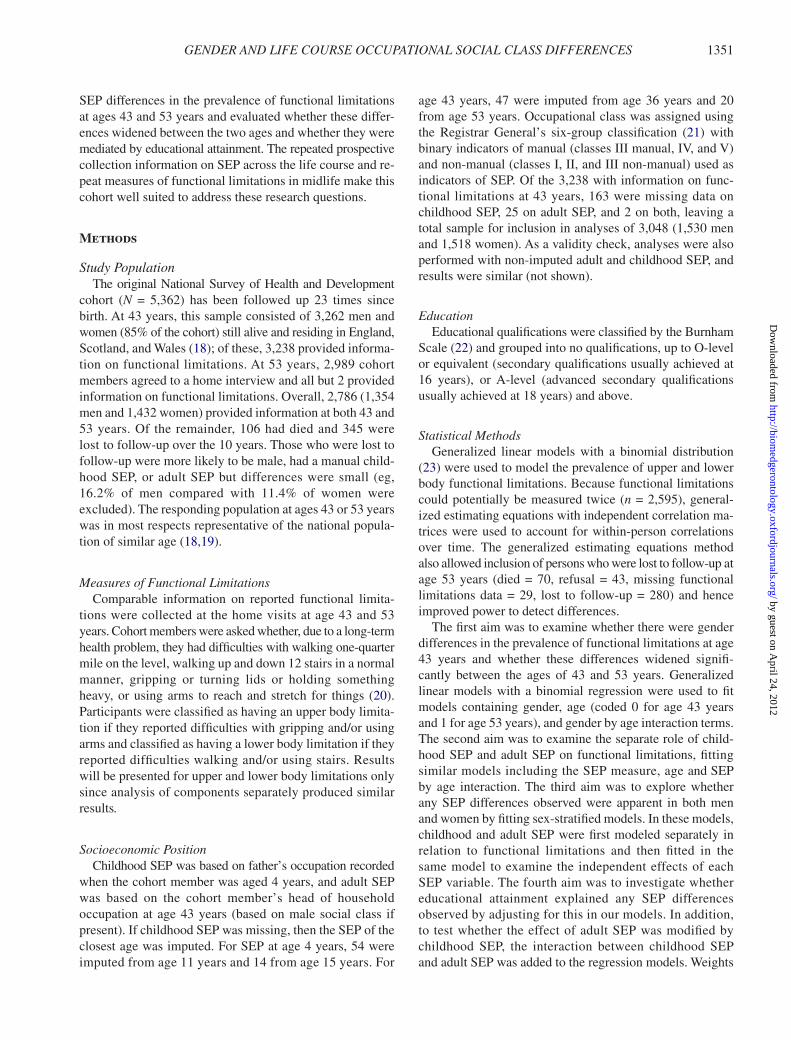
SEP differences in the prevalence of functional limitations at ages 43 and 53 years and evaluated whether these differ-ences widened between the two ages and whether they were mediated by educational attainment. The repeated prospective collection information on SEP across the life course and re-peat measures of functional limitations in midlife make this cohort well suited to address these research questions.
Methods
Study PopulationThe original National Survey of Health and Development
cohort (N = 5,362) has been followed up 23 times since birth. At 43 years, this sample consisted of 3,262 men and women (85% of the cohort) still alive and residing in England, Scotland, and Wales (18); of these, 3,238 provided informa-tion on functional limitations. At 53 years, 2,989 cohort members agreed to a home interview and all but 2 provided information on functional limitations. Overall, 2,786 (1,354 men and 1,432 women) provided information at both 43 and 53 years. Of the remainder, 106 had died and 345 were lost to follow-up over the 10 years. Those who were lost to follow-up were more likely to be male, had a manual child-hood SEP, or adult SEP but differences were small (eg, 16.2% of men compared with 11.4% of women were excluded). The responding population at ages 43 or 53 years was in most respects representative of the national popula-tion of similar age (18,19).
Measures of Functional LimitationsComparable information on reported functional limita-
tions were collected at the home visits at age 43 and 53 years. Cohort members were asked whether, due to a long-term health problem, they had difficulties with walking one-quarter mile on the level, walking up and down 12 stairs in a normal manner, gripping or turning lids or holding something heavy, or using arms to reach and stretch for things (20). Participants were classified as having an upper body limita-tion if they reported difficulties with gripping and/or using arms and classified as having a lower body limitation if they reported difficulties walking and/or using stairs. Results will be presented for upper and lower body limitations only since analysis of components separately produced similar results.
Socioeconomic PositionChildhood SEP was based on father’s occupation recorded
when the cohort member was aged 4 years, and adult SEP was based on the cohort member’s head of household occupation at age 43 years (based on male social class if present). If childhood SEP was missing, then the SEP of the closest age was imputed. For SEP at age 4 years, 54 were imputed from age 11 years and 14 from age 15 years. For
age 43 years, 47 were imputed from age 36 years and 20 from age 53 years. Occupational class was assigned using the Registrar General’s six-group classification (21) with binary indicators of manual (classes III manual, IV, and V) and non-manual (classes I, II, and III non-manual) used as indicators of SEP. Of the 3,238 with information on func-tional limitations at 43 years, 163 were missing data on childhood SEP, 25 on adult SEP, and 2 on both, leaving a total sample for inclusion in analyses of 3,048 (1,530 men and 1,518 women). As a validity check, analyses were also performed with non-imputed adult and childhood SEP, and results were similar (not shown).
EducationEducational qualifications were classified by the Burnham
Scale (22) and grouped into no qualifications, up to O-level or equivalent (secondary qualifications usually achieved at 16 years), or A-level (advanced secondary qualifications usually achieved at 18 years) and above.
Statistical MethodsGeneralized linear models with a binomial distribution
(23) were used to model the prevalence of upper and lower body functional limitations. Because functional limitations could potentially be measured twice (n = 2,595), general-ized estimating equations with independent correlation ma-trices were used to account for within-person correlations over time. The generalized estimating equations method also allowed inclusion of persons who were lost to follow-up at age 53 years (died = 70, refusal = 43, missing functional limitations data = 29, lost to follow-up = 280) and hence improved power to detect differences.
The first aim was to examine whether there were gender differences in the prevalence of functional limitations at age 43 years and whether these differences widened signifi-cantly between the ages of 43 and 53 years. Generalized linear models with a binomial regression were used to fit models containing gender, age (coded 0 for age 43 years and 1 for age 53 years), and gender by age interaction terms. The second aim was to examine the separate role of child-hood SEP and adult SEP on functional limitations, fitting similar models including the SEP measure, age and SEP by age interaction. The third aim was to explore whether any SEP differences observed were apparent in both men and women by fitting sex-stratified models. In these models, childhood and adult SEP were first modeled separately in relation to functional limitations and then fitted in the same model to examine the independent effects of each SEP variable. The fourth aim was to investigate whether educational attainment explained any SEP differences observed by adjusting for this in our models. In addition, to test whether the effect of adult SEP was modified by childhood SEP, the interaction between childhood SEP and adult SEP was added to the regression models. Weights
by guest on April 24, 2012
http://biomedgerontology.oxfordjournals.org/
Dow
nloaded from
MURRAY ET AL.1352
were applied to all models to allow for the initial sampling design.
ResultsAt age 43 years, 4.2% of the study sample reported a
lower body limitation and 4.4% reported an upper body lim-itation. In the subsequent 10 years, cohort members reported four times as many lower body limitations (15.9%) and five times as many upper body limitations (20.6%). The child-hood manual SEP group (42.1%) was larger than the adult-hood manual SEP group (37.9%), but this difference was similar in men and women. More than a third of cohort members did not attain any qualifications by the age of 26
Table 1. Number (%) of Reported Physical Limitations, Socioeconomic Position (SEP; childhood and adult), and Educational Achievement at
Ages 43 and 53 Years, by Gender
Characteristics Total Men Women
Upper body limitation 43 y 134 (4.4) 57 (3.7) 77 (5.1) 53 y* 540 (20.6) 159 (12.4) 381 (28.4)Lower body limitation 43 y* 128 (4.2) 53 (3.5) 75 (4.9) 53 y* 418 (15.9) 139 (10.8) 279 (20.8)Childhood SEP Non-manual 1764 (57.9) 887 (58.0) 877 (57.8) Manual 1284 (42.1) 643 (42.0) 641 (42.2)Adult SEP Non-manual 1894 (62.2) 936 (61.2) 958 (63.1) Manual 1154 (37.9) 594 (38.8) 560 (36.9)Education* None 1077 (36.8) 535 (36.5) 542 (37.2) Up to “O” level 818 (28.0) 308 (21.0) 510 (35.0) “A” level or greater 1030 (35.2) 624 (42.5) 406 (27.9) Missing 123 (4.0) 63 (4.1) 60 (4.0)Total at 43 y 3,048 1,530 1,518
*Significant difference between men and women (p < .05).
0
4
8
12
16
20
24
28
32
36
% w
ith li
mita
tions
43 53Age
women men
Total upper body
0
4
8
12
16
20
24
28
32
36
% w
ith li
mita
tions
43 53Age
women men
Total lower body
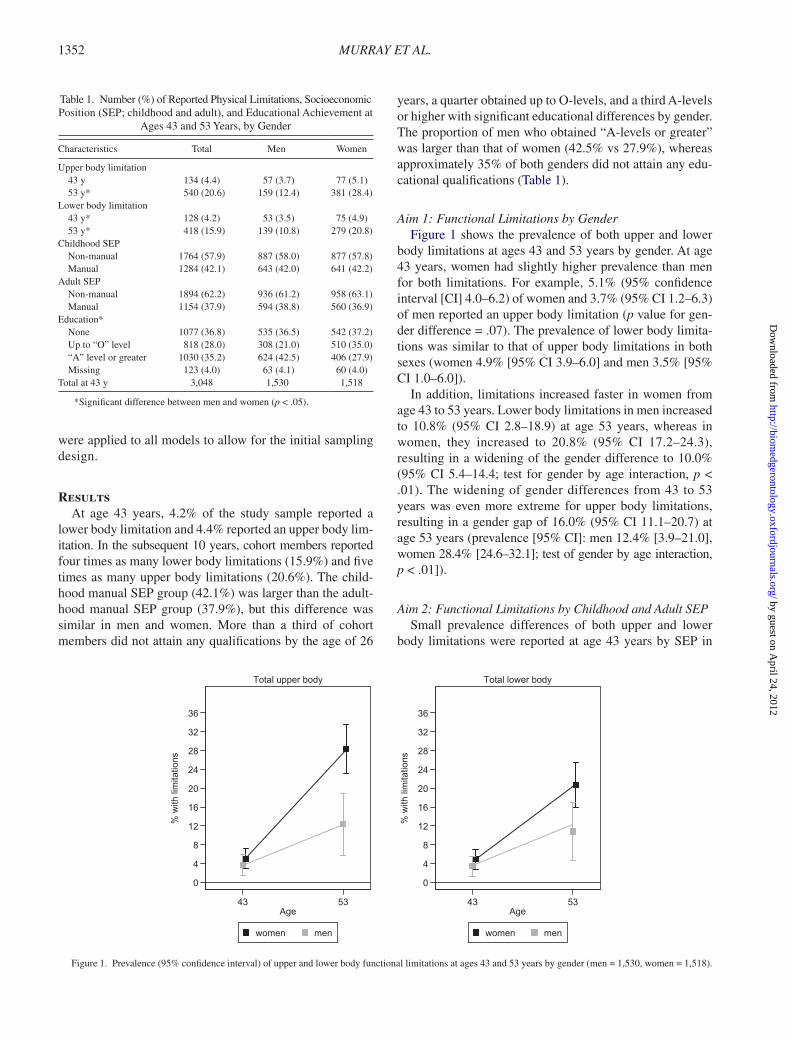
Figure 1. Prevalence (95% confidence interval) of upper and lower body functional limitations at ages 43 and 53 years by gender (men = 1,530, women = 1,518).
years, a quarter obtained up to O-levels, and a third A-levels or higher with significant educational differences by gender. The proportion of men who obtained “A-levels or greater” was larger than that of women (42.5% vs 27.9%), whereas approximately 35% of both genders did not attain any edu-cational qualifications (Table 1).
Aim 1: Functional Limitations by GenderFigure 1 shows the prevalence of both upper and lower
body limitations at ages 43 and 53 years by gender. At age 43 years, women had slightly higher prevalence than men for both limitations. For example, 5.1% (95% confidence interval [CI] 4.0–6.2) of women and 3.7% (95% CI 1.2–6.3) of men reported an upper body limitation (p value for gen-der difference = .07). The prevalence of lower body limita-tions was similar to that of upper body limitations in both sexes (women 4.9% [95% CI 3.9–6.0] and men 3.5% [95% CI 1.0–6.0]).
In addition, limitations increased faster in women from age 43 to 53 years. Lower body limitations in men increased to 10.8% (95% CI 2.8–18.9) at age 53 years, whereas in women, they increased to 20.8% (95% CI 17.2–24.3), resulting in a widening of the gender difference to 10.0% (95% CI 5.4–14.4; test for gender by age interaction, p < .01). The widening of gender differences from 43 to 53 years was even more extreme for upper body limitations, resulting in a gender gap of 16.0% (95% CI 11.1–20.7) at age 53 years (prevalence [95% CI]: men 12.4% [3.9–21.0], women 28.4% [24.6–32.1]; test of gender by age interaction, p < .01]).
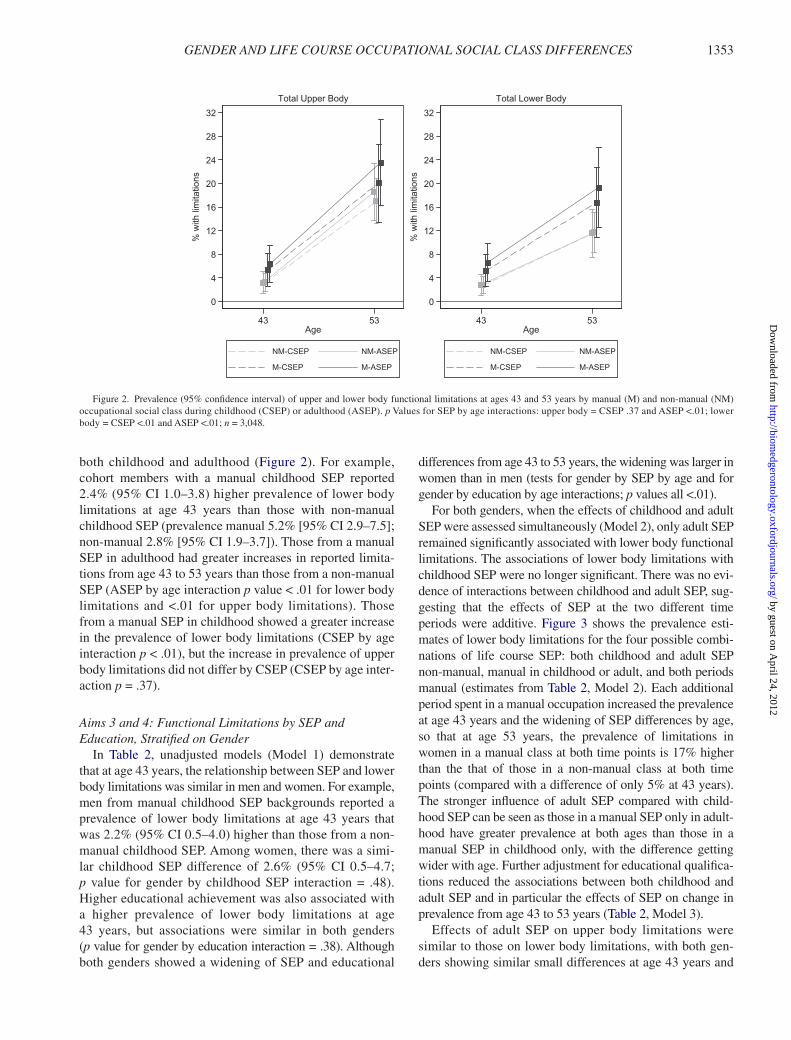
Aim 2: Functional Limitations by Childhood and Adult SEPSmall prevalence differences of both upper and lower
body limitations were reported at age 43 years by SEP in
by guest on April 24, 2012
http://biomedgerontology.oxfordjournals.org/
Dow
nloaded from
GENDER AND LIFE COURSE OCCUPATIONAL SOCIAL CLASS DIFFERENCES 1353
both childhood and adulthood (Figure 2). For example, cohort members with a manual childhood SEP reported 2.4% (95% CI 1.0–3.8) higher prevalence of lower body limitations at age 43 years than those with non-manual childhood SEP (prevalence manual 5.2% [95% CI 2.9–7.5]; non-manual 2.8% [95% CI 1.9–3.7]). Those from a manual SEP in adulthood had greater increases in reported limita-tions from age 43 to 53 years than those from a non-manual SEP (ASEP by age interaction p value < .01 for lower body limitations and <.01 for upper body limitations). Those from a manual SEP in childhood showed a greater increase in the prevalence of lower body limitations (CSEP by age interaction p < .01), but the increase in prevalence of upper body limitations did not differ by CSEP (CSEP by age inter-action p = .37).
Aims 3 and 4: Functional Limitations by SEP and Education, Stratified on Gender
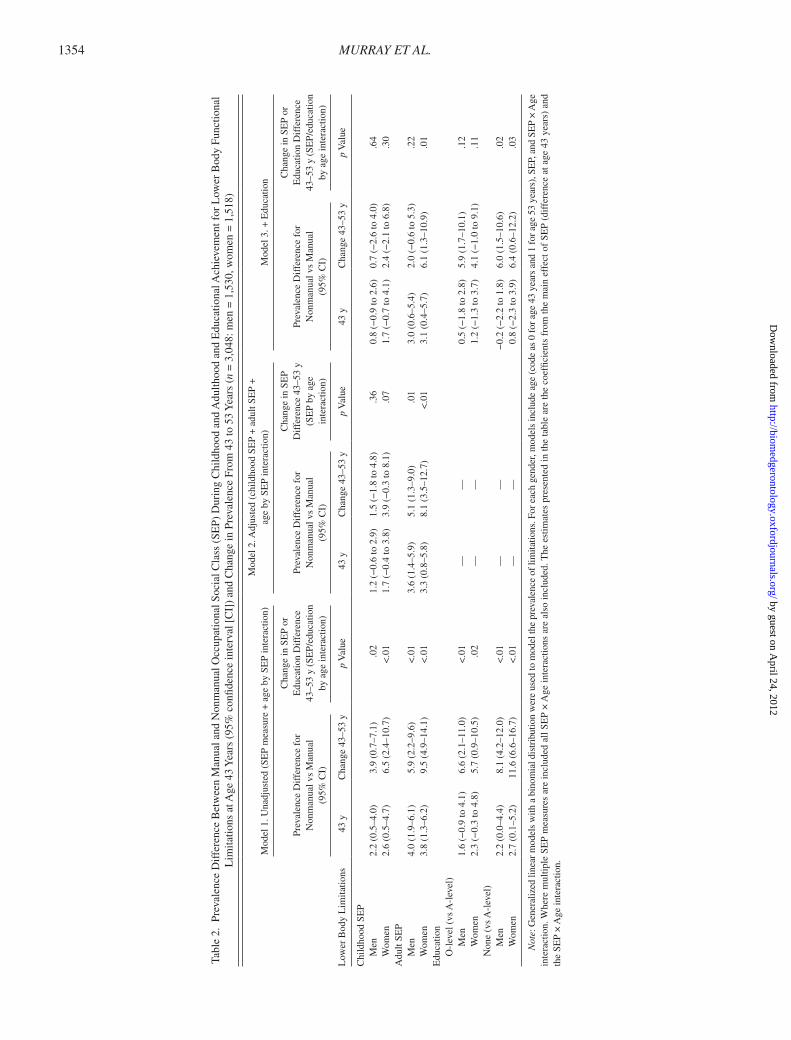
In Table 2, unadjusted models (Model 1) demonstrate that at age 43 years, the relationship between SEP and lower body limitations was similar in men and women. For example, men from manual childhood SEP backgrounds reported a prevalence of lower body limitations at age 43 years that was 2.2% (95% CI 0.5–4.0) higher than those from a non-manual childhood SEP. Among women, there was a simi-lar childhood SEP difference of 2.6% (95% CI 0.5–4.7; p value for gender by childhood SEP interaction = .48). Higher educational achievement was also associated with a higher prevalence of lower body limitations at age 43 years, but associations were similar in both genders (p value for gender by education interaction = .38). Although both genders showed a widening of SEP and educational
differences from age 43 to 53 years, the widening was larger in women than in men (tests for gender by SEP by age and for gender by education by age interactions; p values all <.01).
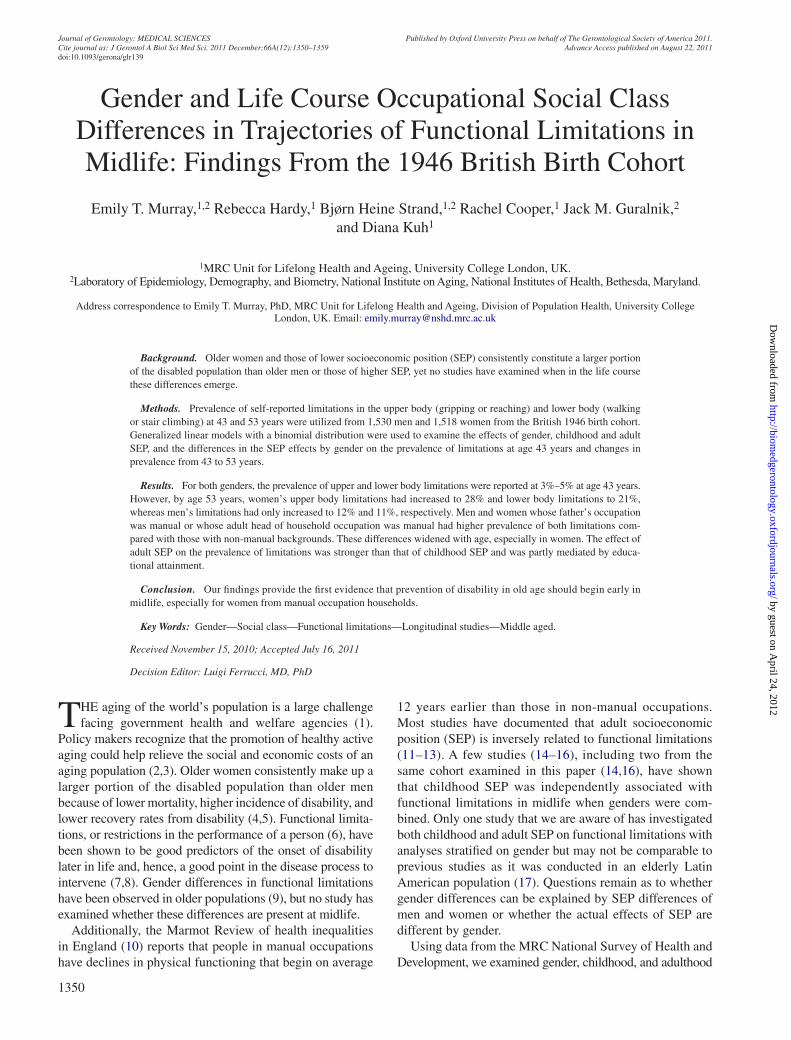
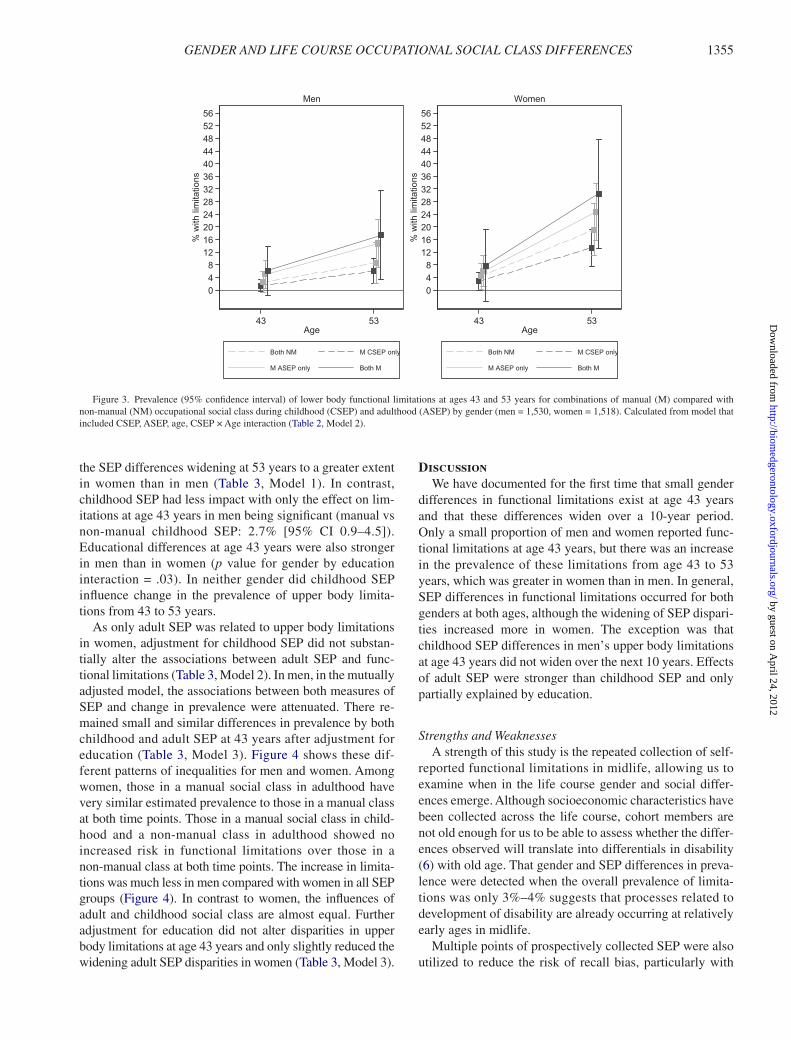
For both genders, when the effects of childhood and adult SEP were assessed simultaneously (Model 2), only adult SEP remained significantly associated with lower body functional limitations. The associations of lower body limitations with childhood SEP were no longer significant. There was no evi-dence of interactions between childhood and adult SEP, sug-gesting that the effects of SEP at the two different time periods were additive. Figure 3 shows the prevalence esti-mates of lower body limitations for the four possible combi-nations of life course SEP: both childhood and adult SEP non-manual, manual in childhood or adult, and both periods manual (estimates from Table 2, Model 2). Each additional period spent in a manual occupation increased the prevalence at age 43 years and the widening of SEP differences by age, so that at age 53 years, the prevalence of limitations in women in a manual class at both time points is 17% higher than the that of those in a non-manual class at both time points (compared with a difference of only 5% at 43 years). The stronger influence of adult SEP compared with child-hood SEP can be seen as those in a manual SEP only in adult-hood have greater prevalence at both ages than those in a manual SEP in childhood only, with the difference getting wider with age. Further adjustment for educational qualifica-tions reduced the associations between both childhood and adult SEP and in particular the effects of SEP on change in prevalence from age 43 to 53 years (Table 2, Model 3).
Effects of adult SEP on upper body limitations were similar to those on lower body limitations, with both gen-ders showing similar small differences at age 43 years and
0
4
8
12
16
20
24
28
32
% w
ith li
mita
tions
43 53Age
NM-CSEP NM-ASEP
M-CSEP M-ASEP
Total Upper Body
0
4
8
12
16
20
24
28
32
% w
ith li
mita
tions
43 53Age
NM-CSEP NM-ASEP
M-CSEP M-ASEP
Total Lower Body
Figure 2. Prevalence (95% confidence interval) of upper and lower body functional limitations at ages 43 and 53 years by manual (M) and non-manual (NM) occupational social class during childhood (CSEP) or adulthood (ASEP). p Values for SEP by age interactions: upper body = CSEP .37 and ASEP <.01; lower body = CSEP <.01 and ASEP <.01; n = 3,048.
by guest on April 24, 2012
http://biomedgerontology.oxfordjournals.org/
Dow
nloaded from
MURRAY ET AL.1354
Tabl
e 2.
Pre
vale
nce
Dif
fere
nce
Bet
wee
n M
anua
l and
Non
man
ual O
ccup
atio
nal S
ocia
l Cla
ss (
SEP)
Dur
ing
Chi
ldho
od a
nd A
dulth
ood
and
Edu
catio
nal A
chie
vem
ent f
or L
ower
Bod
y Fu
nctio
nal
Lim
itatio
ns a
t Age
43
Yea
rs (
95%
con
fiden
ce in
terv
al [
CI]
) an
d C
hang
e in
Pre
vale
nce
From
43
to 5
3 Y
ears
(n
= 3
,048
: men
= 1
,530
, wom
en =
1,5
18)
Low
er B
ody
Lim
itatio
ns
Mod
el 1
. Una
djus
ted
(SE
P m
easu
re +
age
by
SEP
inte
ract
ion)
Mod
el 2
. Adj
uste
d (c
hild
hood
SE
P +
adu
lt SE
P +
ag
e by
SE
P in
tera
ctio
n)M
odel
3. +
Edu
catio
n
Prev
alen
ce D
iffe
renc
e fo
r
Non
man
ual v
s M
anua
l (9
5% C
I)
Cha
nge
in S
EP
or
Edu
catio
n D
iffe
renc
e
43–5
3 y
(SE
P/ed
ucat
ion
by
age
inte
ract
ion)
Prev
alen
ce D
iffe
renc
e fo
r
Non
man
ual v
s M
anua
l (9
5% C
I)
Cha
nge
in S
EP
D
iffe
renc
e 43
–53
y
(SE
P by
age
in
tera
ctio
n)
Prev
alen
ce D
iffe
renc
e fo
r
Non
man
ual v
s M
anua
l (9
5% C
I)
Cha
nge
in S
EP
or
Edu
catio
n D
iffe
renc
e
43–5
3 y
(SE
P/ed
ucat
ion
by a
ge in
tera
ctio
n)
43 y
Cha
nge
43–5
3 y
p V
alue
43 y
Cha
nge
43–5
3 y
p V
alue
43 y
Cha
nge
43–5
3 y
p V
alue
Chi
ldho
od S
EP
M
en2.
2 (0
.5–4
.0)
3.9
(0.7
–7.1
).0
21.
2 (−
0.6
to 2
.9)
1.5
(−1.
8 to
4.8
).3
60.
8 (−
0.9
to 2
.6)
0.7
(−2.
6 to
4.0
).6
4
Wom
en2.
6 (0
.5–4
.7)
6.5
(2.4
–10.
7)<
.01
1.7
(−0.
4 to
3.8
)3.
9 (−
0.3
to 8
.1)
.07
1.7
(−0.
7 to
4.1
)2.
4 (−
2.1
to 6
.8)
.30
Adu
lt SE
P
Men
4.0
(1.9
–6.1
)5.
9 (2
.2–9
.6)
<.0
13.
6 (1
.4–5
.9)
5.1
(1.3
–9.0
).0
13.
0 (0
.6–5
.4)
2.0
(−0.
6 to
5.3
).2
2
Wom
en3.
8 (1
.3–6
.2)
9.5
(4.9
–14.
1)<
.01
3.3
(0.8
–5.8
)8.
1 (3
.5–1
2.7)
<.0
13.
1 (0
.4–5
.7)
6.1
(1.3
–10.
9).0
1E
duca
tion
O
-lev
el (
vs A
-lev
el)
Men
1.6
(−0.
9 to
4.1
)6.
6 (2
.1–1
1.0)
<.0
1—
—0.
5 (−
1.8
to 2
.8)
5.9
(1.7
–10.
1).1
2
W
omen
2.3
(−0.
3 to
4.8
)5.
7 (0
.9–1
0.5)
.02
——
1.2
(−1.
3 to
3.7
)4.
1 (−
1.0
to 9
.1)
.11
N
one
(vs
A-l
evel
)
M
en2.
2 (0
.0–4
.4)
8.1
(4.2
–12.
0)<
.01
——
−0.
2 (−
2.2
to 1
.8)
6.0
(1.5
–10.
6).0
2
W
omen
2.7
(0.1
–5.2
)11
.6 (
6.6–
16.7
)<
.01
——
0.8
(−2.
3 to
3.9
)6.
4 (0
.6–1
2.2)
.03
Not
e: G
ener
aliz
ed li
near
mod
els
with
a b
inom
ial d
istr
ibut
ion
wer
e us
ed to
mod
el th
e pr
eval
ence
of l
imita
tions
. For
eac
h ge
nder
, mod
els
incl
ude
age
(cod
e as
0 fo
r age
43
year
s an
d 1
for a
ge 5
3 ye
ars)
, SE
P, a
nd S
EP
× A
ge
inte
ract
ion.
Whe
re m
ultip
le S
EP
mea
sure
s ar
e in
clud
ed a
ll SE
P ×
Age
inte
ract
ions
are
als
o in
clud
ed. T
he e
stim
ates
pre
sent
ed in
the
tabl
e ar
e th
e co
effic
ient
s fr
om th
e m
ain
effe
ct o
f SE
P (d
iffe
renc
e at
age
43
year
s) a
nd
the
SEP
× A
ge in
tera
ctio
n.
by guest on April 24, 2012
http://biomedgerontology.oxfordjournals.org/
Dow
nloaded from
GENDER AND LIFE COURSE OCCUPATIONAL SOCIAL CLASS DIFFERENCES 1355
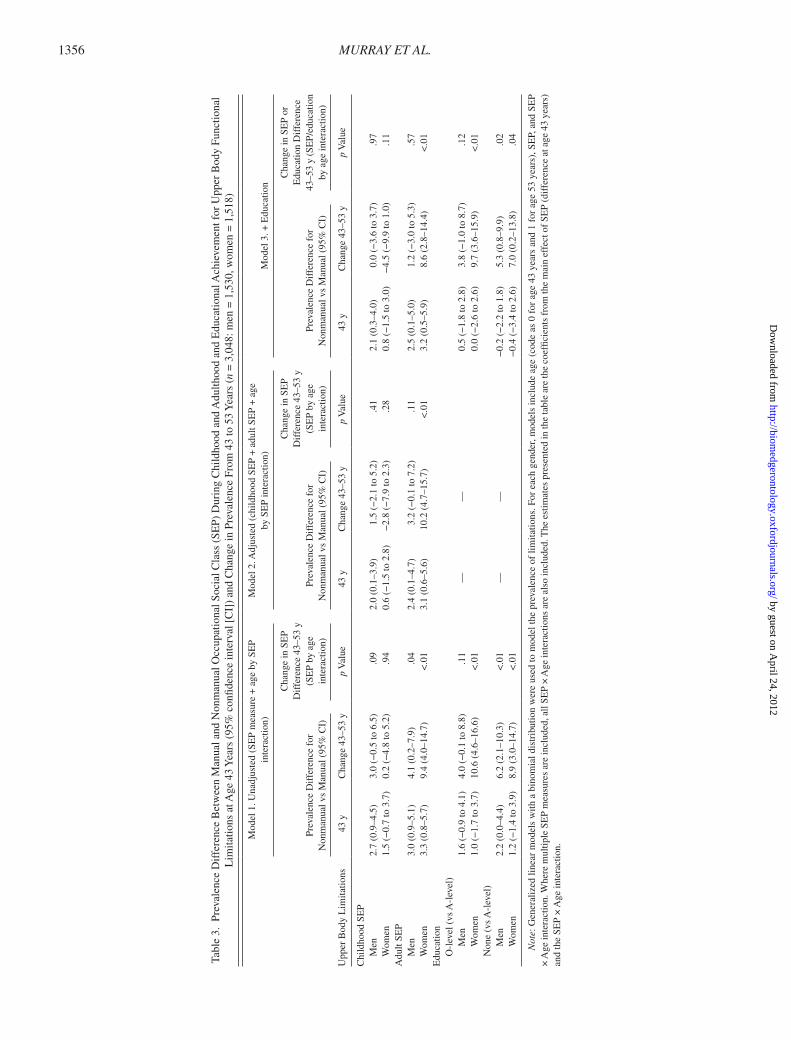
the SEP differences widening at 53 years to a greater extent in women than in men (Table 3, Model 1). In contrast, childhood SEP had less impact with only the effect on lim-itations at age 43 years in men being significant (manual vs non-manual childhood SEP: 2.7% [95% CI 0.9–4.5]). Educational differences at age 43 years were also stronger in men than in women (p value for gender by education interaction = .03). In neither gender did childhood SEP influence change in the prevalence of upper body limita-tions from 43 to 53 years.
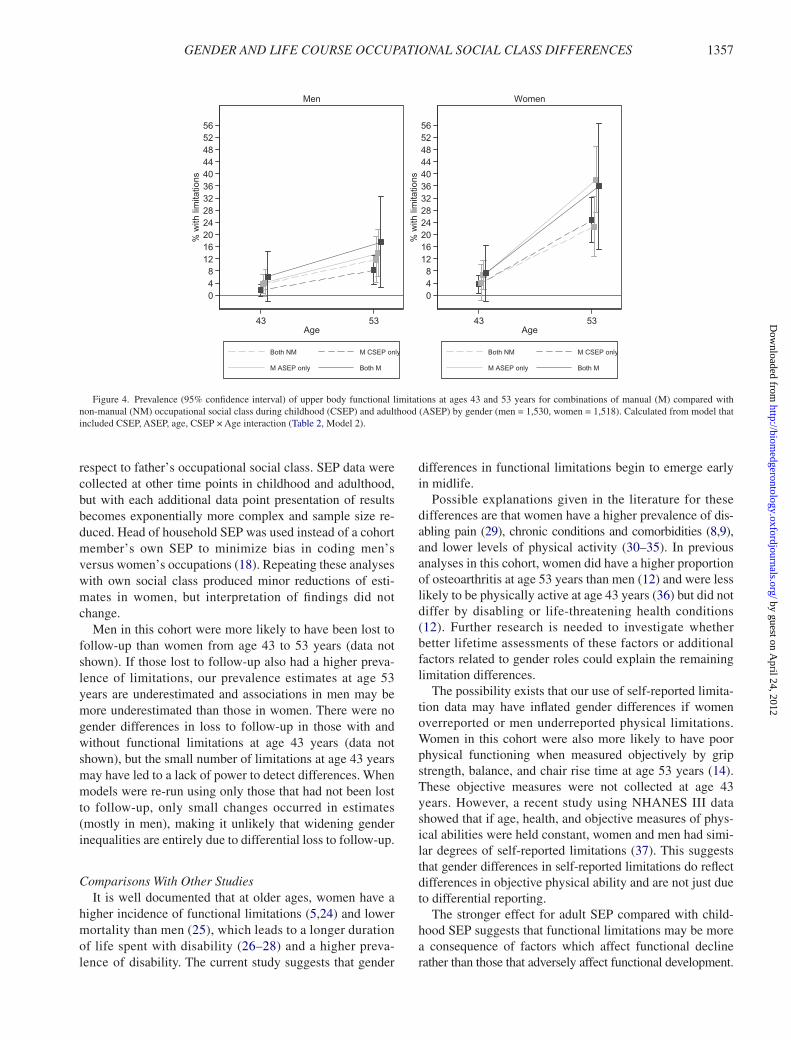
As only adult SEP was related to upper body limitations in women, adjustment for childhood SEP did not substan-tially alter the associations between adult SEP and func-tional limitations (Table 3, Model 2). In men, in the mutually adjusted model, the associations between both measures of SEP and change in prevalence were attenuated. There re-mained small and similar differences in prevalence by both childhood and adult SEP at 43 years after adjustment for education (Table 3, Model 3). Figure 4 shows these dif-ferent patterns of inequalities for men and women. Among women, those in a manual social class in adulthood have very similar estimated prevalence to those in a manual class at both time points. Those in a manual social class in child-hood and a non-manual class in adulthood showed no increased risk in functional limitations over those in a non-manual class at both time points. The increase in limita-tions was much less in men compared with women in all SEP groups (Figure 4). In contrast to women, the influences of adult and childhood social class are almost equal. Further adjustment for education did not alter disparities in upper body limitations at age 43 years and only slightly reduced the widening adult SEP disparities in women (Table 3, Model 3).
DiscussionWe have documented for the first time that small gender
differences in functional limitations exist at age 43 years and that these differences widen over a 10-year period. Only a small proportion of men and women reported func-tional limitations at age 43 years, but there was an increase in the prevalence of these limitations from age 43 to 53 years, which was greater in women than in men. In general, SEP differences in functional limitations occurred for both genders at both ages, although the widening of SEP dispari-ties increased more in women. The exception was that childhood SEP differences in men’s upper body limitations at age 43 years did not widen over the next 10 years. Effects of adult SEP were stronger than childhood SEP and only partially explained by education.
Strengths and WeaknessesA strength of this study is the repeated collection of self-
reported functional limitations in midlife, allowing us to examine when in the life course gender and social differ-ences emerge. Although socioeconomic characteristics have been collected across the life course, cohort members are not old enough for us to be able to assess whether the differ-ences observed will translate into differentials in disability (6) with old age. That gender and SEP differences in preva-lence were detected when the overall prevalence of limita-tions was only 3%–4% suggests that processes related to development of disability are already occurring at relatively early ages in midlife.
Multiple points of prospectively collected SEP were also utilized to reduce the risk of recall bias, particularly with
048
121620242832364044485256
% w
ith li
mita
tions
43 53Age
Both NM M CSEP only
M ASEP only Both M
Men
048
121620242832364044485256
% w
ith li
mita
tions
43 53Age
Both NM M CSEP only
M ASEP only Both M
Women
Figure 3. Prevalence (95% confidence interval) of lower body functional limitations at ages 43 and 53 years for combinations of manual (M) compared with non-manual (NM) occupational social class during childhood (CSEP) and adulthood (ASEP) by gender (men = 1,530, women = 1,518). Calculated from model that included CSEP, ASEP, age, CSEP × Age interaction (Table 2, Model 2).
by guest on April 24, 2012
http://biomedgerontology.oxfordjournals.org/
Dow
nloaded from
MURRAY ET AL.1356
Tabl
e 3.
Pre
vale
nce
Dif
fere
nce
Bet
wee
n M
anua
l and
Non
man
ual O
ccup
atio
nal S
ocia
l Cla
ss (
SEP)
Dur
ing
Chi
ldho
od a
nd A
dulth
ood
and
Edu
catio
nal A
chie
vem
ent f
or U
pper
Bod
y Fu
nctio
nal
Lim
itatio
ns a
t Age
43
Yea
rs (
95%
con
fiden
ce in
terv
al [
CI]
) an
d C
hang
e in
Pre
vale
nce
From
43
to 5
3 Y
ears
(n
= 3
,048
: men
= 1
,530
, wom
en =
1,5
18)
Upp
er B
ody
Lim
itatio
ns
Mod
el 1
. Una
djus
ted
(SE
P m
easu
re +
age
by
SEP
inte
ract
ion)
Mod
el 2
. Adj
uste
d (c
hild
hood
SE
P +
adu
lt SE
P +
age
by
SE
P in
tera
ctio
n)M
odel
3. +
Edu
catio
n
Prev
alen
ce D
iffe
renc
e fo
r
Non
man
ual v
s M
anua
l (95
% C
I)
Cha
nge
in S
EP
D
iffe
renc
e 43
–53
y
(SE
P by
age
in
tera
ctio
n)Pr
eval
ence
Dif
fere
nce
for
N
onm
anua
l vs
Man
ual (
95%
CI)
Cha
nge
in S
EP
D
iffe
renc
e 43
–53
y
(SE
P by
age
in
tera
ctio
n)Pr
eval
ence
Dif
fere
nce
for
N
onm
anua
l vs
Man
ual (
95%
CI)
Cha
nge
in S
EP
or
Edu
catio
n D
iffe
renc
e
43–5
3 y
(SE
P/ed
ucat
ion
by a
ge in
tera
ctio
n)
43 y
Cha
nge
43–5
3 y
p V
alue
43 y
Cha
nge
43–5
3 y
p V
alue
43 y
Cha
nge
43–5
3 y
p V
alue
Chi
ldho
od S
EP
M
en2.
7 (0
.9–4
.5)
3.0
(−0.
5 to
6.5
).0
92.
0 (0
.1–3
.9)
1.5
(−2.
1 to
5.2
).4
12.
1 (0
.3–4
.0)
0.0
(−3.
6 to
3.7
).9
7
Wom
en1.
5 (−
0.7
to 3
.7)
0.2
(−4.
8 to
5.2
).9
40.
6 (−
1.5
to 2
.8)
−2.
8 (−
7.9
to 2
.3)
.28
0.8
(−1.
5 to
3.0
)−
4.5
(−9.
9 to
1.0
).1
1A
dult
SEP
M
en3.
0 (0
.9–5
.1)
4.1
(0.2
–7.9
).0
42.
4 (0
.1–4
.7)
3.2
(−0.
1 to
7.2
).1
12.
5 (0
.1–5
.0)
1.2
(−3.
0 to
5.3
).5
7
Wom
en3.
3 (0
.8–5
.7)
9.4
(4.0
–14.
7)<
.01
3.1
(0.6
–5.6
)10
.2 (
4.7–
15.7
)<
.01
3.2
(0.5
–5.9
)8.
6 (2
.8–1
4.4)
<.0
1E
duca
tion
O
-lev
el (
vs A
-lev
el)
Men
1.6
(−0.
9 to
4.1
)4.
0 (−
0.1
to 8
.8)
.11
——
0.5
(−1.
8 to
2.8
)3.
8 (−
1.0
to 8
.7)
.12
Wom
en1.
0 (−
1.7
to 3
.7)
10.6
(4.
6–16
.6)
<.0
10.
0 (−
2.6
to 2
.6)
9.7
(3.6
–15.
9)<
.01
N
one
(vs
A-l
evel
)
M
en2.
2 (0
.0–4
.4)
6.2
(2.1
–10.
3)<
.01
——
−0.
2 (−
2.2
to 1
.8)
5.3
(0.8
–9.9
).0
2
W
omen
1.2
(−1.
4 to
3.9
)8.
9 (3
.0–1
4.7)
<.0
1−
0.4
(−3.
4 to
2.6
)7.
0 (0
.2–1
3.8)
.04
Not
e: G
ener
aliz
ed li
near
mod
els
with
a b
inom
ial d
istr
ibut
ion
wer
e us
ed to
mod
el th
e pr
eval
ence
of
limita
tions
. For
eac
h ge
nder
, mod
els
incl
ude
age
(cod
e as
0 f
or a
ge 4
3 ye
ars
and
1 fo
r ag
e 53
yea
rs),
SE
P, a
nd S
EP
× A
ge in
tera
ctio
n. W
here
mul
tiple
SE
P m
easu
res
are
incl
uded
, all
SEP
× A
ge in
tera
ctio
ns a
re a
lso
incl
uded
. The
est
imat
es p
rese
nted
in th
e ta
ble
are
the
coef
ficie
nts
from
the
mai
n ef
fect
of
SEP
(dif
fere
nce
at a
ge 4
3 ye
ars)
an
d th
e SE
P ×
Age
inte
ract
ion.
by guest on April 24, 2012
http://biomedgerontology.oxfordjournals.org/
Dow
nloaded from
GENDER AND LIFE COURSE OCCUPATIONAL SOCIAL CLASS DIFFERENCES 1357
respect to father’s occupational social class. SEP data were collected at other time points in childhood and adulthood, but with each additional data point presentation of results becomes exponentially more complex and sample size re-duced. Head of household SEP was used instead of a cohort member’s own SEP to minimize bias in coding men’s versus women’s occupations (18). Repeating these analyses with own social class produced minor reductions of esti-mates in women, but interpretation of findings did not change.
Men in this cohort were more likely to have been lost to follow-up than women from age 43 to 53 years (data not shown). If those lost to follow-up also had a higher preva-lence of limitations, our prevalence estimates at age 53 years are underestimated and associations in men may be more underestimated than those in women. There were no gender differences in loss to follow-up in those with and without functional limitations at age 43 years (data not shown), but the small number of limitations at age 43 years may have led to a lack of power to detect differences. When models were re-run using only those that had not been lost to follow-up, only small changes occurred in estimates (mostly in men), making it unlikely that widening gender inequalities are entirely due to differential loss to follow-up.
Comparisons With Other StudiesIt is well documented that at older ages, women have a
higher incidence of functional limitations (5,24) and lower mortality than men (25), which leads to a longer duration of life spent with disability (26–28) and a higher preva-lence of disability. The current study suggests that gender
differences in functional limitations begin to emerge early in midlife.
Possible explanations given in the literature for these differences are that women have a higher prevalence of dis-abling pain (29), chronic conditions and comorbidities (8,9), and lower levels of physical activity (30–35). In previous analyses in this cohort, women did have a higher proportion of osteoarthritis at age 53 years than men (12) and were less likely to be physically active at age 43 years (36) but did not differ by disabling or life-threatening health conditions (12). Further research is needed to investigate whether better lifetime assessments of these factors or additional factors related to gender roles could explain the remaining limitation differences.
The possibility exists that our use of self-reported limita-tion data may have inflated gender differences if women overreported or men underreported physical limitations. Women in this cohort were also more likely to have poor physical functioning when measured objectively by grip strength, balance, and chair rise time at age 53 years (14). These objective measures were not collected at age 43 years. However, a recent study using NHANES III data showed that if age, health, and objective measures of phys-ical abilities were held constant, women and men had simi-lar degrees of self-reported limitations (37). This suggests that gender differences in self-reported limitations do reflect differences in objective physical ability and are not just due to differential reporting.
The stronger effect for adult SEP compared with child-hood SEP suggests that functional limitations may be more a consequence of factors which affect functional decline rather than those that adversely affect functional development.
048
121620242832364044485256
% w
ith li
mita
tions
43 53Age
Both NM M CSEP only
M ASEP only Both M
Men
048
121620242832364044485256
% w
ith li
mita
tions
43 53Age
Both NM M CSEP only
M ASEP only Both M
Women
Figure 4. Prevalence (95% confidence interval) of upper body functional limitations at ages 43 and 53 years for combinations of manual (M) compared with non-manual (NM) occupational social class during childhood (CSEP) and adulthood (ASEP) by gender (men = 1,530, women = 1,518). Calculated from model that included CSEP, ASEP, age, CSEP × Age interaction (Table 2, Model 2).
by guest on April 24, 2012
http://biomedgerontology.oxfordjournals.org/
Dow
nloaded from
MURRAY ET AL.1358
Previous literature has documented that education predicts incident and prevalent mobility disability (38,39), and yet adult SEP effects were reduced but still apparent after adjustment for educational achievement. We do, however, observe associations with childhood SEP before adjustment for adult SEP. It may therefore be that SEP is important at all ages but that effects of adult SEP appear stronger simply because the exposure was more proximate to the assessment of functional status.
Only one study that we are aware of examined both child-hood and adult socioeconomic conditions on functional limitations, stratified on gender. This study found that a respondent’s childhood “family economic situation” (good/average/poor) and own current education and lifelong oc-cupation were independently related to lower extremity limitations, with stronger effects in women (17), similar to our findings. However, the participants in their study were aged 60 years and older. Our study goes further by showing that the associations are already present in both upper and lower body extremities at the age of 43 years and continue to widen in the next decade. A Dutch study of middle-aged twin men found that neither childhood nor adult SEP (both: com-posite of employment, education, and number of subordi-nates) were associated with limitations in running 100 m. However, running may be measuring a different construct than walking or using stairs, as in our study (40).
Policy Implications and ConclusionsOur findings provide the first evidence that processes
determining gender and social inequalities of disability in older people begin in early midlife. Further research is required to elucidate the pathway between social conditions across the life course and physical limitations at older ages. Identifying what aspects of gender contribute to women’s greater limitation burden will allow for the development of better-targeted strategies for disability prevention.
Funding
The manuscript is funded by MRC Unit for Lifelong Health and Ageing in UK and supported in part by the Intramural Research Program, National Institute on Aging, National Institutes of Health in the United States. The funders of the study had no role in the study design, data collection, data analysis, data interpretation, or writing of the report.
Ethics Committee Approval
The study received Multicentre Research Ethics Committee (MREC) approval.
Conflict of Interest
None.
References 1. National Research Council. Preparing for an Aging World: The Case
for Cross-National Research.; Washington, DC: National Academy Press; 2001.
2. World Health Organization. Active Ageing: A Policy Framework; Geneva, Switzerland: WHO; 2002.
3. Kuh D. A life course approach to healthy ageing, frailty, and capability. J Gerontol A Biol Sci Med Sci. 2007;62A(7):717–721. the New Dynamics of Ageing (NDA) Prepatory Network.
4. Verbrugge LM, Jette AM. The disablement process. Soc Sci Med. 1994;38(1):1–14.
5. Leveille SG, Penninx WJH, Melzer D, Izmirlian G, Guralnik J. Sex differences in the prevalence of mobility disability in old age: the dynamics of incidence, recovery, and mortality. J Gerontol B Psychol Soc Sci Med. 2000;55(1):S41–S50.
6. Jette AM. Toward a common language for function, disability, and health. Phys Ther. 2006;86(5):726–734.
7. Guralnik JM, Ferrucci L, Balfour JL, Volpato S, Di lorio A. Progressive versus catastrophic loss of the ability to walk: implications for the pre-vention of mobility loss. J Am Geriatr Soc. 2001;49(11):1463–1470.
8. Murtagh KN, Hubert HB. Gender differences in physical disability among an elderly cohort. Am J Public Health. 2004;94(8):1406–1411.
9. Stuck AE, Walthert JM, Nikolaus T, Bula CJ, Hohmann C, Beck JC. Risk factors for functional status decline in community-living elderly people: a systematic literature review. Soc Sci Med. 1999;48(4):445–469.
10. Marmot M, Allen J, Goldblatt P, Fair Society, Healthy Lives: The Marmot Review. http://www.ucl.ac.uk/marmotreview. Accessed February 1, 2010.
11. Kuh D, Bassey EJ, Butterworth S, Hardy R, Wadsworth MEJ. Grip strength, postural control, and functional leg power in a representative cohort of British men and women: associations with physical activity, health status, and socioeconomic conditions. J Gerontol A Biol Sci Med Sci. 2005;60A(2):224–231. Muskuloskeletal Study Team.
12. Boult C, Kane RL, Louis TA, Boult L, McCaffrey D. Chronic condi-tions that lead to functional limitation in the elderly. J Gerontol. 1994;49(1):M28–M36.
13. Guralnik JM, Kaplan GA. Predictors of healthy aging: prospective evidence from the Alameda County study. Am J Public Health. 1989;79(6):703–708.
14. Guralnik JM, Butterworth S, Wadsworth MEJ, Kuh D. Childhood socioeconomic status predicts physical functioning a half century later. J Gerontol A Biol Sci Med Sci. 2006;61A(7):694–701.
15. Haas S. Trajectories of functional health: the ‘long arm’ of childhood health and socioeconomic factors. Soc Sci Med. 2008;66(4):849–861.
16. Kuh DJ, Wadsworth ME, Yusuf EJ. Burden of disability in a post war birth cohort in the UK. J Epidemiol Community Health. 1994;48(3):262–269.
17. Alvarado BE, Guerra RO, Zunzunegui MV. Gender differences in lower extremity function in Latin American elders: seeking expla-nations from a life-course perspective. J Aging Health. 2007;19:1004–1024.
18. Wadsworth ME, Mann SL, Rodgers B, Kuh DJ, Hilder WS, Yusuf EJ. Loss and representativeness in a 43 year follow up of a national birth cohort. J Epidemiol Community Health. 1992;46(3):300–304.
19. Wadsworth ME, Butterworth SL, Hardy RJ, et al. The life course prospective design: an example of benefits and problems associated with study longevity. Soc Sci Med. 2003;57(11):2193–2205.
20. Martin J, Melzer H, Elliot D. The Prevalence of Disability Among Adults. OPCS Surveys of Disability in Great Britain. Report 1. Office of Populations Censuses and Surveys Social Survey Division. London, UK: HMSO; 1988.
21. Galobardes B, Shaw M, Lawlor DA, Lynch JW, Davey Smith G. Indicators of socioeconomic position (part 2). J Epidemiol and Com-munity Health. 2006;60(2):95–101.
22. Department of Education and Science. Burnham Further Education Committee Grading Courses 1972; London, UK: HMSO; 1972.
23. Spiegelman D, Hertzmark E. Easy SAS calculations for risk or prevalence ratios and differences. Am J Epidemiol. 2005;162(3):199–200.
24. Hayward MD, Crimmins EM, Saito Y. Differentials in active life expectancy in the older population of the United States. J Gerontol B Psychol Sci Soc Sci. 1996;51B(3):S111–S120.
by guest on April 24, 2012
http://biomedgerontology.oxfordjournals.org/
Dow
nloaded from
GENDER AND LIFE COURSE OCCUPATIONAL SOCIAL CLASS DIFFERENCES 1359
25. Verbrugge LM, Wingard DL. Sex differentials in health and mortality. Health Matrix. 1987;5(2):3–19.
26. Branch LG, Guralnik JM, Foley DJ, et al. Active life expectancy for 10,000 Caucasian men and women in three communities. J Gerontol. 1991;46(4):M145–M150.
27. Guralnik JM, Simonsick EM. Physical disability in older Americans. J Gerontol. 1993;48(Special issue):3–10.
28. Oman D, Reed D, Ferrara A. Do elderly women have more physical disability than men do? AJE. 1999;150(8):834–842.
29. Roddy A, Muller S, Thomas E. Onset and persistence of disabling foot pain in community-dwelling older adults over a 3-year period: a pro-spective cohort study. J Gerontol. 2011;66(4):474–480.
30. LaCroix AZ, Guralnik JM, Berkman LF, Wallace RB, Satterfield S. Maintaining mobility in late life. II. Smoking, alcohol consumption, physical activity, and body mass index. Am J Epidemiol. 1993;137(8):858–869.
31. Launer LJ, Harris T, Rumpel C, Madans J. Body mass index, weight change, and risk of mobility disability in middle-aged and older women. The epidemiologic follow-up study of NHANES I. JAMA. 1994;271(14):1093–1098.
32. Mor V, Murphy J, Masterson-Allen S, et al. Risk of functional decline among well elders. J Clin Epidemiol. 1989;42(9):895–904.
33. Newman AB, Brach JS. Gender gap in longevity and disability in older persons. Epidemiol Rev. 2001;23(2):343–350.
34. Seeman TE, Berkman LF, Charpentier PA, Blazer DG, Albert MS, Tinetti ME. Behavioral and psychosocial predictors of physical per-formance: Macarthur studies of successful aging. J Gerontol A Biol Sci Med Sci. 1995;50(4):M177–M183.
35. Physical Activity Guidelines Advisory Committee. Report of the Physical Activity Guidelines Advisory Committee, 2008; Washington, DC: U.S. Department of Health and Human Services; 2008.
36. Kuh D, Cooper C. Physical activity at 36 years: patterns and childhood predictors in a longitudinal study. J Epidemiol Community Health. 1992;46:114–119.
37. Louie G, Ward MM. Sex disparities in self-reported physical function-ing: true differences, reporting bias, or incomplete adjustment for con-founding? J Am Geriatr Soc. 2010;58:1117–2010.
38. Gregory PC, Szanton SL, Xue Q-L, Tian J, Thorpe RJ, Fried LP. Education predicts incidence of preclinical mobility disability in ini-tially high-functioning older women. The Women’s Health and Aging Study II. J Gerontol A Biol Sci Med Sci. 2011;66A(5):577–581.
39. Melzer D, Izmirlian G, Leveille SG, Guralnik J. Educational differ-ences in the prevalence of mobility disability in old age: the dynamics of incidence, mortality, and recovery. J Gerontol B Soc Sci. 2001;56(5):S294–S301.
40. Osler M, Madsen M, Nybo Andersen AM, et al. Do childhood and adult socioeconomic circumstances influence health and physical function in middle-age? Soc Sci Med. 2009;68(8):1425–1431.
by guest on April 24, 2012
http://biomedgerontology.oxfordjournals.org/
Dow
nloaded from