Prevalence of Personality Disorders at Midlife in a Community Sample: Disorders and Symptoms...
12
Prevalence of Personality Disorders at Midlife in a Community Sample: Disorders and Symptoms Reflected in Interview, Self, and Informant Reports Thomas F. Oltmanns & Merlyn M. Rodrigues & Yana Weinstein & Marci E. J. Gleason Published online: 12 October 2013 # Springer Science+Business Media New York 2013 Abstract This report is concerned with the prevalence of symptoms of specific personality disorders in a representative community sample and draws attention to the importance of different sources of diagnostic information. We recruited a sample of 1,630 people between the ages of 55 and 64 to participate in a study regarding personality and health. Using careful recruitment methods, our participation rate was 43 %. Participants completed the SIDP-IV interview as well as a questionnaire (self-report MAPP). Informants completed the same questionnaire (informant MAPP), describing the partic- ipant’ s maladaptive personality characteristics. According to the diagnostic interview, 7 % of participants met criteria for exactly one PD, 1 % met criteria for 2 or 3 PDs, and 2 % met criteria for PD NOS (defined as 10 or more miscellaneous criteria). Avoidant and obsessive compulsive PDs were the most common types. Correlations between the three sources of information indicated significant agreement among these measurement methods, but they are not redundant. In com- parison to interview and self-report data, informants reported more symptoms of personality pathology (except for avoidant PD). Symptoms of personality pathology are continuously distributed, and subthreshold features may have an important impact on health and social adjustment. In this community sample, rates of co-morbidity among PDs and the proportion of PDNOS diagnoses are substantially lower than reported from clinical samples. Future research must evaluate the va- lidity of diagnostic thresholds and competing sources of diag- nostic information in relation to important life outcomes. Keywords Personality disorders . Sample recruitment . Prevalence . Informant report Personality disorders (PDs) are essential diagnostic con- structs, but they remain poorly understood in comparison to other forms of mental disorder (Kendell 2002). Evidence regarding their prevalence is ambiguous, stemming largely from disagreements about how best to define and measure not only the symptoms of these disorders but also the detri- mental impact that they have on people’ s lives (Paris 2010; Ro and Clark 2009). Epidemiological studies suggest that person- ality disorders are relatively common in community samples, with recent reports noting that approximately 10 % of adults would meet the diagnostic criteria for at least one specific PD (Jackson and Burgess 2004; Lenzenweger et al. 2007; Lewin et al. 2005; Newton-Howes et al. 2010). These numbers are typically based on self-report questionnaires or semi- structured diagnostic interviews that are used to collect infor- mation about the participants. Unfortunately, there is substan- tial reason to believe that these methods have important lim- itations; people with personality disorders are not always aware of the impact that their behavior has on other people or able to identify the presence of maladaptive traits (Huprich et al. 2011; Oltmanns and Turkheimer 2006). Serious ques- tions remain about the prevalence and consequences of PDs in light of the limitations of self-report measures. Another problem with most studies reporting the prevalence of PDs is that they rely on categorical diagnoses. Investigators typically report prevalence rates based on the number of people who qualify for a diagnosis, but these diagnostic thresholds are largely arbitrary. Contrary to this categorical method used in T. F. Oltmanns (*) : M. M. Rodrigues Department of Psychology, Washington University in St. Louis, St. Louis, MO 63130-4899, USA e-mail: [email protected] Y. Weinstein Department of Psychology, University of Massachusetts – Lowell, Lowell, USA M. E. J. Gleason Department of Human Development and Family Sciences, University of Texas in Austin, Austin, USA J Psychopathol Behav Assess (2014) 36:177–188 DOI 10.1007/s10862-013-9389-7
-
Upload
independent -
Category
Documents
-
view
0 -
download
0
Transcript of Prevalence of Personality Disorders at Midlife in a Community Sample: Disorders and Symptoms...
Prevalence of Personality Disorders at Midlife in a CommunitySample: Disorders and Symptoms Reflected in Interview,Self, and Informant Reports
Thomas F. Oltmanns & Merlyn M. Rodrigues &
Yana Weinstein & Marci E. J. Gleason
Published online: 12 October 2013# Springer Science+Business Media New York 2013
Abstract This report is concerned with the prevalence ofsymptoms of specific personality disorders in a representativecommunity sample and draws attention to the importance ofdifferent sources of diagnostic information. We recruited asample of 1,630 people between the ages of 55 and 64 toparticipate in a study regarding personality and health. Usingcareful recruitment methods, our participation rate was 43 %.Participants completed the SIDP-IV interview as well as aquestionnaire (self-report MAPP). Informants completed thesame questionnaire (informant MAPP), describing the partic-ipant’s maladaptive personality characteristics. According tothe diagnostic interview, 7 % of participants met criteria forexactly one PD, 1 % met criteria for 2 or 3 PDs, and 2 % metcriteria for PD NOS (defined as 10 or more miscellaneouscriteria). Avoidant and obsessive compulsive PDs were themost common types. Correlations between the three sourcesof information indicated significant agreement among thesemeasurement methods, but they are not redundant. In com-parison to interview and self-report data, informants reportedmore symptoms of personality pathology (except for avoidantPD). Symptoms of personality pathology are continuouslydistributed, and subthreshold features may have an importantimpact on health and social adjustment. In this communitysample, rates of co-morbidity among PDs and the proportionof PDNOS diagnoses are substantially lower than reported
from clinical samples. Future research must evaluate the va-lidity of diagnostic thresholds and competing sources of diag-nostic information in relation to important life outcomes.
Keywords Personality disorders . Sample recruitment .
Prevalence . Informant report
Personality disorders (PDs) are essential diagnostic con-structs, but they remain poorly understood in comparison toother forms of mental disorder (Kendell 2002). Evidenceregarding their prevalence is ambiguous, stemming largelyfrom disagreements about how best to define and measurenot only the symptoms of these disorders but also the detri-mental impact that they have on people’s lives (Paris 2010; Roand Clark 2009). Epidemiological studies suggest that person-ality disorders are relatively common in community samples,with recent reports noting that approximately 10 % of adultswould meet the diagnostic criteria for at least one specific PD(Jackson and Burgess 2004; Lenzenweger et al. 2007; Lewinet al. 2005; Newton-Howes et al. 2010). These numbers aretypically based on self-report questionnaires or semi-structured diagnostic interviews that are used to collect infor-mation about the participants. Unfortunately, there is substan-tial reason to believe that these methods have important lim-itations; people with personality disorders are not alwaysaware of the impact that their behavior has on other peopleor able to identify the presence of maladaptive traits (Huprichet al. 2011; Oltmanns and Turkheimer 2006). Serious ques-tions remain about the prevalence and consequences of PDs inlight of the limitations of self-report measures.
Another problem with most studies reporting the prevalenceof PDs is that they rely on categorical diagnoses. Investigatorstypically report prevalence rates based on the number of peoplewho qualify for a diagnosis, but these diagnostic thresholds arelargely arbitrary. Contrary to this categorical method used in
T. F. Oltmanns (*) :M. M. RodriguesDepartment of Psychology, Washington University in St. Louis, St.Louis, MO 63130-4899, USAe-mail: [email protected]
Y. WeinsteinDepartment of Psychology, University of Massachusetts – Lowell,Lowell, USA
M. E. J. GleasonDepartment of Human Development and Family Sciences,University of Texas in Austin, Austin, USA
J Psychopathol Behav Assess (2014) 36:177–188DOI 10.1007/s10862-013-9389-7

prevalence studies, the field seems to have reached a consensusthat PDs are best viewed as dimensions rather than categories,regardless of whether they are defined on the basis of symptomsor personality traits (Zimmerman 2012). Several investigatorshave called for empirical efforts to identify the most meaningfulthresholds for diagnosis of PDs (Clifton and Pilkonis 2007;Cooper and Balsis 2009). A comprehensive analysis of theprevalence of personality pathology requires data that reporton the full distribution of PD symptoms in a community sample(e.g., how many people do not exhibit any symptoms of adisorder, how many exhibit one symptom, two symptoms,and so on). These descriptive data would more accuratelyportray the range of personality pathology in the com-munity and could also help identify the potential nega-tive consequences arising from sub-threshold levels ofthese disorders.
Longitudinal data that describe the course and outcomes ofpersonality disorders provide another important basis for un-derstanding these clinical problems. Many young adults whoexhibit severe personality dysfunction experience significantimprovement across the lifespan (Skodol 2008; Tackett et al.2009). Serious questions about the trajectory of PDs remainunanswered, however, particularly with regard to middle ageand later life (Oltmanns and Balsis 2011). Some clinicians andinvestigators have suggested that certain types of personalitypathology “burn out”with age while others may becomemoreevident (Engels et al. 2003; Paris 2003; Shea et al. 2009;Ullrich and Coid 2009). We do not know whether personalityproblems re-emerge later (with either similar or modifiedpresentations). Relationships between personality traits, per-sonality disorders, and symptoms of other mental disorders(e.g., major depression) have not been studied prospectively inolder adults.
The SPAN Study (St. Louis Personality and AgingNetwork) was designed to answer important questions aboutthe prevalence and impact of personality pathology in later life(Oltmanns and Gleason 2011). The first phase of this studyfocused on the identification and recruitment of participantsand completion of baseline assessments. The current paper isdivided into two sections. In the first, we describe methods weused to recruit 1,630 participants and 1,484 informants fromthe community for a study regarding the impact of personalitydisorders in midlife, including a detailed breakdown of re-cruitment success rates at each stage of the process. In thesecond section, we report descriptive data and prevalence ratesfor personality disorders in our sample at baseline, as assessedby an interviewer, the participant (self-report questionnaire),and an informant identified by the participant.
We describe our recruitment process in considerable detailbecause participation rates have received relatively little at-tention in this literature (Galea and Tracy 2007). They arefrequently taken for granted and are also widely misunder-stood. Efforts to generalize from the findings of a particular
investigation obviously depend heavily on the extent to whichthe researchers were able to recruit a representative sample ofthe population in question. Participation rates depend onmanyfactors, including the amount of time and effort involved inthe study and the number of similar requests made to everyonein the population.
Methods
Recruitment
Participants were recruited from the city of St. Louis and itssurrounding suburban areas. Potential participants were of-fered $60 to complete a 3-h assessment. St. Louis has alwaysbeen known for its ethnic and racial diversity: With the cityand adjacent county (suburbs) combined, 30 % of the popu-lation is African American, and 60 % is Caucasian. Only 2 %is Hispanic. The following protocol was used to contactpossible participants.
Selection of Target Households and Initial Contact Potentialparticipants were identified using telephone records purchasedfrom a private sampling firm. We used listed phone numbersfor two reasons. First, listed phone numbers could be checkedagainst census records to determine that someone living in thehousehold was between the ages of 55 and 64. Although theage data were not expected to be flawless, this method insuredthat most of the households did include at least one potentialparticipant.
The second reason for using listed phone numbers is thatthey are associatedwith a name and address, which allowed usto mail a personalized letter explaining the study prior to theinitial phone call. Use of informative advance letters is knownto increase response rates in survey research (Fowler 2002).This letter included a reply postcard, with which participantscould indicate their interest in the study. Households thatreturned the postcard and indicated that they were not inter-ested, or that they were not in the age range, were notcontacted again. All other households received recruitmentphone calls.
Recruitment Phone Calls Staff members and student volun-teers made the initial phone calls, which continued to be madeto a household until someone answered. If contact with aconnected phone number was not made after 12 attempts, asecond letter was sent to the household. This was our lastcontact, unless they returned a postcard (sent with the secondletter) to say they were interested in the study or wanted moreinformation.
Phone Call Outcomes When a contacted resident answeredthe phone, we asked how many people in the household were
178 J Psychopathol Behav Assess (2014) 36:177–188

within our age range. If more than one person in the householdwas eligible to participate (e.g., both husband and wife), theKish Method was used to select a target, sampling withoutreplacement (Kish 1949). There were three possible outcomesfrom a phone conversation: no eligible target was identified,an eligible target was identified and agreed to participate, or aneligible target was identified but did not agree to participate. Inthe latter case, the phone caller coded the “refusal” into one oftwo ways: 1) “do not call back” (i.e., strong refusal, veryspecific and definite) or 2) “try one more time” (i.e., ambiv-alent response).
Refusal Converter Calls If the initial phone contact was codedas “try one more time,” the target person was called againseveral weeks later and politely asked to reconsider. The useof such “refusal converter” calls is a standard procedure insurvey research because many people decline participation ifthey were contacted at a busy or difficult time, and they maylater reconsider their decision (Fowler 2002).
Follow-up Letters and Questionnaires Follow-up letters weresent to all households with an identified eligible target whohad not agreed to participate as well as all households we hadnot managed to contact over the phone, with two importantexceptions: 1) those who had sent back the initial postcardindicating that they did not want to participate, and 2) thosewho were coded as “do not call back” by the initial phonecaller. A total of 2,035 follow-up letters were sent. Of these,180 households responded positively and were added back tothe phone pool. In addition, a total of 1,859 follow-up person-ality questionnaires were sent to people who declined partic-ipation in an attempt to gather data on the characteristics ofnon-responders; a few recipients of this questionnairevolunteered to join the full study.
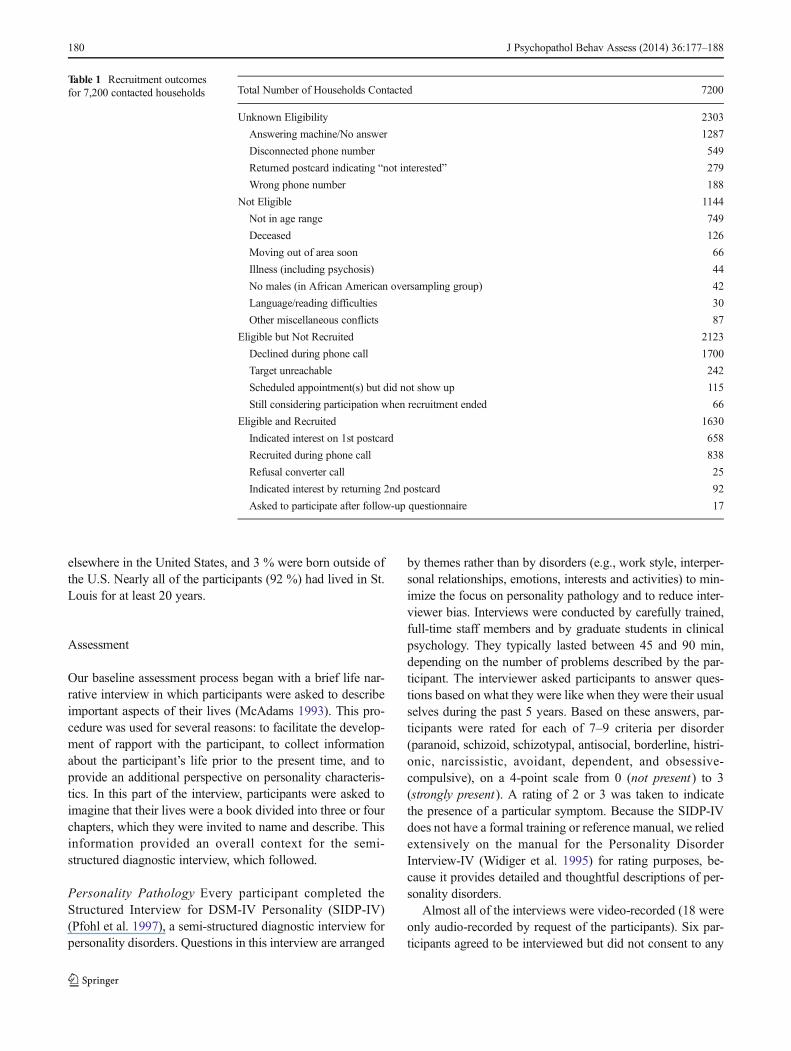
Recruitment Outcomes Table 1 summarizes the outcome ofthe recruitment process for all 7,200 contacted households,divided into four broad categories. A total of 2,303 house-holds (32 % of contacted households) were never reached byphone, and thus we never established whether an eligibletarget resided at the household. For a further 1,144 households(16 % of contacted households), we established that no eligi-ble targets resided at that household.
The next category of households in Table 1 describeshouseholds with an eligible but unrecruited target (2,123 or29 % of contacted households). In some cases, we identifiedthe presence of an eligible target in the household but nevermade contact with this person (target unreachable). In othercases, we spoke to the target and that person declined toparticipate. Others were still considering participation whenwe stopped recruiting new participants. Finally, some targetshad scheduled an appointment, but they did not show up. Newappointments were always scheduled if possible, and some
people did complete the baseline assessment after cancellingor failing to attend multiple appointments.
The final category in Table 1 describes the pathways torecruitment of all the participants in our final cohort of 1,630.The most common pathway was the situation where a house-hold did not respond to the initial letter, but a target did agreeto participate during the phone call. Our final participation ratewas 43% of eligible households (proportion of eligible peoplewho completed the baseline assessment).
Oversampling of African AmericanMen After the first 2 yearsof the project, African American men were somewhat under-represented among our early participants. Therefore, we pur-chased 300 phone numbers from sampling blocks in which atleast 90 % of the residents were listed as African American. Inthis pool, we included only homes for which the phone waslisted in a man’s name. A new letter was crafted, describingthe study and emphasizing our sincere interest in includingAfrican American participants in our study.We did not use theKish Method with these households because we weretargeting male participants. In all other respects, the recruit-ment procedures were identical to those used for other partic-ipants. This over-sampling procedure was quite successful,yielding the same participation rate in these specific samplingblocks that we obtained in the overall study (Spence andOltmanns 2011).
Informants Participants were asked to identify someone whoknew them well and who would be able to provide us with anaccurate description of their personality traits, and preferablylived with them. If that was not possible, we asked for “theperson who knows you best.” In order to serve as an infor-mant, the selected person and the participant had to talk atleast once a month and see each other face-to-face at least onceeach year. On average, informants had known the targetperson for 30 years. Approximately half of the identifiedinformants were spouses or partners; 25 % of the informantswere other family members (e.g., an adult child of the targetperson); the rest were close friends. Participants who wereunwilling or unable to provide an informant were still includ-ed in the study, but 91 % of our participants provided aninformant who completed the baseline assessment.
Final Sample The final sample consisted of 1,630 participants(55 % female) living in the St. Louis area (40%within the citylimits and 60% in the adjoining county). All participants werebetween the ages of 55 and 64 when they entered the study(mean=59.6, SD=2.7 years). With regard to race and ethnicbackground, 65 % were Caucasian, 33 % were AfricanAmerican, and 2 % were from other groups (e.g., Asian,American Indian). Thirty people described themselves asHispanic or Latino (just under the expected 2 %). Slightlymore than half (54 %) were born in St. Louis, 43 % were born
J Psychopathol Behav Assess (2014) 36:177–188 179
elsewhere in the United States, and 3 % were born outside ofthe U.S. Nearly all of the participants (92 %) had lived in St.Louis for at least 20 years.
Assessment
Our baseline assessment process began with a brief life nar-rative interview in which participants were asked to describeimportant aspects of their lives (McAdams 1993). This pro-cedure was used for several reasons: to facilitate the develop-ment of rapport with the participant, to collect informationabout the participant’s life prior to the present time, and toprovide an additional perspective on personality characteris-tics. In this part of the interview, participants were asked toimagine that their lives were a book divided into three or fourchapters, which they were invited to name and describe. Thisinformation provided an overall context for the semi-structured diagnostic interview, which followed.
Personality Pathology Every participant completed theStructured Interview for DSM-IV Personality (SIDP-IV)(Pfohl et al. 1997), a semi-structured diagnostic interview forpersonality disorders. Questions in this interview are arranged
by themes rather than by disorders (e.g., work style, interper-sonal relationships, emotions, interests and activities) to min-imize the focus on personality pathology and to reduce inter-viewer bias. Interviews were conducted by carefully trained,full-time staff members and by graduate students in clinicalpsychology. They typically lasted between 45 and 90 min,depending on the number of problems described by the par-ticipant. The interviewer asked participants to answer ques-tions based on what they were like when they were their usualselves during the past 5 years. Based on these answers, par-ticipants were rated for each of 7–9 criteria per disorder(paranoid, schizoid, schizotypal, antisocial, borderline, histri-onic, narcissistic, avoidant, dependent, and obsessive-compulsive), on a 4-point scale from 0 (not present ) to 3(strongly present ). A rating of 2 or 3 was taken to indicatethe presence of a particular symptom. Because the SIDP-IVdoes not have a formal training or reference manual, we reliedextensively on the manual for the Personality DisorderInterview-IV (Widiger et al. 1995) for rating purposes, be-cause it provides detailed and thoughtful descriptions of per-sonality disorders.
Almost all of the interviews were video-recorded (18 wereonly audio-recorded by request of the participants). Six par-ticipants agreed to be interviewed but did not consent to any
Table 1 Recruitment outcomesfor 7,200 contacted households Total Number of Households Contacted 7200
Unknown Eligibility 2303
Answering machine/No answer 1287
Disconnected phone number 549
Returned postcard indicating “not interested” 279
Wrong phone number 188
Not Eligible 1144
Not in age range 749
Deceased 126
Moving out of area soon 66
Illness (including psychosis) 44
No males (in African American oversampling group) 42
Language/reading difficulties 30
Other miscellaneous conflicts 87
Eligible but Not Recruited 2123
Declined during phone call 1700
Target unreachable 242
Scheduled appointment(s) but did not show up 115
Still considering participation when recruitment ended 66
Eligible and Recruited 1630
Indicated interest on 1st postcard 658
Recruited during phone call 838
Refusal converter call 25
Indicated interest by returning 2nd postcard 92
Asked to participate after follow-up questionnaire 17
180 J Psychopathol Behav Assess (2014) 36:177–188
type of recording. We randomly selected 265 of the video-recorded interviews to be rated again by an independent judge(another member of the team). The overall reliability (com-puted using intraclass correlations and the One-Way Randommodel) was .67. The reliabilities for specific DSM-IV PDs(treated as continuous scores) were: schizoid PD, .75;schizotypal PD, .68; paranoid PD, .53; antisocial PD, .69;borderline PD, .77; histrionic PD, .54; narcissistic PD, .75;avoidant PD, .86; dependent PD, .73; and obsessive compul-sive PD, .62.
Mood Disorders and Psychosis We used the ComputerizedDiagnostic Interview Schedule (C-DIS-IV) screener to identi-fy lifetime and 12-month prevalence of major depression,dysthymia, mania and hypomania, and psychosis. The C-DIS-IV (Robins and Helzer 1994) is an assessment that wasdeveloped for non-clinicians to collect information thatcould be used to generate psychiatric diagnoses according toDSM-IV.
Substance Use Disorders The MINI-InternationalNeuropsychiatric Interview (M.I.N.I.) (Sheehan et al. 1998)is a brief, easy to administer structured interview to diagnoseDSM-IVAxis I disorders. In our study, it was used to measurealcohol dependence and abuse as well as dependence andabuse associated with other drugs. In keeping with the aimsof the study, the criteria for current alcohol dependence andabuse were expanded to include problems experienced acrossthe lifetime. We thus assessed alcohol and drug dependenceand abuse over two time-periods: the past 12 months andacross the lifetime.
Personality Pathology Questionnaire The MultisourceAssessment of Personality Pathology (MAPP) was also ad-ministered to participants and to informants (who were askedto provide answers with respect to the participant). It was usedas a complementary measure of personality pathology. Thisquestionnaire was developed from peer nomination proce-dures used in our previous study with military recruits(Oltmanns and Turkheimer 2006). The MAPP includes oneitem corresponding to each diagnostic feature for the 10 per-sonality disorders listed in DSM-IV. Items were constructed bytranslating the DSM-IV criterion sets for PDs into languagethat avoids use of technical psychopathological terms andpsychiatric jargon.
Treatment for Mental Health Problems We also asked partic-ipants if they had ever “received treatment for a mental disor-der or advice from amental health professional on problems inlife.” If they had received treatment, we asked them to indicatewhen and for how long they had been treated, what kind oftreatment they had received, and for what kind of problemthey had been treated.
Results
Demographic Variables
Education, Income, and Employment Only 3 % of our partic-ipants had less than a high school education. Another 29 %listed a high school degree or its equivalent as their highesteducational level. The others (68 %) all had some furthereducation, with 26 % reporting a Bachelor’s degree, 19 %reporting a master’s degree, and 7 % reporting a doctoral degreeas their highest level of educational achievement.
Our participants represented a wide range of income levels.At the lowest end, 12% of our participants lived in householdsthat earned less than $20,000 per year (below the povertyline). Another 18 % earned between $20,000 and $39,999;20 % earned between $40,000 and $59,999; 13 % earnedbetween $60,000 and $79,000; 10 % earned between $80,000 and $99,999; 7 % earned between $100,000 and $119,999; 4 % earned between $120,000 and $139,999; and 11 %earned more than $140,000 annually. Five percent of theparticipants did not report their income. Our sample, as awhole, had slightly higher incomes than the median householdincome in St. Louis, which was $55,500 in 2008 according tothe U.S. Census (note: our baseline assessments began in late2007 and continued throughout the recession).
Two-thirds (66%) of our participants were employed eitherpart time or full time when they came in for their baselineassessment; 9 % were unemployed due to disability anda further 4 % were seeking employment. Thirty threepercent of the participants had retired from at least oneprofession, but some of those had subsequently taken otheremployment.
Marital History When asked to describe their current maritalstatus, 48 % of the participants said that they were currentlymarried, 28 % divorced, 2 % separated, 7 % widowed, and15 % were single. We also asked participants about theirmarital history: among the 794 participants who had ever beendivorced, 73 % had been divorced only once, 21 % had beendivorced twice, and 6 % had been divorced three to five times.
Prevalence of PDs
Personality disorders were assessed using three sources ofinformation: the semi-structured diagnostic interview (admin-istered to all 1,630 participants), a self-report questionnaire (1,608 participants), and the informant-report questionnaire (1,447 participants). We first discuss the prevalence of PDsidentified by the clinical interview and then turn to com-parisons among the three sources of data for the participantswho provided enough data to examine prevalence from allperspectives.
J Psychopathol Behav Assess (2014) 36:177–188 181

According to the SIDP, 134 participants (8.2 %) metcriteria for at least one personality disorder, and an additional30 participants (1.8 %) qualified for a diagnosis of personalitydisorder not otherwise specified (PDNOS). We definedPDNOS as the presence of ten or more miscellaneous criteriaacross all of the PDswithout meeting the specific threshold fora diagnosis of any one type of PD (Pagan et al. 2005; Verheuland Widiger 2004). In Table 2, we present the number ofmales and females in the sample who qualified for eachpersonality disorder, as well as the number who fell onecriterion short. Note that these numbers are not mutuallyexclusive because a small number of participants (16) quali-fied for two or three PDs. None qualified for more than threePDs. The most frequently observed types were avoidant PD(2.5 %) and obsessive compulsive PD (2.9 %). Another 3.7 %of the participants fell only one criterion short of qualifying fora diagnosis of OCPD. The least frequently observed typeswere schizotypal PD (0.1 %), dependent PD (0.1 %), andhistrionic PD (0.2 %).
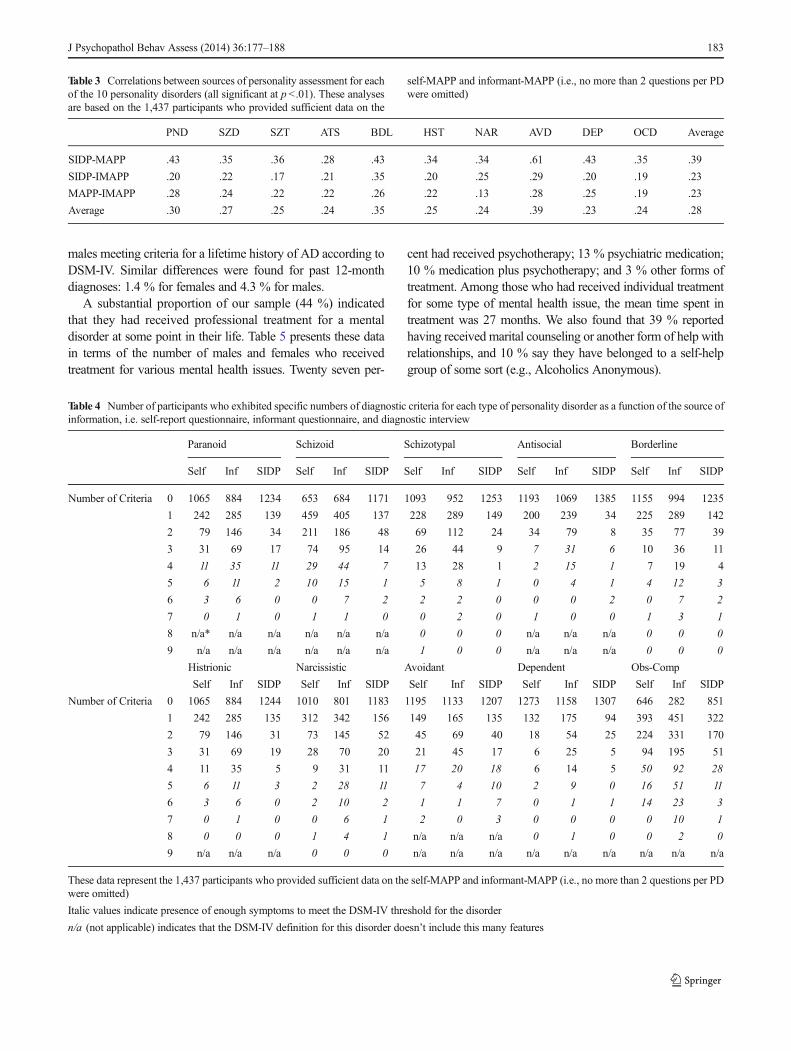
Our next aim was to compare the diagnostic properties ofthe SIDP interview with the self-report and informant-reportMAPP. Table 3 presents the correlations between each of thesethree measures for every specific PD. Correlations were low tomoderate, indicating that the SIDP, self-MAPP, andinformant-MAPP identify some of the same symptoms, butthey also provide unique information about individuals. Thehighest correlations were observed between the SIDP and theself-MAPP, and the lowest between the SIDP and theinformant-MAPP. Avoidant PD and borderline PD showedthe highest levels of concordance among the three sources ofpersonality assessment (average correlations of .39 and .35respectively).
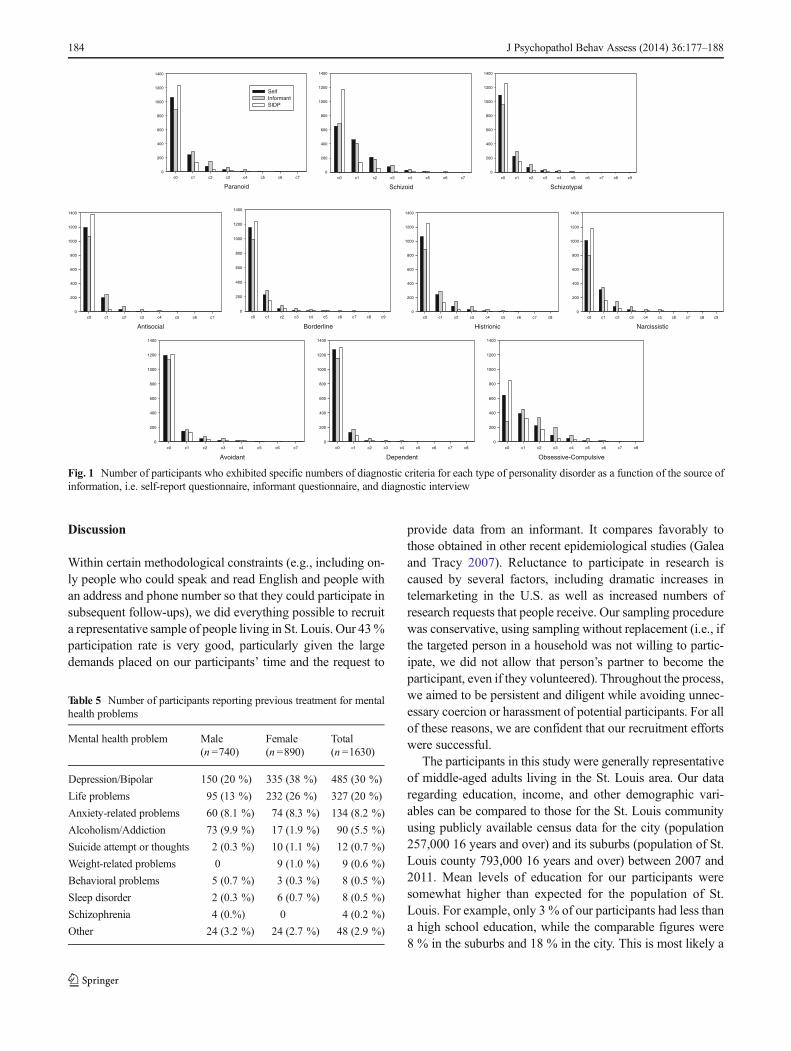
Another way of reporting the prevalence of different PDtypes is to examine the specific numbers of symptoms
(diagnostic criteria) that were exhibited by participants (seeTable 4 and Fig. 1) according to each source of information.For the purposes of this comparison, we looked at the numberof endorsed criteria for each PD based on the SIDP as com-pared with the self-MAPP and informant-MAPP. Criteriawere considered to have been endorsed if one of the top tworating points was assigned to a given criterion on any of thequestionnaires. For the SIDP, this means that the interviewerdeemed the trait to be “present” or “strongly present” in theparticipant, and for the MAPP the participant or informantsaid the target person was “often” or “always” like this. Withthe notable exception of avoidant PD, we found that theinformant MAPP was less conservative than the SIDP or theself-MAPP; informants endorsed the presence of more symp-toms across nine PD types. For schizoid and schizotypal PD,the self-MAPP was also less conservative than the SIDPinterview.
Mood Disorders, Alcohol Dependence, and Mental HealthTreatment
According to the C-DIS, 24.8 % of our participants (17.1 %males and 31.2% females) met criteria for a lifetime diagnosisof major depressive disorder (MDD). Only 4.3 % of theparticipants (3.0 % males and 5.4 % females) met criteria fora diagnosis of MDD within the past 12 months. Mean age atonset was 35.3 years, mean age at most recent episode was43.7, and mean number of episodes was 3.9. Regarding othermood disorders, 2.8 % met criteria for a lifetime diagnosis ofbipolar disorder, and 3.4 % met criteria for a lifetime diagnosisof dysthymic disorder. The prevalence of alcohol dependence(AD), based on the M.I.N.I., was 2.7 % for the past 12 monthsand 15.9% lifetime. Gender differences in ADwere significant,as expected, with 8.8 % of females compared with 24.9 % of
Table 2 Number of participants meeting diagnostic criteria (and falling one criterion short of a diagnosis) for each type of personality disorder based onthe diagnostic interview (SIDP-IV)
% of sample meeting criteria % of sample falling one criterion short (sub-threshold)
Male (n =740) Female (n =890) Total (n=1630) Male (n =740) Female (n =890) Total (n =1630)
Paranoid 6 (0.8 %) 7 (0.8 %) 13 (0.8 %) 6 (0.8 %) 12 (1.3 %) 18 (1.1 %)
Schizoid 10 (1.4 %) 1 (0.1 %) 11 (0.7 %) 11 (1.5 %) 9 (1.0 %) 20 (1.2 %)
Schizotypal 0 1 (0.1 %) 1 (0.1 %) 1 (0.1 %) 0 1 (0.1 %)
Antisocial 9 (1.2 %) 0 9 (0.6 %) 7 (0.9 %) 1 (0.1 %) 8 (0.5 %)
Borderline 3 (0.4 %) 4 (0.4 %) 7 (0.4 %) 2 (0.3 %) 2 (0.2 %) 4 (0.2 %)
Histrionic 1 (0.1 %) 2 (0.2 %) 3 (0.2 %) 2 (0.3 %) 3 (0.3 %) 5 (0.3 %)
Narcissistic 17 (2.3 %) 3 (0.3 %) 20 (1.2 %) 10 (1.4 %) 3 (0.3 %) 13 (0.8 %)
Avoidant 13 (1.8 %) 28 (3.1 %) 41 (2.5 %) 8 (1.1 %) 9 (1.0 %) 17 (1.0 %)
Dependent 1 (0.1 %) 1 (0.1 %) 2 (0.1 %) 3 (0.1 %) 3 (0.3 %) 6 (0.4 %)
Obsessive-compulsive 28 (3.8 %) 19 (2.1 %) 47 (2.9 %) 33 (2.9 %) 27 (3.0 %) 60 (3.7 %)
182 J Psychopathol Behav Assess (2014) 36:177–188
males meeting criteria for a lifetime history of AD according toDSM-IV. Similar differences were found for past 12-monthdiagnoses: 1.4 % for females and 4.3 % for males.
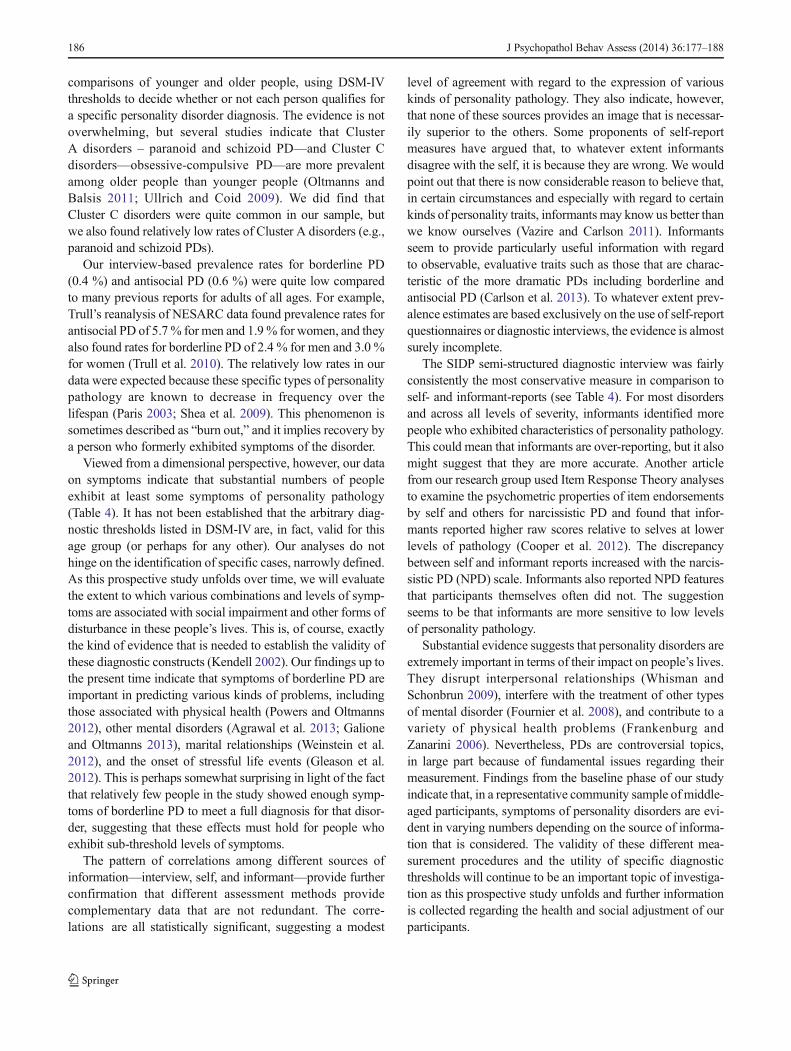
A substantial proportion of our sample (44 %) indicatedthat they had received professional treatment for a mentaldisorder at some point in their life. Table 5 presents these datain terms of the number of males and females who receivedtreatment for various mental health issues. Twenty seven per-
cent had received psychotherapy; 13 % psychiatric medication;10 % medication plus psychotherapy; and 3 % other forms oftreatment. Among those who had received individual treatmentfor some type of mental health issue, the mean time spent intreatment was 27 months. We also found that 39 % reportedhaving received marital counseling or another form of help withrelationships, and 10 % say they have belonged to a self-helpgroup of some sort (e.g., Alcoholics Anonymous).
Table 3 Correlations between sources of personality assessment for eachof the 10 personality disorders (all significant at p <.01). These analysesare based on the 1,437 participants who provided sufficient data on the
self-MAPP and informant-MAPP (i.e., no more than 2 questions per PDwere omitted)
PND SZD SZT ATS BDL HST NAR AVD DEP OCD Average
SIDP-MAPP .43 .35 .36 .28 .43 .34 .34 .61 .43 .35 .39
SIDP-IMAPP .20 .22 .17 .21 .35 .20 .25 .29 .20 .19 .23
MAPP-IMAPP .28 .24 .22 .22 .26 .22 .13 .28 .25 .19 .23
Average .30 .27 .25 .24 .35 .25 .24 .39 .23 .24 .28
Table 4 Number of participants who exhibited specific numbers of diagnostic criteria for each type of personality disorder as a function of the source ofinformation, i.e. self-report questionnaire, informant questionnaire, and diagnostic interview
Paranoid Schizoid Schizotypal Antisocial Borderline
Self Inf SIDP Self Inf SIDP Self Inf SIDP Self Inf SIDP Self Inf SIDP
Number of Criteria 0 1065 884 1234 653 684 1171 1093 952 1253 1193 1069 1385 1155 994 1235
1 242 285 139 459 405 137 228 289 149 200 239 34 225 289 142
2 79 146 34 211 186 48 69 112 24 34 79 8 35 77 39
3 31 69 17 74 95 14 26 44 9 7 31 6 10 36 11
4 11 35 11 29 44 7 13 28 1 2 15 1 7 19 4
5 6 11 2 10 15 1 5 8 1 0 4 1 4 12 3
6 3 6 0 0 7 2 2 2 0 0 0 2 0 7 2
7 0 1 0 1 1 0 0 2 0 1 0 0 1 3 1
8 n/a* n/a n/a n/a n/a n/a 0 0 0 n/a n/a n/a 0 0 0
9 n/a n/a n/a n/a n/a n/a 1 0 0 n/a n/a n/a 0 0 0
Histrionic Narcissistic Avoidant Dependent Obs-Comp
Self Inf SIDP Self Inf SIDP Self Inf SIDP Self Inf SIDP Self Inf SIDP
Number of Criteria 0 1065 884 1244 1010 801 1183 1195 1133 1207 1273 1158 1307 646 282 851
1 242 285 135 312 342 156 149 165 135 132 175 94 393 451 322
2 79 146 31 73 145 52 45 69 40 18 54 25 224 331 170
3 31 69 19 28 70 20 21 45 17 6 25 5 94 195 51
4 11 35 5 9 31 11 17 20 18 6 14 5 50 92 28
5 6 11 3 2 28 11 7 4 10 2 9 0 16 51 11
6 3 6 0 2 10 2 1 1 7 0 1 1 14 23 3
7 0 1 0 0 6 1 2 0 3 0 0 0 0 10 1
8 0 0 0 1 4 1 n/a n/a n/a 0 1 0 0 2 0
9 n/a n/a n/a 0 0 0 n/a n/a n/a n/a n/a n/a n/a n/a n/a
These data represent the 1,437 participants who provided sufficient data on the self-MAPP and informant-MAPP (i.e., no more than 2 questions per PDwere omitted)
Italic values indicate presence of enough symptoms to meet the DSM-IV threshold for the disorder
n/a (not applicable) indicates that the DSM-IV definition for this disorder doesn’t include this many features
J Psychopathol Behav Assess (2014) 36:177–188 183
Discussion
Within certain methodological constraints (e.g., including on-ly people who could speak and read English and people withan address and phone number so that they could participate insubsequent follow-ups), we did everything possible to recruita representative sample of people living in St. Louis. Our 43%participation rate is very good, particularly given the largedemands placed on our participants’ time and the request to
provide data from an informant. It compares favorably tothose obtained in other recent epidemiological studies (Galeaand Tracy 2007). Reluctance to participate in research iscaused by several factors, including dramatic increases intelemarketing in the U.S. as well as increased numbers ofresearch requests that people receive. Our sampling procedurewas conservative, using sampling without replacement (i.e., ifthe targeted person in a household was not willing to partic-ipate, we did not allow that person’s partner to become theparticipant, even if they volunteered). Throughout the process,we aimed to be persistent and diligent while avoiding unnec-essary coercion or harassment of potential participants. For allof these reasons, we are confident that our recruitment effortswere successful.
The participants in this study were generally representativeof middle-aged adults living in the St. Louis area. Our dataregarding education, income, and other demographic vari-ables can be compared to those for the St. Louis communityusing publicly available census data for the city (population257,000 16 years and over) and its suburbs (population of St.Louis county 793,000 16 years and over) between 2007 and2011. Mean levels of education for our participants weresomewhat higher than expected for the population of St.Louis. For example, only 3 % of our participants had less thana high school education, while the comparable figures were8 % in the suburbs and 18 % in the city. This is most likely a
Paranoid
c0 c1 c2 c3 c4 c5 c6 c70
200
400
600
800
1000
1200
1400
SelfInformantSIDP
Schizoid
c0 c1 c2 c3 c4 c5 c6 c70
200
400
600
800
1000
1200
1400
Schizotypal
c0 c1 c2 c3 c4 c5 c6 c7 c8 c90
200
400
600
800
1000
1200
1400
Antisocial
c0 c1 c2 c3 c4 c5 c6 c70
200
400
600
800
1000
1200
1400
Borderline
c0 c1 c2 c3 c4 c5 c6 c7 c8 c90
200
400
600
800
1000
1200
1400
Histrionic
c0 c1 c2 c3 c4 c5 c6 c7 c80
200
400
600
800
1000
1200
1400
Narcissistic
c0 c1 c2 c3 c4 c5 c6 c7 c8 c90
200
400
600
800
1000
1200
1400
Avoidant
c0 c1 c2 c3 c4 c5 c6 c70
200
400
600
800
1000
1200
1400
Dependent
c0 c1 c2 c3 c4 c5 c6 c7 c80
200
400
600
800
1000
1200
1400
Obsessive-Compulsive
c0 c1 c2 c3 c4 c5 c6 c7 c80
200
400
600
800
1000
1200
1400
Fig. 1 Number of participants who exhibited specific numbers of diagnostic criteria for each type of personality disorder as a function of the source ofinformation, i.e. self-report questionnaire, informant questionnaire, and diagnostic interview
Table 5 Number of participants reporting previous treatment for mentalhealth problems
Mental health problem Male(n =740)
Female(n =890)
Total(n =1630)
Depression/Bipolar 150 (20 %) 335 (38 %) 485 (30 %)
Life problems 95 (13 %) 232 (26 %) 327 (20 %)
Anxiety-related problems 60 (8.1 %) 74 (8.3 %) 134 (8.2 %)
Alcoholism/Addiction 73 (9.9 %) 17 (1.9 %) 90 (5.5 %)
Suicide attempt or thoughts 2 (0.3 %) 10 (1.1 %) 12 (0.7 %)
Weight-related problems 0 9 (1.0 %) 9 (0.6 %)
Behavioral problems 5 (0.7 %) 3 (0.3 %) 8 (0.5 %)
Sleep disorder 2 (0.3 %) 6 (0.7 %) 8 (0.5 %)
Schizophrenia 4 (0.%) 0 4 (0.2 %)
Other 24 (3.2 %) 24 (2.7 %) 48 (2.9 %)
184 J Psychopathol Behav Assess (2014) 36:177–188

result of excluding potential participants who were unable toread, which was necessary in order to be sure that question-naires were completed in a meaningful way.
Median household income in our sample was between $40,000 and $60,000 per year, and this figure matches closely withdata from the metropolitan area. In the suburbs of St. Louis,median household income was approximately $58,000 and inthe city it was $34,000 during the time that our baseline datawere collected. Of course, there was a wide range of incomeamong our participants, with 12 % having a total householdincome below $20,000 and 26 %making more than $100,000annually. For the sake of comparison, the poverty line for afamily of 4 in the U.S. was $22,000. The U.S. census reportedthat between 2007 and 2011, 10 % of the residents of thesuburbs of St. Louis lived in poverty, and 26% of the residentsof the city of St. Louis lived in poverty. At the other end of thedistribution, 26 % of households in the St. Louis suburbsmade more than $100,000 per year and 11 % of householdsin the city made more than $100,00 per year. Our sample istherefore fairly similar to the population of the combined St.Louis metropolitan area with regard to the distribution ofincome.
According to the C-DIS, 24.8 % of our participants (wom-en 31.2 % and men 17.1 %) met criteria for a lifetime diag-nosis of major depressive disorder (MDD). According to theM.I.N.I., 15.9 % of the participants met criteria for a lifetimediagnosis of alcohol dependence. These overall rates and thepatterns of gender differences for depression and alcohol usedisorders are similar to figures reported from previous epide-miological studies in the U.S. (Grant et al. 2006; Kessler et al.2005). The lifetime prevalence rate for MDD was somewhathigher than has been reported in some studies, likely becausethe C-DIS screener we used does not include some rule-outsthat are present in the full Diagnostic Interview Schedule(DIS).
Many of our participants had received mental health ser-vices. This aspect of our results serves to emphasize theimportant point that representative community samples doinclude people with significant mental health problems.Unfortunately, this point is sometimes lost in discussionsregarding the value of different approaches to psychopathol-ogy research in general and personality disorders in particular.Community samples are sometimes called non-clinical sam-ples. While that expression may be technically correct, in thesense that the participants are not all selected on the basis ofbeing in treatment, the label should not be taken to mean thatthe sample is free of psychopathology. Samples of clinicalpatients do, in fact, provide useful information about thenature of personality disorders, but they have the drawbackof providing data from people who may also suffer from aneven higher proportion of co-morbid conditions, such as ma-jor depression and substance use disorders, which often pro-vide the critical motivation for seeking professional treatment
(Hopwood et al. 2008). In a large community sample likeours, it is possible to examine a variety of questions aboutthe nature and impact of personality pathology that could notbe answered in a clinical sample. For example, we haveexamined the extent to which people who exhibit features ofpersonality disorders are more (or less) likely than others toseek treatment from mental health professionals (Lawton andOltmanns 2013).
The reliability of the SIDP-IV diagnostic interview wasacceptable, with values for specific DSM-IV PDs (treated ascontinuous scores) ranging from .86 for avoidant PD to .53 forparanoid PD. These values compare favorably to reliabilityestimates for PD diagnoses in other studies (Zanarini et al.2000). As expected, reliability was better for some types ofpersonality disorders than for others. Several factors may beresponsible for differences between diagnostic types. Oneimportant consideration is the frequency of various symptomsand disorders in the sample. A few diagnostic disagreementscan have a more pronounced effect on reliability when thebase rate of the disorder in the sample is either very low orhigh. Several additional factors may also have influenced therange of scores, such as the extent to which specific diagnosticcriteria are subjectively defined or can be easily observed(Jane et al. 2006).
Because we examined three different perspectives on per-sonality pathology (self, informant, and interviewer), our dataprovide unique insights regarding the prevalence of personal-ity pathology in a representative sample of middle-aged com-munity residents. If we focus exclusively on data providedfrom the semi-structured interview and adopt a DSM-IVcategorical approach to the diagnosis of personality disorders,the prevalence rates found in our sample using the SIDP-IV(10%)match fairly closely the rates that have been reported inprevious community studies (Lenzenweger et al. 2007; Trullet al. 2010). However, while 7 % of our participants metcriteria for exactly one type of PD, only 1 % met criteria fortwo or three disorders. The latter percentage is much lowerthan has been reported previously, especially in clinical sam-ples, where rates of co-morbidity are surely inflated. Thesupposed high rate of co-morbidity has been one of the mostimportant criticisms of the current DSM-IV system for diag-nosing PDs (Zimmerman 2012). Our data suggest that theproblem of co-morbidity may be somewhat exaggerated. Wealso found that only 2 % of the people in our sample qualifiedfor a diagnosis of PDNOS. Critics of the DSM-IV classifica-tion system have argued that PDNOS is the most commontype of personality pathology. Again, our data contradict thatclaim.
The most common PD types in our sample were avoidantand obsessive-compulsive. That finding is consistent withother community studies and was expected given the age ofour sample. Evidence regarding the prevalence of specificpersonality disorders in later life comes from cross-sectional
J Psychopathol Behav Assess (2014) 36:177–188 185
comparisons of younger and older people, using DSM-IVthresholds to decide whether or not each person qualifies fora specific personality disorder diagnosis. The evidence is notoverwhelming, but several studies indicate that ClusterA disorders – paranoid and schizoid PD—and Cluster Cdisorders—obsessive-compulsive PD—are more prevalentamong older people than younger people (Oltmanns andBalsis 2011; Ullrich and Coid 2009). We did find thatCluster C disorders were quite common in our sample, butwe also found relatively low rates of Cluster A disorders (e.g.,paranoid and schizoid PDs).
Our interview-based prevalence rates for borderline PD(0.4 %) and antisocial PD (0.6 %) were quite low comparedto many previous reports for adults of all ages. For example,Trull’s reanalysis of NESARC data found prevalence rates forantisocial PD of 5.7 % for men and 1.9% for women, and theyalso found rates for borderline PD of 2.4 % for men and 3.0 %for women (Trull et al. 2010). The relatively low rates in ourdata were expected because these specific types of personalitypathology are known to decrease in frequency over thelifespan (Paris 2003; Shea et al. 2009). This phenomenon issometimes described as “burn out,” and it implies recovery bya person who formerly exhibited symptoms of the disorder.
Viewed from a dimensional perspective, however, our dataon symptoms indicate that substantial numbers of peopleexhibit at least some symptoms of personality pathology(Table 4). It has not been established that the arbitrary diag-nostic thresholds listed in DSM-IV are, in fact, valid for thisage group (or perhaps for any other). Our analyses do nothinge on the identification of specific cases, narrowly defined.As this prospective study unfolds over time, we will evaluatethe extent to which various combinations and levels of symp-toms are associated with social impairment and other forms ofdisturbance in these people’s lives. This is, of course, exactlythe kind of evidence that is needed to establish the validity ofthese diagnostic constructs (Kendell 2002). Our findings up tothe present time indicate that symptoms of borderline PD areimportant in predicting various kinds of problems, includingthose associated with physical health (Powers and Oltmanns2012), other mental disorders (Agrawal et al. 2013; Galioneand Oltmanns 2013), marital relationships (Weinstein et al.2012), and the onset of stressful life events (Gleason et al.2012). This is perhaps somewhat surprising in light of the factthat relatively few people in the study showed enough symp-toms of borderline PD to meet a full diagnosis for that disor-der, suggesting that these effects must hold for people whoexhibit sub-threshold levels of symptoms.
The pattern of correlations among different sources ofinformation—interview, self, and informant—provide furtherconfirmation that different assessment methods providecomplementary data that are not redundant. The corre-lations are all statistically significant, suggesting a modest
level of agreement with regard to the expression of variouskinds of personality pathology. They also indicate, however,that none of these sources provides an image that is necessar-ily superior to the others. Some proponents of self-reportmeasures have argued that, to whatever extent informantsdisagree with the self, it is because they are wrong. We wouldpoint out that there is now considerable reason to believe that,in certain circumstances and especially with regard to certainkinds of personality traits, informants may know us better thanwe know ourselves (Vazire and Carlson 2011). Informantsseem to provide particularly useful information with regardto observable, evaluative traits such as those that are charac-teristic of the more dramatic PDs including borderline andantisocial PD (Carlson et al. 2013). To whatever extent prev-alence estimates are based exclusively on the use of self-reportquestionnaires or diagnostic interviews, the evidence is almostsurely incomplete.
The SIDP semi-structured diagnostic interview was fairlyconsistently the most conservative measure in comparison toself- and informant-reports (see Table 4). For most disordersand across all levels of severity, informants identified morepeople who exhibited characteristics of personality pathology.This could mean that informants are over-reporting, but it alsomight suggest that they are more accurate. Another articlefrom our research group used Item Response Theory analysesto examine the psychometric properties of item endorsementsby self and others for narcissistic PD and found that infor-mants reported higher raw scores relative to selves at lowerlevels of pathology (Cooper et al. 2012). The discrepancybetween self and informant reports increased with the narcis-sistic PD (NPD) scale. Informants also reported NPD featuresthat participants themselves often did not. The suggestionseems to be that informants are more sensitive to low levelsof personality pathology.
Substantial evidence suggests that personality disorders areextremely important in terms of their impact on people’s lives.They disrupt interpersonal relationships (Whisman andSchonbrun 2009), interfere with the treatment of other typesof mental disorder (Fournier et al. 2008), and contribute to avariety of physical health problems (Frankenburg andZanarini 2006). Nevertheless, PDs are controversial topics,in large part because of fundamental issues regarding theirmeasurement. Findings from the baseline phase of our studyindicate that, in a representative community sample ofmiddle-aged participants, symptoms of personality disorders are evi-dent in varying numbers depending on the source of informa-tion that is considered. The validity of these different mea-surement procedures and the utility of specific diagnosticthresholds will continue to be an important topic of investiga-tion as this prospective study unfolds and further informationis collected regarding the health and social adjustment of ourparticipants.
186 J Psychopathol Behav Assess (2014) 36:177–188
Acknowledgments This research was supported by a grant from theU.S. National Institute of Mental Health (RO1-MH077840). We areextremely grateful to Linda Cottler (Department of Epidemiology, Uni-versity of Florida) and her research team for invaluable advice regardingsampling and recruitment procedures. Several staff members and gradu-ate students have made substantial contributions to this project, includingChristie Spence, Abigail Powers, Erin Lawton, Janine Galione, JulietteIacovino, Hannah King, Krystle Disney, Andy Shields, Tami Perkins,AmberWilson, Rickey Louis, and Josh Oltmanns. Finally, we would alsolike to thank our most recent cohort of research assistants: Téa RodriguesMenezes, Aurelia Elise Jackson, and Molly Alison Elizabeth Nield.
Oh behalf of all authors, the corresponding author states that there is noconflict of interest. This project was approved by the Washington Uni-versity Institutional Review Board. All participants and informants pro-vided written, informed consent prior to joining the baseline assessmentprocedure.
References
Agrawal, A., Narayanon, G., & Oltmanns, T. F. (2013). Personalitypathology and alcohol dependence at midlife in a community sam-
Carlson, E.N., Vazire, S., & Oltmanns, T.F. (2013). Self-other knowledgeasymmetries in personality pathology. Journal of Personality, 81 ,155–170.
Clifton, A., & Pilkonis, P. A. (2007). Evidence for a single latent class ofDiagnostic and Statistical Manual of Mental Disorders borderlinepersonality pathology. Comprehensive Psychiatry, 48, 70–78.
Cooper, L. D., & Balsis, S. (2009). When less is more: how fewerdiagnostic criteria can indicate greater severity. PsychologicalAssessment, 21, 285–293.
Cooper, L. D., Balsis, S., & Oltmanns, T. F. (2012). Self- and informant-reported perspectives on symptoms of narcissistic personality disor-der. Personality Disorders: Theory, Research, and Treatment, 3 ,140–154.
Engels, G. I., Duijsens, I. J., Haringsma, R., & van Putten, C. M. (2003).Personality disorders in the elderly compared to four younger agegroups: a cross-sectional study of community residents and mentalhealth patients. Journal of Personality Disorders, 17 , 447–459.
Fournier, J. C., DeRubeis, R. J., Shelton, R. C., Gallop, R., Amsterdam, J.D., & Hollon, S. D. (2008). Antidepressant medications v. cognitivetherapy in people with depression with or without personality dis-order. British Journal of Psychiatry, 192 , 124–129.
Fowler, F. (2002). Survey researchmethods (3rd ed.). ThousandOaks: Sage.Frankenburg, F. R., & Zanarini, M. C. (2006). Personality disorders and
medical comorbidity. Current Opinion in Psychiatry, 19 , 428–431.Galea, S., & Tracy, M. (2007). Participation rates in epidemiologic
studies. Annals of Epidemiology, 17, 643–653.Galione, J., & Oltmanns, T.F. (2013). The relationship between borderline
personality disorder and major depression in later life: acute versustemperamental symptoms. American Journal of Geriatric Psychiatry,21 , 747–756.
Gleason, M. E. J., Powers, A. D., & Oltmanns, T. F. (2012). The enduringimpact of borderline personality pathology: risk for threatening lifeevents in later middle-age. Journal of Abnormal Psychology, 121 ,447–457.
Grant, B. F., Stinson, F. S., Dawson, D. A., Chou, S., Dufour, M. C.,Compton, W., et al. (2006). Prevalence and co-occurrence of sub-stance use disorders and independent mood and anxiety disorders:results from the National Epidemiologic Survey on Alcohol andRelated Conditions. Alcohol Research & Health, 29, 107–120.
Hopwood, C. J., Quigley, B. D., Grilo, C. M., Sanislow, C. A.,McGlashan, T. H., Yen, S., et al. (2008). Personality traits andmental health treatment utilization. Personality and Mental Health,2 , 207–217.
Huprich, S. K., Bornstein, R. F., & Schmitt, T. A. (2011). Self-reportmethodology is insufficient for improving the assessment and clas-sification of Axis II personality disorders. Journal of PersonalityDisorders, 25, 557–570.
Jackson, H. J., & Burgess, P. M. (2004). Personality disorders in thecommunity: results from the Australian National Survey of MentalHealth and Well-Being Part III: relationships between specific typeof personality disorder, Axis 1 mental disorders and physical con-ditions with disability and health consultations. Social Psychiatryand Psychiatric Epidemiology, 39, 765–776.
Jane, J. S., Pagan, J. L., Fiedler, E. R., Turkheimer, E., & Oltmanns, T. F.(2006). The interrater reliability of the Structured Interview forDSM-IV Personality. Comprehensive Psychiatry, 47 , 368–375.
Kendell, R. E. (2002). The distinction between personality disorder andmental illness. British Journal of Psychiatry, 180 , 110–115.
Kessler, R. C., Berglund, P., Demler, O., Jin, R., Merikangas, K. R., &Walters, E. E. (2005). Lifetime prevalence and age-of-onset distri-butions of DSM-IV disorders in the national comorbidity surveyreplication. Archives of General Psychiatry, 62, 593–602.
Kish, L. (1949). A procedure for objective respondent selection within thehousehold. Journal of the American Statistical Association, 44 ,380–387.
Lawton, E. M., & Oltmanns, T. F. (2013). Personality pathology andmental health treatment seeking in a community sample of olderadults. Personality and Mental Health, 7 , 203–212.
Lenzenweger, M. F., Lane, M. C., Loranger, A. W., & Kessler, R. C.(2007). DSM-IV personality disorders in the national comorbiditysurvey replication. Biological Psychiatry, 62 , 553–564.
Lewin, T. J., Slade, T., Andrews, G., Carr, V. J., & Hornabrook, C. W.(2005). Assessing personality disorders in a national mentalhealth survey. Social Psychiatry and Psychiatric Epidemiology, 40 ,87–98.
McAdams, D. P. (1993). The stories we live by: Personal myths and themaking of the self . New York: The Guilford Press.
Newton-Howes, G., Tyrer, P., Anagnostakis, K., Cooper, S., Bowden-Jones, O., & Weaver, T. (2010). The prevalence of personalitydisorder, its comorbidity with mental state disorders, and its clinicalsignificance in community mental health teams. Social Psychiatryand Psychiatric Epidemiology, 45, 453–460.
Oltmanns, T. F., & Balsis, S. (2011). Personality pathology in later life:questions about the measurement, course, and impact of disorders.Annual Review of Clinical Psychology, 7 , 321–349.
Oltmanns, T. F., & Gleason, M. E. J. (2011). Personality, health, andsocial adjustment in later life. In L. B. Cottler (Ed.),Mental health inpublic health: The next 100 years (pp. 151–179). NewYork: OxfordUniversity Press.
Oltmanns, T. F., & Turkheimer, E. (2006). Perceptions of self and othersregarding pathological personality traits. In R. F. Krueger & J. L.Tackett (Eds.),Personality and psychopathology (pp. 71–111). NewYork: Guilford.
Pagan, J. L., Oltmanns, T. F., Whitmore, M. J., & Turkheimer, E. (2005).Personality disorder not otherwise specified: searching for anempirically-defined diagnostic threshold. Journal of PersonalityDisorders, 19, 674–689.
Paris, J. (2003). Personality disorders over time: Precursors, course, andoutcome. Washington: American Psychiatric Publishing.
Paris, J. (2010). Estimating the prevalence of personality disorders in thecommunity. Journal of Personality Disorders, 24, 405–411.
Pfohl, B. M., Blum, N., & Zimmerman, M. (1997). Structured interviewfor DSM-IV personality (SIDP-IV) . Washington: AmericanPsychiatric Association.
J Psychopathol Behav Assess (2014) 36:177–188 187
ple. Personality Disorders: Theory, Research, and Treatment, 4 ,55–61.

Powers, A. D., & Oltmanns, T. F. (2012). Personality disorders andphysical health: a longitudinal examination of physical functioning,healthcare utilization, and health-related behaviors in middle-agedadults. Journal of Personality Disorders, 26 , 524–538.
Ro, E., & Clark, L. (2009). Psychosocial functioning in the context ofdiagnosis: assessment and theoretical issues. PsychologicalAssessment, 21, 313–324.
Robins, L., & Helzer, J. E. (1994). The half-life of a structured interview:the NIMH Diagnostic Interview Schedule (DIS). InternationalJournal of Methods in Psychiatric Research, 4 , 95–102.
Shea, M., Edelen, M. O., Pinto, A. A., Yen, S. S., Gunderson, J. G.,Skodol, A. E., et al. (2009). Improvement in borderline personalitydisorder in relationship to age. Acta Psychiatrica Scandinavica, 119 ,143–148.
Sheehan, D. V., Lecrubier, Y., Sheehan, K., Amorim, P., Janavs, J.,Weiller, E., et al. (1998). The Mini-International NeuropsychiatricInterview (M.I.N.I): the development and validation of a structureddiagnostic psychiatric interview for DSM-IV and ICD-10. Journalof Clinical Psychiatry, 59(Suppl 20), 22–33.
Skodol, A. E. (2008). Longitudinal course and outcome of personalitydisorders. Psychiatric Clinics of North America, 31, 495–503.
Spence, C. T., & Oltmanns, T. F. (2011). Recruitment of AfricanAmerican men: over-coming challenges for an epidemiologicalstudy of personality and health. Cultural Diversity and EthnicMinority Psychology, 17, 377–380.
Tackett, J. L., Balsis, S. M., Oltmanns, T. F., & Krueger, R. F. (2009). Aunifying perspective of personality pathology across the lifespan:developmental considerations for DSM-V. Development andPsychopathology, 21, 687–713.
Trull, T. J., Jahng, S., Tomko, R. L., Wood, P. K., & Sher, K. J. (2010).Revised NESARC personality disorder diagnoses: gender, prevalence,
and comorbidity with substance dependence disorders. Journal ofPersonality Disorders, 24, 412–426.
Ullrich, S., & Coid, J. (2009). The age distribution of self-reportedpersonality disorder traits in a household population. Journal ofPersonality Disorders, 23 , 187–200.
Vazire, S., &Carlson, E. N. (2011). Others sometimes know us better thanwe know ourselves. Current Directions in Psychological Science,20, 104–108.
Verheul, R., & Widiger, T. A. (2004). A meta-analysis of the prevalenceand usage of the Personality Disorder Not Otherwise Specified(PDNOS) diagnosis. Journal of Personality Disorders, 18 , 309–319.
Weinstein, Y., Gleason,M. E. J., & Oltmanns, T. F. (2012). Borderline butnot antisocial personality disorder symptoms predict self-reportedpartner aggression in later life. Journal of Abnormal Psychology,121 , 692–698.
Whisman, M. A., & Schonbrun, Y. (2009). Social consequences ofborderline personality disorder symptoms in a population-basedsurvey: marital distress, marital violence, and marital disruption.Journal of Personality Disorders, 23, 410–415.
Widiger, T., Mangine, S., Corbitt, E., Ellis, C., & Thomas, G. (1995).Personality disorder interview –IV: A semistructured interview forthe assessment of personality disorders . Odessa: PsychologicalAssessment Resources, Inc.
Zanarini, M. C., Skodol, A. E., Bender, D., Dolan, R., Sanislow, C.,Schaefer, E., et al. (2000). The collaborative longitudinal personalitydisorders study: reliability of axis I and II diagnoses. Journal ofPersonality Disorders, 14 , 291–299.
Zimmerman, M. (2012). Is there adequate empirical justification for radi-cally revising the personality disorders section for DSM-5?Personality Disorders: Theory, Research, and Treatment, 3, 444–457.
188 J Psychopathol Behav Assess (2014) 36:177–188