From the Author’s Perspective: Groove: A Phenomenology of Rhythmic Nuance
Upload
independentCategory
view
1download
0
www.elsevier.com/locate/knee
The Knee 13 (200
The tibial tuberosity–trochlear groove distance; a comparative
study between CT and MRI scanning
Philip B. Schoettle a,T, Marco Zanetti b, Burkart Seifert c, Christian W.A. Pfirrmann b,
Sandro F. Fucentese a, Jose Romero a
aOrthopedic Department, University of Zurich, Uniklinik Balgrist, Forchstr. 340, 8008 Zurich, SwitzerlandbRadiological Department, University of Zurich, Uniklinik Balgrist, SwitzerlandcInstitute for social and preventive medicine, University of Zurich, Switzerland
Received 9 May 2005; accepted 6 June 2005
Abstract
CT scan is the gold standard for the measurement of the tibial tuberosity–trochlear groove distance (TTTG). The aim of this study was to
evaluate the reliability of the TTTG on MRI compared to CT scan. Twelve knees in 11 patients underwent CT and MRI examination for
patellofemoral instability or anterior knee pain. Both the bony and the cartilaginous landmarks of the trochlear groove were used for the
measurement of the TTTG. The measurements were performed by two experienced musculoskeletal radiologists. The interrater, intermethod
and interperiod reliability was calculated using a restricted maximum likelihood estimation and a Bland–Altman analysis. The mean TTTG
referenced on bony landmarks was 14.4T5.4 mm on CT scans, and 13.9T4.5 mm on MR images. The mean TTTG referenced on
cartilaginous landmarks was 15.3T4.1 mm on CT scans, and 13.5T4.6 mm on MR images. An excellent interrater (82%), intermethods
(86%), and interperiod (91%) quantitative reliability was found. TTTG can be determined reliably on MRI using either cartilage or bony
landmarks. Additional CT scans are not necessary.
D 2005 Published by Elsevier B.V.
Keywords: Knee; Patellofemoral; Instability; TTTG; Trochlear dysplasia; MRI; CT
1. Introduction
Patellar instability is a common orthopaedic problem
and precise diagnosis is mandatory for optimal treatment.
Patellofemoral disorders can be categorized into five
types;
(a) Patellar instability with dislocation or subluxation
associated with trochlear dysplasia
(b) Patellar instability with dislocation or subluxation
associated without trochlear dysplasia
(c) Patellofemoral pain syndrome without dislocation,
associated with trochlear dysplasia
0968-0160/$ - see front matter D 2005 Published by Elsevier B.V.
doi:10.1016/j.knee.2005.06.003
T Corresponding author.
E-mail address: [email protected] (P.B. Schoettle).
(d) Patellofemoral pain syndrome without anatomical
abnormalities
(e) Isolated patellofemoral arthritis.
One of the anatomically relevant factors for these
disorders is a lateralised tibial tuberosity, or a medialised
trochlear groove in the case of trochlear dysplasia [1,2].
Bland [8] first described the measurement of the distance
between tibial tuberosity and the trochlear groove (TTTG).
This measurement is obtained from CT scanning and is
abnormal in 56–93% of cases with patellar instability [3]
and nearly all cases with trochlear dysplasia [1,2]. An
excessive TTTG can be used as the indication for a distal
realignment procedure such as medialising the tibial
tubercle [2].
Patellofemoral pain syndromes may require assessment
of the cartilage and the soft tissue and ligamentous
6) 26 – 31

Fig. 1. a and b. A line through the deepest point of the trochlea perpendicular to the posterior epicondyle tangent is drawn. (a: CT scan, b: MRI).
P.B. Schoettle et al. / The Knee 13 (2006) 26–31 27
structures of the patellofemoral joint [1,4]. This is most
suitably done by MRI scanning.
If the TTTG distance could be reliably measured on MR
images, CT scans could be avoided. However, measurement
methods for the TTTG distance have not been established
on MR images. On CT scans, only the bony architecture of
the trochlear groove is considered. The architecture of the
cartilaginous surface of the trochlea may however have a
more important impact on the maltracking of the patella [5].
The aim of this study was to evaluate not only the bony [6],
but also a ‘‘cartilagino-tendinous’’ TTTG distance on both
CT and MRI scanning, using the patellofemoral gliding
surface and the centre of the patellar tendon as landmarks.
2. Patients and methods
2.1. Patients
CT and MRI scans were performed with axial sections from the
bony-cartilaginous border at the femoral site down to and with the
Fig. 2. a and b. Tibial sequence: a line parallel to the trochlea line through the m
parallels (arrow) describes the TTTG.
tibial tuberosity on 12 consecutive knees (10 female, 2 male) in 11
patients. All patients had a history of patellar instability (n =10) or
anterior patellofemoral pain syndrome (n =2). The prospective
evaluation of patient imaging data and records was approved by the
local ethics committee. Patient informed consent was not required
for the retrospective review.
2.2. Imaging
All examinations were performed with the same CT scanner
(Somatom Plus 4, Siemens Medical Solutions, Erlangen, Germany)
and the same MRI scanner (Siemens 1.5 T Symphony, Siemens
Medical Solution, Germany). The CT scans were performed first
on a single detector CT system using a bone algorithm (section
thickness of 3 mm, 120 kV, 146 mA).
The standard knee MRI examination protocol (sagittal inter-
mediate and T2 weighted, coronal T1-weighted, coronal STIR
sequence, and axial gradient echo sequence covering the patellar
cartilage) was adapted by adding a T1 weighted turbo-spinecho
axial sequences covering the entire trochlea femoris and tibial
tuberosity. Section thickness was 3 mm, distance factor of 50%,
TR/TE 625/20 ms, matrix 512�512, and FOV 160 mm).
ost anterior portion of the tibial tuberosity. The distance between the two
Fig. 3. a and b. On the most cranial femoral sequence with complete cartilaginous coverage of the trochlea a perpendicular line through the deepest point of the
cartilaginous trochlea to the tangent to the cartilaginous posterior epicondyles is drawn.
P.B. Schoettle et al. / The Knee 13 (2006) 26–3128
Bony TTTG was assessed between the most anterior point of
the tibial tuberosity and the deepest bony point of the trochlear
groove, perpendicular to the tangent to the bony borders of the
posterior condyles on axial CT scans as described by Goutallier
and Bernageau [6]. The lines first drawn on the axial section
tangential to the posterior femoral condyles (bl) and a perpendic-
ular line through the deepest point of the trochlea (Fig. 1a) were
transferred to the axial section with the most anterior point of the
tibial tuberosity, and a perpendicular line to the baseline (bl)
through the most anterior point of the tibial tuberosity was drawn.
Then the distance between the two perpendicular lines (bony
TTTG) was measured in millimetres (Fig. 2a). The same measure-
ments were performed on the MR images (Figs. 1 and 2b).
Cartilaginous-tendon TTTG was assessed on MR images
between the deepest cartilaginous point of the trochlear groove
and the centre of patellar tendon insertion on the tibial tuberosity.
The first craniocaudal image that depicted complete cartilaginous
trochlea was used to determine the deepest point within the
trochlear groove and the insertion centre of the patellar tendon to
the tibial tuberosity was determined on the image with a complete
attachment of the patellar tendon to the tuberosity. Therefore the
Fig. 4. a and b. A middle vertical line between the two external points of the patell
the patellar tendon.
axial image through the femur was evaluated and a tangent to the
cartilaginous border of the posterior condyles was set and a
perpendicular line to the deepest point of the cartilaginous trochlea
was drawn (Fig. 3a). These lines were transferred to all axial
images. The first craniocaudal sequence with complete attachment
of the patellar tendon was evaluated. Between the two most
external insertion points of the patellar tendon, a line was drawn
and a mid-vertical line was set through the tuberosity to determine
the centre of the patellar tendon insertion (Fig. 4a). Then a
perpendicular line was drawn to the epicondylar tangent through
this point and the TTTG was measured in the way as mentioned
above (Fig. 5a). The same measurements were performed on CT
scans (Figs. 3b–5b).
All pictures measurements were performed by two experienced
musculoskeletal radiologists (M.Z., 10 years and C.P., 6 years)
using the PACS* system.
During all analysis procedures, M.Z. and C.P. were blinded to
each other. All data were compared to each other, using a paired t-
test and an interrater, intermethods (CT vs. MRI) and interperiod
(bony vs. cartilaginous TTTG) reliability was evaluated, using
SPSS 11.0.
ar tendon insertion to the tuberosity is drawn to mark the insertion centre of

Fig. 5. a and b. A line parallel to the trochlear line through the patellar tendon centre is drawn and distance between the two lines (arrow) is measured (TTTG).
P.B. Schoettle et al. / The Knee 13 (2006) 26–31 29
2.3. Statistical analysis
Mean bony and cartilaginous TTTG values and SDs were
calculated separately for all knees; a paired t-test was used to
determine the significance of the differences ( p <0.05).
The interrater, interperiod (bony vs. cartilaginous TTTG), and
intermethods (CT vs. MRI measurement) reliabilities were
computed using restricted maximum likelihood estimation in a 4-
way random analysis of variance using SPSS (SAS; SPSS; Cary,
NC). An interrater reliability is the ratio of variance components
not influenced by the rater to the sum of all variance components.
An interperiod reliability is the ratio of variance components not
influenced by the period to the sum of all variance components. An
intermethods reliability is the ratio of variance components not
influenced by the method to the sum of all variance components.
The reliability is rated as excellent/acceptable, if the result is equal
to or more than 80% [7]. Finally to determine whether the TTTG
predicted with CT scans is exchangeable with the observed TTTG
in the MRI for the bony as well as for the cartilaginous (functional)
TTTG we used the Bland–Altmann plot [8].
Bland-Altmann: bony CT vs. bony MRI
bo
ny:
CT-
MR
I TT
TG
5
4
3
2
1
08 12 16 20 24
-1
-2
3. Results
The mean bony TTTGTSD was 14.4T5.4 mm as determined
on CT scans, and 13.9T4.5 mm, as determined on MRI. Mean
cartilaginous TTTGTSD was 15.3T4.6 mm as determined on CT
scans, and 13.5T4.1 mm, as determined on MRI (Table 1). There
was a significant difference in mean cartilaginous TTTG,
obtained on CT scan and on MRI ( p =0.006) only. There was
an excellent interrater reliability of 82%, interperiod reliability of
91% and intermethods reliability of 86%. The Bland–Altman
plots are presented in Figs. 6–9. The differences between the
observed and the predicted TTTG showed results inside the limit
of agreement (biasT2SD) for all cases (12 of 12) in all matched
groups (Figs. 6–9).
Table 1
Mean bony and cartilaginous TTTG in mm, obtained by CT and MRI
TTTG: Bony CT Bony
MRI
Cartilaginous
CT
Cartilaginous
MRI
mean valueTSD: 14.4T5.4 13.9T4.5 15.3T4.6 13.5T4.1
The limits of agreement were 0.5T3.9 mm for the TTTG
measurement, obtained by the bony CT in comparison to those
obtained by the bony MRI (Fig. 6). The limits of agreement were
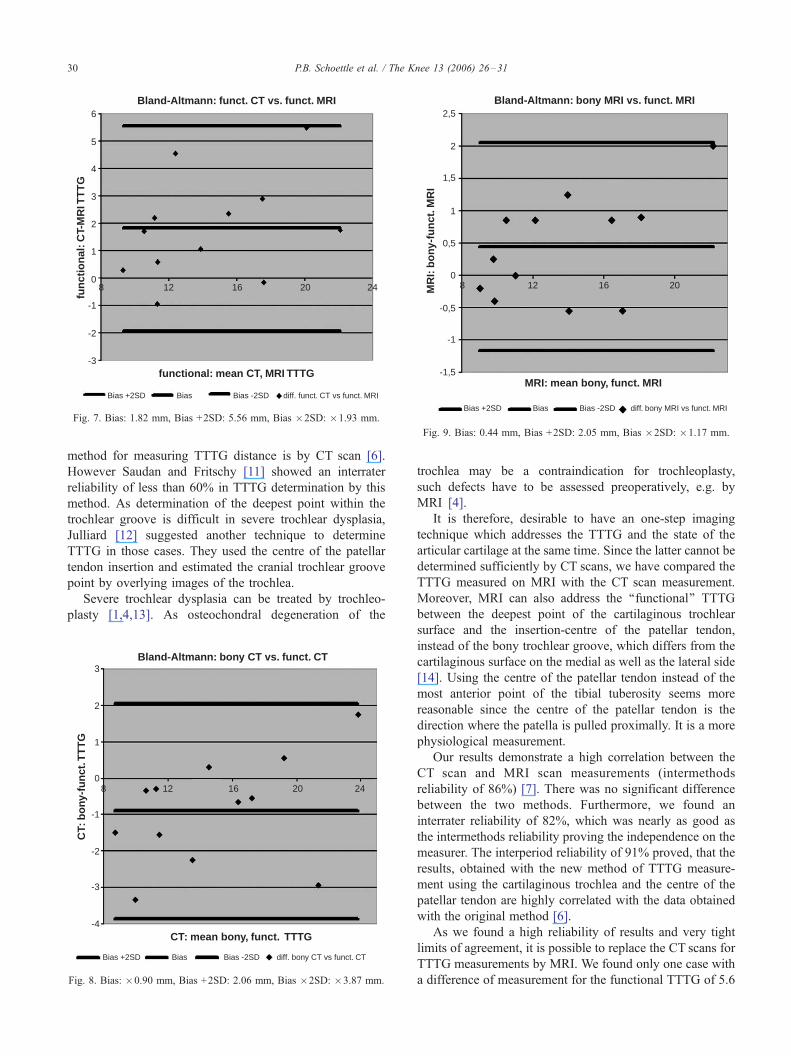
1.8T3.7 mm for the data obtained by the cartilaginous CT in
comparison to those, obtained by the cartilaginous MRI (Fig. 7).
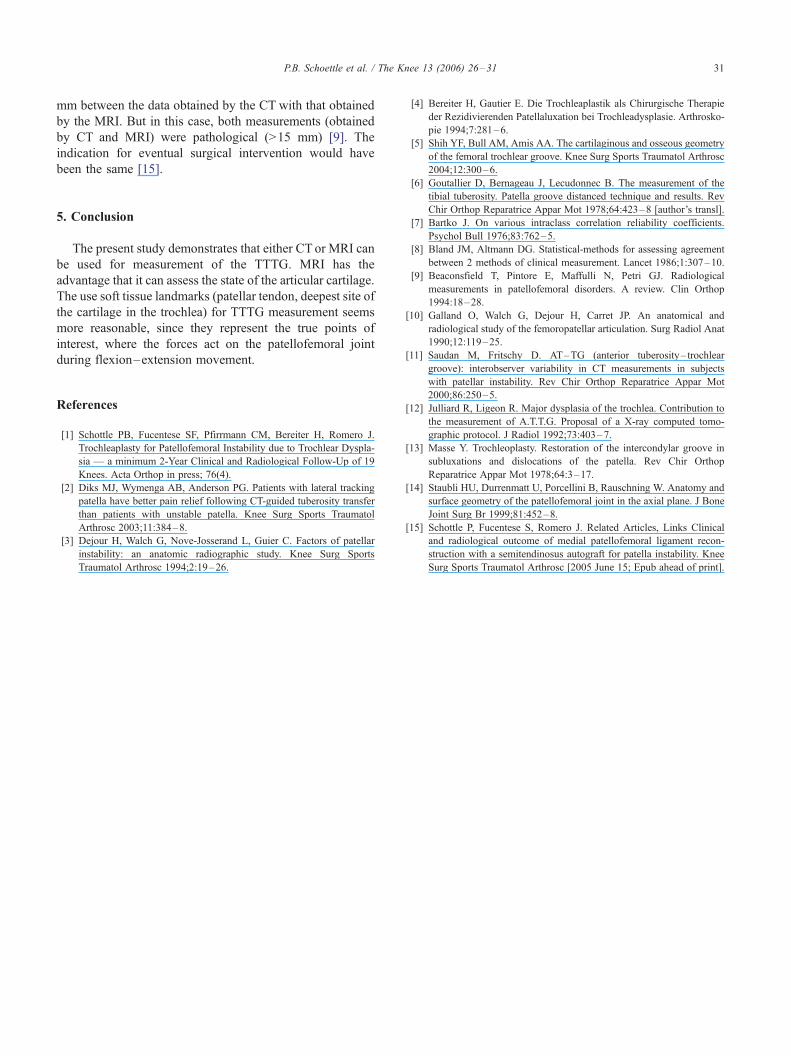
The limits of agreement were �0.9T3.0 mm for the bony CT
measurements in comparison to those, obtained by the functional
CT (Fig. 8). The limits of agreement were 0.4T1.6 mm for the bony
MRI results in comparison to those, obtained by the functional MRI
(Fig. 9). Thus all differences in all measurements were within 3.4
mm, except in one case, where the difference was 5.6 mm, when
comparing the CT and MRI functional TTTGs (Fig. 7).
4. Discussion
Several anatomical factors such as a trochlear dysplasia
are associated with an increased TTTG and predispose for
patellofemoral instability [2,3,9,10]. The gold standard
bony: mean CT, MRI TTTG
-3
-4
Bias +2SD Bias -2SD diff. bony CT vs bony MRIBias
Fig. 6. Bias: +0.48, Bias +2SD: +4.34, Bias �2SD: �3.4.
Bland-Altmann: funct. CT vs. funct. MRI
functional: mean CT, MRI TTTG
fun
ctio
nal
: CT-
MR
I TT
TG
5
4
3
2
1
08 12 16 20 24
-1
-2
-3
6
Bias +2SD Bias -2SD diff. funct. CT vs funct. MRIBias
Fig. 7. Bias: 1.82 mm, Bias +2SD: 5.56 mm, Bias �2SD: �1.93 mm.
Bland-Altmann: bony MRI vs. funct. MRI
MRI: mean bony, funct. MRI
MR
I: b
ony
-fu
nct
. MR
I
-1,5
2,5
2
1,5
1
-1
8 12 16 20
0,5
0
-0,5
Bias +2SD Bias -2SD diff. bony MRI vs funct. MRIBias
Fig. 9. Bias: 0.44 mm, Bias +2SD: 2.05 mm, Bias �2SD: �1.17 mm.
P.B. Schoettle et al. / The Knee 13 (2006) 26–3130
method for measuring TTTG distance is by CT scan [6].
However Saudan and Fritschy [11] showed an interrater
reliability of less than 60% in TTTG determination by this
method. As determination of the deepest point within the
trochlear groove is difficult in severe trochlear dysplasia,
Julliard [12] suggested another technique to determine
TTTG in those cases. They used the centre of the patellar
tendon insertion and estimated the cranial trochlear groove
point by overlying images of the trochlea.
Severe trochlear dysplasia can be treated by trochleo-
plasty [1,4,13]. As osteochondral degeneration of the
Bland-Altmann: bony CT vs. funct. CT
CT: mean bony, funct. TTTG
CT:
bo
ny-f
un
ct. T
TT
G
-4
3
2
1
08 12 16 20 24
-1
-2
-3
Bias +2SD Bias -2SD diff. bony CT vs funct. CTBias
Fig. 8. Bias: �0.90 mm, Bias +2SD: 2.06 mm, Bias �2SD: �3.87 mm.
trochlea may be a contraindication for trochleoplasty,
such defects have to be assessed preoperatively, e.g. by
MRI [4].
It is therefore, desirable to have an one-step imaging
technique which addresses the TTTG and the state of the
articular cartilage at the same time. Since the latter cannot be
determined sufficiently by CT scans, we have compared the
TTTG measured on MRI with the CT scan measurement.
Moreover, MRI can also address the ‘‘functional’’ TTTG
between the deepest point of the cartilaginous trochlear
surface and the insertion-centre of the patellar tendon,
instead of the bony trochlear groove, which differs from the
cartilaginous surface on the medial as well as the lateral side
[14]. Using the centre of the patellar tendon instead of the
most anterior point of the tibial tuberosity seems more
reasonable since the centre of the patellar tendon is the
direction where the patella is pulled proximally. It is a more
physiological measurement.
Our results demonstrate a high correlation between the
CT scan and MRI scan measurements (intermethods
reliability of 86%) [7]. There was no significant difference
between the two methods. Furthermore, we found an
interrater reliability of 82%, which was nearly as good as
the intermethods reliability proving the independence on the
measurer. The interperiod reliability of 91% proved, that the
results, obtained with the new method of TTTG measure-
ment using the cartilaginous trochlea and the centre of the
patellar tendon are highly correlated with the data obtained
with the original method [6].
As we found a high reliability of results and very tight
limits of agreement, it is possible to replace the CT scans for
TTTG measurements by MRI. We found only one case with
a difference of measurement for the functional TTTG of 5.6
P.B. Schoettle et al. / The Knee 13 (2006) 26–31 31
mm between the data obtained by the CT with that obtained
by the MRI. But in this case, both measurements (obtained
by CT and MRI) were pathological (>15 mm) [9]. The
indication for eventual surgical intervention would have
been the same [15].
5. Conclusion
The present study demonstrates that either CT or MRI can
be used for measurement of the TTTG. MRI has the
advantage that it can assess the state of the articular cartilage.
The use soft tissue landmarks (patellar tendon, deepest site of
the cartilage in the trochlea) for TTTG measurement seems
more reasonable, since they represent the true points of
interest, where the forces act on the patellofemoral joint
during flexion–extension movement.
References
[1] Schottle PB, Fucentese SF, Pfirrmann CM, Bereiter H, Romero J.
Trochleaplasty for Patellofemoral Instability due to Trochlear Dyspla-
sia — a minimum 2-Year Clinical and Radiological Follow-Up of 19
Knees. Acta Orthop in press; 76(4).
[2] Diks MJ, Wymenga AB, Anderson PG. Patients with lateral tracking
patella have better pain relief following CT-guided tuberosity transfer
than patients with unstable patella. Knee Surg Sports Traumatol
Arthrosc 2003;11:384–8.
[3] Dejour H, Walch G, Nove-Josserand L, Guier C. Factors of patellar
instability: an anatomic radiographic study. Knee Surg Sports
Traumatol Arthrosc 1994;2:19–26.
[4] Bereiter H, Gautier E. Die Trochleaplastik als Chirurgische Therapie
der Rezidivierenden Patellaluxation bei Trochleadysplasie. Arthrosko-
pie 1994;7:281–6.
[5] Shih YF, Bull AM, Amis AA. The cartilaginous and osseous geometry
of the femoral trochlear groove. Knee Surg Sports Traumatol Arthrosc
2004;12:300–6.
[6] Goutallier D, Bernageau J, Lecudonnec B. The measurement of the
tibial tuberosity. Patella groove distanced technique and results. Rev
Chir Orthop Reparatrice Appar Mot 1978;64:423–8 [author’s transl].
[7] Bartko J. On various intraclass correlation reliability coefficients.
Psychol Bull 1976;83:762–5.
[8] Bland JM, Altmann DG. Statistical-methods for assessing agreement
between 2 methods of clinical measurement. Lancet 1986;1:307–10.
[9] Beaconsfield T, Pintore E, Maffulli N, Petri GJ. Radiological
measurements in patellofemoral disorders. A review. Clin Orthop
1994:18–28.
[10] Galland O, Walch G, Dejour H, Carret JP. An anatomical and
radiological study of the femoropatellar articulation. Surg Radiol Anat
1990;12:119–25.
[11] Saudan M, Fritschy D. AT–TG (anterior tuberosity– trochlear
groove): interobserver variability in CT measurements in subjects
with patellar instability. Rev Chir Orthop Reparatrice Appar Mot
2000;86:250–5.
[12] Julliard R, Ligeon R. Major dysplasia of the trochlea. Contribution to
the measurement of A.T.T.G. Proposal of a X-ray computed tomo-
graphic protocol. J Radiol 1992;73:403–7.
[13] Masse Y. Trochleoplasty. Restoration of the intercondylar groove in
subluxations and dislocations of the patella. Rev Chir Orthop
Reparatrice Appar Mot 1978;64:3–17.
[14] Staubli HU, Durrenmatt U, Porcellini B, Rauschning W. Anatomy and
surface geometry of the patellofemoral joint in the axial plane. J Bone
Joint Surg Br 1999;81:452–8.
[15] Schottle P, Fucentese S, Romero J. Related Articles, Links Clinical
and radiological outcome of medial patellofemoral ligament recon-
struction with a semitendinosus autograft for patella instability. Knee
Surg Sports Traumatol Arthrosc [2005 June 15; Epub ahead of print].
Copyright © 2022 FDOKUMEN