Enhanced rate of gas hydrate formation in a fixed bed column filled with sand compared to a stirred...
8
This article appeared in a journal published by Elsevier. The attached copy is furnished to the author for internal non-commercial research and education use, including for instruction at the authors institution and sharing with colleagues. Other uses, including reproduction and distribution, or selling or licensing copies, or posting to personal, institutional or third party websites are prohibited. In most cases authors are permitted to post their version of the article (e.g. in Word or Tex form) to their personal website or institutional repository. Authors requiring further information regarding Elsevier’s archiving and manuscript policies are encouraged to visit: http://www.elsevier.com/copyright
Transcript of Enhanced rate of gas hydrate formation in a fixed bed column filled with sand compared to a stirred...
This article appeared in a journal published by Elsevier. The attachedcopy is furnished to the author for internal non-commercial researchand education use, including for instruction at the authors institution
and sharing with colleagues.
Other uses, including reproduction and distribution, or selling orlicensing copies, or posting to personal, institutional or third party
websites are prohibited.
In most cases authors are permitted to post their version of thearticle (e.g. in Word or Tex form) to their personal website orinstitutional repository. Authors requiring further information
regarding Elsevier’s archiving and manuscript policies areencouraged to visit:
http://www.elsevier.com/copyright
Author's personal copy
Enhanced rate of gas hydrate formation in a fixed bed column filledwith sand compared to a stirred vessel
Praveen Linga a, Nagu Daraboina b, John A. Ripmeester c, Peter Englezos b,n
a Department of Chemical and Biomolecular Engineering, National University of Singapore, 4 Engineering Drive 4, Singapore 117 576b Department of Chemical and Biological Engineering, University of British Columbia, Vancouver, BC, Canada V6T 1Z3c Steacie Institute for Molecular Sciences, National Research Council Canada, Ottawa, ON, Canada K1A 0R6
a r t i c l e i n f o
Article history:
Received 29 March 2011
Received in revised form
11 October 2011
Accepted 12 October 2011Available online 18 October 2011
Keywords:
Carbon dioxide
Natural gas
Gas hydrates
Enhanced kinetics
Porous media
Mass transfer
a b s t r a c t
The performance of two gas/liquid contact modes was evaluated in relation to the rate of gas hydrate
formation. Hydrate formation experiments were conducted for several gas mixtures relevant to natural
gas hydrate formation in the earth (CH4, CH4/C3H8, CH4/C2H6 and CH4/C2H6/C3H8) and two CO2 capture
and storage (CO2, CO2/H2/C3H8). One set of experiments was conducted in a bed of silica sand, saturated
with water (fixed fed column) while the other experiment was conducted in a stirred vessel for each
gas/gas mixture. Both sets of experiments were conducted at a constant temperature. The rate of
hydrate formation is customarily correlated with the rate of gas consumption. The results show that the
rate of hydrate formation in the fixed bed column is significantly greater and thereby resulted in a
higher percent of water conversion to hydrate in lesser reaction time for all the systems studied.
& 2011 Elsevier Ltd. All rights reserved.
1. Introduction
Clathrate or gas hydrates are ice-like inclusion crystals formedby water and several molecules including methane, ethane,carbon dioxide, hydrogen at suitable temperature, pressure andmaterial availability conditions (Davidson, 1973; Englezos, 1993;Ripmeester et al., 1987; Sloan and Koh, 2008). Hydrates of naturalgas also exist in nature (in and under permafrost and below thesea floor along continental margins) and constitute a potentiallyhuge energy source (Grace et al., 2008). Understanding themechanism of hydrocarbon hydrate formation and dissociationin the Earth’s porous media is of interest in relation to natural gasrecovery. Recently, Linga et al. (2009) reported water to hydrateconversion of more than 70% for all the hydrate formationexperiments that were performed in a water saturated silica sandmatrix and contacted with methane at 8.0 MPa (at the start of theexperiment) and at temperatures 4.0 and 1.0 1C, respectively. Themost frequently used arrangement for laboratory hydrate studiesis a stirred vessel in which such high water conversions are notobserved. Linga et al. (2009) reported this observation for experi-ments that were carried out for three different silica sand bedsizes. The sand used was micro porous and hence the wateroccupied the interstitial spaces of the particles in the bed voids. Itis not known why the hydrate formation rate is enhanced in aporous medium. It is therefore of interest to evaluate the
performance of the fixed bed column (silica sand bed saturatedwith water) against a stirred tank vessel. The comparison will bebased on the gas uptake, which correlates with the rate of hydratecrystal formation and on the water conversion to hydrate.
It should also be noted that an enhanced rate of hydrate crystal-lization is one of the requirements to render a number of hydrate-based processes (mainly gas separations) economically viable(Mori, 2003). A process that could benefit from an enhanced ratewhile being carried using sand as a porous medium is the separationof carbon dioxide from fuel (synthesis) gas mixtures (Aaron andTsouris, 2005; Herri et al., 2007; Kang and Lee, 2000; Klara andSrivastava, 2002; Linga et al., 2008; Linga et al., 2007a).
As a part of a fundamental study to understand the formationof hydrates in the presence of porous media we have used twopure gases (CO2 and CH4) and four gas mixtures (CO2/H2/C3H8,CH4/C3H8, CH4/C2H6 and CH4/C2H6/C3H8). Such work will be ofpractical interest in relation to some gas hydrate-based separa-tions, natural gas recovery from hydrates and storage of CO2 inthe Earth (geological storage).
2. Experimental section
2.1. Materials
The gas/gas mixtures that were used for this work were UHPgrade supplied by Praxair Technology Inc., their compositions aregiven in Table 1. Silica sand supplied by Sigma–Aldrich was used.
Contents lists available at SciVerse ScienceDirect
journal homepage: www.elsevier.com/locate/ces
Chemical Engineering Science
0009-2509/$ - see front matter & 2011 Elsevier Ltd. All rights reserved.
doi:10.1016/j.ces.2011.10.030
n Corresponding author. Tel.: þ1 604 822 6184; fax: þ1 604 822 6003.
E-mail address: [email protected] (P. Englezos).
Chemical Engineering Science 68 (2012) 617–623
Author's personal copy
It is noted that the sand used in this study is the same as that wasused by Linga et al. (2009). The water was distilled and deionisedprior to injection into the hydrate formation vessels.
2.2. Silica sand apparatus and procedure for hydrate formation
Detailed description of the silica sand apparatus (Apparatus #1)and the procedure are given elsewhere in the literature (Linga et al.,2009). Briefly, the procedure for the experiments is as follows. Theamount of silica sand placed in the crystallizer for each experimentwas 228.5 g. The volume of water required to completely fill thevoid space between the sand particles was found to be 0.217 ml/g.Accordingly, 49.7 ml of water was added into the sand. Once thesand bed is setup with the required amount of sand and water, it isclosed. The pressure in the crystallizer is then set to the desiredexperimental value and the temperature is allowed to reach thetarget value (this took approximately 5 min). This point was set astime zero for the formation of experiment. Pressure and tempera-ture data were logged in the computer for every 20 s.
2.3. Stirred tank apparatus and procedure for hydrate formation
Detailed description of the stirred tank reactor apparatus(Apparatus # 2) and the procedure are given elsewhere in theliterature (Lee et al., 2005; Linga et al., 2007b). Briefly, theprocedure for the experiment is as follows. The amount of watertaken for the bulk water experiments is 49.7 ml. The pressure inthe crystallizer is then set to the desired experimental pressureand the temperature is allowed to reach the experimentaltemperature (approximately 5 min). The liquid phase of thecrystallizer is now stirred with a magnetic stirrer at a constantspeed of 300 rpm. This is time zero for the experiment. Pressureand temperature data were logged in the computer for every 20 s.
2.4. Calculation of the amount of gas consumed during
hydrate formation
All hydrate formation experiments using both apparati werecarried out with a fixed amount of water and gas (closed system)and at a constant temperature. When hydrate formation occurs,gas is consumed and hence the pressure in the closed system
drops. The pressure and temperature data are recorded and usedto calculate the moles of gas being consumed in the crystallizer(gas uptake).
At any given time, the total number of moles (nT,t) of gas in thesystem remains constant and equal to that at time zero (nT,0).The total number of moles at any given time is the sum of thenumber of moles (nG) in the gas phase (G) of the crystallizer (fixedbed column or stirred vessel) and the number of moles (nH)consumed to form hydrate (H) or dissolved in water.
At any given time, the number of moles of the gas that hasbeen consumed for hydrate formation is the difference betweenthe number of moles of the gas at time t¼0 present in the gasphase of the crystallizer (CR) and the number of moles of the gaspresent in the gas phase of CR at time t¼t and is given by thefollowing equation:
DnH,k ¼ nH,t�nH,0 ¼PV
zRT
� �G,0
�PV
zRT
� �G,t
ð1Þ
where z is the compressibility factor calculated by Pitzer’scorrelation (Smith et al., 2001), V is the volume of gas phase ofthe crystallizer, P (kPa) and T (K) are the pressure and tempera-ture of the crystallizer.
The rate of hydrate formation is calculated through theforward difference method given below
dDnH,k
dt
� �t
¼DnH,ktþDt
�DnH,kt
Dt, Dt¼ 20s ð2Þ
The average of these rates is calculated every 30 min andreported. Percent conversion of water to hydrates is determinedfrom the information obtained from gas uptake and the experi-mental conditions using the following equation:
Conversion of water to hydrates ðmol%Þ
¼DnH,k �Hydration Number
nH2O� 100 ð3Þ
where DnH,k is the number of moles of gas consumed for hydrateformation at the end of the experiment determined from the gasuptake measurement and nH2O is the total number of moles ofwater in the system.
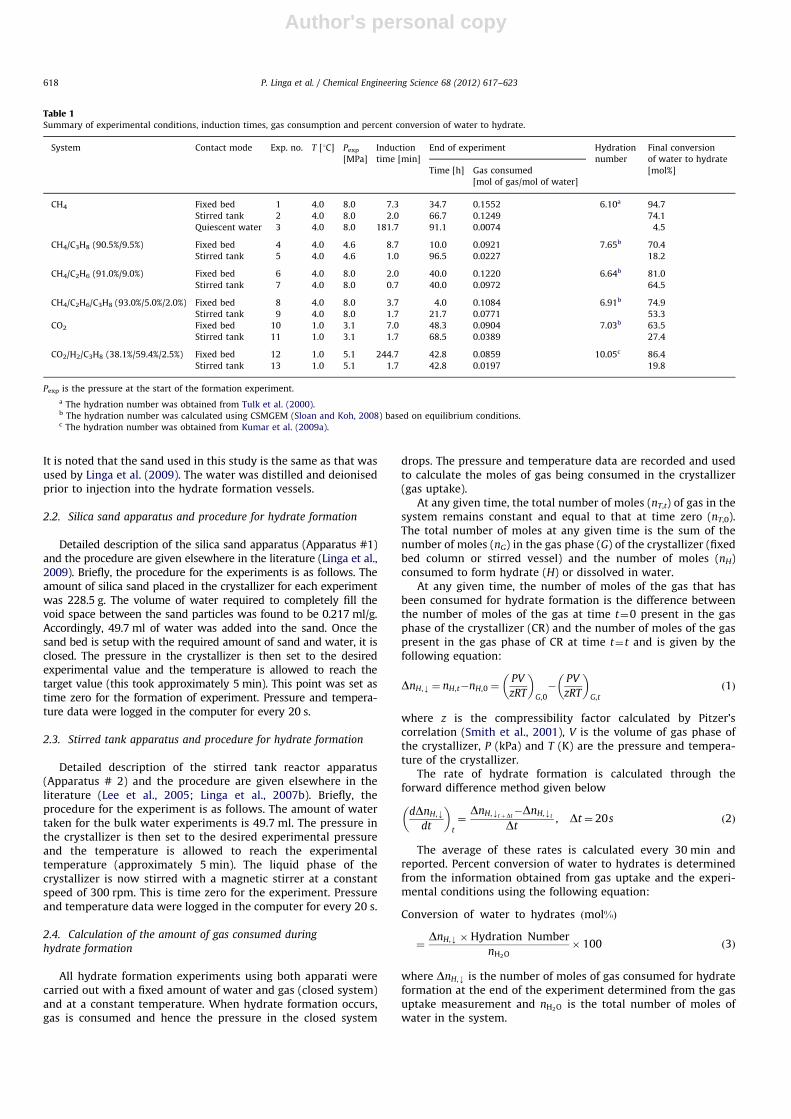
Table 1Summary of experimental conditions, induction times, gas consumption and percent conversion of water to hydrate.
System Contact mode Exp. no. T [1C] Pexp
[MPa]
Induction
time [min]
End of experiment Hydration
number
Final conversion
of water to hydrate
[mol%]Time [h] Gas consumed
[mol of gas/mol of water]
CH4 Fixed bed 1 4.0 8.0 7.3 34.7 0.1552 6.10a 94.7
Stirred tank 2 4.0 8.0 2.0 66.7 0.1249 74.1
Quiescent water 3 4.0 8.0 181.7 91.1 0.0074 4.5
CH4/C3H8 (90.5%/9.5%) Fixed bed 4 4.0 4.6 8.7 10.0 0.0921 7.65b 70.4
Stirred tank 5 4.0 4.6 1.0 96.5 0.0227 18.2
CH4/C2H6 (91.0%/9.0%) Fixed bed 6 4.0 8.0 2.0 40.0 0.1220 6.64b 81.0
Stirred tank 7 4.0 8.0 0.7 40.0 0.0972 64.5
CH4/C2H6/C3H8 (93.0%/5.0%/2.0%) Fixed bed 8 4.0 8.0 3.7 4.0 0.1084 6.91b 74.9
Stirred tank 9 4.0 8.0 1.7 21.7 0.0771 53.3
CO2 Fixed bed 10 1.0 3.1 7.0 48.3 0.0904 7.03b 63.5
Stirred tank 11 1.0 3.1 1.7 68.5 0.0389 27.4
CO2/H2/C3H8 (38.1%/59.4%/2.5%) Fixed bed 12 1.0 5.1 244.7 42.8 0.0859 10.05c 86.4
Stirred tank 13 1.0 5.1 1.7 42.8 0.0197 19.8
Pexp is the pressure at the start of the formation experiment.
a The hydration number was obtained from Tulk et al. (2000).b The hydration number was calculated using CSMGEM (Sloan and Koh, 2008) based on equilibrium conditions.c The hydration number was obtained from Kumar et al. (2009a).
P. Linga et al. / Chemical Engineering Science 68 (2012) 617–623618
Author's personal copy
3. Results and discussion.
Table 1 summarizes the experimental conditions for thesystems studied. In addition, the induction time observed as wellas the duration (in hours) and the gas consumed during theexperiment are reported. Based on the hydration numbers of thehydrate the water conversion to hydrate was determined andreported in the table. In general, the induction times were shorterfor the experiments that were conducted in a stirred tank reactor.It is also noted that the final gas consumption for the experimentsconducted in a fixed bed column were higher than the gasconsumption in a stirred vessel.
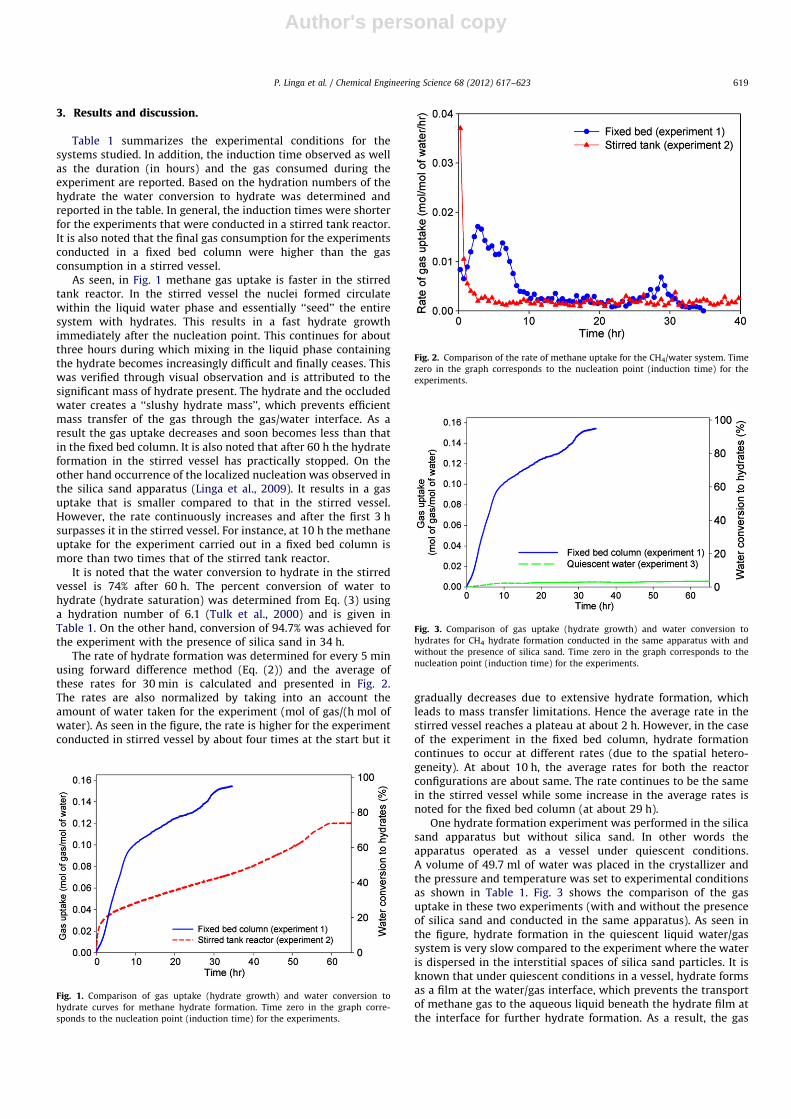
As seen, in Fig. 1 methane gas uptake is faster in the stirredtank reactor. In the stirred vessel the nuclei formed circulatewithin the liquid water phase and essentially ‘‘seed’’ the entiresystem with hydrates. This results in a fast hydrate growthimmediately after the nucleation point. This continues for aboutthree hours during which mixing in the liquid phase containingthe hydrate becomes increasingly difficult and finally ceases. Thiswas verified through visual observation and is attributed to thesignificant mass of hydrate present. The hydrate and the occludedwater creates a ‘‘slushy hydrate mass’’, which prevents efficientmass transfer of the gas through the gas/water interface. As aresult the gas uptake decreases and soon becomes less than thatin the fixed bed column. It is also noted that after 60 h the hydrateformation in the stirred vessel has practically stopped. On theother hand occurrence of the localized nucleation was observed inthe silica sand apparatus (Linga et al., 2009). It results in a gasuptake that is smaller compared to that in the stirred vessel.However, the rate continuously increases and after the first 3 hsurpasses it in the stirred vessel. For instance, at 10 h the methaneuptake for the experiment carried out in a fixed bed column ismore than two times that of the stirred tank reactor.
It is noted that the water conversion to hydrate in the stirredvessel is 74% after 60 h. The percent conversion of water tohydrate (hydrate saturation) was determined from Eq. (3) usinga hydration number of 6.1 (Tulk et al., 2000) and is given inTable 1. On the other hand, conversion of 94.7% was achieved forthe experiment with the presence of silica sand in 34 h.
The rate of hydrate formation was determined for every 5 minusing forward difference method (Eq. (2)) and the average ofthese rates for 30 min is calculated and presented in Fig. 2.The rates are also normalized by taking into an account theamount of water taken for the experiment (mol of gas/(h mol ofwater). As seen in the figure, the rate is higher for the experimentconducted in stirred vessel by about four times at the start but it
gradually decreases due to extensive hydrate formation, whichleads to mass transfer limitations. Hence the average rate in thestirred vessel reaches a plateau at about 2 h. However, in the caseof the experiment in the fixed bed column, hydrate formationcontinues to occur at different rates (due to the spatial hetero-geneity). At about 10 h, the average rates for both the reactorconfigurations are about same. The rate continues to be the samein the stirred vessel while some increase in the average rates isnoted for the fixed bed column (at about 29 h).
One hydrate formation experiment was performed in the silicasand apparatus but without silica sand. In other words theapparatus operated as a vessel under quiescent conditions.A volume of 49.7 ml of water was placed in the crystallizer andthe pressure and temperature was set to experimental conditionsas shown in Table 1. Fig. 3 shows the comparison of the gasuptake in these two experiments (with and without the presenceof silica sand and conducted in the same apparatus). As seen inthe figure, hydrate formation in the quiescent liquid water/gassystem is very slow compared to the experiment where the wateris dispersed in the interstitial spaces of silica sand particles. It isknown that under quiescent conditions in a vessel, hydrate formsas a film at the water/gas interface, which prevents the transportof methane gas to the aqueous liquid beneath the hydrate film atthe interface for further hydrate formation. As a result, the gas
Fig. 1. Comparison of gas uptake (hydrate growth) and water conversion to
hydrate curves for methane hydrate formation. Time zero in the graph corre-
sponds to the nucleation point (induction time) for the experiments.
Fig. 2. Comparison of the rate of methane uptake for the CH4/water system. Time
zero in the graph corresponds to the nucleation point (induction time) for the
experiments.
Fig. 3. Comparison of gas uptake (hydrate growth) and water conversion to
hydrates for CH4 hydrate formation conducted in the same apparatus with and
without the presence of silica sand. Time zero in the graph corresponds to the
nucleation point (induction time) for the experiments.
P. Linga et al. / Chemical Engineering Science 68 (2012) 617–623 619
Author's personal copy
uptake reaches a plateau. On the other hand the system with thepresence of silica sand resulted in significantly higher methaneconsumption in a shorter time (Figs. 1 and 3).
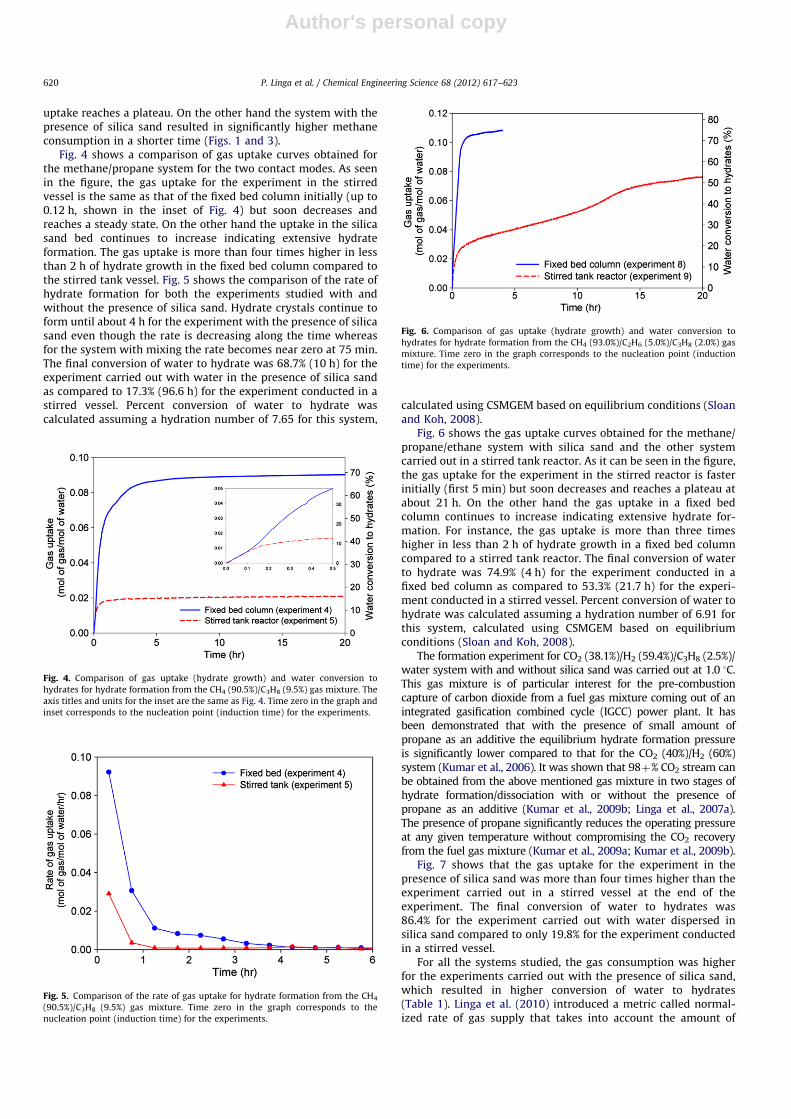
Fig. 4 shows a comparison of gas uptake curves obtained forthe methane/propane system for the two contact modes. As seenin the figure, the gas uptake for the experiment in the stirredvessel is the same as that of the fixed bed column initially (up to0.12 h, shown in the inset of Fig. 4) but soon decreases andreaches a steady state. On the other hand the uptake in the silicasand bed continues to increase indicating extensive hydrateformation. The gas uptake is more than four times higher in lessthan 2 h of hydrate growth in the fixed bed column compared tothe stirred tank vessel. Fig. 5 shows the comparison of the rate ofhydrate formation for both the experiments studied with andwithout the presence of silica sand. Hydrate crystals continue toform until about 4 h for the experiment with the presence of silicasand even though the rate is decreasing along the time whereasfor the system with mixing the rate becomes near zero at 75 min.The final conversion of water to hydrate was 68.7% (10 h) for theexperiment carried out with water in the presence of silica sandas compared to 17.3% (96.6 h) for the experiment conducted in astirred vessel. Percent conversion of water to hydrate wascalculated assuming a hydration number of 7.65 for this system,
calculated using CSMGEM based on equilibrium conditions (Sloanand Koh, 2008).
Fig. 6 shows the gas uptake curves obtained for the methane/propane/ethane system with silica sand and the other systemcarried out in a stirred tank reactor. As it can be seen in the figure,the gas uptake for the experiment in the stirred reactor is fasterinitially (first 5 min) but soon decreases and reaches a plateau atabout 21 h. On the other hand the gas uptake in a fixed bedcolumn continues to increase indicating extensive hydrate for-mation. For instance, the gas uptake is more than three timeshigher in less than 2 h of hydrate growth in a fixed bed columncompared to a stirred tank reactor. The final conversion of waterto hydrate was 74.9% (4 h) for the experiment conducted in afixed bed column as compared to 53.3% (21.7 h) for the experi-ment conducted in a stirred vessel. Percent conversion of water tohydrate was calculated assuming a hydration number of 6.91 forthis system, calculated using CSMGEM based on equilibriumconditions (Sloan and Koh, 2008).
The formation experiment for CO2 (38.1%)/H2 (59.4%)/C3H8 (2.5%)/water system with and without silica sand was carried out at 1.0 1C.This gas mixture is of particular interest for the pre-combustioncapture of carbon dioxide from a fuel gas mixture coming out of anintegrated gasification combined cycle (IGCC) power plant. It hasbeen demonstrated that with the presence of small amount ofpropane as an additive the equilibrium hydrate formation pressureis significantly lower compared to that for the CO2 (40%)/H2 (60%)system (Kumar et al., 2006). It was shown that 98þ% CO2 stream canbe obtained from the above mentioned gas mixture in two stages ofhydrate formation/dissociation with or without the presence ofpropane as an additive (Kumar et al., 2009b; Linga et al., 2007a).The presence of propane significantly reduces the operating pressureat any given temperature without compromising the CO2 recoveryfrom the fuel gas mixture (Kumar et al., 2009a; Kumar et al., 2009b).
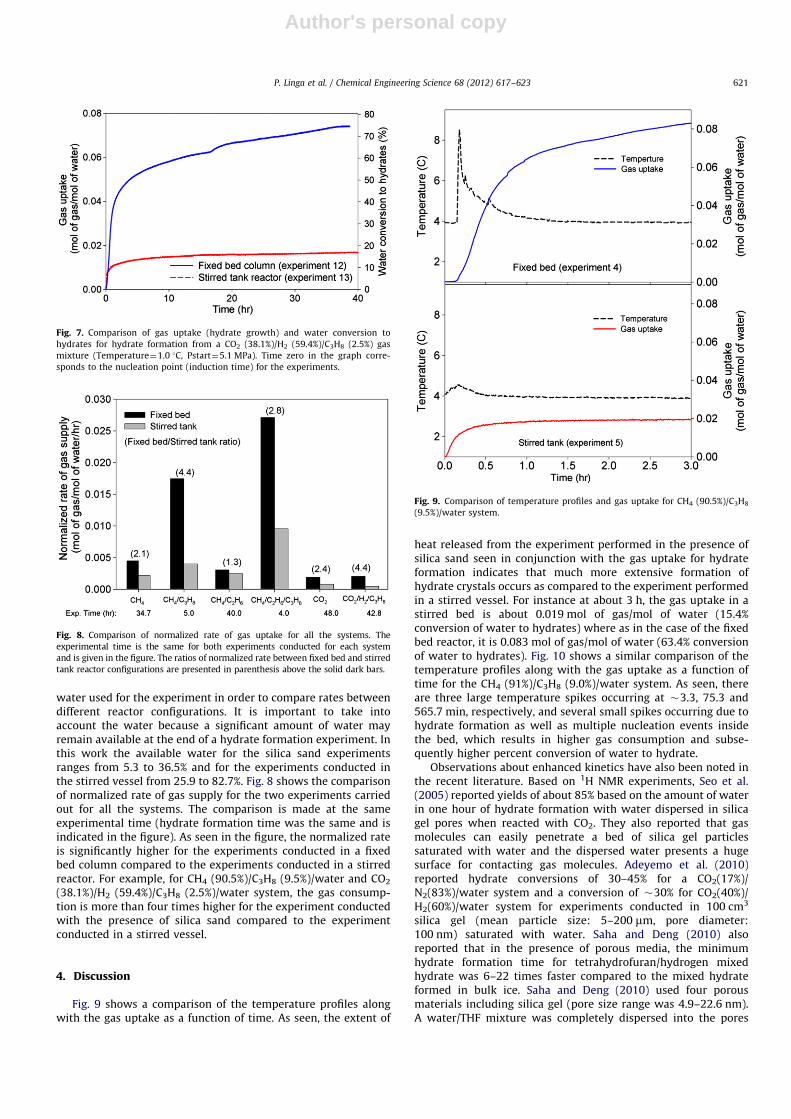
Fig. 7 shows that the gas uptake for the experiment in thepresence of silica sand was more than four times higher than theexperiment carried out in a stirred vessel at the end of theexperiment. The final conversion of water to hydrates was86.4% for the experiment carried out with water dispersed insilica sand compared to only 19.8% for the experiment conductedin a stirred vessel.
For all the systems studied, the gas consumption was higherfor the experiments carried out with the presence of silica sand,which resulted in higher conversion of water to hydrates(Table 1). Linga et al. (2010) introduced a metric called normal-ized rate of gas supply that takes into account the amount of
Fig. 4. Comparison of gas uptake (hydrate growth) and water conversion to
hydrates for hydrate formation from the CH4 (90.5%)/C3H8 (9.5%) gas mixture. The
axis titles and units for the inset are the same as Fig. 4. Time zero in the graph and
inset corresponds to the nucleation point (induction time) for the experiments.
Fig. 5. Comparison of the rate of gas uptake for hydrate formation from the CH4
(90.5%)/C3H8 (9.5%) gas mixture. Time zero in the graph corresponds to the
nucleation point (induction time) for the experiments.
Fig. 6. Comparison of gas uptake (hydrate growth) and water conversion to
hydrates for hydrate formation from the CH4 (93.0%)/C2H6 (5.0%)/C3H8 (2.0%) gas
mixture. Time zero in the graph corresponds to the nucleation point (induction
time) for the experiments.
P. Linga et al. / Chemical Engineering Science 68 (2012) 617–623620
Author's personal copy
water used for the experiment in order to compare rates betweendifferent reactor configurations. It is important to take intoaccount the water because a significant amount of water mayremain available at the end of a hydrate formation experiment. Inthis work the available water for the silica sand experimentsranges from 5.3 to 36.5% and for the experiments conducted inthe stirred vessel from 25.9 to 82.7%. Fig. 8 shows the comparisonof normalized rate of gas supply for the two experiments carriedout for all the systems. The comparison is made at the sameexperimental time (hydrate formation time was the same and isindicated in the figure). As seen in the figure, the normalized rateis significantly higher for the experiments conducted in a fixedbed column compared to the experiments conducted in a stirredreactor. For example, for CH4 (90.5%)/C3H8 (9.5%)/water and CO2
(38.1%)/H2 (59.4%)/C3H8 (2.5%)/water system, the gas consump-tion is more than four times higher for the experiment conductedwith the presence of silica sand compared to the experimentconducted in a stirred vessel.
4. Discussion
Fig. 9 shows a comparison of the temperature profiles alongwith the gas uptake as a function of time. As seen, the extent of
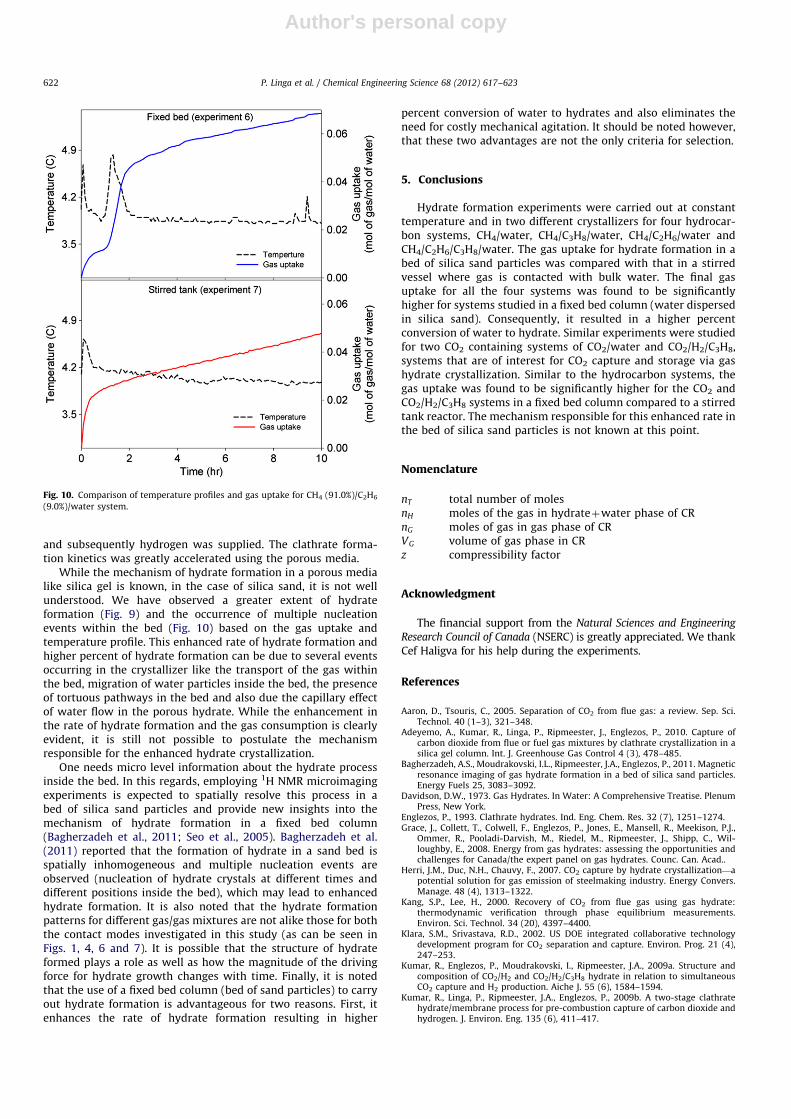
heat released from the experiment performed in the presence ofsilica sand seen in conjunction with the gas uptake for hydrateformation indicates that much more extensive formation ofhydrate crystals occurs as compared to the experiment performedin a stirred vessel. For instance at about 3 h, the gas uptake in astirred bed is about 0.019 mol of gas/mol of water (15.4%conversion of water to hydrates) where as in the case of the fixedbed reactor, it is 0.083 mol of gas/mol of water (63.4% conversionof water to hydrates). Fig. 10 shows a similar comparison of thetemperature profiles along with the gas uptake as a function oftime for the CH4 (91%)/C3H8 (9.0%)/water system. As seen, thereare three large temperature spikes occurring at �3.3, 75.3 and565.7 min, respectively, and several small spikes occurring due tohydrate formation as well as multiple nucleation events insidethe bed, which results in higher gas consumption and subse-quently higher percent conversion of water to hydrate.
Observations about enhanced kinetics have also been noted inthe recent literature. Based on 1H NMR experiments, Seo et al.(2005) reported yields of about 85% based on the amount of waterin one hour of hydrate formation with water dispersed in silicagel pores when reacted with CO2. They also reported that gasmolecules can easily penetrate a bed of silica gel particlessaturated with water and the dispersed water presents a hugesurface for contacting gas molecules. Adeyemo et al. (2010)reported hydrate conversions of 30–45% for a CO2(17%)/N2(83%)/water system and a conversion of �30% for CO2(40%)/H2(60%)/water system for experiments conducted in 100 cm3
silica gel (mean particle size: 5–200 mm, pore diameter:100 nm) saturated with water. Saha and Deng (2010) alsoreported that in the presence of porous media, the minimumhydrate formation time for tetrahydrofuran/hydrogen mixedhydrate was 6–22 times faster compared to the mixed hydrateformed in bulk ice. Saha and Deng (2010) used four porousmaterials including silica gel (pore size range was 4.9–22.6 nm).A water/THF mixture was completely dispersed into the pores
Fig. 7. Comparison of gas uptake (hydrate growth) and water conversion to
hydrates for hydrate formation from a CO2 (38.1%)/H2 (59.4%)/C3H8 (2.5%) gas
mixture (Temperature¼1.0 1C, Pstart¼5.1 MPa). Time zero in the graph corre-
sponds to the nucleation point (induction time) for the experiments.
Fig. 8. Comparison of normalized rate of gas uptake for all the systems. The
experimental time is the same for both experiments conducted for each system
and is given in the figure. The ratios of normalized rate between fixed bed and stirred
tank reactor configurations are presented in parenthesis above the solid dark bars.
Fig. 9. Comparison of temperature profiles and gas uptake for CH4 (90.5%)/C3H8
(9.5%)/water system.
P. Linga et al. / Chemical Engineering Science 68 (2012) 617–623 621
Author's personal copy
and subsequently hydrogen was supplied. The clathrate forma-tion kinetics was greatly accelerated using the porous media.
While the mechanism of hydrate formation in a porous medialike silica gel is known, in the case of silica sand, it is not wellunderstood. We have observed a greater extent of hydrateformation (Fig. 9) and the occurrence of multiple nucleationevents within the bed (Fig. 10) based on the gas uptake andtemperature profile. This enhanced rate of hydrate formation andhigher percent of hydrate formation can be due to several eventsoccurring in the crystallizer like the transport of the gas withinthe bed, migration of water particles inside the bed, the presenceof tortuous pathways in the bed and also due the capillary effectof water flow in the porous hydrate. While the enhancement inthe rate of hydrate formation and the gas consumption is clearlyevident, it is still not possible to postulate the mechanismresponsible for the enhanced hydrate crystallization.
One needs micro level information about the hydrate processinside the bed. In this regards, employing 1H NMR microimagingexperiments is expected to spatially resolve this process in abed of silica sand particles and provide new insights into themechanism of hydrate formation in a fixed bed column(Bagherzadeh et al., 2011; Seo et al., 2005). Bagherzadeh et al.(2011) reported that the formation of hydrate in a sand bed isspatially inhomogeneous and multiple nucleation events areobserved (nucleation of hydrate crystals at different times anddifferent positions inside the bed), which may lead to enhancedhydrate formation. It is also noted that the hydrate formationpatterns for different gas/gas mixtures are not alike those for boththe contact modes investigated in this study (as can be seen inFigs. 1, 4, 6 and 7). It is possible that the structure of hydrateformed plays a role as well as how the magnitude of the drivingforce for hydrate growth changes with time. Finally, it is notedthat the use of a fixed bed column (bed of sand particles) to carryout hydrate formation is advantageous for two reasons. First, itenhances the rate of hydrate formation resulting in higher
percent conversion of water to hydrates and also eliminates theneed for costly mechanical agitation. It should be noted however,that these two advantages are not the only criteria for selection.
5. Conclusions
Hydrate formation experiments were carried out at constanttemperature and in two different crystallizers for four hydrocar-bon systems, CH4/water, CH4/C3H8/water, CH4/C2H6/water andCH4/C2H6/C3H8/water. The gas uptake for hydrate formation in abed of silica sand particles was compared with that in a stirredvessel where gas is contacted with bulk water. The final gasuptake for all the four systems was found to be significantlyhigher for systems studied in a fixed bed column (water dispersedin silica sand). Consequently, it resulted in a higher percentconversion of water to hydrate. Similar experiments were studiedfor two CO2 containing systems of CO2/water and CO2/H2/C3H8,systems that are of interest for CO2 capture and storage via gashydrate crystallization. Similar to the hydrocarbon systems, thegas uptake was found to be significantly higher for the CO2 andCO2/H2/C3H8 systems in a fixed bed column compared to a stirredtank reactor. The mechanism responsible for this enhanced rate inthe bed of silica sand particles is not known at this point.
Nomenclature
nT total number of molesnH moles of the gas in hydrateþwater phase of CRnG moles of gas in gas phase of CRVG volume of gas phase in CRz compressibility factor
Acknowledgment
The financial support from the Natural Sciences and Engineering
Research Council of Canada (NSERC) is greatly appreciated. We thankCef Haligva for his help during the experiments.
References
Aaron, D., Tsouris, C., 2005. Separation of CO2 from flue gas: a review. Sep. Sci.Technol. 40 (1–3), 321–348.
Adeyemo, A., Kumar, R., Linga, P., Ripmeester, J., Englezos, P., 2010. Capture ofcarbon dioxide from flue or fuel gas mixtures by clathrate crystallization in asilica gel column. Int. J. Greenhouse Gas Control 4 (3), 478–485.
Bagherzadeh, A.S., Moudrakovski, I.L., Ripmeester, J.A., Englezos, P., 2011. Magneticresonance imaging of gas hydrate formation in a bed of silica sand particles.Energy Fuels 25, 3083–3092.
Davidson, D.W., 1973. Gas Hydrates. In Water: A Comprehensive Treatise. PlenumPress, New York.
Englezos, P., 1993. Clathrate hydrates. Ind. Eng. Chem. Res. 32 (7), 1251–1274.Grace, J., Collett, T., Colwell, F., Englezos, P., Jones, E., Mansell, R., Meekison, P.J.,
Ommer, R., Pooladi-Darvish, M., Riedel, M., Ripmeester, J., Shipp, C., Wil-loughby, E., 2008. Energy from gas hydrates: assessing the opportunities andchallenges for Canada/the expert panel on gas hydrates. Counc. Can. Acad..
Herri, J.M., Duc, N.H., Chauvy, F., 2007. CO2 capture by hydrate crystallization—apotential solution for gas emission of steelmaking industry. Energy Convers.Manage. 48 (4), 1313–1322.
Kang, S.P., Lee, H., 2000. Recovery of CO2 from flue gas using gas hydrate:thermodynamic verification through phase equilibrium measurements.Environ. Sci. Technol. 34 (20), 4397–4400.
Klara, S.M., Srivastava, R.D., 2002. US DOE integrated collaborative technologydevelopment program for CO2 separation and capture. Environ. Prog. 21 (4),247–253.
Kumar, R., Englezos, P., Moudrakovski, I., Ripmeester, J.A., 2009a. Structure andcomposition of CO2/H2 and CO2/H2/C3H8 hydrate in relation to simultaneousCO2 capture and H2 production. Aiche J. 55 (6), 1584–1594.
Kumar, R., Linga, P., Ripmeester, J.A., Englezos, P., 2009b. A two-stage clathratehydrate/membrane process for pre-combustion capture of carbon dioxide andhydrogen. J. Environ. Eng. 135 (6), 411–417.
Fig. 10. Comparison of temperature profiles and gas uptake for CH4 (91.0%)/C2H6
(9.0%)/water system.
P. Linga et al. / Chemical Engineering Science 68 (2012) 617–623622

Author's personal copy
Kumar, R., Wu, H.J., Englezos, P., 2006. Incipient hydrate phase equilibrium for gasmixtures containing hydrogen, carbon dioxide and propane. Fluid PhaseEquilibria 244 (2), 167–171.
Lee, J.D., Susilo, R., Englezos, P., 2005. Kinetics of structure H gas hydrate. EnergyFuels 19 (3), 1008–1015.
Linga, P., Adeyemo, A., Englezos, P., 2008. Medium-pressure clathrate hydrate/membrane hybrid process for postcombustion capture of carbon dioxide.Environ. Sci. Technol. 42 (1), 315–320.
Linga, P., Haligva, C., Nam, S.C., Ripmeester, J.A., Englezos, P., 2009. Gas hydrateformation in a variable volume bed of silica sand particles. Energy Fuels 23,5496–5507.
Linga, P., Kumar, R., Englezos, P., 2007a. The clathrate hydrate process for post andpre-combustion capture of carbon dioxide. J. Hazardous Mater. 149 (3),625–629.
Linga, P., Kumar, R., Englezos, P., 2007b. Gas hydrate formation from hydrogen/carbon dioxide and nitrogen/carbon dioxide gas mixtures. Chem. Eng. Sci. 62(16), 4268–4276.
Linga, P., Kumar, R., Lee, J.D., Ripmeester, J.A., Englezos, P., 2010. A new large scaleapparatus to enhance the rate of gas hydrate formation: application to captureof carbon dioxide. Int. J. Greenhouse Gas Control 4 (4), 630–637.
Mori, Y.H., 2003. Recent advances in hydrate-based technologies for naturalgas storage—a review. Journal of Chemical Industry and Engineering (China)54, 1–17.
Ripmeester, J.A., Tse, J.S., Ratcliffe, C.I., Powell, B.M., 1987. A new clathrate hydratestucture. Nature 325, 135–136.
Saha, D., Deng, S., 2010. Accelerated formation of THF—H2 clathrate hydrate inporous media. Langmuir 26 (11), 8414–8418.
Seo, Y.T., Moudrakovski, I.L., Ripmeester, J.A., Lee, J.W., Lee, H., 2005. Efficientrecovery of CO2 from flue gas by clathrate hydrate formation in porous silicagels. Environ. Sci. Technol. 39 (7), 2315–2319.
Sloan Jr., E.D., Koh, C.A., 2008. Clathrate Hydrates of the Natural Gases. CRC Press,Boca Raton, FL.
Smith, J.M., Van Ness, H.C., Abbott, M.M., 2001. Introduction to ChemicalEngineering Thermodynamics. McGraw-Hill, Inc., New York.
Tulk, C.A., Ripmeester, J.A., Klug, D.D., 2000. The application of Raman spectro-scopy to the study of gas hydrates. Gas Hydrates: Challenges for the Future
912, 859–872.
P. Linga et al. / Chemical Engineering Science 68 (2012) 617–623 623