Energy dependent gamma-ray morphology in the Pulsar wind nebula HESSJ1825-137
12
arXiv:astro-ph/0607548v1 24 Jul 2006 Astronomy & Astrophysics manuscript no. hessj1825II c ESO 2008 February 5, 2008 Energy dependent γ-ray morphology in the Pulsar wind nebula HESS J1825–137 F. Aharonian 1 , A.G. Akhperjanian 2 , A.R. Bazer-Bachi 3 , M. Beilicke 4 , W. Benbow 1 , D. Berge 1 , K. Bernl ¨ ohr 1,5 , C. Boisson 6 , O. Bolz 1 , V. Borrel 3 , I. Braun 1 , A.M. Brown 7 , R. B ¨ uhler 1 , I. B ¨ usching 8 , S. Carrigan 1 , P.M. Chadwick 7 , L.-M. Chounet 9 , R. Cornils 4 , L. Costamante 1,22 , B. Degrange 9 , H.J. Dickinson 7 , A. Djannati-Ata ¨ i 10 , L.O’C. Drury 11 , G. Dubus 9 , K. Egberts 1 , D. Emmanoulopoulos 12 , P. Espigat 10 , F. Feinstein 13 , E. Ferrero 12 , A. Fiasson 13 , G. Fontaine 9 , Seb. Funk 5 , S. Funk 1 , M. F ¨ ußling 5 , Y.A. Gallant 13 , B. Giebels 9 , J.F. Glicenstein 14 , P. Goret 14 , C. Hadjichristidis 7 , D. Hauser 1 , M. Hauser 12 , G. Heinzelmann 4 , G. Henri 15 , G. Hermann 1 , J.A. Hinton 1,12 , A. Hoffmann 16 , W. Hofmann 1 , M. Holleran 8 , D. Horns 16 , A. Jacholkowska 13 , O.C. de Jager 8 , E. Kendziorra 16 , B. Kh´ elifi 9,1 , Nu. Komin 13 , A. Konopelko 5 , K. Kosack 1 , I.J. Latham 7 , R. Le Gallou 7 , A. Lemi` ere 10 , M. Lemoine-Goumard 9 , T. Lohse 5 , J.M. Martin 6 , O. Martineau-Huynh 17 , A. Marcowith 3 , C. Masterson 1,22 , G. Maurin 10 , T.J.L. McComb 7 , E. Moulin 13 , M. de Naurois 17 , D. Nedbal 18 , S.J. Nolan 7 , A. Noutsos 7 , K.J. Orford 7 , J.L. Osborne 7 , M. Ouchrif 17,22 , M. Panter 1 , G. Pelletier 15 , S. Pita 10 , G. P ¨ uhlhofer 12 , M. Punch 10 , B.C. Raubenheimer 8 , M. Raue 4 , S.M. Rayner 7 , A. Reimer 19 , O. Reimer 19 , J. Ripken 4 , L. Rob 18 , L. Rolland 14 , G. Rowell 1 , V. Sahakian 2 , A. Santangelo 16 , L. Saug´ e 15 , S. Schlenker 5 , R. Schlickeiser 19 , R. Schr ¨ oder 19 , U. Schwanke 5 , S. Schwarzburg 16 , A. Shalchi 19 , H. Sol 6 , D. Spangler 7 , F. Spanier 19 , R. Steenkamp 20 , C. Stegmann 21 , G. Superina 9 , J.-P. Tavernet 17 , R. Terrier 10 , C.G. Th´ eoret 10 , M. Tluczykont 9,22 , C. van Eldik 1 , G. Vasileiadis 13 , C. Venter 8 , P. Vincent 17 , H.J. V ¨ olk 1 , S.J. Wagner 12 , and M. Ward 7 (Affiliations can be found after the references) Preprint online version: February 5, 2008 ABSTRACT Aims. We present results from deep γ-ray observations of the Galactic pulsar wind nebula HESS J1825–137 performed with the H.E.S.S. array. Methods. Detailed morphological and spatially resolved spectral studies reveal the very high-energy (VHE) γ-ray aspects of this object with unprecedented precision. Results. We confirm previous results obtained in a survey of the Galactic Plane in 2004. The γ-ray emission extends asymmetrically to the south and south-west of the energetic pulsar PSR J1826–1334, that is thought to power the pulsar wind nebula. The differential γ-ray spectrum of the whole emission region is measured over more than two orders of magnitude, from 270 GeV to 35 TeV, and shows indications for a deviation from a pure power law. Spectra have also been determined for spatially separated regions of HESS J1825–137. The photon indices from a power-law fit in the different regions show a softening of the spectrum with increasing distance from the pulsar and therefore an energy dependent morphology. Conclusions. This is the first time that an energy dependent morphology has been detected in the VHE γ-ray regime. The VHE γ-ray emission of HESS J1825–137 is phenomenologically discussed in the scenario where the γ-rays are produced by VHE electrons via Inverse Compton scattering. The high γ-ray luminosity of the source cannot be explained on the basis of constant spin-down power of the pulsar and requires higher injection power in past. Key words. ISM: plerions – ISM: individual objects: PSR B1823–13, HESS J1825–137, G18.0–0.7 – gamma-rays: observations 1. Introduction A growing number of extended objects that seem to be as- sociated with energetic pulsars are detected in the Galactic Plane by their very high-energy (VHE, energy E γ 100 GeV) γ-ray emission. Latest results on this class of objects include emission from MSH–15–52 (HESS J1514– 591) (Aharonian et al. 2005a) and Vela X (HESS J0835– Send offprint requests to: Stefan Funk ([email protected]) 455) (Aharonian et al. 2006a), and the two sources in the Kookaburra region (HESS J1420–607 and HESS J1418–609) as described in Aharonian et al. (2006b). If these associa- tions are correct, then these objects are pulsar wind nebulae (PWN), objects generally thought to be powered by a rela- tivistic particle outflow (electrons and positrons) from a cen- tral source. The central source – a pulsar – is a rapidly rotat- ing neutron star generated in a supernova event. The relativis- tic wind of particles flows freely out until its pressure is bal-
Transcript of Energy dependent gamma-ray morphology in the Pulsar wind nebula HESSJ1825-137
arX
iv:a
stro
-ph/
0607
548v
1 2
4 Ju
l 200
6
Astronomy & Astrophysicsmanuscript no. hessj1825II c© ESO 2008February 5, 2008
Energy dependent γ-ray morphology in the Pulsar wind nebulaHESS J1825–137
F. Aharonian1, A.G. Akhperjanian2, A.R. Bazer-Bachi3, M. Beilicke4, W. Benbow1, D. Berge1, K. Bernlohr1,5,C. Boisson6, O. Bolz1, V. Borrel3, I. Braun1, A.M. Brown7, R. Buhler1, I. Busching8, S. Carrigan1, P.M. Chadwick7,L.-M. Chounet9, R. Cornils4, L. Costamante1,22, B. Degrange9, H.J. Dickinson7, A. Djannati-Atai10, L.O’C. Drury11,
G. Dubus9, K. Egberts1, D. Emmanoulopoulos12, P. Espigat10, F. Feinstein13, E. Ferrero12, A. Fiasson13,G. Fontaine9, Seb. Funk5, S. Funk1, M. Fußling5, Y.A. Gallant13, B. Giebels9, J.F. Glicenstein14, P. Goret14,C. Hadjichristidis7, D. Hauser1, M. Hauser12, G. Heinzelmann4, G. Henri15, G. Hermann1, J.A. Hinton1,12,
A. Hoffmann16, W. Hofmann1, M. Holleran8, D. Horns16, A. Jacholkowska13, O.C. de Jager8, E. Kendziorra16,B. Khelifi9,1, Nu. Komin13, A. Konopelko5, K. Kosack1, I.J. Latham7, R. Le Gallou7, A. Lemiere10,
M. Lemoine-Goumard9, T. Lohse5, J.M. Martin6, O. Martineau-Huynh17, A. Marcowith3, C. Masterson1,22,G. Maurin10, T.J.L. McComb7, E. Moulin13, M. de Naurois17, D. Nedbal18, S.J. Nolan7, A. Noutsos7, K.J. Orford7,
J.L. Osborne7, M. Ouchrif17,22, M. Panter1, G. Pelletier15, S. Pita10, G. Puhlhofer12, M. Punch10,B.C. Raubenheimer8, M. Raue4, S.M. Rayner7, A. Reimer19, O. Reimer19, J. Ripken4, L. Rob18, L. Rolland14,
G. Rowell1, V. Sahakian2, A. Santangelo16, L. Sauge15, S. Schlenker5, R. Schlickeiser19, R. Schroder19,U. Schwanke5, S. Schwarzburg16, A. Shalchi19, H. Sol6, D. Spangler7, F. Spanier19, R. Steenkamp20, C. Stegmann21,
G. Superina9, J.-P. Tavernet17, R. Terrier10, C.G. Theoret10, M. Tluczykont9,22, C. van Eldik1, G. Vasileiadis13,C. Venter8, P. Vincent17, H.J. Volk1, S.J. Wagner12, and M. Ward7
(Affiliations can be found after the references)
Preprint online version: February 5, 2008
ABSTRACT
Aims. We present results from deepγ-ray observations of the Galactic pulsar wind nebula HESS J1825–137 performed with the H.E.S.S. array.Methods. Detailed morphological and spatially resolved spectral studies reveal the very high-energy (VHE)γ-ray aspects of this object withunprecedented precision.Results. We confirm previous results obtained in a survey of the Galactic Plane in 2004. Theγ-ray emission extends asymmetrically to thesouth and south-west of the energetic pulsar PSR J1826–1334, that is thought to power the pulsar wind nebula. The differentialγ-ray spectrumof the whole emission region is measured over more than two orders of magnitude, from 270 GeV to 35 TeV, and shows indications for adeviation from a pure power law. Spectra have also been determined for spatially separated regions of HESS J1825–137. The photon indicesfrom a power-law fit in the different regions show a softening of the spectrum with increasing distance from the pulsar and therefore an energydependent morphology.Conclusions. This is the first time that an energy dependent morphology hasbeen detected in the VHEγ-ray regime. The VHEγ-ray emissionof HESS J1825–137 is phenomenologically discussed in the scenario where theγ-rays are produced by VHE electrons via Inverse Comptonscattering. The highγ-ray luminosity of the source cannot be explained on the basis of constant spin-down power of the pulsar and requireshigher injection power in past.
Key words. ISM: plerions – ISM: individual objects: PSR B1823–13, HESSJ1825–137, G18.0–0.7 – gamma-rays: observations
1. Introduction
A growing number of extended objects that seem to be as-sociated with energetic pulsars are detected in the GalacticPlane by their very high-energy (VHE, energyEγ &
100 GeV) γ-ray emission. Latest results on this class ofobjects include emission from MSH–15–52 (HESS J1514–591) (Aharonian et al. 2005a) and Vela X (HESS J0835–
Send offprint requests to: Stefan Funk ([email protected])
455) (Aharonian et al. 2006a), and the two sources in theKookaburra region (HESS J1420–607 and HESS J1418–609)as described in Aharonian et al. (2006b). If these associa-tions are correct, then these objects are pulsar wind nebulae(PWN), objects generally thought to be powered by a rela-tivistic particle outflow (electrons and positrons) from a cen-tral source. The central source – a pulsar – is a rapidly rotat-ing neutron star generated in a supernova event. The relativis-tic wind of particles flows freely out until its pressure is bal-
2 F. Aharonian et al.: Energy dependentγ-ray morphology in HESS J1825–137
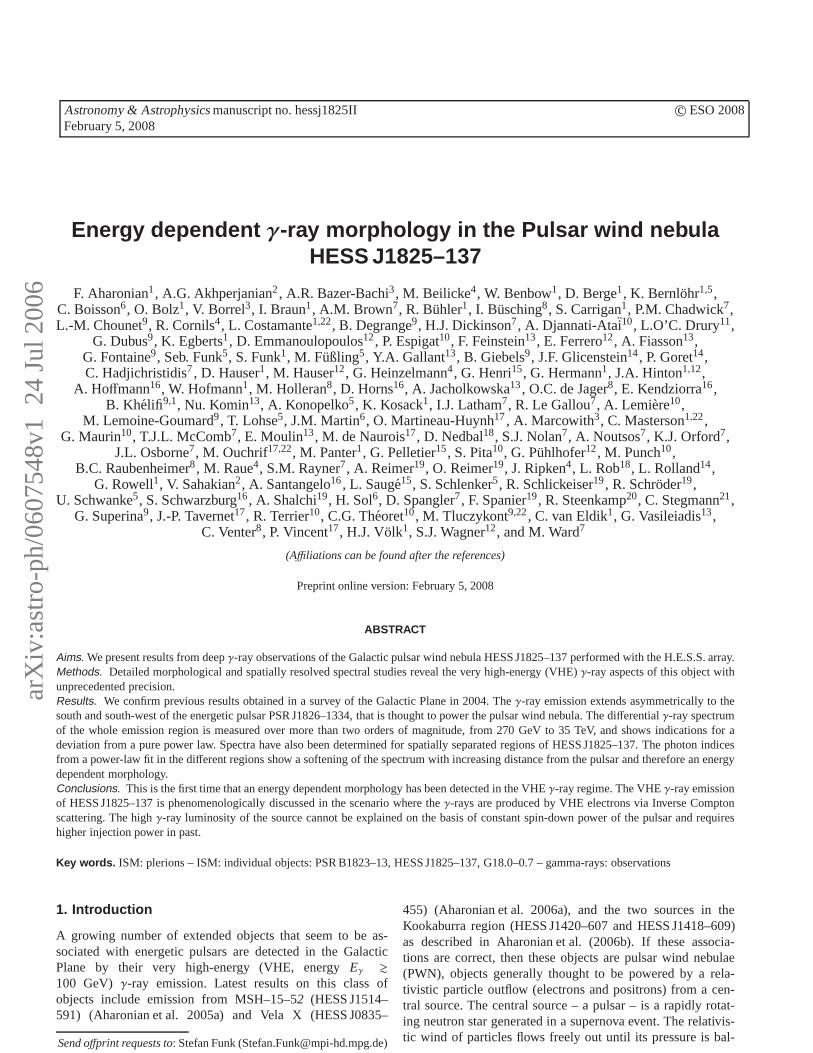
Fig. 1. Acceptance-corrected smoothed excess map (smoothing radius 2.5′) of the 2.7◦ × 2.7◦ field of view surroundingHESS J1825–137. The linear colour scale is in units of integrated excess counts within the smoothing radius of 2.5′. The ex-cess has been derived from a model of the system acceptance asdescribed in the text. The inset in the bottom left corner showsthe PSF of the dataset (smoothed in the same way as the excess map with the black dashed circle denoting the smoothing radius).The dashed black and white contours are linearly spaced and denote the 5σ, 10σ and 15σ significance levels (the 5σ contourbeing the outermost one), determined with aθ = 0.1◦ radius cut. The best fit position of HESS J1825–137 is marked with ablack square, the best extension and position angle by a black ellipse (see text). The dotted white contour shows the 95% po-sitional confidence contour of the unidentified EGRET source3EG J1826–1302. The position of the pulsar PSR J1826–1334 ismarked by a white triangle. The bright point-source to the south of HESS J1825–137 is the microquasar LS 5039 (HESS J1826–148) (Aharonian et al. 2005d). The colour scale for this source is truncated in this Figure. The Galactic plane is shown asa whitedashed line. Some indication for an additional emission region to the north of the pulsar is seen.
anced by that of the surrounding medium. In that region thewind decelerates and a standing termination shock is formedat which particles are accelerated (Kennel & Coroniti 1984a;Aharonian, Atoyan & Kifune 1997). The existence of electronsaccelerated to energies> 100 TeV in such PWN has been es-tablished by X-ray observations of synchrotron emission, e.g.in the Crab nebula (Weisskopf et al. 2000). VHEγ-rays canbe generated in PWN from the high-energy electrons by non-thermal bremsstrahlung or inverse Compton (IC) scatteringonphoton target fields, such as the cosmic microwave background(CMBR) or star-light photons.
One such object, HESS J1825–137, has been detectedby the High Energy Stereoscopic System (H.E.S.S.) in asurvey of the inner Galaxy (Aharonian et al. 2005b, 2006c)and has subsequently been associated with the X-ray PWNG18.0–0.7 surrounding the energetic pulsar PSR J1826–1334 (Aharonian et al. 2005c). This pulsar PSR J1826–1334(also known as PSR B1823–13) was detected in the JodrellBank 20 cm radio survey (Clifton et al. 1992) and is among the
20 most energetic pulsars in the current ATNF catalogue (spindown powerE = 3× 1036 erg/s). The distance of PSR J1826–1334 as measured from the dispersion of the radio pulses is3.9± 0.4 kpc (Cordes & Lazio 2002). The radio detection fur-ther revealed characteristic properties of the system thataresimilar to those of the well studied Vela pulsar, namely a pulseperiod of 101 ms and a characteristic age of 21.4 kyears (de-rived by τ = P/2P). This age renders PSR J1826–1334 oneof the 40 youngest pulsars detected so far (Manchester et al.2005), and due to this, deep radio observations were performedto find emission associated with the remnant of the Supernovaexplosion that gave rise to the pulsar. However, deep VLAobservations of the 20′ surrounding the pulsar have failedto detect this Supernova remnant (SNR) (Braun, Goss & Lyne1989).
Initial observations of the region in X-rays withROSAT (Finley et al. 1998) revealed a point source surroundedby an elongated diffuse region of size∼5′. The X-ray emis-sion region was subsequentially observed with the ASCA in-
F. Aharonian et al.: Energy dependentγ-ray morphology in HESS J1825–137 3
strument and the data confirmed the picture of a compact ob-ject surrounded by an extended emission region (Sakurai et al.2001). While ROSAT data did not provide sufficient statistics,ASCA data lacked the spatial resolution to resolve and inter-pret the sources in this region. The situation was clarified inan XMM-Newton observation in which high angular resolu-tion observations revealed a compact core of extension 30′′
surrounding PSR J1826–1334, and furthermore an asymmetricdiffuse nebula extending at least 5′ to the south of the pul-sar (Gaensler et al. 2003). In this XMM-Newton dataset thesignal to noise ratio deteriorates rapidly at offsets larger than5′ and for this reason the XMM data cannot place useful con-straints on the presence of a faint shell of emission at largerradii as might be produced by an associated SNR. The extendedasymmetric structure was attributed to synchrotron emissionfrom the PWN of PSR J1826–1334 (Gaensler et al. 2003). TheX-ray spectrum in the diffuse emission region follows a powerlaw with photon indexΓ ∼2.3 and an X-ray luminosity between0.5 and 10 keV ofLx ∼ 3 × 1033 erg s−1 compared to the X-ray spectrum for the compact core following a power law withΓ ∼1.6 andLx ∼ 9×1032 erg s−1 (these luminosities are derivedassuming a distance of 4 kpc). Gaensler et al. (2003) discussedvarious scenarios to explain the asymmetry and offset morphol-ogy of the PWN G18.0–0.7. The most likely explanation seemsto be that a symmetric expansion of the PWN is prevented bydense material to the north of the pulsar which shifts the wholeemission to the south. Asymmetric reverse shock interactionsof this kind have originally been proposed to explain the off-set morphology of the Vela X PWN based on hydro-dynamicalsimulations by Blondin, Chevalier & Frierson (2001). Indeedrecent analyses of CO data show dense material surroundingPSR J1826–1334 (at a distance of 4 kpc) to the north and north-east (Lemiere et al. 2005), supporting this picture. It is inter-esting to note, that H.E.S.S. has now detected offset morpholo-gies from both G18.0–0.7 and Vela X (Aharonian et al. 2006a),confirming the existence of a class of at least two offset PWNimplied by X-ray observations (Gaensler et al. 2003). WhereasX-rays probe a combination of the thermal and ultrarelativisticcomponents, which could have been mixed at the time when theasymmetric reverse shock interaction took place, the H.E.S.S.results are important in determining the offset morphology ofthe ultrarelativistic component alone.
Based on its proximity and energetics, the pulsarPSR J1826–1334 has been proposed to be associated with theunidentified EGRET source 3EG J1826–1302 (Hartman et al.1999). This EGRET source exhibits a hard power law of pho-ton index 2.0 ± 0.11 with no indication of a cut-off. The pul-sar lies south of the centre of gravity of the EGRET positionand is marginally enclosed in the 95% confidence contour (seeFig. 1). It has been shown (Zhang & Cheng 1998) that an as-sociation between PSR J1826–1334 and 3EG J1826–1302 isplausible based on the pulsar properties (such as pulsar pe-riod and magnetic field derived in the frame of an outer gapmodel), and that the observedγ-ray spectrum can be fit to thismodel. Although an unpulsed excess from EGRET has been re-ported with a significance of 9σ (Nel et al. 1996), a significantperiodicity could not be established. Additionally an ASCAX-ray source possibly connected to the EGRET data above
1 GeV (Roberts, Romani & Kawai 2001) was found in this re-gion. Recently, Nolan et al. (2003) reassessed the variability ofthe EGRET source and found a weak variability, which led theauthors to consider the source finally as a PWN candidate inthe EGRET high-energyγ-ray energy range above 100 MeV.
Here we report on re-observations of the VHEγ-ray sourceHESS J1825–137 and the region surrounding PSR J1826–1334performed with H.E.S.S. in 2005. H.E.S.S. consists of fourimaging atmospheric Cherenkov telescopes and detects thefaint Cherenkov light fromγ-ray induced air showers in theatmosphere above an energy threshold of 100 GeV up to sev-eral tens of TeV. Each telescope is equipped with a mirror areaof 107 m2 (Bernlohr et al. 2003) and a 960 photo-multipliercamera for the detection of the faint Cherenkov light. The tele-scopes are operated in a coincidence mode in which at leasttwo telescopes must have triggered in each event (Funk et al.2004). The H.E.S.S. system has a point source sensitivity above100 GeV of< 2.0 × 10⁻¹³ cm−2s−1 (1% of the flux from theCrab nebula) for a 5σ detection in a 25 hour observation. Thesystem is located in the Khomas Highland of Namibia (Hinton2004) and began operation in December 2003.
2. H.E.S.S. observations of PSR J1826–1334
First indications of a VHEγ-ray signal in the region sur-rounding the pulsar PSR J1826–1334 during the H.E.S.S.Galactic plane survey (Aharonian et al. 2005b, 2006c) trig-gered pointed re-observations of the region, resulting in thedetection of an 8.1σ significance signal – named HESS J1825–137 (Aharonian et al. 2005c). This significance was obtainedusing events within a circle ofa priori chosen radiusθ = 0.22◦
from the best fit position as used in a blind search for somewhatextended sources. Using a larger integration radius ofθ = 0.4◦,appropriate to contain most of the emission region, the signif-icance increased to 13.4σ. HESS J1825–137 was reported toextend∼1◦ asymmetrically to the south of PSR J1826–1334and shows the same asymmetric extension as the X-ray PWNG 18.0–0.7 on a much larger scale. In Aharonian et al. (2005c)an association has been proposed between the H.E.S.S. sourceand the X-ray emission region. The different sizes in the twoenergy bands were explained by the difference in the syn-chrotron cooling lifetimes of the (higher energy) X-ray emit-ting and the (lower energy) IC-γ-ray emitting electrons. Theenergy spectrum of the source in the 2004 data within the largerintegration circle ofθ = 0.4◦ was fitted by a power law ofphoton index 2.40± 0.09stat± 0.2sys at a flux level correspond-ing to 20% of the flux from the Crab nebula above 1 TeV. Thepeak of HESS J1825–137 is located just outside the 95% confi-dence limits on the position of the unidentified EGRET source3EG J1826–1302. As shown by Aharonian et al. (2005c), theH.E.S.S. energy spectrum can be connected to the EGRETspectrum by extrapolation. Therefore, despite the somewhatmarginal spatial coincidence, an association between these twoobjects was considered.
HESS J1825–137 was revisited in 2005 for∼7 hours inpointed observations between June and July and was addi-tionally in the field of view of a large part of the pointedobservations on the nearby (distance∼1◦) γ-ray emitting mi-
4 F. Aharonian et al.: Energy dependentγ-ray morphology in HESS J1825–137
RA J2000 (hours)
Dec
(de
g.)
-15.5
-15
-14.5
-14
-13.5
-13
-12.5 PSR J1826-1334
18h20m18h30mDistance from best fit (deg)
-1.5 -1 -0.5 0 0.5 1 1.5E
xces
s co
unts
0
200
400
600
PSR J1826-1334North
Distance from best fit (deg)-1.5 -1 -0.5 0 0.5 1 1.5
Exc
ess
coun
ts
0
200
400
600
PSR J1826-1334West
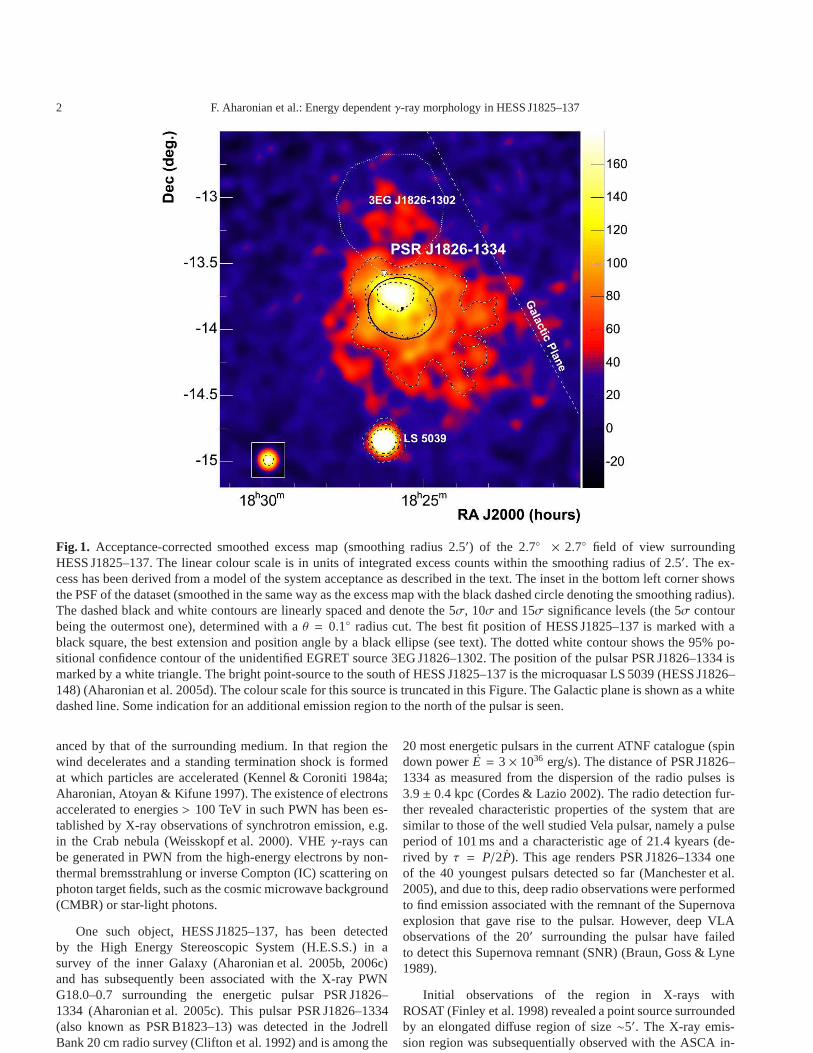
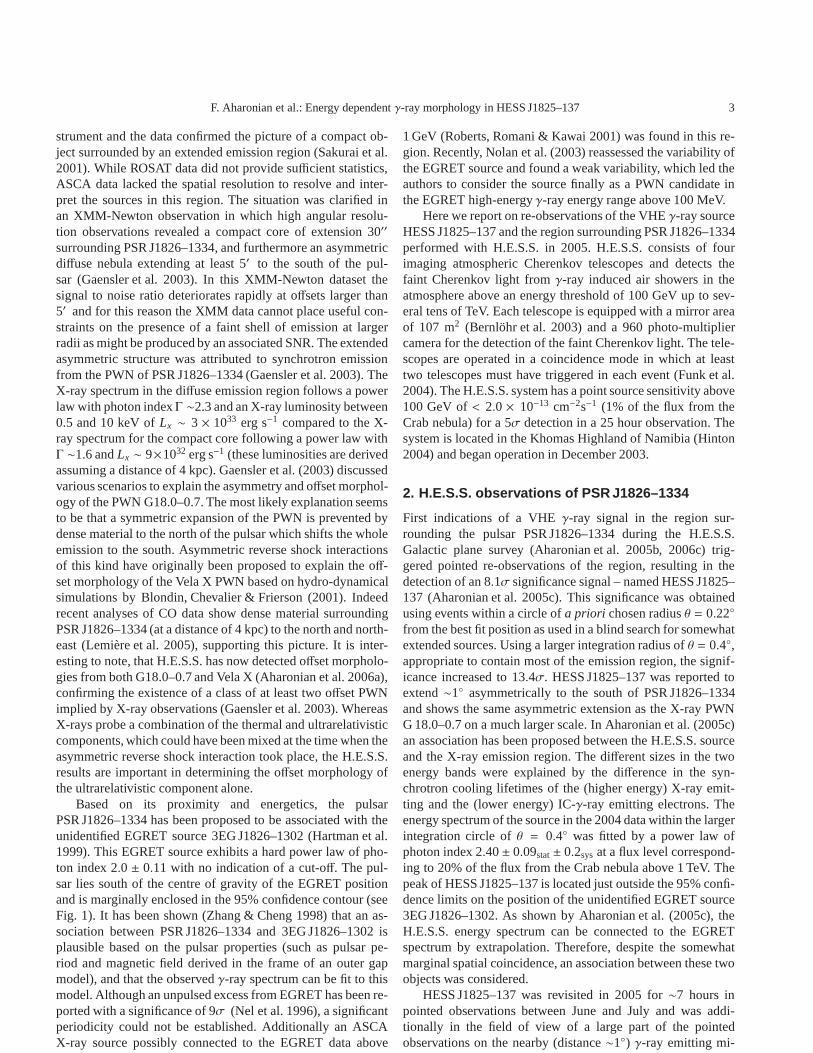
Fig. 2. Slices in the uncorrelated excess map of HESS J1825–137 to further illustrate the morphology. The width of the slices is0.6◦ .The direction is given by the orientation from the fit of an elongated Gaussian (see Fig. 1) and has a value of 17◦ (centralpanel) and perpendicular to this direction (right panel). The left panel shows the region in which the slices were taken as blackboxes overlaid on the H.E.S.S. excess map as shown in Fig. 1. The colors denote the 20%, 40%, 60% and 80% intensity contoursof the VHEγ-ray emission. The slices are centred on the best fit position, the position of the pulsar in the slices is marked asa dashed black line. As a large part of the observations are taken south of HESS J1825–137, the range beyond 1◦ north of thepulsar is at the edge of the field of view of most observations,and the background subtraction is less reliable in this region.
croquasar LS 5039 (HESS J1826–146), adding another 50.9hours between April and September (Aharonian et al. 2005d).Here we report on the total available dataset (i.e. 2004 and2005 data) that includes now∼67 hours of observations withHESS J1825–137 within 2.0◦ of the pointing position of thetelescopes. The exposure adds up to a total dead-time correctedlifetime of 52.1 hours after quality selection of runs accord-ing to hardware and weather conditions, thereby increasingtheobservation time by more than a factor of 6 compared to ear-lier publications. The mean zenith angle of the dataset pre-sented here is 20.1◦, the mean offset of the peak position ofHESS J1825–137 from the pointing direction of the system is1.2◦.
The standard H.E.S.S. event reconstruction scheme was ap-plied to the raw data after calibration and tail-cuts cleaningof the camera images (Aharonian et al. 2004a). The showergeometry was reconstructed based on the intersection of theimage axes, providing an angular resolution of∼0.1◦ for in-dividual γ-rays. Cuts on scaled width and length of the im-age (optimised onγ-ray simulations and off-source data) areapplied to selectγ-ray candidates and suppress the hadronicbackground (Aharonian et al. 2004b). The energy of theγ-rayis estimated from the total image intensity taking into accountthe shower geometry. The resulting energy resolution is∼15%.As previously described (Aharonian et al. 2005b, 2006d), twosets of quality cuts are applied. For morphological studiesofa source a rather tight image size cut of 200 photo-electrons(p.e.) is applied (along with a slightly tighter cut on the meanscaled width), yielding a maximum signal-to-noise ratio for ahard-spectrum source. For spectral studies the image size cut isloosened to 80 p.e. to extend the energy spectra to lower ener-gies. Different methods are applied to derive a background es-timate as described by Hinton, Berge & Funk (2005). For mor-phological studies the background at each test position in thesky is either derived from a ring surrounding this test position(with radius 1.0◦, an area 7 times that of the on-source area, tak-
ing into account the changing acceptance on the ring), or froma model of the system acceptance, derived from off-data (datawith noγ-ray source in the field of view) with similar zenith an-gle. In all background methods, knownγ-ray emitting regionsare excluded from the background regions to avoidγ-ray con-tamination of the background estimate. All results presentedhere have been obtained consistently with different backgroundestimation techniques.
3. VHE γ-ray emission from HESS J1825–137
To illustrate the overall morphology of HESS J1825–137,Fig. 1 shows a smoothed excess map of the field of view sur-rounding the source, corrected for the changing relative ac-ceptance in the field of view. The background for this maphas been derived from a model of the system acceptance ob-tained from off-data (similar to the background estimationin Aharonian et al. (2006d)). The map has been smoothed witha Gaussian of width 2.5′. The inset in the bottom left cornershows a Monte-Carlo simulated point-source as it would ap-pear in the same dataset taking the smoothing and the point-spread function (PSF) for this dataset into account. The pul-sar PSR J1826–1334 is marked by a white triangle. To thesouth of HESS J1825–137, another VHEγ-ray source, thepoint-source microquasar LS 5039 (HESS J1826–148), is vis-ible (Aharonian et al. 2005d). The color scale for this lattersource is truncated and thus its apparent size is exaggerated.Also shown in Fig. 1 is the 95% positional confidence con-tour of the unidentified EGRET source 3EG J1826–1302 (dot-ted white), that is possibly associated to HESS J1825–137.
HESS J1825–137 shows a clearly extended morphologywith respect to the PSF, extending to the south-west of the pul-sar. The position and extension of HESS J1825–137 have beendetermined by fitting the uncorrelated (i.e. unsmoothed) excessmap to a model of a 2-D Gaussianγ-ray brightness profile ofthe formρ ∝ exp(−θ2/2σ2
source), convolved with the PSF for
F. Aharonian et al.: Energy dependentγ-ray morphology in HESS J1825–137 5
Energy (eV)
710 810 910 1010 1110 1210 1310 1410
)-1
s-2
dN
/dE
(er
g cm
2E
-1210
-1110
-1010
EGRET
H.E.S.S.
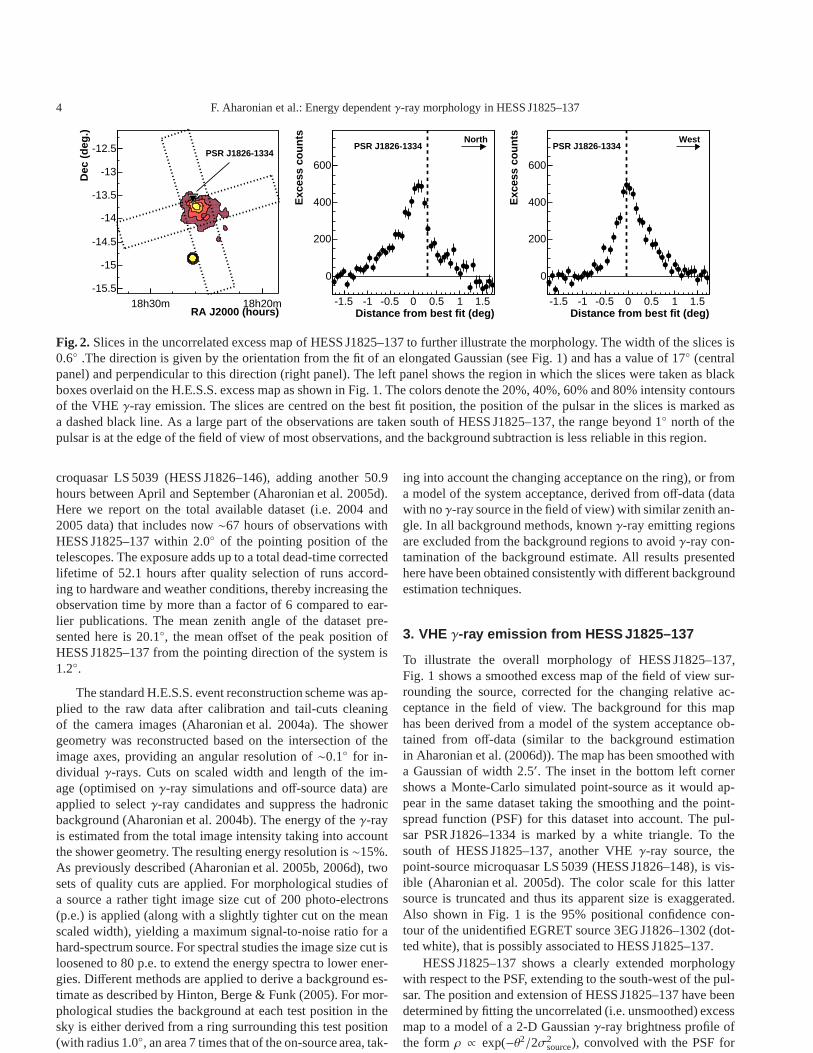
Fig. 3. Energy fluxE2dN/dE of HESS J1825–137 inγ-rays as measured by H.E.S.S. (black filled circles) up to∼35 TeV fora large part of the emission region within an integration radius of 0.8◦ around the best fit position. Also shown as open circlesare the energy flux points of the possibly related unidentified EGRET source 3EG J1826–1302. The background estimate for thespectrum has been derived from off-runs (i.e. runs withoutγ-rays in the field of view). The spectrum can be fit by a power lawdN/dE = I0 E−Γ but the poorχ2 of the fit (40.4 for 15 degrees of freedom) suggests a different spectral shape. Here a power lawfit with an exponential cutoff is shown, but it should be noted that this shape is not favoured over other similarly complex spectralshapes as discussed in the text in more detail.
this dataset (68% containment radius: 0.075◦). The best fit po-sition – equivalent to the center of gravity of the source – isat18h25m41s±3stats , –13◦50′21′′±35stat
′′(here and in the fol-lowing the epoch J2000 is used), the best fit rms extensionis σsource = 0.24◦ ± 0.02stat
◦ . However, theχ2 per degreeof freedom is not satisfactory (1295/1085), indicative of themore complex morphology of the source. Reflecting the non-Gaussian and skewed source profile, the position of the peakin the γ-ray emission (at 18h25m57s, –13◦43′36.8′′as deter-mined by fitting a 2-D Gaussian in a restricted region aroundthe peak) is slightly shifted at a distance of∼8′ to the best fitposition. The pulsar PSR J1826–1334 is located at a distanceof ∼10′ from the peakγ-ray emission and∼17′ from the bestfit position. To test for a different source morphology, an elon-gated Gaussian with independentσsourcealong the minor andσ′sourcealong the major axis and a free position angleω (mea-sured counter-clockwise from the North) has also been fitted.This elongated fit gives a best fit position of 18h25m41s±4stats,–13◦50′20′′±40stat
′′, consistent within errors to the symmetri-cal fit. The fit yields only a slight indication for an elongationwith σsource= 0.23±0.02statandσ′source= 0.26±0.02statat a po-sition angle ofω = 17◦ ± 12◦stat. Theχ2 per degree of freedom(1288/1083) is still relatively poor. The best fit position devi-ates slightly from the best fit position reported in earlier papers(Aharonian et al. 2005b, 2006c). The difference can mainly beattributed to the different fit range. The best fit parameters of theelliptical fit are shown as a black square and ellipse in Fig. 1.Note that the fitted position angle is consistent within errors
with the orientation of the line connecting the pulsar positionand the best fit position, which amounts to 23.1◦.
Fig. 2 shows slices in the direction of the position angle(17◦) of the elliptical fit (centre) and in the direction perpendic-ular to it (right). The width of the slices is chosen to be 0.6◦,the slices are illustrated in the left panel as black dashed boxes.The position of the pulsar in the slices is marked as a dashedblack line. It can be seen, that the peak of the H.E.S.S. emis-sion is close to the pulsar position but slightly shifted as is alsoapparent from the two-dimensional excess plot. Also visible inthe central panel is the rather sharp drop from the peak posi-tion towards the north-eastern direction and the longer tail tothe south-western direction. Some indication for an additionalexcess to the north of HESS J1825–137 is seen in Fig. 1 andin the central panel of Fig. 2 at a distance of∼0.7◦ from thepulsar position. Further investigation of this feature will haveto await future data, in particular given that most current datawere taken on positions south of the pulsar, with regions in thenorth near the edge of the field of view.
For the spectral analysis the image size cut is loosened to80 p.e. to achieve a maximum coverage in energy. The result-ing spectral analysis threshold for the dataset described here is270 GeV. Events with reconstructed direction within an angleθ = 0.8◦ of the source location are considered on-source. Nocorrection for theγ-ray emission extending beyond this angu-lar cut has been applied. Thus the flux level determined cor-responds to the flux level of the source within the integrationregion and might be an underestimation of the flux from the

6 F. Aharonian et al.: Energy dependentγ-ray morphology in HESS J1825–137
Table 1. Fit results for different spectral models for the whole emission region within an integration radius of 0.8◦ aroundthe best fit position and the background derived from off-data. The differential flux normalisationI0 is given in units of10−12 cm−2 s−1 TeV−1. E, EB, andEc are given in units of TeV. The last column gives the integrated flux above the spectralanalysis threshold of 270 GeV in units of 10−11 cm−2 s−1. The power-law fit provides a rather poor description of the data. Thusfits of a power law with an exponential cutoff (row 2), a power law with an energy dependent photon index (row 3), and a brokenpower law (row 4; in the formula, the parameterS = 0.1 describes the sharpness of the transition fromΓ1 to Γ2 and is fixed inthe fit) are also given. Note that some of the fit parameters arehighly correlated.
Fit Formula fordNdE Fit Parameters χ2 (ndf) Flux>270 GeV
I0 E−Γ I0 = 19.8± 0.4 Γ = 2.38± 0.02 40.4 (15) 87.4± 2.0I0 E−Γ exp(−E/Ec) I0 = 21.0± 0.5 Γ = 2.26± 0.03 Ec = 24.8± 7.2 16.9 (14) 86.7± 2.5I0 E−Γ+ β logE I0 = 21.0± 0.4 Γ = 2.29± 0.02 β = −0.17± 0.04 14.5 (14) 82.8± 2.2
I0 (E/EB)−Γ1(
1+ (E/EB)1/S) S (Γ1−Γ2)
I0 = 2.2± 1.0 Γ1 = 2.26± 0.03 Γ2 = 2.63± 0.07 EB = 2.7± 0.5 15.1 (13) 84.6± 38.5
whole source. In the determination of the energy spectrum, theenergy of each event is corrected for the time-varying detectoroptical efficiency, relative to that used in Monte Carlo simula-tions to estimate the effective area of the instrument. The opti-cal efficiency is estimated from single muon events detectedduring each observation run (Leroy et al. 2003; Bolz 2004).The mean energy correction is∼25%. For the spectral analy-sis the background is taken from positions in the same field ofview with the same offset from the pointing direction as thesource region. This approach is taken to avoid systematic ef-fects from the energy-dependent system acceptance function(which is to a good approximation radially symmetric). In an-other approach off-data have been used in the background esti-mation to confirm the results from the same field of view, usingeither the same shaped region as the on-region in the off-dataor using again off-regions distributed with the same offset fromthe pointing direction of the system as the on-region. The totalsignificance of the emission region with the loose cuts is 33.8σwith an excess of 19510± 577γ-ray events. Fig. 3 shows thespectral energy distribution in terms of energy fluxE2dN/dEof the H.E.S.S. emission region (full black circles). Also shownare the energy flux points and the spectral fits of the possiblyrelated unidentified EGRET source 3EG J1826–1302 (open cir-cles). Given the poor angular resolution of EGRET, these dataare taken on a scale similar to that of the full H.E.S.S. emis-sion region and can thus be compared to the total H.E.S.S.flux. From this figure one can see that the unidentified EGRETsource 3EG J1826–1302 could be associated with the H.E.S.S.emission region from a spectral continuity point of view.
A fit of the differential energy spectrum from 270 GeVup to ∼35 TeV by a power lawdN/dE = I0 E−Γ yields anormalisation ofI0 = 19.8 ± 0.4stat ± 4.0sys × 10−12 TeV−1
cm−2 s−1 and a photon indexΓ = 2.38 ± 0.02stat ± 0.15sys
(see Table 1). The flux of HESS J1825–137 above 1 TeV corre-sponds to∼68% of the flux from the Crab nebula. Note thatthis flux is significantly higher than the previously reportedflux (Aharonian et al. 2005c) due to a significantly increasedintegration radius (0.8◦ instead of 0.4◦) in the attempt to coverthe whole source region. Integrating only within the smallerregion of 0.4◦ the flux level is consistent with the previouslypublished result. The power-law fit represents a rather bad de-scription of the data (as can be seenχ2 of the fit) and suggeststherefore a different spectral shape. Various models have been
fit to the data to investigate the shape of the spectrum. Table1summarises these fits. Three alternative shapes have been used:a power law with an exponential cutoff Ec (row 2), a power lawwith an energy dependent exponent (row 3), and and a brokenpower law (row 4). In all cases,I0 is the differential flux nor-malisation, and the photon indices are specified asΓ. It is ev-ident that the alternative descriptions of the spectrum describethe data significantly better than the pure power law as can beseen from the decreasingχ2/ndf (see Table 1).
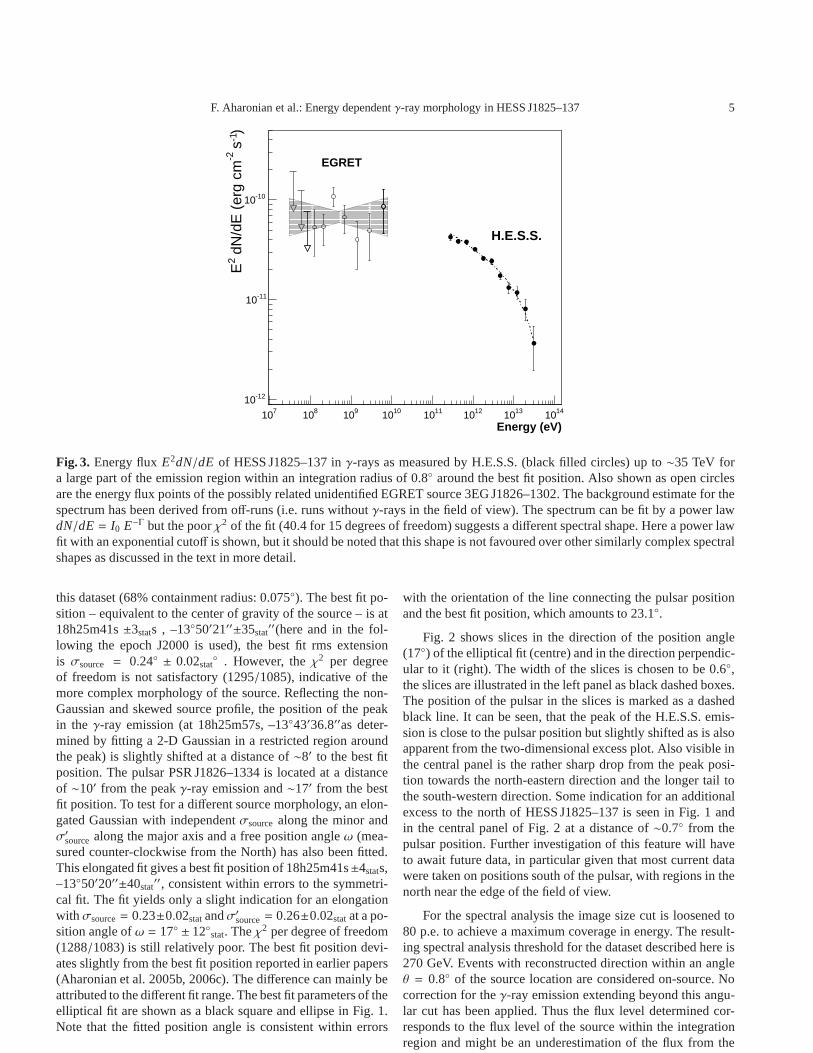
Given the large dataset with more than 19,000γ-ray ex-cess events and given the extension of HESS J1825–137, a spa-tially resolved spectral analysis has been performed to searchfor a change in photon index across the source, similar to thedetailed analysis of theγ-ray SNR RX J1713.7–3946 as per-formed in Aharonian et al. (2006d). Fig. 4 shows energy spec-tra determined in radial bins around the pulsar position, cov-ering the extended tail of the VHEγ-ray source. The inset ofFig. 4 shows again the H.E.S.S. excess map as shown in Fig. 1along with wedges that illustrate the regions in which the en-ergy spectra were determined, with radii increasing in steps of0.1◦; the innermost region is centred on the pulsar PSR J1826–1334. The opening angle of the wedges was constrained byLS 5039 in the southern part and by the apparent end of theemission region in the northern part. For all regions the energyspectrum has been determined by defining the wedge as the on-region. The background estimate has been derived from circlesdistributed on a ring around the pointing direction. The radiusof this ring was chosen to be equal to the distance of the centreof gravity of the wedge to the pointing direction. This approachensures a similar offset distribution in the on- and off-datasetand has been used to determine the background estimate fromthe same field of view as well as from off-data taken on regionswithoutγ-ray sources. Consistent results were achieved in bothmethods.
Along with each spectrum in Fig. 4, the power law fit tothe innermost region centred on the pulsar position is shownasa dashed line for comparison. A softening of the energy spec-tra is apparent with increasing distance from the pulsar. Thissoftening is equivalent to a decrease of the source size within-creasing energy and provides the first evidence for an energydependent morphology detected in VHEγ-rays. Differences inthe energy bin sizes arise from the fact that for non-significantphoton points the bin size was increased. It has been verified
F. Aharonian et al.: Energy dependentγ-ray morphology in HESS J1825–137 7
Fig. 4. Energy spectra in radial bins.Inset: H.E.S.S. excess map as shown in Fig. 1. The wedges show the radial regions withradii in steps of 0.1◦ in which the energy spectra were determined. The innermost region is centred on the pulsar PSR J1826–1334.Main Figure: Differential energy spectra for the regions illustrated in the inset, scaled by powers of 10 for the purpose ofviewing. The spectrum for the analysis at the pulsar position is shown as a reference along with the other spectra as dashed line.For all regions the energy spectrum has been determined as described in the text and has been fitted by a power-law in a restrictedenergy range between 0.25 and 10 TeV.
that this approach does not change the result of the fit. Dueto the different distribution of offsets from the pointing direc-tion of the system in the different regions, the photon analysisthreshold changes slightly, thus some of the different spectra donot start at exactly the same energy.
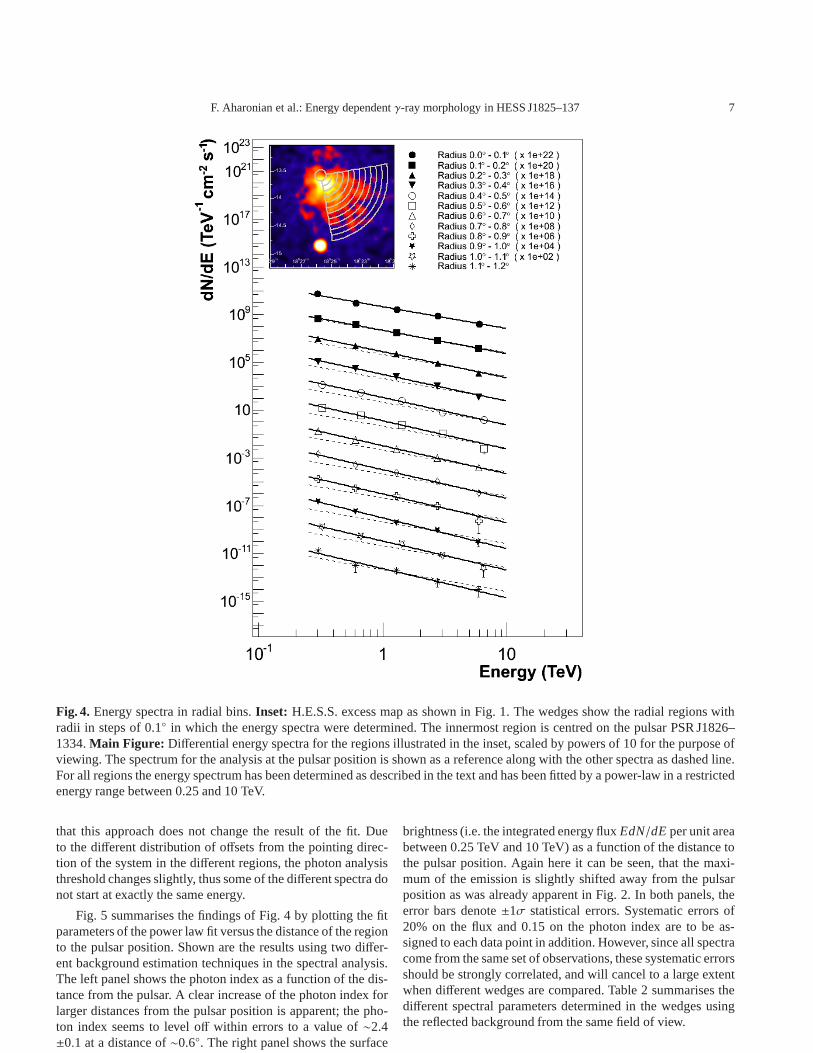
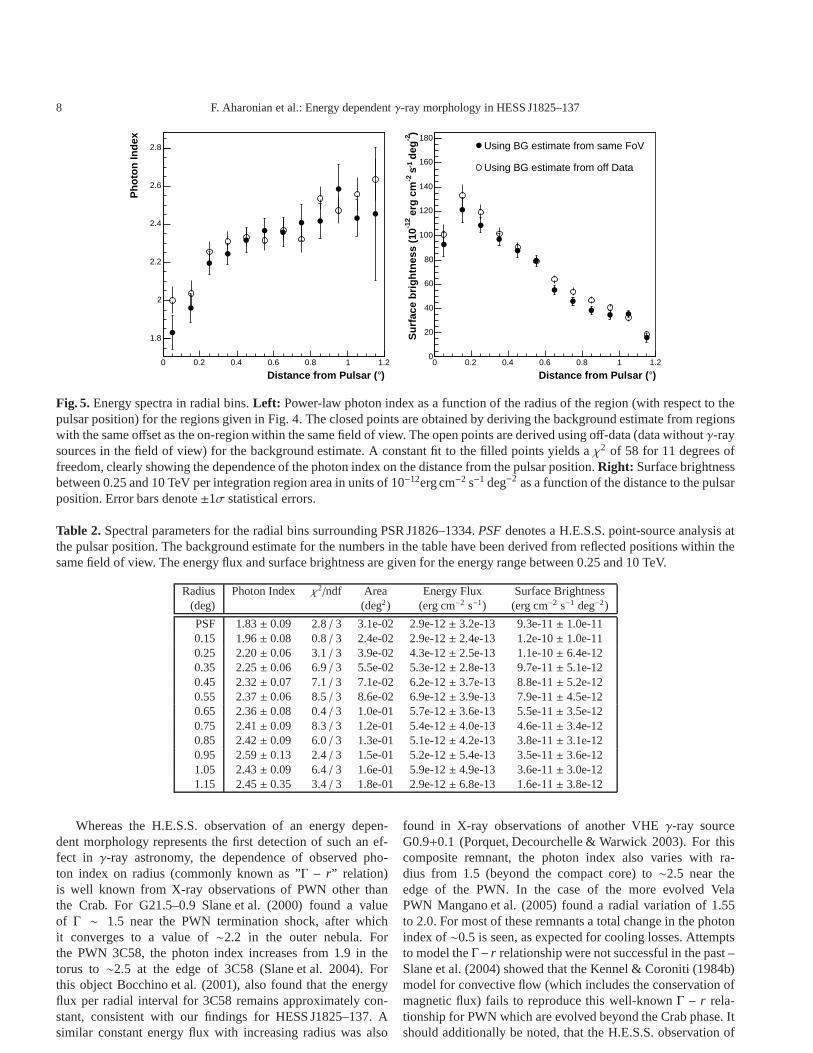
Fig. 5 summarises the findings of Fig. 4 by plotting the fitparameters of the power law fit versus the distance of the regionto the pulsar position. Shown are the results using two differ-ent background estimation techniques in the spectral analysis.The left panel shows the photon index as a function of the dis-tance from the pulsar. A clear increase of the photon index forlarger distances from the pulsar position is apparent; the pho-ton index seems to level off within errors to a value of∼2.4±0.1 at a distance of∼0.6◦. The right panel shows the surface
brightness (i.e. the integrated energy fluxEdN/dE per unit areabetween 0.25 TeV and 10 TeV) as a function of the distance tothe pulsar position. Again here it can be seen, that the maxi-mum of the emission is slightly shifted away from the pulsarposition as was already apparent in Fig. 2. In both panels, theerror bars denote±1σ statistical errors. Systematic errors of20% on the flux and 0.15 on the photon index are to be as-signed to each data point in addition. However, since all spectracome from the same set of observations, these systematic errorsshould be strongly correlated, and will cancel to a large extentwhen different wedges are compared. Table 2 summarises thedifferent spectral parameters determined in the wedges usingthe reflected background from the same field of view.
8 F. Aharonian et al.: Energy dependentγ-ray morphology in HESS J1825–137
)°Distance from Pulsar (0 0.2 0.4 0.6 0.8 1 1.2
Pho
ton
Inde
x
1.8
2
2.2
2.4
2.6
2.8
)°Distance from Pulsar (0 0.2 0.4 0.6 0.8 1 1.2
)-2
deg
-1 s
-2 e
rg c
m-1
2S
urfa
ce b
right
ness
(10
0
20
40
60
80
100
120
140
160
180Using BG estimate from same FoV
Using BG estimate from off Data
Fig. 5. Energy spectra in radial bins.Left: Power-law photon index as a function of the radius of the region (with respect to thepulsar position) for the regions given in Fig. 4. The closed points are obtained by deriving the background estimate fromregionswith the same offset as the on-region within the same field of view. The open points are derived using off-data (data withoutγ-raysources in the field of view) for the background estimate. A constant fit to the filled points yields aχ2 of 58 for 11 degrees offreedom, clearly showing the dependence of the photon indexon the distance from the pulsar position.Right: Surface brightnessbetween 0.25 and 10 TeV per integration region area in units of 10−12erg cm−2 s−1 deg−2 as a function of the distance to the pulsarposition. Error bars denote±1σ statistical errors.
Table 2. Spectral parameters for the radial bins surrounding PSR J1826–1334.PSF denotes a H.E.S.S. point-source analysis atthe pulsar position. The background estimate for the numbers in the table have been derived from reflected positions within thesame field of view. The energy flux and surface brightness are given for the energy range between 0.25 and 10 TeV.
Radius Photon Index χ2/ndf Area Energy Flux Surface Brightness(deg) (deg2) (erg cm−2 s−1) (erg cm−2 s−1 deg−2)
PSF 1.83± 0.09 2.8/ 3 3.1e-02 2.9e-12± 3.2e-13 9.3e-11± 1.0e-110.15 1.96± 0.08 0.8/ 3 2.4e-02 2.9e-12± 2.4e-13 1.2e-10± 1.0e-110.25 2.20± 0.06 3.1/ 3 3.9e-02 4.3e-12± 2.5e-13 1.1e-10± 6.4e-120.35 2.25± 0.06 6.9/ 3 5.5e-02 5.3e-12± 2.8e-13 9.7e-11± 5.1e-120.45 2.32± 0.07 7.1/ 3 7.1e-02 6.2e-12± 3.7e-13 8.8e-11± 5.2e-120.55 2.37± 0.06 8.5/ 3 8.6e-02 6.9e-12± 3.9e-13 7.9e-11± 4.5e-120.65 2.36± 0.08 0.4/ 3 1.0e-01 5.7e-12± 3.6e-13 5.5e-11± 3.5e-120.75 2.41± 0.09 8.3/ 3 1.2e-01 5.4e-12± 4.0e-13 4.6e-11± 3.4e-120.85 2.42± 0.09 6.0/ 3 1.3e-01 5.1e-12± 4.2e-13 3.8e-11± 3.1e-120.95 2.59± 0.13 2.4/ 3 1.5e-01 5.2e-12± 5.4e-13 3.5e-11± 3.6e-121.05 2.43± 0.09 6.4/ 3 1.6e-01 5.9e-12± 4.9e-13 3.6e-11± 3.0e-121.15 2.45± 0.35 3.4/ 3 1.8e-01 2.9e-12± 6.8e-13 1.6e-11± 3.8e-12
Whereas the H.E.S.S. observation of an energy depen-dent morphology represents the first detection of such an ef-fect in γ-ray astronomy, the dependence of observed pho-ton index on radius (commonly known as ”Γ − r” relation)is well known from X-ray observations of PWN other thanthe Crab. For G21.5–0.9 Slane et al. (2000) found a valueof Γ ∼ 1.5 near the PWN termination shock, after whichit converges to a value of∼2.2 in the outer nebula. Forthe PWN 3C58, the photon index increases from 1.9 in thetorus to ∼2.5 at the edge of 3C58 (Slane et al. 2004). Forthis object Bocchino et al. (2001), also found that the energyflux per radial interval for 3C58 remains approximately con-stant, consistent with our findings for HESS J1825–137. Asimilar constant energy flux with increasing radius was also
found in X-ray observations of another VHEγ-ray sourceG0.9+0.1 (Porquet, Decourchelle & Warwick 2003). For thiscomposite remnant, the photon index also varies with ra-dius from 1.5 (beyond the compact core) to∼2.5 near theedge of the PWN. In the case of the more evolved VelaPWN Mangano et al. (2005) found a radial variation of 1.55to 2.0. For most of these remnants a total change in the photonindex of∼0.5 is seen, as expected for cooling losses. Attemptsto model theΓ− r relationship were not successful in the past –Slane et al. (2004) showed that the Kennel & Coroniti (1984b)model for convective flow (which includes the conservation ofmagnetic flux) fails to reproduce this well-knownΓ − r rela-tionship for PWN which are evolved beyond the Crab phase. Itshould additionally be noted, that the H.E.S.S. observation of
F. Aharonian et al.: Energy dependentγ-ray morphology in HESS J1825–137 9
an energy dependent morphology is the first unambiguous de-tection of a spectral steepening away from the pulsar, for fixedelectron energies; in X-rays the situation is complicated by apossible variation of the magnetic field with increasing distancefrom the pulsar; if the X-ray spectrum is probed near or abovethe peak of the SED, a variation of the field will influence theslope. Depending on the age and magnetic field, one might ex-pects to see similar effects in other VHEγ-ray PWN, but so faronly HESS J1825–137 has sufficient statistics to clearly revealthe energy dependent morphology.
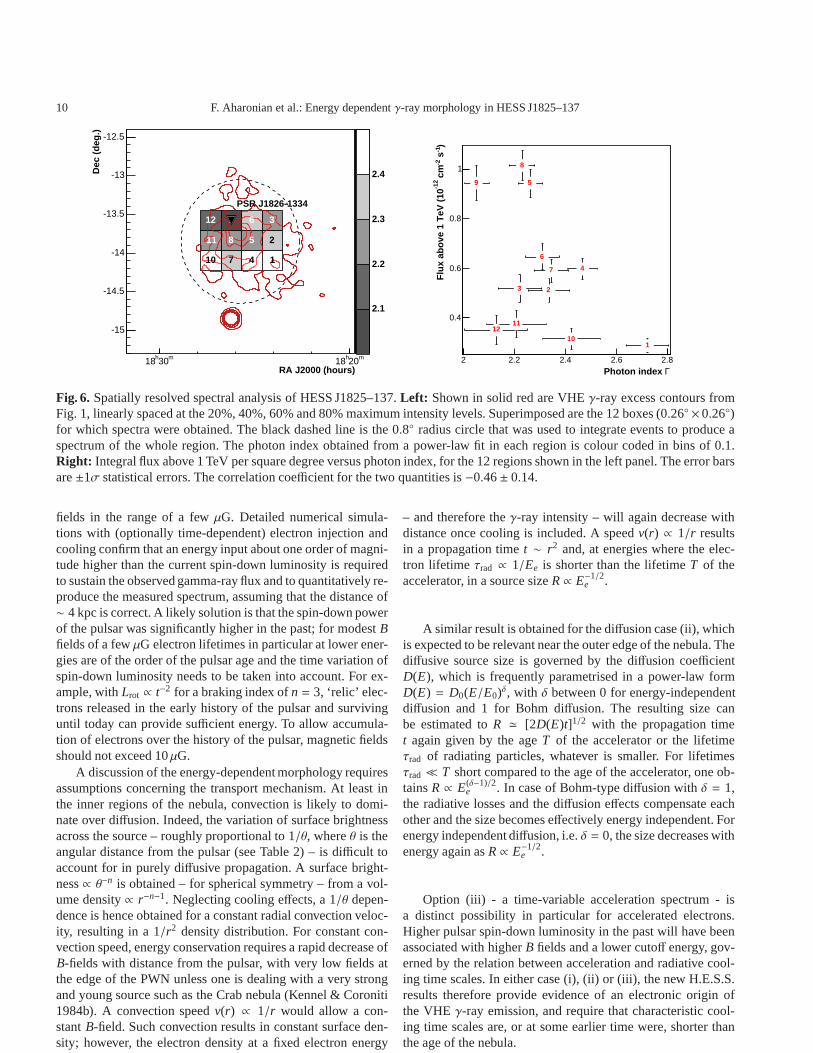
To further investigate the spectral properties ofHESS J1825–137, the emission region has been segmentedinto boxes. The result of the spectral analysis in these boxes isshown in Fig. 6. The left panel shows in red VHEγ-ray excesscontours as given in Fig. 1. Overlaid are 12 boxes for whichspectra were obtained independently. The photon index result-ing from a power law fit in each region is grey-scale coded inbins of 0.1. Also here a softening of the spectral indices awayfrom the pulsar position is apparent, although the error bars arelarger than in Fig. 5 due to the smaller integration regions.Thesize of the boxes is equivalent to the ones used in the analysisof the shell-type SNR RX J1713.7–3946 (Aharonian et al.2006d), where no spectral variation has been detected. Theright hand figure shows the correlation of photon indexΓ tointegral flux per square degree above 1 TeV. A mild correlationbetween the flux per deg2 and the spectral index exists andthe correlation coefficient between these two quantities is−0.46± 0.14.
4. Interpretation
Obviously, the key aspect of the new H.E.S.S. data is the soft-ening of the energy spectrum at larger distances from the pul-sar position or equivalently, the decrease in source size withincreasing energy of theγ-rays. The following discussion isbased on the plausible assumption that particles have beenaccelerated in the proximity of the pulsar during the last 20kyears – the characteristic age of the pulsar – and that theywere then transported by diffusion and/or convection to formthe extended nebula of about 10–15 pc radius (for a recentreview of PWN see Gaensler & Slane 2006). The asymmetricshape of the nebula most likely reflects the ambient conditions,and could be caused by a reverse supernova shock created inthe dense medium north of the pulsar (van der Swaluw & Wu2001; Aharonian et al. 2005c), geometrically by the motion ofthe pulsar leaving a PWN ‘trail’, or even dynamically by a bowshock, resulting in a ‘cometary’ tail; however, the high speedsin excess of 1000 km/s required in case of HESS J1825–137favour the first scenario. Spectral variation with distancefromthe pulsar could result from (i) energy loss of particles dur-ing propagation, with radiative cooling of electrons propagat-ing outward from the pulsar termination shock as the obviousloss mechanism, as well as from (ii) energy dependent diffu-sion or convection speeds, and from (iii) variation of the shapeof the injection spectrum with age of the pulsar which, afterpropagation, translates into a spatial variation of spectra.
Loss mechanisms in (i) include, e.g, adiabatic expansion,ionisation loss, bremsstrahlung, synchrotron losses and inverse
Compton (IC) losses; only the last two result in a lifetimeτ = E/(dE/dt) which decreases with energy and hence causespower-law spectra to steepen, due to the quadratic dependenceof dE/dt on the particle energy (Blumenthal & Gould 1970;Kardashev 1962). A source size which decreases with energyis therefore a strong indication that the accelerated particles areelectrons. The lifetime due to synchrotron and IC losses is:
τrad ≈ 3.1× 10⁵( wr
eV cm−3
)−1 ( Ee
TeV
)−1
yr. (1)
Here, wr = ηwph + 0.025 eVcm−3(B/µG)2 is the total en-ergy density in the form of radiation and magnetic fields,ηis a normalisation factor to account for the reduction of IClosses due to the transition into the Klein-Nishina regime andB the magnetic field. Given the density of the 2.7 K CMBRw2.7K = 0.26 eVcm−3, and the fact that IC losses of multi-TeV electrons on the diffuse optical/IR photons are stronglysuppressed due to the Klein-Nishina effect, and even for theCMBR are reduced by a factorη ≈ 2/3 at H.E.S.S. energies,synchrotron losses dominate forB > 3 µG. In case of continu-ous injection and radiative lifetimes short compared to theageof the source,τrad(E) ≪ T , the spectral indexα of the elec-trons steepens by one unit, corresponding to a change of thephoton index by half a unit, which approximately matches theobserved variation between the inner and outer regions of thenebula (Fig. 5). In the Thomson regime, the energy of the par-ent electrons isEe ≈ 20(Eγ/TeV )1/2 TeV, corresponding tothe range from about 10 to 100 TeV forγ-ray energies between0.2 and 20 TeV. Cooling time scales below 20 kyears requireB > 6 µG for 10 TeV electrons; at 100 TeV the lifetime isbelow 20 kyears already in typical 3µG interstellar fields, sosome steepening of spectra at the highest energies is expectedeven in relatively modest fields.
It is then instructive to consider the energy budget of thePWN in an electronic scenario. The assumed large distanceof ≈ 4 kpc and the relatively highγ-ray flux, F ≃ 1.5 ×10⁻¹⁰ erg/cm2s above 200 GeV, imply a quite luminous VHEγ-ray source,Lγ ∼ 3× 1035 erg/s. This luminosity is compara-ble to that of the Crab nebula, while the spin-down luminosityof the pulsar is smaller by two orders of magnitude. Thus, theefficiency of theγ-ray production in HESS J1825–137 is muchhigher,ǫγ = Lγ(> 200GeV)/Lrot ≈ 0.1. A relatively large effi-ciency is not unexpected (Aharonian, Atoyan & Kifune 1997)since the much lower magnetic field in a nebula powered by aless energetic pulsar results in a more favourable sharing be-tween IC and synchrotron energy losses. In a steady state, andneglecting non-radiative energy losses, the efficiency forγ-rayproduction is
ǫγ ≈ ǫeτrad
τIC≈ ǫe
ηwph
ηwph + 0.025eVcm−3(B/µG)2(2)
whereτIC is the lifetime due to IC losses andǫe is the fractionof pulsar spin-down power going into 10 to 100 TeV electrons,corresponding to the observedγ-ray energies. Unless the elec-tron spectral index is well below 2 at energies below 10 TeV,ǫewill be below 10-15%, taking into account the sharing of spin-down energy between particle and field energies. An efficiencyǫγ of 0.1 cannot be obtained, even for rather small magnetic
10 F. Aharonian et al.: Energy dependentγ-ray morphology in HESS J1825–137
RA J2000 (hours)
Dec
(de
g.)
-15
-14.5
-14
-13.5
-13
-12.5
m20h18m30h18
2.1
2.2
2.3
2.4
1
2
3
4
5
6
7
8
9
10
11
12
PSR J1826-1334
ΓPhoton index 2 2.2 2.4 2.6 2.8
)-1
s-2
cm
-12
Flu
x ab
ove
1 T
eV (
10
0.4
0.6
0.8
1
1
23
4
5
6
7
8
9
10
1112
Fig. 6. Spatially resolved spectral analysis of HESS J1825–137.Left: Shown in solid red are VHEγ-ray excess contours fromFig. 1, linearly spaced at the 20%, 40%, 60% and 80% maximum intensity levels. Superimposed are the 12 boxes (0.26◦ ×0.26◦)for which spectra were obtained. The black dashed line is the0.8◦ radius circle that was used to integrate events to produce aspectrum of the whole region. The photon index obtained froma power-law fit in each region is colour coded in bins of 0.1.Right: Integral flux above 1 TeV per square degree versus photon index, for the 12 regions shown in the left panel. The error barsare±1σ statistical errors. The correlation coefficient for the two quantities is−0.46± 0.14.
fields in the range of a fewµG. Detailed numerical simula-tions with (optionally time-dependent) electron injection andcooling confirm that an energy input about one order of magni-tude higher than the current spin-down luminosity is requiredto sustain the observed gamma-ray flux and to quantitativelyre-produce the measured spectrum, assuming that the distance of∼ 4 kpc is correct. A likely solution is that the spin-down powerof the pulsar was significantly higher in the past; for modestBfields of a fewµG electron lifetimes in particular at lower ener-gies are of the order of the pulsar age and the time variation ofspin-down luminosity needs to be taken into account. For ex-ample, withLrot ∝ t−2 for a braking index ofn = 3, ‘relic’ elec-trons released in the early history of the pulsar and survivinguntil today can provide sufficient energy. To allow accumula-tion of electrons over the history of the pulsar, magnetic fieldsshould not exceed 10µG.
A discussion of the energy-dependent morphology requiresassumptions concerning the transport mechanism. At least inthe inner regions of the nebula, convection is likely to domi-nate over diffusion. Indeed, the variation of surface brightnessacross the source – roughly proportional to 1/θ, whereθ is theangular distance from the pulsar (see Table 2) – is difficult toaccount for in purely diffusive propagation. A surface bright-ness∝ θ−n is obtained – for spherical symmetry – from a vol-ume density∝ r−n−1. Neglecting cooling effects, a 1/θ depen-dence is hence obtained for a constant radial convection veloc-ity, resulting in a 1/r2 density distribution. For constant con-vection speed, energy conservation requires a rapid decrease ofB-fields with distance from the pulsar, with very low fields atthe edge of the PWN unless one is dealing with a very strongand young source such as the Crab nebula (Kennel & Coroniti1984b). A convection speedv(r) ∝ 1/r would allow a con-stantB-field. Such convection results in constant surface den-sity; however, the electron density at a fixed electron energy
– and therefore theγ-ray intensity – will again decrease withdistance once cooling is included. A speedv(r) ∝ 1/r resultsin a propagation timet ∼ r2 and, at energies where the elec-tron lifetime τrad ∝ 1/Ee is shorter than the lifetimeT of theaccelerator, in a source sizeR ∝ E−1/2
e .
A similar result is obtained for the diffusion case (ii), whichis expected to be relevant near the outer edge of the nebula. Thediffusive source size is governed by the diffusion coefficientD(E), which is frequently parametrised in a power-law formD(E) = D0(E/E0)δ, with δ between 0 for energy-independentdiffusion and 1 for Bohm diffusion. The resulting size canbe estimated toR ≃ [2D(E)t]1/2 with the propagation timet again given by the ageT of the accelerator or the lifetimeτrad of radiating particles, whatever is smaller. For lifetimesτrad≪ T short compared to the age of the accelerator, one ob-tainsR ∝ E(δ−1)/2
e . In case of Bohm-type diffusion withδ = 1,the radiative losses and the diffusion effects compensate eachother and the size becomes effectively energy independent. Forenergy independent diffusion, i.e.δ = 0, the size decreases withenergy again asR ∝ E−1/2
e .
Option (iii) - a time-variable acceleration spectrum - isa distinct possibility in particular for accelerated electrons.Higher pulsar spin-down luminosity in the past will have beenassociated with higherB fields and a lower cutoff energy, gov-erned by the relation between acceleration and radiative cool-ing time scales. In either case (i), (ii) or (iii), the new H.E.S.S.results therefore provide evidence of an electronic originofthe VHE γ-ray emission, and require that characteristic cool-ing time scales are, or at some earlier time were, shorter thanthe age of the nebula.
F. Aharonian et al.: Energy dependentγ-ray morphology in HESS J1825–137 11
4.1. Conclusion
We have presented detailed morphological and spectral studiesof the VHEγ-ray source HESS J1825–137 that has been origi-nally detected in the survey of the inner Galaxy, conducted byH.E.S.S. in 2004. Theγ-ray spectrum of the source has beenmeasured over more than two decades between∼270 GeV and∼35 TeV. The energy spectrum shows indications for a devia-tion from a pure power-law. Several spectral shapes have beenapplied to fit the data and it seems, that a broken power-lawor a power-law with energy dependent photon index provide abetter description than a pure power law. The large data sethas provided the possibility for a spatially resolved spectralstudy. A significant softening of theγ-ray spectrum away fromthe position of the energetic pulsar PSR J1826–1334 has beenfound, providing the first direct evidence of an energy depen-dent morphology in VHEγ-rays. The studies performed heresignificantly strengthen the case that the VHEγ-ray emissionoriginates in the wind nebula of PSR J1826–1334. It is diffi-cult to explain the measuredγ-ray luminosity in terms of thecurrent spin-down luminosity of the pulsar. A like scenarioisa significant contribution of ‘relic’ electrons released intheearly history of the pulsar, when the spin-down luminosity ishigher. The variation of index with distance from the pulsarisattributed both to IC and synchrotron cooling of the continu-ously accelerated electrons.
Acknowledgements. The support of the Namibian authorities and ofthe University of Namibia in facilitating the constructionand oper-ation of H.E.S.S. is gratefully acknowledged, as is the support bythe German Ministry for Education and Research (BMBF), the MaxPlanck Society, the French Ministry for Research, the CNRS-IN2P3and the Astroparticle Interdisciplinary Programme of the CNRS, theU.K. Particle Physics and Astronomy Research Council (PPARC),the IPNP of the Charles University, the South African Departmentof Science and Technology and National Research Foundation, andby the University of Namibia. We appreciate the excellent work ofthe technical support staff in Berlin, Durham, Hamburg, Heidelberg,Palaiseau, Paris, Saclay, and in Namibia in the construction and oper-ation of the equipment.
References
Aharonian, F. A., Atoyan, A., & Kifune, T. 1997, MNRAS 291,162
Aharonian, F. A., et al. (H.E.S.S. Collaboration) 2004a, APh22, 109
Aharonian, F. A., et al. (H.E.S.S. Collaboration) 2004b, A&A430, 865
Aharonian, F. A., et al. (H.E.S.S. Collaboration) 2005a, A&A435, L17
Aharonian, F. A., et al. (H.E.S.S. Collaboration) 2005b,Science 307, 1938
Aharonian, F. A., et al. (H.E.S.S. Collaboration) 2005c, A&A442, L25
Aharonian, F. A., et al. (H.E.S.S. Collaboration) 2005d,Science 309, 746
Aharonian, F. A., et al. (H.E.S.S. Collaboration) 2006a, A&A,448, L43
Aharonian, F. A., et al. (H.E.S.S. Collaboration) 2006b, inpress (astro-ph/0606311)
Aharonian, F. A., et al. (H.E.S.S. Collaboration) 2006c, ApJ636, 777
Aharonian, F. A., et al. (H.E.S.S. Collaboration) 2006d, A&A449, 223
Bernlohr, K. et al. 2003, APh 20, 111Blondin, J.M., Chevalier, R.A., & Frierson, D.M. 2001, ApJ
563, 806Blumenthal, G. R., Gould, R. J. 1970, Rev. Mod. Phys 42, 237Bocchino, F., Warwick, R. S., Marty, P., Lumb, S., Becker, W.,
& Pigot, C. 2001, A&A 369, 1078Bolz, O. 2004, PhD thesis, Karl-Ruprecht University
Heidelberg (http://www.ub.uni-heidelberg.de/archiv/4812)Braun, R., Goss, W. M., & Lyne, A. G., 1989, ApJ 340, 355Clifton, T. R., Lyne, A. G., Jones, A. W., McKenna, J., &
Ashworth, M. 1992, MNRAS 254, 177Cordes, J. M., & Lazio, T. J. W. 2002, preprint
(astro-ph/0207156)Finley, J. P., Srinivasan, R., & Park, S. 1996, ApJ 466, 938Funk, S. et al. 2004, APh 22, 285Gaensler, B. M., Schulz, N. S., Kaspi, V. M. Pivovaroff, M. J.,
& Becker, W. E. 2003, ApJ 588, 441Gaensler, B. M., & Slane, P. O. 2006, To appear in Annual
Review of A&A. (astro-ph/0601081)Hartman, R. C., et al., 1999, ApJS 123, 79Hinton, J. A. 2004, NewAR 48, 331Hinton, J. A., Berge, D., & Funk, S. 2005, Proc. of
Towards a Network of Atmospheric Cherenkov DetectorsVII (Palaiseau), 183
Kardashev, N. S. 1962, Sov. Astr. 6, 317Kennel, C. F., Coroniti, F. V. 1984a, ApJ 283, 710Kennel, C. F., Coroniti, F. V. 1984b, ApJ 283, 694Kobayashi, T., Komori, Y., Yoshida, K., Nishimura, J. 2004,
ApJ 601, 340Lemiere, A., for the H.E.S.S. Collaboration, To appear in the
Proceedings of the 29th ICRC, Pune (2005)Leroy, N. et al. 2003, in Proceedings of the 28th International
Cosmic Ray Conference (Tsukuba), Vol. 1, 2895 (ArXiv:astro-ph/0307452)
Manchester, R. N., Hobbs, G. B., Teoh, A., & Hobbs, M. 2005,AJ 129, 1993
Mangano, V., Massaro, E., Bocchino, F., Mineo, T., &Cusumano, G. 2005, A&A 436, 917
Nel, H.I. et al. 1996, ApJ 465, 898Nolan, P. L, Tompkins, W. F., Grenier, I. A., & Michelson, P. F.
2003, ApJ 597, 615Porquet, D., Decourchelle, A., & Warwick, R. S. 2003, A&A
401, 197Roberts, M. S. E., Romani, R. W., Kawai, N. 2001, ApJS 133,
451Sakurai, I., Kawai, N., Torii, K., & Shibata, S. 2001, in ASP
Conf. Ser. 251, New Century of X-Ray Astronomy, ed. H.Inoue & H. Kunieda (San Francisco: ASP), 408
Slane, P., Yang, C., Schulz, N. S., Seward, F. D., Hughes, J. P.& Gaensler, B. M. 2000, ApJ 533, L29
Slane, P., Helfand, D. J, van der Swaluw, E., & Murray, S. S2004, ApJ 616, 403
12 F. Aharonian et al.: Energy dependentγ-ray morphology in HESS J1825–137
van der Swaluw, E., & Wu, Y. 2001, ApJ 555, L49Weisskopf, M. C., et al. 2000, ApJ 536, L81Zhang L., & Cheng, K. S. 1998, A&A 335, 234
List of Objects
‘HESS J1825–137’ on page 1‘PSR J1826–1334’ on page 1‘PSR B1823–13’ on page 1‘HESS J1825–137’ on page 1‘G18.0–0.7’ on page 1‘MSH–15–52’ on page 1‘HESS J1514–591’ on page 1‘Vela X’ on page 1‘HESS J0835–455’ on page 1‘Kookaburra’ on page 1‘HESS J1420–607’ on page 1‘HESS J1418–609’ on page 1‘3EG J1826–1302’ on page 2‘LS 5039’ on page 2‘HESS J1826–148’ on page 2‘G21.5–0.9’ on page 7‘3C58’ on page 7‘G0.9+0.1’ on page 71 Max-Planck-Institut fur Kernphysik, P.O. Box 103980, D 69029
Heidelberg, Germany2 Yerevan Physics Institute, 2 Alikhanian Brothers St., 375036
Yerevan, Armenia3 Centre d’Etude Spatiale des Rayonnements, CNRS/UPS, 9 av. du
Colonel Roche, BP 4346, F-31029 Toulouse Cedex 4, France4 Universitat Hamburg, Institut fur Experimentalphysik,Luruper
Chaussee 149, D 22761 Hamburg, Germany5 Institut fur Physik, Humboldt-Universitat zu Berlin, Newtonstr. 15,
D 12489 Berlin, Germany6 LUTH, UMR 8102 du CNRS, Observatoire de Paris, Section de
Meudon, F-92195 Meudon Cedex, France7 University of Durham, Department of Physics, South Road,
Durham DH1 3LE, U.K.8 Unit for Space Physics, North-West University, Potchefstroom
2520, South Africa9 Laboratoire Leprince-Ringuet, IN2P3/CNRS, Ecole
Polytechnique, F-91128 Palaiseau, France10 APC, 11 Place Marcelin Berthelot, F-75231 Paris Cedex
05, France UMR 7164 (CNRS, Universite Paris VII, CEA,Observatoire de Paris)
11 Dublin Institute for Advanced Studies, 5 Merrion Square, Dublin2, Ireland
12 Landessternwarte, Universitat Heidelberg, Konigstuhl, D 69117Heidelberg, Germany
13 Laboratoire de Physique Theorique et Astroparticules,IN2P3/CNRS, Universite Montpellier II, CC 70, Place EugeneBataillon, F-34095 Montpellier Cedex 5, France
14 DAPNIA/DSM/CEA, CE Saclay, F-91191 Gif-sur-Yvette, Cedex,France
15 Laboratoire d’Astrophysique de Grenoble, INSU/CNRS,Universite Joseph Fourier, BP 53, F-38041 Grenoble Cedex 9,France
16 Institut fur Astronomie und Astrophysik, Universitat T¨ubingen,Sand 1, D 72076 Tubingen, Germany
17 Laboratoire de Physique Nucleaire et de Hautes Energies,IN2P3/CNRS, Universites Paris VI & VII, 4 Place Jussieu, F-75252 Paris Cedex 5, France
18 Institute of Particle and Nuclear Physics, Charles University, VHolesovickach 2, 180 00 Prague 8, Czech Republic
19 Institut fur Theoretische Physik, Lehrstuhl IV: WeltraumundAstrophysik, Ruhr-Universitat Bochum, D 44780 Bochum,Germany
20 University of Namibia, Private Bag 13301, Windhoek, Namibia21 Universitat Erlangen-Nurnberg, Physikalisches Institut, Erwin-
Rommel-Str. 1, D 91058 Erlangen, Germany22 European Associated Laboratory for Gamma-Ray Astronomy,
jointly supported by CNRS and MPG