EMOLITE - Final Report - TRIMIS
131
Contract nr. ST-96-SC.1018 Final Report November 1999 Database Manual University of Antwerp - RUCA Universidade Nova de Lisboa University of Piraeus 1 Final Report for Publication (public)
-
Upload
khangminh22 -
Category
Documents
-
view
4 -
download
0
Transcript of EMOLITE - Final Report - TRIMIS

Contract nr. ST-96-SC.1018 Final Report November 1999 Database Manual
University of Antwerp - RUCA
Universidade Nova de Lisboa
University of Piraeus
1
Final Report for Publication (public)

Contract nr. ST-96-SC.1018 Final Report November 1999 Database Manual
University of Antwerp - RUCA
Universidade Nova de Lisboa
University of Piraeus
2
Content
1 Names and Addresses of the Partnership ........................................................... 5
2 Executive Summary............................................................................................. 7
2.1 context ............................................................................................................. 7
2.2 EMOLITE framework........................................................................................ 8
2.3 Components Description.................................................................................. 9
2.4 Conclusions ................................................................................................... 12
3 Objectives of the EMOLITE project ................................................................... 13
4 Means to achieve the objectives........................................................................ 15
5 Scientific and technical description of EMOLITE............................................... 18
5.1 Introduction .................................................................................................... 18
5.2 Context........................................................................................................... 19
5.3 Project description.......................................................................................... 20
5.3.1 Introduction ............................................................................................. 20
5.4 Development of the prototype........................................................................ 21
5.4.1 First prototype ......................................................................................... 21
5.4.2 Final prototype ........................................................................................ 25
5.5 The EMOLITE database ................................................................................ 32
5.5.1 The general database structure .............................................................. 33
5.5.2 The EMOLITE Internal database ............................................................ 35
5.5.3 Information sources and how to update the data.................................... 42
5.5.4 The external EMOLITE database ........................................................... 46

Contract nr. ST-96-SC.1018 Final Report November 1999 Database Manual
University of Antwerp - RUCA
Universidade Nova de Lisboa
University of Piraeus
3
5.6 Technical description of EMOLITE................................................................. 48
5.6.1 Technical requirements........................................................................... 48
5.6.2 The EMOLITE framework ....................................................................... 49
5.6.3 Data handling.......................................................................................... 49
5.6.4 Simulation process for selection of destination terminals ....................... 49
5.7 The user interface to increase user accessibility ........................................... 57
5.8 Setting weights and criteria ............................................................................ 64
5.9 EMOLITE Algorithms ..................................................................................... 66
5.9.1 The models of EMOLITE ........................................................................ 66
5.9.2 The Objective Function ........................................................................... 68
5.9.3 The Optimising Process.......................................................................... 69
5.9.4 The Multiple Terminal Choice Problem: a Heuristic Approach................ 71
6 Improvement potential of EMOLITE .................................................................. 75
6.1 EMOLITE for passenger terminals................................................................. 75
6.2 EMOLITE 2000 : The internet version............................................................ 77
6.3 Some strategic considerations ....................................................................... 80
6.3.1 introduction ............................................................................................. 80
6.3.2 Project assessment................................................................................. 80
6.3.3 Problem Analysis .................................................................................... 82
6.3.4 Design..................................................................................................... 82
6.3.5 Development, testing and documentation............................................... 83
6.3.6 Implementation ....................................................................................... 84
6.3.7 Maintenance ........................................................................................... 85
6.3.8 Note on Semi-structured decisions ......................................................... 85

Contract nr. ST-96-SC.1018 Final Report November 1999 Database Manual
University of Antwerp - RUCA
Universidade Nova de Lisboa
University of Piraeus
4
7 Conclusions and recommendations................................................................... 87
7.1 Why EMOLITE?............................................................................................. 87
7.2 EMOLITE and the decision making process ................................................. 88
7.3 The usefulness of EMOLITE.......................................................................... 90
8 Annex 1: References and further reading.......................................................... 92
9 Annex 2: The External Database of EMOLITE.................................................. 96
9.1 Global Transport Data.................................................................................... 96
9.1.1 Global Transport Database..................................................................... 96
9.1.2 Transport Networks................................................................................. 98
9.2 AND Format ................................................................................................. 102
9.3 Transport Network........................................................................................ 109
10 Annex 3: additional technical information ........................................................ 119
10.1 The approach used to develop the project ............................................... 119
10.2 Fuzzy an crisp approach .......................................................................... 120
10.3 Three-tier architecture .............................................................................. 124
11 Annex 4: Short presentation of EMOLITE results and potential ....................... 129
12 Annex 5: Summary of EMOLITE project (Cordis)
13 Annex 6: EMOLITE Software (no Copyright, Public)

Contract nr. ST-96-SC.1018 Final Report November 1999 Database Manual
University of Antwerp - RUCA
Universidade Nova de Lisboa
University of Piraeus
5
1 Names and Addresses of the Partnership
Project Management Scientific Management
University of Antwerp – RUCA Department of Transport Middelheimlaan 1 2020 Antwerpen Prof. Dr. A. Verbeke Project co-ordinator tel: +32 3 218 07 32 fax: +32 3 218 07 46 Email: not available
STRATECO Eeig Floris Jespersbuilding Plantinkaai 1, box 8 2000 Antwerpen Dr. E. Declercq Scientific Officer tel: +32 3 234 16 46 fax. +32 3 234 96 62 Email: [email protected]
Project Partners
UNIVERSITY OF ANTWERP – RUCA. Department of Logistics Middelheimlaan 1 2020 Antwerpen (Belgium) Prof. Dr. Gerrit Janssens tel: +32 3 218 06 82 fax: +32 3 218 07 13 Email : [email protected]
UNIVERSIDADE NOVA LISBOA Faculdade de Ciências e Technologia Depertamento de Informàtica Quinta de Torra, 2825 Monte de Caparica (Portugal) Prof. Dr. Ana MOREIRA Prof. Dr. Rita RIBEIRO Prof. Dr. Pedro Guerreiro Eng. Geiza d’Oliveira tel: +351 1 294.85.36 fax: +351 1 294.85.41 Emails [email protected] [email protected] [email protected] [email protected]
UNIVERSITY OF PIRAEUS Department of Maritime Studies 40, Karaoli & Dimitriou street 185 32 Piraeus (Greece)
AND MAPPING BV. Schiedamsedijk 44 3011 ED Rotterdam (The Netherlands)

Contract nr. ST-96-SC.1018 Final Report November 1999 Database Manual
University of Antwerp - RUCA
Universidade Nova de Lisboa
University of Piraeus
6
Dr. Orestis SCHINAS tel: +30 1 418 0751 (ext. 159) fax: +30 1 412 580 E-mail [email protected]
Mr. Raoul Coenegracht Tel: +31 10 433 3440 Fax: +31 10 414 0660 Email: [email protected]
Project Supervision
European Commission Directorate General for Transport Rue de Mot 28 1049 Brussels (Belgium) Patrick Mercier-Handisyde Contract person European Commission on EMOLITE Tel: +32 2 296 83 29 Fax: +32 2 295 43 49 Email: [email protected]

Contract nr. ST-96-SC.1018 Final Report November 1999 Database Manual
University of Antwerp - RUCA
Universidade Nova de Lisboa
University of Piraeus
7
2 Executive Summary
2.1 context
The continuously expanding number of privately owned vehicles and the ever
increasing demand for (long distance) road haulage is leading to congestion of the
European road network. Circumventing this congestion-problem by expansion of the
road infrastructure is no longer possible in most cases. Moreover, road haulage is
increasingly met with social disapproval because of the burden it puts on the
environment (external costs).
The development of intermodal terminals at strategic locations on the Trans
European Transportation Network is therefore important. However, the identification
and evaluation of these potential locations should not be based solely upon
transport-economic criteria at the level of the corporation (e.g., transportation costs
and - distances). The use of an alternative approach should be considered which
takes into account general and terminal-specific decision parameters, as well as
public and private selection criteria.
In that context, the European Commission has, within the context of the 4th
Framework R&D programme, awarded a contract (Contract nr. ST-96-SC.1018) to a
research team, consisting of:
• = University of Antwerp – RUCA (B)
• = Centre for Intermodal Research – CIR (B)
• = Universidade Nova de Lisboa (PE)
• = Technical University of Athens (G)
• = AND mapping (NL)
to develop a decision support model for the for the “Evaluation Model for the Optimal
Location for Intermodal Terminals in Europe” (EMOLITE).

Contract nr. ST-96-SC.1018 Final Report November 1999 Database Manual
University of Antwerp - RUCA
Universidade Nova de Lisboa
University of Piraeus
8
2.2 EMOLITE framework
The objective of the project was to develop a decision support system that allows an
integrated evaluation of potential terminal locations according to general and
terminal-specific criteria, while simultaneously taking into account the dynamic and
continuously changing transportation market. EMOLITE should provide
comprehensive strategic information on the quality of potential locations for
intermodal terminals.
EMOLITE is developed for non computer-experts, using computer-assisted data
input, processing wizards and other applications that facilitate its use. EMOLITE
therewith lowers the threshold to use computer modelling in the strategic decision-
making process. The program therefore contains a multiplicity of data from different
fields of interest. The information provides insights into the economic, social and
infrastructure image of a country and is necessary at the level of strategic decisions.
The main sequence of tasks necessary to obtain the information is the following:
The main features of the EMOLITE prototype are:
1. It ranks the alternative destination terminals according to attribute values and criteria (cost, flexibility and reliability).
2. It is a flexible system for handling terminal attributes, such as modifications and new insertions.
3. It contains a sophisticated, but simple, algorithm for solving the rating and ranking of terminals, using a fuzzy multiple attribute model.
4. The fuzzy multiple attribute model includes fuzzy attributes and fuzzy importance/weights and applies a weighted average aggregation procedure.
5. The construction of the fuzzy attribute membership functions is fully transparent to the user because the values to build them are automatically
Select
destination
Country
User Select
ConditionsSelect Weigts
Rank
Terminals
Contract nr. ST-96-SC.1018 Final Report November 1999 Database Manual
University of Antwerp - RUCA
Universidade Nova de Lisboa
University of Piraeus
9
extracted from the database. This feature implies that with the increase of cases (terminals) in the database the attributes will better represent them.
6. EMOLITE is interactive and user-friendly in all dialogues with the user. It therefore contains two levels for weighting to allow the user to go more into detail only when wanted.
7. It incorporates a simulation facility, where the user can compare what are the results are of changes in his/her weights in the ranking of terminals.
2.3 Components Description
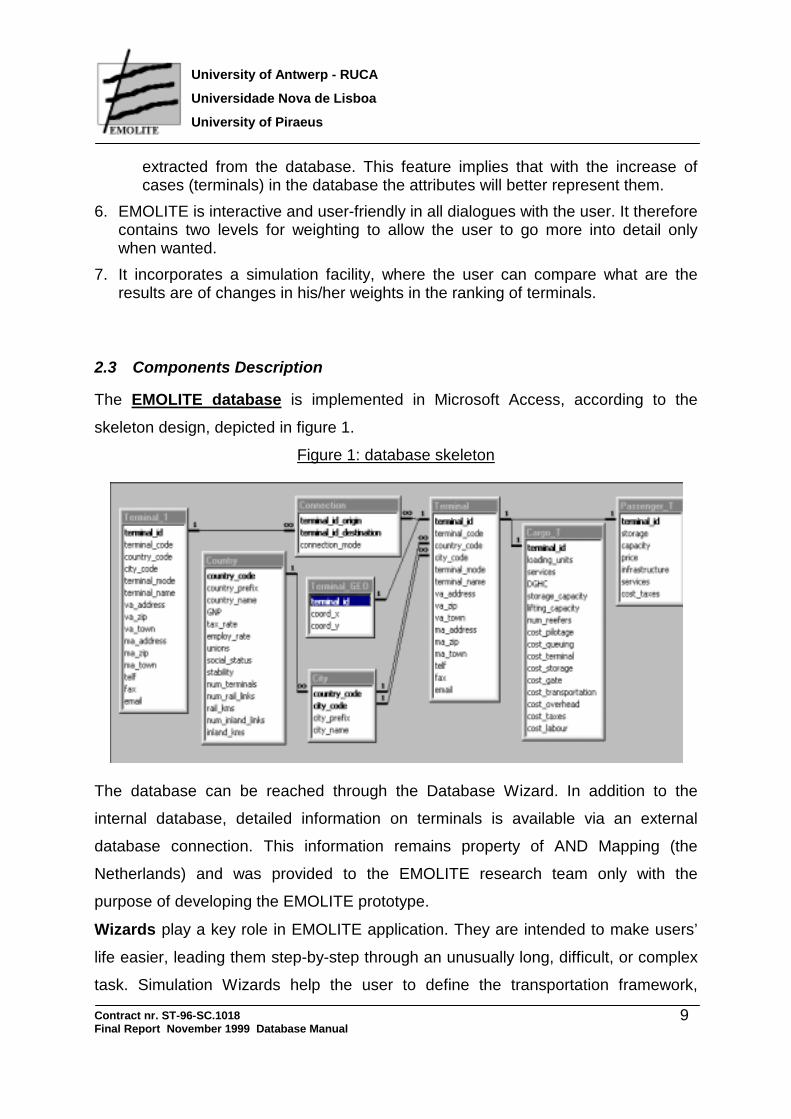
The EMOLITE database is implemented in Microsoft Access, according to the
skeleton design, depicted in figure 1.
Figure 1: database skeleton
The database can be reached through the Database Wizard. In addition to the
internal database, detailed information on terminals is available via an external
database connection. This information remains property of AND Mapping (the
Netherlands) and was provided to the EMOLITE research team only with the
purpose of developing the EMOLITE prototype.
Wizards play a key role in EMOLITE application. They are intended to make users’
life easier, leading them step-by-step through an unusually long, difficult, or complex
task. Simulation Wizards help the user to define the transportation framework,

Contract nr. ST-96-SC.1018 Final Report November 1999 Database Manual
University of Antwerp - RUCA
Universidade Nova de Lisboa
University of Piraeus
10
conditions and criteria/weights for a simulation session. The wizards are MDI
(Multiple Document Interface) applications, where the main window provides a
workspace for all the child windows in the application.
The EMOLITE simulation module is divided into classes, attributes and objects.
The user weights each class and attribute by order of importance. The classes are:
• = Cost
• = Flexibility
• = Reliability Cost includes attributes such as overheads, pilotage, queuing time, terminal cost,
storage, gate cost, taxes, labour cost, GNP and transportation. Flexibility consists of
attributes like storage, cranes, fridge, connections, TEN accessibility and
infrastructure. Reliability contains among others following attributes: unions, social
status and stability.
The user will be able to display multiple documents at the same time, each displayed
in its own window. In the case of EMOLITE, Project Specific information, charts,
maps and reports are different types of documents. A crucial step is the definition of
criteria / weights, see figure 2
Figure 2: setting criteria / weights

Contract nr. ST-96-SC.1018 Final Report November 1999 Database Manual
University of Antwerp - RUCA
Universidade Nova de Lisboa
University of Piraeus
11
The weights for each class and for every attribute are identical and are determined by the user. The weight scale in EMOLITE is,
• = Irrelevant • = Low importance • = Important • = Very important • = Extremely important
EMOLITE uses an innovative approach in criteria setting because the user can
choose which constraints will be considered by (un)checking them.
The program allows the user to choose the presentation from of the results: Full
Report, Summary Report, Graph, Map.
If all the criteria are introduced, the simulation can run and the results calculated.
Running the simulation starts a calculation process for ranking terminals taking into
account the conditions and criteria defined for the project under evaluation. A
progress bar is shown during the calculation; once finished, the corresponding output
windows (Summary Report, Full Report, Graph, Map) are updated to reflect the new
results. The final results are presented to the user in different formats. An example of
the graphics output is visualized in figure 3.
Figure 3: Graphical presentation of results

Contract nr. ST-96-SC.1018 Final Report November 1999 Database Manual
University of Antwerp - RUCA
Universidade Nova de Lisboa
University of Piraeus
12
The results obtained from the simulation can be saved and re-used in future
simulations.
2.4 Conclusions
The implementation of the EMOLITE prototype has been an interesting and
rewarding experience in several ways. Undoubtedly, improvements can be made,
e.g., in the user interface by including some additional functionality, in the database
structure to accommodate more consistent data handling or in the fuzzy model by
creating more fine-tuned algorithms in order to deal with more realistic / complex
scenarios.
However, EMOLITE was a Prototype and should be considered only as a relevant
step in the development of a system close to managers’ real needs. The future
“EMOLITE 2000 system” must be Web-based, for obvious reasons. The deployment
of a Web-based architecture would result in much less maintenance effort and
certainly in much easier and widespread utilisation, since users could access it
simply as “another” Web page.
The EMOLITE prototype therefore has more value as a prototype rather than being
already a practical computer model for strategic decision making.
However, the basic approach of EMOLITE already offers an interesting innovative
feature, namely the users interface. Using the Wizards available in Windows and
applying fuzzy logic to interact with the user can be considered an important step in
closing the gap between high level managers and (logistics) computer models. The
difficulties of entering data and conditions before running the simulations has been
reduced to an easy “guided” methodology that enables non-experienced users to
apply the method for their calculations.

Contract nr. ST-96-SC.1018 Final Report November 1999 Database Manual
University of Antwerp - RUCA
Universidade Nova de Lisboa
University of Piraeus
13
3 Objectives of the EMOLITE project
The goal of the EMOLITE project is to provide a valuable and reliable tool to the
decision maker, either public or private, to help him or her decide and consider the
advantages and disadvantages of potential locations to develop an intermodal
terminal.
To reach a sustainable decision, decision makers have to be adequately informed
about the economical status of the country (and even better of the specific regions),
the transport infrastructure and the transport flows, which means consequently that
he or her needs an ever-increasing amount of information in order to draw up,
assess and evaluate projects.
It is important to stress that EMOLITE has not only to face as a probable user transport experts or researchers, but also managers and decision makers in the private sector. Consequently, EMOLITE collected as many data as possible
from various fields of interest and incorporates several presentation methods. All
these data may not be useful to a particular user of a transport problem, but most of
the data are very useful regarding the investment in a specific region. All these data
constitute the economic, social and infrastructure image of a country.
Most of the decision support systems related to transportation are a direct or indirect
application of operational research techniques. Many hidden assumptions and
simplifications result to output, which may be the optimal solution from a
mathematics point of view but in many cases not useful from the point of view of the
investor. This is why EMOLITE uses the fuzzy logic technology to develop the
prototype and paid particular attention to the user interface. Wizards are intended to
make users’ life easier, leading them step-by-step through an unusually long,
difficult, or complex task. In EMOLITE, wizards are mainly used for creating and
modifying simulation scenarios, accessing databases and getting help.

Contract nr. ST-96-SC.1018 Final Report November 1999 Database Manual
University of Antwerp - RUCA
Universidade Nova de Lisboa
University of Piraeus
14
The goal of the prototype is to select a number of terminals in a given country (and
optionally in a given city) which meets a defined number of quality conditions.
For the development of the EMOLITE-prototype, following assumptions have been
made:
�� The prototype will not deal with distances between terminals;
�� The origin terminal is not relevant, only the destination terminal, its conditions and
the connections it has with other terminals is considered;
�� Intermediate terminals will also not be integrated; only the set of destination
terminals will be taken into consideration;
�� The model is developed both for goods. However, the prototype was developed
in such a manner that it can easily be adapted for passenger terminal analysis..
�� The multiple terminal choice models will be formalised and conceptualised, but
not implemented in the prototype due to its complexity (it could be considered in a
future project).

Contract nr. ST-96-SC.1018 Final Report November 1999 Database Manual
University of Antwerp - RUCA
Universidade Nova de Lisboa
University of Piraeus
15
4 Means to achieve the objectives
The concept of EMOLITE is innovative given that it is designed for practical use at
the managerial level. Although it is only a prototype, some practical application is
possible. However, further development is required, in particular to integrate the
application into new technologies such as the Internet.
To reach the objectives described in chapter 3, three elements were particularly
important, namely
• = the structure of the consortium and the exchange of information between the
research partners;
• = the hardware and software used for the development of EMOLITE;
• = the dissemination.
The structure of the consortium took into consideration that there were two important
issues in the project, which were the technical development and the strategic
considerations. Therefore, a structure was designed were all tasks (both technical
and strategic) were concentrated in one location. The writing of reports was also
centralised in that location. In addition, the technical partners (Universidade Nova de
Lisboa and the University of Antwerp – Department of Computer Science) were
collaborating in the technical development and submitted a single technical report.
The approach is visualised in next figure.

Contract nr. ST-96-SC.1018 Final Report November 1999 Database Manual
University of Antwerp - RUCA
Universidade Nova de Lisboa
University of Piraeus
16
Operational structure
The use of hardware and software was an important element for the programme. In
many cases, decision support systems are complex and written in propriety software
or in complicated software packages. Given that simplicity was one of the important
conditions for EMOLITE, the use of complicated software (and hardware) was not
possible and “standard” software and hardware had to be selected.
After careful analysis, the EMOLITE partners decided for following software and
hardware requirements:
- PC with Pentium processor. - Microsoft Windows 95 or Microsoft Windows NT Workstation operating
system version 4.0 or later. - 16 MB of RAM (32/64 MB recommended). - Microsoft Visual Basic/Visual C++ language and tools to implement the
interfaces. - DAO/ODBC to access databases from both languages.
PROJECT CO-ORDINATION (Administration) University of Antwerp-RUCA, Department of Transport
PROJECT CO-ORDINATION (Research and reporting)University of Antwerp – Centre for Intermodal Research
University of Antwerp –RUCA
Department of Operations Research
Universidade Nova de Lisboa
Departamento de Informática
University of Piraeus Transport Department
Technical reporting
Practical Co-ordination
Software development
Administrative reporting

Contract nr. ST-96-SC.1018 Final Report November 1999 Database Manual
University of Antwerp - RUCA
Universidade Nova de Lisboa
University of Piraeus
17
Finally, the success of EMOLITE will depend upon the efficient dissemination of the
results. For that reason, the consortium partners decided that the prototype should
be free of copyright to enable other persons / institutes / companies to use the
EMOLITE results and extend / expand / improve the prototype.
In addition to academic papers that will be written by the university professors in the
team, the dissemination will be focussing on the Internet. A resumé of the project
results will be made available on the CORDIS website. In addition, more detailed
information and a copy of the prototype will be made available trough the
STRATECO website (www.strateco.org), in which the Centre for Intermodal
Research is a founding partner.

Contract nr. ST-96-SC.1018 Final Report November 1999 Database Manual
University of Antwerp - RUCA
Universidade Nova de Lisboa
University of Piraeus
18
5 Scientific and technical description of EMOLITE
5.1 Introduction
This research project was made possible under the Strategic Sector of the Transport Research Programme of the 4th Framework Programme, Task 1.3/22:
Spatial Coordination for Intermodality and Modal Split.
The objective of the project was to develop an “Evaluation Model for the Optimal
Location for Intermodal Terminals in Europe” (EMOLITE).
EMOLITE allows an integrated evaluation of potential terminal locations according to
general and terminal-specific criteria. EMOLITE provides comprehensive strategic
information on the quality of potential locations for intermodal freight terminals.
The development of EMOLITE is a joint effort of the University of Antwerp - RUCA
(Belgium), Department of Transport Economics and Department of Operations
Research, the University of Piraeus (Greece) , Department of Transport and the
Universidade Nova de Lisboa (Portugal) , Departamento de Informática. The group
was later in the project expanded with AND Mapping (the Netherlands).
The co-ordinates of the partners are given in Chapter 2.

Contract nr. ST-96-SC.1018 Final Report November 1999 Database Manual
University of Antwerp - RUCA
Universidade Nova de Lisboa
University of Piraeus
19
5.2 Context
The current European transport environment faces a number of important problems,
which urgently require a solution. The continuously expanding number of privately
owned vehicles and the ever increasing demand for (long distance) road haulage is
leading to congestion of the European road network. Circumventing this congestion-
problem by expansion of the road infrastructure is no longer possible in most cases.
Moreover, road haulage is increasingly met with social disapproval because of the
burden it puts on the environment (exhaust gases, negative effects on the
environment, etc… ).
Freight transport services have evolved substantially in the last decade and
encountered an increased demand for speed, reliability, optimum transportation
costs and value added logistics. New developments in the field of telecommunication
and technology (telematics) have contributed substantially to increase both speed
and efficiency of transportation and made a tight control of commodity flows
possible. The increased use of modern logistical concepts for the development of
local, national, regional and Europe-wide distribution and transhipment centres for
European and non-European freight are particularly important because patters are
being laid down for the future which, once determined, will be difficult to change.
At present, distribution and transhipment locations designed for road or road/rail
modes alone may be chosen unless the validity of the intermodal alternative as part
of the offer can be demonstrated. Therefore, in order to fully develop modern
European intermodal transportation networks the necessary supply and demand
requirements of the distribution and transhipment centres need to be accurately
determined. Supply-driven terminal requirements are controllable by the service
provider while terminal operators cannot influence demand-driven terminal
requirements.

Contract nr. ST-96-SC.1018 Final Report November 1999 Database Manual
University of Antwerp - RUCA
Universidade Nova de Lisboa
University of Piraeus
20
An integrated approach to the combination of supply and demand requirements
enables to circumvent one of the major shortcomings of most intermodal research.
Indeed, it is not sufficient to only address terminal-based requirements without
reference to increasingly complex user requirements. Such approach would generate
an optimised supply but would remain alienated from the true user needs.
However, concentrating exclusively on user requirements without taking into account
specific supply-side availability, will inevitably lead to an unsustainable ad
unattractive intemodal offer at the level of the transhipment area. It is only by means
of simultaneously integrating into the analysis the demand and supply side
conditions, that locations for the development of sustainable intermodal transhipment
areas can be identified. Since terminals feature in a dynamic and complex
transportation environment, the interrelations with this environment also need to be
carefully considered. Therefore, the effect of changes in this external environment
and their impact on customer needs (e.g. the need for value added logistics) and
supply-side characteristics (e.g. changing terminal activity costs) need to be
incorporated into the analysis.
5.3 Project description
5.3.1 Introduction
The goal of the Emolite prototype is to find a number of terminals in a given country
(and optionally in a given city) which satisfy certain restrictions and criteria. In order
to accomplish this, the following assumptions are made:
(i) distances between terminals are not handled;
(ii) the origin terminal is not important, it is only important the destination terminal, its conditions and the connections it has with other terminals;
(iii) intermediate terminals are not handled, since here we only consider the set of destination terminals;
(iv) multiple terminal choice models will be formalized, but not implemented in the prototype.

Contract nr. ST-96-SC.1018 Final Report November 1999 Database Manual
University of Antwerp - RUCA
Universidade Nova de Lisboa
University of Piraeus
21
The main sequence of tasks necessary to obtain the destination terminals is the following (see figure 4):
Figure 4: Sequence of tasks
5.4 Development of the prototype
5.4.1 First prototype
The goal of the EMOLITE BETA Version was to select a number of terminals in a
given country (and optionally in a given city) which meets a defined number of
qualitative conditions. For the development of the first EMOLITE-prototype, following
assumptions have been made:
�� The prototype will not deal with distances between terminals;
�� The origin terminal is not relevant, only the destination terminal, its conditions and
the connections it has with other terminals is considered;
�� Intermediate terminals will also not be integrated; only the set of destination
terminals will be taken into consideration;
�� The model is developed both for passengers and goods, although the
concentration is on cargo transport, given that the case study will deal with cargo
transport and not with passenger transport.
�� The multiple terminal choice models will be formalised and conceptualised, but
not implemented in the prototype due to its complexity (it could be considered in a
future project).
Contract nr. ST-96-SC.1018 Final Report November 1999 Database Manual
University of Antwerp - RUCA
Universidade Nova de Lisboa
University of Piraeus
22
The main features of the first EMOLITE prototype are:
8. It ranks the alternative destination terminals according to attribute values and criteria importance (cost, flexibility and reliability).
9. It is flexible system for handling terminal attributes, such as modifications and new insertions.
10. It contains a sophisticated, but simple, algorithm for solving the rating and ranking of terminals, using a fuzzy multiple attribute model.
11. The fuzzy multiple attribute model includes fuzzy attributes and fuzzy importance/weights and uses a weighted average aggregation procedure.
12. The construction of the fuzzy attribute membership functions is fully transparent to the user because the values to build them are automatically extracted from the database. This feature implies that with the increase of cases (terminals) in the database the attributes will better represent them.
13. EMOLITE is interactive and user-friendly in all dialogues with the user. It therefore contains two levels for weighting to allow the user to go into detail only when wanted.
14. it incorporates a simulation facility, where the user can compare what are the results of changes in his/her weights in the ranking of terminals.
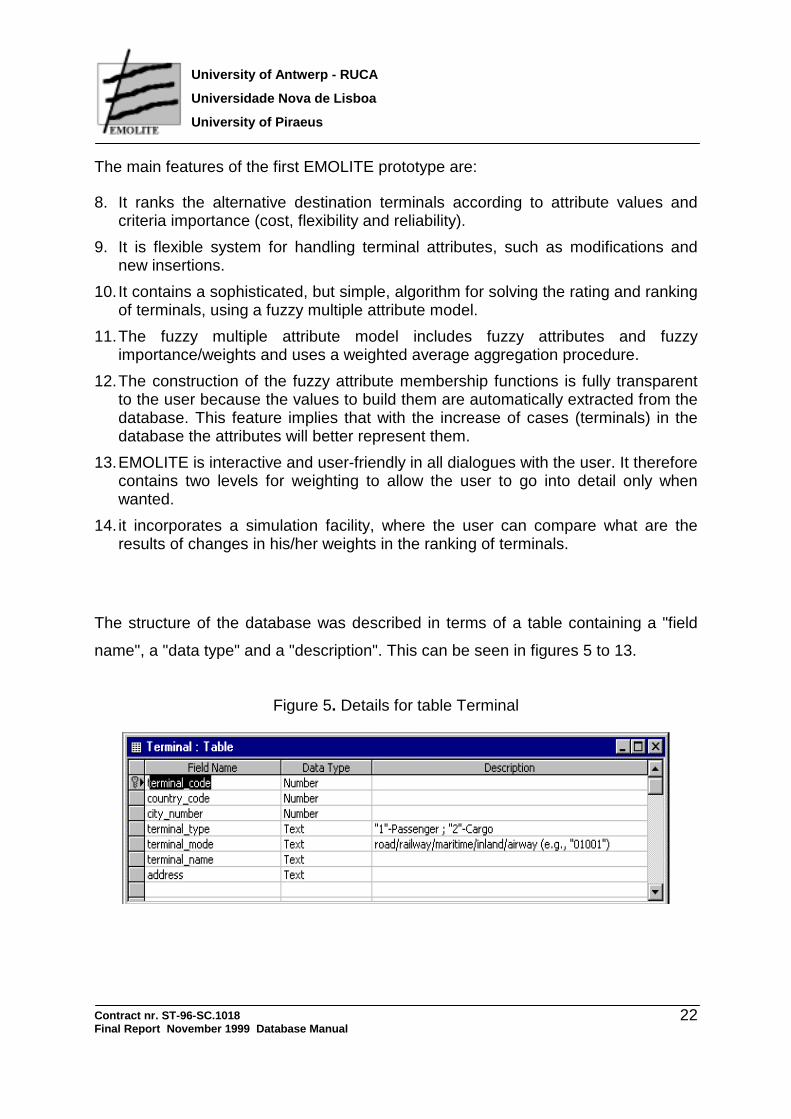
The structure of the database was described in terms of a table containing a "field
name", a "data type" and a "description". This can be seen in figures 5 to 13.
Figure 5. Details for table Terminal

Contract nr. ST-96-SC.1018 Final Report November 1999 Database Manual
University of Antwerp - RUCA
Universidade Nova de Lisboa
University of Piraeus
23
Figure 6. Details for table Passenger_T
Figure 7. Details for Cargo_T table
Figure 8. Details for Cranes table

Contract nr. ST-96-SC.1018 Final Report November 1999 Database Manual
University of Antwerp - RUCA
Universidade Nova de Lisboa
University of Piraeus
24
Figure 9. Details for table Fridge
Figure 10. Details for table Terminal_GEO table
Figure 11. Details for table City table
Figure 12. Details for table Connection table

Contract nr. ST-96-SC.1018 Final Report November 1999 Database Manual
University of Antwerp - RUCA
Universidade Nova de Lisboa
University of Piraeus
25
Figure 13. Details for table Country table
For the first prototype, all “general information” was introduced in the EMOLITE
BETA Version. Detailed information was collected and introduced in the general
database. Information on the terminal specific database was depending upon the
results of the AND Mapping co-operation and would be introduced in the final version
of the EMOLITE prototype,
The algorithms and the simulation module were developed on the basis of the
general database. depending again upon the information received from AND
Mapping, adjustments would be made to finalise an operational prototype.
5.4.2 Final prototype
The following changes were made to the first prototype of the EMOLITE database
and simulator:
1. Match AND Mapping fields with our EMOLITE attributes. 2. Feed the database with AND Mapping values. 3. Change some interface windows in order to make different groupings of
information. 4. Guarantee correctness for CARGO; we only have information for this type of
terminal. 5. Fuzzify in all cases. For example, all binary arrays must be fuzzified. All
counting fields must be modified. 6. Add graphical views of the results obtained during the simulation.

Contract nr. ST-96-SC.1018 Final Report November 1999 Database Manual
University of Antwerp - RUCA
Universidade Nova de Lisboa
University of Piraeus
26
7. Define a log file, so that the user can see and validate the values that are calculated.
8. Build a help on-line that can be used as a tutorial to help inexperienced users to get acquainted with the prototype.
9. Rearrange the main window so that, from there, we can access to a multi-criteria selection process.
All the above points were covered by the second version of the EMOLITE prototype.
As the research team could only have access to information on cargo terminals, the
passenger terminals were left unchanged. That is, the corresponding tables and
fields still exist in the database, but the simulator ignores them in the second version.
However, activating the passenger terminal evaluation model can be done without
major difficulties and mainly depends upon the availability of relevant information.
The final prototype operates as demonstrated hereafter.
If cargo terminal is chosen from the window:
This is the second step of the PSI Wizard. The screen shown allows the user to
specify the transportation framework, that is, to define the general characteristics of

Contract nr. ST-96-SC.1018 Final Report November 1999 Database Manual
University of Antwerp - RUCA
Universidade Nova de Lisboa
University of Piraeus
27
the location(s) he/she is looking for. This step corresponds to the "Select destination
country". The user must pick a country from the "Country" list box, where the
countries available are the ones stored in the database. Optionally, the user may
pick a city, which belongs to the selected country. The user must select at least one
modality for the requested terminals. If the user selects more than one modality, the
terminals extracted from the database will have at least one of the modalities
selected.
Click Back to go to back and review/change the settings or click Next to proceed.
When proceeding, the following window appears:
This is the third step of the PSI Wizard. The screen shown allows the user to specify
the conditions applicable to each type of terminal. In other words, the user is able to
narrow the set of terminals, evaluated for the intended purpose, through some
conditional parameters. This step corresponds to the "Select conditions”.
The user may select one or more types of loading units as well as services for the
requested terminals. If the user selects more than one option, the terminals extracted

Contract nr. ST-96-SC.1018 Final Report November 1999 Database Manual
University of Antwerp - RUCA
Universidade Nova de Lisboa
University of Piraeus
28
from the database will have all the capabilities selected.
Click Back to go to back and review/change the settings or click Next to proceed.
If we proceed, the conditions screen emerges:
This is the fourth step of the PSI Wizard. The screen shown allows the user to
specify additional conditions applicable to each type of terminal. This step still
corresponds to the "Select conditions".
The user may enter minimum values for terminals' capacities as well as maximum
admitted costs for various items. If the user enters more than one value, the
terminals extracted from the database will obey to all the restrictions specified.
Click Back to go to back and review/change the settings or click Next to proceed.
When Next is clicked, the fifth step is:

Contract nr. ST-96-SC.1018 Final Report November 1999 Database Manual
University of Antwerp - RUCA
Universidade Nova de Lisboa
University of Piraeus
29
The screen shown corresponds to the main interface for the specification of criteria
and weights that will apply to the terminals extracted from the database according to
the conditions defined in the previous steps. This step corresponds to the "Select
weights" task depicted in the Introduction.
The user may choose which constraints will be considered by (un)checking them.
Besides, for each constraint checked it is mandatory to assign at least one weight to
its elementary criteria as it is depicted in the detailed cost criteria screen, detailed
flexibility criteria screen and detailed reliability criteria screen (see further). The
weights assigned at this (high) level will affect the criteria as a whole as explained in
the context of the simulation model section.
Click Back to go to back and review/change the settings or click Next to proceed.
If all the detailed criteria are ok, then we can run the simulation. The final window
allows us to choose the presentation of the results: Full Report, Summary Report,
Graph, Map.

Contract nr. ST-96-SC.1018 Final Report November 1999 Database Manual
University of Antwerp - RUCA
Universidade Nova de Lisboa
University of Piraeus
30
A summary report has the form:

Contract nr. ST-96-SC.1018 Final Report November 1999 Database Manual
University of Antwerp - RUCA
Universidade Nova de Lisboa
University of Piraeus
31
The screen shown is an MDI child, which displays the results from the Simulation in
a tabular way. This window is shown and updated every time a simulation runs.
Graphs can also be used to better appreciate the results of the simulation. The
screen shown is an MDI child, which displays the results from the simulation in terms
of a graph. This window is shown and/or updated every time a simulation is run. For
legibility reasons, only ten terminals are presented at the same time.
The following picture shows the global and flexibility criteria compared for the first ten
terminals ranked:
It is possible to double-click on every terminal presented to open the window showing
its data, an example of such detailed information is demonstrated in next picture:

Contract nr. ST-96-SC.1018 Final Report November 1999 Database Manual
University of Antwerp - RUCA
Universidade Nova de Lisboa
University of Piraeus
32
The results obtained from the simulation can then be saved and used in the future.
5.5 The EMOLITE database
The EMOLITE program is based on two types of databases, an external and an
internal one. EUROSTAT was chosen as main source for the internal database
because EUROSTAT ensures availability in all Member-States, and has a uniform
way of data-collection and data-presentation. The external database is based upon
the database of AND Mapping (the Netherlands).

Contract nr. ST-96-SC.1018 Final Report November 1999 Database Manual
University of Antwerp - RUCA
Universidade Nova de Lisboa
University of Piraeus
33
5.5.1 The general database structure
Although the capabilities of modelling problems by using fuzzy logic are interesting, it
is necessary to go back to the basics and use sound basic information. Therefore the
research team used data, cross-checked for their accuracy and their availability also
in the (near) future. Consequently, EUROSTAT was chosen as main source of data
because EUROSTAT ensures availability in all Member-States, and has a uniform
way of data-collection and data-presentation.
The EMOLITE program is based on two types of databases, an external and an
internal one. The databases are logically integrated in the system as shown in figure
14 below.
Figure 14: Database structure
USER
USER INTERACTIVE
MODULE
EXTERNAL DATABASES
module to connect to terminal database
module to connect to site
database
module to connect to
market database
module to connect to
GIS/GEODATA
CONTROLLING MODULE TO SPECIFY NECESSERY INFORMATION
GENERAL DATABASE
OF EMOLITE
STRUCTURAL DATABASE FOR
USER INPUT
The external database is linked to four main built-in query modules of relevant data.
The first module queries for a set of data referring to the terminal as such, the next
group to the site, the other to the market and the last one provides geographical
information. Thus the system extracts data of each sort in a robust and accurate way
Contract nr. ST-96-SC.1018 Final Report November 1999 Database Manual
University of Antwerp - RUCA
Universidade Nova de Lisboa
University of Piraeus
34
whenever necessary. The database includes extensive data and the links channel
the data into information for the internal needs of the system, i.e. of the algorithms.
The internal database is a more a general one, containing information related to the
country and to economy. It will be analysed thoroughly, as separate section.
It is important to appreciate in figure 1 the user requirements logical box. The
database should be considered as an encyclopaedia where data, facts and figures
are stored. The user needs some but not all information available. This makes a
selection procedure necessary.
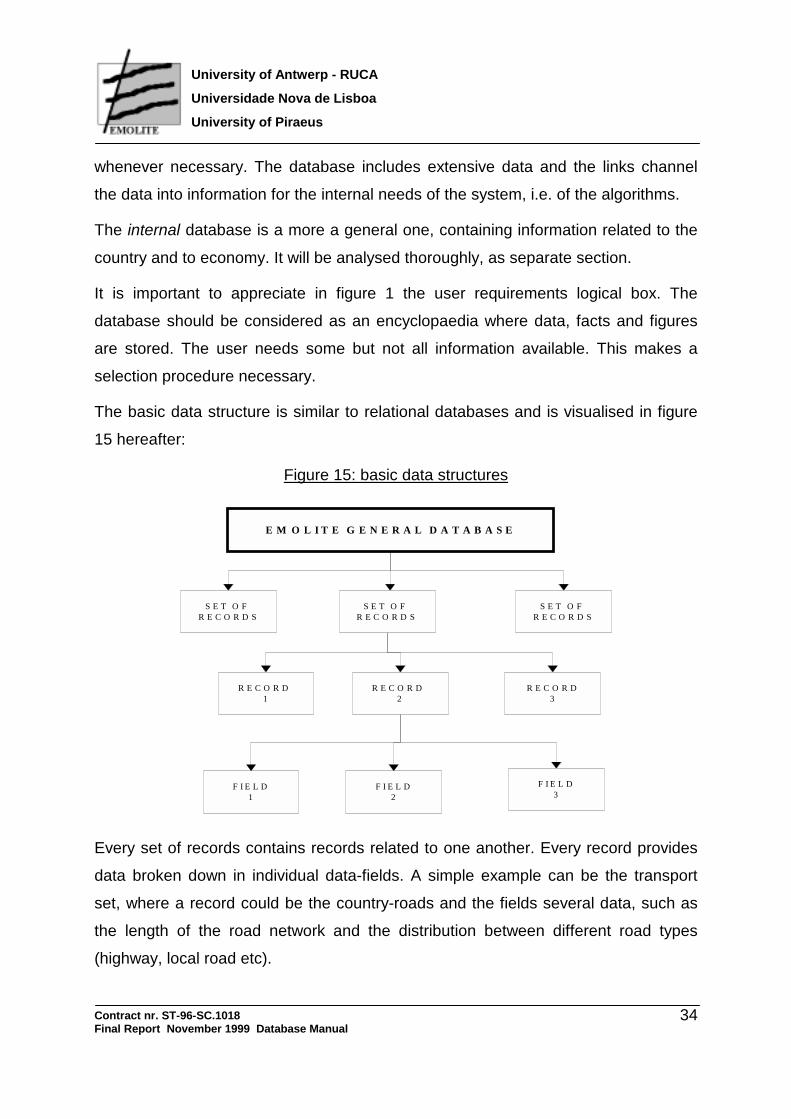
The basic data structure is similar to relational databases and is visualised in figure
15 hereafter:
Figure 15: basic data structures
E M O L I T E G E N E R A L D A T A B A S E
S E T O F R E C O R D S
S E T O F R E C O R D S
S E T O F R E C O R D S
R E C O R D 1
R E C O R D 2
R E C O R D 3
F I E L D 1
F I E L D 2
F I E L D 3
Every set of records contains records related to one another. Every record provides
data broken down in individual data-fields. A simple example can be the transport
set, where a record could be the country-roads and the fields several data, such as
the length of the road network and the distribution between different road types
(highway, local road etc).

Contract nr. ST-96-SC.1018 Final Report November 1999 Database Manual
University of Antwerp - RUCA
Universidade Nova de Lisboa
University of Piraeus
35
Many figures are already included in the tables. The user must however perform the
tedious task of updating these figures and complementing them.
5.5.2 The EMOLITE Internal database
The internal database contains six different groups of data, provided by EUROSTAT.
The different tables represent groups of related information referring to all Member-
States. The information can be broken down to macroeconomic and financial data,
labour data, transport infrastructure, social status and origin-destination (OD) tables.
All data are retrievable and can be integrated in any given application.
The macro-economic and financial data are providing an image of the fiscal status in
the country. Figures of GNP, GNP per capita offer a comparison measure between
different national economies. Along with the customer price index (CPI) and the
short-term interest rates, the user can build an idea on the difference of costs related
to the sites in one particular country compared to another country. In a simplified
evaluation procedure, where two sites very close to each other but belonging to
different countries are compared, such macro-data can act as first filter. Such
indicators can provide important information before complex financial evaluations are
conducted.
The EMOLITE database collects information from following available tables:
• = Gross National Product in Millions of EURO
• = Annual Growth
• = Gross National Product in Millions of Purchase Parity Units
• = Comparison of EURO and Purchase Parity Units
• = Gross National Product per Capita in Purchase Parity Units [1000 Units]
• = Consumer Price Index (base year 1985=100)
• = Consumer Price Index Increase rate within 12 months
• = Short term interest rates -Daily interest %

Contract nr. ST-96-SC.1018 Final Report November 1999 Database Manual
University of Antwerp - RUCA
Universidade Nova de Lisboa
University of Piraeus
36
The GNP measured in EURO or in “Purchase Parity Units” and their comparison
provides interesting information about the growth and the investment potential of a
country. The annual growth and the consumer price index along with the interest
rates provide the general outline of the economy. The annual growth percentage
indicates the growth or the expansion and the development of trade and commerce.
The CPI along with the interest rates indicates the inflation and the local market of
capital. Large-scale investment and transport infrastructure investments demand
capital from the international financial markets and institutions, yet it is necessary to
be aware, in almost all cases, of the local market as well.
A second set of interesting information is the information on labour and social
protection. This information forms a separate table and provides an overview on
employment conditions in the country. For the user of EMOLITE, these data reveal
interesting information because they do not only support the system with data, such
as unemployment rate but abet also figures about the percentage of labour missing
due to illnesses or partial employment.
This set of data has actually four main objectives:
• = to provide general employment information,
• = to assist the user estimate the earnings of employees,
• = to calculate the total working days per week,
• = to estimate the total irrevocable days per year due to strikes, etc.
In order to achieve this goal the system draws out data out of these tables:
• = Unemployment rates
• = Unemployment in 1,000s (Totals)
• = Net Earnings of employees (couple - no children) in the manufacturing industry
EURO
• = Net Earnings of employees (one salary - two children) in the manufacturing
industry

Contract nr. ST-96-SC.1018 Final Report November 1999 Database Manual
University of Antwerp - RUCA
Universidade Nova de Lisboa
University of Piraeus
37
• = Social Protection per capita in EURO (1985 = 100)
• = Social Protection per capita in Units
• = Working hours weekly, full time occupation
• = Percentage (%) of the labour force missing work due to illnesses
• = Percentage (%) of the labour force missing work due to partial unemployment
• = Lost working days due to strikes and disputes per 1,000 workers in the industry
(all sections)
• = Lost working days due to strikes and disputes per 1,000 workers in the
manufacturing industry
These data concerning human resources labour force and their “habits” try to answer
to questions such as the wages of the employment and labour force in the country
and what is the expected evolution / attitude?
Figures of unemployment and net earnings of two major categories of workers are
provided. In order to help the decision maker, the system must outline for him not
only the official data regarding the average worker in a country but also the expected
salary of a worker, the expected disputes and lost working days per year. The social
protection figures and the official unemployment rates conclude this part. All these
data may assist the user more by getting an idea about the actual status in human
resources and calculate the cost with more accurate data keeping always in mind the
necessary simplifications.
All this data are available from a single source, namely EUROSTAT.
The next group is the one containing information about the tax regime. The available
income is about the taxation of the income and assets as percentage (%) of the GNP
and the taxation of the production and the imports as percentage (%) of the GNP.
Both data-sets are macroeconomic measurements but they give quite a clear idea
about the tax regime.

Contract nr. ST-96-SC.1018 Final Report November 1999 Database Manual
University of Antwerp - RUCA
Universidade Nova de Lisboa
University of Piraeus
38
For simplicity and harmonisation reasons all monetary values are in EURO, as the
common currency, which is the basis of calculation now and will be the common and
dominating currency among Member States.
Collecting information regarding transport infrastructure and related information
becomes more complicated because no uniform method of data-collection is
existing. A breakdown per mode is available but the data provided by EUROSTAT
are outdated and could therefore only be used as “indicators”.
The EUROSTAT tables provide information regarding the infrastructure and in some
cases also the current supply of transportation means. The breakdown is according
to usual patterns.
Regarding the railways, breakdowns are available for tracks per narrow and normal
gauges, per double or single lines and per electrified line or non-electrified. Subtotals
and percentages provide informing on the current situation.
Unfortunately most of these data are of low value, since EUROSTAT does not
publish small changes per year, e.g., the upgrading to a highway. Therefore, it is
difficult to identify differences in the existing situation of the network.
In the EMOLITE database, several data groups have been collected covering both
the “qualitative and quantitative aspects” of infrastructure to overcome the above
described limitations.
More data is available for the road infrastructure, although these data can not be
integrated in a single table since every country has different criteria and
characteristics for road conditions. An additional problem is that the data are
referring to 1990 (latest information available). Although there is no significant
difference for developed countries such as Belgium, Germany or the Netherlands. In
less developed countries such as Greece, Spain or Portugal, these figures can be
misleading since many kilometres of highways have been constructed and national
roads are transformed to highways in recent years.

Contract nr. ST-96-SC.1018 Final Report November 1999 Database Manual
University of Antwerp - RUCA
Universidade Nova de Lisboa
University of Piraeus
39
Data on the number of vehicles can provide useful information about the expected
traffic but again, one should be careful because the figures are not reflecting the
most recent situation.
An important factor is the fuel retail prices, as almost over of the 50% percent of the
total road cost is the fuel cost. The user should update these tables as frequently as
possible with the latest information available.
However and in spite of all these restrictions, the data can provide basic information,
which demonstrate the quality of the EMOLITE model.
In the EMOLITE internal database, the road network is described with the following
tables of data:
• = Road Network
• = Road Vehicles
• = Stock of vehicles by category excluding motorcycles and caravans
• = First registration
• = Percentage of renewal
• = Fuel - Retail Prices per 100 lt. [EURO]
The rail network is described with a consolidated table including all information about
the gauges, number of tracks and electrification.
A very interesting group of data that has been integrated in the EMOLITE database
is the one referring to inland waterways. High quality information is available in the
EUROSTAT database, although it is not lately updated.
The following data are integrated in the EMOLITE database:
• = Inland waterways - Number of enterprises servicing per country
• = Inland Waterways
• = Length and traffic density of the most important Inland Waterways
• = Canals

Contract nr. ST-96-SC.1018 Final Report November 1999 Database Manual
University of Antwerp - RUCA
Universidade Nova de Lisboa
University of Piraeus
40
• = Rivers
• = Length of Navigable waterways by group
The tables providing information on seaport container terminals are outdated.
However, the EUROSTAT information can be improved using another relevant
source apart from EUROSTAT, which is the European Sea Ports Organisation
(ESPO). The user can get an access through the web site: www.espo.be. However,
accuracy remains questionable because most ports collect their own data and there
is fierce competition among them making these ports reluctant to provide
information. Nevertheless the structure of the available information allows the input
of information according to a normal breakdown, as usually provided to the public. In
many cases other information, such as the available infrastructure, superstructure
and transit movements, is of greater importance, but it is only available in specialised
publications. These publications can be found through ISL (www.isl.org) or via the
magazine Containerisation Today.
Though the interest of freight movement by air is rather restricted to specific cargoes,
it could be important to provide in EMOLITE the possibility of using the air facilities.
For parcel shipping and JIT logistics, airports and airways provide the only
alternative. Therefore, the option is included in the database but has not been
elaborated in the prototype. The data include specific breakdown for parcel
movements. Information on air traffic volumes in international airports is also
provided.
Finally there are figures about the number of transport enterprises per each country,
which could be an important starting point for marketing reasons and logistics chain
development.
This information is completed with the general data used for calculations, such as
the total surface and population of each country.

Contract nr. ST-96-SC.1018 Final Report November 1999 Database Manual
University of Antwerp - RUCA
Universidade Nova de Lisboa
University of Piraeus
41
Origin - Destination (O-D) tables were also foreseen in the EMOLITE database but
generated more complications. The collection of O-D data is even more difficult since
national borders disappeared in the EU. At present, there is almost no information
available in the national statistics offices. Some specialised companies are collecting
such data from trade unions, organisations and specialised agencies. However it
might be very interesting to have this data in form of transport flows per mode and
per SITC digit analysis among EU Member States. This feature is however not
available in the EMOLITE prototype but could be considered for a later version if one
is interesting in making detailed O-D surveys. Other flows, such as trade with third
countries, are available by the national statistical departments and in many cases in
electronic form. They could be used if the model is expanded with extra-European
trade relations.
Finally, the EMOLITE database contains “general” information on the Member-
States, which is stored in text format.
The text contains data on:
Geography Location Coastline Maritime claims International disputes Climate Terrain Natural resources Land use Irrigated land Environment Geographic notes People Population Age structure Population growth rate Birth rate Death rate Net migration rate Sex ratio Infant mortality rate
Life expectancy at birth Total fertility rate Nationality Ethnic divisions Religions Languages Literacy Government Name of the country Data code Type of government Capital city Administrative divisions Dependent areas Independence National Holiday Constitution Legal system Suffrage Executive branch Legislative branch
Judicial branch Political Parties and leaders Other political or pressure groups International organisations participation Economy An economic overview GDP GDP real growth rate GDP per capita GDP composition by sector Inflation rate (consumer prices) Labour force

Contract nr. ST-96-SC.1018
Final Report November 1999
University of Antwerp - RUCA
Universidade Nova de Lisboa
University of Piraeus
42
Unemployment rate Budget Industries Industrial Production growth rate Electricity Agriculture Illicit drugs Exports Imports External Debt
Economic Aid Currency Exchange rates Fiscal Year Transportation Railways Highways Waterways Pipelines Ports Merchant marine
Airports Heliports Communications Telephones Telephone system Radio Broadcast stations Radios Television broadcast stations Televisions Defence Branches Manpower availability Defence expenditures
All these data can be considered and calculated in the selection process for the
location(s) of intermodal terminals. Although some of these data seem to be rather
irrelevant, several could be interesting indicators regarding the level of development
of a country. For example, military activities in a country are indicative of the national
wealth spend on the armed forces and the purchase power of such public service.
The number of radios and TVs can be useful to users who needs direct information
about the market penetration ability in audio-video. Additionally other information
about the population and the government can affix to previous calculations or shape
a first idea about marketing groups or the political environment.
5.5.3 Information sources and how to update the data
The aim of the EMOLITE research team was not only to assemble relevant data in
the internal database but also to assure that the future user/developer of the
EMOLITE decision support system could easily update the necessary data from
several data sources.
Some 235 regions, comprising the entire territory of the European Union (EUR 15)
and EFTA countries, feature in the four volumes of Portrait of the regions. The
information includes maps and illustrations in colour, general and harmonised
statistical tables, commentaries and analyses on territory, environment,

Contract nr. ST-96-SC.1018
Final Report November 1999
University of Antwerp - RUCA
Universidade Nova de Lisboa
University of Piraeus
43
infrastructures, strengths and weaknesses of a region, changes in population,
employment and unemployment and structure of economy (principle sectors of
activity, salaries, list of companies or organisations employing the largest number of
people, etc.). This publication is classified as “General Statistics”.
The catalogue number is CA-74-91-00$-**-C, where $=1, 2, 3, 4 for each volume, i.e.
volume 3 has the catalogue number CA-74-91-003-**-C.
Because the usual procedure is that EUROSTAT publishes the data after the
collection and the checking operation by the National Statistic Offices. Consequently
it costs time to concentrate all data from all Member States, but this is for the real
benefit of the end-user. The EMOLITE team decided however to use the
EUROSTAT data as basis because the information is consistent for every Member.
The publications of EUROSTAT used as sources are:
EUROSTAT code
ISBN
6120/007 ISBN 92-827-8845-8 6120/8201 ISBN 92-825-9734-2 6120/8201 ISBN 92-827-8360-X 6120/40401 ISBN 92-827-6756-6 6120/7101
The first bulletin, 6120/007, is the Census Yearbook for 1996. “The people”, “the land
and environment”, “the national economy”, “trade and industry”, the European
Union”: these five key chapters contain the main statistical data from EU countries
from 1983 to 1993. This exhaustive statistical publication contains also detailed
comparisons with the EU’s main trade partners.
The user must be aware that, although this information is also offered in electronic
format and in all languages (catalogue number the CA-81-93-204-**-C) as a CD-
ROM it cannot be integrated to any system since it is a “read-only version”. The last
one, 6120/7101, is the EUROSTAT special edition on transport infrastructure, dated

Contract nr. ST-96-SC.1018
Final Report November 1999
University of Antwerp - RUCA
Universidade Nova de Lisboa
University of Piraeus
44
1990. As discussed previously, it might be useful as basic information but the figures
could be misleading.
Interesting information provided by EUROSTAT offices for free can be found in more
than one publication. This information includes:
• = Net earnings of employees in manufacturing industry in the EU, 1995 • = Statistics in focus: population and social conditions. EUROSTAT, labour force
survey, 1994 • = Social protection and receipts, 1980-1994 • = Statistics in focus: population and social conditions. Social Protection in the EU,
1995 • = National Accounts ESA: aggregates, 1970-94 • = General government accounts and statistics, 1970-93, 1993 • = General government accounts and statistics, 1970-93, 1995 • = Economy and finance, short term statistics, monthly publication • = Cost of living in the EU, 1995 • = Money and finance (quarterly) III.3
Important transport related information can be found in the following EUROSTAT
editions:
Title Catalogue Number EUROSTAT yearbook CA-81-93-204-**-C Portrait of the regions (4 volumes) CA-74-91-00$-**-C where $ = 1, 2, 3, 4 Regions, statistical Yearbook CA-91-95-924-4M-C Money and Finance CA-BQ-96-000-3A-C ESA 1995 CA-15-96-001-**-C National Accounts ESA – Aggregates 1970-1994
CA-94-96-154-3A-C
Labour Force Survey Results 1994 CA-92-95-877-**-C External trade, Statistical yearbook, 1994 CA-83-94-628-5E-C
All these editions are reference tools that are regularly updated. In addition to the
above reference tool interested persons could also examine the GISCO database.
The GISCO database contains geographical information on themes such as
administrative areas, infrastructures, hydrography, natural resources, industries, etc.
By combing GISCO with the REGIO database, statistical information can be mapped
at a regional level. REGIO is the first statistical, topographical software of the
European regions. The real value of such a combination is to be seen in the

Contract nr. ST-96-SC.1018
Final Report November 1999
University of Antwerp - RUCA
Universidade Nova de Lisboa
University of Piraeus
45
application of spatial analysis to areas like: the accessibility of European
infrastructure networks, the degree of urbanisation or even the structural funds.
Regarding O-D tables, EUROSTAT provides in CD format a breakdown of cargo-
flows per 8 digit SITC code for the intra- and extra EU trade. The data are analysed
per month. Unfortunately, no breakdown per transport mode is provided.
The CD can be bought by EUROSTAT. Its code number is ISSN 1017-6594.
All information, described and used in the EMOLITE internal database, can be
purchased as individual document or by annual subscription. Several publications
are available in libraries, National Statistic Offices and relevant institutions.
An overview of existing statistical publications is available on the web (URL address:
http://europa.eu.int/eurostat.html). The information can also be acquired in the
‘EUROSTAT Data Shops’:
Data Shop Brussels Rue Joseph II, 121 1049 Brussels tel.:+32-2-29-96666 fax:+32-2-29-50125 email: [email protected] Data Shop Luxembourg 2, rue Jean Engling 1466 Luxembourg tel.:+352-4335-2251 fax:+352-4335-22221 email: [email protected] Data Shop Paris - c/o INSEE INFO Service 195, rue de Bercy Tour Gamma A 75582 Paris Cedex 12 tel.:+33-1-53-17-89-32 or-45 fax:+33-1-53-17-88-22 Data Shop New York - c/o Haver Analytics 60 East 42nd Street - Suite 2424 New York, NY 10165, USA tel.:+1-212-986-93-00 fax:+1-212-986-58-57 email: [email protected]

Contract nr. ST-96-SC.1018
Final Report November 1999
University of Antwerp - RUCA
Universidade Nova de Lisboa
University of Piraeus
46
For the general data regarding all countries, which constitutes the last set of
information in the EMOLITE database, the “Almanac of 1996” is a very interesting
additional source. The EMOLITE research team also used it. This Almanac is on the
World Wide Web on the site of the Central Intelligence Agency (CIA) of the United
States Government. The database is updated frequently and is always accessible.
5.5.4 The external EMOLITE database
The external database used in EMOLITE is the Global transport database, an AND
proprietary database. This database can either be licensed individually or in
conjunction with the Global Geographic database. In the latter case the Unique
Connection Points (UCP’s) Terminals facilitates the connection.
The Global Transport database is continuously updated. New releases are made
available to our clients twice a year, namely in January and July.
This database contains all information required for the transportation of cargo by
standardised loading units like for instance containers. The database is divided into
Transport Networks and Services.
Transport Networks Contents Terminals 1,031 Ferry Connections 190,500 Railway Network 323,200 Inland Waterway Network 14,500 kmSea Network 85,500 kmIndustrial areas 5,800
Transport Services Number of Ferry Services 3,000 Rail Services 19,500 Inland Waterway 25,400 Sea Services 7,500

Contract nr. ST-96-SC.1018
Final Report November 1999
University of Antwerp - RUCA
Universidade Nova de Lisboa
University of Piraeus
47
Transport related Number of Organisations Europe 3,300
Transport Networks
All Transport networks are digital models of maps that can easily be linked together.
When the Road Network Database is incorporated, extra information about tonnage
restrictions for roads, toll roads, and border crossings open to freight transport will be
included as well.
Terminal Network
Terminals are the turntables between different networks, the place where goods are
transferred from one mode of transportation to another. The Terminal network
consist of two files: the first file contains name, location and type of the terminal and
the second file contains all specific characteristics of each terminal; like for example
accessibility, names of operators ad loading equipment.
Ferry Network
The Ferry Network holds all data on ferry connections plus ferry coding points, as
well as information like tonnage restrictions for freight transport. The ferry coding
points can be used to link ferry timetables to this network (see Transport Services).
Railway Network
The Railway Network consist of freight and passenger lines and links to terminals
with a rail connection. Passenger lines are also included as they are increasingly
being used for freight.
Inland Waterway Network
The Inland waterway network contains river and canal waterways accessible to ships
of over 50 meters in length and the links to terminals with a river or canal connection.
Sea Network

Contract nr. ST-96-SC.1018
Final Report November 1999
University of Antwerp - RUCA
Universidade Nova de Lisboa
University of Piraeus
48
The European sea network contains transport routes between ports and the links to
terminals with a sea connection. The sea networks of the Atlantic, India and Pacific
Ocean are not linked yet to terminals on the surrounding continents.
Industrial Areas
The network of Industrial Areas contains information used by companies for
industrial or other non – agricultural purposes.
Further details are described in Annex 1 of this final report. However, this information
is confidential, given the commercial sensitiveness of the information.
5.6 Technical description of EMOLITE
5.6.1 Technical requirements
EMOLITE 2.0 is a prototype of a system, that is user friendly and not difficult to
install. Also, since there was a limited budget available for the EMOLITE project,
hardware and software choices reflect both large availability and low cost:
- PC with Pentium processor. - Microsoft Windows 95 or Microsoft Windows NT Workstation operating
system version 4.0 or later. - 16 MB of RAM (32/64 MB recommended). - Microsoft Visual Basic/Visual C++ language and tools to implement the
interfaces. - DAO/ODBC to access databases from both languages.
The selected hardware and software is sufficient because the goal of the EMOLITE
project was only to produce a prototype version of the model. In order to produce a
complete and complex system, software and hardware choices will have to be more
demanding, at least in what concerns the database management system.

Contract nr. ST-96-SC.1018
Final Report November 1999
University of Antwerp - RUCA
Universidade Nova de Lisboa
University of Piraeus
49
5.6.2 The EMOLITE framework
The EMOLITE framework can be seen from two different perspectives: data and
simulation.
5.6.3 Data handling
An abstract and implementation free data model is shown in figure 16.
Figure 16. Data model
Countrybelongs
has
Terminal Connectionconnect
City
serve
Passenger_T Cargo_T
N
N 1
1
N
M
N
M
5.6.4 Simulation process for selection of destination terminals
The model for the developed prototype assumes that the user is located at an origin
and that he wants to select a destination terminal to send his products. The

Contract nr. ST-96-SC.1018
Final Report November 1999
University of Antwerp - RUCA
Universidade Nova de Lisboa
University of Piraeus
50
destination teminals are N, but all in one destination country. Figure 17 depicts this
aspect.
Figure 17: Origin-destination decision model
In order to select which of the destination terminals is the one that best satisfies the
user conditions and criteria a simulation model was developed. This model is
implemented in the prototype and includes two main phases:
Phase 1- Pre- Selection of possible destination terminals using the basic
requirements (conditions) specified by the user.
Phase 2- Selection of the best terminal using a fuzzy rating and ranking of the
possible terminals to provide the best choices to the user.
Phase 1
In this phase the user must select the basic requirements his/her destination
terminals should have. These requirements are divided in two sections
(corresponding to two windows in the prototype).
First, the user has to click on which of the following items the destination terminals
should handle to transport the products:
• = Type of cargo «solid bulk, general cargo, containers, liquid bulk commodities, cement»,
• = Specials «piggyback, swap body, double stack»,
• = Services « water, fueling, maintenance, repair»
Second, the user should introduce the values for the following conditions:
Country-origin
Destination
Country:

Contract nr. ST-96-SC.1018
Final Report November 1999
University of Antwerp - RUCA
Universidade Nova de Lisboa
University of Piraeus
51
• = Capacity « minimal storage, minimal crane, Fridge»
• = Price «overhead, pilotage, queing time, terminal cost, storage, gate cost» After, the prototype performs the selection of the destination terminals that fulfill the
specified requirements (conditions). The result is a set of POSSIBLE destination
terminals.
Phase 2
In this phase a rating and ranking process are performed to obtain a final
classification for each of the possible terminals (previously selected in phase 1). This
selection process includes the following elements: (1) an aggregation algorithm for
rating the terminals; (2) a raking process for the selection of terminals (from best
terminal to worst from the set of possible ones), (3) Importance/weights for the three
evaluation criteria (cost, flexibility, reliability) and for their respective attributes; (4)
Fuzzy attributes;
The structure of the fuzzy multiple attribute decision model, implemented in the
prototype is shown in Figure 2. This figure depicts the three main classes of
attributes (costs, flexibiltity, reliability) and their respective attributes. The figure also
shows the weights that will be assigned to the classes and attributes (Weight_X,
W_Y), as well as the membership values for each attribute (M_Y).
The inputs required from the user for the whole process are just the importances
(weights) that they assign to each class and to each attribute(Weight_X, W_Y). To
introduce this weights the prototype provides user-friendly windows with bars wre the
user moves the bar to the desired importance level. The importances range go from
extremely unimportant to extremely important (more details about the importances
will be provided later). The fuzzy membership values (M_Y) are obtained
automatically from the database using the fuzzy membership function for the
respective attribute. The latter functions are embeded in the prototype and its
construction process will be addressed later.

Contract nr. ST-96-SC.1018
Final Report November 1999
University of Antwerp - RUCA
Universidade Nova de Lisboa
University of Piraeus
52
After obtaining the weights the rating and ranking process are performed by the
prototype to obtain the final classification as follows:
(1) Rating
The rating process for any terminal A is obtained by a weighted sum formula. Using
the labels depicted in figure 18 generates:
Rating (A) =
Weight_C* (M_ov*W_ov+ M_pi*W_pi + M_qt*W_qt + M_tc*W_qt + M_tc*W_tc +
M_tr*W_tr + M_gc*W_gc + M_tx* W_tx + M_lb* W_lb + M_st* W_st) +
Weight_F* (M_cr*W_cr + M_str* W_str + M_fr*W_fr + M_co*W_co + M_ten* W_ten
+ M_inf* W_inf) +
Weight_R* (M_un*W_un + M_soc* W_soc + M_sta*W_sta).

Contract nr. ST-96-SC.1018
Final Report November 1999
University of Antwerp - RUCA
Universidade Nova de Lisboa
University of Piraeus
53
Figure 18: Multiple attribute decision mode
W _ o v
O v e r h e a d W _ o v
P i lo t a g e W _ p i
Q u e in g T im e W _ q t
T e r m in a l C o s t W _ tc
W e ig h t_ C
C o s t s T r a n s p o r t . W _ T r
G a t e c o s t W _ g c
T a x e s W _ tx
L a b o u r W _ lb
S to r a g e W _ s t
C r a n e s W _ c r
S to r a g e W _ s tr
W e ig h t_ F F r id g e W _ f r
F le x ib i l i t y
C o n n e c t io n s W _ c o
T E N a c c e s s . W _ te n
In f r a s t r u tu r e W _ in f
W e ig h t_ R U n io n s W _ u n
R e l ia b i l i t y
S o c ia l s ta t u s W _ s o c
S ta b i l i t y W _ s ta
M _ o v
M _ p i
M _ tc
M _ q t
M _ tr
M _ g c
M _ tx
M _ lb
M _ s t
M _ c r
M _ s t r
M _ f r
M _ c o
M _ te n
M _ in f
M _ u n
M _ s o c
M _ s ta
Formally the aggregation formulas are:
Where Cj is a criterion (Cost, Flexibility or Reliability), SCi are the sub-criteria (fuzzy
attribute value) of each criteria, Wi is the importance of that sub-criteria, Wj is the
importance of criteria Cj and Termk is the terminal being evaluated.
jj
jK
ii
ij
CWTermRating
SCWCRating
×=
×=
)(
)(

Contract nr. ST-96-SC.1018
Final Report November 1999
University of Antwerp - RUCA
Universidade Nova de Lisboa
University of Piraeus
54
(2) Ranking
After obtaining the rating for each possible destination terminal the ranking process
begins. The ranking is done by using an “ideal” terminal concept, i.e. the rating is
matched with a fixed ideal terminal to obtain a classification. An ideal terminal is one
with membership value of 1 for all attributes, where 1 corresponds to the highest
(smallest) membership value for the attribute data range. In addition, the summary
report (output of the prototype) also shows the fuzzy rating as well as the rating with
the ideal.
The value obtained in the rating of terminal is than matched against the “ideal” value
to obtain a measure of how far away from the ideal that choice is. The “ideal” is
calculated with the above formulas using for all attributes a membership value (µ) of
1 (best possible). This is an original measure, proposed in this project, which
accounts for the importances given by the user to each sub-criteria and criteria, to
obtain a final ideal value for the terminal being evaluated. Hence, the final ranking
value, per terminal, is obtained as follows:
As can be observed, the operators for aggregation used in the EMOLITE prototype
are the algebric product and algebric sum and they belong to the set of t-nomrs and
t-conorms. These type of operators satisfy the axioms of boundary, associativity,
monotone non-decreasing and comutativity (similarity). Many other operators from
the classes of t-norms and even compensatory operators could have been used, but
for reasons of simplicity the prototype only used the simple algebric product and
sum.
The final ordering of the terminals, which corresponds to the Ranking phase of the
FMA approach is the descending order of the values obtained in the FuzzyRating. I.
e. the best terminal is the one with the highest value, the second best is the one with
the second highest value and so forth.
IdealRatinggFuzzyRakin AA ÷= )Terminal()Terminal(

Contract nr. ST-96-SC.1018
Final Report November 1999
University of Antwerp - RUCA
Universidade Nova de Lisboa
University of Piraeus
55
As mentioned, the prototype shows, in the summary report, the FuzzyRaking value
and the Rating(A) to provide the total value obtained and its relation with an “ideal”
value. The classification are presented in a decreasing order of classification, i.e.
from the best classification to the worst.
With the results obtained with the prototype the user has a rating and ranking of all
possible terminals (the ones selected with the Conditions module) and if he is not
satisfied he can always change some of the weights to perform a “what-if” analysis
(simulation capability).
(3) Importance/weights
The importance/weights for the three criteria (cost, reliability and flexibility) and its
respective sub-criteria (see respective menus) is defined as a discrete fuzzy set with
the following labels and respective membership values:
[irrelevant: 1, low: 3; important: 5, very important: 7, extremely important: 10]
The prototype presents the user a scale-bar with the above labels where each tick
corresponds to the above membership values. The user introduces his/her
importance/weights for the three upper level criteria (Costs, Flexibility, Reliability)
and, when desired, for each of the detailed sub-criteria. By default the value is
irrelevant.
(4) Fuzzy Attributes
There are two types of representation for the fuzzy attributes: discrete or continuous.
The attributes of the EMOLITE are depicted in the second level of Figure 2. These
fuzzy attributes are embeded in the software and the user does not need to provide
any information for its construction, once they are build automatically. Hence, the
construction process for the continuous attributes was the following:
1. First the Minimum and the Maximum of each attribute is extracted from the
database of terminals.
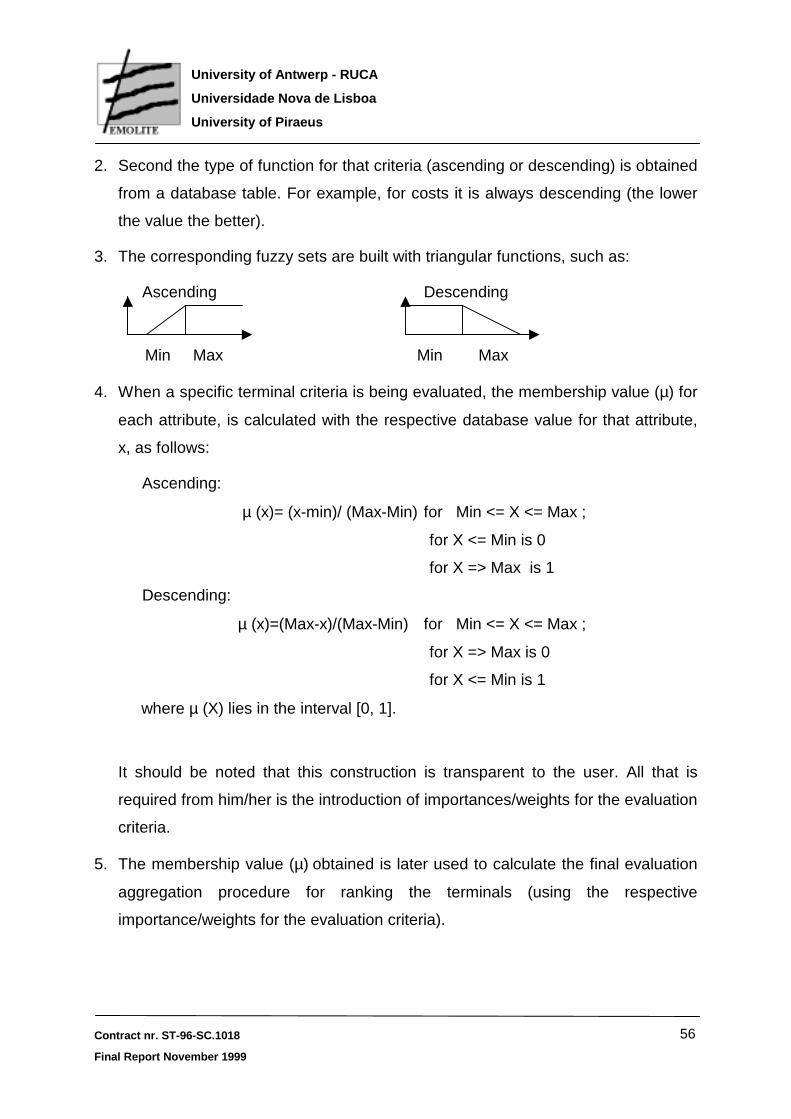
Contract nr. ST-96-SC.1018
Final Report November 1999
University of Antwerp - RUCA
Universidade Nova de Lisboa
University of Piraeus
56
2. Second the type of function for that criteria (ascending or descending) is obtained
from a database table. For example, for costs it is always descending (the lower
the value the better).
3. The corresponding fuzzy sets are built with triangular functions, such as:
Ascending Descending
Min Max Min Max
4. When a specific terminal criteria is being evaluated, the membership value (µ) for
each attribute, is calculated with the respective database value for that attribute,
x, as follows:
Ascending:
µ (x)= (x-min)/ (Max-Min) for Min <= X <= Max ;
for X <= Min is 0
for X => Max is 1
Descending:
µ (x)=(Max-x)/(Max-Min) for Min <= X <= Max ;
for X => Max is 0
for X <= Min is 1
where µ (X) lies in the interval [0, 1].
It should be noted that this construction is transparent to the user. All that is
required from him/her is the introduction of importances/weights for the evaluation
criteria.
5. The membership value (µ)=obtained is later used to calculate the final evaluation
aggregation procedure for ranking the terminals (using the respective
importance/weights for the evaluation criteria).

Contract nr. ST-96-SC.1018
Final Report November 1999
University of Antwerp - RUCA
Universidade Nova de Lisboa
University of Piraeus
57
5.7 The user interface to increase user accessibility
When the application starts, a logo screen is shown:
Start EMOLITE...
This button allows going to the main EMOLITE window, by giving the user the
possibility of creating or opening a Project Specific Information.
Start Excel Model...
This button opens an Excel model, from where we can access to a multicriteria
selection process.
Exit
This button exits the application.
After closing the logo screen, a dialog box pops up, allowing the user to choose
between loading a project file saved previously or creating a new one from the
scratch.
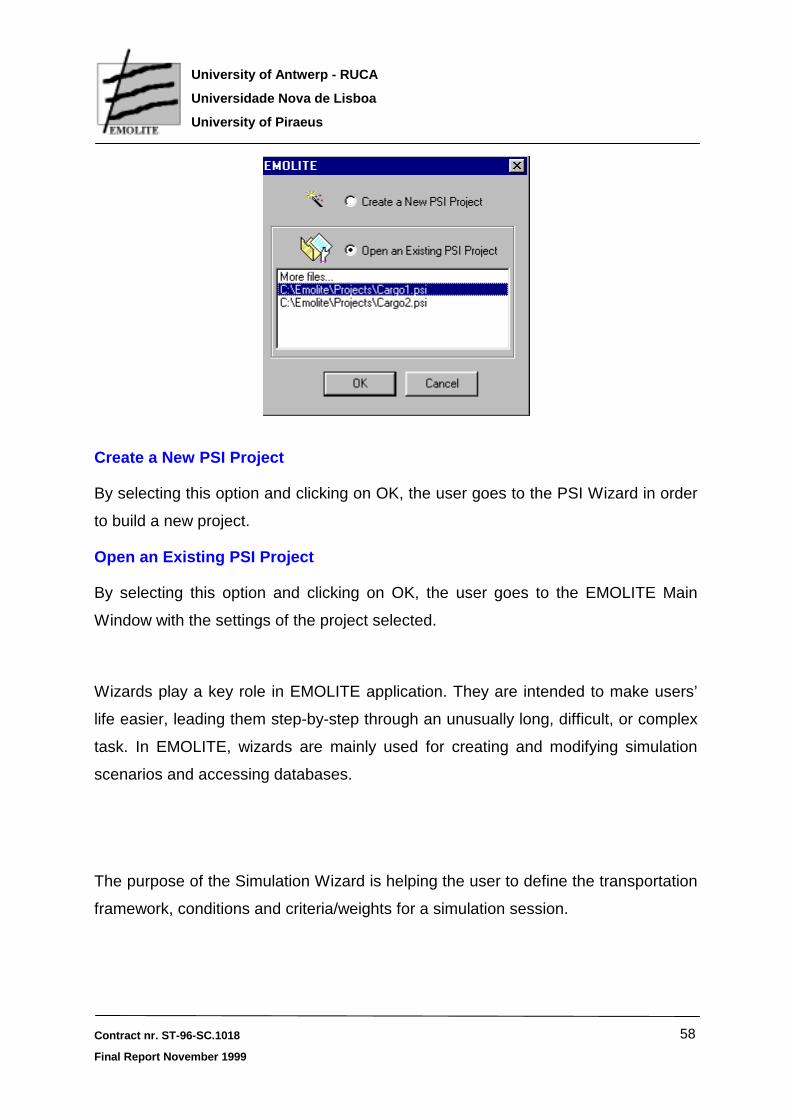
Contract nr. ST-96-SC.1018
Final Report November 1999
University of Antwerp - RUCA
Universidade Nova de Lisboa
University of Piraeus
58
Create a New PSI Project
By selecting this option and clicking on OK, the user goes to the PSI Wizard in order
to build a new project.
Open an Existing PSI Project
By selecting this option and clicking on OK, the user goes to the EMOLITE Main
Window with the settings of the project selected.
Wizards play a key role in EMOLITE application. They are intended to make users’
life easier, leading them step-by-step through an unusually long, difficult, or complex
task. In EMOLITE, wizards are mainly used for creating and modifying simulation
scenarios and accessing databases.
The purpose of the Simulation Wizard is helping the user to define the transportation
framework, conditions and criteria/weights for a simulation session.

Contract nr. ST-96-SC.1018
Final Report November 1999
University of Antwerp - RUCA
Universidade Nova de Lisboa
University of Piraeus
59
This is an MDI (Multiple Document Interface) application, that is, the main window
will provide a workspace for all the child windows in the application.
The user will be able to display multiple documents at the same time, with each
document displayed in its own window. In the case of EMOLITE, Project Specific
Info, charts, maps and reports are different types of documents.

Contract nr. ST-96-SC.1018
Final Report November 1999
University of Antwerp - RUCA
Universidade Nova de Lisboa
University of Piraeus
60
The Project Specific Info window contains the parameters defined for the project
currently in use.
The menus will provide the usual commands for managing PSI files, customizing
windows, displaying documents, getting help, starting wizards and running
simulations.
File Menu New Open... Close Save Save As ... Properties... Print Preview Print...

Contract nr. ST-96-SC.1018
Final Report November 1999
University of Antwerp - RUCA
Universidade Nova de Lisboa
University of Piraeus
61
Exit Edit Menu Cut Copy Paste View Menu Toolbar Status Bar Log Simulation Menu PSI Wizard DB Wizard Fuzzy Set Range Run... Window Menu Cascade Tile Horizontal Tile Vertical Arrange Icons Help Menu Contents Search About Emolite... All the underlined entries have graphical interfaces defined.
There is also a Toolbar - from which the user can issue some commands in a quicker
way – and a Status bar – where relevant messages are displayed showing the status
of the application when certain operations are being performed.
The Log window is provided as a debug tool, that is, it displays the contents of the
EMOLITE log file. This is useful in some situations, where something goes wrong or
tracing an operation in a detailed way is important.

Contract nr. ST-96-SC.1018
Final Report November 1999
University of Antwerp - RUCA
Universidade Nova de Lisboa
University of Piraeus
62
Another important window is provided as an auxiliary way to view the current range
for the various criteria parameters used by the simulation algorithm.

Contract nr. ST-96-SC.1018
Final Report November 1999
University of Antwerp - RUCA
Universidade Nova de Lisboa
University of Piraeus
63
The Criteria field shows the name of the criteria.
The Delta field shows a plus sign if "Min" is the lower limit and a minus sign
otherwise.
The Min and Max fields show the range values.
To run the simulation we need to choose Run... from the menu. This step
corresponds to the "Rank terminals" after the simulation.
To run the simulation, the user has three alternatives:
- by clicking the option Run... from the Simulation menu in the main window
- by clicking the appropriate button at the Toolbar in the main window
- by clicking Yes in the Confirmation box shown after leaving the PSI Wizard

Contract nr. ST-96-SC.1018
Final Report November 1999
University of Antwerp - RUCA
Universidade Nova de Lisboa
University of Piraeus
64
Running the simulation starts a calculation process - that takes into account the
conditions and criteria defined for the current project - for ranking terminals.
A progress bar is shown during the calculation; once finished, the corresponding
output windows (Summary Report, Full Report, Graph, Map) are updated to reflect
the new results.
5.8 Setting weights and criteria
Setting the weights and criteria can be done at the general level and at the detailed
level (see figure 18)
Figure 18. Definition of general criteria
Next step in preparing the simulation is defining the criteria. Here, the window
represented in figure 18 is used. The main criteria that are used to evaluate the
quality of the terminal are: cost, flexibility and reliability. Each of these can be given a
total value, for example a total cost. In case more specifications are required by the
user, the button Detail is pressed and specifications for each element which
compose the three main values can be entered. Figures 19, 20 and 21 demonstrate
the composition of each of the three criteria.

Contract nr. ST-96-SC.1018
Final Report November 1999
University of Antwerp - RUCA
Universidade Nova de Lisboa
University of Piraeus
65
Figure 19. Definition of detailed cost criteria
Figure 20. Definition of detailed flexibility criteria
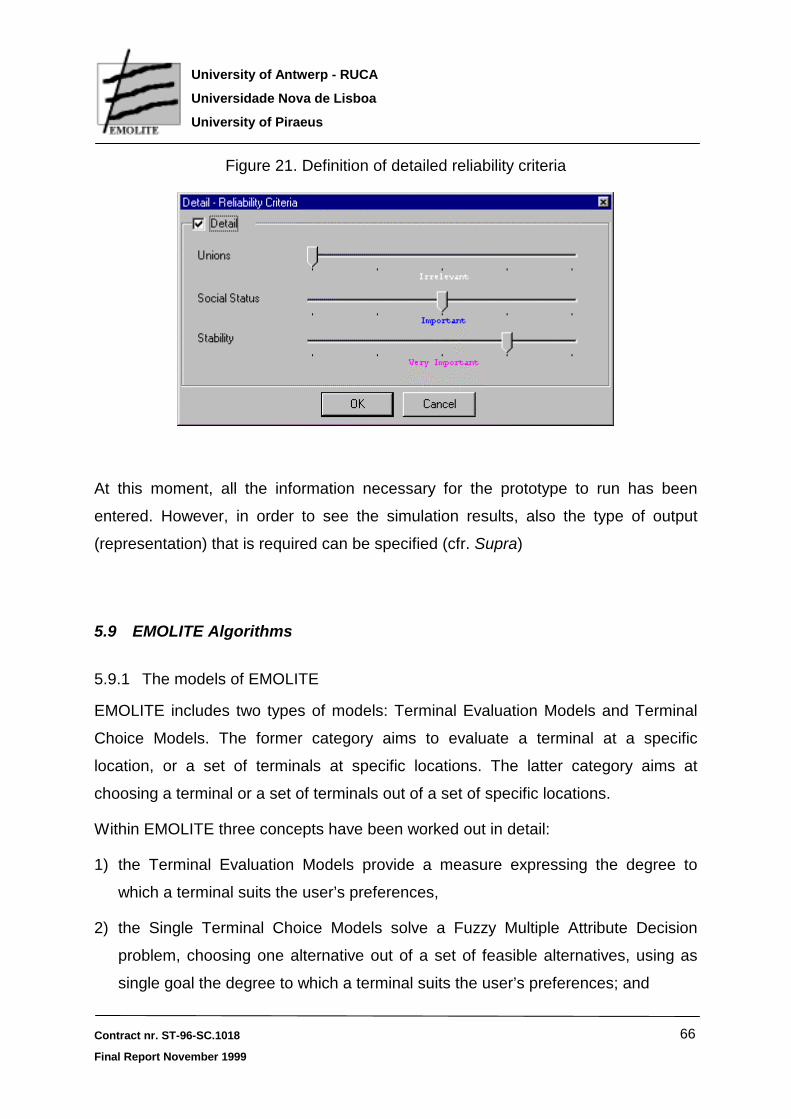
Contract nr. ST-96-SC.1018
Final Report November 1999
University of Antwerp - RUCA
Universidade Nova de Lisboa
University of Piraeus
66
Figure 21. Definition of detailed reliability criteria
At this moment, all the information necessary for the prototype to run has been
entered. However, in order to see the simulation results, also the type of output
(representation) that is required can be specified (cfr. Supra)
5.9 EMOLITE Algorithms
5.9.1 The models of EMOLITE
EMOLITE includes two types of models: Terminal Evaluation Models and Terminal
Choice Models. The former category aims to evaluate a terminal at a specific
location, or a set of terminals at specific locations. The latter category aims at
choosing a terminal or a set of terminals out of a set of specific locations.
Within EMOLITE three concepts have been worked out in detail:
1) the Terminal Evaluation Models provide a measure expressing the degree to
which a terminal suits the user’s preferences,
2) the Single Terminal Choice Models solve a Fuzzy Multiple Attribute Decision
problem, choosing one alternative out of a set of feasible alternatives, using as
single goal the degree to which a terminal suits the user’s preferences; and

Contract nr. ST-96-SC.1018
Final Report November 1999
University of Antwerp - RUCA
Universidade Nova de Lisboa
University of Piraeus
67
3) the Multiple Terminal Choice Models solve an optimisation problem, choosing a
free or predetermined number of alternatives out of a set of feasible alternatives.
It can be seen that the three models make up a hierarchy. The third model calls the
second model multiple times to be solved, while the second model uses as basis for
its choice the evaluation method developed in the first model.
Before elaborating more on the three models, the terminology is presented, which is
taken from Starr and Zeleny (1977) and proposed in the review article by Ribeiro
(1996):
1) Alternatives. A set of objects, products, actions, items of choice or strategies . For instance, a list of cars considered for purchase or a list of sites for a new building, or, in our case, a terminal at a specific location.
2) Attributes. Each alternative is defined by a set of characteristics. These may represent physical characteristics such as weight or colour, or, in our case, labour cost, pilotage cost, accessibility to TEN, country stability.
3) Objectives. A collection of attributes selected by the decision-maker to be used as a goal. For example, buying a car (objective) includes attributes such as price, maximum velocity and comfort, price, in our case, the evaluation is done on aggregated attributes as cost, flexibility and reliability.
4) Preferences/weights. The relative importance of each attribute across all attributes or, the relative importance of the instances of an attribute. In our case, the decision-maker can give more or less importance to either cost, or flexibility, or reliability.
Many times it is difficult to obtain precise concepts for features, attributes, criteria,
such as how to define comfort as an attribute for buying a car, or how to measure
accessibility to Trans European Networks. Several types of uncertainty can arise and
many methods and theories have been proposed to solve this problem in the realm
of decision making. However, the most important theories addressing uncertainty in
decision making are probability and fuzzy set theories.

Contract nr. ST-96-SC.1018
Final Report November 1999
University of Antwerp - RUCA
Universidade Nova de Lisboa
University of Piraeus
68
In a fuzzy environment attributes, weights and objectives can all be fuzzy sets.
Further, the attributes may be fuzzy linguistic variables as, for example, the ‘social
status’ attribute can have three fuzzy subsets ‘low’, ‘moderate’ and ‘high’.
The Single - or Multiple Terminal Choice problem is very similar to a classical
problem in Operations Research, called the Warehouse Location problem. The
Warehouse Location aims to locate one or more warehouses at a number of distinct
pre-specified locations in such a way that a cost function is minimised. In the
following paragraphs we will briefly discuss the Warehouse Location Problem in
terms of its opportunities and limitations for our problem. An extensive review of the
scientific literature on location including more than 1500 titles can be found in
Domschke ad Drexl (1985).
5.9.2 The Objective Function
The main objective used in OR models for location is distribution cost. In its most
simplistic version it even reduces to a weighted sum of distances, assuming a linear
transport cost structure. If only one warehouse has to be located, the omission of the
fixed operating cost of the warehouse assumes that this cost is equal in all locations.
This is a situation that is, in Europe, certainly not correct. More sophisticated models
include multiple costs and other terms can be added as long as they are expressible
in monetary units. In such a way models are obtained which minimise either total
facility cost, or total transport cost, total fixed and operating cost, or total user cost.
As a result the vast majority of the models available examine and optimise on one
single objective, be its cost minimisation or profit maximisation.
In our case, cost is an important issue but certainly not the only one. Two other
aggregate objectives are high flexibility and high reliability. Also, a number of
researchers have recognised that the problem of locating facilities has a number of
different facets - for example cost, customer service, risk and environmental impact.
These facets are not necessarily measurable in comparable ways, e.g. money, and
the optimum result for each factor is unlikely to be achievable simultaneously in the

Contract nr. ST-96-SC.1018
Final Report November 1999
University of Antwerp - RUCA
Universidade Nova de Lisboa
University of Piraeus
69
same site. Min and Schilling (1990) give an analysis of several papers examining
multiple objectives.
Location models can be distinguished not only by the type of objective function but
also by the attitude taken towards the choice of location. The approach may be
either ‘continuous’ or ‘discrete’. The continuous models basically assume that the
facility may be located anywhere, whereas in discrete models, a list of pre-selected
sites is required from which to choose the best subset to use. In our case, we
certainly deal with the discrete case as we make a choice of already existing
terminals. Even if we put ourselves in the position of thinking about building a new
terminal, only a limited number of locations have to be taken into consideration.
Algorithms for optimising discrete models frequently use mathematical programming
[e.g. in Khumawala (1972) and in Erlenkotter (1978)]. EMOLITE, however, cannot
use mathematical programming because its objective function cannot be expressed
in a single term, e.g., costs. The simplest of all continuous models, namely the
centre-of-gravity model, is still advocated by some authors, although the model has
serious modelling restrictions, - for example, the method locates only one facility, and
ignores any interaction with other facilities.
5.9.3 The Optimising Process
The objective function of EMOLITE aims to maximise the degree of satisfaction with
a (set of) terminals given by the user, where this degree is represented by the degree
of membership to a fuzzy set. This means that in fact, a single objective function
exists, but this function itself is consists of many factors.
The Single Terminal Choice Problem can be solved in a straightforward way. Out of
the potential sites residing in the databases those sites are selected which are
feasible according to the user’s requirements and constraints. At first it is assumed
that the constraints are crisp. This means that upper or lower bounds put by the user
on some characteristics cannot be violated. However, it could be that the user puts

Contract nr. ST-96-SC.1018
Final Report November 1999
University of Antwerp - RUCA
Universidade Nova de Lisboa
University of Piraeus
70
forward such a set of constraints that no feasible solution exists in the database.
Therefore, fuzzy constraints can be included in the DSS, meaning that the
constraints can sometimes be violated to a certain degree. In this way, a terminal is
no longer either ‘feasible’ or ‘not feasible’, but has a degree of feasibility.
Assuming that out of one hundred potential locations in the database, ten feasible
locations (or in the fuzzy case with a high enough degree of feasibility) are selected.
Ranking the ten alternatives according to the fuzzy objective function and choosing
the site with the highest ranking solves the Single Terminal Choice Problem. This
procedure is similar to the earlier mentioned Multi Attribute Decision Making (MADM)
procedures.
Multiple attribute decision making (MADM) deals with the problem of choosing an
alternative from a set of alternatives which are characterised in terms of their
attributes. Usually MADM consists of a single goal, but this may be of two different
types. The first is where the goal is to select an alternative from a set of scored ones
based on the values and importance of the attributes of each alternative. The second
type of goal is to classify alternatives, using a kind of role model or similar cases.
MADM is a qualitative approach due to the existence of criteria subjectivity. Both type
of goals require information about the preferences among the instances of an
attribute and the preferences across the existing attributes [MacCrimmon, 1973]. The
assessment of these preferences is provided either directly by the decision-maker or
based on past choices. Further, the decision-maker might express or define a
ranking for the criteria as importance/weights. There are many forms for expressing
the importance. The most common are: (a) utility preference function; (b) the
analytical hierarchy process and (c) a fuzzy version of the classical linear weighted
average. In addition, even for a fuzzy decision, the criteria could be fuzzy or
crisp.The aim of the MADM is to obtain the best alternative, that is the one with the
highest degree of satisfaction for all the relevant attributes or goals. In order to obtain
the best alternative a ranking process is required. If the rating for each alternative is
crisp, there is no problem and the best alternative is the one with the highest support.

Contract nr. ST-96-SC.1018
Final Report November 1999
University of Antwerp - RUCA
Universidade Nova de Lisboa
University of Piraeus
71
When the rating is itself a fuzzy set, a more sophisticated ranking procedure is
required. Further discussion of potential ranking procedures can be found in Ribeiro
(1996).
5.9.4 The Multiple Terminal Choice Problem: a Heuristic Approach
The procedure that is proposed for the Single Terminal Choice Problem is inefficient
for the more complex problems. Theoretically, it should be possible to evaluate all
subsets out of the set of feasible sites, but this number grows in an exponential way
with the number of sites. It is known that if N sites are selected, the number of
subsets is equal to 2N. Assume, as above, that ten feasible sites are selected, 1024
evaluations have to be made before a ranking can be obtained.
For all problems - and terminal choice is no exception - there are two approaches to
optimisation: exact procedures and heuristic procedures. Exact solution procedures
are defined as those procedures that can be demonstrated as always giving the
optimal solution to a problem. Heuristics are essentially rules of thumb, which will
usually give a good if not optimal solution. However, counter examples to heuristic
procedures can be found; that is, a problem (in many cases a pathological one) for
which the method clearly gives a bad solution.
Obviously most people would prefer an optimal solution, which leads to the use of an
exact procedure. Unfortunately, the choice is not always so straightforward. Let us
consider the classical warehouse location problem, with total fixed and operational
cost as the objective function to be minimised. The principle technique for obtaining
an exact solution is a form of mathematical programming called mixed integer
programming. This method requires the costs to be linear, that is, that they increase
directly with the level of activity. So, this idea completely ignores the notion of
economies of scale. Often non-linearities occur, which can be accommodated in
some ways by using a piece-wise linear cost curve. But this makes the mathematical
programming formulation so complex that with current optimisation packages it is
virtually impossible to solve it optimally.

Contract nr. ST-96-SC.1018
Final Report November 1999
University of Antwerp - RUCA
Universidade Nova de Lisboa
University of Piraeus
72
The basics question in EMOLITE is related to the degree of accuracy with which the
EMOLITE-program needs to model the terminal evaluation or choice system. A
simplified model may be used to provide an exact solution, but to optimise accurate
representations of most real intermodal transport systems means using a heuristic
procedure.
For reasons of efficiency, not all the 2N potential subsets should be evaluated. As
mentioned before, the objective is to reduce the search, and this is exactly what is
meant by a heuristic. As Herbert Simon said about heuristics; they denote “any
principle or device that contributes to the reduction in the average search to a
solution” [Newell, Shaw and Simon, 1958]. Therefore using heuristics as an
approach to problem solving will be applied, where the emphasis is on working
towards optimum solution procedures rather than optimum solutions. Heuristic
techniques are most often used when the goal is to solve a problem whose solution
can be described in terms of acceptability characteristics rather than by optimising
rules [Tonge, 1961].
Given that the number of potential sites will be high due to computational
requirements, a heuristic approach is the only feasible solution in EMOLITE. Among
the more successful heuristics is the Add algorithm introduced by Kuehn and
Hamburger (1963). Using their ideas, a heuristic for the Multiple Terminal Choice
Problem will be developed in the next phase of EMOLITE.
The heuristic that is proposed in EMOLITE for identifying the best set of terminal
sites consists of two parts:
• = the main program, which adds terminals one at a time until no more additional
terminals can be added which increase the degree of satisfaction of the transport
user,

Contract nr. ST-96-SC.1018
Final Report November 1999
University of Antwerp - RUCA
Universidade Nova de Lisboa
University of Piraeus
73
• = the bump-and-shift routine, entered after the main program, which attempts to
modify solutions arrived at in the main program by evaluating the degree of
satisfaction implications of dropping individual terminal sites or of shifting them
from one location to another.
The heuristic is considered valid based on the following elements:
• = most geographical locations are not promising sites for a ‘best’ terminal site.
Locations with promise are either located close to the source or close to the
destination or in a corridor in between those two places;
• = near optimal sets of terminals can be developed by locating terminals one at a
time, adding at each stage of the analysis a terminal which produces the greatest
increase in degree of satisfaction for the entire terminal set ;
• = only a small subset of all possible terminal locations need be evaluated in detail
at each stage of the analysis to determine the next terminal to be added.
The main program begins with the source (or sources) connected to one central
terminal. Each possible terminal site is then evaluated by determining the increase in
degree of satisfaction that would be achieved by placing a terminal at that location.
The location giving the greatest increase in degree of satisfaction is then selected for
the first placement of a terminal. With the new terminal in place, the process is
repeated for the next location. When no further improvement in degree of
satisfaction is achieved, the main procedure yields to the second routine.
The bump-and-shift routine is designed to check the solution in two ways:
• = any terminal which is no longer really increasing the degree of satisfaction
because some traffic has shifted to newly located terminals is eliminated
(bumped) and the traffic reassigned,

Contract nr. ST-96-SC.1018
Final Report November 1999
University of Antwerp - RUCA
Universidade Nova de Lisboa
University of Piraeus
74
• = attempts are made to interchange each remaining site with other in the territory it
serves.
During the implementation a second heuristic is also taken into consideration, called
the Drop algorithm, which is basically the reverse of the Add algorithm, terminals are
initially assumed to be at all possible locations, and customers are assigned to
multiple terminals. The procedure is then to eliminate the terminal whose elimination
gives the biggest increase in degree of satisfaction. The process is repeated until no
further increase is possible.
Contract nr. ST-96-SC.1018
Final Report November 1999
University of Antwerp - RUCA
Universidade Nova de Lisboa
University of Piraeus
75
6 Improvement potential of EMOLITE
Due to several administrative setbacks during the project, the development of
EMOLITE remained limited to the qualitative evaluation of intermodal terminals in
Europe.
However, the implementation of the EMOLITE prototype has been an interesting and
rewarding experience in several ways. The research team is aware that some
aspects could have been done in different ways leading perhaps to a better solution.
The lack of feedback from professional users during the analyses and development
process was regrettable. Their contribution could have helped finding an even better
user interface. It might also have lead to include additional functionality, more
adapted to specific user needs. Possibly, the database structure might have been
improved to accommodate consistent and more relevant data. Finally the
participation / validation by the end user could have helped the research team to
fine-tune the fuzzy model in order to deal with more realistic scenarios.
However, given that the proposed EMOLITE model is only a first prototype, it will be
up to the researchers that further develop and improve the initial model to generate a
truly validated model that can be tested by the end users.
Despite all these setbacks, the EMOLITE researchers strongly believe that the
present structure constitutes a relevant step for the final development of a decision
support system that meets the real managers’ needs.
There are several aspects of the present prototype that could be scrutinised for
further improvement. The issues are discussed hereafter.
6.1 EMOLITE for passenger terminals
The EMOLITE model can be considered as an innovation in the field of strategic
decision making in the selection and qualitative assessment of intermodal freight
terminals.

Contract nr. ST-96-SC.1018
Final Report November 1999
University of Antwerp - RUCA
Universidade Nova de Lisboa
University of Piraeus
76
However, EMOLITE could easily be expanded to passenger with only limited efforts.
In the final prototype there is a basic evaluation structure foreseen for the
assessment and selection of passenger terminals. If a database with relevant
information on passenger is created in the future, the model could be easily
expanded as demonstrated hereafter.
In a first window a selection can be made between the type of terminal (passengers,
freight). Next, the set of alternative modes of transportation (e.g. railway, road, train,
maritime, airway) has to be identified by the EMOLITE user. Supposing that a
passangers terminal is selected, then, by selecting Next a window as visualised in
figure 22 could allow the user to identify the maximum number of people, maximum
price, the required services and infrastructure.
Figure 22: Selection of passengers terminals’ conditions
By pressing the button Next a new window, represented in figure 23, could define the
connections and the alternative modes.
Figure 23: Selection of terminal’s connections

Contract nr. ST-96-SC.1018
Final Report November 1999
University of Antwerp - RUCA
Universidade Nova de Lisboa
University of Piraeus
77
At this moment, all the information necessary for the passenger prototype to run has
been entered.
The calculations and algorithms are similar to the examples provided for intermodal
freight terminals.
6.2 EMOLITE 2000 : The internet version
In all cases, the new version of EMOLITE must be Web based. The following figure
illustrates roughly what could be the “Web Architecture” for the EMOLITE 2000
system.

Contract nr. ST-96-SC.1018
Final Report November 1999
University of Antwerp - RUCA
Universidade Nova de Lisboa
University of Piraeus
78
The deployment of such architecture would result in much less maintenance efforts
and certainly in much easier and widespread utilisation, since users could access it
simply as “another” Web page. The concept is visualised in the next figure.
Operating System
EMOLITESystem
- WebArchitecture
Internet
/Intranet
/Extranet
Database
Server
EMOLITE Clients
AD
O
via
OD
BC
AD
O
via
OD
BC
MapManagement
nt
Administration
n
Localapplicationallowing
visualizationedition
printing of maps.
Local applicationallowingspecific systemadministrativetasks.
LAN
Map
LayerMap
LayerMap
Layer
Map
ServerIncorporates geographical
features into Webpublishing
Map
EngineObjets and methodsfor accessingcartography
Web
ServerResponsible for hostingandmanaging Web
applications
Application
ServerAPI exporting methodsto access database
and cartography toclient applications
Web Page
UserInterface
based on
Internetbrowser
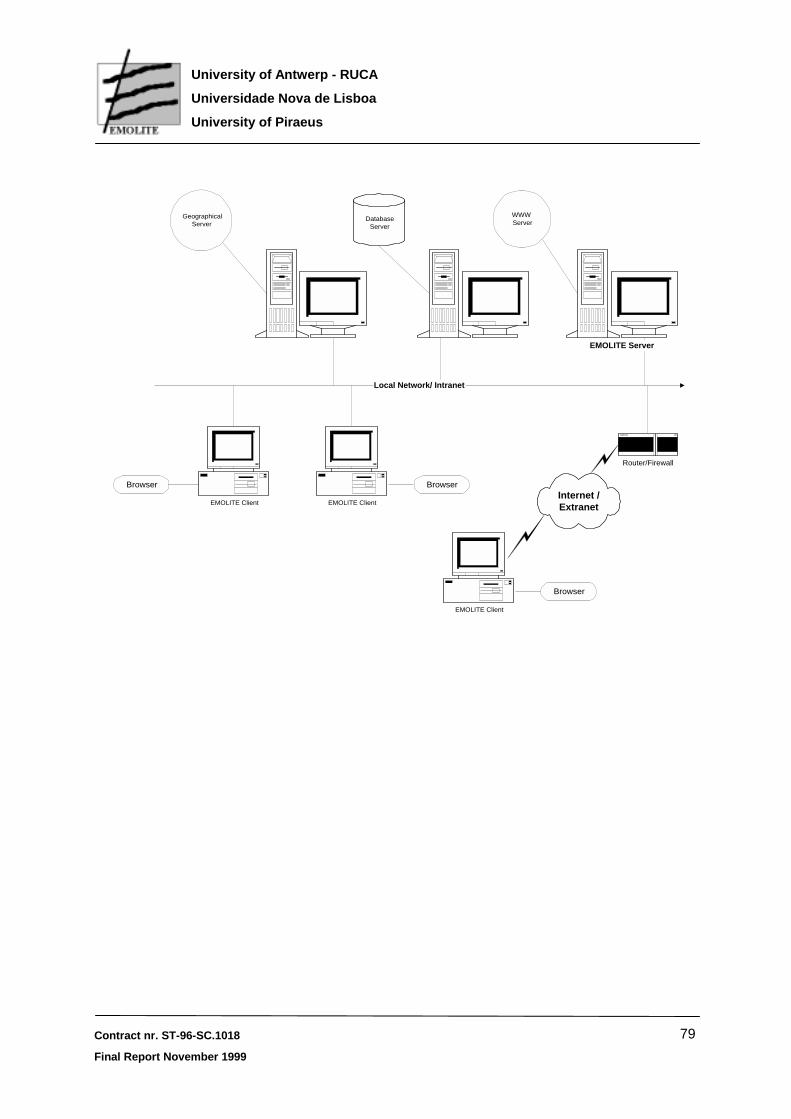
Contract nr. ST-96-SC.1018
Final Report November 1999
University of Antwerp - RUCA
Universidade Nova de Lisboa
University of Piraeus
79
Local Network/ Intranet
EMOLITE Client
DatabaseServer
Browser
WWWServer
EMOLITE Client
Browser
EMOLITE Client
Browser
EMOLITE Server
GeographicalServer
Router/Firewall
Internet /Extranet

Contract nr. ST-96-SC.1018
Final Report November 1999
University of Antwerp - RUCA
Universidade Nova de Lisboa
University of Piraeus
80
6.3 Some strategic considerations
6.3.1 introduction
The present EMOLITE design, development and implementation is based on the
systems development life cycle (SDLC) concept and rapid prototyping. Because of
the unstructured nature of a DSS, the development methodology differs from the
traditional SDLC in several ways. The process itself is shorter and iterative, i.e., the
stages are not strictly sequential. DSS designers have long recognised the need for
departure from the traditional SDLC and recommend an iterative approach, with
extensive use of prototyping [Sprague and Carlson, 1982].
Any future EMOLITE development requires the active participation of various
specialists (transport economics, logistics management, operations research,
computer science) in all stages and employs a development strategy that allows for
working concurrently on design and development. A fundamental assumption of the
traditional SDLC methodology is that the requirements can be completely specified
during the analysis phases. This does not translate well to DSS development. The
process of requirement specification for a DSS is best characterised as a learning
experience that takes place continuously during development. Since formal
methodologies do not exist for DSS development to the same extent as for
information systems, a framework is proposed, which consists of the following
phases: project assessment, problem analysis, design, development, testing, and
documentation, implementation and maintenance.
6.3.2 Project assessment
In this phase three major tasks are defined: (1) define the problem, (2) determine the
project feasibility; and (3) develop a project proposal.
Projects are initiated in response to a problem or an opportunity to employ new
technology. The first task in project evaluation is to carefully define the problem and
to determine if the problem is appropriate for a DSS. The problem should be neither
too trivial nor too complex. If heuristic problem-solving techniques exist, it is likely to

Contract nr. ST-96-SC.1018
Final Report November 1999
University of Antwerp - RUCA
Universidade Nova de Lisboa
University of Piraeus
81
be appropriate. We consider our decision problem as a semi-structured problem (this
idea is elaborated further on), and for this type of problem a DSS is suitable.
Whether it is feasible for the Transport Company depends not only on the suitability
evaluation but also needs technical, operational and economic feasibility.
Technical feasibility is used to determine if the technology (hardware, software and
expertise) exists to solve the problem. If, like in our project, the DSS is intended to be
used by multiple users, it is necessary that it is developed on a widely-used platform.
It seems quite natural that in a today’s small business environment a personal
computer is common hardware, and that a DSS should run in a Microsoft Windows
environment to allow for widely distribution among potential users. In terms of
expertise, we are convinced that the nature of solving the decision problem is not
difficult, but the difficulty appears in the huge amount of technical and economic
data. These data could possibly be kept in memory of the human user, or in various
books at different places. But it is easily understood that the integration of these data
on one place together with simple calculating or optimisation models, can greatly
improve the decision-making process of the transport manager. The project is
operationally feasible if the new system can be introduced with little disruption to
current operations, can be operated by current staff, and can be integrated with
current systems. Comparing costs versus anticipated benefits can test economic
feasibility. But, in practice, a DSS offers intangible benefits like:
• = better decisions,
• = more consistency in decision-making,
• = better use of resources,
• = superior service,
• = enhancement of the company image.
In the case of a future EMOLITE application, it is not expected that current
operations will suffer from the installation of the DSS. But the tasks of deciding which
terminal(s) to use have changed. It can however be expected that the user will
accept these changes in a positive way. It facilitates work in terms of searching for

Contract nr. ST-96-SC.1018
Final Report November 1999
University of Antwerp - RUCA
Universidade Nova de Lisboa
University of Piraeus
82
data and calculating. The user also will feel greater responsibility. By making
simulations, either with changed parameters or changed objective functions, a ‘best’
solution can be obtained in an interactive way while, using a manual system, it is
technically or economically impossible to compare various scenarios. If the whole
project seems feasible, the company can make up a project proposal for the
development and installation of the DSS.
6.3.3 Problem Analysis
This stage consists of an in-depth study of the key elements of the problem, which
should provide the developer with more insight into the decision-making process.
The partners in any future EMOLITE-project per definition need different
backgrounds. One part of the group should act as transport and logistics specialists
providing information on which data and decision techniques are relevant for the
decision-making process; the other part represent the computer science and the
problem solving (modelling and algorithmic) people gathering information from the
transport experts. It is known that results are highly dependent on the developer and
his/her ability to understand the problem domain.
The next step is the development of a more advanced prototype to assist in
identifying more detailed systems requirements. Here, the difference with large-scale
systems is clear. In a large-scale system, the analyst attempts to understand the
entire system before any development is started. For a small scale DSS, the process
is less rigid with prototyping beginning early in the development process.
6.3.4 Design
The first step in the overall logical design of the future EMOLITE DSS is to construct
the main menu and the menu structure. Since the DSS is a dynamic system, plans to
incorporate changes are made during the design. A modular design will facilitate the
addition of new features and modification of existing features is essential. Object-
oriented design is another option that will support future enhancements. The detailed
design will focus on the database, the model (base) and the user interface.

Contract nr. ST-96-SC.1018
Final Report November 1999
University of Antwerp - RUCA
Universidade Nova de Lisboa
University of Piraeus
83
For the database design, a database model is selected. In today’s environments, it is
comm2on to use the relational database model for real-life applications. The model
or model subsystem will be designed to provide the user with the ability to create,
access, catalog and integrate mathematical models easily. The new EMOLITE
should use Evaluation Models, which assess locations or sets of locations, based on
the transport decision-maker’s preferences. A second type of models to be provided
are Optimisation Models, in which a location or a set of locations is found according
to a preference function put forward by the user.
User-interfaces are also required and must include pull-down menus and graphical
user interfaces (GUIs) which will meet the needs of all potential users. The menus
present the choices in a clear and consistent manner, and the format of the results
will facilitate decision-making, and are consistent with the user’s conceptual
approach of the system.
6.3.5 Development, testing and documentation
During development, the application is constructed, databases are established and
implemented, the user interface is refined, and the analytical models are developed
and tested. The development stage of the DSS is considerably shorter than that of a
traditional information system since the tools used are typically application
generators which free the programmer to think about the ‘how to’ of systems
functions. One successful development strategy is to identify a key module and
develop it completely, deferring development of other modules. The rationale is that
if the appropriate module is developed first, the logical structure of other modules are
similar to the key module and successful development of the key module is a good
indication of overall system success.
The user of the future EMOLITE model (or in this case the transport specialists) must
provide feedback on the user interface and the help screens, validate the decisions
made by the system, evaluate the menu navigation logic (how to move between

Contract nr. ST-96-SC.1018
Final Report November 1999
University of Antwerp - RUCA
Universidade Nova de Lisboa
University of Piraeus
84
screens) and refine the system specifications, if necessary. This element was left out
in the original EMOLITE program due to managerial problems.
The evaluation of a future EMOLITE DSS could therefore turn out completely bad. It
could be that the wrong development tool is selected, the prototype must be thrown
away, and the design process restarted. This sounds dramatic, but a more serious
error would be to proceed with a wrong development environment.
Testing the DSS focuses on validation of the system product, the expected results
and user acceptance. Results from analytical models and heuristics should be
validated using historical data to check if system results are consistent with past
decisions. A useful strategy is to load a file containing test cases (e.g. data on one
specific country in Europe) at the beginning of the development and continuously
test, as different components for the DSS are developed.
Documentation is developed during this stage, with an emphasis on clarity of
presentation. DSS documentation should consist of project description, input and
output screens, reports, model descriptions and formulas, database schema, menu
navigation diagrams, results from test cases and source code. This is a technical
documentation that cannot serve as a user’s manual.
6.3.6 Implementation
It should be recognised that the implementation of an improved EMOLITE model is a
process of organisational change. The implementation changes the way tactical or
operational decisions are made. The major concern is here the successful
implementation. Different organisational models have served as a basis for a theory
of successful implementation. A review on the scientific literature can be found in
Alavi and Joachimsthaler (1992). They have linked successful implementation of a
DSS to user situational variables (user involvement, training and experience). They
estimated that when users were involved in the development process and provided
with the appropriate training and experience, the rate of implementation success
could increase by as much as 30%.

Contract nr. ST-96-SC.1018
Final Report November 1999
University of Antwerp - RUCA
Universidade Nova de Lisboa
University of Piraeus
85
6.3.7 Maintenance
As decision-making strategies will evolve over time, the DSS will require changes.
The present EMOLITE model is only a prototype model that can be distributed on a
large scale, but the potential user should be aware that this package would not solve
his problems forever. In a real commercial implementation a plan for system
maintenance is required. The design of the system, choice of development tool, and
programming skills of the developer, will affect maintenance costs. If the system is
developed by outside contractors, it is recommended that an individual within the
organisation be responsible for monitoring the system. An important part of the
maintenance effort is a post-implementation evaluation during which the system
users and management discuss strengths and weaknesses of the DSS. Users
should report problems and request for new features to the individual who is
responsible for managing the maintenance effort. Security should be added to lock
out unauthorised changes.
6.3.8 Note on Semi-structured decisions
Consider the transport operator being confronted with the decision of choosing one
or more terminal locations. It can be stated that
(1) considerable data on the available alternatives and their characteristics exist; (2) information is known about his past decisions (or of the decisions made by his
predecessor); (3) experts who know about the transport and handling services are available. Still it
seems that the decision of choosing the right terminal is a difficult one.
The society as a whole knows a lot about this type of decision, but a given decision-
maker might know relatively little or not enough about the particular problem. Thus
the decision problem can be almost perfectly structured from the point of view of
society as a whole and relatively unstructured from the point of view of the decision-
maker. This type of problem is called a semi-structured decision problem [Jacquet-
Lagrèze and Shakun, 1984]. In the well-known textbooks of Keen and Scott Morgon
(1978), of Sprague and Carlson (1982), and of Bonczek, Holsapple and Whinston
(1981) it is suggested that semi-structured decision problems are a fruitful area for

Contract nr. ST-96-SC.1018
Final Report November 1999
University of Antwerp - RUCA
Universidade Nova de Lisboa
University of Piraeus
86
DSS. The ultimate goal of the DSS for our semi-structured decision problem has to
enable the decision-maker to learn in an efficient way what his preferences and
goals are in relation to what is available on the market and thus to make the
decision. The information is located in a database on the existing alternatives and
their characteristics. Into the DSS a set of goals (or criteria) is built which decision-
makers and experts in the field have commonly used. This is what we have called
earlier the knowledge available in the society. Further, we must be able to assess the
preference function of a particular decision-maker.
In multi-objective decision-making problems, multiple objectives are mostly non-
commensurable and cannot be combined into a single objective. Moreover the
objectives usually conflict with each other in that any improvement of one objective
can be achieved only at the expense of another. Consequently the aim is to find a
compromise of satisfying solution of a decision-maker which is also Pareto optimal
based on his/her subjective value judgment. When formulating the multi-objective
optimisation problem that closely describes and represents the real decision
situation, various factors of the real system should be reflected in the description of
the objective functions and the constraints. Naturally these objective functions and
the constraints involve many parameters whose possible values may be assigned by
the experts. In the conventional approaches, such parameters are fixed at some
values in an experimental or subjective manner through the experts’ understanding
of the nature of the parameters. In most practical situations, it is natural to consider
that the experts often only ambiguously know the possible values of these
parameters. In this case, it may be more appropriate to interpret the experts’
understanding of the parameters as fuzzy numerical data which can be represented
by means of fuzzy subsets of the real line known as fuzzy numbers [Dubois and
Prade, 1978]. The resulting multi-objective optimisation problem involving fuzzy
parameters would be viewed as the more realistic version of the conventional one
[Orlovski, 1984].

Contract nr. ST-96-SC.1018
Final Report November 1999
University of Antwerp - RUCA
Universidade Nova de Lisboa
University of Piraeus
87
7 Conclusions and recommendations
7.1 Why EMOLITE?
At present, the EMOLITE software is strongly determined by the availability and
quality of the information that feed the algorithms. This aspect is directly related to
one of the core problems of location analysis. Uncertainty and mathematical
fuzziness govern information in the decision-making process. Objectives and criteria
are often difficult to be measured by crisp values, and thus regularly neglected. Also
the lack of accurate data increases the fuzziness of the analyses.
Transport problems are per definition complex. Therefore, any approach that
translates qualitative objectives in crisp parameters and fixed data is inaccurate and
insufficient. Even if all information used is quantifiable the selection process is
subjective in nature. Decision-makers therefore find any analytical approach too
restrictive and use subjective knowledge (business intuition) during the final phases
of the decision-making process. In most cases, computers are no longer used and
are even considered obsolete because user interfaces are generally to complex to
handle.
The implementation of the EMOLITE prototype has been an interesting and
rewarding experience in several ways. Some aspects could have been done in a
different way leading perhaps to a better solution than the present prototype. The
hardest problem was the lack of feedback from potential users during the whole
analysis and development period. Such a contribution could have
• = improved the user interface,
• = identified additional functionality more suited to specific user needs,
• = optimised the database structure to accommodate consistent data
• = validated and fine-tuned the fuzzy model in order to deal with more realistic
selection scenarios.

Contract nr. ST-96-SC.1018
Final Report November 1999
University of Antwerp - RUCA
Universidade Nova de Lisboa
University of Piraeus
88
Despite all that, the research team strongly believes that the present structure is a
relevant step towards implementing a system close to the true managers’ needs.
7.2 EMOLITE and the decision making process
Decisions related to the location of freight and passenger terminals are complex and
require careful consideration because they generally involve a long term allocation of
substantial (financial) resources. Once such decisions are taken, they also become
very difficult to reverse without losing a considerable part of the initial investment.
Decision makers should therefore analyze all relevant elements which could
influence both the short term and the long term consequences of selecting specific
locations.
The various existing models to identify optimal locations can be positioned in one of
the four quadrants of Figure 24, in which the horizontal axis refers to the complexity
of the applied analytical model (high or low) and the vertical axis identifies the value
of the results for public and private decision makers (high or low) in their final
decision. Conventional location models usually do not meet the requirements of
decision makers. These models are either too complex or too general.
Figure 24: Policy Relevance of Location Decision Models
1 3
42
C om plexity o f the analytical m odel
C on tribu tion of the resu lts to the decision m aking process
L O W H IG H
H IG H
L O W
Complex models generally consist of mathematical and/or geometrical algorithms.
The complex algorithms generate very detailed results on very specific problems,
e.g., the optimal location in terms of minimising costs, taking into account

Contract nr. ST-96-SC.1018
Final Report November 1999
University of Antwerp - RUCA
Universidade Nova de Lisboa
University of Piraeus
89
transportation costs and distances. These solution models are very important from
an academic point of view, but have only a limited relevance in managerial decision
making processes because these mathematical algorithms require so many
abstractions and conditions that the final results are extremely difficult to be
translated into real-life decisions. They are therefore located in quadrant 4.
However, many decision criteria in the selection and evaluation of specific locations
are characterised by uncertainty, subjectivity, imprecision and ambiguity. The
inaccuracy is not only related to the data but also to the evaluation process itself. In
certain cases, accurate data are available and decision makers have a well defined
opinion as regards the importance of specific parameters. Mathematical algorithms
can be applied in order to analyse these specific problems. However, accurate data
will not always be available and existing inter-relationships between decision factors
may be unclear. In addition, decision makers have the tendency to evaluate
parameters not according to objective standards but according to personal
experience, intuition and on the basis of a subjective assessment of the importance
(weight) of the criterion in the overall decision making process. The problem of
inaccuracy has to be taken into consideration and a methodology developed that
enables to translate this inaccuracy and uncertainty into a reliable decision making
framework.
General models, on the contrary, include a large number of uncertain decision
factors in the analysis. But the actual evaluation of the individual factors is in most
cases very limited and rarely based upon reliable evaluation models. General site
evaluation models also have a tendency to overlook existing inter-dependencies
among the set of relevant decision factors. Such type of general analysis seems
useful in the managerial decision process to overcome the problem of inaccuracy but
it is doubtful whether the results of such superficial evaluation are reliable and
generate the best solution possible. The general models are therefore located in
quadrant 2 of Figure 24.
In principle, it is possible to develop custom made models for the identification of the
optimal location to establish freight and passenger terminals. However, time and

Contract nr. ST-96-SC.1018
Final Report November 1999
University of Antwerp - RUCA
Universidade Nova de Lisboa
University of Piraeus
90
resources generally are lacking in order to develop these individualised models
which are located in quadrant 3 of Figure 24.
The development of an alternative selection and evaluation model for the location of
intermodal terminals is proposed in this research project. The Evaluation Model for the Optimal Location of Intermodal Terminals in Europe (EMOLITE) proposed in
this research project, allows an accurate evaluation of potential sites for the
development of freight and passenger terminals according to both internal and
external requirements, taking into consideration the dynamic and continuously
changing environment of freight and passenger transport. The model also combines
mathematical accuracy and user-friendliness and can therefore be positioned in
quadrant 1 of Figure 24.
7.3 The usefulness of EMOLITE
The EMOLITE prototype has several interesting features that could be useful to
other applications. Consider the prototype in accordance to its functions and the
conclusion is that in itself, the present model has more value as academic tool rather
than a practical and useful model for strategic decision making. However, digging
deeper in the concept of EMOLITE, on can conclude that several sections constitute
the basis of further research possibilities.
EMOLITE is constructed in a modular manner as visualised in figure 25.
Figure 25: modular approach of EMOLITE
EMOLITE MANAGEMENT
INTERFACE
EMOLITE DATABASE EMOLITE ALGORITHM

Contract nr. ST-96-SC.1018
Final Report November 1999
University of Antwerp - RUCA
Universidade Nova de Lisboa
University of Piraeus
91
In particular the EMOLITE Management Interface is important. Using the Wizards
available in Windows and applying fuzzy logic to interact with the user creates a first
user friendly approach between operational computer models and their users. The
difficulties of entering data and conditions before running the simulations has been
reduced to an easy and “guided” method that enables non-experienced users to
apply the method for their particular purpose.
Also the two other sections, namely the Database and the Algorithm are innovative
and offer possibilities to expand most existing approaches to site location selection
and analysis. The mixed use of socio-economic, geographical and economic data in
combination with a multi-criteria analysis offers a wider perspective to the computer
assisted site location decision making process.
Further research will be necessary to explore the possibilities of EMOLITE, not only
in relation to site location and selection procedures but also and even more to the
possibilities of further elaborating the EMOLITE approach to other evaluation
models.

Contract nr. ST-96-SC.1018
Final Report November 1999
University of Antwerp - RUCA
Universidade Nova de Lisboa
University of Piraeus
92
8 Annex 1: References and further reading
• = Alavi, M. and E. Joachimsthaler, 1992, Revisiting DSS implementation research: a meta-analysis of the literature and suggestions for researchers, MIS Quarterly,pp. 95-116. • = Alreck P. L. and R. B. Settle, 1985, The Survey Reasearch Handbook, Irwin Publishers. • = Anthony, R.N., 1965, Planning and Control Systems: a Framework for Analyses, Harvard Business School, Boston, MA. • = Baldwin, J. F., forthcoming, Evidential Support Logic, FRIL and Case Based Reasoning. To appear in International Journal of Intelligent Systems. • = Baldwin, J. F., T. P. Martin and B.W. Pilsworth, 1994 FRIL- Fuzzy and Evidential Reasoning in AI, Research Studies Press. • = Bonczek, R.H., C.W. Holsapple and A.G. Whinston, 1981, Foundations of Decision Support Systems, Academic Press, New York. • = Buede, D.M., 1992, Superior design features of decision-analytic software, Computers and Operations Research, vol. 19, pp. 43-57. • = Current, J., H. Min and D. Schilling, 1990, Multiobjective analysis of facility location decisions, European Journal of Operational Research, vol. 49, pp. 295-307. • = E. Declercq & Brain Boffey, 1998 Site Location from a Managerial Perspective, Special Series on Locational Analysis, VUB Press, Brussels, Belgium • = E. Declercq & A. Verbeke, 1997 Het Electic Site Evaluation Model: een Multi – Criteria Analyse voor de Locatie van Intermodale terminals in Vlaanderen” in: Tijdschrift voor Vervoerwetenschap, 3/97 • = DeLone, W.H., 1988, Determinants of success for computer usage in small business, MIS Quarterly, vol. 12, pp. 51-61. • = Domschke, W. and A. Drexl, 1985, Location and Layout Planning, Lecture Notes on Economics and Mathematical Systems, vol. 238, Springer Verlag, Berlin.

Contract nr. ST-96-SC.1018
Final Report November 1999
University of Antwerp - RUCA
Universidade Nova de Lisboa
University of Piraeus
93
• = Dubois, D. and H. Prade, 1978, Operations on fuzzy numbers, International Journal of Systems Science, vol. 9 no. 6, pp. 613-626. • = Edwards, W.F., 1987, A microcomputer inventory system for the small business, Journal of Systems Management, vol. 38, pp. 18-23. • = Erlenkotter, D., 1978, A dual-based procedure for incapacitated facility location,
Operations Research, vol. 26 no. 6, pp. 992-1000. • = Finlay, P.N. and C.J. Martin, 1989, The state of decision support systems: a review, Omega, vol. 17, pp. 525-531. • = Floyd, S.A., C.F. Turner and K.R. Davis, 1989, Model-based decision support systems: an effective implementation, Computers and Operations Research, vol. 16, pp. 481-491. • = Gordon, W.L. and J.R. Key, 1987, Artificial intelligence in support of small business information needs, Journal of Systems Management, vol. 38, pp. 24-28. • = Gorry, M.A. and M. Scott Morton, 1971, A framework for Management Information Systems, Sloan Management Review, vol. 13, pp. 55-70. • = Gupta, J.N.D. and T.M. Harris, 1989, Decision support systems for small businesses, Journal of Systems Mangement, vol. 40, pp. 37-41. • = Jacquet-Lagrèze, E. and M.F. Shakun, 1984, Decision Support Systems for semi-structured buying decisions, European Journal of Operational Research, vol. 16, no. 1, pp. 48-58. • = Keen, P.G.W. and M.S. Scott Morton, 1978, Decision Support Systems: An Organizational Perspective, Addison-Wesley, Reading, MA. • = Khumawala, B.M., 1972, An efficient branch-and-bound algorithm for the warehouse location problem, Management Science, vol. 18 no. 12, pp. B718-731. • = Kuehn, A.A. and M.J. Hamburger, 1963, A heuristic program for locating warehouses, Management Science, vol. 9, pp. 643-666. • = Lincoln, D.J. and W.B. Warberg, 1987, The role of computer in small business marketing, Journal of Small Business Management, vol. 25, pp. 8-17.

Contract nr. ST-96-SC.1018
Final Report November 1999
University of Antwerp - RUCA
Universidade Nova de Lisboa
University of Piraeus
94
• = Little, J.D.C., 1970, Models and Managers: the concept of a decision calculus, Management Science, vol. 16, pp. B466-B485. • = MacCrimmon K.R., 1973, An Overview of Multiple Objective Decision Making.” in: Cochrane and Zeleny (eds.), Multiple Criteria Decision Making, University of South Caroline Press. • = Newell, A., J.C. Shaw and H.A. Simon, 1958, The Processes of Creative Thinking, The RAND Corporation Paper P-1320. • = Orlovski, S.A., 1984, Multiobjective programming problems with fuzzy parameters, Control and Cybernetics, vol. 13 no. 3, pp. 175-183. • = Ribeiro, R.A., 1996, Fuzzy Multiple Attribute Decision Making: a Review and New Preference Elicitation Techniques, Fuzzy Sets and Systems, vol. 78, pp. 155-181. • = Ribeiro, R. A., 1993 Application of Support Logic Theory to Fuzzy Multiple Attribute Decision Problems, PhD Thesis, University of Bristol, UK. • = Rumbaugh, J, M. Blaha, W. Premerlani, F. Eddy, W. Lorensen, 1991, Object-Oriented Modeling Technique, Prentice Hall. • = Saaty, T., 1986, Decision Making for Leaders. University of Pittsburgh. • = Simmons, L.F. and L. Poulos, 1987, DSS: the successful implementation of a mathematical programming model for strategic planning, Computers and Operations Research, vol. 15, pp. 1-5. • = Sprague, R.H. and E.D. Carlson, 1982, Building effective decision support systems, Prentice Hall, New Jersey. • = Starr, M.K. and M. Zeleny, 1977, MCDM - State and Future of the Arts, TIMS Studies in the Management Sciences, vol. 6, pp. 5-29. • = Stroustrup, B., 1991, The C++ Programming Language, 2nd edition, Addison-Wesley. • = Tonge, F.M., 1961, A Heuristic Program for an Assembly Line Balancing Problem, Prentice Hall.

Contract nr. ST-96-SC.1018
Final Report November 1999
University of Antwerp - RUCA
Universidade Nova de Lisboa
University of Piraeus
95
• = Yourdon, E., 1989, Modern Structured Analysis, Prentice-Hall. • = Zadeh, L. A., Fuzzy Sets, Information and Control 8, 338-353. • = Zadeh, L. A., 1975 Fuzzy Logic and Approximate Reasoning, Synthese, 30, 407-428.

Contract nr. ST-96-SC.1018
Final Report November 1999
University of Antwerp - RUCA
Universidade Nova de Lisboa
University of Piraeus
96
9 Annex 2: The External Database of EMOLITE
9.1 Global Transport Data
The Global transport database is an AND proprietary database. This database can
either be licensed individually or in conjunction with the Global Geographic database.
In the latter case the Unique Connection Points (UCP’s) Terminals facilitates the
connection.
The Global Transport database is continuously updated. New releases are made
available to our clients twice a year, namely in January and July.
9.1.1 Global Transport Database
This database contains all information required for the transportation of cargo by
standardised loading units like for instance containers. The database is divided into
Transport Networks and Services.
Transport Networks Contents Terminals 1,031 Ferry Connections 190,500 Railway Network 323,200 Inland Waterway Network 14,500 kmSea Network 85,500 kmIndustrial areas 5,800
Transport Services Number of Ferry Services 3,000 Rail Services 19,500 Inland Waterway 25,400 Sea Services 7,500
Transport related Number of Organisations Europe 3,300

Contract nr. ST-96-SC.1018
Final Report November 1999
University of Antwerp - RUCA
Universidade Nova de Lisboa
University of Piraeus
97
Transport Networks
All Transport networks are digital models of maps that can easily be linked together.
When the Road Network Database is incorporated, extra information about tonnage
restrictions for roads, toll roads, and border crossings open to freight transport will be
included as well.
Terminal Network
Terminals are the turntables between different networks, the place where goods are
transferred from one mode of transportation to another. The Terminal network
consist of two files: the first file contains name, location and type of the terminal and
the second file contains all specific characteristics of each terminal; like for example
2accessibility, names of operators ad loading equipment.
Ferry Network
The Ferry Network holds all data on ferry connections plus ferry coding points, as
well as information like tonnage restrictions for freight transport. The ferry coding
points can be used to link ferry timetables to this network (see Transport Services).
Railway Network
The Railway Network consist of freight and passenger lines and links to terminals
with a rail connection. Passenger lines are also included as they are increasingly
being used for freight.
Inland Waterway Network
The Inland waterway network contains river and canal waterways accessible to ships
of over 50 meters in length and the links to terminals with a river or canal connection.
Sea Network
The European sea network contains transport routes between ports and the links to
terminals with a sea connection. The sea networks of the Atlantic, India and Pacific
Ocean are not linked yet to terminals on the surrounding continents.

Contract nr. ST-96-SC.1018
Final Report November 1999
University of Antwerp - RUCA
Universidade Nova de Lisboa
University of Piraeus
98
Industrial Areas
The network of Industrial Areas contains information used by companies for
industrial or other non – agricultural purposes.
Notes:
Km total length of all segments Links total number of segments - mode does not exist 0 no information available Railway Network consist if lines for passenger and freight transport Inland waterway Network are counted twice when border between countries is in the middle of the river Services connections operating on the network; numbers are subject to heavy changes Organisations numbers are subject to heavy changes
9.1.2 Transport Networks
Sea Links
Sea Shipping Links Km Europe 1,100 85,500Atlantic Ocean 606 255,100Indian Ocean 260 120,800West Pacific 830 246,300East Pacific 291 226,100
Ferries
No Code Country Links Km International ferries 869 109,16
355 AL Albania 0 0374 ARM Armenia 0 043 A Austria 24 3994 AZ Azerbaydzhan 0 032 B Belgium 0 0387 BIH Bosnia and Herzegovina 0 0359 BG Bulgaria 0 0375 BY Byelorussia 0 0385 HR Croatia 153 2,952357 CY Cyprus 0 0420 CZ Czechia 4 3

Contract nr. ST-96-SC.1018
Final Report November 1999
University of Antwerp - RUCA
Universidade Nova de Lisboa
University of Piraeus
99
45 DK Denmark / Faeroe 217 1,030 372 EW Estonia 12 80358 FIN Finland 156 1,37033 F France 144 5,276995 GE Georgia 0 049 D Germany 420 1,58430 GR Greece 630 19,83836 H Hungary 93 20354 IS Iceland 27 368353 IRL Ireland 46 10039 I Italy 495 15,887371 LV Latvia 0 0411 FL Liechtenstein 0 0370 LT Lithuania 3 1352 L Luxembourg 0 0389 MK Macedonia 0 0356 M Malta 3 6373 MD Moldavia 0 0377 MC Monaco 0 031 NL Netherlands 143 11247 N Norway 1?962 17,07648 PL Poland 192 46351 P Portugal / Madeira / 54 3,10040 RO Romania 12 1597 RUS Russia 9 305421 SK Slovakia 0 0386 SLO Slovenia 0 034 E Spain / Canary Island 60 3,84546 S Sweden 198 76741 CH Switzerland 9 990 TR Turkey 123 1,631380 UA Ukraine 0 044 GB United Kingdom 540 5,718381 YU Yugoslavia 12 4 TOTAL 6,610 190,45
Each ferry connection between a pair of ports consist of 3 links (segments) with 2
ferry coding points in between, one for each direction.

Contract nr. ST-96-SC.1018
Final Report November 1999
University of Antwerp - RUCA
Universidade Nova de Lisboa
University of Piraeus
100
Terminals, industrial areas, railways and inland waterways
Nr Cod Country Terminal Industri Railw Inland Location Location Links Km Links Km35 AL Albania 1 0 32 503 - -37 AR Armenia 0 0 8 467 - -43 A Austria 30 0 2,055 5,776 9 31299 AZ Azerbaydzhan 0 0 17 1,519 - -32 B Belgium 44 534 994 3,061 192 96738 BIH Bosnia and 0 0 58 1,695 - -35 BG Bulgaria 11 0 135 3,763 2 46137 BY Byelorussia 1 0 128 5,074 - -38 HR Croatia 9 0 112 2,583 1 13335 CY Cyprus 4 0 - - - -42 CZ Czechia 20 0 1,038 9,092 27 25945 DK Denmark / 38 0 592 2,620 - -37 EW Estonia 1 0 61 1,159 - -35 FIN Finland 18 0 368 5,778 - -33 F France 94 0 4,453 31,66 159 1,88099 GE Georgia 2 0 44 1,244 - -49 D Germany 171 3,310 10,649 39,68 407 5,51330 GR Greece 9 0 412 2,356 - -36 H Hungary 12 0 705 8,528 6 44435 IS Iceland 14 0 - - - -35 IRL Ireland 15 0 180 1,915 - -39 I Italy 105 0 4,085 18,31 - -37 LV Latvia 4 0 67 2,301 - -41 FL Liechtensein 0 0 3 9 - -37 LT Lithuania 0 0 68 1,970 - -35 L Luxemburg 52 1,917 90 242 1 3738 MK Macedonia 35 0 26 736 - -35 M Malta 15 0 - - - -37 MD Moldavia 16 0 26 973 - -37 MC Monaco 4 0 2 4 - -31 NL Netherlands 8 0 577 2,643 354 2,51847 N Norway 8 0 3,191 4,100 - -48 PL Poland 3 0 1,407 21,91 23 25735 P Portugal / 75 0 460 3,119 - -40 RO Romania 53 0 306 9,453 7 1,1697 RU Russia 21 0 787 46,64 0 042 SK Slovakia 10 0 1,229 3,741 5 16338 SLO Slovenia 7 0 166 1,158 - -34 E Spain / Canary 110 0 1,617 13,73 - -46 S Sweden 1 0 1,162 10,62 - -41 CH Switzerland 21 0 2,117 5,776 10 65

Contract nr. ST-96-SC.1018
Final Report November 1999
University of Antwerp - RUCA
Universidade Nova de Lisboa
University of Piraeus
101
90 TR Turkey 10 0 118 7,580 - -38 UA Ukraine 7 0 595 19,65 - -44 GB United 110 0 3,913 15,35 - -38 YU Yugoslavia 1 0 259 4,678 2 352 TOTAL 1,031 5,775 44,312 323,2 1,205 14,53
Transport Services
The Transport Services Database contains timetables, transit times and accessibility
for calculating the optimum way of transportation.
Number of services departing from terminals in European countries.
No Code Country Ferry Railway Waterway Sea
355 AL Albania 2) 0 - 0 374 ARM Armenia 10 0 - 0 43 A Austria 0 2,200 131 - 994 AZ Azerbaydzhan 0 0 - - 32 B Belgium 8 1,924 7,612 353 387 BIH Bosnia and - 0 - - 359 BG Bulgaria 0 0 36 37 375 BY Byelorussia 0 0 - 0 385 HR Croatia 177 98 35 12 357 CY Cyprus 3) - - 183 420 CZ Czechia 0 262 85 - 45 DK Denmark / Faeroe 859 2,068 - 277 372 EW Estonia 30 0 - 18 358 FIN Finland 356 5 - 264 33 F France 224 710 881 405 995 GE Georgia 0 0 - 6 49 D Germany 514 5,194 3,758 711 30 GR Greece 226 37 - 411 36 H Hungary 0 324 102 - 354 IS Iceland 4 - - - 353 IRL Ireland 42 0 - 135 39 I Italy 444 1,378 - 668 371 LV Latvia 2 0 - 36

Contract nr. ST-96-SC.1018
Final Report November 1999
University of Antwerp - RUCA
Universidade Nova de Lisboa
University of Piraeus
102
411 FL Liechtensein - 0 - - 370 LT Lithuania 7 0 - 3 352 L Luxemburg - 3 0 - 389 MK Macedonia 0 0 - - 356 M Malta 2) - - 63 373 MD Moldavia - 0 - - 377 MC Monaco - 0 - - 31 NL Netherlands 4 624 11,873 594 47 N Norway 647 97 - 390 48 PL Poland 3 106 0 31 351 P Portugal / Madeira / 0 46 - 334 40 RO Romania 0 1 33 38 7 RUS Russia 0 1 68 56 421 SK Slovakia 0 43 70 - 386 SLO Slovenia 0 119 - 24 34 E Spain / Canary Islands 167 581 - 672 46 S Sweden 217 2,999 - 293 41 CH Switzerland 46 373 617 - 90 TR Turkey 2) 1 - 532 380 UA Ukraine 0 0 0 51 44 GB United Kingdom 706 296 - 693 381 YU Yugoslavia 2) 0 69 1 TOTAL 4,693 19,490 25,370 7,459
9.2 AND Format
The EMOLITE research team used the AND Mapping Format, being an ANSI –
string whit a latitude / longitude WGS’ 84 projection system. In addition to the
proprietary format, EMOLITE support following formats and projections:
Formats: ARC / info (Export, Shape or Generate), Atlas GIS (BNA; for boundary files only), MapInfo
String formats: ANSI, ASCII Projection systems: Latitude/longitude
several cartesian projections

Contract nr. ST-96-SC.1018
Final Report November 1999
University of Antwerp - RUCA
Universidade Nova de Lisboa
University of Piraeus
103
NOTE: . Boundary files are usually delivered in the BNA format for which a separate format description is available. . Field separators are commas, they are not used within fields. Strings are in ANSI character set.
An overview of the Node File, Segment File and Intermediate File of the AND
Transport Network is given below.
Node File (*. VRT) and unconnected points (*CRD)
Nr Field Format Id Description
1 ND – ID N8 NNNNNNNN Internal AND – ID
2 ND – XLONG N4. 6
NNNN.NNNNNN Longitude in decimal degrees
3 ND – YLAT N3.6 NNN.NNNNNN Latitude in decimal degrees
4 ND – TYPE 2
N3 0 1 2 3 4 10 11 12 13 14 15 16 17 20 21 22 23 24 25 26 27
Node type Standard node Junction (motor way exit) Intersection (motor way junction) Border note Directional information; only in connection whit type 1 roads. The type for town districts expresses the importance of the item. The following parameters influence the importance; a capital is always type 10 a number of inhabitants. Basic scale as follows; large city > 500,000 medium city > 100,000 small city > 50,000 town > 20,000 village > 5,000 small village > 1,000 tiny village < 1,000 postal code area within city large town district with specific number town district > 100,000 town district > 50,000 town district > 20,000 town district > 5,000 town district > 1,000 town district < 1,000 a town or village is upgraded (one or two types) if it is a national or regional centre. A village type 17 upgraded to 16 if it has an individual postal code. A village (type 16 or 17) is upgraded (one type) if it is of touristic importance. In this way we can guarantee that each level contains a well – balanced number of towns or villages with a more or less equal importance.
30 Railway station

Contract nr. ST-96-SC.1018
Final Report November 1999
University of Antwerp - RUCA
Universidade Nova de Lisboa
University of Piraeus
104
36 40 41 42 43 46 47 48 50 51 52 53 54 55 56 57 58 59 60 71
Car/train terminal (passengers vehicles) Airport Large international airport Medium international airport Small international airport Large national airport Medium national airport Small national airport Cluster terminal cargo transport Terminal road/rail cargo transport Terminal road/inland waterway cargo transport Terminal road/sea cargo transport Terminal road/inland/rail cargo transport Terminal road/rail/sea cargo transport Terminal road/inland waterway/sea cargo transport Terminal road/rail/inland waterway/sea cargo transport Lock (inland waterway) Lift for ships (inland waterway) Industrial area: area used by companies for industrial or other non – agricultural purposes. The Government agrees upon this usage. Ferry coding point
5 ND _ NATION N3 NNN Nation code (table is available; country . txt) 6 ND _ LEVEL N3 NNN Connection level
The connection level of a node equals the level of the road on which it is situated (see LINK FILE * SGM)
7 ND _ DELETED L 1 For backward compability (0) 8 ND _ ZIP C10 Text Postal code 9 ND _ NAME C60 Text Name 10 ND _ NAME PREFIX C10 Text Name prefix, e.g. “la” 11 ND _ NAME SUFFIX C20 Text Name suffix, e.g. “bei Wien” or “plage” 12 ND _ NAME COMP
C2 Text Compass direction (N,S,E,NE etc.) of ND _
NAME 13 ND _ CODE C18
WWW XXXX YYYY NNNN WWW XXXX YYYY NNNN
Unique terminal code comprising of: Country code (list of codes available; ISO – country . txt) Town Terminal name Number for exact location (e.g. NDL.ROTT.ECDS., 0000, list of codes available; terminal code txt) In case of more then 1 terminal in a town the code for a cluster is (list available; terminal – code. Txt): Country code (list of codes available; ISO – country .txt) Town Code for cluster of terminals Number for exact location
14 ND _ PROV N3 NNN Province code (table is available; prov.txt) 15 ND _ UN _ PROV L 1 Flag if province code is needed to make ND _
NAME unique

Contract nr. ST-96-SC.1018
Final Report November 1999
University of Antwerp - RUCA
Universidade Nova de Lisboa
University of Piraeus
105
16 ND _ UN _ CITY C60 Text City name to make ND _ NAME unique 17 ND _ UN _ CITY _ PREFIX C10 Text Prefix for ND _ UN _ CITY 18 ND _ UN _ CITY _ SUFFIX C20 Text Suffix for ND _ UN _ CITY 19 ND _ UN _ CITY _ PROV N3 NNN Province code to make ND _ UN _ CITY unique 20 ND _ UN _ CITY _ COMP C2 Text Compass direction relative to ND _ UN _ CITY to
make ND _ NAME unique 21 ND _ CONURB C60 Text Name of conurbation to which suburb or town
district belongs 22 ND _ CONURB _ PREFIX C10 Text Prefix for ND _ CONURB 23 ND _ CONURB _ SUFFIC C20 Text Suffix for ND _ CONURB 24 ND _ CONURB _ UN _
PROV N3 NNN Province code to make ND _ CONURB unique
25 ND _ ID _ PERMANENT N10 NNNNNNNNNN Permanent node ID, internal AND 26 ND _ DBLINK C60 TD#NNNNNN
TD#NNNNNN TD#NNNNNN
Internal code for connection to services database TD = transport data, “t” is terminal, “c” is cluster, “f” is ferry coding Point, NNNNN is number
27 ND _ OTHER C60 Stp = r9999 Stp = i9999 Stp = s9999 Stp = c9999
This field can contain the permanent ID’s of points to describe transport routes Points along railways Points along inland railways Points along sea links Points along sea + inland waterways
Link File (*.SGM)
Nr. Field Format Id Description
1 RD _ ID _ FROM N8 NNNNNNNNN ND _ ID of start of link 2 RD _ ID _ TO N8 NNNNNNNNN ND _ ID of end of link 3 RD _ LINGTH N5 NNNN Road length in hectometres 4 RD _ DIRECTION N1
0 1 2
Direction for one – way connections: Both From – to To – from
1 2 3 4 5 6 7 8 9 10 11 12 21 22
Road type: Motor way Federal highway dual carriage way Federal highway Regional road Local road Other road Ferry (passengers and cargo) Ferry (cargo only) Ferry (train) Sea link Sea link + inland waterway type 21 Sea link + inland waterway type 22 Inland waterway, ships with length > 95m, width > 11.50 m, depth > 2.70 m, height > 6.70m Inland waterway ships with length >95m,

Contract nr. ST-96-SC.1018
Final Report November 1999
University of Antwerp - RUCA
Universidade Nova de Lisboa
University of Piraeus
106
23 24 31 32 33 50 51 52 53 58 59
width > 11.50 m, depth > 2.70m, height <6.70m Inland waterway ships with length > 80m, width >9.50m, depth < 2.50 m, height > 3.95 m Railway passenger transport Railway freight transport Railway passenger and freight transport Connection between terminal and road Connection between terminal and sea link Connection between terminal and inland waterway Connection between terminal and railway Walking connection between railway stationsVirtual connection between non – connected networks
6 RD _ NATION N3 NNN Nation code 7 RD _ LEVEL N3
0 1 2 3 4 5
Connection level: The connection level of a road expresses the importance of that road. The general classification is as follows: All E – roads in Europe (not seamless) E _ roads and important national roads in such a way that all type 10 to 13 locations are connected. Scale ~ 1: 2.000.000 All main roads (on maps usually motor ways and red roads) with secondary roads in such a way that all type 10 to 14 locations are connected. All through roads in such a way that all type 10 to 15 locations are connected. Scale ~1: 750.000 All through and local roads in such a way that all type 10 to 16 and 20 to 26 locations are connected. Every postal code occurs at least once on this level. All roads Scale > 1: 400.000
8 RD _ DELETED L 1 For backward compatibility (0) 9 RD _ SLOW C1
C Slow road type City road
10 RD _ NAME C60 Text Road name (not a code) 11 RD _ CODE NAT1 C12 Text National road code 12 RD _ CODE _ NAT2 C12 Text National road code 13 RD_ CODE _ NAT3 C12 Text National road code 14 RD _ CODE _ INT1 C12 Text International road code 15 RD _ CODE _ INT2 C12 Text International road code 16 RD _ CODE _ INT3 C12 Text International road code 17 RD_ TUNNEL L 1 18 RD _ TOLL L 1 19 RD _ TIME N5 NNNN Duration time in minutes (ferries) 20 RD _ FLOOR N1 N Road “floor”, level of a fly – over (0,1,2…)

Contract nr. ST-96-SC.1018
Final Report November 1999
University of Antwerp - RUCA
Universidade Nova de Lisboa
University of Piraeus
107
21 RD _ TONNAGE N2 3 28 40
Tonnage (whole metric tonnes), possible entries: Accessible for vehicles of less then 3.5 metric tons Accessible for vehicles of less or equal then 28 metric tons Accessible for vehicle of less or equal then 40 metric tons
22 RD _OTHER C60 Toll – cargo Toll for freight vehicles
Intermediate File (*.INT)
Nr. Field Format Id Description
1 INT – ID – FROM N6 NNNNNN ND – ID of start of link 2 INT – ID – TO N6 NNNNNN ND – ID of end of link 3 INT – XLONG1 N9 NNNNNNNNN Longitude in decimal degrees 4 INT – YLAT2 N9 NNNNNNNNN Latitude in decimal degrees 5 INT – XLONGN N9 NNNNNNNNN Longitude in decimal degrees 6 INT – YLAT2 N9 NNNNNNNNN Latitude in decimal degrees 2N+1 INT – XLONGN N9 NNNNNNNNN Longitude in decimal degrees 2N+2 INT – XLONGN N9 NNNNNNNNN Latitude in decimal degrees
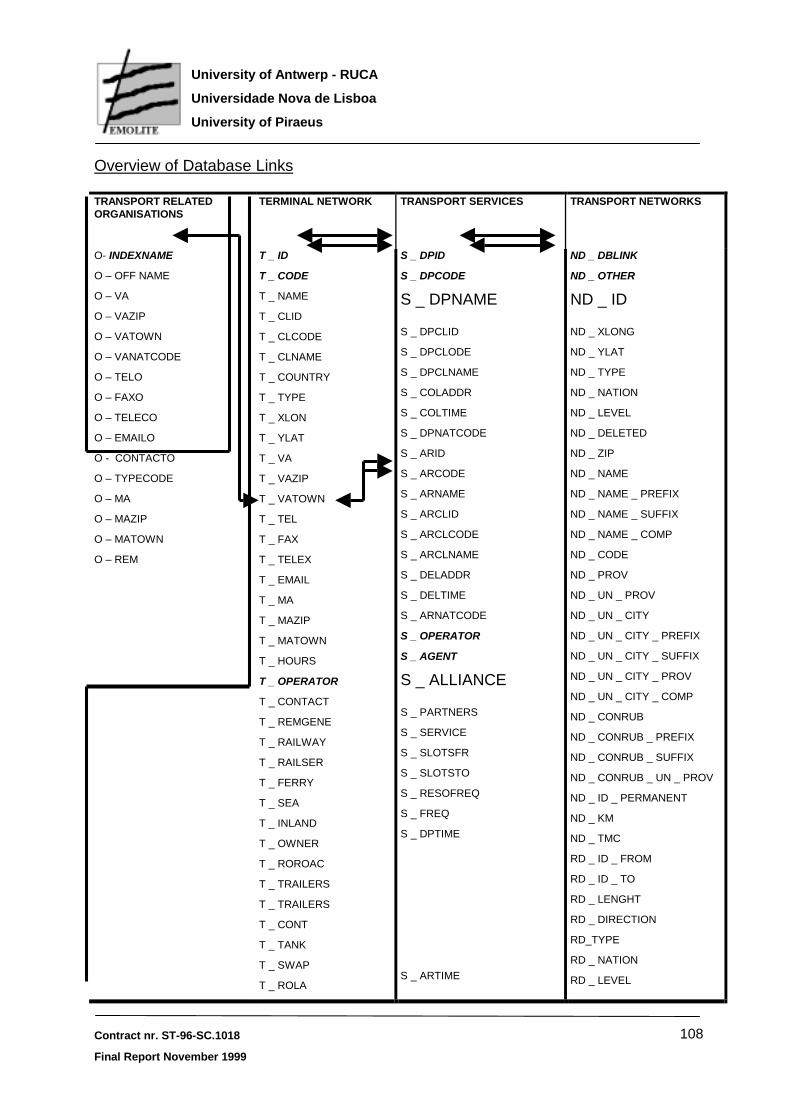
Contract nr. ST-96-SC.1018
Final Report November 1999
University of Antwerp - RUCA
Universidade Nova de Lisboa
University of Piraeus
108
Overview of Database Links
TRANSPORT RELATED ORGANISATIONS
TERMINAL NETWORK TRANSPORT SERVICES TRANSPORT NETWORKS
O- INDEXNAME
O – OFF NAME
O – VA
O – VAZIP
O – VATOWN
O – VANATCODE
O – TELO
O – FAXO
O – TELECO
O – EMAILO
O - CONTACTO
O – TYPECODE
O – MA
O – MAZIP
O – MATOWN
O – REM
T _ ID
T _ CODE
T _ NAME
T _ CLID
T _ CLCODE
T _ CLNAME
T _ COUNTRY
T _ TYPE
T _ XLON
T _ YLAT
T _ VA
T _ VAZIP
T _ VATOWN
T _ TEL
T _ FAX
T _ TELEX
T _ EMAIL
T _ MA
T _ MAZIP
T _ MATOWN
T _ HOURS
T _ OPERATOR
T _ CONTACT
T _ REMGENE
T _ RAILWAY
T _ RAILSER
T _ FERRY
T _ SEA
T _ INLAND
T _ OWNER
T _ ROROAC
T _ TRAILERS
T _ TRAILERS
T _ CONT
T _ TANK
T _ SWAP
T _ ROLA
S _ DPID
S _ DPCODE
S _ DPNAME
S _ DPCLID
S _ DPCLODE
S _ DPCLNAME
S _ COLADDR
S _ COLTIME
S _ DPNATCODE
S _ ARID
S _ ARCODE
S _ ARNAME
S _ ARCLID
S _ ARCLCODE
S _ ARCLNAME
S _ DELADDR
S _ DELTIME
S _ ARNATCODE
S _ OPERATOR
S _ AGENT
S _ ALLIANCE
S _ PARTNERS
S _ SERVICE
S _ SLOTSFR
S _ SLOTSTO
S _ RESOFREQ
S _ FREQ
S _ DPTIME
S _ ARTIME
ND _ DBLINK
ND _ OTHER
ND _ ID
ND _ XLONG
ND _ YLAT
ND _ TYPE
ND _ NATION
ND _ LEVEL
ND _ DELETED
ND _ ZIP
ND _ NAME
ND _ NAME _ PREFIX
ND _ NAME _ SUFFIX
ND _ NAME _ COMP
ND _ CODE
ND _ PROV
ND _ UN _ PROV
ND _ UN _ CITY
ND _ UN _ CITY _ PREFIX
ND _ UN _ CITY _ SUFFIX
ND _ UN _ CITY _ PROV
ND _ UN _ CITY _ COMP
ND _ CONRUB
ND _ CONRUB _ PREFIX
ND _ CONRUB _ SUFFIX
ND _ CONRUB _ UN _ PROV
ND _ ID _ PERMANENT
ND _ KM
ND _ TMC
RD _ ID _ FROM
RD _ ID _ TO
RD _ LENGHT
RD _ DIRECTION
RD_TYPE
RD _ NATION
RD _ LEVEL

Contract nr. ST-96-SC.1018
Final Report November 1999
University of Antwerp - RUCA
Universidade Nova de Lisboa
University of Piraeus
109
T_STRANUM
T_ STRACAP
T _ RFSLOTS
T _ REACNUM
T _ REACCAP
T _ FORKNUM
T _ FORKCAP
T _ GROUNDEQ
T _ TRACTORS
T _ REMEQUI
T _ SECUR
T _ CUSTOMS
T _ BANK
T _ CATERING
T _ STRIPSTU
T _ REFUEL
T _ ADSERV
T _ REMSERV
T _ REMMODE
T _COGANUM
T _ COGACAP
T _ MOCRCAP
T _ QUCRNUM
T _ QUCRCAP
T _ AGVNUM
T _ AGVCAP
T _ YAGANUM
T _ YAGACAP
T _ RENTUNI
T _ REPAIR
T _ RENTCHA
T _ DEPUNIT
T _ STORAGE
T _ DEPCHAS
T _ CLEANING
T _ TRUCKING
T _ REFSERV
T _ DANSERV
S _ RESOUDURA
S _ ITIME
S _ FREQDAY
S _ MODE
S _ DISTANCE
S _ METRTONS
S _ CONT
S _ SWAP
S _ TRAI
S _ ROROAC
S _ ROROUN
S _ ROLA
S _ PPRO250
S _ PPRO260
S _ CPRO250
S _ CPRO260
S _ RAILWAY
S _ REM
RD _ DELETED
RD _ SLOW
RD _ NAME
RD _ CODE _ NAT1
RD _ CODE _ NAT2
RD _ CODE _ NAT3
RD _ CODE _ INT1
RD _ CODE _ INT2
RD _ CODE _ INT 3
RD _ TUNNEL
RD _ TOLL
RD _ TIME
RD _ FLOOR
RD _ TONNAGE
RD _ TOLL _ CARGO
RD _ OTHER
INT _ ID _ FROM
INT _ ID _ TO
INT _ XLONG1
INT _ YLAT1
INT _ XLONG2
INT _ YLAT2
INT _ XLONGN
INT _ YLATN
9.3 Transport Network
Ferry Network
Field 13, ND – CODE form above VRT – file contains Ferry information as well as
following fields from the SGM – file: 3, RD – LENGHT / 4, RD – DIRECTION / 5 , RD
_ TYPE / 10, RD _ NAME / 19, RD _ TIME / 21, RD _ TONNAGE / 22,RD _ OTHER.
Railway Network
Terminals with a rail – connection are described in field 4 of the VRT – file. These
are linked to the Railway Network described in field 5, RD – TYPE of the SGM – file.

Contract nr. ST-96-SC.1018
Final Report November 1999
University of Antwerp - RUCA
Universidade Nova de Lisboa
University of Piraeus
110
Inland Waterway Network
Terminals with a river or canal connection are described in field 4 of the VRT – file.
These are linked with the inland waterway network described in field 5, RD _ TYPE
of the SGM – file.
Sea Network
The Sea Network is described in field 5, RD – TYPE of the SGM – file.
Terminal Network
The VRT file contains 3 fields with terminal information: 4, ND _ TYPE / 9, ND _
NAME and 13, ND – CODE.
Field 13 of the VRT – file is linked to field 1 of the Terminal Network. Field number 1
is the unique ID for terminals and the key field to the other Transport Networks. A
complete overview of the Terminal Network Format is given hereafter:
Terminal Network (*. TER)
Nr Field Format Id Description 1 T _ID C20 Td#t NNNNN
TD#c NNNNN TD#f NNNNN
Internal code for connection to GIS – database TD = transport data, “t” is terminal, “c” is cluster, “f” is ferry coding point, NNNNN Is number
2 T – CODE C18 WWW. XXXX. YYYY. NNNN.
Unique code of terminal comprising of: Country code (list of codes available; ISO – country. Txt) Town Terminal name Exact location (e.g. NLD.ROTT.ECDS.0000, list of codes available; terminal – code. Txt)
3 T – NAME C60 Text Unique index name of terminal 4 T _ CLID C20 TD#tNNNNN
TD#cNNNNN TD#fNNNNN
Internal code for connection of cluster of terminals to GIS – database TD = transport data, “t” is terminal, “c” is cluster, “f” is ferry coding point, NNNN Is number
5 T – CLCODE C18 WWW. XXXX. CLUS. 0000
When there is more than one terminal in a city it is possible to generalise the services of rail, inland waterway and sea to a cluster. This cluster has a unique code Comprising of Country code (list of codes available; ISO – country . txt) Town Code for cluster Code for location (e.g. NLD.ROTT.CLUS.0000 for Rotterdam, lsit of codes and

Contract nr. ST-96-SC.1018
Final Report November 1999
University of Antwerp - RUCA
Universidade Nova de Lisboa
University of Piraeus
111
names of clusters available; terminal – code.txt). Note: when there is only one terminal in a city the cluster code is the same as the terminal code.
6 T – CLNAME C60 Text Unique index name of a cluster 7 T – COUNTRY C3 Text ISO 3 digit country name (list of names available) 8 T – TYPE N2 50
51 52 53 54 55 56 57
Cluster (virtual point, representing different terminals in an specific area) Road / rail Road / inland waterway Road / sea Road / rail / inland waterway Road / rail/ sea Road / inland waterway / sea Road / rail / inland waterway / sea
9 T _ XLON N4.6 NNNN.NNNNNN Longitude in degrees with 6 decimals 10 T – YLAT N3.6 NNN.NNNNNN Latitude in degrees with 6 decimals 11 T – VA C60 Text Visitors address 12 T _ VAZIP C10 ZIP – code Visitors address town or village name 13 T_ VATOWN C60 Text Mail address 14 T _ MA C60 Text 15 T _ MAZIP C20 ZIP _ code Mail address ZIP – code / postcode 16 T – MATOWN C60 Text Mail address town or village name 17 T – TEL C20
+ N or NN or NNN - NNNN…N
International telephone number of office for general information, comprising of: + country code hyphen region code + individual telephone number
18 T – FAX C20 + N or NN or NNN - NNNN …N
International fax number for general information, comprising of: + country code hyphen region code + individual telephone number
19 T – TELEX C20 NNNN …N International telex number for general information 20 T – MAIL C60 Text E – mail number for general information 21 T _ HOURS C60 Text Business hours of the terminal 22 T _ OPERATOR C60 Text Name of operator(s) 23 T _ CONTACT C60 Text Name of external affairs official or operational official 24 T_ REMGENE C60 Text Other important information
Information on served modes and loading units
Nr Field Format Id Description 25 T _ RAILWAY C60 Text Names of railway haulage companies with to, from or on
the terminal. 26 T _ RAILSER C60 Text Names of railway operators with services from this
terminal 27 T _ FERRY C60 Text Names of ferry operators handlers 28 T _ SEA C60 Text Names of sea operators handlers 29 T _ INLAND C60 Text Names of inland barge operators handlers 30 T _ OWNER C60 Text Name(s) of terminal owner(s) 31 T _ CONT L 1 Accepts containers 32 T _TANK L 1 Accepts tankcontainers 33 T _ SWAP L 1 Accepts swap – bodies 34 T _ TRAILERS L 1 Accepts semi – trailers 35 T _ ROROAC L 1 Accepts drive accompanied ro / ro transport of semi –
trailers 36 T _ROROUN L 1 Accepts drive unaccompanied ro / ro transport of semi –
trailers

Contract nr. ST-96-SC.1018
Final Report November 1999
University of Antwerp - RUCA
Universidade Nova de Lisboa
University of Piraeus
112
37 T _ROLA L 1 Accepts Rollende Landstrasse 38 T _ REMMODE C60 Text Other important information
Information on terminal equipment
Nr Field Format Id Description 39 T _ COGANUM N2 NN Number of container gantries ship – to – shore) 40 T _ COGACAP N4.1 NNNN.N Maximum lifting capacity of container gantries in
metric tons 41 T _ MOCRNUM N2 NN Number of mobile cranes 42 T _ MOCRCAP N4.1 NNNN.N Maximum lifting capacity of mobile cranes in metric
tons 43 T _ QUCRNUM N2 NN Number of quay cranes 44 T _ AGVNUM N4.1 NNNN.N Maximum lifting capacity of quay cranes in metric
tons 45 T _ AGVCAP N2 NN Number of AGV’s 46 T _ YAGANUM N4.1 NNNN.N Maximum lifting capacity AGV’s in metric tons 47 T _ YAGACAP N2 NN Number of yard gantries 48 T _YAGANUM N4.1 NNNN.N Maximum lifting capacity of yard gantries in metric
tons 49 T _ STRANUM N2 NN Number of straddle carriers 50 T – STRACAP N4.1 NNNN.N Maximum lifting capacity of straddle carriers in
metric tons 51 T _ REACNUM N2 NN Number of reach stackers 52 T _ REACCAP N4.1 NNNN.N Maximum lifting capacity of reach stackers in
metric tons 53 T _ FORKNUM N2 NN Number of forklift trucks 54 T _ FORKCAP N4.1 NNNN.N Maximum lifting capacity of forklift trucks in metric
trucks 55 T _ GROUNDEQ C60 Text Number of and measurements of yard chassis and
trailers 56 T _ RFSLOTS N3 NNN Number of reefer slots 57 T _ TRACTORS N2 NN Number of yard tractors 58 T _ REMEQUI C60 Text Other important information concerning equipment
(e.g. voltage on reefer sots, specification of other terminal equipment)
Information on additional services on or near the terminal
Nr Field Format Id Description 59 T _ SECUR L 1 Security 60 T _ CUSTOMS L 1 Customs 61 T _ BANK L 1 Bank 62 T _ CATERING L 1 Catering 63 T _ STRIPTSU L 1 Stripping and stuffing of containers 64 T _ RENTUNI L 1 Rental of loading units 65 T _ REPAIR L 1 Repair of loading units 66 T _ RENTCHA L 1 Rental of chassis 67 T _ DEPUNIT L 1 Depot of units 68 T _ STORAGE L 1 Storage of units

Contract nr. ST-96-SC.1018
Final Report November 1999
University of Antwerp - RUCA
Universidade Nova de Lisboa
University of Piraeus
113
69 T _ DEPCHAS L 1 Depot of chassis 70 T _ CLEANING L 1 Cleaning of loading units 71 T _ TRUCKING L 1 Trucking 72 T _ REFSERV L 1 Reefer services 73 T _ DANSERV L 1 Dangerous cargo services 74 T _ REFUEL L 1 Refuelling services 75 T _ ADSERV L 1 Administrative services 76 T _ REMSERV C60 text Other important information concerning services of the
terminal
Transport services
The Ferry services can be linked to the Ferry Network via the terminal code S_DPID
in field 1. Railway Services, Inland waterway Services and Sea Services and Sea
Services files can be lined to the Terminal Network via the terminal code
S_DPCODE in field 2. The services files contain information connected to the
terminals of departure.
Services File (*.Ser)
Nr Field Format Id Description
1 S _ DPID C20 TD#tNNNN
TD#fNNNN
Internal code for connection to GIS – database
TD = transport data, “t” = ferry coding point,
NNNNNN = number
Note: this field is the key field to link to the Transport networks
2 S _ DPCODE C18
WWW.
XXXX..
YYYY.
NNNN
Unique code of terminal services which a certain service departs,
Comprising of:
Country code (list of codes available; ISO – country. txt)
Town
Terminal name
Exact location (e.g. NLD.ROTT.ECDS.0000, list of codes: terminal – code.txt)
3 S _ DPNAME C60 text Geographical name of location (terminal) form which service departs
(e.g. Rotterdam – ECT Delta / Sea – Land Terminal)
4 S _ DPCLID C20 TD#tNNNN
TD#cNNNN
Internal code for connection to GIS – database
TD = transport data, “t” = terminal, “f” = ferry coding point, “c”

Contract nr. ST-96-SC.1018
Final Report November 1999
University of Antwerp - RUCA
Universidade Nova de Lisboa
University of Piraeus
114
Idc-TD#fNNNN = cluster, NNNNNN = number
5 S _ DPCLCODE C18
WWW.
XXXX.
CLUS.
0000
When there is more than one terminal in a city it is possible to group the rail, inland waterway and sea services into a cluster. This cluster of departure has a code comprising of:
Country code (list of codes available; ISO – country.txt.)
Town
Code for cluster
Code for location
(e.g. NLD.ROTT.CLUS.0000 ofr Rotterdam , list of codes and names of cluster available; terminal – code.txt.).
note: when there is only one terminal in a city the cluster code is the same as the terminal code.
6 S _ DPCLNAME C60 Text Unique index name of a cluster of departure
7 S_ COLADDR C60 Text For later use: collection address if location is ot the same as S _ DPNAME (field 3)
8 S _ COLTIME C5 Time Ultimate time stated between 00:00 and 23.59 hours at which cargo must have arrived at collection address for further transportation by “Service” (local time)
9 S _ DPNATCODE C3 text ISO – country code in three digits, country of departure (e.g. Germany = DUE, list of codes available; ISO – country. txt)
10 S _ ARID C20 TD#tNNNN
TD#fNNNN
Internal code for connection GIS – database.
TD = transport data, “t” = terminal, “f” ferry coding point, NNNNNN = number
11 S _ ARCODE C18
WWW.
XXXX.
YYYY.
NNNN
Unique code of terminal of arrival, comprising of:
Country code (list of codes available; ISO – country.txt)
Town
Terminal name
Exact location
(e.g. NLD.ROTT.ECDS.0000, list of codes: terminal – code.txt)
12 S _ ARNAME C60 text Geographical name of location (terminal) at which service arrives (e.g. Rotterdam – ECT Delta / Sea – Land Terminal)
13 S _ ARCLID C20 TD#TNNN
TD#cNNN
TD#fNNN
Internal code for connection GIS – database
TD = transport data, “t” = terminal, “c” = cluster. “f” = ferry
Coding point, NNNNNN = number
14 S _ ARCLCODE C18
WWW.
Unique cluster code of arrival comprising of:
Country code (list of codes available; ISO – country.txt)

Contract nr. ST-96-SC.1018
Final Report November 1999
University of Antwerp - RUCA
Universidade Nova de Lisboa
University of Piraeus
115
XXXX.
CLUS.
0000
Town
Code for cluster
Code for location (e.g. NLD.ROTT.CLUS.0000 for Rotterdam, list of codes and names of cluster available; terminal- code.txt).
Note: when there is only one terminal in a city the cluster code is the same as the terminal code.
15 S _ ARCLNAME C60 text Geographical name of cluster (terminal) at which service arrives
16 S _ DELADDR C60 Text For later use: collection address if location is not the same as S _ ARNAME (field 12)
17 S _ DELTIME C5 time Ultimate time stated between 00:00 and 23:59 hours at which cargo can be taken after arrival at destination terminal (local time)
18 S _ ARNATCODE C3 Text ISO – country code in three digits, country of arrival (e.g. Germany = DUE, list of codes available; ISO country.txt)
19 S _ OPERATOR C60 text Name operator (e.g. P&O Nedloyd, Ukrainian), file with names and descriptions of operators see &2.3
20 S _ AGENT C60 text Representative office in / near location of departure or arrival, file with names and descriptions of agents see&2.3
21 S _ ALLIANCE C60 text Name alliance (e.g. Global Alliance, ASA, Penta)
22 S _ PARTNERS C60 Name of co-operative operator within alliance or service
23 S _ SERVICE C60 Particular name for service between a number of locations either;: routing of regions (e.g. Mediterranean / US west Coast,or given name (e.g. China Express, WECON)
24 S _ SLOTSFR C60 Name of colleague operator from which space is taken
25 S _ SLOTSTO C60 Name of colleague operator to whom space is granted
26 S _ REOFREQ C60 Relevant time – units: months, weeks, days, day, hour
72 S _ FREQ C10 Amount of departure within time units of field 26
28 S _ DPTIME C18
Moment of departure, stated between 00:00 and 23:59 hours (local time)
29 S _ ARTIME C5
Moment arrival, stated between 00:00 hours and 23:59 hours (local time)
30 S _ RESODURA C5 Relevant time units: minutes, days, hours
31 S _ TTIME N2
Duration of specific transport form A to B, stated in time units of field 30
32 S _ FREQDAY C10 1 = Monday, 2 = Tuesday, 3 = Wednesday, 4 = Thursday, 5 = Friday, 6 = Saturday, 7 = Sunday
33 S _ MODE C2 Transportation category:
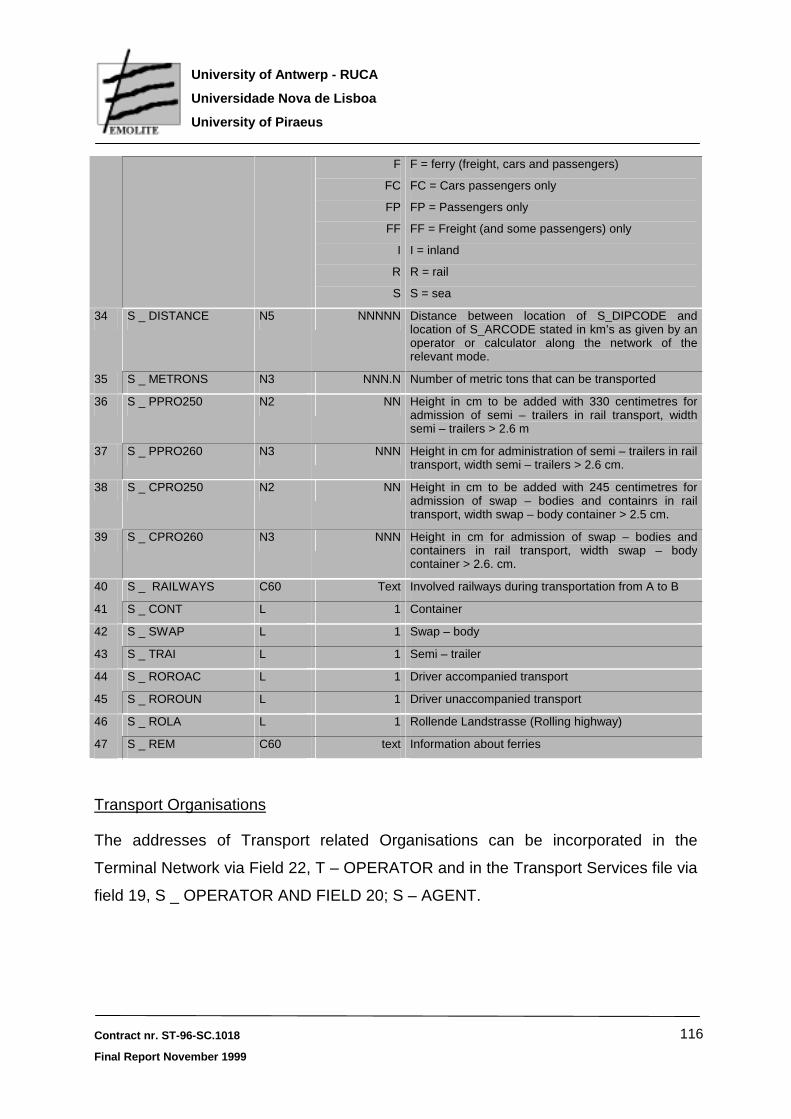
Contract nr. ST-96-SC.1018
Final Report November 1999
University of Antwerp - RUCA
Universidade Nova de Lisboa
University of Piraeus
116
F
FC
FP
FF
I
R
S
F = ferry (freight, cars and passengers)
FC = Cars passengers only
FP = Passengers only
FF = Freight (and some passengers) only
I = inland
R = rail
S = sea
34 S _ DISTANCE N5 NNNNN Distance between location of S_DIPCODE and location of S_ARCODE stated in km’s as given by an operator or calculator along the network of the relevant mode.
35 S _ METRONS N3 NNN.N Number of metric tons that can be transported
36 S _ PPRO250 N2 NN Height in cm to be added with 330 centimetres for admission of semi – trailers in rail transport, width semi – trailers > 2.6 m
37 S _ PPRO260 N3 NNN Height in cm for administration of semi – trailers in rail transport, width semi – trailers > 2.6 cm.
38 S _ CPRO250 N2 NN Height in cm to be added with 245 centimetres for admission of swap – bodies and containrs in rail transport, width swap – body container > 2.5 cm.
39 S _ CPRO260 N3 NNN Height in cm for admission of swap – bodies and containers in rail transport, width swap – body container > 2.6. cm.
40 S _ RAILWAYS C60 Text Involved railways during transportation from A to B
41 S _ CONT L 1 Container
42 S _ SWAP L 1 Swap – body
43 S _ TRAI L 1 Semi – trailer
44 S _ ROROAC L 1 Driver accompanied transport
45 S _ ROROUN L 1 Driver unaccompanied transport
46 S _ ROLA L 1 Rollende Landstrasse (Rolling highway)
47 S _ REM C60 text Information about ferries
Transport Organisations
The addresses of Transport related Organisations can be incorporated in the
Terminal Network via Field 22, T – OPERATOR and in the Transport Services file via
field 19, S _ OPERATOR AND FIELD 20; S – AGENT.

Contract nr. ST-96-SC.1018
Final Report November 1999
University of Antwerp - RUCA
Universidade Nova de Lisboa
University of Piraeus
117
Organisation File (*Org).
No Field Format Id Description
1 O_INDEXNAME C60 Text Index name of organisation, this is key field to field “T – OPERATOR” in terminal file (*TER), fields “S _ OPERATOR” and “S _ AGENT” in services file (*.SER)
2 O _ OFF _ NAME C60 Text Official name or organisation
3 O _ VA C60 Text Visitors address
4 O _ VAZIP C20 ZIP – code Visitors address, ZIP – code / Post Code
5 O _ VATOWN C60 Text Visitors address, town or village name
6 O _ VANATCODE C3 Text ISO 3 digit abbreviation of country name (list of names available)
7 O _ TELO C20
+
N or NN or NNN
-
NNNN…N
International telephone number for general information,
Comprising of:
+
country code
hyphen
region code + individual telephone number
8 O _ FAXO C20
+
N or NN or NNN
-
NNNN…N
International fax number for general information, comprising of:
+
country code
hyphen
region code + individual telephone number
9 O _ EMAILO C60 Text E – mail number for general information
10 O _ CONTACTO C60 Text Name of external affairs official or operational official
11 O _ TELEX C20 NNNN…N International telex number for general information
12 O _ TYPECODEO N3
1
2
3
4
5
6
7
Type of organisation:
Agent / groupage / nvocc
Barge operator
Ferry operator
Forwarder
Groupage / nvocc
Network operator
Road hauliers

Contract nr. ST-96-SC.1018
Final Report November 1999
University of Antwerp - RUCA
Universidade Nova de Lisboa
University of Piraeus
118
8
9
10
11
12
Rail operator
Railway company
Ship operator
Shipping agent
Terminal operator
Nvocc: non vessel ocean common carrier: party who undertakes to carry goods issues in his own name a Bill of cargo, without having the availability of any own means of transport (taken from having the availability of any own means of transport (taken from operators).
13 O _ MA C60 Text Mail address
14 O _ MAZIP C20 ZIP – code Mail address, ZIP – code / Post code
15 O _ MATOWN C60 Text Mail address; town or village name
16 O _ MANATCODE C3 Text ISO 3 digit abbreviation of country name (list of names available)
17 O _ REM C60 Text Remarks, other important information

Contract nr. ST-96-SC.1018
Final Report November 1999
University of Antwerp - RUCA
Universidade Nova de Lisboa
University of Piraeus
119
10 Annex 3: additional technical information
10.1 The approach used to develop the project
The problem domain was studied using the standard UML (Unified Modeling
Language) approach. First we identified actors and use cases, then built the use
case diagram (see figure 24).
Figure 24. Use case model
EMOLITE System
End User
New Project
Use Project
Set SimulationParameters
«uses»
«uses»
Run Simulation
Access Data
«uses»
Set Data Parameters
«uses»
Save Project
End User
External DB
Promethee Model
GIS System
The use case model shows the system boundaries, demonstrates how actors
communicate with use cases and relates use cases between each other.
Contract nr. ST-96-SC.1018
Final Report November 1999
University of Antwerp - RUCA
Universidade Nova de Lisboa
University of Piraeus
120
10.2 Fuzzy an crisp approach
Attributes represent a common property of a collection of alternatives pertaining to a
class. Objects are elements of attributes that can be crisp or fuzzy and, if fuzzy,
discrete or continuous. Fuzzy attributes and respective linguistic labels are
associated with a specified universe of discourse, which defines the problem space.
For example, height and weight are attributes of John, Peter, Philip etc.
There are two types of attributes in EMOLITE, notably “crisp” and “fuzzy”. For
instance sex is a crisp attribute, which can take discrete values female or male. A
fuzzy attribute is for instance height which could take values on universe [ 0, 2.5]
meters and be divided into linguistic fuzzy subsets short, average and tall. Fuzzy
attributes are linguistic variables {Zadeh, 1983}; {Zadeh, 1987}, where the values
(here designated fuzzy objects) are linguistic rather than numerical.
In more formal terms, a linguistic variable X is characterised by a quadruple (X, T(X),
U, F) where:
X is the name of the attribute, e.g. height;
T(X) is a collection of the fuzzy objects e.g. T(X) = {short, average, tall};
U is the universe of discourse e.g. U = {0, 0.4, ... ,2.5 meters};
F is a semantic rule which associates each fuzzy object x of T(X) with a possibility or
probability distribution F(x) in U, depicting the degree of each value of U belonging to
the fuzzy object x, expressed as µx(u) -> [ 0, 1], e.g. µshort (1.4) = 0.7.
The rationale for using linguistic variables is that it is quite difficult to classify
quantitatively, alternatives in a fuzzy multiple attribute problem. The attributes are
used both as features to describe properties and as criteria for alternatives which,
themselves, are the elements (objects) of classes. As an illustration, it is quite
difficult to say an exact height for a person, as for example 1.8m, while to say it is
tall is more “common sense” knowledge. Note that linguistic variables are an efficient
way to express ambiguous concepts and an integrate part of approximate reasoning
{Zadeh, 1979} {Baldwin, 1979}.

Contract nr. ST-96-SC.1018
Final Report November 1999
University of Antwerp - RUCA
Universidade Nova de Lisboa
University of Piraeus
121
Examples of each possible type of attributes are:
�� attribute fuzzy continuous unions (bad, average, good) �� attribute fuzzy continuous gate-cost (low, medium, high) �� attribute fuzzy continuous price (low, medium, expensive) �� attribute fuzzy discrete social-status {‘A’, ‘B’, ‘C’, ‘D’}
Formally, the mathematical trapezoidal and triangular distribution for continuous
fuzzy sets, independently of the range distributions, are:
Tr iangular x : αααα ====, σσσσ====, ββββ====(= )=
======== 0 for ββββ====≤≤≤≤====x ≤≤≤≤====αααα ====
======== x −−−−====αααα ====αααα ====
for αααα ====≤≤≤≤====x ≤≤≤≤====σσσσ====
======== ββββ====−−−−====x αααα ====
for σσσσ====≤≤≤≤====x ≤≤≤≤====ββββ====
======== 1 for x ========σσσσ====
====
====
========
�=�=�=�=
========
where parameters c 1 ========αααα ====++++====σσσσ====2
and c 2 ========αααα ====++++====ββββ====2
are cross - over points .
Trapezoidal x : αααα ====, ρρρρ====, σσσσ====, ββββ====(= )=
======== 0 for ββββ====≤≤≤≤====x ≤≤≤≤====αααα ============ 1 for ρρρρ====≤≤≤≤====x ≤≤≤≤====σσσσ====
======== x −−−−====αααα ====αααα ====
for αααα ====≤≤≤≤====x ≤≤≤≤====ρρρρ====
======== ββββ====−−−−====x αααα ====
for ρρρρ====≤≤≤≤====x ≤≤≤≤====ββββ====
====
====
========
�=�=�=�=
========
Where parameters c 1========ββββ====−−−−====σσσσ====2
and c 2========ρρρρ====−−−−====αααα ====2
are simetric cross - over points ,
and ββββ====−−−−====σσσσ====(= )========= σσσσ====−−−−====ρρρρ====(= )========= ρρρρ====−−−−====αααα ====(= )= on interval αααα ====, ββββ====[= ]=. Note: When ρρρρ============σσσσ==== the distribution is triangular.

Contract nr. ST-96-SC.1018
Final Report November 1999
University of Antwerp - RUCA
Universidade Nova de Lisboa
University of Piraeus
122
Specifically, the algorithms for the automatic calculation of triangular or trapezoidal
distributions “by attribute” range, using middle point values (MPV) are:
• = Triangles MPV = (upper lim. - lower lim.) / (No. objects + 1)
• = Trapezium MPV = (upper lim. - lower lim.) / (2 * No. objects +1)
• = Cross-over point = MPV/2
Then, using the middle point value (MPV) the fuzzy sets are:
• = Triangles [ lower lim: 0 , lower lim+MPV: 1 , upper lim: 0]
• = Trapeziums {lower lim: 0, lower lim.+MPV:1, lower lim+ (2*MPV):1 upper lim:0]
• = The cross over point, cp = MPV/2, of the previous distribution (n-1) to determine
the beginning of the next distribution object (n) is used for the automatic
calculation of all objects of an attribute possibility distributions (for the option “by
attribute”).
Triangle n [ upper lim(n-1) - cp : 0 (upper lim(n-1) - cp) +MPV: 1 (upper lim(n-1)- cp)
+2*MPV] for all objects except first.
Example 1. Consider the object, cheap, within the interval (0 - 7000), then:
triangular MPV = 7000 - 0 /1+1 => so the fuzzy set built by the system would be:
(cheap [ 0:0 3500:1 7000:0])
trapezium MPV = 7000 - 0 /2*1 +1 => so the fuzzy set built by the system would be:
(cheap [ 0:0, 2333:1, 4666:1, 7000:0])
Example 2. Now consider that moderate is the next overlapping object of attribute
price, then:
cp = 3500/2 -> 1750, so (moderate [ 5250 : 0 8750 :1 12250 :0]).
Briefly, to define the overlapping indentation for the sequenced objects, cross-over
points were used, as the starting point for the next object of the attribute. This
corresponds to using the alpha-cut 0.25 of the outside leg, of the object distribution

Contract nr. ST-96-SC.1018
Final Report November 1999
University of Antwerp - RUCA
Universidade Nova de Lisboa
University of Piraeus
123
for the next object, considering that the attribute objects list is in increasing
sequence. Illustrating, let attribute A = {object1, object2, ..., object n}, where
objectn(xi) - objectn-1(xi) _ 0 and (cross-over n-1)/2 = x1 for objectn(x1).
Both triangular and trapezoidal distributions could have open or closed intervals for
their limiting objects, the extreme linguistic variables of the fuzzy set (attribute). The
meaning of open intervals is that all values situated to the left and right respectively
of the object limits, will maintain the same membership value, µ(x), as the last value
of that object. Closed intervals means that the limiting objects are completely defined
by the space (range) provided when inserted. The respective graphical
representations are shown in figure 25.
Figure 25: Graphical Distributions
Trapezium Distributions
Triangular Distributions
open intervals closed intervals
open intervals closed intervals
The second type of fuzzy attributes, the discrete objects, have a much smaller range
of options since they are single point values and not distributions. Since the objects
are discrete it is irrelevant to have possibility distributions. Therefore the expert will

Contract nr. ST-96-SC.1018
Final Report November 1999
University of Antwerp - RUCA
Universidade Nova de Lisboa
University of Piraeus
124
(1) insert the memberships for each object (component) and (2) generalise, if the
objects are numeric and integers.
10.3 Three-tier architecture
Although the EMOLITE prototype was planned to be a standalone application, it has
been designed following the general guidelines of three-tier applications. In some
cases, a pragmatic approach took the place of pure formal aspects in a three-tier
architecture. Overall, we feel that we achieved a good compromise. In what follows,
we provide a top-level description of both logical and physical views of the EMOLITE
system.
Business Services Data ServicesUser Services
The User Services is composed of:
VB Forms
VB ActiveX Components
VB Interface Controlers
VB Main
EMOLITE::Business Services
EMOLITE::Data Services

Contract nr. ST-96-SC.1018
Final Report November 1999
University of Antwerp - RUCA
Universidade Nova de Lisboa
University of Piraeus
125

Contract nr. ST-96-SC.1018
Final Report November 1999
University of Antwerp - RUCA
Universidade Nova de Lisboa
University of Piraeus
126
The VB Main is composed of:
modApp
modMain
modDecls
modRegistrymodUtils
modWin32
The VB Interface Controlers is composed of:
frmMDIBrowser frmPreview
frmWizardDB frmWizardPSI
The VB Forms is composed of:
frmCostCriteria
frmEDITConnect
frmEDITCountry
frmEDITCterminal
frmEDITPterminal
frmFlexibilityCriteria
frmFuzzySet
frmGraph
frmMain
frmMap
frmLog
frmMDIOpen
frmMsgBox frmProgress
frmProperties
frmReliabilityCriteria
frmReportFull
frmReportSumary
frmSplash
frmPSI

Contract nr. ST-96-SC.1018
Final Report November 1999
University of Antwerp - RUCA
Universidade Nova de Lisboa
University of Piraeus
127
The VB ActiveX Components is composed of:
ComCtl32
ComDlg32
Crystl32
DBList32
MSChart
RichTX32
TDBG5
Threed32 DAO
The Business services is composed of:
VB Modules
EMOLITE::Data ServicesUser Services::VB ActiveX Components
User Services::VB Main
VB Classes
The VB Classes is composed of:
modSimulation

Contract nr. ST-96-SC.1018
Final Report November 1999
University of Antwerp - RUCA
Universidade Nova de Lisboa
University of Piraeus
128
The Data services is composed of:
Access DatabaseJet Engine
System files
Windows Registry

Contract nr. ST-96-SC.1018
Final Report November 1999
University of Antwerp - RUCA
Universidade Nova de Lisboa
University of Piraeus
129
11 Annex 4: Short presentation of EMOLITE results and potential
10-01-2000 EMOLITE Final Presentation 1
For the Directorate General for TransportDr. E. Declercq, Scientific Officer
FINAL PRESENTATIONFINAL PRESENTATIONFINAL PRESENTATION
10-01-2000 EMOLITE Final Presentation 2
Database
InterfaceAlgorithms

Contract nr. ST-96-SC.1018
Final Report November 1999
University of Antwerp - RUCA
Universidade Nova de Lisboa
University of Piraeus
130
10-01-2000 EMOLITE Final Presentation 3
result potentialInternal database
• geographical• logistics• socio-economic• societal• infrastructure
External database• freight terminals• freight related information• terminal interconnectivity
++@@
10-01-2000 EMOLITE Final Presentation 4
result potential
Freight TerminalsFreight TerminalsFreight Terminals• user interface• settings• weights ...
• Freight Terminals• Passenger Terminals• Corridor Approach• INTERMODALITY
•• Freight Terminals Freight Terminals•• Passenger Terminals Passenger Terminals•• Corridor Approach Corridor Approach•• INTERMODALITY INTERMODALITY

Contract nr. ST-96-SC.1018
Final Report November 1999
University of Antwerp - RUCA
Universidade Nova de Lisboa
University of Piraeus
131
10-01-2000 EMOLITE Final Presentation 5
result potentialFreight TerminalsFreight TerminalsFreight Terminals
IntermodalCorridors
IntermodalIntermodalCorridorsCorridors
10-01-2000 EMOLITE Final Presentation 6
PC gast
PC gast PC gast
PC gast
PC gast
PC gast
WebSpeedAgent
Web Server
ProgressDatabase
Server
Modem
Hub
PC gast PC gast
PC gast
PC gast
PC gast
Hub
Intranet
Extranet
InternetPC gast
Modem
Internet
Assessment Assessment Model forModel forIntermodalIntermodalConnections inConnections inEuropeEurope