PROJECT FINAL REPORT - TRIMIS
37
PROJECT FINAL REPORT Grant Agreement number: 619236 Project acronym: X-WALD Project title: Avionic X-band Weather signal modeling and processing vALidation through real Data acquisition and analysis Funding Scheme: JTI-CS-2013-01-SGO-03-022 Period covered: from 01-01-2014 to 30-04-2016 Name of the scientific representative of the project's co-ordinator 1 , Title and Organisation: Dr. Fabrizio Cuccoli, Head of Research, CONSORZIO NAZIONALE INTERUNIVERSITARIO PER LE TELECOMUNICAZIONI Tel: + 39 055 2758523 Fax: +39 055 2758570 E-mail: [email protected] Project website address: xwald.cnit.it 1 Usually the contact person of the coordinator as specified in Art. 8.1. of the Grant Agreement.
-
Upload
khangminh22 -
Category
Documents
-
view
0 -
download
0
Transcript of PROJECT FINAL REPORT - TRIMIS

PROJECT FINAL REPORT
Grant Agreement number: 619236
Project acronym: X-WALD
Project title: Avionic X-band Weather signal modeling and processing vALidation through real Data acquisition and analysis
Funding Scheme: JTI-CS-2013-01-SGO-03-022
Period covered: from 01-01-2014 to 30-04-2016
Name of the scientific representative of the project's co-ordinator1, Title and Organisation: Dr. Fabrizio Cuccoli, Head of Research, CONSORZIO NAZIONALE INTERUNIVERSITARIO PER LE TELECOMUNICAZIONI
Tel: + 39 055 2758523
Fax: +39 055 2758570
E-mail: [email protected]
Project website address: xwald.cnit.it
1 Usually the contact person of the coordinator as specified in Art. 8.1. of the Grant Agreement.
Table of content
1 Executive summary 3
2 Summary description of project context and objectives 4
2.1 Technical background 4
2.2 Objectives 5
2.3 Innovative contributions of the project 5
2.4 Progress beyond the state of the art 6
2.5 Project work plan 7
3 Description of the main S&T results/foregrounds 8
3.1 X-band avionic polarimetric radar selection and acquisition (WP3) 8
3.2 Measurement campaign planning (WP4) 12 3.2.1 First measurement campaign: activities in Netherland 12 3.2.2 Flight measurement planning 12 3.2.3 Other validation/comparison sensors measurement planning 12 3.2.4 Second measurement campaign: activities in Italy 14
3.3 Experiment and data acquisition (WP5) 15 3.3.1 Airborne carrier platforms 15 3.3.2 Measurement campaings 17 3.3.3 Preliminary results 20
3.4 Meteorological signal models assessment and optimization (WP6) 21
3.5 EFB processing algorithms assessment and optimization (WP7) 28 3.5.1 AWR processing validation and optimization 29 3.5.2 EFB code re-engineering 30 3.5.3 Q-AI and route optimization 32 3.5.4 Q-AI trajectory processing: validation and optimization 33
4 Potential impact and the main dissemination activities and exploitation of results 34
4.1 Expected impact 34
4.2 Dissemination of the project 35
4.3 Exploitation of the project 35
4.4 Management of intellectual property rights 35
4.5 Contribution to European Competitiveness 36
5 Address of project public website and relevant contact details. 37
5.1 Address of project public website 37
5.2 Relevant contact details 37

1 Executive summary
The MAIN OBJECTIVE of the X-WALD project has been the planning and the execution of ad-
hoc experimental measurements finalized to optimize, test and validate:
- the avionic polarimetric radar signal simulator (CleoSim);
- the radar signal processing and weather classification algorithms implemented on an EFB in
the KLEAN project;
- the EFB GUI interfaces for the advanced display of weather classifications and decision-
making advices developed in KLEAN
For the achievement of this goals, the following specific activities have been carried out:
the selection and the upgrade of an X-BAND polarimetric radar suitable to be mounted on the
nose of an airborne platform for gathering data in presence of weather events in compliance
with the JU-SGO goals,
the planning of ad-hoc measurement campaign in well-monitored selected scenarios,
the experiment execution for data acquisition,
the validation, optimization and refinement of the avionic polarimetric radar signal simulator
(CleoSim),
the validation, optimization and refinement of the weather radar signal processing and
trajectory optimization algorithms running on the EFB (KLEAN project),
The refinement of the EFB GUI in accordance with the new needs resulting from the
experimental data analysis,
The overall EFB SW refinement for reaching level TRL5 (Technology Readiness Level 5)
The innovative contributions of the proposal are:
I. Analysis, selection and customization of experimental avionic radar with system
characteristics suitable to be installed on the nose of airborne platforms and able to carry out
measurements also in adverse meteorological conditions,
II. Avionic polarimetric data acquisition during selected meteorological events, concurrently
monitored by auxiliary ground-based polarimetric weather radar(s) and in situ meteorological
sensors,
III. Validation and optimization of the CleoSim radar simulator in meteorological scenarios a
priori characterized by auxiliary sensors,
IV. Validation and optimization of the radar signal processing and weather classification
algorithms in comparison with other external radar data and in situ meteorological sensors,
V. Reliability test of the trajectory optimization algorithms through the use of a mission/flight
simulator that reproduces the measurement conditions, in which the optimum trajectories
estimated by the real data are applied,
VI. Validation and reliability testing of the customized EFB developed in KLEAN to real
operative scenarios.

2 Summary description of project context and objectives
2.1 Technical background
All civil airplanes and military transport aircrafts are usually equipped with avionic weather radars
(AWR). Current AWRs allow different functionalities on detection of dangerous weather
phenomena. Typical and possible methods and systems so far developed, both for ground-based and
for airborne applications, to detect dangerous weather zones and to be implemented in future weather
radar systems are: (1) conventional radar, that is, non-coherent radar, which is able to measure radar
reflectivity only, ignoring polarization features of the signal; (2) coherent (Doppler) radar that can
measure Doppler spectrum parameters; (3) polarimetric radar, which takes into account signal
polarization to improve system performance characteristics. The highest potential can be obtained by
the Doppler-polarimetric radar that combine both Doppler and polarimetric diversities to improve
detection performances. Single polarization radar permits to detect only the intensity of the
meteorological phenomenon, which is anyway, in case of high values, obviously linked to harsh and
dangerous conditions, like hailstorms and turbulence. Polarimetric radars can provide more refined
information on the type of precipitation once the model of specific hydrometeor (rain, snow or hail)
is known. Polarimetry is typically used in meteorological ground radar for weather forecast.
Existing airborne polarimetric radars are mainly used for research purposes, like NASA Airborne
Rain Mapping Radar (ARMAR), to remote sensing the weather phenomena, without supporting
flight hazard assessment.
In the framework of CLEANSKY Joint Undertaking (JU) European program and specifically in the
Clean Sky Systems for Green Operations (SGO) Integrated Technological Demonstrator (ITD), the
use of a polarimetric avionic radar has been proposed in the Management of Trajectory and Mission
(MTM) study to have more precise information about not forecasted weather phenomena. The goal is
to optimize the skipping trajectories in order to minimize the noise pollution and emissions in each
flight phase of the airplane. To this purpose, two projects, namely CLEOPATRA and KLEAN, have
been sponsored by the JU-SGO for developing an avionic polarimetric radar signal simulator
(CleoSim) and the implementation and testing of polarimetric signal processing (AWR processing
(AWRP), AWR post-processing (AWRPP)) and trajectory optimization algorithms (developed by
Selex Galileo, now Selex Electronic System: SES) on an EFB (Electronic Flight Bag), respectively.
An EFB is an electronic display system designed to replace the traditional pilot flight bag and to
reduce or eliminate the need for paper and other reference materials in the cockpit.
In the JU-SGO MTM activity, the use of a polarimetric radar simulator has been chosen because of
the unavailability of the avionic commercial and/or experimental polarimetric radar among the JU-
SGO members and by the difficulty of finding commercial systems. The simulator has the advantage
to generate any kind of weather phenomena scenarios, which is of great importance to extensively
test signal processing and trajectory optimization algorithms. Obviously, algorithm performance
analysis results and its implementation on an EFB are strictly dependent on the reliability of the
polarimetric radar simulator. In this context, the availability of real data in a well-monitored scenario
would be of great importance to test the quality of the simulator as well as the capability of the
algorithms.

2.2 Objectives
In accordance with the background analysis, the MAIN objectives of the project were to plan and run
ad hoc measurements finalized to optimize, test and validate:
1 the CleoSim radar signal simulator,
2 the radar signal processing and weather classification algorithms implemented on an EFB in the
KLEAN project,
3 the EFB GUI interfaces for the advanced display of weather classifications and decision-making
advices developed in KLEAN
To achieve this goal, the following specific objectives have been aimed at:
- X-BAND polarimetric radar overview, selection and acquisition. The radar has been mounted on
the nose of airborne platforms for gathering data in presence of weather events in compliance
with the JU-SGO goals,
- planning the ad hoc measurement campaign in well-monitored selected scenarios
- experiments conduction and data acquisition,
- optimization and validation of the avionic polarimetric radar signal simulator (CleoSim),
- optimization and validation of the EFB weather radar signal processing and trajectory
optimization algorithms (KLEAN project)
- Refinement of the EFB GUI in accordance with the needs resulting from the experimental data
analysis
- EFB SW refinement and implementation to a level TRL5 (Technology Readiness Level 5)
2.3 Innovative contributions of the project
The innovative contributions of the project are:
- analysis, selection and customization of experimental avionic radar with system
characteristics suitable to be installed on an airborne platform and to carry out measurements
also in strong meteorological conditions.
- avionic polarimetric data acquisition in meteorological conditions selected and monitored
during the measurement by auxiliary polarimetric weather ground-based radars and in situ
meteorological sensors,
- optimization and validation of the CleoSim radar simulator in meteorological scenarios a
priori characterized by auxiliary sensors,
- optimization and validation the radar signal processing and weather classification algorithms
in comparison with other external radar data and in situ meteorological sensors.
- reliability test of the trajectory optimization algorithms through the use of a mission/flight
simulator that reproduces the measurement conditions, in which the optimum trajectories
estimated by the real data are applied.

- validation and reliability testing of the customized EFB developed in KLEAN to real
operative scenarios.
2.4 Progress beyond the state of the art
From the technical background analysis we can arise that the current commercial avionic radars
mainly operate in single polarization even if there exists some experimental avionic polarimetric
radars for testing and measurement. It is obvious that the cost for avionic polarimetric radar is higher
than for the single polarization one, therefore the advantages in terms of weather classification and
its use for trajectory optimization must be quantitatively demonstrated in order to show the
significant gain. The development of new signal processing and trajectory optimization algorithms
done within framework of JU-SGO aimed to this purpose. In these programmes, an avionic
polarimetric signal simulator, called CleoSim, was developed to have data on which the processing
and trajectory optimization algorithms implemented on an EFB could be tested. The main drawback
of this approach is related to the certainness of the reliability of such a simulator, whose performance
clearly affects the algorithm behaviour. Moreover, for the algorithm testing point of view, the use of
simulated data is always a limitation for the analysis goodness and for its behaviour when
implemented on EFB.
For the sake of clarity, the current state of the art is hereunder summarized:
1) Most of the commercial avionic radars have a single polarization .
2) Experimental airborne polarimetric radar exists but they are unavailable among the JU-SGO
members.
3) Avionic polarimetric radar signal simulators are not available in the open market, therefore a new
ad hoc simulator, named CleoSim, have been developed in the framework of JU-SGO.
4) New algorithms for polarimetric data processing and trajectory optimization have been developed
and implemented on EFB but their validation has been only carried out making use of simulated data
coming from CleoSim, which suffers of some limits related to the accuracy of the employed models.
The progress beyond the state of the art given by X-WALD project is:
- selection and/or updating existing polarimetric radar to be installed on an airborne platform
robust enough to also take measurement during strong weather events in compliance with the
cases of the JU-SGO program.
- organize a measurement campaign to obtain real data, which will be used for the algorithm
performance analysis as well as to assess the reliability of the signal simulator.
- carry on an extensive validation of algorithms running in the customized EFB of the KLEAN
project and a reliability analysis of the signal simulator through the use of the observed real
data.
- use of ancillary data coming from auxiliary sensors (polarimetric ground radar and
meteorological sensor) to crosscheck the outcomes of the data analysis with in situ
measurements.
The added value of the X-WALD approach is the uniqueness of such kind of measurement in real
scenarios to validate and refine a polarimetric signal simulator, which it will represent an useful tool
for designing and testing real polarimetric radar. The data acquired during the X-WALD flight

campaigns also allows a quantitative analysis of the EFB algorithm performance to really estimate
the actual gain offered by polarimetric radars with respect to classic single polarized radar.
2.5 Project work plan
The X-WALD project has been implemented through the following eight Work Packages, those
numbered from 3 to 7 concerning research and development activities:
WP1 - Project management: This WP primarily aimed at providing a structured system for the full
administrative and technical management of the project, addressing all methods of risk management,
quality assurance and confidentiality including Intellectual Property Rights (IPR) handling.
WP2– Analysis of the signal models, processing algorithms and EFB implementation: this WP aimed
at finding what are the critical aspects and limits on the reliability of simulator and algorithms caused
by the accuracy of models and absence of real data.
WP3 – X-band avionic polarimetric radar selection and acquisition: the goals of this WP were: an
overview of the existing X-band airborne polarimetric radar, the selection of the radar, the radar
updating in order to fulfil the expected performance and the definition of the modalities for the radar
acquisition.
WP4– Measurement campaign planning: this WP included the following activities: the definition of
the measurement scenario, the selection of the areas where the trials could be run, the selection of
the airborne platforms, the definition and selection of auxiliary sensors.
WP5 – Experiment and data acquisition: this WP aimed at carrying out all activities related to the
preparation and execution of the experiments. The radar was installed in the nose of the airborne
platforms in order to reproduce the avionic radar operating conditions.
WP6 – Meteorological signal models assessment and optimization: this WP concerned the
validation and optimization of the polarimetric signal simulator making use of real data gathered
during the experiments.
WP7 – EFB processing algorithms assessment and optimization: This WP aimed at the testing and
the optimization of the SW tools inside the EFB: the Advanced Weather Radar processing (AWRP),
the AWR Post-Processing (AWRPP) for feature extraction, identification and classification of
weather, the Q-AI trajectory optimization algorithm and the advanced GUI interfaces.
WP8 – Exploitation and dissemination: This WP outlined how to develop the exploitation and the
dissemination of the XWALD results in the SGO CLEANSKY program, in other European projects
(FP7, H2020. etc), manufacturing industries and in the technical and scientific community, following
Clean Sky JU directives.

3 Description of the main S&T results/foregrounds
Main S&T results are described in the following subsection according to the technical workpackages
breakdown and with reference to projects deliverable (numbered as Dn.m, with “m” denoting the
corresponding workpackage).
3.1 X-band avionic polarimetric radar selection and acquisition (WP3)
The WP3 aimed at the selection of a suitable radar system for achieving the XWALD project goals,
in particular the acquisition of fully polarimetric radar data at X band from an airborne platform
during different precipitation events. The first specific objective of this work package consisted in
surveying the existing airborne polarimetric X-band radars in the market, to investigate if any of
these could be used as such for the XWALD purpose, or eventually after the implementation of
necessary upgrades. Examples of investigated options are given in
Figure 1. From the survey it was concluded that no existing avionic whether radar system had
implemented the dual-polarization feature. Therefore, it was not possible to use any OTS radar
system for the XWALD project.
Figure 1: Investigated avionic X-band weather radar sensors available on the market. All of them are characterized by single polarization feature, and, therefore, none of them was suitable for XWALD.

It was clear that a customized version of the desired radar system needed to be developed. The
experience of MetaSensing in the field of radar design, development and deployment was exploited.
Among other frequency bands, MetaSensing in fact had available an airborne radar sensor at X band,
fully polarimetric, for general mapping purposes. Additionally, know-how in weather radar data
processing was gathered while operating the MetaXWR X and the QX-60, two ground-based full pol
FMCW radar sensors by MetaSensing. In Figure 2 some examples showing the past experience of
MetaSensing in airborne and whether radar applications.
Figure 2: Examples of experience by MetaSensing in radar design and deployment: on the left, a number of aircraft platforms used in different radar acquisition campaigns preformed at X-band. On the right, the
MetaXWR X whether radar installed on top of a high building in Rotterdam (NL).
The decision of using a customized version of an airborne radar sensor at X band by MetaSensing
followed. However, a number of upgrades had to be implemented in order to adapt the performance
of the existing sensor to the specific requirements of the XWALD project.
Main implemented upgrades consisted in:
Introduction of a pulsed approach, meaning the use of a single antenna for transmitting and
receiving radar signals, instead of two antennas, like in the Continuous Wave approach
usually adopted by MetaSensing;
Increase of maximum transmittable power (necessary as a consequence of the new pulsed
approach);
Choice of an OTS antenna with optimal radiation characteristics and minimized physical
dimensions;
Introduction of a scanning mechanism to allow for antenna pointing in different directions;

General re-engineering of the system (new enclosure and cabling), for withstanding with
typical aircraft space and weight limitations.
Figure 3: Upgrades implemented by MetaSensing in its radar sensor at X band for adapting its detection performance to the one expected for the XWALD project.
In Figure 3 are shown the main upgrades which have been implemented by MetaSensing to its sensor
at X band to match with the XWALD requirements. From top left, clockwise: a parabolic dish
antenna capable of dual polarized signal handling; a two axis (pan and tilt) motor unit and relative
interface for radar antenna pointing and scanning; reduced (in weight and dimension) radar sensor
enclosure with external navigation system; pulsed technology implemented in the Radio Frequency
circuitry. Thanks to the above described upgrades, and also due to the versatility of the control unit
of the airborne systems by MetaSensing allowing a ready tuning of radar parameters (sampling
frequency, pulse duration, transmitted bandwidth, PRF, etc) it has been possible to obtain an airborne
radar sensor at X-band suitable for the XWALD purpose, as testified by the main radiation
performance features summarized in Table 1.

Table 1: Expected radiation performance from MetaSensing radar sensor at X band after upgrades for the XWALD project

3.2 Measurement campaign planning (WP4)
The WP4 aimed at planning the two measurement campaigns to be actuated in The Netherlands and
in Italy.
3.2.1 First measurement campaign: activities in Netherland
The aircraft was transferred to the Netherlands by week 51, the one targeted for the actual
acquisitions. The basis of operations was set in the International airport of Teuge (ICAO: EHTE), a
small airfield close to the town of Apeldoorn (NL).
3.2.2 Flight measurement planning
Preliminary flight tests with measurements were carried on during good weather conditions in order
to test the system for its correct functionality. After that, the weather conditions were constantly
monitored, in search of precipitation events suitable for actual acquisitions. In particular the pilot was
involved in this task, due to the advanced forecast resources characterizing the flying activities.
Radar data were acquired from a distance of ~20 km from the precipitation event, flying toward it up
to being as close as possible to the event itself.
Concerning to that and to the expected hazardous flying conditions, proper risk assessments were
defined together with the aircraft pilot and safety manager prior to the campaign execution: a set of
Standard Operating Procedures was defined to minimize the risks associated to the campaign
execution.
A temporary experimental license for RF transmission at X-band was requested to the Dutch local
authorities (Agentschap Telecom – Ministerie van Economische Zaken), valid for week 51 and 52, in
order to allow for RF transmission.
3.2.3 Other validation/comparison sensors measurement planning
In order to validate the radar acquisition results, the flight was performed in the surrounding of the
Cabauw experimental site for atmospheric research in the Netherlands (CESAR), due to the
availability of polarimetric X-band Radar for meteorological application (IDRA) on top of the 213
metre high mast (see Figure 4). The site and the equipment therein used are managed by the Royal
Netherlands Meteorological Institute (KNMI). The IDRA data is freely available for scientific
purposes under the CESAR data policy. From Teuge airport, the Cabauw site is reachable in about
20 minutes of flight. It was also possible to deploy additional instrumentation near by the site for
further validation purposes of the airborne data. Additionally, a Parsivel laser disdrometer was
deployed on-site to have a reference for the measured Drop Size Distribution to be compared with
the data received by the sensor.
Regarding the on-ground radar sensor, IDRA radar, it is aimed at the detailed observation of the
spatial and temporal distribution of rainfall and drizzle. The system was placed at the end of August
2007 on top of a 213 m high meteorological tower in the CESAR (Cabauw Experimental Site for
Atmospheric Research) observatory in Cabauw, The Netherlands. This location has several
advantages: In the first place, an increased sensitivity due to the reduction of the influence of ground
clutter. Secondly, it allows direct observation of the horizontal distribution of low level clouds and
fog.

Figure 4: Picture of the 213 metre high mast in Cabauw, hosting different meterological remote sensing instruments, including IDRA, a, X band polarimetric radar. On the internal square, displacement of Teuge and
of Cabauw site.
Finally, the presence of other instruments in the vicinity enhances the understanding of the physical
processes in the atmosphere by synergistically combining their measure-ments. IDRA provides the
horizontal distribution of reflectivity, Doppler spectrum width and polarimetric parameters like
differential reflectivity, linear depolarization ratio or specific differential phase. IDRA data will be
used as a reference for validating and cross-referencing airborne data. Additionally, a Parsivel laser
disdrometer (see Figure 5) will be deployed on-site to have a reference for the measured Drop Size
Distribution to be compared with the data received by the sensor. The instrument provides a full
picture of the precipitation event in all weather phenomena and provides accurate reporting of
precipitation types and intensities. It also detects and identifies up to eight different precipitation
types as drizzle, mixed drizzle/rain, rain, mixed rain/snow, snow grains, freezing rain and hail.
Figure 5: Parsivel Disdrometer and related GUI
The output data, consisting of raw data, classification related to size and velocity of particles, present
weather reports, make the instrument suitable to any kind of weather application. At the end of week
51, the aircraft performed the ferry from Teuge back to Diamond facilities in Wiener Neustadt,
where the radar system was dismantled and shipped back to MetaSensing, while the aircraft was able
to return back to DEA headquarter.

3.2.4 Second measurement campaign: activities in Italy
In order to take into account for different precipitation types related to the particular geographic area
of observation, acquisitions were attempted also in different countries than the Netherlands. This
also represented a back-up solution if anything should go wrong with the system preventing the
successful finalization of the campaign. The platform is a Piaggio P166C (see Figure 9). The
possibility of installing the radar sensor in the front part of the aircraft was successfully checked in
the last months.
Figure 6: Radar Polar 55C in Rome
The basis of the operation was the AVIOSUPERFICIE LEONARDI – TERNI (42° 34,390' N 012°
35,06' E, 114 m ASL), where the setup of the measurement will be the same. This location was
chosen for the proximity of another ground radar facility which covers the flight zone near Terni.
Moreover, due to the portability of other ground sensor, the synergy of sensor was still guaranteed.
The ground system is a coherent C-band Doppler dual polarization radar, which has been
continuously upgraded through an evolution process so that the radar can be used for state of the art
research in radar meteorology. From the current site (the roof of the CNR building in Roma Tor
Vergata) , the POLAR 55C (see Figure 6) can monitor precipitation over the farthest part of the
Tevere basin, the urban area of Rome, and the central Appennines. The Parsivel disdrometer was re-
deployed on site to have access to the same DSD observables.

3.3 Experiment and data acquisition (WP5)
The objective of WP5 was the definition and realization of all the activities inherent to the
experiments of the XWALD project, and in particular the implementation of the airborne radar
polarimetric data acquisition campaign. Two different aircraft have been used for the purpose, as
discussed in paragraph 3.3.1. With each one of these a distinct measurement campaign has been
performed in the Netherlands and in Italy, respectively in December 2015 and March 2016, as
detailed in paragraph 3.3.2.
3.3.1 Airborne carrier platforms
A number of potential aircraft platforms has been investigated to be used during the XWALD
airborne measurement campaign, mainly in terms of installation capabilities (existence of a pod able
to fruitful the expected radar acquisition geometry), of flight performances (capacity to operate in
safe way also in presence of adverse meteorological conditions, possibly with two engines to cope
with over sea operations) and of course in terms of cost and availability.
Among the different options evaluated, first choice was the Diamond DA-42, also due to the wide
portfolio of existing pods which could be used for hosting the radar equipment, as shown in Figure 7.
Figure 7: Existing pod for the DA-42 MPP platform; the nose payload pod has been chosen for the XWALD acquisitions.
The installation of the radar systems within the DA-42 pod and the cables routing strategies have
been designed in collaboration between MetaSensing and Diamond. The physical installation of the
system on board of the aircraft has been performed at the Diamond Aircraft facilities in Wiener

Neustadt (Austria) few days before the first acquisition campaign in the Netherlands, as shown in
Figure 8.
Figure 8: Radar installation and certification on the DA-42 at Diamond facilities, in Austria. From top left, clockwise: CAD study of potential location for different radar subsystems; actual implementation in the front nose; avionics instrumentation monitored during RFI tests for certification; mechanical check of installation
for certification.
As a back-up it was decided to have a second aircraft option available in case the first measurement
campaign would have been failed by any reason. The choice fell on a Piaggio P-166 from an Italian
operator, mainly due to the existence of an experimental platform in Italy allowing the system to be
conveniently installed (see Figure 9) and operated.
Figure 9: Radar installation onboard the Piaggio P-166.

The two aircraft with the installed XWALD radar sensor are shown in the pictures of Figure 10 and
Figure 11, shot during the two distinct measurement campaigns described in the next paragraph.
Figure 10: Nose pod-equipped DA42 at the airport of Teuge (NL) during the first XWALD measurement campaign.
Figure 11: Nose pod-equipped P-166 at the airport of Terni (IT) during the second XWALD measurement campaign.
3.3.2 Measurement campaings
The main objective of the measurement campaign was the collection of fully polarimetric airborne
radar data at X band of different precipitation events, simultaneously with auxiliary ground
measurements for analysis and validation purposes. The ferry from Wiener Neustadt (Diamond
facilities) to the Teuge happened on the 13th
of December, 2015. The day after a check test flight was
performed (with no precipitation), confirming the correct functioning of the system. The first actual
acquisition flight has been performed on the 16th
December 2015, representing the “wettest” day of
the designed week for acquisitions. However, very weak precipitation could be visually observed

only time to time, as the cloud were not really thick (see left picture of Figure 12), overall a quite
poor event to be considered as the main results of the acquisition campaign. At the right of Figure 12
it is shown the aircraft trajectory during the acquisitions, over imposed to a Google map. The
permission to fly in proximity of the Cabauw meteorological site was denied by the air traffic control
authorities during the flight, due to low visibility conditions limiting safe operations.
Figure 12: Acquisition flight of the 16th of December 2015, in NL: on the left, meteorological situation
observable from the aircraft, with few clouds and weak precipitations; on the right, DA-42 trajectory.
Because it was not possible to collect radar data during any significant precipitation event within the
planned week of the Dutch campaign, a new measurement session was scheduled for March 2016, in
Italy. Given the unavailability of the same (or equivalent) platform used for the Dutch campaign, the
second aircraft (see Figure 11) has been used for the Italian campaign. The XWALD system has
been operated for the first time on board the P166 during the morning of the 11th
of March 2016, for
a check flight. Once the correct functioning of the system was assessed an acquisition flight has been
performed over the Tyrrhenian sea chasing some instability events which were were predicted by
weather forecasts and confirmed by weather radar imagine available through public web sites (see
Figure 13).
Figure 13: Acquisition flight of the 11th of March 2016, in Italy: on the left, meteorological situation showing
lightning events; on the right, performed trajectory.

Similarly, other acquisition flights with the XWLAD system have been performed in the following
days, in particular on the 15th
and on the 16th
of March 2016, in different areas of Italy, see Figure
14, and different precipitation events could be observed, see Figure 15.
Figure 14: Acquisition flight trajectories on the 15th (top) and 16th (bottom) of March 2016.
Figure 15: Scenarios observed during flights on the 15th (left) and 16th (right) of March.

3.3.3 Preliminary results
After each flight a preliminary data check was performed, a quick data look to assess the acquisition
campaign results. Already from that, it could be concluded that both the campaigns were successful,
as radar data could be acquired as expected. However, the radar dataset collected during the Italian
campaign is definitely more valuable than the one collected during the Dutch campaign for the
XWALD project, in terms of presence of interesting precipitation events. Range-Doppler
spectrograms processed from the acquired data after the Italian campaigns are given in Figure 16.
Figure 16: Example of Range-Doppler spectrograms processed from data acquired during the flights on the
15th (top) and 16th (bottom) of March. For each example, the four polarimetric channels are shown.

3.4 Meteorological signal models assessment and optimization (WP6)
The objective of WP 6 was to validate the CLEOSIM simulator (CLEOpatra SIMulator), which
consists of a tool able to simulate the polarimetric I/Q signals gathered by weather radars installed on
board an aircraft. The validation has been carried out by exploiting the measured data and mainly
consisted in comparing the results of the simulation against the measured data. Since validation
cannot be carried out by directly comparing the measured I/Q signals against the simulated one, a
specific processing algorithm has been developed and applied to the provided measured data.
Preprocessing: it consists of deriving the 3D distribution (Figure 17) of the mesoscale
parameters (e.g. water content) in the entire radar illuminated region (Figure 18, i.e. input
domain of CleoSim, from the measured radar observables.
Figure 17: Meteorological simulative scenario: W·106 (kg/m3).
Figure 18: Radar illuminated region.
Also data from ground radars have been exploited to better identify the meteorological events
associated to the airborne measurements. This helped to better identify the nature of the
hydrometeors present in the analyzed scenarios, confirming, for example, the absence of the melting
layer in the observed data, which mainly consisted in rain only.

Figure 19: Example of measured radar observables.
Since the provided measured reflectivity was not calibrated, it has been necessary to fix a reference
by directly estimating the radar constant from the radar parameters. It has been then possible to
determine the “correct” reflectivity. A reliability test has been then performed on the resulting
calibrated data: measured Zdr was plotted as a function of measured Zh and the result compared
against the theoretical Zh-Zdr relation. The result is shown in Figure 20, where the spread of the
measured data is mainly due to the low S/N ratio: indeed, where the most intense precipitations are
observed (orange dots) the correlation improves, being higher the intensity of the radar echo.
Figure 20: Scatterplot between Zh and Zdr values for “test 2” measurement.
Processing: it consists in performing the CleoSim simulations. Several measurements sets were
available for the simulations, but only those with the highest S/N ratio have been taken into
account. Hereafter, two main test cases are reported:
o “Test 1”: the related data set has been acquired on 2016/03/16 - 12:43:49 UTC. It consists of a
unique azimuthal scan, from − 15° to + 15°. During this acquisition the AC was flying above
Tyrrhenian Sea (region covered by MSP radar) moving with a velocity of 80 m/s toward South-

West, at a height of 250 m. Since the AC was flying inside an intense precipitation cell, Zh
values measured here are the highest of the entire dataset.
Figure 21: Main input radar parameters (Zh, Zdr, RhoHV, LDR and V) on azimuth-range maps.
The setup for validation 1, which is related to measurement “Test 1”, is reported in Table 2.
Table 2: CleoSim input parameters for “Test 1” validation.
CleoSim setup “Validation 1”
Simulation duration 0.6 s
AC attitude: yaw, pitch, roll 252°, 0°, 0°
AC navigation (first trajectory point): lat.,
long., alt.
43.73° N, 8.82° N, 250 m
AC velocity and direction 85 m/s, 252°
Transmitted pulses (for each polarization) 2560
Azimuthal scan: from, to, scan velocity + 15°, − 15°, 50°/s
Elevation + 10°
-3dB beamwidth aperture on az. and elev. 5.5°
Maximum range 5 km
Carrier frequency 9.6 GHz
PRF 4900 Hz
Antenna gain 27.8 dBi
Chirp gain 10.7 dB
Receiver bandwidth 1.2 MHz
Co-polar and cross-polar loss 2 dB
Transmitted power 5 W
Noise figure 3.1 dB
Meteo up-sampling along horizontal plane 15
Seed 1
o “Test 2”: the related data set has been acquired on 2016/03/16 - 11:33:31 UTC. It consists of
seventeen azimuthal scans in the angular range − 15° to + 15°. The AC was flying above
Southern Tuscany moving at 60 m/s toward South-West, at an height of 550 m. Measured values
of Zh are still quite high, but lower than “Test 1”. The values of Zh, Zdr and RhoHV for the 17
scans are shown in Figure 22. The two horizontal black dotted lines delimit the range between
1.5 and 5 km. The red vertical lines define each scan along the azimuth. Every scan lasts 5 s and
consists in five azimuthal lines per polarization, derived by averaging 4800 pulses. At the end of
each scan, the same region is scanned azimuthally on the opposite direction.

Figure 22: Radar input parameters (Zh, Zdr and RhoHV) measured on 17 scans during “test 2”
(2016/03/16 - 11:33:31 UTC).
The setup of the second validation is similar to the previous one, so we report in Table 3 only the
parameters which differs from those listed in Table 2.
After checking and setting up the above described scenarios, simulations have been run to obtain the
related polarimetric IQ signals.
Table 3: CleoSim input parameters for “Test 2” validation (the ones different from validation 1).
CleoSim setup “Validation 2”
AC attitude: yaw, pitch, roll 241°, 0°, 0°
AC navigation (first trajectory point): lat., long., alt. 43.73° N, 8.82° N, 550 m
AC velocity and direction 60 m/s, 241°

Post-processing: it consists of the extraction of the radar observables from the simulated IQ
signals and in comparing them against the measured data, in both addressed cases:
Figure 23: test 1 - airborne measurements (on the left) and airborne simulations (on the right).

Figure 24: test 2 - airborne measurements (on the left) and airborne simulations (on the right).
Throughout the validation campaign some improvements and fixes have been applied to the CleoSim
simulator, which are all reported in D6.2. Therefore, the second part of WP6 was fully devoted to re-
test all the simulator functionalities concurring in the estimation of the radar echoes from all the
handled meteorological events and types of grounds.
To conclude, despite several issues found in the measurements, a good level of agreement with the
measured data has been found, at least where the latter were consistent with the theoretical
microphysical models of the rain.

Figure 25: An example of some CleoSim outputs: received power on both polarizations.
.

3.5 EFB processing algorithms assessment and optimization (WP7)
Assessment and optimization of the EFB processing algorithms developed along the CleanSky
KLEAN (Knowledge-based EFB for green flight trajectory decision aid) project, were the main
objectives of WP 7. 1) . The EFB doftware includes:
1. AWR Post-Processor (AWRPP) for risk identification based on hydrometeor classification
2. Q-AI trajectory optimization algorithm
3. GUI to display of AWRPP and Q-AI output integrated typical information from EMS.
Synergy with other CleanSky projects like TACTIC (in flight Trajectory optimizAtion through
advanCed simulation TechnICs) has been exploited to gather pilot’s feedback and quantifying the
benefits of Q-AI in terms of reduction of CO2 and NOX emissions. Used is the NEXISTM
EFB
manufactured by Astronautics Corporation of America (http://www.astronautics.com/) composed of
a display unit and an electronic unit featuring:
- Class 2 and Class 3 EFB products running a Certified Linux OS, DO178 Level C;
- 8” XGA 1024x768 pixels display on display unit with touch screen
- 2 GHz Core i7 Intel CPU and 4GB DDR3 1066 MHz memory;
- 8 ARINC-429 receive channels, 4 ARINC-429 transmit channels, and one 1 ARINC-717
receive channel;
- 4 full duplex Ethernet channels (10/100 Base-T);
- 1 USB port on display unit, 2 USB ports on electronic unit;
- 1 RS-422 channel.
The available SDK allows developing other Class2 Level B applications to be executed on top of the
provided certified operating system. KLEAN software was developed using C/C++ language for a
Linux platform. The EFB final configuration contained the following elements:
- Updated executable with improved visualization and user interface.
- Pre-computed and loaded graph for Q-AI, including all possible routes between known
waypoints in the region of flight used in the test.
- Database of names and positions of known waypoints in the region of flight used in the test.
- Pre-loaded information about original planned route of the aircraft.
- Files with emissions data (from ICAO and BADA) for the aircraft used.
The EFB with the upgraded version of the KLEAN tool has been used for passing the TRL5 of the
WRPP in June 2015 and the TRL5 of the Q-AI in December 2015. Details of improvements to EFB
and validation efforts are detailed in the following subsections.

3.5.1 AWR processing validation and optimization
The hydrometeor classification (HCA) module of the AWRPP exploits potentials of polarimetric
capabilities of next generation weather radar for civil aircrafts. It is based on the Support Vector
Machine (SVM) approach found to be computationally efficient and compliant with EFB
computation performances. It has distinct phases: training and prediction. The first one finds
relations among input variables and class labels outputs, and the second one assigns the most likely
hydrometeor class to each radar sampling volume. The computationally fast prediction phase is the
only one implemented in the EFB. The training phase is performed off-board and resulting prediction
models are preloaded before the flight. Any changes in the SVM HCA, such as the number and
definition of output classes and the models arising from a different training can be easily
implemented, without resorting to changes in the EFB code. The tested module inputs the typical set
of dual-polarization measurements, i.e. radar reflectivity factor Zh (dBZ), differential reflectivity Zdr
(dB), specific differential phase shift Kdp (dB/km), copolar correlation coefficient (hv) and the height
of 0°, the latter extrapolated from FMS measurements. The output classes, based on convective
events, the most interesting for flight safety, are six, namely rain (RA), dry snow (DS), wet snow
(WS), graupel (G/SH), hail, hail mix (R+H). Since a wide knowledge base about radar based HCA is
based on Fuzzy Logic (FL), an FL HCA using the same input and output set has been to train the
optimized SVM classifier with an appropriate number of events.
A critical aspect of HCA is its validation due to the impossibility of collecting independent
measurements of hydrometeors that are representative of those in a radar resolution volume. A
convenient approach is to use known microphysics provided by meteorological models as input of
weather radar simulators. The Weather Research and Forecasting (WRF) model with explicit
microphysics scheme and the polarimetric Doppler weather radar simulator (POWERS) are used. We
first considered an intense precipitation occurred in the afternoon of 15 October 2012 in South
Mediterranean, off the coasts of Tunisia. The WRF scenario is composed of a cube of 80068252
elements of 1.5km1.5km0.150km resolution for which microphysical characteristics of four
classes are provided. To obtain the six HCA classes, some WRF classes were mixed. The height of
0° isothermal is given by the WRF model. The training set is obtained by random sampling elements
of the WRF cube and includes 104 samples, while a test set of 3106 samples were retained to test
the HCA. The HCA uses the radial basis function kernel identified by the parameters C and and it
was found that best parameters were 8 and , respectively. We found that 104 observations allow to
train the SVM model with a high accuracy (94.8%) and in a reasonable time processing (less than 1
minute). A set that is almost equally dived among the classes is necessary to achieve a good
representation of all the classes for training. To evaluate the prediction phase, a confusion matrix
(CM) was calculated, whose elements CM(i,j) contain the number of observations classified in i-th
class actually belonging to the j-th class, the diagonal terms expressing the correct classification. The
performance is quantified by the overall accuracy (OA) and the Cohen’s Kappa (K). Both the FL
(used for training) and SVM classificators are in good agreements with an OA= 74% and a K= 0.62.
Main differences are found for wet snow and hail mix class that are additional to the default classes
of WRF. A more realistic dataset, although at a different band, was also used. Real measurements are
from the two C-band (5.6 GHz) dual-pol Doppler radars sited in Gattatico (Reggio Emilia, Italy, lat
44.65° lon 11.62°) and San Pietro Capofiume (Bologna, Italy lat 44.79° lon 10.49°) managed by the
Agenzia Regionale Prevenzione e Ambiente (ARPA) Emilia Romagna, collected on August 1st,
2015. The event was also reconstructed using WRF and POWERS. For this event, the same training

and performance assessment procedure was followed, obtaining the overall accuracy of the
comparison is 67%, and K= 0.53 (Fig. 26).
3.5.2 EFB code re-engineering
Within WP7, the entire original KLEAN code was revised. As a result, several bug were fixed and
the re-engineered solution led to a highly improved robustness and flexibility to accommodate future
upgrades. More important, the GUI was thoroughly revised according to pilot’s feedbacks to increase
the effectiveness of information presented for the decision making process followed by pilot. The
main screen keeps all the most used controls and information to avoid unnecessary browsing of
secondary screens (Figure 27, left). Higher resolution maps are now used. Colors for route
visualization are more similar to what pilot is accustomed to see on FMS (e.g. green is for planned
route, magenta for Q-AI proposed route). Waypoints of the routes are visible also on map with a
marker and a label with their code name. Visualization aids (distance rings, waypoints, AWRPP
outputs) can be switched on/off with a single button on main screen, because they may sometimes
cover other important map details (Figure 27, middle).
Figure 26: Reflectivity map from San Pietro Capofiume weather radar (top left) and simulated (top right), HCA results for real (top left) and simulated dataset (top right). Plots refer to a PPI sweep at 2.3° elevation
A ZOOM button allows selection of three different zoom levels, cycling between 1 2 3
1, considered to be simple and effective by pilots (Figure 27, left and middle). A blinking red frame
(1 Hz) acts as visual alert when Q-AI is active and a Q-AI event is detected. In this case, the planned
route must be changed (Figure 28, right). This warning comes only 5-10 minutes before the aircraft
enters the risk zone allowing pilot must to examine the Q-AI proposed route and negotiate with ATC.

When a “risk zone” appears on the map, as a red line showing the no-flight zones nearby, a “safety”
zone also appears. A yellow line that shows a security distance of 5 NM from the risk zone (Figure
28, right). In case of Q-AI event, a new optimal route that avoids risk zones is almost immediately
computed and proposed to the pilot. If the OK button is pressed, that button disappears and pilot must
confirm by pressing a second Confirm OK button. Now the pilot may confirm or press the original
Refuse route button, visible on main screen in its original location. This two-step acceptance remains
very quick but was strongly suggested by GUI experts to avoid accidentally touches.
Figure 27: The GUI main screen soon after the no flight zone event on the left, and on the right presentation of routes and waypoints. Planned route and its waypoints are all in green, the Q-AI proposed route and its
waypoints are in magenta. The WP button switches on/off the visibility of labels.
Figure 28: - Comparison of zoom level 1 (left) and level 2 (center). Circles are at 40 and nm. Red arrows (left) indicates the 1 Hz red lines blinking corresponding to risk area.
While the pilot examines the proposed route, the Q-AI is frozen. If pilot accepts the new route and
successfully negotiate it with ATC, the Q-AI becomes active again. The pilot will insert the new
route on FMS and the FMS will send it to the EFB, which will show it as new current planned route.
The pilot might not accept the Q-AI proposed route: the pilot may press the Refuse route button and
use the DCT button allowing to use the EFB touch screen to select manually the first waypoint for a
new route. The Q-AI is reactivated to compute a new optimal route with this constraint as first leg of
the new route. To facilitate negotiation phase with ATC, legs are described with full compliance with
ICAO rules: if a leg is not directed to a waypoint it is described in terms of heading and length.
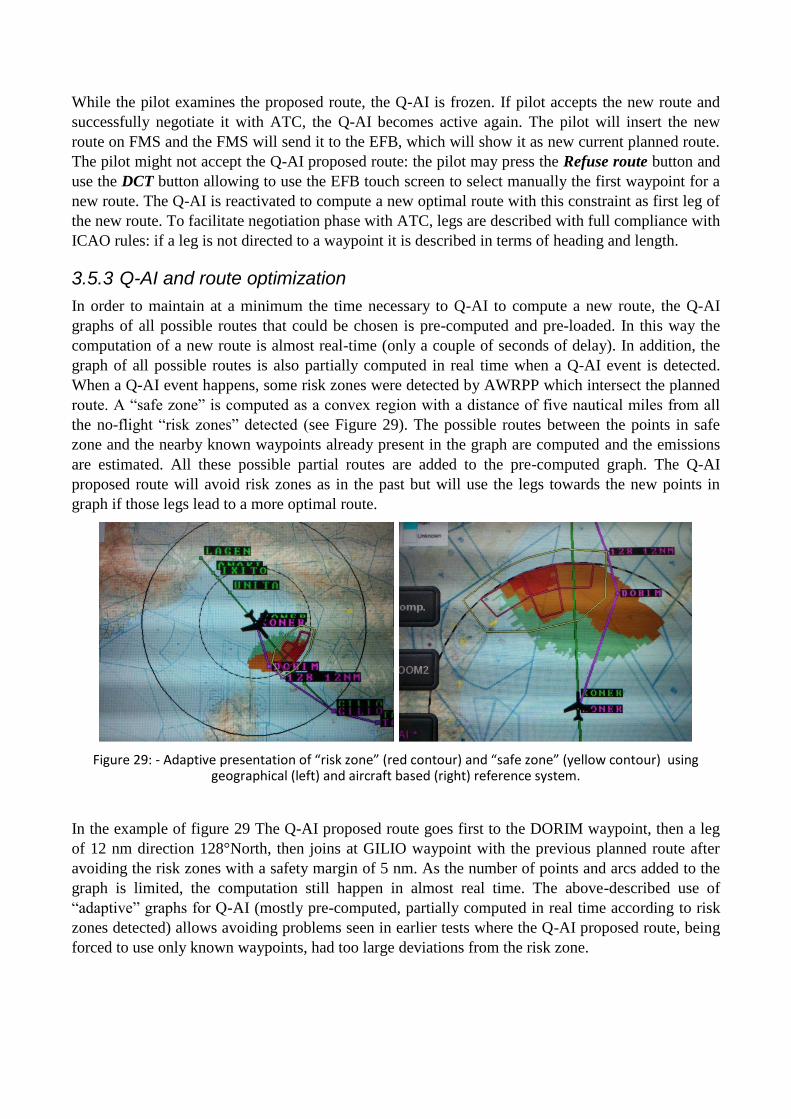
3.5.3 Q-AI and route optimization
In order to maintain at a minimum the time necessary to Q-AI to compute a new route, the Q-AI
graphs of all possible routes that could be chosen is pre-computed and pre-loaded. In this way the
computation of a new route is almost real-time (only a couple of seconds of delay). In addition, the
graph of all possible routes is also partially computed in real time when a Q-AI event is detected.
When a Q-AI event happens, some risk zones were detected by AWRPP which intersect the planned
route. A “safe zone” is computed as a convex region with a distance of five nautical miles from all
the no-flight “risk zones” detected (see Figure 29). The possible routes between the points in safe
zone and the nearby known waypoints already present in the graph are computed and the emissions
are estimated. All these possible partial routes are added to the pre-computed graph. The Q-AI
proposed route will avoid risk zones as in the past but will use the legs towards the new points in
graph if those legs lead to a more optimal route.
Figure 29: - Adaptive presentation of “risk zone” (red contour) and “safe zone” (yellow contour) using geographical (left) and aircraft based (right) reference system.
In the example of figure 29 The Q-AI proposed route goes first to the DORIM waypoint, then a leg
of 12 nm direction 128°North, then joins at GILIO waypoint with the previous planned route after
avoiding the risk zones with a safety margin of 5 nm. As the number of points and arcs added to the
graph is limited, the computation still happen in almost real time. The above-described use of
“adaptive” graphs for Q-AI (mostly pre-computed, partially computed in real time according to risk
zones detected) allows avoiding problems seen in earlier tests where the Q-AI proposed route, being
forced to use only known waypoints, had too large deviations from the risk zone.

3.5.4 Q-AI trajectory processing: validation and optimization
Validation and optimization activities for Q-AI technology also in the view of reaching TRL5 were
conducted in relevant scenarios using two different flight simulators, one named GRA, set up by
Alenia Aermacchi (ATR72 aircraft), and one provided by IDS in the framework of TACTIC project
(A320 aircraft). The general objectives were:
- Confirmation of feasibility of routes proposed by Q-AI.
- Confirmation of their results in terms of reduced emissions.
- Pilots’ feedback on GUI and Q-AI procedures and output format.
- Improvement of acceptance by pilots of the new possible tool.
- Verification of pilots’ workload with or without Q-AI tool.
With the GRA simulator, the route used in the simulations was a Turin-Rome flight. Along the route,
approximately between ELB and GILIO waypoints, a weather perturbation forces a change of route.
One pilot in the flight simulator did the same route three times (only the central part, where the event
occurred). The first time relying only on standard radar reflectivity to choose an alternate route. The
second time relying also on AWRPP on NEXISTM
EFB, giving more accurate classification of the
weather in front of the aircraft. The third time also with Q-AI activated to follow the route suggested
by the EFB.
The TACTIC project had the main objective was the analysis and evaluation of pilot performance,
with or without the help of an on-board decision support system, in decision making when
unforeseen events force a change in the reference trajectory. To reach this objective a simulation
environment that replicates present and future ATC and airborne system configurations was set up
using the IDS facilities such as AACS (Advanced Aircraft Cockpit Simulator) connected directly to
the DDS (Decision Support System), and ATCSim, an air traffic control simulator, including. This
test bed environment was used to perform a set of simulations to study:
- The impact of different pilot behaviors in the decision making process when unforeseen
events force a change of the reference trajectory;
- The impact of the DDS on pilot workload, situation awareness and aircraft/airspace
performance in all the phases of flight.
The overall evaluation strategy for the assessment of the concept followed a human-centred design
approach and E-OCVM methodology. In line with these approaches, both aspects related to human
factor and system performance were investigated.
Milan-Palermo and Turin-Rome routes were used in the simulations, which were set for an A320
flight simulator. In scenarios simulating an airline flight both pilot and co-pilot were present. In
Commercial flight simulation only pilot was present. Also full negotiation with ATC was simulated
along the flights. Four run of each scenario were performed: 1) Commercial pilot without DSS, 2)
Airline pilot without DSS; 3) Commercial pilot with DSS; 4) Airline pilot with DSS. Recorded were
all voice communication between pilots and ATCOs. All radio transmissions were recorded together
with their UTC start time and duration and all flight plan modifications performed by the crew with
the associated UTC time. The unforeseen events forcing a change in aircraft trajectory were not
necessarily weather-related. The aircraft received a message defining a no-flight-zone which
intersected the planned route. It was not specified if such no flight zone should be due to a METAR,
NOTAM or other source.

4 Potential impact and the main dissemination activities and exploitation of results
4.1 Expected impact
The aim of the CleanSky System for Green Operations ITD, and specifically the Management of
Trajectory and Mission (MTM) work package, is to demonstrate that the mitigation of external noise
generated by the aircraft and the reduction of emissions (main environmental goals of ACARE, the
European Technology Platform for Aeronautics and Air Transport) can be supported by the
prediction of the new Green trajectory development.
To this purpose, avionic polarimetric radar has been proposed as a new advanced system to better
sensing weather phenomena. New polarimetric radar signal processing algorithms has been
developed for weather classification as well as trajectory optimization techniques based on Q-AI
approach. Such algorithms have been implemented in an EFB in the KLEAN project and tested on
simulated data generated by the CleoSim signal simulator realized in the CLEOPATRA project .
Algorithm assessment is strongly affected by the reliability of the radar data simulator, therefore it is
not really clear if any conclusion coming out from the performance analysis results is not really clear
if it is due to the algorithm behaviour or if they are partially influenced by the processed data.
X-WALD will give a concrete solution to these doubts by planning specific measurements planned
and tailored to validate and refine both the CleoSim and the weather classification algorithms
The results of X-WALD will have a strong impact on the MTM work packages and on the whole
SGO-ITD partner member because:
1) A reliable avionic polarimetric weather radar simulator will be available that represents a valuable
tool for generating any kind of radar data in any weather condition, so saving money and effort in
conducting a multitude of real measurements.
2) The benefits of the weather classification and trajectory optimization algorithms to the reduction
of noise pollution and gas emissions will be quantitatively demonstrate on real data.
3) Tests on the behaviour of the EFB in a real scenarios can be conducted also assessing the impact
that these new decision-aid tools have on the pilots.

4.2 Dissemination of the project
The dissemination of the project results has been carried out in two different ways: internal and
external dissemination actions.
- Internal dissemination: the dissemination among the consortium partners has been done
through the organization of internal meeting operated by audio or video conferences or held
directly in the main sites of participants. Internal reports facilitated the divulgation of
technical results among the project consortium staff.
- External dissemination: External dissemination has been carried out in four different ways.
(a) project web site (www.xwald.cnit.it)
(b) one open workshops addressed for the Cleansky community
(c) Participation to international scientific conferences
(d) Participation to Exhibition and DEMO sessions of international conference/events
4.3 Exploitation of the project
The results of the project can be provided useful benefits to existing correlated EU projects such as
FP6 FLYSAFE (on flight safety), FP7 ALICIA (on operative conditions) SESAR (on overall air
traffic optimization), SANDRA (on next generation of air-to-ground telecommunication systems)
and CLEANSKY (on air traffic optimization to reduce emissions and noise pollution).
Specifically, X-WALD will represent an useful procedure to verify how much the pilot decision
support will have an impact in the flight green trajectory, if these new EFB algorithm could also have
an interest influence on flight safety (the optimized trajectories must continue the avoidance of
hazard situations), and finally having a better characterization of weather phenomena.
4.4 Management of intellectual property rights
The X-WALD participation will agree, before project start, on rules defining the access rights to the
Intellectual Property Rights (IPR) on the Knowledge and on the pre-existing know-how, for the
purpose of the achievement of the project on one side, and for further exploitation of those results on
the other side.

4.5 Contribution to European Competitiveness
As explained in the impact section, X-WALD could be considered as a reference model for
measurement planning with avionic polarimetric radar . Moreover, assessment and validation of the
X-WALD data can also injected in the Mission/flight simulator to test the benefits produced by the
EFB weather algorithms.
European dissemination throughout the Europe also allows stakeholders to have a clear idea of the
project results and show it to the air transport community, with a right level of new know how.
All these aspects are in the direction of providing significant gain in Europe, both individually and
collectively, to have a tangible impact for return of investment on Europe.
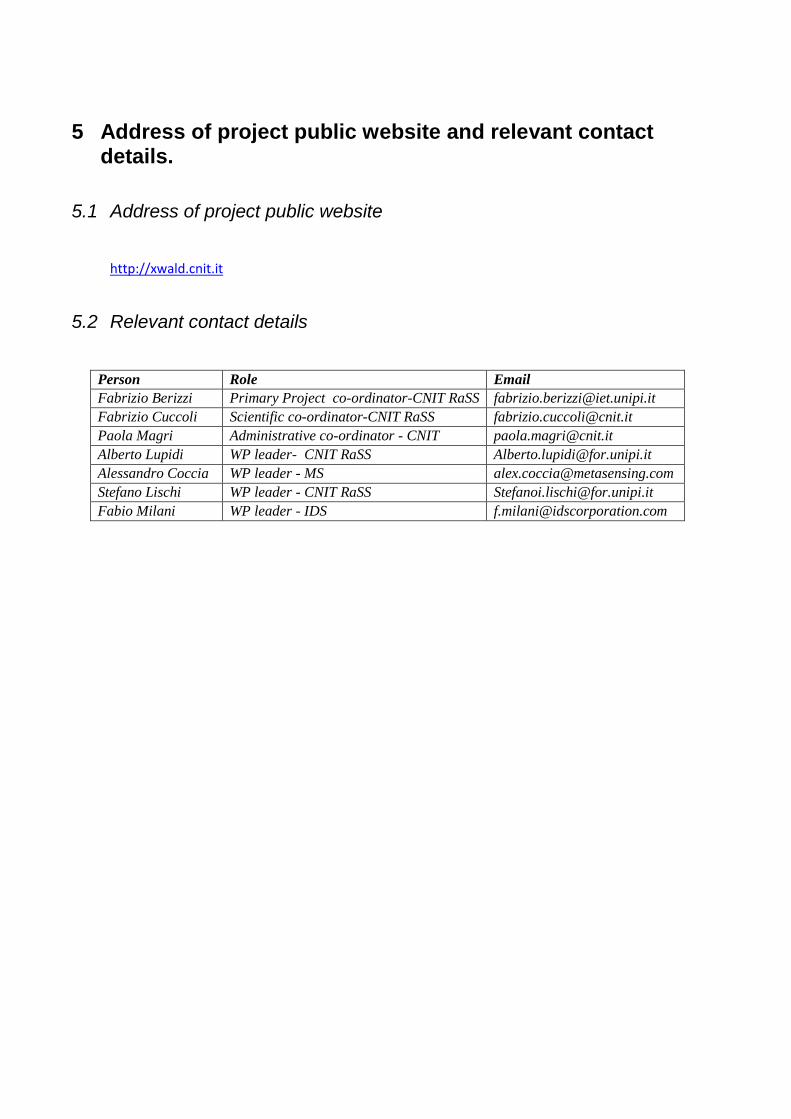
5 Address of project public website and relevant contact details.
5.1 Address of project public website
http://xwald.cnit.it
5.2 Relevant contact details
Person Role Email
Fabrizio Berizzi Primary Project co-ordinator-CNIT RaSS [email protected]
Fabrizio Cuccoli Scientific co-ordinator-CNIT RaSS [email protected]
Paola Magri Administrative co-ordinator - CNIT [email protected]
Alberto Lupidi WP leader- CNIT RaSS [email protected]
Alessandro Coccia WP leader - MS [email protected]
Stefano Lischi WP leader - CNIT RaSS [email protected]
Fabio Milani WP leader - IDS [email protected]