Elis investor day - Presentation (in English).pdf
168
Elis Investor Day 30 JANUARY 2018
-
Upload
khangminh22 -
Category
Documents
-
view
0 -
download
0
Transcript of Elis investor day - Presentation (in English).pdf

Elis Investor Day 30 JANUARY 2018
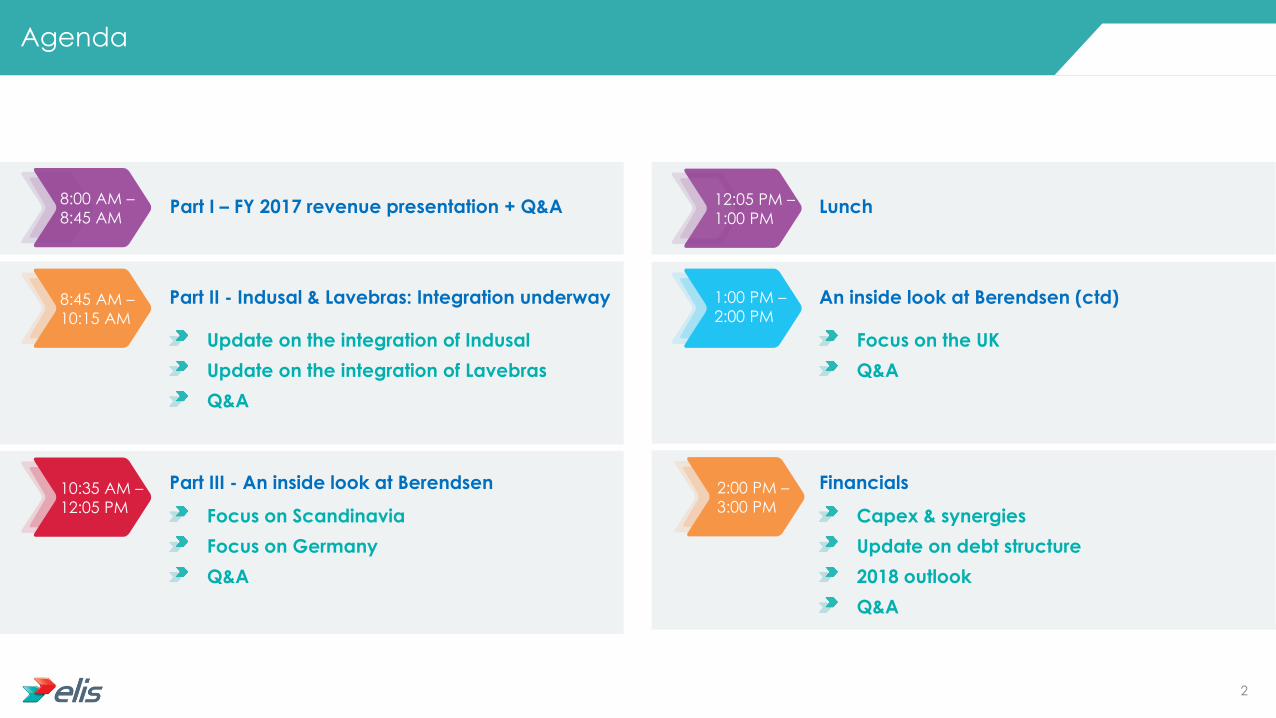
Agenda
Part I – FY 2017 revenue presentation + Q&A
Part II - Indusal & Lavebras: Integration underway
Update on the integration of Indusal
Update on the integration of Lavebras
Q&A
Part III - An inside look at Berendsen
Focus on Scandinavia
Focus on Germany
Q&A
Lunch
An inside look at Berendsen (ctd)
Financials
Focus on the UK
Q&A
Capex & synergies
Update on debt structure
2018 outlook
Q&A
12:05 PM –
1:00 PM
1:00 PM –
2:00 PM
8:00 AM –
8:45 AM
8:45 AM –
10:15 AM
10:35 AM –
12:05 PM
2:00 PM –
3:00 PM
2

FY 2017 revenue presentation Louis Guyot - CFO

New breakdown of revenue by geography
Latin America
Scandinavia & Eastern Europe
Central Europe
Southern Europe
France UK & Ireland
4
France
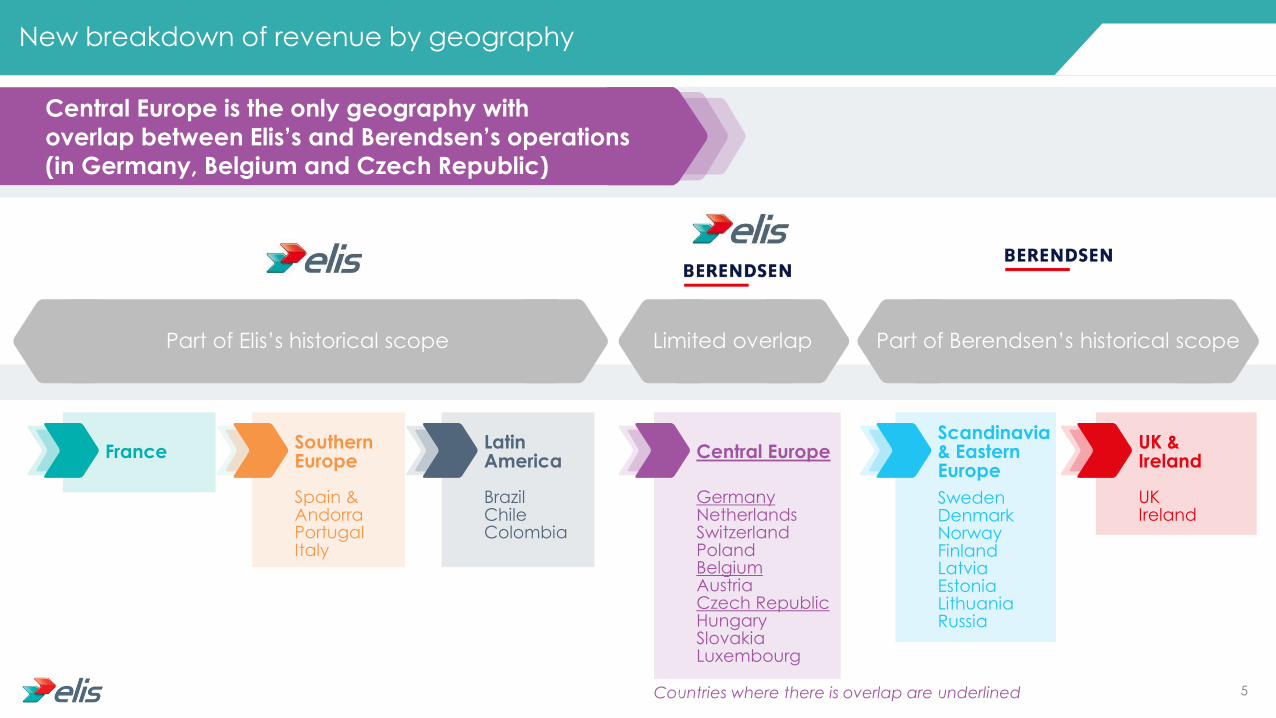
New breakdown of revenue by geography
Part of Elis’s historical scope Limited overlap Part of Berendsen’s historical scope
Central Europe is the only geography with
overlap between Elis’s and Berendsen’s operations
(in Germany, Belgium and Czech Republic)
Southern Europe
Latin America
Spain & Andorra Portugal Italy
Brazil Chile Colombia
Central Europe
Germany Netherlands Switzerland Poland Belgium Austria Czech Republic Hungary Slovakia Luxembourg
Scandinavia & Eastern Europe
UK & Ireland
Sweden Denmark Norway Finland Latvia Estonia Lithuania Russia
UK Ireland
Countries where there is overlap are underlined 5

Strong growth in FY 2017 revenue, driven by acquisitions
2017 2017 vs. 2016
2,214.9
(In €mn)
FY 2017
revenue Reported:
+46.4%
At constant
exchange
rate: +46.0%
Organic:
+2.4%
6

FY 2017 revenue by geography
2017 2016 Reported
growth
Organic
growth
1,009.0
388.8
164.2
152.5
259.1
221.2
20.0
2,214.9
984.2
218.6
-
-
158.1
132.9
18.9
1,512.8
+2.5%
+77.8%
n/a
n/a
+63.9%
+66.4%
+6.3%
+46.4%
+1.4%
+1.0%
n/a
n/a
+5.6%
+7.0%
+2.7%
+2.4%
France
Central Europe
Scandinavia & Eastern Europe
UK & Ireland
Southern Europe
Latin America
Other
Total
(In €mn)
7

FY 2017 revenue by quarter
Q1 2017 Q2 2017 Q3 2017 Q4 2017
237.0
64.3
-
-
55.5
38.8
5.0
400.6
257.6
66.2
-
-
68.3
48.7
4.4
445.2
267.2
98.1
40.1
38.1
75.1
67.0
4.2
589.8
247.2
160.3
124.1
114.4
60.2
66.6
6.5
779.4
France
Central Europe
Scandinavia & Eastern Europe
UK & Ireland
Southern Europe
Latin America
Other
Total
(In €mn)
8
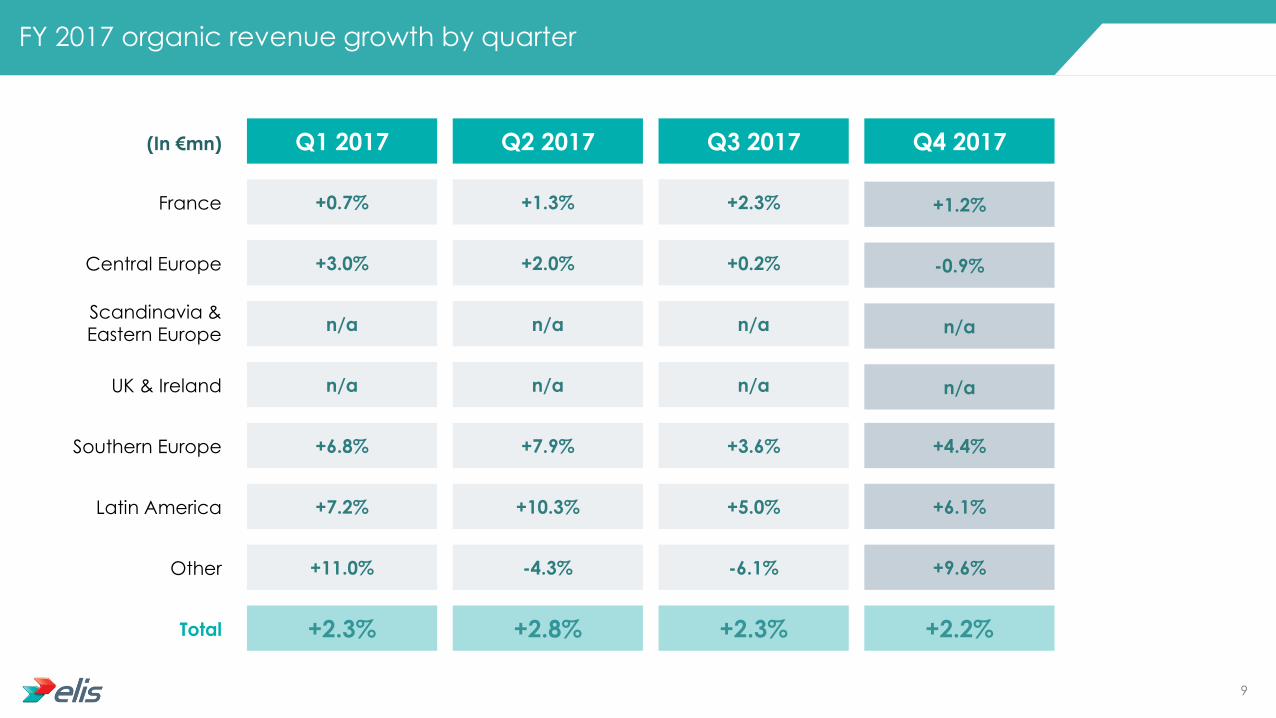
FY 2017 organic revenue growth by quarter
Q1 2017 Q2 2017 Q3 2017 Q4 2017
+0.7%
+3.0%
n/a
n/a
+6.8%
+7.2%
+11.0%
+2.3%
+1.3%
+2.0%
n/a
n/a
+7.9%
+10.3%
-4.3%
+2.8%
+2.3%
+0.2%
n/a
n/a
+3.6%
+5.0%
-6.1%
+2.3%
+1.2%
-0.9%
n/a
n/a
+4.4%
+6.1%
+9.6%
+2.2%
France
Central Europe
Scandinavia & Eastern Europe
UK & Ireland
Southern Europe
Latin America
Other
Total
(In €mn)
9
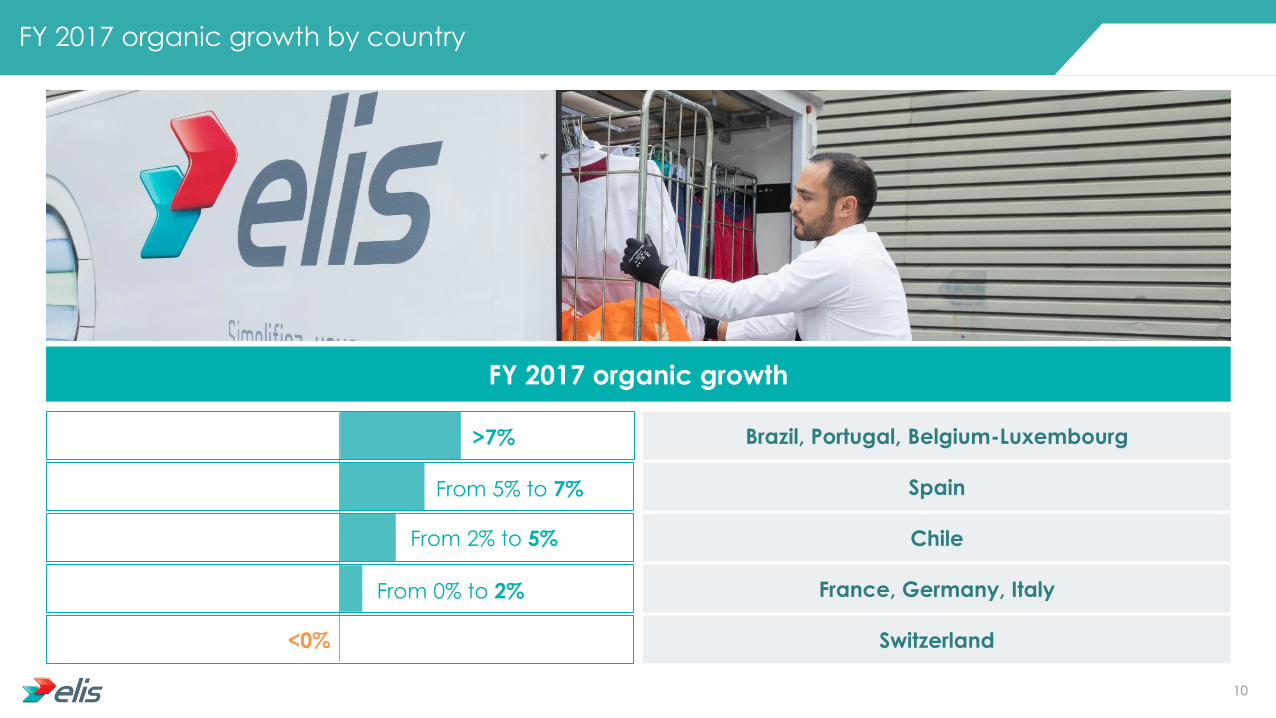
FY 2017 organic growth by country
FY 2017 organic growth
Brazil, Portugal, Belgium-Luxembourg
Spain
Chile
France, Germany, Italy
Switzerland
>7%
<0%
From 5% to 7%
From 2% to 5%
From 0% to 2%
10

Includes both Elis and
Berendsen operations
Elis: +1.0% organic growth in
2017 with c. 2% growth in
Germany and a disappointing
year in Switzerland
Berendsen: +4.9% organic
growth in 2017
Central Europe
FY 2017 revenue key highlights by geography 1/2
Revenue up +2.5% in 2017
+1.4% organic growth
Positive trends in Hospitality
and Trade & Services
Subdued activity in Industry
and Healthcare
No broad recovery
observed yet
France
Berendsen geography only
Lower volumes in Hospitality
Client losses following
underperformance due to
operating and commercial
issues
Revenue down -2.9% on an
organic basis in 2017
UK & Ireland
Berendsen geography only
Commercial momentum is
good in the region
Organic growth of +3.1%
in 2017
Scandinavia & Eastern Europe
11

Revenue up +66.4% (impact of the acquisition of
Lavebras and Bardusch Brazil)
Organic growth of +7.0%
Commercial momentum and price increases above inflation
Tough comparable base due to the 2016 uplift from the Rio Olympic Games
Latin America
FY 2017 revenue key highlights by geography 2/2
Revenue up +63.9%
Strong impact of the
acquisition of Indusal
+5.6% organic growth with a good commercial momentum
Strong performance in Portugal
Slight slowdown in Spain due to a high comparable base (the summer of 2016 was very good)
The recent events in Catalonia impacted the
Hospitality business in Q4
Southern Europe
+2.4% organic growth
+46.0% growth excluding FX
+46.4% growth overall
Group
12

Investor day opening remarks
Xavier Martiré - CEO

Xavier Martiré
Chairman of the
Management
Board & CEO
Louis Guyot
Member of the
Management
Board & CFO
Romain Dupuy
CEO Spain
Otávio Carvalho
CEO Brazil
Erik Verstappen
COO Scandinavia
and Benelux
Andreas Schneider
COO Germany and
Eastern Europe
Yann Michel
COO France, UK
and Ireland
Mark Franklin
Country Operations
Director UK
Speakers
14

Berendsen is a transformational acquisition for Elis
The Indusal, Lavebras and Berendsen acquisitions underscore the acceleration of our growth strategy
Potential to improve operating performance in our countries
Potential for further M&A in most of our markets
Elis has strengthened its leadership in a consolidating industry,
with a more balanced footprint and a greater capacity for innovation
Elis well-positioned for further value creation
1
2
3
4
5
15

Elis: From the Great Laundries of Pantin to an industry leader
2017
Foundation of the
Grandes Blanchisseries
de Pantin (Great
Laundries of Pantin) by
Théophile Leducq
2 services,
€130mn
revenue
Creation of
the Elis group,
standing for
Europe Linge
Service
4 services,
€510mn
revenue
8 countries
End of the
Leducq
family
ownership
and 1st LBO
by BC
Parners
5 services,
€700mn
revenue
10 countries
2nd LBO by
PAI Partners
Revenue:
€950mn
3rd LBO by
Eurazeo
6 services,
€1,330mn
revenue
Acquisition of
Atmosfera in
Brazil
€1,415mn
revenue
13 countries
Elis IPO
Acquisition
of Indusal
Proforma
revenue:
€3bn
28 countries
Acquisition of
Lavebras &
Berendsen
2016 2015 2014 2007 2002 1997 1968 1883
16

A long track-record of continuous expansion
Historical net sales evolution (in €mn)
0
500
1 000
1 500
2 000
2 500
3 000
50s 60s 70s 80s 90s 1994 1997 2000 2001 2005 2007 2009 2011 2012 2013 2014 2015 2016 2017 PF
Flat linen Workwear Washroom Dust mats Beverages International
New products
/ Services
New countries
1999-2002 Launch of Water Cooler
and Espresso services
1994 Luxem-
bourg
1987-90 Portugal
& Germany
1973 Belgium & Spain
1999 Italy
2010 Start of expansion
in Switzerland
2014 Further expansion
in Brazil with Atmosfera
2013 Launch of
Pest Control service
1978 Launch of Dust
Mat service
2003 Launch of Resident
Linen service
1968 Creation
of Elis “brand”
2012 Brazil
1992 Switzerland
2015 Chile
2016 Colombia
2001 Czech
Republic
FRANCE
2017 28
countries
with Berendsen
17

Elis: A track record of
continuous growth
Continuous YoY organic
growth since the Group was
created
More than 50 acquisitions over
the last 10 years
Strong structural market drivers
offer significant growth potential
in our core
businesses
With the acquisition of
Berendsen, Elis will accelerate its
development in Europe
Stable or increasing
margins in all
geographies
Predictable and resilient level of
cash flows
Capital deployment policy will allow
focused investments for growth and a
consistent dividend policy
Elis: A story of profitable growth
18

Successful track record in acquiring and integrating businesses
Countries
More than 50 acquisitions since 2010
2010 2011 2012 2013 2014 2015 2016
Number of acquisitions
Additional annualized revenue
(in €mn)
Strategic acquisitions
2017
7 7 4 8 7 9 6 5
52 22 11 47 ~100 ~70 ~240 ~1,470
Atmosfera Indusal Lavebras
Berendsen
Strategic acquisitions
or bolt-ons to
consolidate positions,
enter new geographies
or offer new services
19

Greater geographical diversification
France 33%
Central Europe
21%
Southern Europe
9%
Latin America
7%
Scandinavia & Eastern Europe
15%
UK & Ireland 15%
France now represents 33% of Group revenue compared to c. 60% before the Berendsen transaction
Balanced European presence
Fast-growing platform in Latin America
FY 2017 revenue breakdown by geography
proforma of the full-year impact of Berendsen 20

Elis’ revenue and profitability by country
EBITDA margin >35%
Revenue (in €mn)
France 1,010
Sweden / Finland 220
Denmark 190
The Netherlands 120
Poland 40
Czech Republic / Slovakia/Hungary
10
EBITDA margin 30%-35%
Revenue (in €mn)
Norway 60
Portugal 50
EBITDA margin below 25%
Revenue (in €mn)
UK 420
Italy 30
Chile 20
Baltics & Russia 10
Colombia 10
Our target: Raise all the countries up to the level of the Group’s top performers
EBITDA margin 25%-30%
Revenue (in €mn)
Germany / Austria 340
Brazil 230
Spain 180
Switzerland 110
Ireland 50
Belux 30
Note:
Elis: 2017 revenue actual figures (rounded) - Colombia and Brazil are pro forma for the full-year impact of the 2017 acquisitions
Berendsen: Full-year 2017 proforma revenue figures
21

Indusal and Lavebras opening remarks Xavier Martiré - CEO

Acquisitions of Indusal and Lavebras: 2 illustrations of Elis’ M&A strategy
Strong track-record of growth in these markets
Double-digit organic growth for
Elis in Spain in 2014, 2015 and 2016
Double-digit organic growth for
Elis in Brazil in 2015 and 2016
despite challenging
macroeconomic conditions
Both deals were announced on
21 December 2016
Beyond the timing coincidence,
many similarities:
Two countries with strong potential
Organic growth:
Local outsourcing is still limited
and both markets should double
their size in the medium term
External growth:
Additional bolt-on opportunities
23

Acquisitions of Indusal and Lavebras: 2 illustrations of Elis’ M&A strategy
Similar deal tactics
First contacts with the sellers were initiated years ago and regular
meetings were held, so Elis was the first call in both situations
Similar outcome
Elis has doubled its market share in both countries from c. 15% to c. 30%
and has become a strong market leader
Similar profitability
targets
Network densification will lead to significant productivity gains: EBITDA
margin of 30% by 2019 in both countries
24

Update on the integration of Indusal Romain Dupuy – CEO of Elis Spain

Romain Dupuy CEO of Elis Spain
Age: 44
Academic background: Engineer (graduated from Ecole
Nationale des Ponts et Chaussées)
Professional experience: SAUR (subsidiary of Bouygues):
3 years
Autoroutes du Sud de la France
(Vinci): 4 years
Joined Elis in 2007:
Plant Director: 3 years
Director in Spain: 1 year
CEO of Elis Spain since September 2011
26

Main themes covered
Presentation of the Spanish market
Elis in Spain
Update on the integration of Indusal
1
3
4
Agenda
Competitive landscape & market dynamics 2
27

-5%
-4%
-3%
-2%
-1%
0%
1%
2%
3%
4%
5%
2005 2006 2007 2008 2009 2010 2011 2012 2013 2014 2015 2016 2017 2018 2019 2020
Spain Western Europe
Historical and projected GDP growth 2005-2020
Spain has been rebounding since the 2009 crisis
Spain UK France
Area (sq km) 505,990 242,495 551,695
Inhabitants (mn) 46.5 65.6 64.8
Density (Inh/sq km) 92 271 116
GDP/capita (nominal $) 26,643 40,049 39,673
Unemployment rate (%) 16.7 4.2 9.2
Source: Wikipedia, Eurostat
Economy
5th largest European economy
Strong recovery since 2013 after the deep crisis between 2009-2013
Export-focused economy
Tourism industry is the second-biggest in the world
Very strong automotive, energy and agribusiness sectors
Barcelona SPAIN
Madrid
Balearic Islands
Valencia
Seville
28

49%
25%
18%
8%
A €650mn rental market, mostly geared towards flat linen
Andalusia €100mn
Madrid area
€50mn
Catalonia €130mn
Basque Country €25mn
In Spain, Elis operates in a €650mn market, essentially relating to textile services.
Since the end of the financial crisis, the market has been rebounding, driven by higher activity and positive outsourcing trend.
Barcelona SPAIN
Madrid
Valencia
Seville
Canary Islands €90mn
Levante €60mn
Balearic islands €115mn
Healthcare Hospitality Industry Trade & Services
Market breakdown by geography
Source: Elis estimates
29
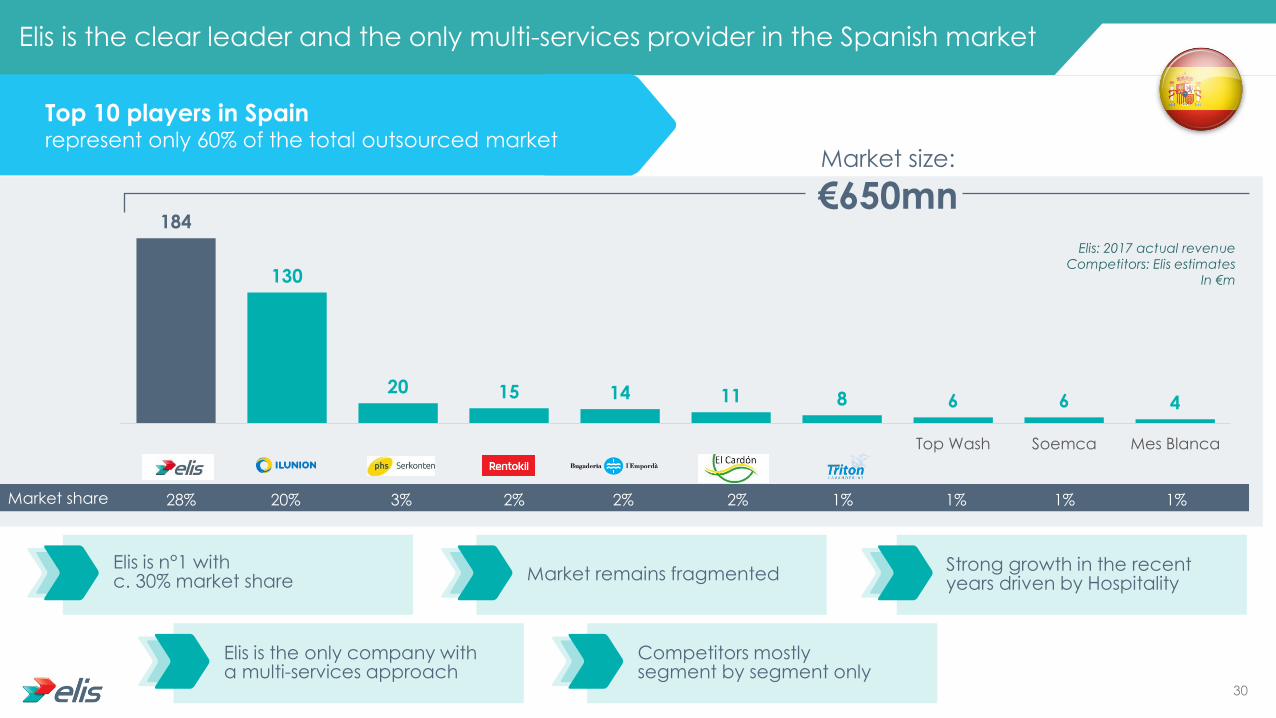
184
130
20 15 14 11 8 6 6 4
Top Wash Soemca Mes Blanca
Elis is the clear leader and the only multi-services provider in the Spanish market
Elis is n°1 with c. 30% market share Market remains fragmented
Strong growth in the recent years driven by Hospitality
Elis is the only company with a multi-services approach
Competitors mostly segment by segment only
Market share 28% 3% 2% 1% 1% 20% 2% 2% 1% 1%
Top 10 players in Spain
represent only 60% of the total outsourced market Market size:
€650mn Elis: 2017 actual revenue
Competitors: Elis estimates
In €m
30
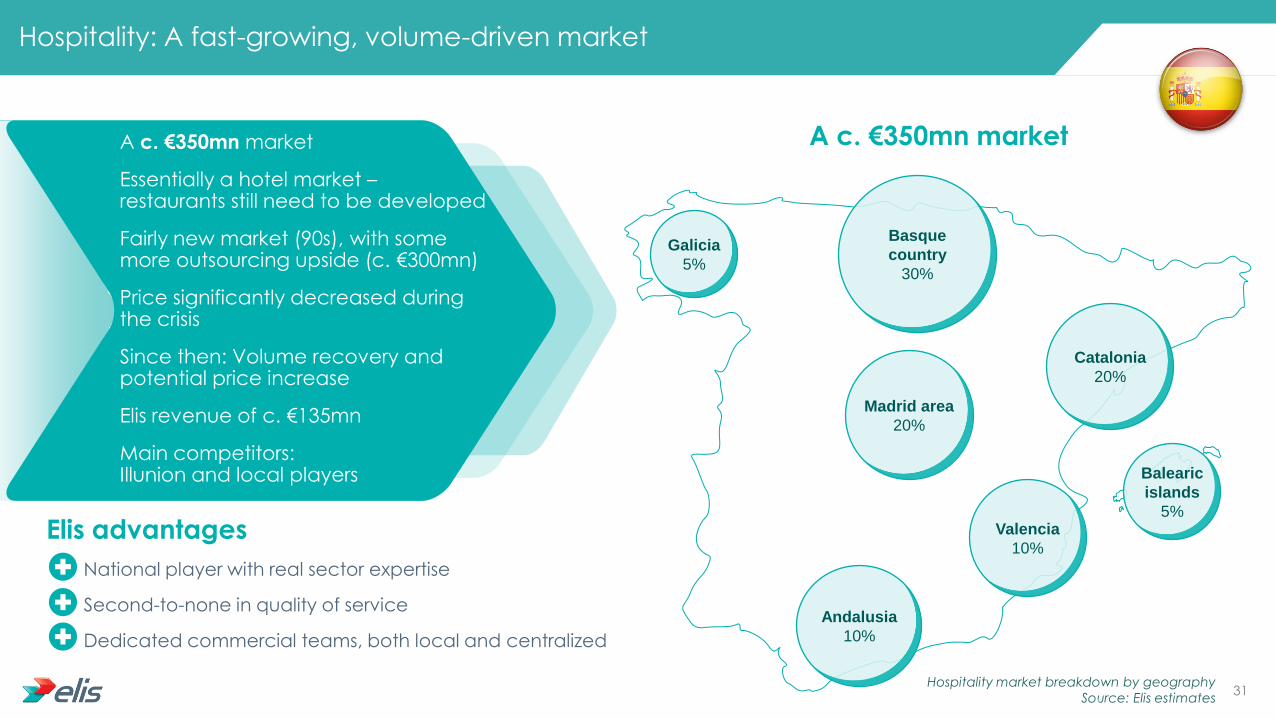
Hospitality: A fast-growing, volume-driven market
Andalusia
10%
Valencia
10%
Madrid area
20%
Catalonia
20%
Basque
country
30%
A c. €350mn market
Essentially a hotel market – restaurants still need to be developed
Fairly new market (90s), with some more outsourcing upside (c. €300mn)
Price significantly decreased during the crisis
Since then: Volume recovery and potential price increase
Elis revenue of c. €135mn
Main competitors: Illunion and local players
Galicia
5%
A c. €350mn market
Balearic
islands
5%
National player with real sector expertise
Second-to-none in quality of service
Dedicated commercial teams, both local and centralized
Elis advantages
Hospitality market breakdown by geography
Source: Elis estimates 31

Price increase potential with hotels
0
500
1 000
1 500
2 000
2 500
3 000
No star 1 star 2 stars 3 stars 4 stars 5 stars
Number of hotels
Majority of 3 or 4 star hotels looking for price over quality
Consolidation of the market makes negotiation easier
Volumes have been bouncing back since the crisis
Pricing has slightly increased flat but there is further upside potential
Elis is a clear leader in this market with revenue of c. €135mn
40
50
60
70
80
90
2008 2009 2010 2011 2012 2013 2014 2015 2016 2017
RevPar evolution 2008-2017
32

Healthcare: A highly competitive, mature market
A c. €160mn, volume-based
market with low prices
Hospitals and clinics have major budget
constraints and
outsource many services either directly
or through public services concessions
Virtually no seasonality in this
sector
Mostly public, but private sector is
growing, especially nursing homes
Illunion and Indusal were the main
players, competing fiercely on price. Elis
has chosen to be firm on pricing
Market has been
consolidating in the last years leading to
a pricing stabilization
Elis advantages
Recognized as the most reliable player offering a
customized range of services
33

Industry and Services: A fast-growing market
A c. 140mn market, mostly workwear
Very low
outsourcing rate -
market is growing
fast – could x3 in
next decade
Export-focused food
processing and pharma companies
face increasing demand from their
clients for traceability in the garment cleaning
process
Elis leads the outsourcing
transition with revenue of c. 20mn
No other national player - local players
sometimes join forces to propose a
national offer
34

0
20 000
40 000
60 000
80 000
100 000
120 000
2013 2014 2015 2016 2017
Elis is very well placed to benefit from the industry market growth
Heavy industry & automotive
Heavy industry sector is still
unregulated with companies
owning their garments and
outsourcing laundry
Elis is currently strengthening
its commercial team in this field
Rescue services
Fire service garments are being
outsourced
Only one main national
competitor
Elis entered the market in
2011 and won a major contract with Catalonia fire service in 2016
Small shops
Strong growth with clients like
hairdressers or fitness clubs
Growth is more subdued with
other retail businesses
Elis is the only player with a
logistics network that can serve small clients
Food-processing
Growth market
Increasing demand from
food-processing companies
and their clients for
traceability in the garment
cleaning process
Elis is the only credible,
national player
Pharma
Strong and increasing demand
for ultra clean garments
Also moving towards any kind
of uniform
Elis has a unique know-how in the ultra-clean sector (only player with the ISO 5
certification)
Number of Elis’ wearers 2010-2017
35

The small clients market represents a big opportunity for Elis
Potentially huge market
to be opened
c. 0.5% of Spanish companies are clients of Elis vs c. 4% in France
The vast majority of small clients are located in urban areas
Spain has more big cities than France
Spain has 14 cities with more than 300,000 inhabitants vs only 6 in France
355
233
382
250
402
277
437
278
568
303
674
343
703
472
814
513
1,621
861
3,256
2,206
0 500 1000 1500 2000 2500 3000 3500
Bilbao
Lille
Las Palmas
Bordeaux
Palma
Strasbourg
Murcia
Montpellier
Malaga
Nantes
Zaragoza
Nice
Seville
Toulouse
Valencia
Lyon
Barcelona
Marseille
Madrid
Paris
Number of inhabitants
(In thousands)
1
2
3
4
5
6
7
8
9
10
Hig
he
st p
op
ula
ted
citie
s
(Fra
nc
e &
Sp
ain
)
Source: Wikipedia 36

73% 13%
6%
8%
Elis Spain at a glance - 2017
86%
10%
4%
Revenue
€184mn EBITDA margin
c. 26% EBIT margin
c. 7% Sites
33
Employees c. 3,200
Market share c. 30%
Player
Flat linen: Market leader
Workwear: Market leader
HWB: Number 3
Customers c. 12,000 #1
Workwear Flat linen Hygiene & well-being
Healthcare Hospitality Trade & Services Industry
37

Elis’ industrial footprint in Spain is well-diversified and provides clients with a national network
Barcelona
Madrid
Valencia
Seville
Balearic Islands
€20mn
€10mn €40mn
€10mn
€40mn
€10mn €20mn
€30mn
Flat linen
Multi-services
Workwear
SPAIN
Good geographical diversification: Catalonia represents c. 19% of Elis revenue vs c. 50% 3 years ago
Strong footprint in the Basque country, with high price and a culture of clothes rental
Canary islands, one of the largest Spanish touristic spots, is still to be developed
Elis 2017 actual revenue
by region (rounded)
38

Elis acquires
Reig Marti
Revenue: c.
€4mn
Elis acquires
Blycolin
Revenue: c. €5mn
Elis Spain has demonstrated its ability to integrate assets
Elis enters Spain by
acquiring a small
business
Revenue: <€1mn
Elis opens a
workwear
plant in
Madrid
Elis takes over
Arly (flat linen
business) in
Parets (near
Barcelona)
Revenue: €15mn
Parets
becomes a
multi-service
plant and Elis’
HQ is located
there
Expansion in
Spain with the
opening of sites
in Vigo, Bilbao,
Valencia,
Zaragoza and
Sevilla
Elis acquires the
Spanish operations
of CWS.
Revenue: c. €5mn
Elis #4 in the market
Revenue: c. €20mn
Elis acquires the flat
linen and workwear
activities of Initial.
Revenue: c. €18mn
Elis #3 in the market
Revenue: c. €45mn
2017 2016 2015 2014 2013 2012 2010 2008 2007 2006 2001 2000 1996 1973
Elis acquires
Explotadora
Revenue: c. €6mn
Elis acquires
Lavalia
Revenue: c.
€10mn
Elis acquires La
Paloma
(Getafe)
Revenue: €6mn
Elis acquires
Indusal
Revenue:
c. €90mn
Elis #1 in the
market
Revenue:
c. €180mn
Elis acquires
Textil Rent
(Almansa)
Revenue: €3mn
39

Indusal key highlights
Founded in 1981 in Pamplona, Indusal is a family business
Leading player in the Spanish linen
rental and laundering sector
Provides mainly flat linen services for the hospitality and healthcare
sectors
Diversified customer base with a strong
focus on some large clients
24 plants in Spain, with a strong presence in
Northern Spain Plants generally smaller than Elis’
c. 1,450 employees (June 2016)
40

Indusal at a glance
2016 revenues: €90mn
By activity By end-market
92%
2% 6%
70% 25%
5%
Barcelona
Madrid
Valencia
Seville
Balearic Islands
Indusal’s centers
Elis’ centers
Strong presence of
Indusal in the Basque
country and in Navarra
Workwear Flat linen
Hygiene & well-being
Healthcare Hospitality
Other
41

€184mn revenue 2017
National player
c. 3,200 employees
#1 Elis: €184mn
#2 Ilunion: €130mn
#3 L'emporda: c. €20mn
30% market share
Combined entity
2016
Multi-regional player
€87mn revenue
#1 Ilunion: €130mn
#2 Elis & Indusal: €85mn/€90mn
c. 15% market share
Elis in Spain before the acquisition
With Indusal, Elis is now a clear leader in Spain
Elis: actual revenue
Competitors: Elis estimates 42

Elis has started the integration of Indusal in a very timely manner
21 Dec 16
Closing January February
In-depth HR review
Validation of the industrial plan
Hiring of consultancy firm
dedicated to integration
processes
Renegotiation of main
purchases terms
15 March
Implementation of the new
central organization (Finance,
HR, commercial)
New operational organization
with 3 regional directors
reporting to Spain CEO
April to June
Closure of 3 sites (2 in
Navarra and 1 near
Valencia)
First measures of logistics
optimization
August to Oct
Merger of Indusal’s 42 legal
entities into 3 main ones
End of October
Shut down of Indusal
HQ in Pamplona
End
of Dec
One site closure in the
Basque Country
Finalization of the logistics
optimization
Q1
2018
2 additional site
shutdowns scheduled
43

3 8 10
2017 2018 2019
Update on synergies: What we said in December 2016
Topline synergies
Cost synergies
c. €10m synergies
per year by 2019
c.30% by 2019 EBITDA margin
Phasing of synergies (in €mn)
90%
10%
44

Update on synergies: Where we are today
€2.0mn: productivity gains
€1.9mn: improvement of gas and chemical products purchasing conditions
€1.8mn: site closures
€8.2mn Total impact on EBITDA on an
annualized basis as of 2017
€9.8mn Total impact on EBIT on an annualized basis as of 2017
€1.2mn: HQ shut down
€0.8mn: logistics organization optimization
€0.5mn: pricing
€1.6mn: linen purchase (EBIT impact only)
Synergies achieved as of 31 December 2017:
Phasing of synergies is ahead of schedule
We confirm:
The €10mn EBITDA synergy target for 2019
The 30% EBITDA margin target for Spain by the end of 2019 45
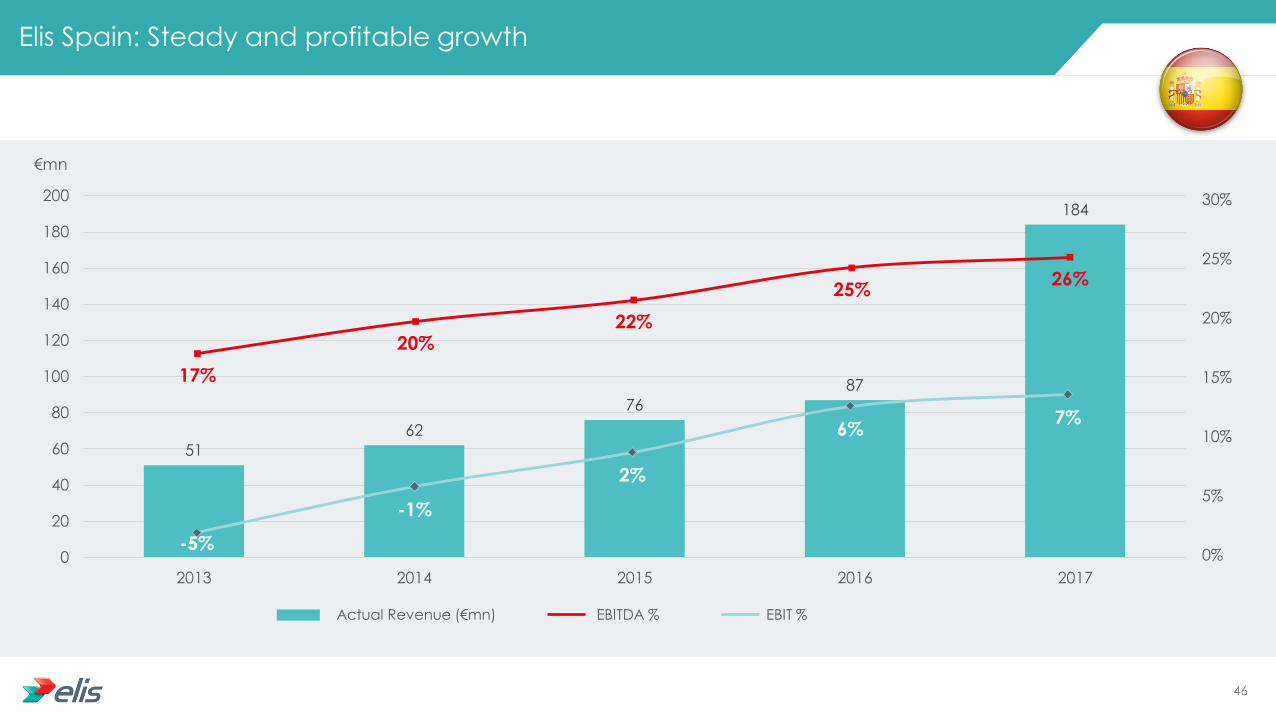
Elis Spain: Steady and profitable growth
51
62
76
87
184
0
20
40
60
80
100
120
140
160
180
200
2013 2014 2015 2016 2017
17%
20% 22%
25% 26%
-5%
-1%
2%
6% 7%
0%
5%
10%
15%
20%
25%
30%
Actual Revenue (€mn) EBITDA % EBIT %
€mn
46
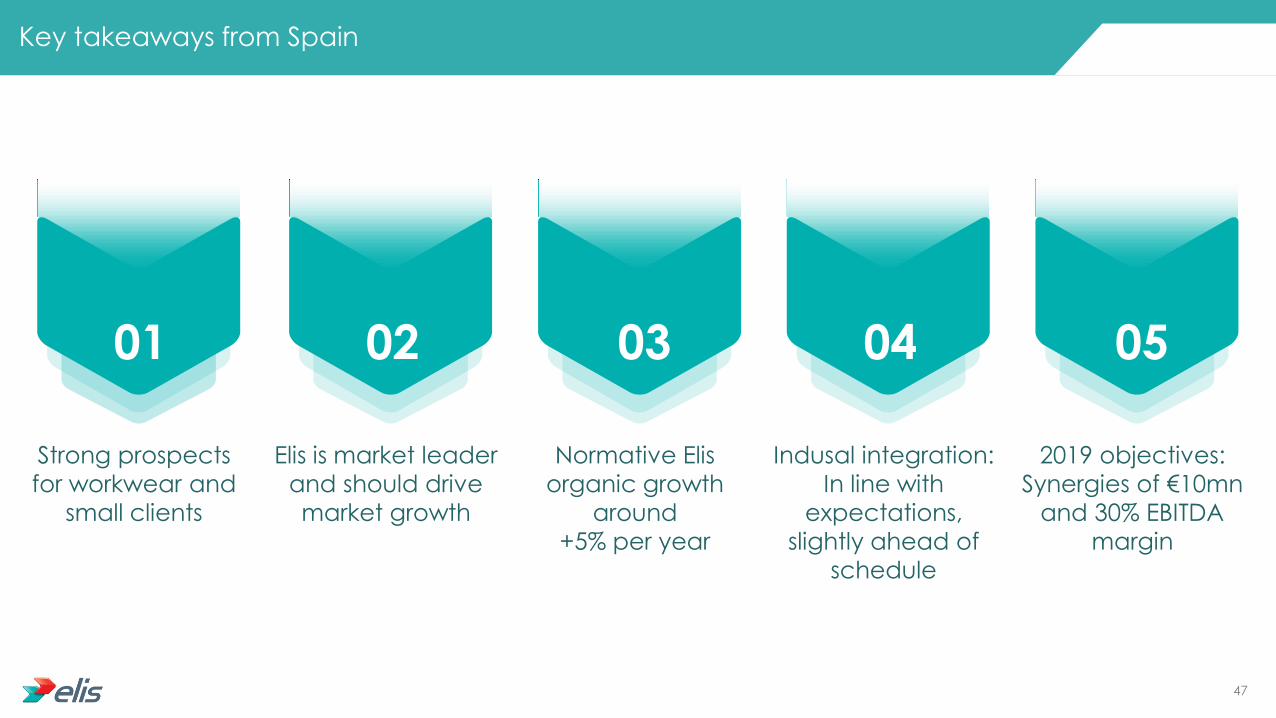
Key takeaways from Spain
01
Strong prospects
for workwear and
small clients
02
Elis is market leader
and should drive
market growth
03
Normative Elis
organic growth
around
+5% per year
04
Indusal integration:
In line with
expectations,
slightly ahead of
schedule
05
2019 objectives:
Synergies of €10mn
and 30% EBITDA
margin
47

Update on the integration of Lavebras Otávio Carvalho - CEO of Elis Brazil

Otávio Carvalho CEO of Elis Brazil
Age: 44
Academic background: Graduated as Aeronautical
Engineer from ITA-Aeronautical
Institute of Technology in Brazil
Master in Finance degree from
the London Business School
Professional experience: Procter & Gamble (3 years)
A.T. Kearney (5 years)
Votorantim Cimentos, leading
cement company in Brazil (5
years)
WestRock, 2nd largest paper and
packaging company worldwide
(5 years)
Joined Elis in March 2015
49

Main themes covered
Presentation of the Brazilian market 1
Agenda Elis in Brazil
Update on the integration of Lavebras
3
4
Competitive landscape & market dynamics 2
50

Historical and projected GDP growth 2005-2020
Brazil’s economy is recovering
Brazil UK France
Area (sq km) 8,514,876 242,495 551,695
Inhabitants (mn) 206.8 65.6 64.8
Density (Inh/sq km) 24 271 116
GDP/capita (nominal $) 11,604 40,049 39,673
Unemployment rate (%) 12.0 4.2 9.2
Source: Wikipedia, Eurostat
Economy
8th biggest global economy
Economy has been facing significant headwinds since 2011 but signs of improvement are visible
Brazil is a global leader in agriculture and natural resources
Industry (notably aeronautics) is also very strong
-6%
-4%
-2%
0%
2%
4%
6%
8%
10%
2005 2006 2007 2008 2009 2010 2011 2012 2013 2014 2015 2016 2017 2018 2019 2020
Brazil Western Europe
BRAZIL
51

The total Brazilian linen market today represents c. €1.2bn
Our definition of the Brazilian market is
made up of linen products only and excludes Hygiene and well-being products
Brazilian linen market breakdown
The market is roughly equally split between workwear and flat linen
Industry and Healthcare are the main end-markets as Hospitality remains limited in Brazil
We estimate that c. 42% of the existing market is still operated
by internal laundries (mainly in Healthcare)
55%
45%
Workwear Flat linen
42%
58%
Internal laundries External laundries
11%
50%
Hospitality Industry Healthcare
39%
52

Mostly a workwear and flat linen market
c. 80% of the Brazilian market consists in workwear for industrial clients and flat linen for healthcare
Brazilian linen market breakdown
Most clients are private with the exception of a part of Healthcare (12% public, 88% private)
82%
4%
Healthcare
Industry
20%
69%
Hospitality
Healthcare
Industry
11%
45% 55%
Flat linen Workwear
14%
Hospitality
53
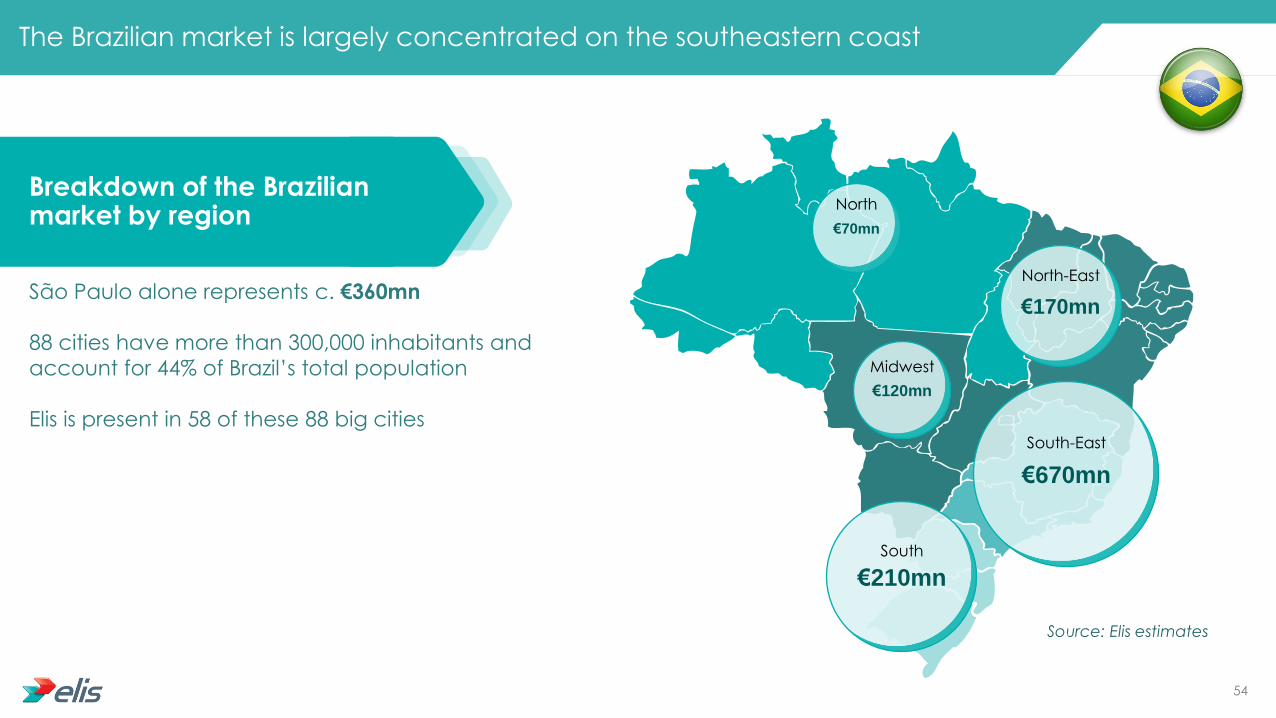
Breakdown of the Brazilian market by region
The Brazilian market is largely concentrated on the southeastern coast
São Paulo alone represents c. €360mn
88 cities have more than 300,000 inhabitants and
account for 44% of Brazil’s total population
Elis is present in 58 of these 88 big cities
€670mn
South-East
€210mn
South
€170mn
North-East
€70mn
North
€120mn
Midwest
Source: Elis estimates
54

Great potential for market growth
Rental model should contribute to boost market growth
Very low outsourcing ratio, especially in Workwear
Potential for price increases
Political environment remains a concern
No help from the macro environment in recent years
Public clients are currently facing cash constraints
With the acquisition of Lavebras, Elis has consolidated its leadership in Brazil
Top 6 players in Brazil represent
more than half of the outsourced
market
230
52 37
14 9 1
Market share >30% 2% 1% <1% 7% 5%
Market size: €1.2bn (including internal laundries)
Elis: 2017 revenue pro forma for the full-year impact of the acquisitions
Competitors: Elis estimates
In €mn
55

Growth prospects are strong in every end-market
Market growth drivers
Healthcare
• Aging of population: People over 65 expected to represent 9.4% of the
Brazilian population in 2020 (vs 6.4% and 2010)
• Increase of chronic diseases
• Technological advances / product innovation
• Growth of emerging markets
Hospitality
• BRL12.8bn will be invested in the Hospitality industry over the next 6 years
• 408 new projects by 2020
• Over the same period, the number of available rooms will increase from
c. 94,000 to c. 164,000 (+75%)
Industry • GDP recovery (-3.6% in 2016, +1.1% in 2017 and +2.8% for 2018E)
Source: Forum of Hotel Operators of Brazil (FOHB), Brazilian Ministry of Tourism
56

Elis enters the Brazilian market
through the opening of a
commercial office
Elis’ history in Brazil
2012
Acquisition of Atmosfera and L’Acqua
2014
Acquisition of Teclav
2015
Acquisition of Martins & Lococo, MPW
and Laves
2016
Acquisition of Lavebras and
Bardusch
2017
Revenues (in BRLmn)
Revenues (in €mn)
Customers
Employees
c. 266
c.60
3,649
3,601
c. 325
c. 90
3,752
3,848
c. 440
c. 110
4,105
4,757
c. 890
c. 230
+5,000
8,970
proforma
57
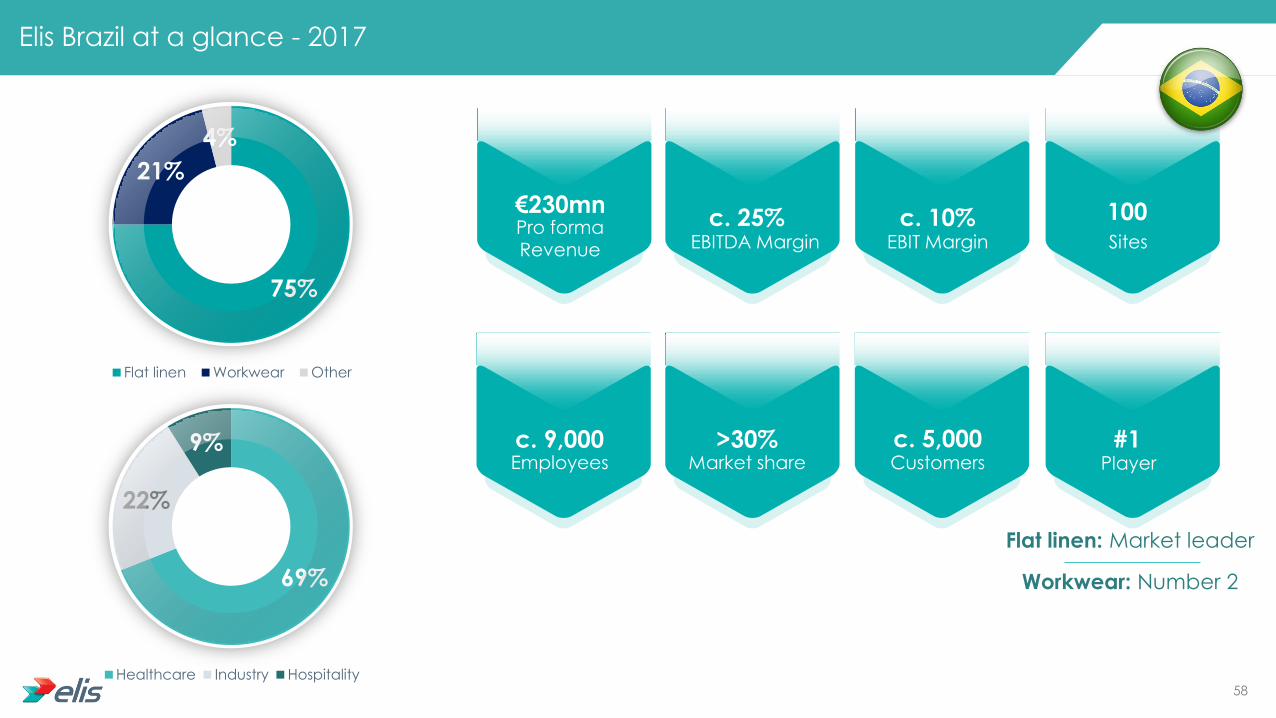
Elis Brazil at a glance - 2017
Pro forma
Revenue
€230mn
EBITDA Margin
c. 25% EBIT Margin
c. 10% Sites
100
Employees c. 9,000
Market share >30%
Player
Flat linen: Market leader
Workwear: Number 2
Customers c. 5,000 #1
75%
21%
4%
Flat linen Workwear Other
69%
22%
9%
Healthcare Industry Hospitality58

Elis has a strong national footprint
In most geographies,
plants are multi-services
In large geographies (e.g. in São
Paulo), some plants are specialized
in a specific segment
In situ plants (installed at our
customers' production sites) adjust
to the client’s activity (industry,
healthcare)
100 sites in Brazil, including 58 in situ plants
€40mn
€20mn
€120mn
€50mn
Elis 2017 revenue by region (rounded)
pro forma for the full-year impact of the acquisitions
59

Historical Revenue and profitability
Between
2014-2017:
Revenue: x3
EBITDA %: +440bps
EBIT %: +430bps
Elis is the undisputed market leader
Second-to-none industrial footprint
Strong commercial power
Some bolt-on M&A opportunities
Inflation still high, but below previous historical levels
85 87
113
195 20%
21%
23%
25%
5%
2%
5%
10%
0%
4%
8%
12%
16%
20%
24%
28%
0
50
100
150
200
250
2014 2015 2016 2017
Actual revenue (in €mn)
EBITDA %
EBIT %
60

Lavebras at a glance
2016 revenues: BRL370mn
By activity By end-market
7% 26%
67%
Main Lavebras centers
Main Elis centers
Rio de Janeiro
São Paulo
Belo
Horizonte
Salvador
Fortaleza
Brasilia
Curitiba
Recife
75%
25%
Company description Family-owned business created in 1997
Offers complete linen solutions for hotels, hospitals and frozen food business
Has grown both organically and externally in the past few years,
with 12 acquisitions since 2015
Extensive network of 76 plants in 17 different states
Network of small laundries in-situ (agri-business)
Limited linen capex requirements linked to Brazilian market specificities
(higher weight of non-rented linen)
Workwear Flat linen Industry Healthcare Hospitality
61

c. BRL890mn pro forma revenues 2017
c. 9,000 employees
#1 Elis: BRL890mn
#2 Alsco: c. BRL200mn
#3 Servizi Italia: c. BRL140mn
>30% market share
Combined entity
c. BRL440mn revenue 2016
c. 3,700 employees
#1 Elis: BRL440mn
#2 Lavebras: BRL370mn
#3 Alsco: c. BRL200mn
c. 15% market share
Elis in Brazil pre-acquisition
Creation of an undisputed Brazilian leader
Elis: 2016 actual revenue. 2017 revenue is pro forma for the full-year impact of the acquisitions
Competitors: Elis estimates 62

(in BRL)
Positive pricing dynamics
2,65 2,79
2017 2016
Elis has been able to significantly increase pricing over the last years
+5.3% CAGR
(in BRL)
2,96 3,07 3,12 3,30 3,43
2017 2016 2015 2014 2013
+3.8% CAGR
Lavebras’ average pricing is below Elis’ due to a higher mix for pure laundry (vs rental-cleaning)
Price increase has been passed in 2017 for the Lavebras scope
63

Integration milestones since the closing on 24 May
Communication to existing clients about the transaction
Mapping and monitoring of clients identified as at risk
Alignment of contracts (customers and suppliers)
Sales/clients
Volume redistribution between plants
Optimization of the existing equipment distribution between plants
3 sites shut down (2 former Lavebras plants, 1 former Elis plant)
Route optimization
Cost renegotiations
Labor productivity and plant processes improvement
Operations
Implementation of Elis’ financial KPIs
One single ERP for all entities
Standardization of processes and centralization at a Shared Services Office
Identification and retention of key Lavebras managers
Implementation of a new organization with
5 regional directors
Alignment of trade union negotiations
Organization & HR
Finance & IT
Textile portfolio optimization
Capture of purchasing synergies
Procurement
Done
On-going
Later stage
64

A new organization has been put in place in Brazil, addressing the need for strong management of operations
Midwest South East North East
# Plants (on site)
# employees
6 (+39)
c. 1,300
5 (+1)
c. 1,400
7 (+5)
c. 1,400
São Paulo South Total
10 (+7)
c. 3,000
14 (+6)
c. 1,800
42 (+58)
c. 8,900
Region
65

10 40
60
2017 2018 2019
c.30% by 2019
Tax goodwill amortization of c. BRL300mn
to be amortized over 5 years
Update on synergies: What we said in December 2016
Topline synergies
Cost synergies
c. BRL60mn synergies
per year by 2019
EBITDA margin
67%
33%
Tax credit
Phasing of synergies (in BRLmn)
66

Update on synergies: Where we stand today
As of 31
December 2017
3.2
2.4
4.5
0.4
1.3
0.0
11.8
2018 target
8.6
6.0
6.7
7.7
7.1
4.0
40.0
Plant closures/volume rebalancing
Productivity gains
Cost renegotiations
Textile portfolio optimization
Central cost savings and other items
Revenue/margin improvements
Total
In BRLmn 2019 target
12.6
11.0
8.7
9.3
8.4
10.0
60.0
Phasing of synergies
is ahead of schedule
We confirm:
BRL60mn cash synergy
target for 2019
30% EBITDA margin target
for Brazil by the end
of 2019 67

Key takeaways from Brazil
01
Strong prospects for
market growth
02
Elis is market leader
and should drive
market growth
03
Elis organic growth
plan is mid to high
single digit
04
Lavebras
integration ahead
of schedule
05
2019 objectives
confirmed:
Synergies of
BRL60mn and 30%
EBITDA margin
68

Berendsen Opening remarks Xavier Martiré - CEO

Creation of a pan-European textile, hygiene and facility services leader with attractive market positions across its key geographies
Complementary geographical footprints – balanced presence across
Northern & Southern Europe with high-growth Latin America presence
Significant synergies in terms of operating costs and capital expenditure
Continuation of Elis's current strategy including enhanced organic growth, continued bolt-on M&A and focus on innovation and profitable market segments
Stronger, more balanced footprint in Germany with an enhanced product offering
Berendsen acquisition: Strategic rationale
1
2
3
4
5
70
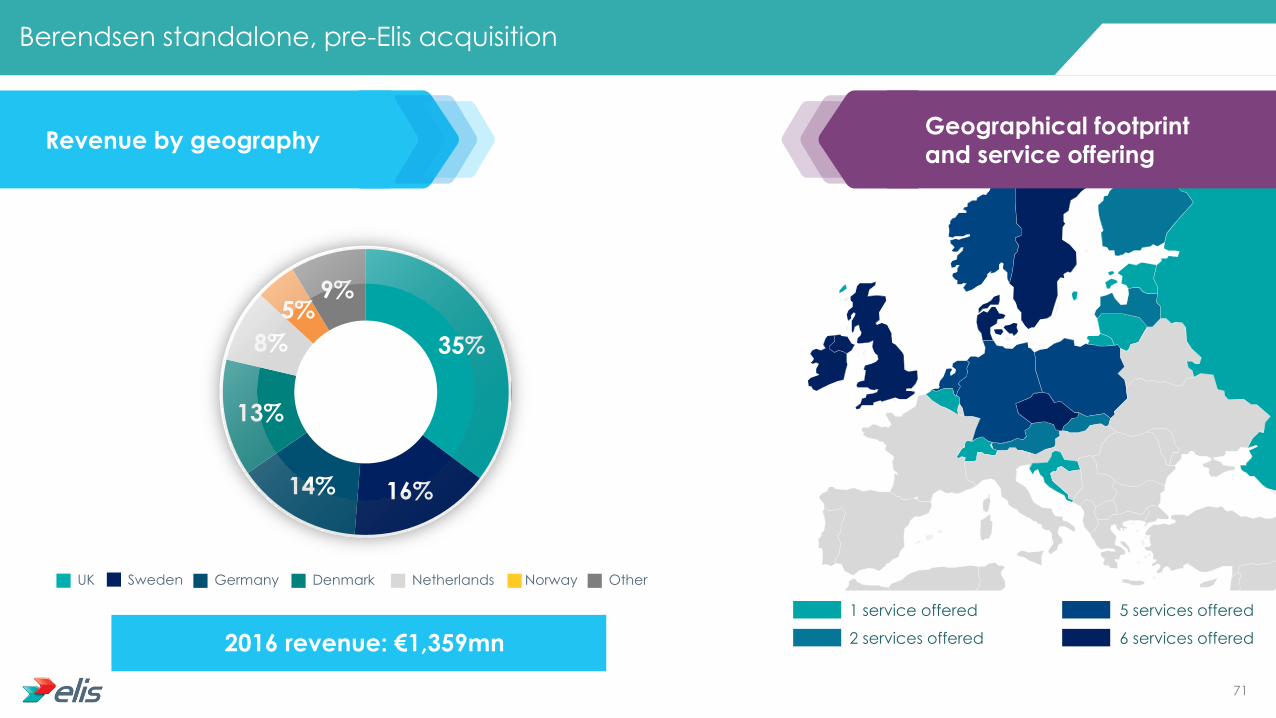
35%
16% 14%
13%
8%
5% 9%
1 service offered
2 services offered
5 services offered
6 services offered
Berendsen standalone, pre-Elis acquisition
2016 revenue: €1,359mn
Revenue by geography Geographical footprint
and service offering
Sweden UK Germany Denmark Netherlands Norway Other
71

A deal publicly born in May and closed in September
27 April
Private meeting Xavier Martiré – James Drumond
28 April
First offer 12 May
First offer
rejected
16 May
Second offer
16 May
Second offer rejected
18 May
Possible Offer (2.4 announcement)
From 18 May
Roadshow 7 June
« Agreement in Principle »
12 June
Firm Offer (2.7 announcement)
31 Aug
Elis AGM Court Meeting and Berendsen AGM
12 Sept
Closing Private
Public
72

A rapid integration process
More than 100 site visits including c. 40 by Xavier Martiré
Top 150 managers of Berendsen interviewed by Xavier Martiré and/or by Elis’ HR Director
Several integration work streams (Operations, Purchasing, Finance & Legal, IT, etc.) put in place in a timely manner
New organization announced internally on November, 13th – switch from Berendsen’s organization by Business Unit to Elis’ organization by geography
Since closing:
73

Top management organization
Chief Executive Officer Xavier Martiré
Chief Financial Officer
Louis Guyot
Engineering, Purchasing
& Supply Chain Director
Frédéric Deletombe
HR and CSR Director
Didier Lachaud
Transformation and Information
Systems Director
François Blanc
Marketing & Innovation Director
Caroline Roche
5 Central Functions
France – South-West
Italy
Spain
Portugal
France – center-East
Latin America
France – Paris
Hospit./ Healthcare
France – Rhône Alpes
France – South-East
France – North
Switzerland
France – ICS Paris
France – Brittany
UK
Ireland
Sweden
Denmark
Netherlands
Benelux
Norway
Finland
Germany
Austria
Poland
Baltics/Russia
Czech Rep./
Slovakia/Hungary
Chief
Operating Officer
Alain Bonin
Chief
Operating Officer
Matthieu Lecharny
Chief
Operating Officer
Yann Michel
Chief
Operating Officer
Erik Verstappen
Chief
Operating Officer
Andreas Schneider
Cleanroom Commercial Business Unit
Pest Control Commercial Business Unit
M&A France Commercial Departments International coordination for Hospitality
5 Operational Areas
74

An experienced management team with regional responsibilities
Andreas Schneider
Erik Verstappen
Yann Michel
Alain Bonin
Matthieu Lecharny
Paris: Yann Michel (Industry, Trade & Services) Alain Bonin (Hospitality, Healthcare)
75

Berendsen in Scandinavia & in the Netherlands Erik Verstappen - COO

Erik Verstappen COO Scandinavia and Benelux In charge of Cleanroom Commercial Business Unit across the Group
Age: 59
Academic background: Business Administration,
MBA from Erasmus University
Professional experience: 21 years in IT & Document
Management (Kyocera, Ricoh,
Rex Rotary)
Joined Berendsen in 2007:
Netherlands Managing Director: 5 years
Country Manager Workwear: 5 years
77

Sweden & Finland: c. €220mn
Denmark: c. €190mn
The Netherlands: c. €120mn
Norway: c. €60mn
Belgium & Luxembourg: c. €30mn
The Scandinavia & Benelux region
Revenue of the region: c. €610mn
Number of plants: 66
Number of employees: c. 4,000
78

Main themes covered
Overview of the region’s key countries:
Sweden, Denmark and the Netherlands
Presentation of Berendsen’s activities and
financial performance
Market dynamics
Impact of Elis’ acquisition of Berendsen
Presentation of the competitive landscape
1
2
3
4
5
Agenda
79

THE NETHERLANDS
80

Historical and projected GDP growth 2005-2020
The Netherlands: A very solid economy
Netherlands UK France
Area (sq km) 42,508 242,495 551,695
Inhabitants (mn) 17.1 65.6 64.8
Density (Inh/sq km) 393 271 116
GDP/capita (nominal $) 44,654 40,049 39,673
Unemployment rate (%) 4.4 4.2 9.2
Source: Wikipedia, Eurostat
Economy
Depends heavily on foreign trade
Fairly low unemployment and inflation
Strong industrial activity in food processing, chemicals, petroleum refining, high-tech, financial services, creative sector and electrical machinery
Amsterdam
NETHERLANDS
Rotterdam
The Hague
Eindhoven
-5%
-4%
-3%
-2%
-1%
0%
1%
2%
3%
4%
5%
2005 2006 2007 2008 2009 2010 2011 2012 2013 2014 2015 2016 2017 2018 2019 2020
Netherlands Western Europe
81
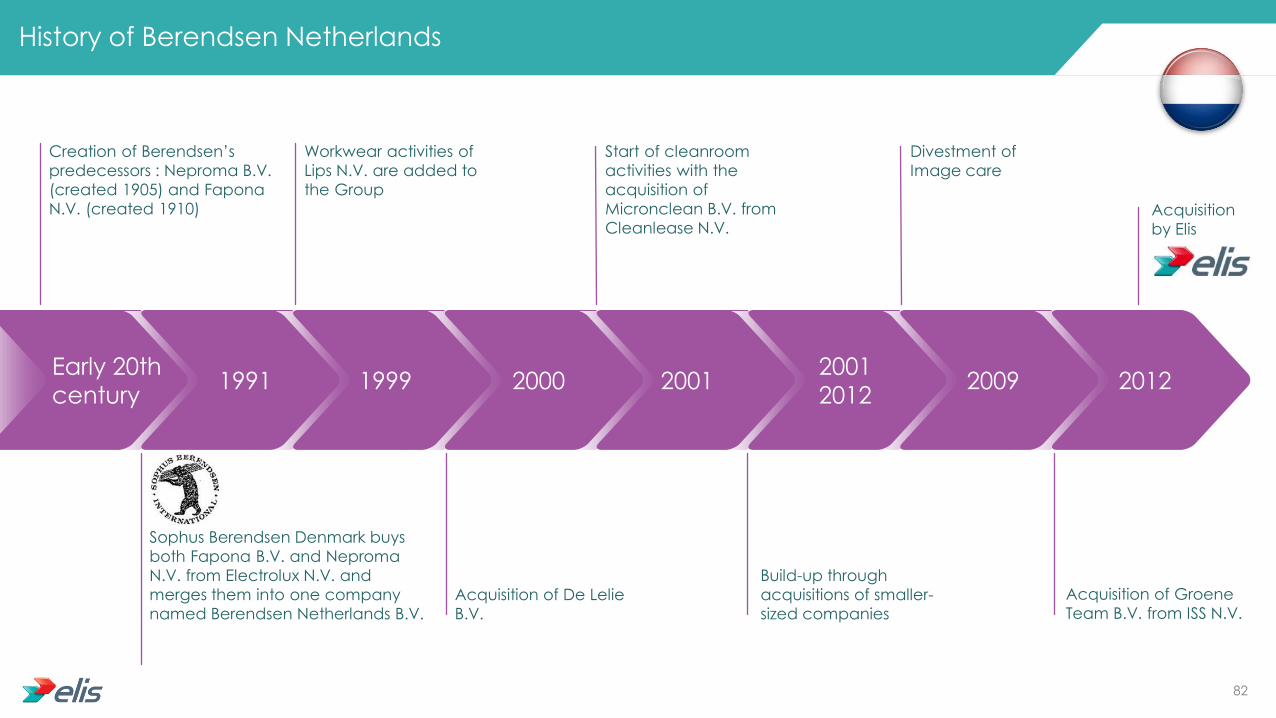
Creation of Berendsen’s
predecessors : Neproma B.V.
(created 1905) and Fapona
N.V. (created 1910)
History of Berendsen Netherlands
Sophus Berendsen Denmark buys
both Fapona B.V. and Neproma
N.V. from Electrolux N.V. and
merges them into one company
named Berendsen Netherlands B.V.
Workwear activities of
Lips N.V. are added to
the Group
Acquisition of De Lelie
B.V.
Start of cleanroom
activities with the
acquisition of
Micronclean B.V. from
Cleanlease N.V.
Build-up through
acquisitions of smaller-
sized companies
Acquisition of Groene
Team B.V. from ISS N.V.
Acquisition
by Elis
Divestment of
Image care
2012 2009 2001
2012 2001 2000 1999 1991
Early 20th
century
82

2%
4%
26%
68%
Berendsen Netherlands at a glance - 2017
19%
81%
Workwear: Market leader
HWB: Number 2
Flat linen: No presence
HWB Workwear
Hospitality Industry Healthcare Trade & Services
Revenue
€117mn EBITDA Margin
c. 38% EBIT Margin
c. 24% Sites 9
Employees c. 770
Customers 9,000
Player #1
83

The Netherlands is a very fragmented market
Top 4 players in the Netherlands represent around half of the total
outsourced market
223
129 117 82
Market share 19% 11% 10% 7%
Market size:
€1.2bn
Textile market is well developed but still growing, with a rental market
penetration of above 50%
Each segment is generally dominated by two or three players
Overall trend of concentration in the market, but fragmentation in some segments due to specific customer demands
Small laundries serving Hospitality, Healthcare or Industry clients are closing down while bigger laundries expand capacity
Berendsen: 2017 full-year pro forma revenue
Competitors: Elis estimates
In €mn
84

Amsterdam
The Hague
Eindhoven
Rotterdam
Six Workwear plants across the country
Zaandam
Schiedam
Ede
Uden
Helmond
Apeldoor
Klarenbeek
Hoogeveen
Bolsward
Business lines Sites
Total 9
Workwear 6
Washroom 1
Cleanroom 1
Mats 1
Good quality industrial asset Limited reinvestment foreseen and no plant closure expected in the near future
A new plant will become operational mid-2018 (replacing an old plant)
Capacity utilization is high
Washroom and Mat operations have been grouped with common leadership Distribution and production synergies
85

The Netherlands’ margins remain very resilient
83 86 93
106 105 107
114 117
46% 48%
44% 43% 41%
40%
38% 38%
28%
31% 28% 28% 27% 26%
24% 24%
0%
5%
10%
15%
20%
25%
30%
35%
40%
45%
50%
0
20
40
60
80
100
120
140
2010 2011 2012 2013 2014 2015 2016 2017
2010-2017:
Revenue CAGR: +5.0%
EBITDA CAGR: +2.3%
EBIT CAGR: +2.6%
Very experienced management team
Big market share in workwear
Potential M&A opportunities in Flat Linen (in which Berendsen is not active in the Netherlands)
Dilutive acquisition of ISS in 2012
Focus on key accounts → higher growth but slight
impact on EBIT margin
Impact of allocated cost structure
Actual Revenue (€mn) EBITDA % EBIT %
86

Amsterdam
NETHERLANDS
The Hague
Eindhoven
Opportunities from Elis Berendsen merger
New management structure - lower cost base
Elis’ multi services approach will generate
operational and logistics efficiencies
Refocus on small- and medium-sized customers
Less complex management structure - faster
decision-making
Plant/laundry as key organizational entity -
alignment of roles, responsibilities and
accountability
Sharing of best practices between
Elis and Berendsen
87

Key takeaways on the Netherlands
01 02 03 04 05
Solid economy
Business is highly
profitable with
good industrial
asset and healthy
client base
Commercial upside
with smaller clients
Mature market,
mostly Workwear for
Berendsen
Multi-services
approach will
create operational
improvements
88

SWEDEN
89

Historical and projected GDP growth 2005-2020
Sweden: A very solid economy outside the Eurozone
Sweden UK France
Area (sq km) 450,295 242,495 551,695
Inhabitants (mn) 10.0 65.6 64.8
Density (Inh/sq km) 22 271 116
GDP/capita (nominal $) 51,603 40,049 39,673
Unemployment rate (%) 6.6 4.2 9.2
Source: Wikipedia, Eurostat
Economy
Export-oriented economy based on:
Natural resources: Forest and iron ore
Engineering, telecom, automotive, pharmaceutical and defence industry
Stockholm
SWEDEN
Karlstad
Linkoping
Kalmar
Orebro
Gothenburg
Umea
Malmo
-6%
-4%
-2%
0%
2%
4%
6%
8%
2005 2006 2007 2008 2009 2010 2011 2012 2013 2014 2015 2016 2017 2018 2019 2020
Sweden Western Europe 90
2017
Acquisition by Davis
Service Group
2002
Name changed to
“Berendsen Textil Service”
2000
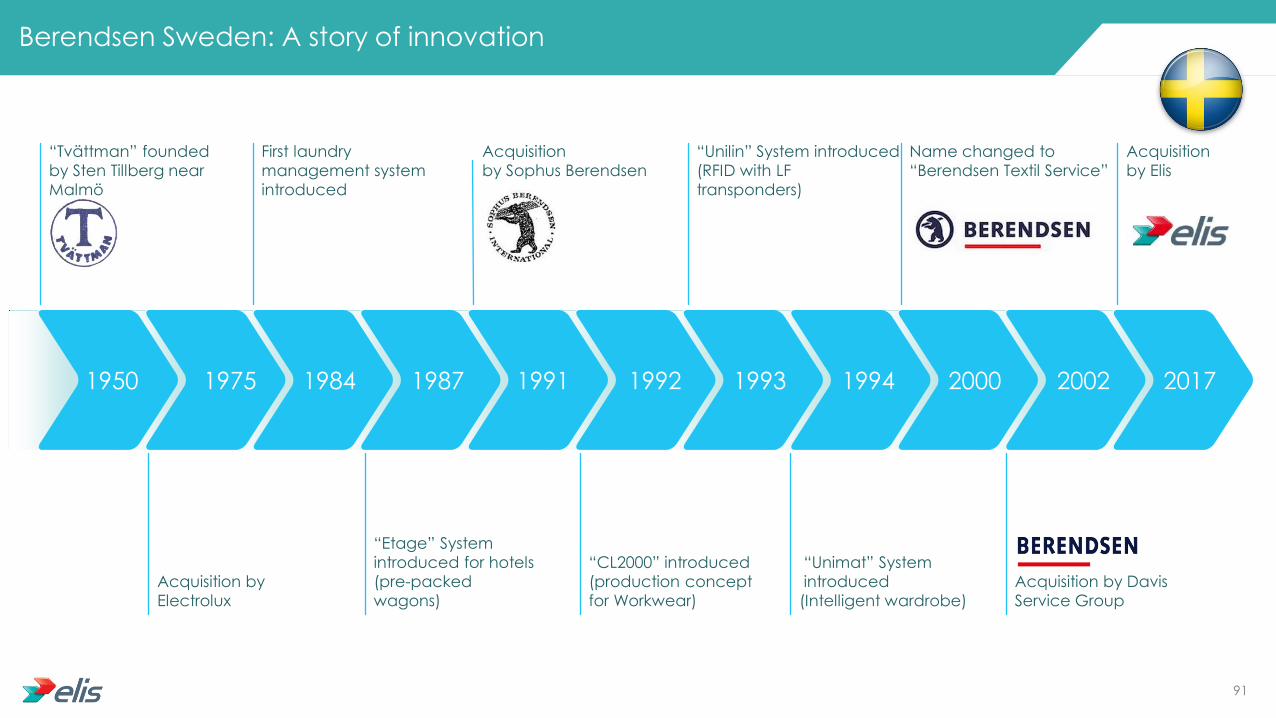
Berendsen Sweden: A story of innovation
“Tvättman” founded
by Sten Tillberg near
Malmö
Acquisition by
Electrolux
First laundry
management system
introduced
“Etage” System
introduced for hotels
(pre-packed
wagons)
Acquisition
by Sophus Berendsen
“CL2000” introduced
(production concept
for Workwear)
“Unilin” System introduced
(RFID with LF
transponders)
“Unimat” System
introduced
(Intelligent wardrobe)
1994 1993 1992 1991 1987 1984 1975 1950
Acquisition
by Elis
91

31%
35%
34%
Workwear: Market leader
HWB: Market leader
Flat linen: Number 2
15%
16% 27%
42%
Berendsen Sweden at a glance - 2017
*: Including Finland
HWB Workwear Flat Linen
Hospitality Industry Healthcare Trade & Services
Revenue*
€220mn EBITDA Margin
c. 38% EBIT Margin
c. 21% Sites
35
Employees 1,300
Customers +65,000
Player #1
92
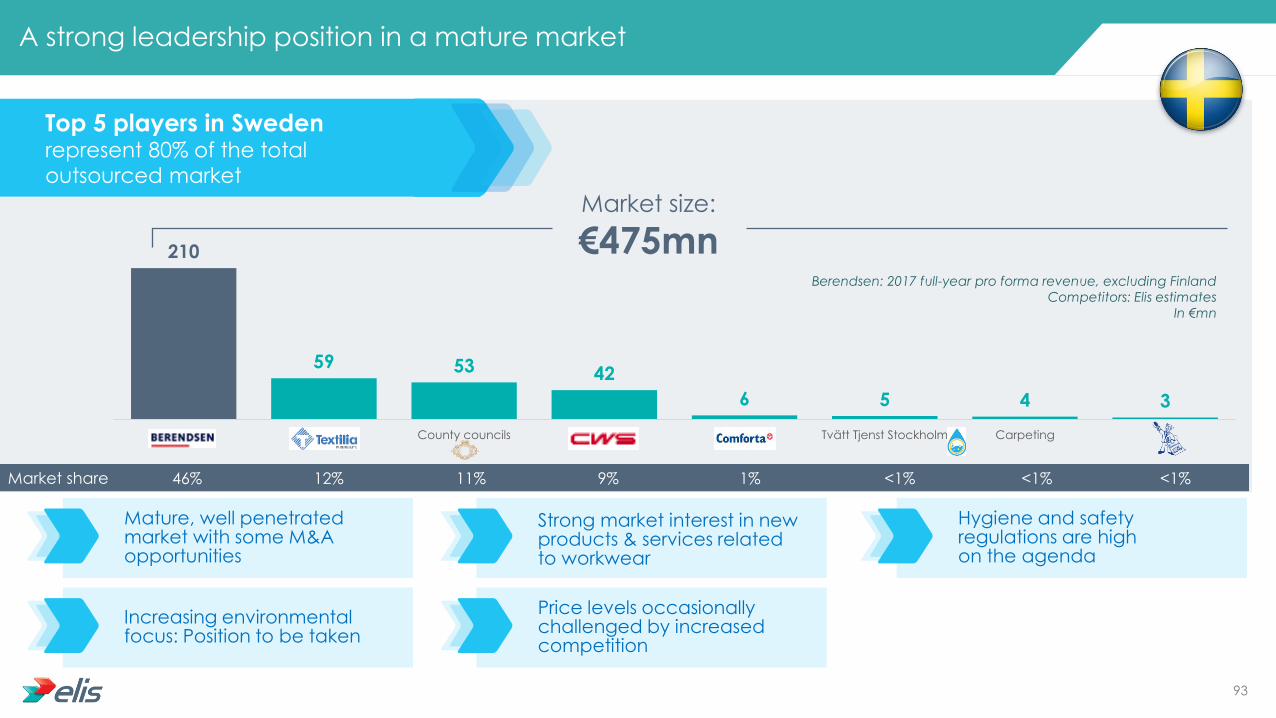
210
59 53 42
6 5 4 3
County councils Tvätt Tjenst Stockholm Carpeting
Top 5 players in Sweden
represent 80% of the total
outsourced market
A strong leadership position in a mature market
Market size:
€475mn
Market share 46% 9% <1% <1% 11% 12% 1% <1%
Mature, well penetrated market with some M&A opportunities
Strong market interest in new products & services related to workwear
Hygiene and safety regulations are high on the agenda
Increasing environmental focus: Position to be taken
Price levels occasionally challenged by increased competition
Berendsen: 2017 full-year pro forma revenue, excluding Finland
Competitors: Elis estimates
In €mn
93
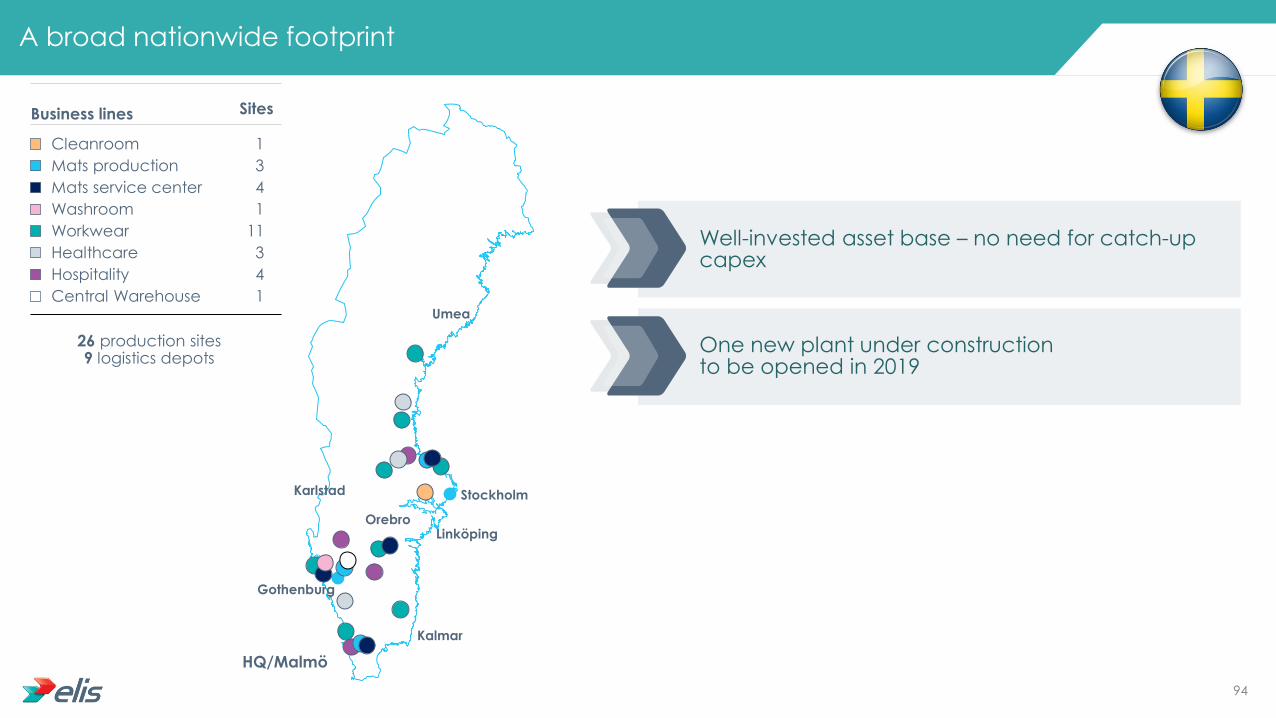
A broad nationwide footprint
Umea
Gothenburg
Kalmar
Stockholm
Orebro
Karlstad
Linköping
HQ/Malmö
Business lines Sites
26 production sites 9 logistics depots
Workwear 11
Washroom 1
Cleanroom 1
Mats production 3
Healthcare 3
Hospitality 4
Mats service center 4
Central Warehouse 1
Well-invested asset base – no need for catch-up capex
One new plant under construction to be opened in 2019
94

Berendsen Sweden: High and broadly stable EBIT margin
2010-2017:
Revenue CAGR: +6.8%
EBITDA CAGR: +4.8%
EBIT CAGR: +5.2%
136 153
161 167 180
192
205 216 43%
41% 39% 40% 40% 40%
39%
38%
24%
22% 20%
22% 22% 22% 22% 21%
0%
5%
10%
15%
20%
25%
30%
35%
40%
45%
50%
0
50
100
150
200
250
2010 2011 2012 2013 2014 2015 2016 2017
Strong leadership position supports growth
Very experienced management team
Quality of the business
High market share and high margins
Best-in-class social climate
Impact of allocated cost structure
Insufficient cross-selling
Flat linen business to be improved
Actual Revenue (€mn) EBITDA % EBIT %
95

Opportunities from Elis Berendsen merger
Stockholm
SWEDEN
Karlstad
Linkoping
Kalmar
Orebro
Gothenburg
Umea
Malmo
Complementary skill set between Berendsen’s strength in workwear & mats and Elis’ skills in Flat Linen
Streamlined organization
Multi-services approach to be rolled-out (cross-selling and logistics optimization)
96
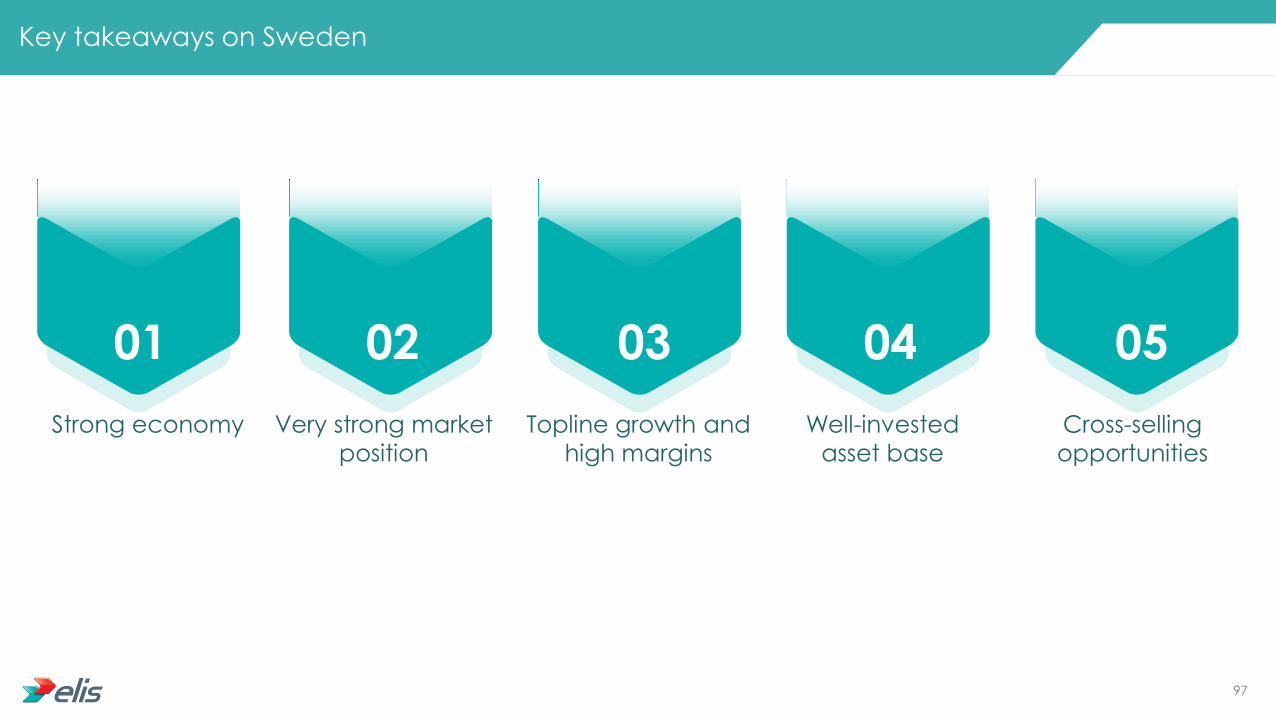
Key takeaways on Sweden
01 02 03 04 05
Very strong market
position
Well-invested
asset base
Cross-selling
opportunities
Topline growth and
high margins
Strong economy
97

DENMARK
98

Historical and projected GDP growth 2005-2020
Denmark: A mid-sized but very solid economy
Denmark UK France
Area (sq km) 42,931 242,495 551,695
Inhabitants (mn) 5.7 65.6 64.8
Density (Inh/sq km) 134 271 116
GDP/capita (nominal $) 56,335 40,049 39,673
Unemployment rate (%) 5.6 4.2 9.2
Source: Wikipedia, Eurostat
Economy
Mixed economy based on services and manufacturing
Economic climate is improving
Unemployment rate is decreasing
Inflation still at a relatively low level
Copenhagen
DENMARK
Vejle
Esberj
Randers
Odense
-6%
-5%
-4%
-3%
-2%
-1%
0%
1%
2%
3%
4%
5%
2005 2006 2007 2008 2009 2010 2011 2012 2013 2014 2015 2016 2017 2018 2019 2020
Denmark Western Europe
99

2017
Berendsen is
represented in 12
European
countries and is
market leader in
Denmark with 16
branches.
2008
History of Berendsen Denmark
Sophus Berendsen
founds the
company, dealing
in glass and steel
in Denmark.
A century of acquisitions
and expansion into
several new areas
including pest control,
equipment for rail,
marine and navigation.
First linen laundry
bought – foundation
stone of the Berendsen
we know today.
SoPhus Berendsen
is listed on the
Copenhagen Stock
Exchange.
Sophus Berendsen
acquires ISS
Linnedservice and
chooses to focus on the
linen business.
Davis Service Group
plc acquires Sophus
Berendsen a/s. shares
are delisted from the
Copenhagen Stock
Exchange.
Berendsen continues to
expand its market position
with the acquisition of
various laundries in
Denmark
2004
-2008 2002 1993 1973 1972
1860
-1960 1854
Acquisition
by Elis
100

29%
38%
33%
Flat linen: Market leader
Workwear: Market leader
HWB: Market leader
21%
12%
29%
38%
Berendsen Denmark at a glance - 2017
HWB Workwear Flat Linen
Hospitality Industry Healthcare Trade & Services
Revenue
€186mn EBITDA Margin
c. 36% EBIT Margin
c. 20% Sites 18
Employees 1,200
Customers 44,000
Player #1
101
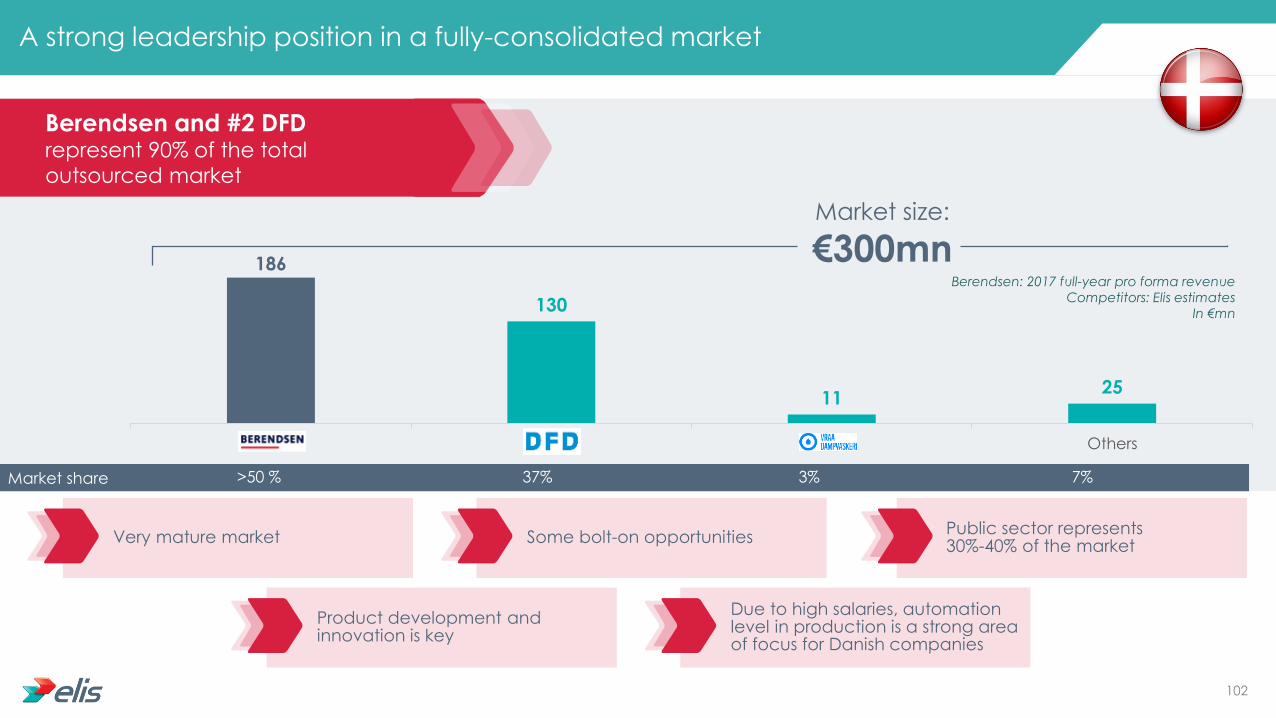
186
130
11 25
Others
Berendsen and #2 DFD represent 90% of the total
outsourced market
A strong leadership position in a fully-consolidated market
Market size:
€300mn
Market share >50 % 37% 3% 7%
Very mature market Some bolt-on opportunities Public sector represents 30%-40% of the market
Product development and innovation is key
Due to high salaries, automation level in production is a strong area of focus for Danish companies
Berendsen: 2017 full-year pro forma revenue
Competitors: Elis estimates
In €mn
102

Copenhagen
Vejle
Esberj
Randers
Odense
A broadly diversified industrial footprint
Business lines Sites
Total
Cleanroom
Healthcare
Hospitality
Mats
Washroom
Workwear
4
1
4
3
1
4
17
Well-invested asset base – no need for catch-up capex
Some minor capacity investments launched in 2017/2018
103

Best-in-class profitability, steady margins across the cycle
2010-2017:
Revenue CAGR: +3.2%
EBITDA CAGR: +3.1%
EBIT CAGR: +3.2%
151 157 159 161 166
173 180
186 36% 36% 35%
34% 35%
35% 35% 36%
20%
21% 20% 19% 19% 19% 19% 20%
0%
5%
10%
15%
20%
25%
30%
35%
40%
0
20
40
60
80
100
120
140
160
180
200
2010 2011 2012 2013 2014 2015 2016 2017
Strong leadership position in highly profitable services
Experienced management
Very efficient laundries
Very good social climate
High cost of workforce
Impact of allocated cost structure
Insufficient cross-selling
Actual Revenue (€mn) EBITDA % EBIT %
104

Opportunities from Elis Berendsen merger
Copenhagen
DENMARK
Vejle
Esberj
Randers
Odense
Leaner and empowered organization
Multi-services approach to be rolled-out
(cross-selling and logistics optimization)
105

Key takeaways on Denmark
01 02 03 04 05
Good, stable
economy
Well-invested
asset base
Upside from sharing
of best practices,
focus on smaller
customers and
cross-selling
opportunities
Very strong
market position
Topline growth and
strong profitability
106

In summary
Berendsen is a strong leader in
these stable, resilient
economies
Steady topline growth and
best-in-class profitability
Target is to maintain profitability
at its current high level
Potential to grow multi-services
1
2
3
4
107

Berendsen in Germany Andreas Schneider - COO
Andreas Schneider COO responsible for Germany & Austria,
Poland & Baltics & Russia and
Czech Republic & Slovakia / Hungary
Age: 51
Academic background: MBA in Economics
Professional experience: 1986-1998: Several finance positions at Gruner & Jahr AG & Co. (one of the biggest German printing &
publishing companies)
1998-2004: Responsible for the “turnaround business unit” at Haarmann Hemmelrath Management Consultant
2004-2008: CFO and COO in two logistic companies within the “Deutsche Bahn Group” (Railion Denmark and TFG Transfracht GmbH)
Joined Berendsen in 2008 as CFO for the Central Europe region
Appointed Finance Director Workwear at Berendsen in January 2012 109

Germany & Austria: c. €340mn
Poland: c. €40mn
Baltics and Russia: c. €10mn
Czech Republic,
Slovakia, Hungary: c. €10mn
A business spanning multiple countries
Revenue of the region: c. €400mn
Number of plants: 48
Number of employees: c. 6,500
110

Main themes covered
Presentation of the German market
Presentation of the competitive landscape
Presentation of Elis & Berendsen’s activities and
financial performance
Impact of Elis’ acquisition of Berendsen
Market dynamics
1
2
3
4
5
Agenda
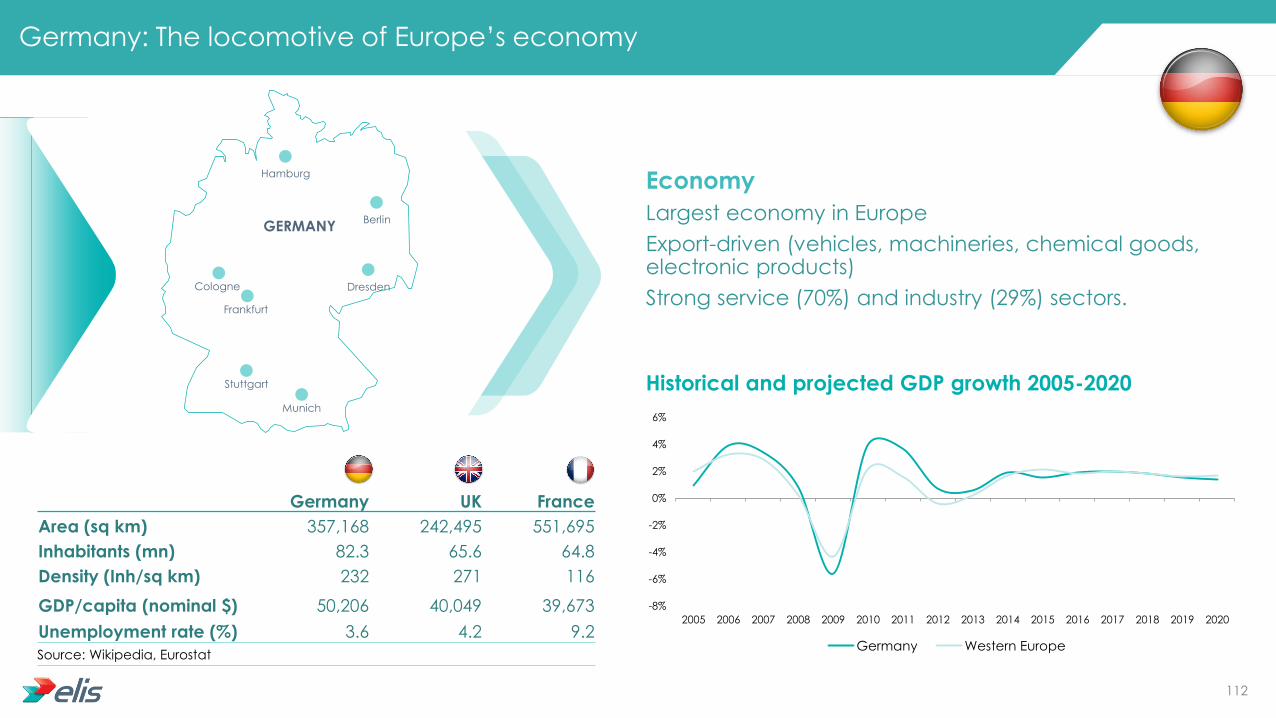
Historical and projected GDP growth 2005-2020
Germany: The locomotive of Europe’s economy
Germany UK France
Area (sq km) 357,168 242,495 551,695
Inhabitants (mn) 82.3 65.6 64.8
Density (Inh/sq km) 232 271 116
GDP/capita (nominal $) 50,206 40,049 39,673
Unemployment rate (%) 3.6 4.2 9.2
Source: Wikipedia, Eurostat
Economy
Largest economy in Europe
Export-driven (vehicles, machineries, chemical goods, electronic products)
Strong service (70%) and industry (29%) sectors.
-8%
-6%
-4%
-2%
0%
2%
4%
6%
2005 2006 2007 2008 2009 2010 2011 2012 2013 2014 2015 2016 2017 2018 2019 2020
Germany Western Europe
Berlin GERMANY
Munich
Frankfurt
Cologne
Hamburg
Dresden
Stuttgart
112

The German market is by far the largest market in Europe
€142mn €79mn
€308mn
€204mn
€109mn
€109mn
€887mn
€320mn
€210mn
€50mn
€591mn
€706mn
€529mn Nordrhein-Westfalen
Baden-Württemberg
Bayern
Hamburg Berlin
Hessen
Flat Linen Work wear Hygiene
In Germany, Elis/Berendsen operates in a €4.2bn market, with €3.7bn relating to textile services.
c. 25% of the market is with public entities
Market breakdown by geography
Source: Elis estimates
51%
36% 13%
113

3 926
4 002
4 116
4 244
3 700
3 800
3 900
4 000
4 100
4 200
4 300
2013 2014 2015 2016
A mature but growing market
Source: WIRTEX Branchenkompendium 2016, Elis estimates
In €mn
114

750
500
323 260*
187 187* 123 120* 110
Elis is now number 3 in a market that remains very fragmented
Top 9 players represent around half of the total
outsourced market
Market share 18% 12% 8% 6% 5% 4% 4% 3% 3%
Market size:
€4.2bn
Remaining half is very fragmented with 150+ smaller companies, typically family businesses
Companies like DBL, Sitex, LavanTex and Servitex are actually a combination of lots of different companies using a same brand
Lots of M&A opportunities: Ongoing consolidation of the market is bringing in additional sellers
*: Associations of independent laundries
Berendsen: 2017 full-year pro forma revenue, excluding Austria
Competitors: Elis estimates
In €mn
115
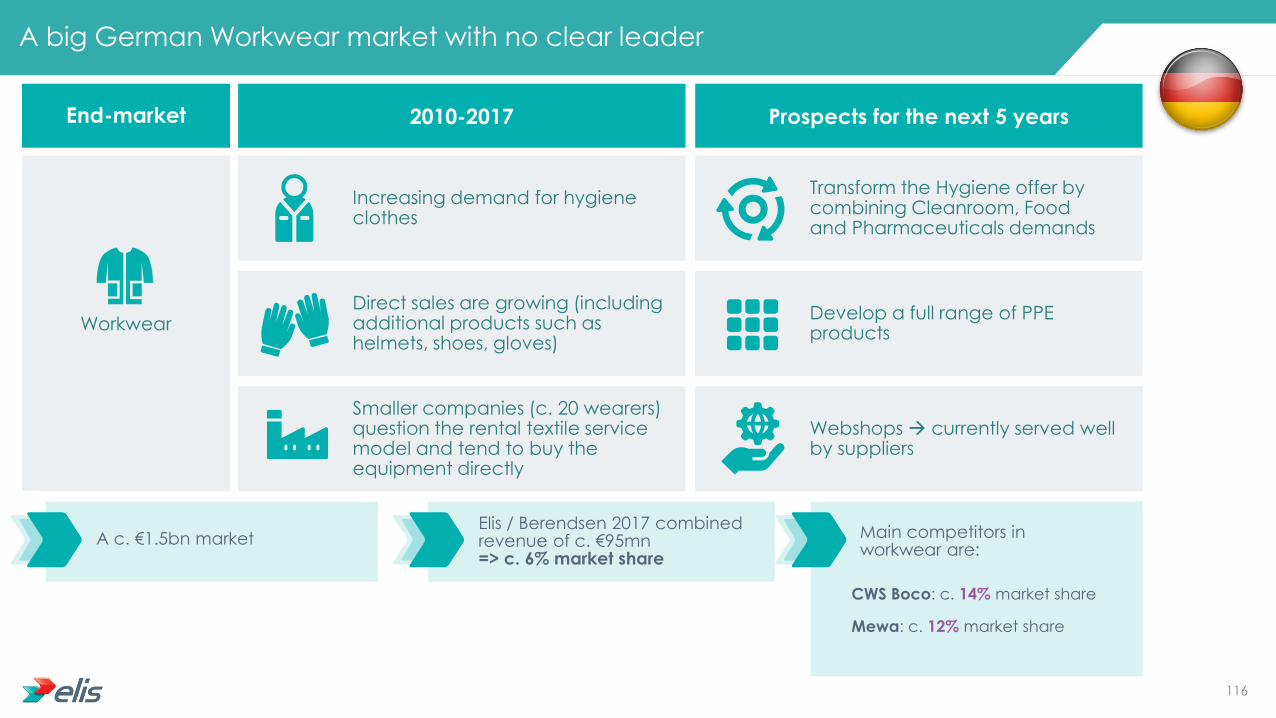
Workwear
Increasing demand for hygiene clothes
Direct sales are growing (including additional products such as helmets, shoes, gloves)
Smaller companies (c. 20 wearers) question the rental textile service model and tend to buy the equipment directly
A big German Workwear market with no clear leader
End-market 2010-2017 Prospects for the next 5 years
CWS Boco: c. 14% market share
Mewa: c. 12% market share
Transform the Hygiene offer by combining Cleanroom, Food and Pharmaceuticals demands
Develop a full range of PPE products
Webshops currently served well by suppliers
A c. €1.5bn market Elis / Berendsen 2017 combined revenue of c. €95mn => c. 6% market share
Main competitors in workwear are:
116

Healthcare
Hospitals
Shorter stays but fewer beds
Significant pressure on price
Healthcare is a difficult market in Germany
End-market 2010-2017 Prospects for the next 5 years
Quality should become an increasingly important criteria in tender offers
Nursing homes
The increasing influence of large groups should lead to consolidation of demand / larger tenders
Nursing homes
Number of beds is increasing
Trend towards smaller facilities
Sitex: c. 5% market share
Bardusch: c. 5% market share
A c. €1.6bn market Elis / Berendsen 2017 combined revenue of c. €175mn => c. 12% market share
Main competitors in Healthcare are:
117
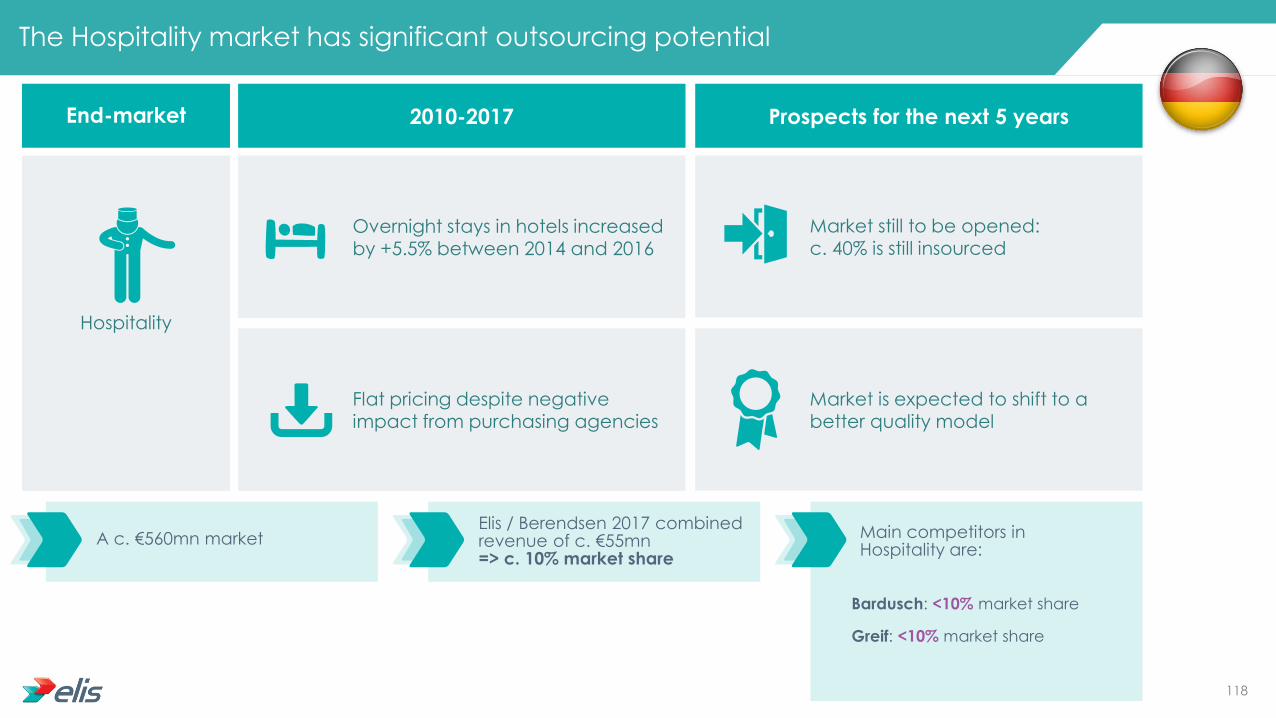
The Hospitality market has significant outsourcing potential
End-market 2010-2017 Prospects for the next 5 years
Bardusch: <10% market share
Greif: <10% market share
A c. €560mn market Elis / Berendsen 2017 combined revenue of c. €55mn => c. 10% market share
Main competitors in Hospitality are:
Overnight stays in hotels increased by +5.5% between 2014 and 2016
Flat pricing despite negative impact from purchasing agencies
Market still to be opened: c. 40% is still insourced
Market is expected to shift to a better quality model
Hospitality
118

1st Elis warehouse
2017 2016 2015 2013 2009 2008 1996 1991
Elis & Berendsen in Germany: Built through acquisitions
Entry of Davis Service Group plc in the German market
c. 10 acquisitions
c. 10 acquisitions
Elis 2016 PF revenue: c. €120mn
Berendsen 2016 revenue:
c. €200mn
119

New combined footprint in Germany
Elis revenue: c. €125mn
Berendsen revenue: c. €215mn
Combined revenue: c. €340mn
82%
17% 1%
44% 49%
7%
Flat linen Workwear Hygiene and well-being
Hospitality Healthcare Industry / Trade & Service
65%
2% 33%
54% 44%
2%
Flat linen Workwear Hygiene and well-being
Hospitality Healthcare Industry / Trade & Service
47%
2%
51%
52%
31%
17%
Flat linen Workwear Hygiene and well-being
Hospitality Healthcare Industry / Trade & Service
BY SEGMENT
BY END MARKET
120

Berendsen
17 plants
1 central warehouse (Worms)
1 logistics hub (Berlin)
1 manufacturing center (Pritzwalk)
2 Head offices (Hamburg)
Elis has become a leader in the Eastern part of the
country Combined footprint will allow some significant logistics optimization
Combined industrial footprint covers the whole country
Heilbad Heiligenstadt
Schönebeck Zerbst
Riesa
Böhrigen
Lübbenau
Beelitz Fürstenwalde/ Spree
Potsdam
Pritzwalk (garment manufacture)
Berlin (Hub)
Wismar
Stralsund
Schleswig
Glinde
Headquarters
Vechta
Rehburg-Loccum
Ibbenbüren
Dorsten
Hagen
Köln
Ochtendung
Simmem
Mannheim
Mörlenbach
Freiburg im Breisgrau München
Hard (Austria)
Pfunllendorf
Augsburg
Bad Windsheim
Dietzenbach
Siegen
Elis
17 plants
121
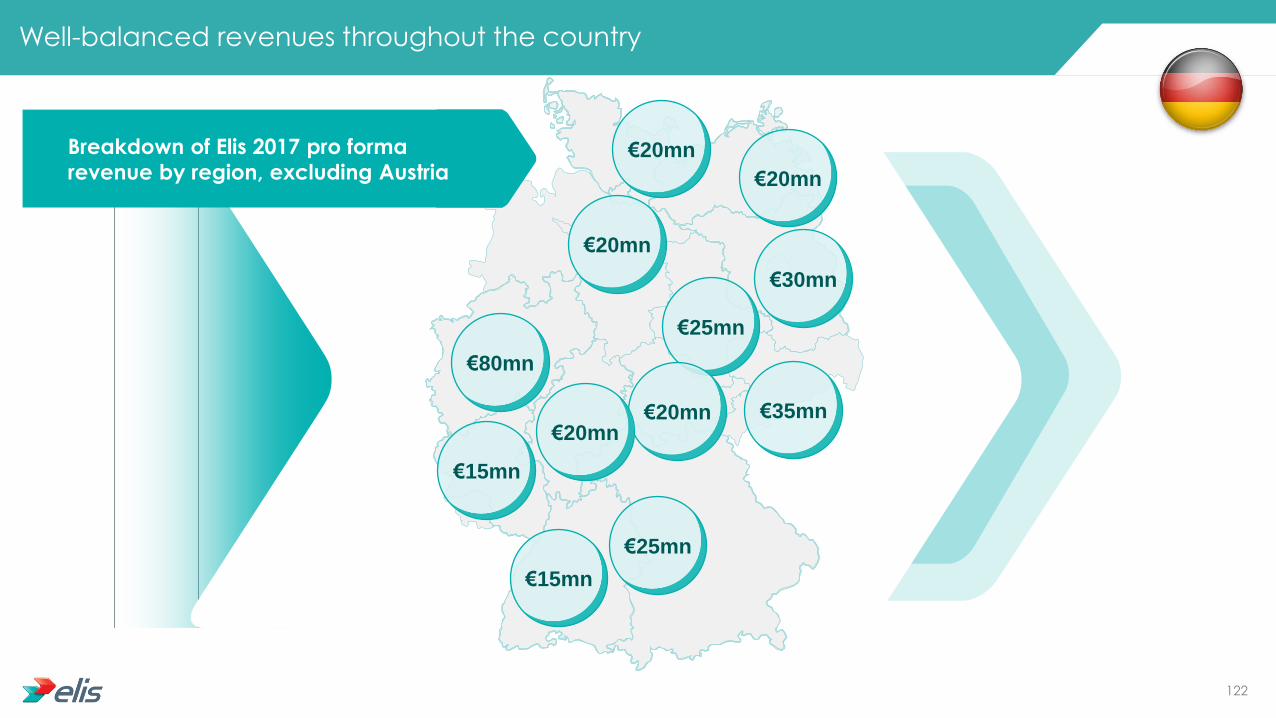
Well-balanced revenues throughout the country
€20mn
€20mn
€30mn
€35mn
€25mn
€20mn
€80mn
€15mn
€15mn
€25mn
€20mn €20mn
Breakdown of Elis 2017 pro forma
revenue by region, excluding Austria
122

Elis and Berendsen in Germany
2017 revenue (actual)
2017 EBITDA % (estimated)
2017 EBIT % (estimated)
Number of plants
Number of employees (December 2017)
Market share
Number of customers
€122mn €214mn €336mn
20% 30% 27%
2% 7% 6%
17 17 34
c. 2,300 c. 2,600 c. 4,900
3% 5% 8%
c. 7,000 c. 4,000 c. 11,000
Berendsen numbers include Austria (1 plant)
123

Combined group key financials in Germany
42 44 57 81
122
183 187 197
204
214
0
50
100
150
200
250
300
350
400
2013 2014 2015 2016 2017
Elis Berendsen
8% 8% 9% 9%
6%
27% 29% 29% 29%
27%
0%
5%
10%
15%
20%
25%
30%
35%
2013 2014 2015 2016 2017
Combined EBIT % Combined EBITDA %
Elis delivered strong revenue growth on the back of acquisitions
Berendsen revenue CAGR of +4%
Between 2013 and 2017:
Impact of allocated cost structure
Berendsen numbers include Austria
Flat EBITDA margin 2013-2017
124
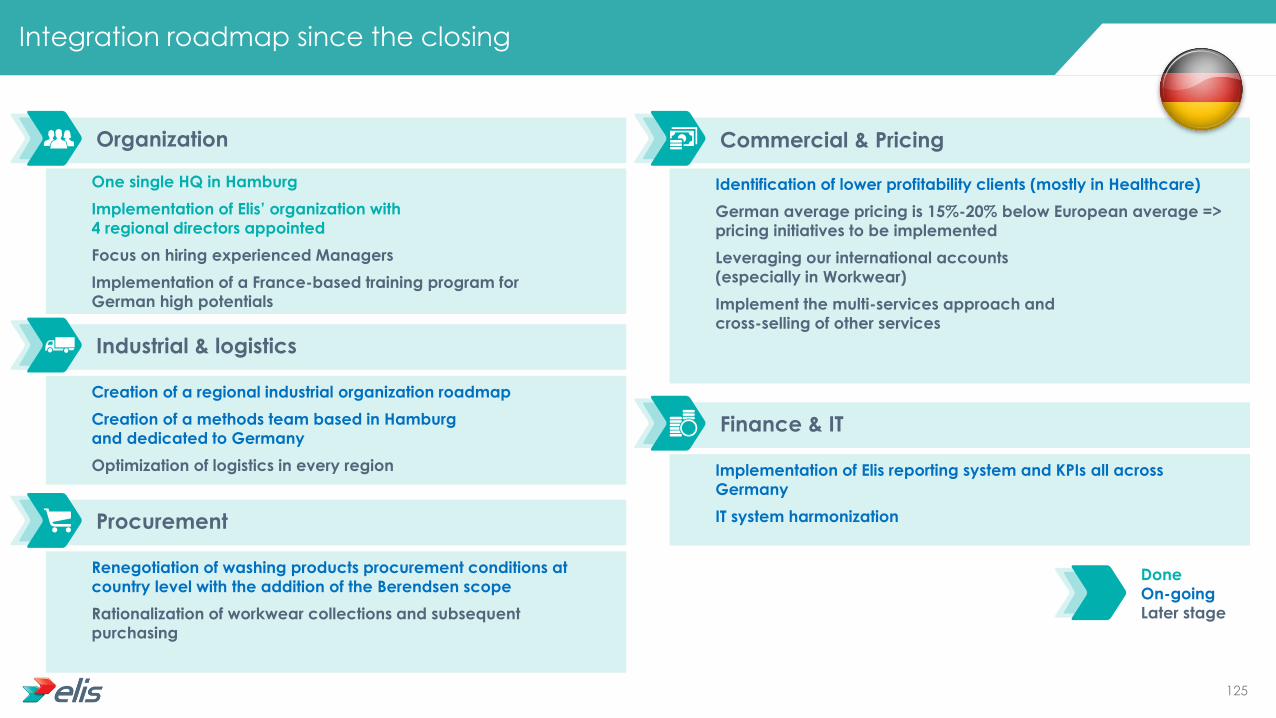
Identification of lower profitability clients (mostly in Healthcare)
German average pricing is 15%-20% below European average =>
pricing initiatives to be implemented
Leveraging our international accounts
(especially in Workwear)
Implement the multi-services approach and
cross-selling of other services
Commercial & Pricing
Implementation of Elis reporting system and KPIs all across
Germany
IT system harmonization
Finance & IT
Creation of a regional industrial organization roadmap
Creation of a methods team based in Hamburg
and dedicated to Germany
Optimization of logistics in every region
One single HQ in Hamburg
Implementation of Elis’ organization with
4 regional directors appointed
Focus on hiring experienced Managers
Implementation of a France-based training program for
German high potentials
Integration roadmap since the closing
Organization
Industrial & logistics
Renegotiation of washing products procurement conditions at
country level with the addition of the Berendsen scope
Rationalization of workwear collections and subsequent
purchasing
Procurement
Done
On-going
Later stage
125

Key takeaways on Germany
01
Good underlying
market but
fragmentation is
an obstacle
02
Dynamic Workwear
market in which
Berendsen has
a high-quality
network
03
Healthcare and
Hospitality markets
less profitable due
to lack of
consolidation
04
Integration streams
have started
efficiently
05
Additional M&A is
to be expected to
grow market share
126

Berendsen in the UK Yann Michel - COO
Mark Franklin - Operations Director

Yann Michel COO France (Brittany,
Paris Workwear, Paris
Facility), UK & Ireland
Age: 42
Nationality: French
Academic background: Graduate of the UTC Compiègne
Professional experience: 8 years as site manager in the
automotive sector.
Worked for Elis since 2004 and has
held a number of operational and
commercial positions, including
heading up two French regions.
128

Main themes covered
Presentation of the UK market
Presentation of the competitive landscape
Presentation of Berendsen’s activities and
financial performance
Key observations on Berendsen in the UK
and action plans
Market dynamics
1
2
3
4
5
Agenda
129

-5%
-4%
-3%
-2%
-1%
0%
1%
2%
3%
4%
5%
2005 2006 2007 2008 2009 2010 2011 2012 2013 2014 2015 2016 2017 2018 2019 2020
United Kingdom Western Europe
Historical and projected GDP growth 2005-2020
UK: A strong economy, facing Brexit uncertainty
UK France
Area (sq km) 242,495 551,695
Inhabitants (mn) 65.6 64.8
Density (Inh/sq km) 271 116
GDP/capita (nominal $) 40,049 39,673
Unemployment rate (%) 4.2 9.2
Source: Wikipedia, Eurostat
Economy
Fifth-largest in the world
Service sector represents 80% of GDP, with a strong contribution from financial services
Pharmaceutical and aerospace industries also strong
Brexit uncertainty
Edinburgh
UNITED KINGDOM
Belfast
Cardiff
London
130

22%
29%
7%
5%
12%
2% 16%
7%
Workwear Hospitality Healthcare Mats
Washroom Cleanroom Clinical Sterilisation
The UK market at a glance
South West
€270mn
North €470mn
South East €570mn
Central €460mn
Textile services
In the UK, Berendsen operates in a €2.1bn market, with €1.7bn relating to textile services
Market breakdown by region
(Excluding clinical)
Source: Elis estimates
131

Berendsen is the largest UK player
Top 7 players
represent 2/3 of
the total market
Market remains very fragmented:
12 companies with revenue between £10mn and £50mn
50 to 100 companies with revenue
below £10mn
374
285
205
130 105 95
70
Berendsen Johnson PHS SynergyHealth Rentokil Cannon
Hygiene
CLEAN3%
Market share 14% 6% 4% 18% 10% 5% 5%
Berendsen: 2017 full-year pro forma revenue
Competitors: Elis estimates
In £mn
132

2010-2017
Slight contraction in activity:
More automation (steep rise in the UK minimum wage)
Continued contraction in the UK engineering / manufacturing sectors
Continued growth in outsourcing has fuelled growth in the corporate catering sector
Pricing up
Prospects for the next 5 years
Outsourcing rate is still low (the French Workwear market is c. €700mn)
Workwear market expected to grow in line with UK GDP
Impact of Brexit on manufacturing (notably automotive) still unclear
The UK Workwear market is one of the largest in Europe
A c. £490mn market*
Berendsen 2017 revenue of c. £85mn
c. 17% market share
Main competitors in Workwear:
Johnson Services: c. 25% market share
Fenland: c. 5% market share
* Includes the cleanroom business
133

2010-2017
A broadly stable market
Flat linen market only – no garments
90% of the market is public
Number of NHS beds has continued to fall
Number of patients treated has increased
Pricing slightly up
Prospects for the next 5 years
Hospital capacity unlikely to increase (investment is limited due to economic constraints)
Significant outsourcing potential for nursing homes (nursing homes account for c. 1/3 of Elis’ Healthcare revenue in France)
Growth could be boosted by a change in policy regarding NHS (lower investment in own laundries)
UK Healthcare market is dominated by NHS
A c. £600mn market*
Berendsen 2017 revenue of c. £170mn
c. 27% market share
Main competitor in Healthcare:
SynergyHealth: c. 20% market share
* Includes the clinical and sterilization businesses
134

2010-2017
Market broadly stable
Growth in number of beds: +1.5% per annum
Large groups account for most of the +3.1% annual growth in rooms; Independent hotels sector has shrunk by -0.2% per year
Pricing quite low overall and virtually flat
Prospects for the next 5 years
Expected growth of around +1.5% per year
Potential impact of Brexit on tourism
UK Hospitality market is stable; pricing at the lower end of European average
A c. £600mn market
Berendsen 2017 revenue of c. £110mn
c. 18% market share
Main competitors in Hospitality:
Johnson Services: c. 25% market share
CLEAN: c. 10% market share
135

2017
Davis Service Group plc becomes Berendsen plc
2011
Acquisition of clinical and sterilisation businesses from
InHealth Group
2007
History of Berendsen UK
Opening of Sunlight Laundry
Sunlight floated on the London Stock Exchange
Creation of National Sunlight Laundries
Appointment of John Ivey as CEO
Various acquisitions including Modeluxe Linen Services
Sunlight Service Group plc acquires Godfrey Davis plc – renamed The Davis Service Group plc
Acquisition of Spring Grove Services Ltd (UK and Ireland)
Acquisition of Sophus Berendsen (Nordics, Benelux, Central & Eastern Europe)
2002 1996 1987 1974
1987 1974 1963 1928 1890
Berendsen plc acquired by Elis SA
136

29% 45%
23%
3%
Hospitality Healthcare Trade & Services Industry
Berendsen UK at a glance - 2017
54%
23%
23%
Flat linen Workwear Hygiene & well being
Flat linen: Market leader
Workwear: Number 2
HWB: Number 4
Revenue
€420mn EBITDA Margin
c. 23% EBIT Margin
c. 5% Sites 43
Employees 7,600
Customers 10,000
Player
#1
137

Plants are currently organized according to the former Business lines of Hospitality, Healthcare, Workwear, Cleanroom and Clinical Solutions.
Low level of Flat linen processed in some of the Workwear sites.
A broad footprint of specialized plants
Business lines Sites
Total 43
Hospitality 15
Healthcare 9
Cleanroom 1
Clinical Solution 8
Workwear 10
138

Historical profitability in the UK below Group average
362 371 376 386 389 407
388 374
22%
26% 26% 28% 28% 27%
26%
23%
-1%
9% 8%
11%
10% 11%
9%
5%
-5%
0%
5%
10%
15%
20%
25%
30%
35%
40%
0
50
100
150
200
250
300
350
400
450
2010 2011 2012 2013 2014 2015 2016 2017
Revenue EBITDA % EBIT %
Additional hires weighing on cost structure
Revenues are in £mn
Client loss in Hospitality & pricing decrease
granted to big Hospitality accounts
Productivity decrease in Flat linen plants due to loss of key managers
+6.6% increase in the minimum wage in April 2017
Costs hard to variabilize
2016-2017
Increase in central costs had a c. 200-300bps negative impact on UK profitability between 2015 and 2017
139

Mark Franklin Country Operations
Director UK
Age: 48
Nationality: British
Academic background: MBA from OUBS
Professional experience: Toyota: CHEP (managing FMCG,
Automotive and Equipment
Pooling sectors)
Recall (data management):
several management positions
and then UK Managing Director
Joined Berendsen in October 2016
as Country manager for the UK
Workwear business.
140

Lack of technical “know-how” in the flat linen business
Key observations on Berendsen in the UK
44%
26%
25%
5%
Redundancies or leaversEmployees confirmed or promotedEmployees confirmed or promoted after a training periodOther
A massive HR review was undertaken in the UK before the takeover by Elis (September 2016 – April 2017)
More than 400 Berendsen UK managers were assessed
c. 180 opted for a voluntary redundancy package or left the business
c. 200 were confirmed or promoted
c. 20 were downgraded or transferred
This led to:
Loss of industry experience
Decreasing productivity, including in the most recent plants
Reduced focus on the business, leading to some disruptions during the summer months
Significant impact on UK employees’ morale
#1
141

Transfer of some top Berendsen
Workwear managers to Flat Linen plants
Creation of a 6-week training program
in France for UK managers
Our action plan
#1
Ongoing program for Plant Directors
and Production Manager roles
Creation of a six-person Methods team:
- Based in the UK
- Fully dedicated to optimizing UK
productivity
- Reporting to a central team located in
France
Lack of technical “know-how” in the flat linen business
Leveraging on our know-how to improve efficiency and service quality in UK flat linen plants
142

Local managers have little visibility on the commercial activity in their plant/region
Lack of local commercial dynamism
Absence of customer focus in plants
Key observations on Berendsen in the UK
#2
A fully-centralized commercial organisation
In recent years, plants have been specialized by type of clients
(e.g. flat linen Hospitality, flat linen Healthcare, workwear, etc… )
Since January 2017, no small clients (<40£ revenue per month) were signed or renewed
A service line-focused approach in the plants, neglecting small clients
143

South West
£57mn
North £75mn
South East £80mn
Central £87m
Our main action plan
#2
The country is divided into 4 regions headed by
4 regional managers who report to Mark Franklin
The Plant Directors are now responsible for the plant P&L
and the customer relationship
Strong potential to develop small clients
Implementation of a commercial organization by end-
market (Healthcare, Hospitality, Industry & Services)
Absence of customer focus in plants
Re-establishing strong, local leadership
Since the middle of November, Elis has implemented a new operational structure in the UK similar to the one in France
Strong focus will be put on cross-selling – one pilot plant
per region will lead multi-services initiatives
2017 revenue breakdown by region, excluding clinical 144

An ineffective logistics organization
Key observations on Berendsen in the UK
#3
Hospitality route
Workwear route
Hospitality plant
Workwear plant
Some specialized plants are serving clients that are very far from the plant
These clients are sometimes located near plants serving other categories of clients
Some plants are even specialized by hotel category (luxury hotels, etc…)
Plant specialization leads to high logistics costs
This has led to UK margin decline in the previous years
This was done in a systematic and disruptive way, significantly impacting productivity
At the end of 2016, Berendsen accelerated its strategy of turning multi-services plants into specialized plants
1h30
3h30
2h
3h30
2h30
145

Multi-services plant
Delivery zone
Our main action plan
#3
Plants will be able to serve different
categories of clients in their area
This will eliminate the existing long
logistics routes and significantly reduce
logistics costs
An ineffective logistics organization
Roll-out Elis’ multi-services approach
Specialized plants will be turned back into multi-services plants
Machinery is usually already on site –
but was shut down in 2016-2017
146

Lack of investment in plants, machinery and maintenance operations
Key observations on Berendsen in the UK
#4
No extra capacity is currently needed in the UK market
Berendsen’s capex program was oversized and the company
did not have the capacity to manage it Some poorly-conceived recent investments are far below
expectations in terms of returns
Some old UK plants need to be closed & UK machinery is
generally aging, leading to low productivity and service issues
147

Transformation of the machine layout in plants recently
built by Berendsen
Elaboration of a new, resized, industrial roadmap
Elis will have a targeted investment approach with selected
maintenance capex in some plants rather than
dismantling/rebuilding
Our main action plan
#4 Lack of investment in plants, machinery and maintenance operations
Right-sized investment plan in industrial assets to put the business back on track
148

Key takeaways on the UK
01 02 03 04 05
The UK market has
good fundamentals
Berendsen’s UK
business impacted in
the past by a lack of
investments and
misguided decisions
A quite consolidated
market, with decent
price levels and
further potential for
outsourcing
Elis action plan
consists in applying
Elis standards and
methodology to the
UK business
Right-sized
investment plan in
industrial assets
to put the business
back on track
149

Berendsen capex & synergies
Xavier Martiré - CEO
Louis Guyot - CFO
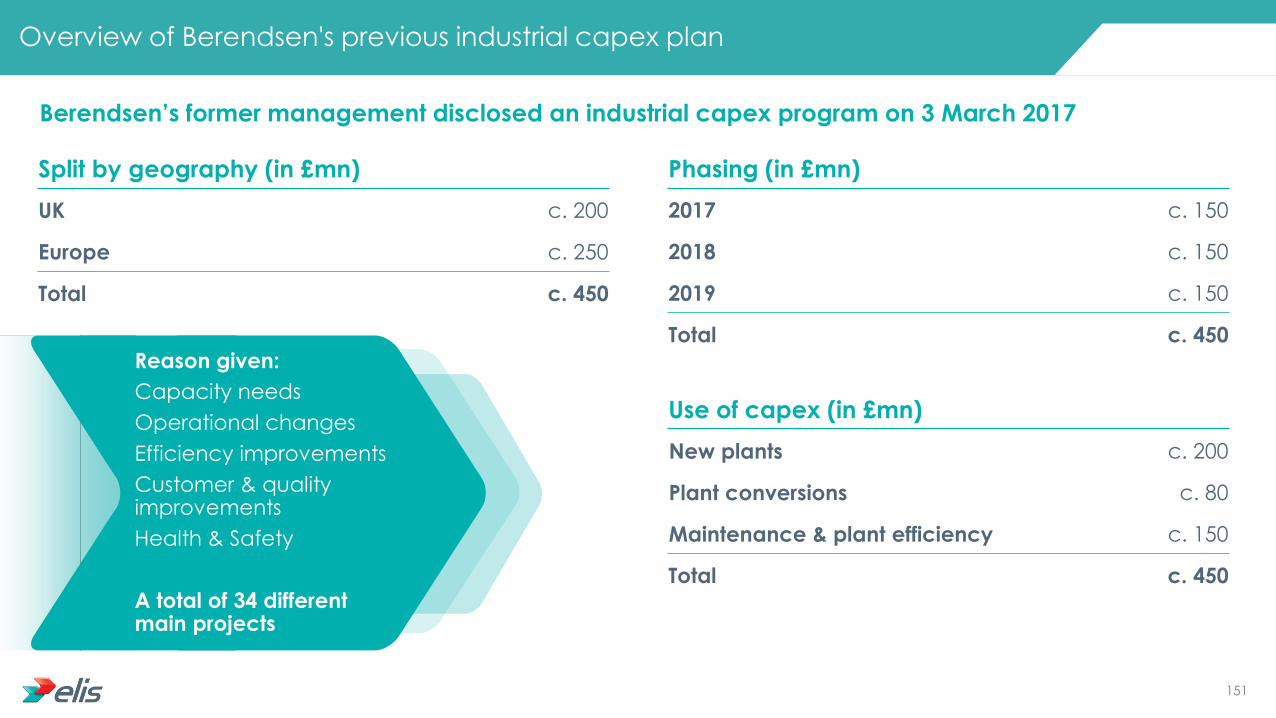
Overview of Berendsen's previous industrial capex plan
Split by geography (in £mn)
UK c. 200
Europe c. 250
Total c. 450
Berendsen’s former management disclosed an industrial capex program on 3 March 2017
Phasing (in £mn)
2017 c. 150
2018 c. 150
2019 c. 150
Total c. 450
Reason given:
Capacity needs
Operational changes
Efficiency improvements
Customer & quality improvements
Health & Safety
A total of 34 different main projects
Use of capex (in £mn)
New plants c. 200
Plant conversions c. 80
Maintenance & plant efficiency c. 150
Total c. 450
151

Elis’ capex plan: A one-third reduction compared to Berendsen’s
Phasing by geography (in £mn) UK Europe Total
2017 50 65 115
2018 52 40 92
2019 51 40 91
Total 153 145 298
Elis will only focus on mandatory upgrades to guarantee sound operations whilst optimizing cash spent
Phasing by geography (in €mn) UK Europe Total
2017 56 73 130
2018 59 45 104
2019 57 45 103
Total 172 163 336
Using a 1.1271 EUR/GBP rate
£
€
65 50
97
65
0
20
40
60
80
100
120
140
160
180
79 52
101
40
63 51
45 40
Europe
(in £mn)
UK
(in £mn)
2017 2018 2019
152

Elis has cut half of Berendsen’s planned new plants
In €mn 2017 2018 2019 Total
UK 56 59 57 172
New plants 11 19 28 59
Number of new plants 1 1 2 4
Plant conversions 17 6 0 23
Number of plants upgraded 3 1 0 4
Maintenance & plant efficiency 28 34 29 91
Europe 73 45 45 163
New plants 23 11 23 56
Number of new plants 2 2 1 5
Plant conversions 23 11 0 34
Number of plants upgraded 4 2 0 6
Maintenance & plant efficiency 28 23 23 73
Total 130 104 103 336
A plan tailored to put the UK flat linen business back on track and to provide European operations with some industrial adjustments
-60%
-33%
-38%
-40%
153

In summary
Elis’ investment plant is 33% below Berendsen’s initial plan
This plan covers the needs of Berendsen’s footprint in terms of
capacity and modernization
For the whole Group, we expect:
– 20% capex to sales in 2018 and 2019
– Return to 17% -18% capex to sales in 2020
154

Expected synergies

Expected synergies: What we said in June 2017
Based on the limited public information available, we estimated total recurring run-rate pre-tax cost synergies of at least €40mn per annum by the end of the third year post-completion:
€35mn per annum of operating expenditure EBITDA synergies
€5mn per annum of capital expenditure synergies
€8mn
Not quantified
€6mn
€9mn
€17mn
€40mn COST
SYNERGIES
REVENUE SYNERGIES
PROCUREMENT SAVINGS
OPERATIONAL
COST SAVINGS
CORPORATE OVERHEAD
CENTRAL COSTS
156

Our new estimate: Cost synergies of €80mn by the end of 2020 excluding any potential revenue synergies
What is included?
Corporate costs
Overhead excluding corporate
Purchasing spend opex
Operational cost savings (including logistics optimization)
Management and other costs (e.g. sites, sales)
UK operational improvement OPEX
CAPEX IMPROVEMENT
TOTAL CASH SYNERGIES
Additional synergies identified as of end of January 2018
Synergies communicated in June
15
40
60 35
40
5
2020 end-year savings in €mn
25
20
80
Purchasing spend capex
IT capex improvement
On top of this, we expect some revenue synergies to kick in from 2019 onwards
We are still in the process of running some in-depth analysis and will quantify synergies once completed
CASH SYNERGIES
157

CASH SYNERGIES
Detailed cash synergies quantification
OPEX
CAPEX IMPROVEMENT
2020 end-year savings, in €mn
20
Includes logistics optimization
Includes Berendsen’s main and local HQs, as well as Elis HQ net synergies
Site level, sales & customer service
€20mn total synergies in purchasing spend
What is included?
Corporate
Finance & legal
IT
HR
Marketing & innovation
Purchasing, supply chain & industry
Operational cost savings
UK optimization improvement (EBITDA impact)
Management & other costs
Purchasing spend opex
Purchasing spend capex
IT capex improvement
Total cash synergies
6
4
80
5
2
5
60 20
5
5
5
7
15
CENTRAL STRUCTURE
1
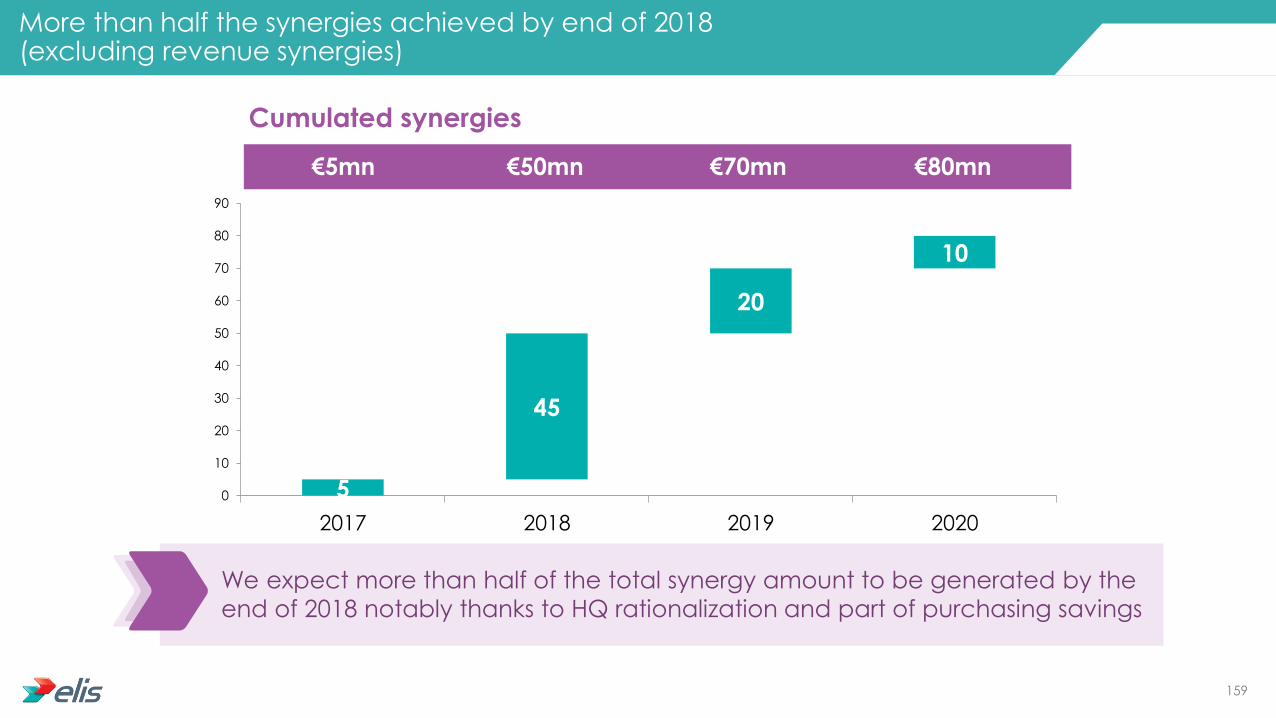
More than half the synergies achieved by end of 2018 (excluding revenue synergies)
5
45
20
10
0
10
20
30
40
50
60
70
80
90
2017 2018 2019 2020
€5mn €50mn €70mn €80mn
Cumulated synergies
We expect more than half of the total synergy amount to be generated by the
end of 2018 notably thanks to HQ rationalization and part of purchasing savings
159

Conclusion
A 3-year capex plan of £300mn (€340mn) that fits the needs of Berendsen
scope, equally spread between the UK and Europe
€80mn cash synergies to be achieved by the end of 2020 with a quick
ramp-up: €50mn will be generated as early as 2018
Some revenue synergies - not yet quantified - to come on top of the
€80mn from 2019 onwards
160

Update on debt structure and 2018 outlook
Xavier Martiré - CEO
Louis Guyot - CFO

€200mn
€400mn
€600mn
€200mn
€400mn
€75mn
Capital increase reserved to CPPIB
Convertible bond
Syndicated loan *
Term loan
RCF
Schuldschein *
13 September 2017
3 October 2017
23 November 2017
Maturity October 2023, 0% coupon
Fully drawn
maturity November 2022
Fully undrawn
maturity November 2022
7 tranches
Fixed and floating rates: 3, 4, 5 & 7 years
Margin between 130 and 175 bps
Refinancing of the €1.92bn bridge loan for Berendsen acquisition is underway
Amount Issuance Terms
*: Covenant (net debt / EBITDA): < 4x on 31 December 2017 and < 3.75x from 30 June 2018 onwards
c. €1bn already refinanced
Less than €1bn still to be refinanced
As of today:
Bond transactions via an EMTN Program
Additional bilateral bank facilities
Targeted refinancing in progress:
€100mn Bilateral bank facilities Sept 2017 - Jan 2018 Average maturity: 4.4 years
Very favorable conditions (cannot be disclosed)
162

Gross debt breakdown as of 31st December 2017
As of 31 December 2017:
Gross debt of €3.5bn
Proforma Net debt to EBITDA ratio of 3.2x
Cash cost below 2.5% c. 2.2% including hedging
1,015
800
650
400
396
177 75
As of 31 December 2017
Schuldschein
Capex line
Commercial paper
0% convertible bond (2023)
Term loans (2022)
3% High Yield Bond (2022)
Bridge facility (drawn)
€3.5bn
163

Around 13.5%
Around 30.0%
2017 actual revenue and margin estimates
2017 actual revenue
2017 EBITDA margin
2017 EBIT margin
€2,215mn, up +46.4% vs 2016 (+2.4% on an organic basis)
164

Up +100bps vs 2017
Up +150bps vs 2017
2018 outlook
2018 revenue
2018 EBITDA margin
2018 EBIT margin
Above €3.2bn (excluding potential M&A)
• Confirmation of the target of c. 3x Net debt / EBITDA ratio by the end of 2018
165

On-going focus on improved operational performance
Doubling of June cost synergies estimate: €80mn vs €40mn
Implementation of new organization
Investor day takeaways
Indusal & Lavebras
integrations well
underway
Berendsen
integration on track
Confirmation of synergies estimates
• Post Berendsen, Elis is very well positioned to continue its profitable
growth in the short and medium term
166

Elis has consolidated its leading position in the industry
A more diversified geographical footprint and a more resilient business model
High synergies from acquisitions prove capacity to integrate companies
Sound financial structure allows further M&A
Improving economic prospects should favor further organic growth
A model built for growth and value creation
1
2
3
4
5
167

Nicolas Buron
Investor Relations Director
Tel: +33 1 75 49 98 30
Mob: +33 6 83 77 66 74
Email: [email protected]