2021 AQN INVESTOR DAY
87
1 AQN Investor Day December 14, 2021 Algonquin | Liberty | 2021 Investor Day ~21% 2020 Total Shareholder Return (“TSR”) 3 ~141% Cumulative 5-Year Total Shareholder Return 4 BBB Credit Rating ~$9.1 B Market Cap 1 ~$16.7 B Total Assets 2 3,400+ Employees $12.4 B CapEx Plan from 2022 through end of 2026 ~4.1 GW Renewables (owned, operated and/or net interest in) ~3.8 GW Prospective Greenfield Development Pipeline 1988 Company Founded 1. Market capitalization on the New York Stock Exchange (NYSE), as of November 30, 2021. 2. Total Assets as of September 30, 2021. 3. 2020 TSR calculation on New York Stock Exchange (NYSE), as of December 31, 2020. 4. 5-year TSR calculation on Toronto Stock Exchange (TSX), as of December 31, 2020.
-
Upload
khangminh22 -
Category
Documents
-
view
5 -
download
0
Transcript of 2021 AQN INVESTOR DAY
AQN
1
AQN
Investor Day December 14, 2021
Algonquin | Liberty | 2021 Investor Day
~21%2020 Total
Shareholder Return (“TSR”)3
~141%Cumulative 5-Year Total
Shareholder Return4
BBBCredit Rating
~$9.1 BMarket Cap1
~$16.7 BTotal Assets2
3,400+Employees
$12.4 BCapEx Plan from 2022 through end of 2026
~4.1 GWRenewables (owned, operated and/or net
interest in)
~3.8 GWProspective Greenfield Development Pipeline
1988Company Founded
1. Market capitalization on the New York Stock Exchange (NYSE), as of November 30, 2021.2. Total Assets as of September 30, 2021.3. 2020 TSR calculation on New York Stock Exchange (NYSE), as of December 31, 2020.4. 5-year TSR calculation on Toronto Stock Exchange (TSX), as of December 31, 2020.
AQN
2
AQN
Forward-Looking StatementsCertain written statements included herein and/or oral statements made in connection with the presentation contained herein constitute “forward-looking information” within the meaning of applicable securities laws ineach of the provinces of Canada and the respective policies, regulations and rules under such laws and “forward-looking statements” within the meaning of the U.S. Private Securities Litigation Reform Act of 1995 (collectively,“forward-looking statements”). The words “will”, “expects”, “intends”, “should”, “would”, “anticipates”, “projects”, “forecasts”, “plans”, “estimates” (occasionally denoted herein by the letter “E”), “may”, “outlook”, “aims”,“pending”, “prospective”, “target”, “believes”, “could”, “potential” and similar expressions are often intended to identify forward-looking statements, although not all forward-looking statements contain these identifying words.Specific forward-looking statements contained in or made in connection with this presentation include, but are not limited to statements regarding: the expected performance of Algonquin Power & Utilities Corp. (“AQN”,“Algonquin” or the “Company”); the Company’s expected future growth, earnings, cash flows, funds from operations, revenue, debt and dividends; expected future rate base; capital expenditure and investment plans;development projects (including greenfield opportunities) and the anticipated generation capacity, completion, timing, cost, location, size, success rate, customer benefits and qualification for tax credits of such projects;the Company’s pending acquisitions of New York American Water Company, Inc. (“New York American Water” or “NYAW”) and Kentucky Power Company (“Kentucky Power”) and AEP Kentucky Transmission Company, Inc.,including the expected timing for closing and the financing thereof; the impact and expected benefits of such acquisitions to the Company, including the impact on the Company’s business, operations, customer count, ratebase, business mix, return on equity and financial condition; the Company’s “greening the fleet” plans, including with respect to Kentucky Power and the Mitchell coal plant; expectations regarding the benefits, outcomes andimpacts of transitioning to renewable energy; expectations regarding the timing for the transfer or retirement (for rate-making purposes in Kentucky) of the Mitchell coal plant; the expected non-renewal of the offtakecontract for the Rockport coal plant; expectations regarding the use of proceeds of the Company’s November 2021 C$800 million bought deal common share offering; expectations regarding the levelized cost of energy fromrenewable sources; the Company’s financing plan and expected sources and uses of capital, including the impact thereof on the Company’s balance sheet; projections about liquidity, capital sufficiency and credit ratings;targets and expectations regarding credit metrics; the Company’s corporate development and growth initiatives and the results thereof, including future acquisitions and the expected business mix between the Company’soperating segments; expectations regarding potential future asset dispositions and other capital recycling initiatives, including the anticipated benefits and structure thereof; the Company’s sustainability, decarbonization,environmental, social and governance goals, targets and initiatives (including the Company’s ability to achieve these goals, targets and initiatives and the Company’s expectations with respect thereto); the Company’sexpected growth strategies; anticipated utility rates, regulatory filings, outcomes and initiatives, available regulatory mechanisms and recoverability of investments; expected tax rates; industry data and projections;expectations regarding safety, reliability and system operating performance; expected future operating costs; expectations regarding legislative changes and initiatives; expectations regarding the Company’s investment inemerging technologies, including battery storage, microgrids, community solar and renewable natural gas; grid updates in connection with the Texas Coastal Wind Facilities; and customer expectations, rates and savings.These statements are based on factors or assumptions that were applied in drawing a conclusion or making a forecast or projection, including assumptions based on historical trends, current conditions and expected futuredevelopments. Since forward-looking statements relate to future events and conditions, by their nature they rely on assumptions and involve inherent risks and uncertainties. AQN cautions that although it is believed that theassumptions are reasonable in the circumstances, actual results may differ materially from the expectations set out in the forward-looking statements. Material risk factors and assumptions include those set out in thispresentation or contained in AQN’s Management Discussion and Analysis for the three and nine months ended September 30, 2021 (the “Interim MD&A”), AQN’s Management Discussion and Analysis for the three and twelvemonths ended December 31, 2020 (the “Annual MD&A”), and AQN’s Annual Information Form for the year ended December 31, 2020, each filed with securities regulatory authorities in Canada and the United States. Given theserisks, undue reliance should not be placed on these forward-looking statements, which apply only as of their dates. Other than as specifically required by law, AQN undertakes no obligation to update any forward-lookingstatements to reflect new information, subsequent or otherwise.
CurrencyIn this presentation, unless otherwise specified or the context requires otherwise, all dollar amounts are expressed in U.S. dollars.
Non-GAAP Financial MeasuresThe terms “Adjusted Net Earnings”, “Adjusted Net Earnings per share” (or “Adjusted Net EPS”), “earnings before interest, taxes, depreciation and amortization” (“EBITDA”), “Adjusted EBITDA”, “Adjusted Funds from Operations”,"Net Energy Sales", "Net Utility Sales" and “Divisional Operating Profit” (together the “Financial Measures”) may be used in this presentation and discussion. The Financial Measures are not recognized measures under U.S. GAAP.There is no standardized measure of the Financial Measures; consequently, AQN’s method of calculating the Financial Measures may differ from methods used by other companies and therefore they may not be comparableto similar measures presented by other companies. An explanation, calculation and analysis of the Financial Measures, including a reconciliation to the most directly comparable U.S. GAAP measure, where applicable, can befound in the Interim MD&A and the Annual MD&A. A reconciliation of certain of the Financial Measures used in the presentation to the most directly comparable U.S. GAAP measure can also be found in the Appendix beginningon page 77 of this presentation.
Market and Industry DataCertain of the information contained in this presentation concerning economic trends and market, peer and industry data and projections is based upon or derived from information by third party or industry sources. TheCompany provides no assurance with respect to the accuracy of such information nor has the Company independently verified such information or the assumptions upon which projections of future trends are based. As aresult, readers should be aware that any such information and data set forth in this presentation and estimates and beliefs based on such information and data, may not be reliable.
Algonquin | Liberty | 2021 Investor Day

AQN
3
Speakers & Agenda
Algonquin | Liberty | 2021 Investor Day
Arun Banskota Arthur KacprzakJeff Norman Johnny Johnston George Trisic
1. Welcome and Safety Moment ………………………………………… Amelia Tsang, Vice President, Investor Relations2. Strategic Overview …………………………………………………………………… Arun Banskota, President and Chief Executive Officer3. Leaders in Growth ……………………………………………………………………… Jeff Norman, Chief Development Officer4. Leaders in Operational Excellence ………………………………… Johnny Johnston, Chief Operating Officer5. Leaders in Sustainability ……………………………………………………… George Trisic, Chief Sustainability Officer6. Financial Overview …………………………………………………………………… Arthur Kacprzak, Chief Financial Officer7. Closing Remarks ……………………………………………………………………… Arun Banskota, President and Chief Executive Officer8. Q&A
Amelia Tsang
Algonquin | Liberty | 2021 Investor Day
Strategic Overview
AQNAQN
5
Arun Banskota
“Algonquin continues to play a leading role in the transition to a low-carbon economy.”
Algonquin | Liberty | 2021 Investor Day
President and CEO
AQN
6
AQN
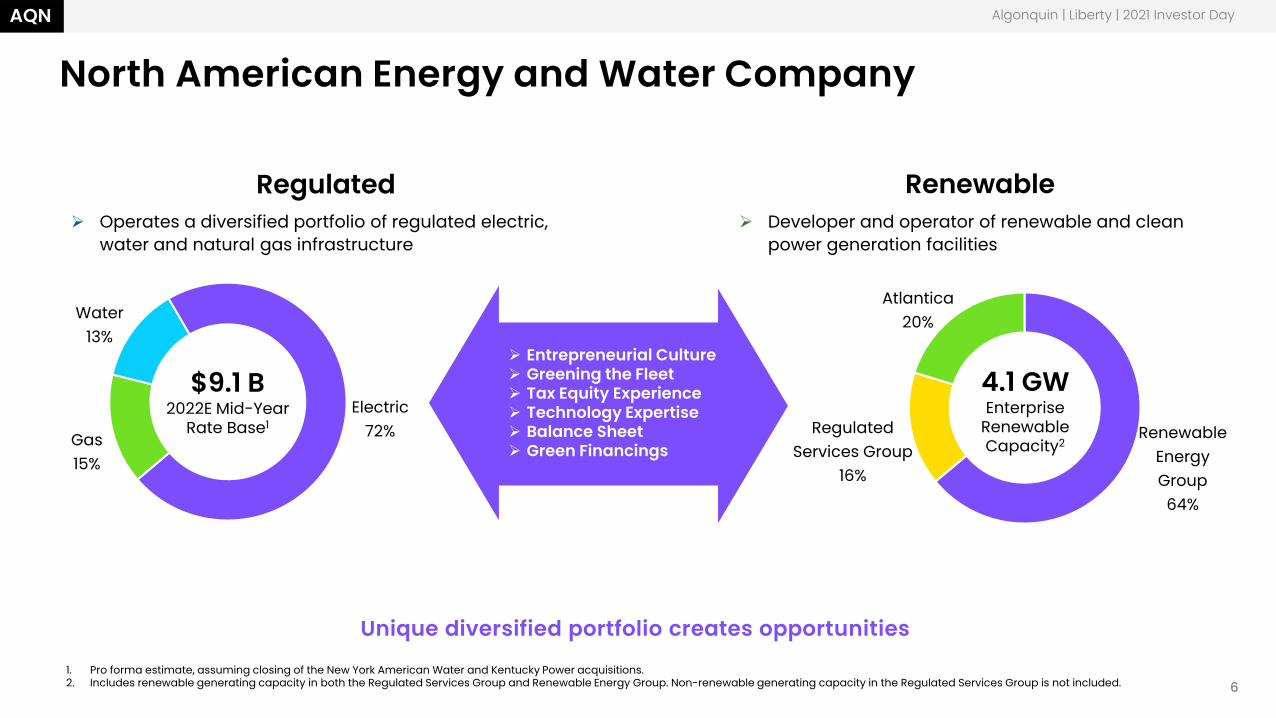
North American Energy and Water Company
Unique diversified portfolio creates opportunities
Algonquin | Liberty | 2021 Investor Day
Renewable Energy Group
64%
Regulated Services Group
16%
Atlantica20%
4.1 GWEnterprise
RenewableCapacity2
Electric72%Gas
15%
Water13%
$9.1 B2022E Mid-Year
Rate Base1
Developer and operator of renewable and clean power generation facilities
Operates a diversified portfolio of regulated electric, water and natural gas infrastructure
RenewableRegulated
1. Pro forma estimate, assuming closing of the New York American Water and Kentucky Power acquisitions.2. Includes renewable generating capacity in both the Regulated Services Group and Renewable Energy Group. Non-renewable generating capacity in the Regulated Services Group is not included.
Entrepreneurial Culture Greening the Fleet Tax Equity Experience Technology Expertise Balance Sheet Green Financings
AQNAQN
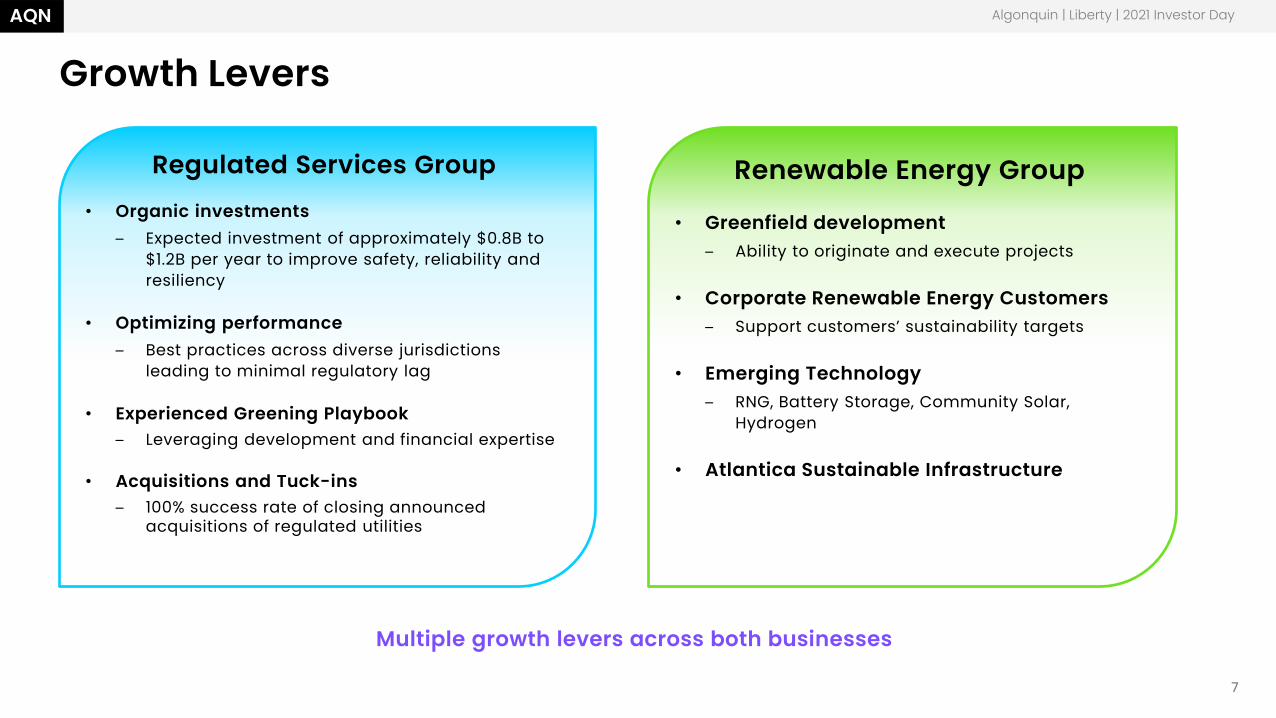
Growth Levers
Multiple growth levers across both businesses
Regulated Services Group• Organic investments
– Expected investment of approximately $0.8B to $1.2B per year to improve safety, reliability and resiliency
• Optimizing performance– Best practices across diverse jurisdictions
leading to minimal regulatory lag
• Experienced Greening Playbook– Leveraging development and financial expertise
• Acquisitions and Tuck-ins– 100% success rate of closing announced
acquisitions of regulated utilities
Renewable Energy Group
• Greenfield development– Ability to originate and execute projects
• Corporate Renewable Energy Customers– Support customers’ sustainability targets
• Emerging Technology – RNG, Battery Storage, Community Solar,
Hydrogen
• Atlantica Sustainable Infrastructure
Algonquin | Liberty | 2021 Investor Day
7
AQN
8
AQN
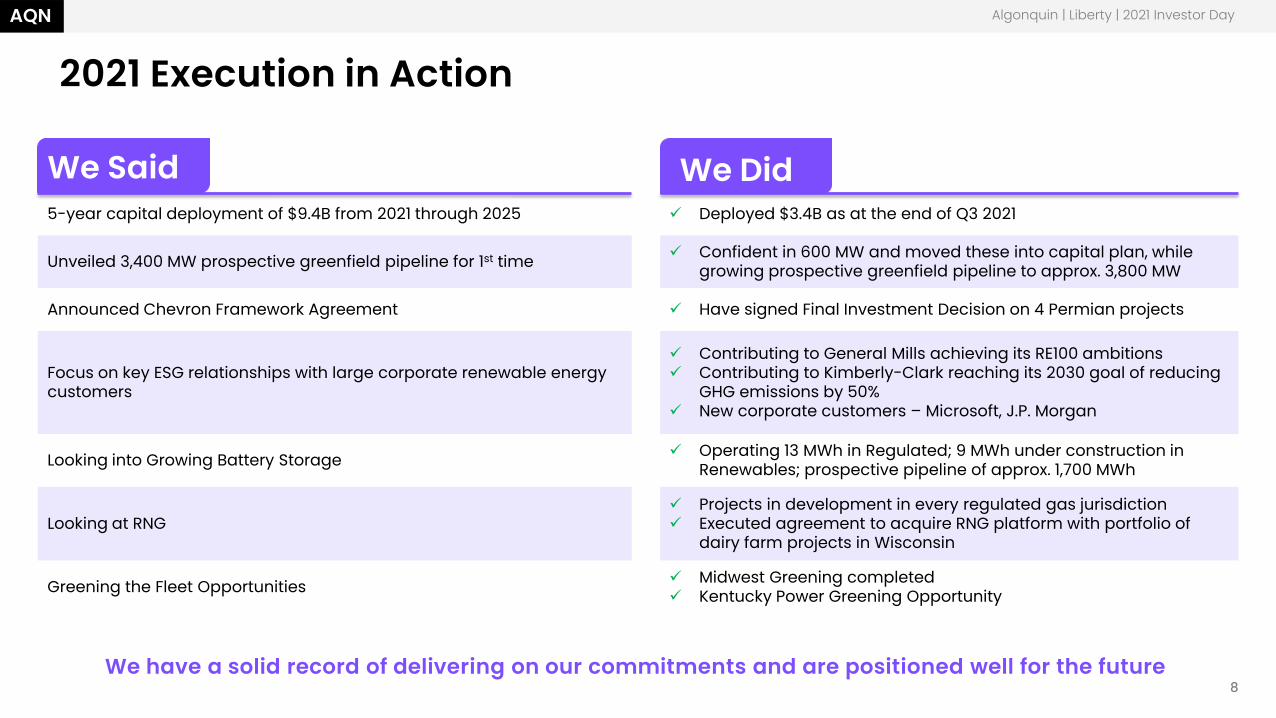
2021 Execution in Action
We have a solid record of delivering on our commitments and are positioned well for the future
5-year capital deployment of $9.4B from 2021 through 2025 Deployed $3.4B as at the end of Q3 2021
Unveiled 3,400 MW prospective greenfield pipeline for 1st time Confident in 600 MW and moved these into capital plan, while growing prospective greenfield pipeline to approx. 3,800 MW
Announced Chevron Framework Agreement Have signed Final Investment Decision on 4 Permian projects
Focus on key ESG relationships with large corporate renewable energy customers
Contributing to General Mills achieving its RE100 ambitions Contributing to Kimberly-Clark reaching its 2030 goal of reducing
GHG emissions by 50% New corporate customers – Microsoft, J.P. Morgan
Looking into Growing Battery Storage Operating 13 MWh in Regulated; 9 MWh under construction in Renewables; prospective pipeline of approx. 1,700 MWh
Looking at RNG Projects in development in every regulated gas jurisdiction Executed agreement to acquire RNG platform with portfolio of
dairy farm projects in Wisconsin
Greening the Fleet Opportunities Midwest Greening completed Kentucky Power Greening Opportunity
Algonquin | Liberty | 2021 Investor Day
We Said We Did
AQNAQN
9
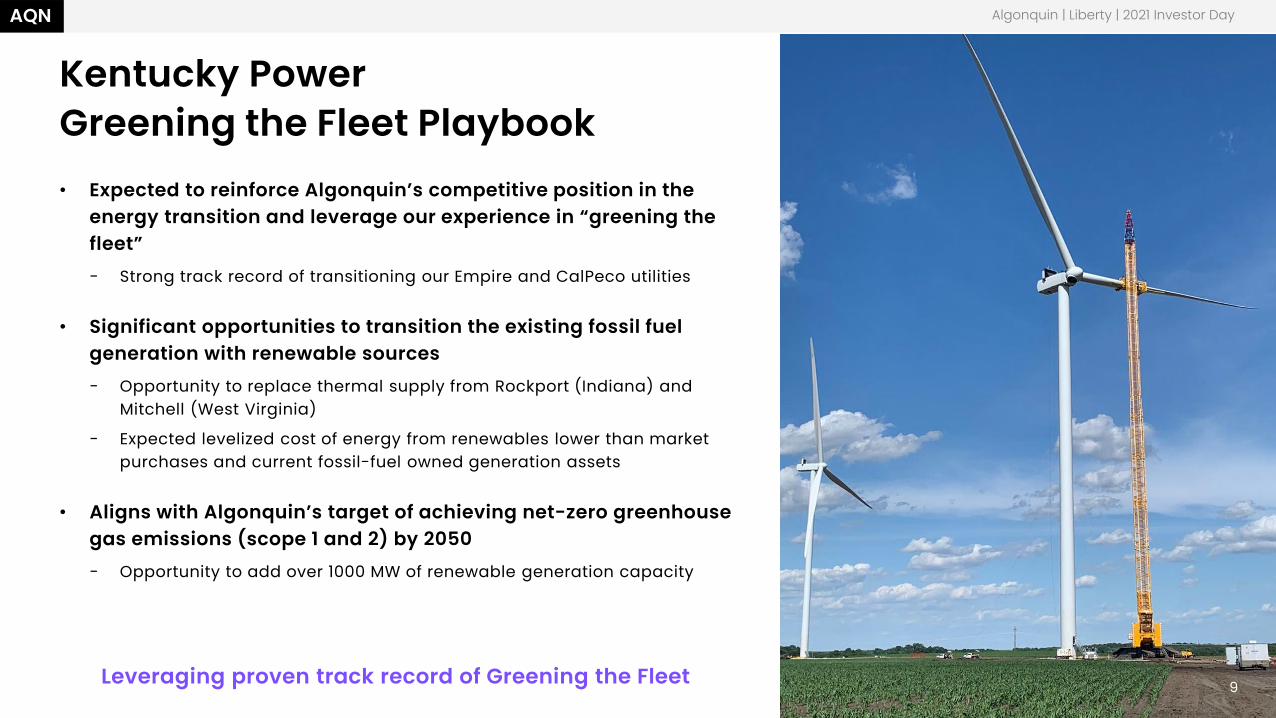
Kentucky Power Greening the Fleet Playbook
Leveraging proven track record of Greening the Fleet
• Expected to reinforce Algonquin’s competitive position in the energy transition and leverage our experience in “greening the fleet”- Strong track record of transitioning our Empire and CalPeco utilities
• Significant opportunities to transition the existing fossil fuel generation with renewable sources- Opportunity to replace thermal supply from Rockport (Indiana) and
Mitchell (West Virginia)
- Expected levelized cost of energy from renewables lower than market purchases and current fossil-fuel owned generation assets
• Aligns with Algonquin’s target of achieving net-zero greenhouse gas emissions (scope 1 and 2) by 2050- Opportunity to add over 1000 MW of renewable generation capacity
Algonquin | Liberty | 2021 Investor Day
9
AQNAQN
10
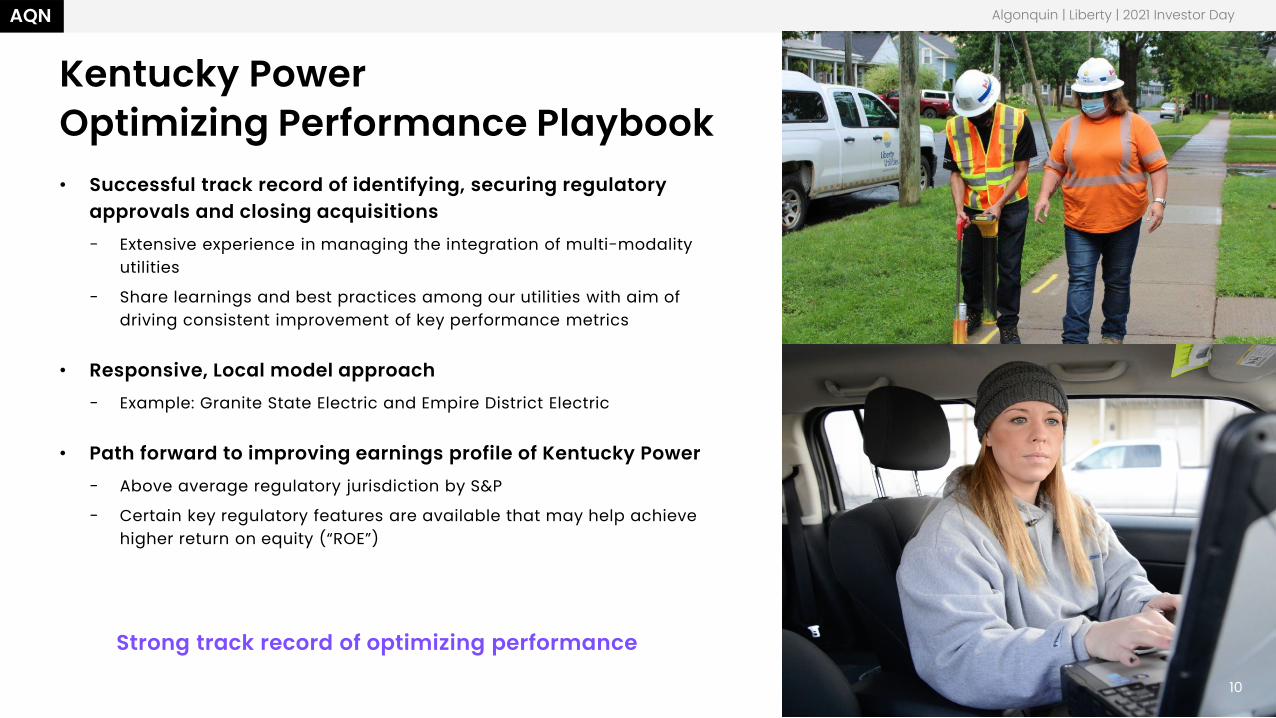
Kentucky Power Optimizing Performance Playbook
Strong track record of optimizing performance
• Successful track record of identifying, securing regulatory approvals and closing acquisitions- Extensive experience in managing the integration of multi-modality
utilities
- Share learnings and best practices among our utilities with aim of driving consistent improvement of key performance metrics
• Responsive, Local model approach- Example: Granite State Electric and Empire District Electric
• Path forward to improving earnings profile of Kentucky Power- Above average regulatory jurisdiction by S&P
- Certain key regulatory features are available that may help achieve higher return on equity (“ROE”)
Algonquin | Liberty | 2021 Investor Day
10
AQN
11
AQN
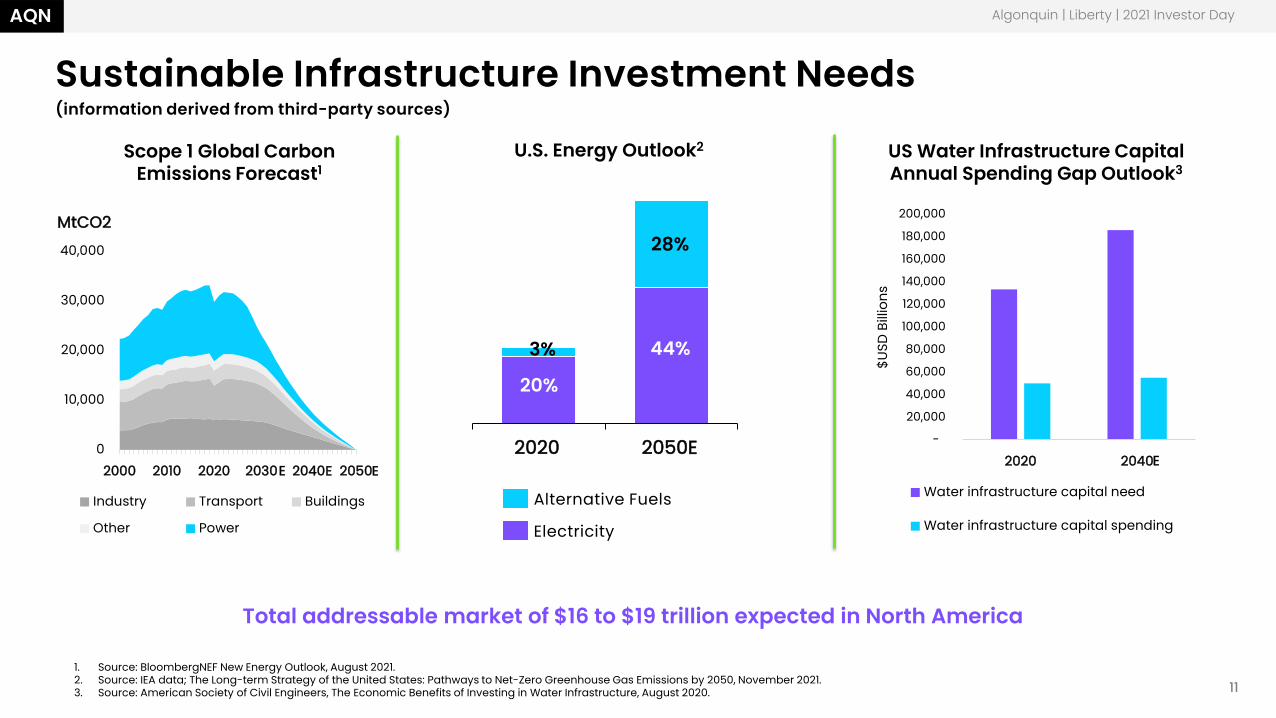
Sustainable Infrastructure Investment Needs(information derived from third-party sources)
Algonquin | Liberty | 2021 Investor Day
0
10,000
20,000
30,000
40,000
2000 2010 2020 2030 2040 2050
MtCO2
Industry Transport Buildings
Other Power
Scope 1 Global Carbon Emissions Forecast1
1. Source: BloombergNEF New Energy Outlook, August 2021.2. Source: IEA data; The Long-term Strategy of the United States: Pathways to Net-Zero Greenhouse Gas Emissions by 2050, November 2021.3. Source: American Society of Civil Engineers, The Economic Benefits of Investing in Water Infrastructure, August 2020.
Total addressable market of $16 to $19 trillion expected in North America
U.S. Energy Outlook2 US Water Infrastructure Capital Annual Spending Gap Outlook3
-
20,000
40,000
60,000
80,000
100,000
120,000
140,000
160,000
180,000
200,000
2020 2040
$USD
Bill
ions
Water infrastructure capital need
Water infrastructure capital spending
2020 2050E
Alternative Fuels
Electricity
20%
44%
28%
3%
E E EE

AQN
12
AQN
Emerging Commercial Technologies(information derived from third-party sources)
Algonquin is actively growing across each technology platform
Algonquin | Liberty | 2021 Investor Day
1. Source: Bloomberg New Energy Finance - Global Energy Storage Outlook Report, dated November 15, 2021.2. Source: American Gas Foundation Study, dated December 18, 2019.3. Source: Bloomberg New Energy Finance, September 2021 dataset: “Realizing the Potential of Customer-Sited Solar”.
Battery Storage1
~10xBy 2030 for
U.S.
Renewable Natural Gas2
~4xBy 2030 for
U.S.
Community Solar3
~22xBy 2030 for
U.S.
AQN
13
AQN
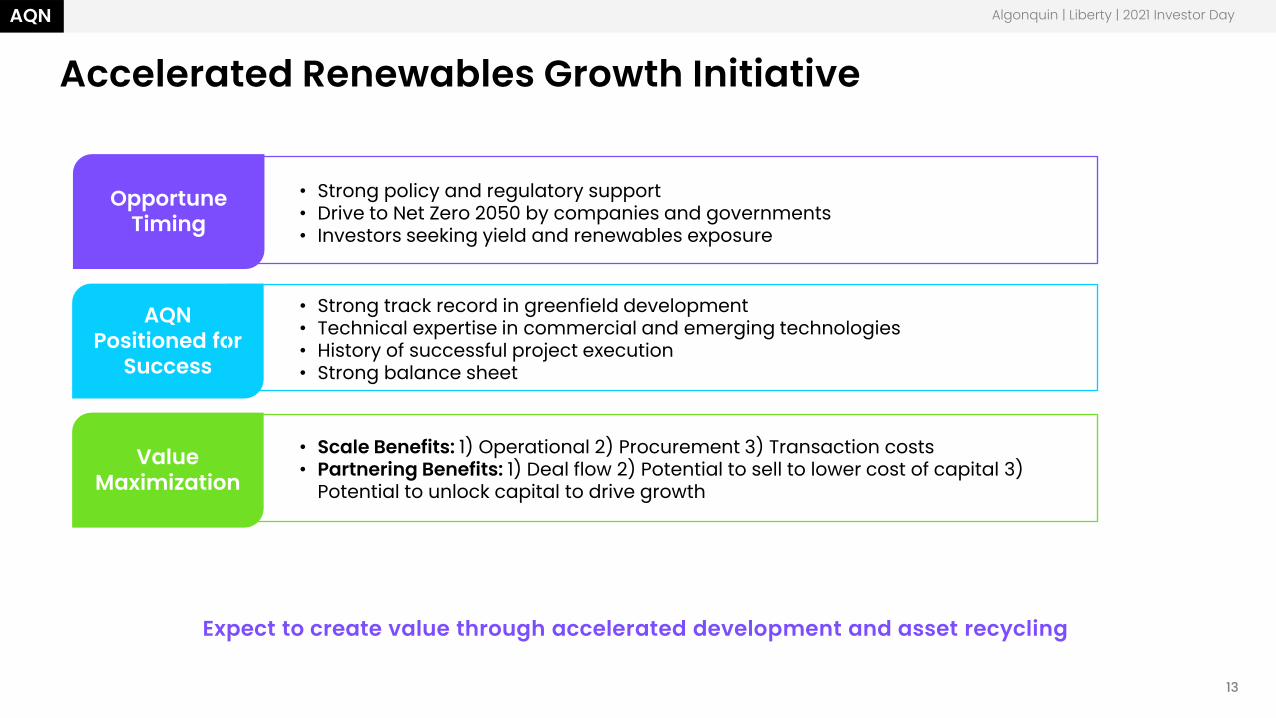
Accelerated Renewables Growth Initiative
Expect to create value through accelerated development and asset recycling
Algonquin | Liberty | 2021 Investor Day
AQN Positioned for
Success
Value Maximization
Opportune Timing
• Strong policy and regulatory support• Drive to Net Zero 2050 by companies and governments• Investors seeking yield and renewables exposure
• Strong track record in greenfield development• Technical expertise in commercial and emerging technologies• History of successful project execution• Strong balance sheet
• Scale Benefits: 1) Operational 2) Procurement 3) Transaction costs• Partnering Benefits: 1) Deal flow 2) Potential to sell to lower cost of capital 3)
Potential to unlock capital to drive growth
AQN
14
AQN
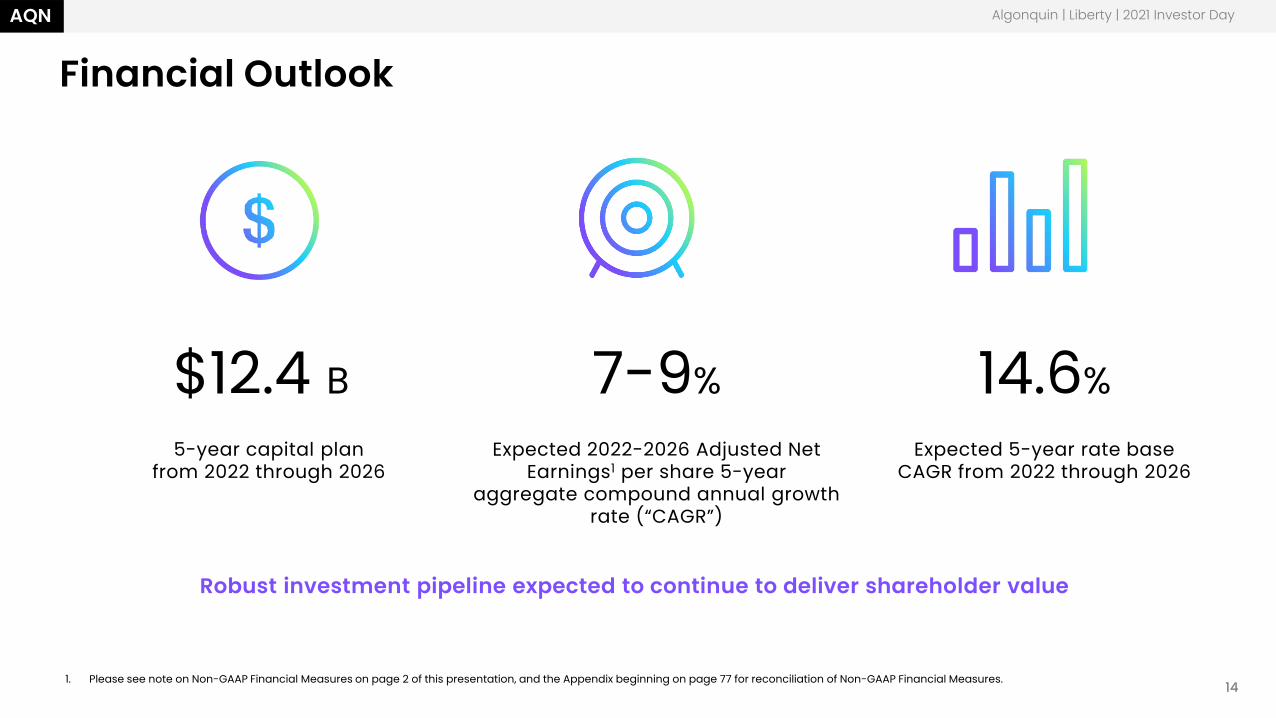
Financial Outlook
Robust investment pipeline expected to continue to deliver shareholder value
Algonquin | Liberty | 2021 Investor Day
1. Please see note on Non-GAAP Financial Measures on page 2 of this presentation, and the Appendix beginning on page 77 for reconciliation of Non-GAAP Financial Measures.
$12.4 B5-year capital plan
from 2022 through 2026
7-9%Expected 2022-2026 Adjusted Net
Earnings1 per share 5-year aggregate compound annual growth
rate (“CAGR”)
14.6%Expected 5-year rate base
CAGR from 2022 through 2026
AQN
15
AQN
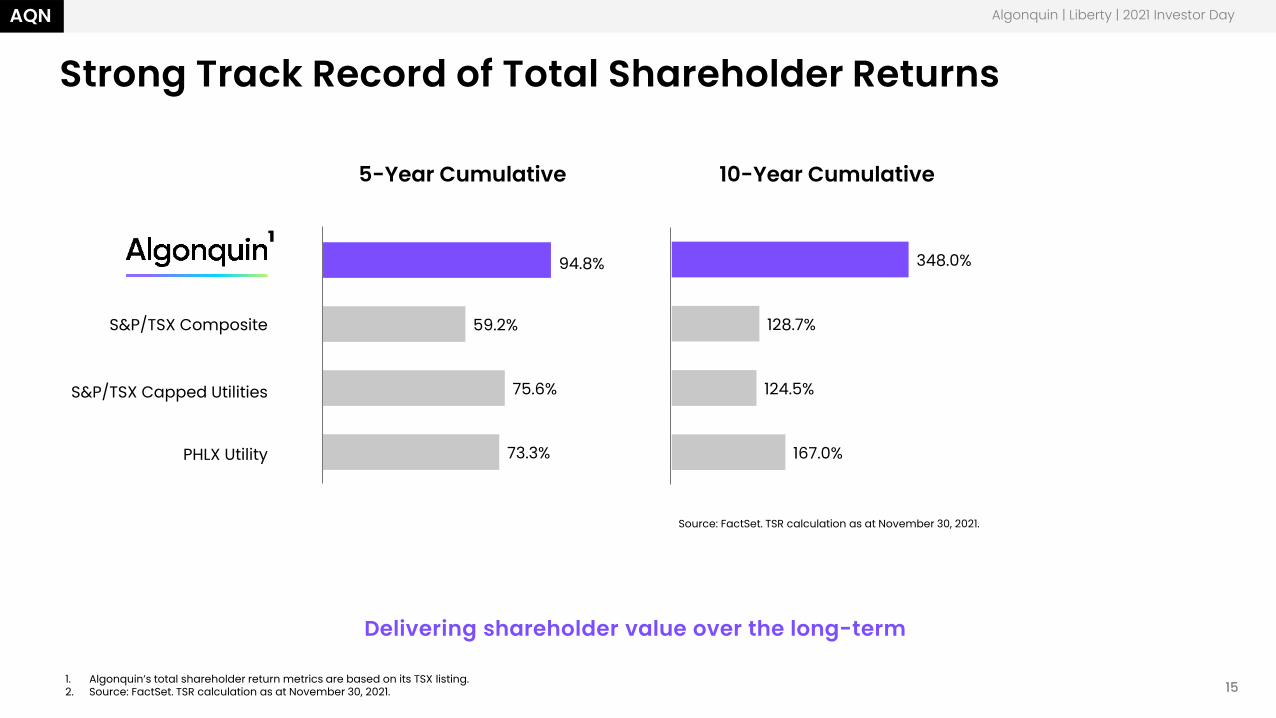
73.3%
75.6%
59.2%
94.8%
5-Year Cumulative
167.0%
124.5%
128.7%
348.0%
10-Year Cumulative
Strong Track Record of Total Shareholder Returns
Delivering shareholder value over the long-term
Algonquin | Liberty | 2021 Investor Day
Source: FactSet. TSR calculation as at November 30, 2021.
S&P/TSX Composite
S&P/TSX Capped Utilities
PHLX Utility
¹
1. Algonquin’s total shareholder return metrics are based on its TSX listing.2. Source: FactSet. TSR calculation as at November 30, 2021.
AQN
16
AQN
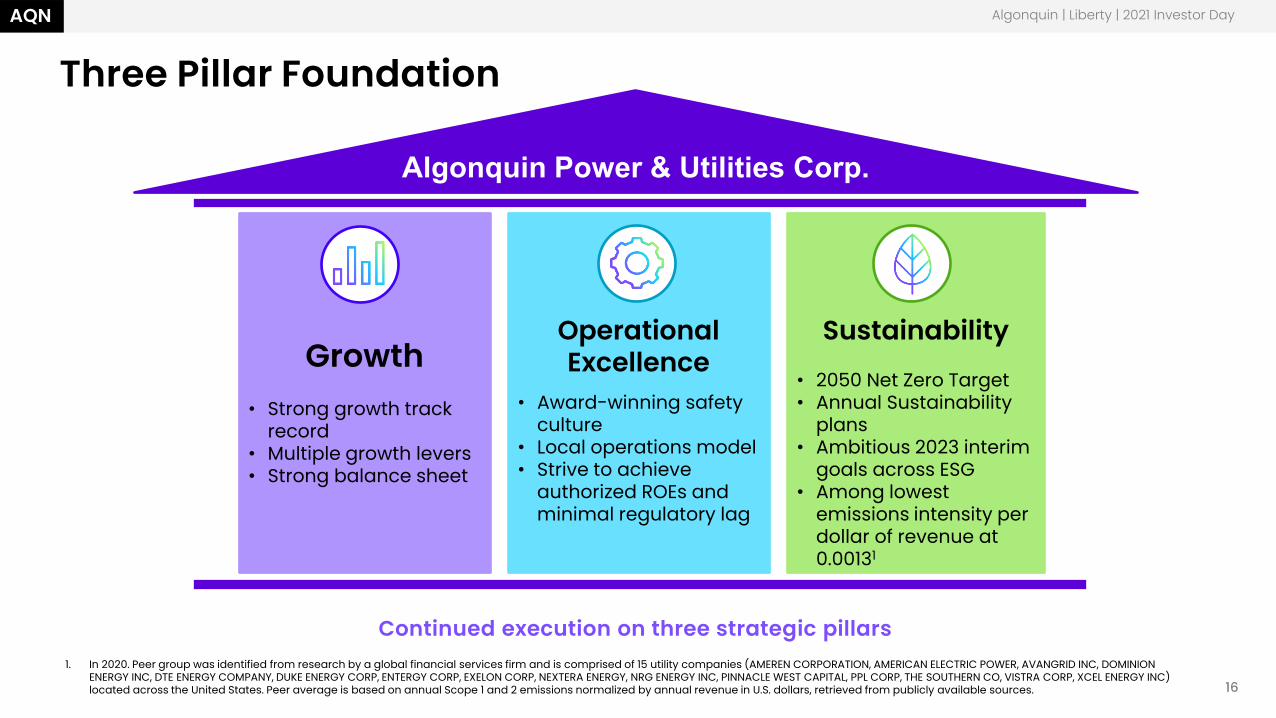
Three Pillar Foundation
Continued execution on three strategic pillars
Algonquin | Liberty | 2021 Investor Day
Algonquin Power & Utilities Corp.
Growth• Strong growth track
record• Multiple growth levers• Strong balance sheet
Sustainability
• 2050 Net Zero Target• Annual Sustainability
plans• Ambitious 2023 interim
goals across ESG• Among lowest
emissions intensity per dollar of revenue at 0.00131
Operational Excellence
• Award-winning safety culture
• Local operations model• Strive to achieve
authorized ROEs and minimal regulatory lag
1. In 2020. Peer group was identified from research by a global financial services firm and is comprised of 15 utility companies (AMEREN CORPORATION, AMERICAN ELECTRIC POWER, AVANGRID INC, DOMINION ENERGY INC, DTE ENERGY COMPANY, DUKE ENERGY CORP, ENTERGY CORP, EXELON CORP, NEXTERA ENERGY, NRG ENERGY INC, PINNACLE WEST CAPITAL, PPL CORP, THE SOUTHERN CO, VISTRA CORP, XCEL ENERGY INC) located across the United States. Peer average is based on annual Scope 1 and 2 emissions normalized by annual revenue in U.S. dollars, retrieved from publicly available sources.

Algonquin | Liberty | 2021 Investor Day
Growth
AQNAQN
18
Jeff Norman
“Algonquin’s development and construction platform is ready to execute on this once in a generation growth opportunity”
Algonquin | Liberty | 2021 Investor Day
Chief Development Officer
AQN
19
AQN
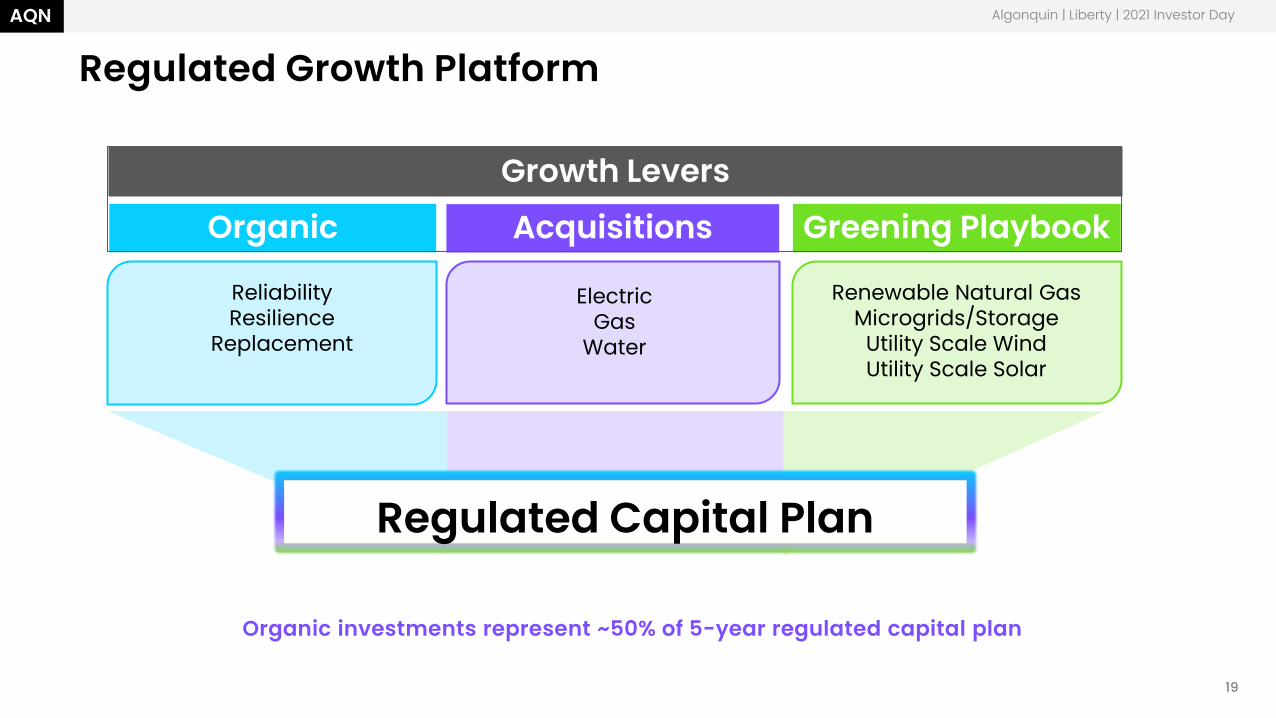
Regulated Growth Platform
Organic investments represent ~50% of 5-year regulated capital plan
Algonquin | Liberty | 2021 Investor Day
Growth Levers
Organic
ReliabilityResilience
Replacement
ElectricGas
Water
Acquisitions
Renewable Natural GasMicrogrids/Storage
Utility Scale WindUtility Scale Solar
Greening Playbook
Regulated Capital Plan
AQN
20
AQN
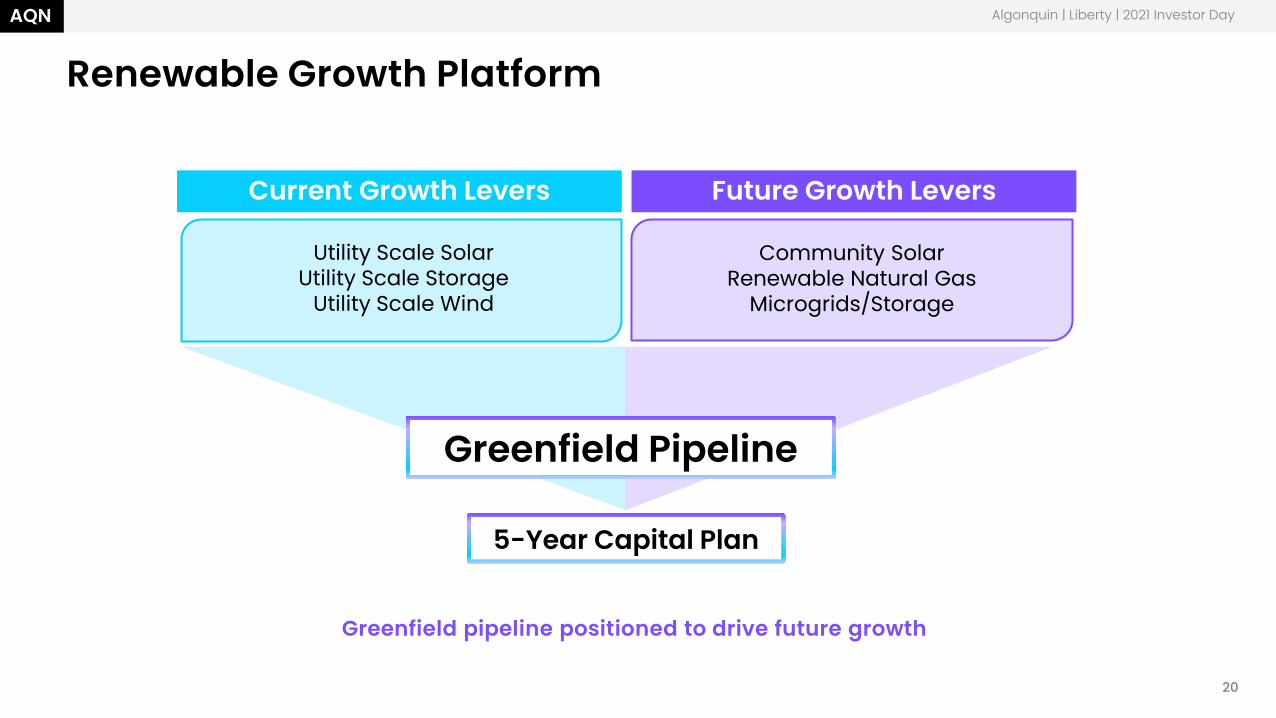
Renewable Growth Platform
Algonquin | Liberty | 2021 Investor Day
Greenfield pipeline positioned to drive future growth
3.8 GW Solar Pipeline
Greenfield Pipeline
Current Growth Levers Future Growth Levers
Utility Scale SolarUtility Scale Storage
Utility Scale Wind
Community SolarRenewable Natural Gas
Microgrids/Storage
5-Year Capital Plan
AQN
21
AQN
$45
$65
$151
$83
$26
$28
$59
$67
$147
$- $50 $100 $150 $200 $250
GAS COMBINED CYCLE
COAL
GAS PEAKING
WIND - OFFSHORE
WIND - ONSHORE
SOLAR PV - UT IL ITY SCALE
SOLAR PV - COMMUNITY
SOLAR PV - ROOFTOP C&I
SOLAR PV - ROOFTOP RES IDENTIAL
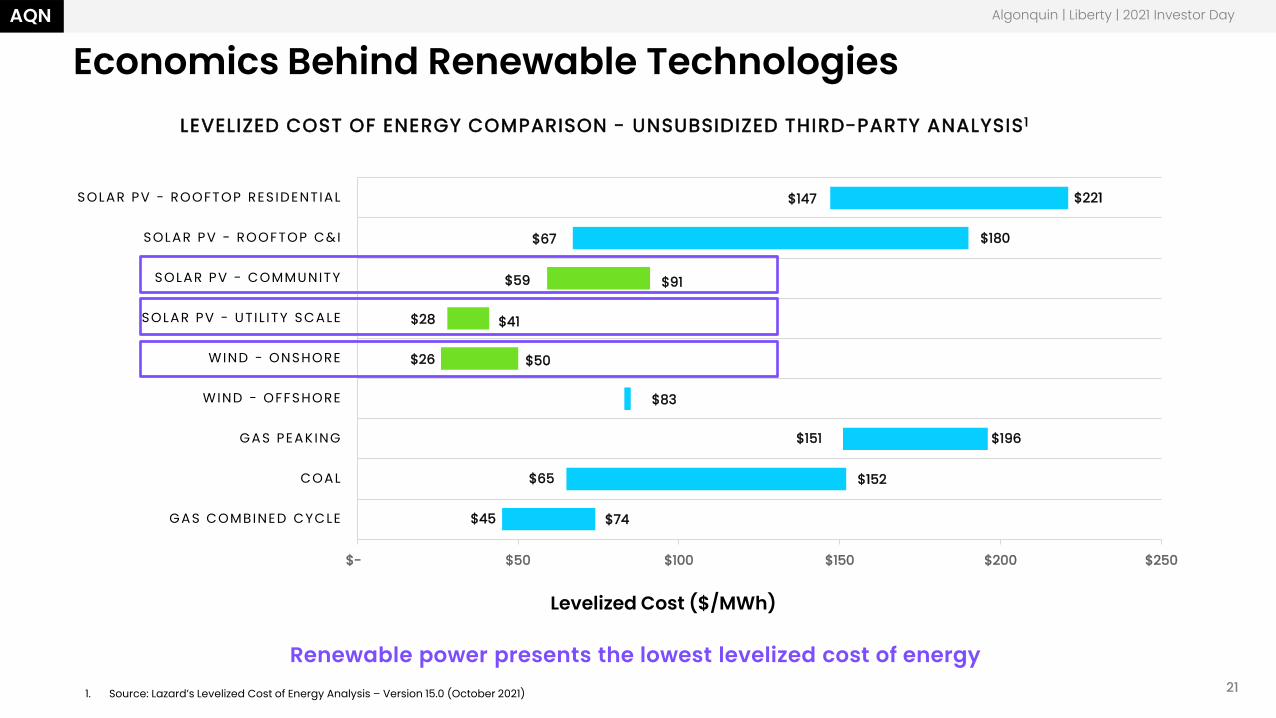
LEVELIZED COST OF ENERGY COMPARISON - UNSUBSIDIZED THIRD-PARTY ANALYSIS1
$91
$41
$50
$196
$152
$74
$180
$221
Renewable power presents the lowest levelized cost of energy
Economics Behind Renewable TechnologiesAlgonquin | Liberty | 2021 Investor Day
1. Source: Lazard’s Levelized Cost of Energy Analysis – Version 15.0 (October 2021)
Levelized Cost ($/MWh)
AQN
ShadyOaks II$0.2 B
TXCoastal
Wind$0.3 B
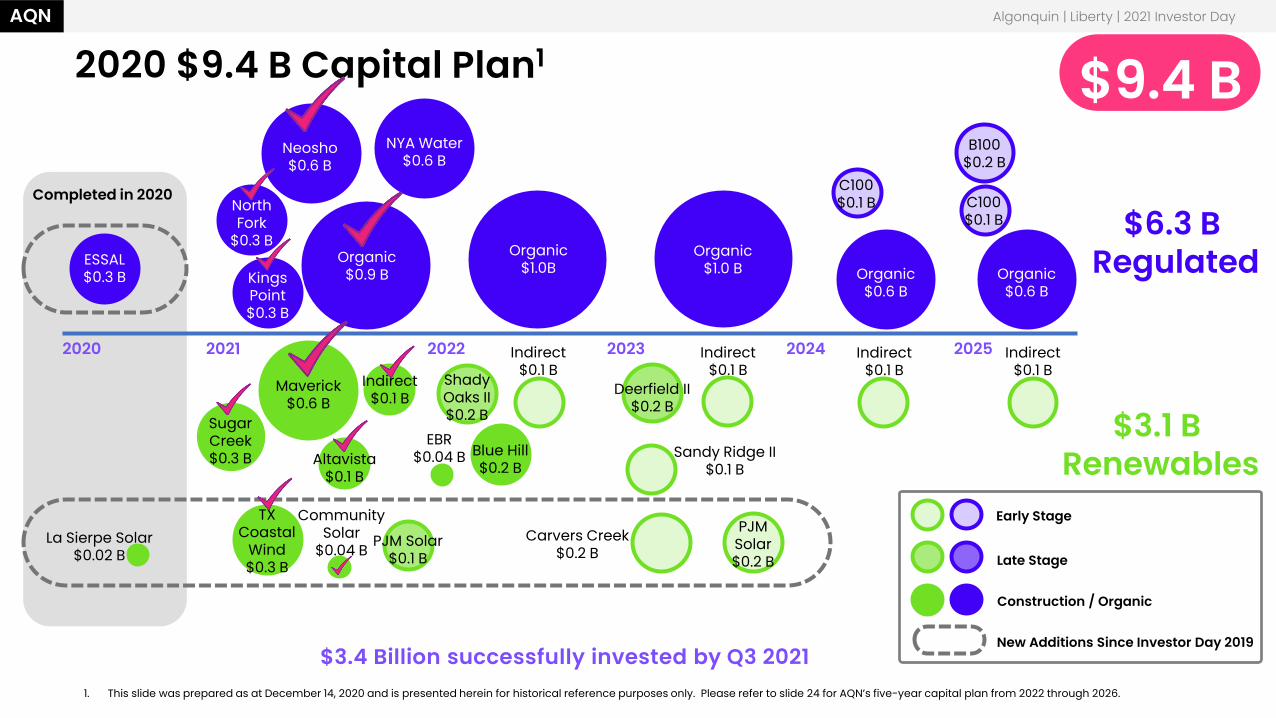
2020 $9.4 B Capital Plan1
$3.4 Billion successfully invested by Q3 2021
$9.4 B
NorthFork
$0.3 B
KingsPoint$0.3 B
Neosho$0.6 B
NYA Water$0.6 B
C100$0.1 B
B100$0.2 B
Organic$0.6 B
Organic$0.9 B
Organic$1.0 B
Organic$1.0B
CommunitySolar
$0.04 BCarvers Creek
$0.2 B
ESSAL$0.3 B
PJM Solar$0.1 B
La Sierpe Solar$0.02 B
PJMSolar$0.2 B
Organic$0.6 B
2020 2021 2022 2023 2024 2025
EBR$0.04 B
SugarCreek$0.3 B Blue Hill
$0.2 B
Deerfield II$0.2 B
Indirect$0.1 B
Indirect$0.1 B
Indirect$0.1 B
Altavista$0.1 B
Maverick$0.6 B
Indirect$0.1 B
Sandy Ridge II$0.1 B
Indirect$0.1 B
$6.3 B Regulated
$3.1 B Renewables
C100$0.1 B
Construction / Organic
Late Stage
Early Stage
1. This slide was prepared as at December 14, 2020 and is presented herein for historical reference purposes only. Please refer to slide 24 for AQN’s five-year capital plan from 2022 through 2026.
New Additions Since Investor Day 2019
Algonquin | Liberty | 2021 Investor Day
Completed in 2020
AQN
23
AQN
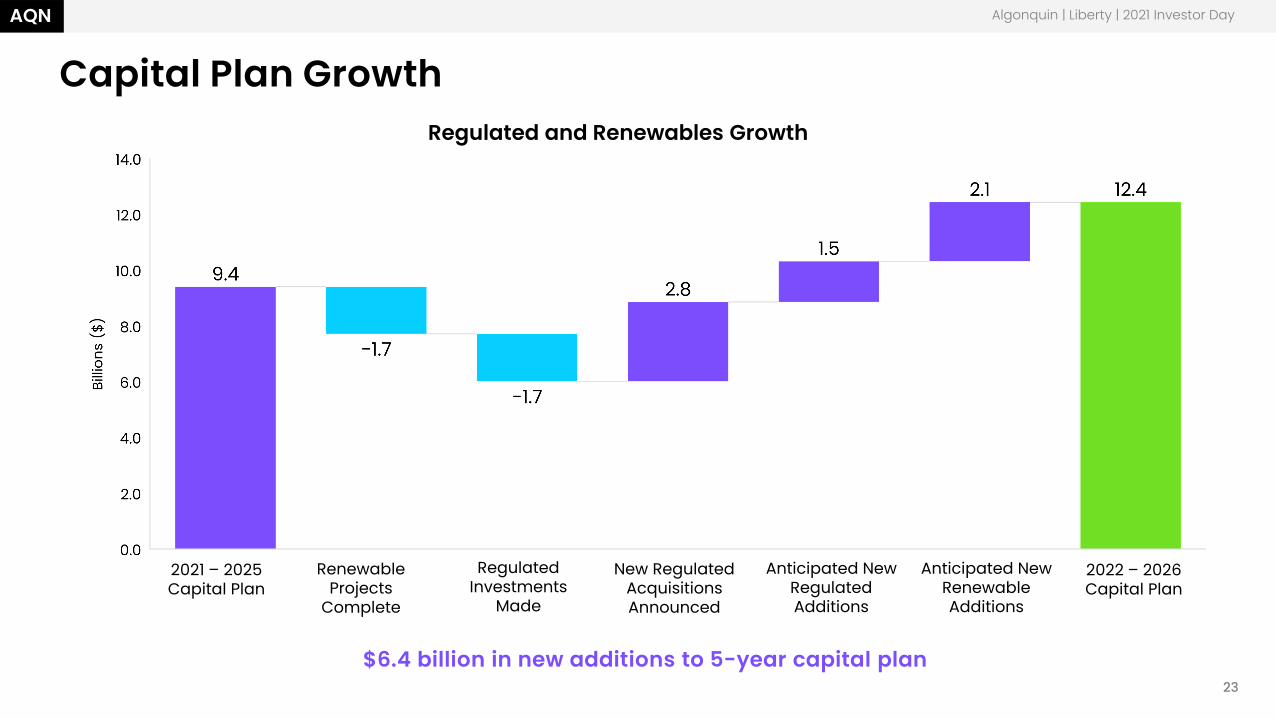
Capital Plan Growth
$6.4 billion in new additions to 5-year capital plan
Algonquin | Liberty | 2021 Investor Day
Regulated and Renewables Growth
2021 – 2025 Capital Plan
Renewable Projects
Complete
Regulated Investments
Made
New Regulated Acquisitions Announced
Anticipated New Regulated Additions
Anticipated New Renewable Additions
2022 – 2026 Capital Plan
AQN
24
AQN
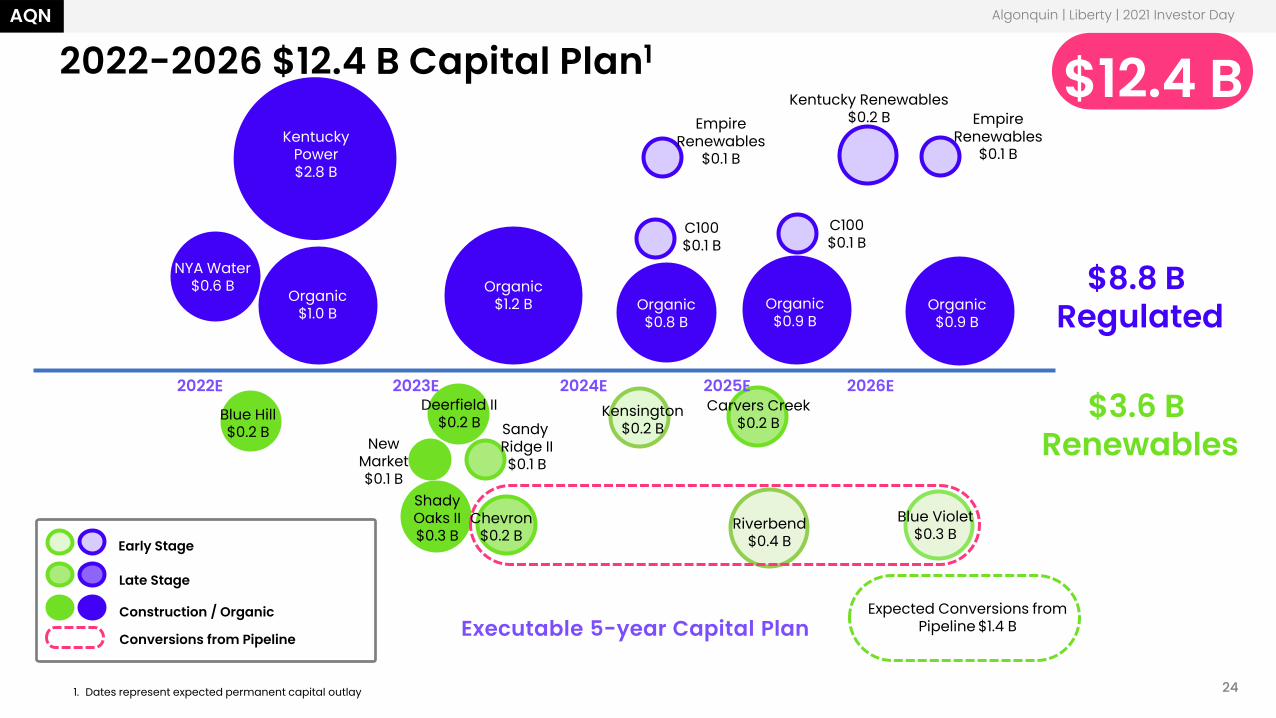
Expected Conversions from Pipeline $1.4 B
Organic$1.0 B
ShadyOaks II$0.3 B
2022-2026 $12.4 B Capital Plan1
Executable 5-year Capital Plan
Algonquin | Liberty | 2021 Investor Day
$12.4 BKentucky
Power$2.8 B
Organic$0.8 B
Organic$1.2 B
Carvers Creek$0.2 B
New Market$0.1 B
Organic$0.9 B
2022E 2023E 2024E 2025E 2026EDeerfield II
$0.2 B SandyRidge II$0.1 B
$8.8 BRegulated
$3.6 BRenewables
1. Dates represent expected permanent capital outlay
NYA Water$0.6 B
Riverbend$0.4 B
Organic$0.9 B
C100$0.1 B
Empire Renewables
$0.1 B
Empire Renewables
$0.1 B
Kentucky Renewables $0.2 B
Kensington$0.2 B
Construction / Organic
Late Stage
Early Stage
Blue Hill$0.2 B
C100$0.1 B
Conversions from Pipeline
Blue Violet$0.3 B
Chevron$0.2 B

Algonquin | Liberty | 2021 Investor Day
Growth Regulated
AQN
26
AQN
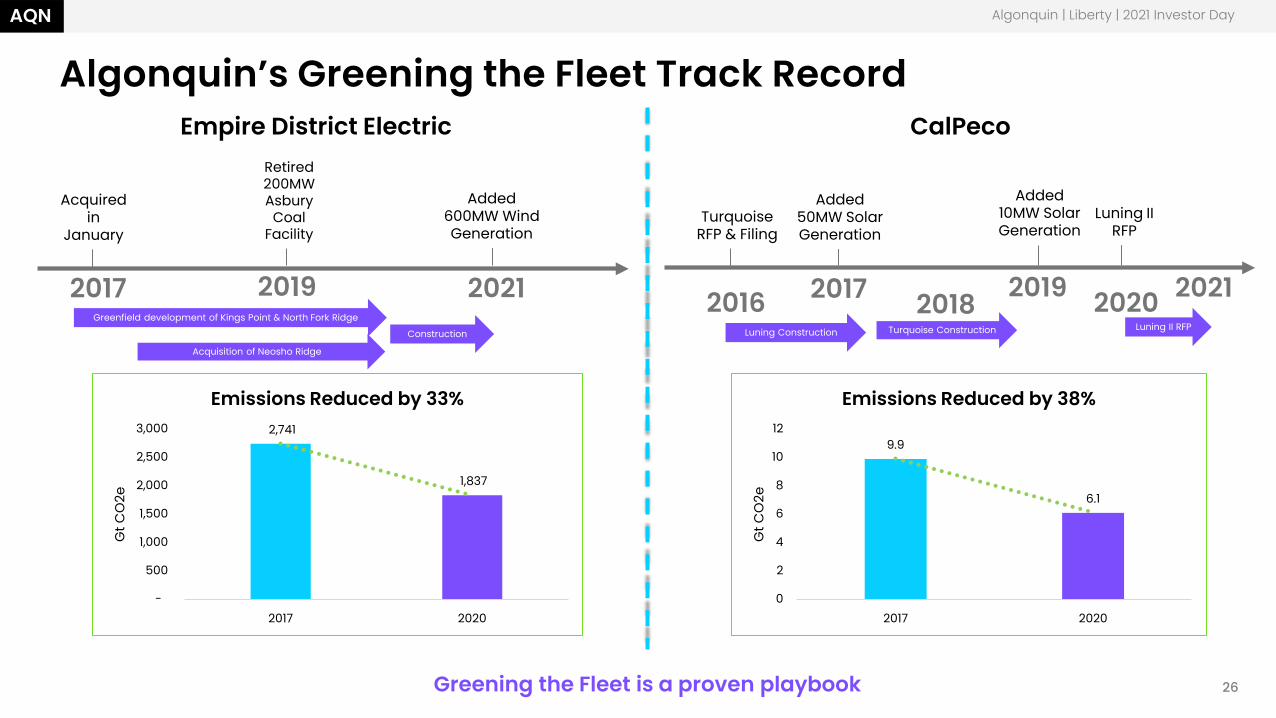
Algonquin’s Greening the Fleet Track Record
Algonquin | Liberty | 2021 Investor Day
Empire District Electric CalPeco
2,741
1,837
-
500
1,000
1,500
2,000
2,500
3,000
2017 2020
Gt C
O2e
Emissions Reduced by 33%
9.9
6.1
0
2
4
6
8
10
12
2017 2020
Gt C
O2e
Emissions Reduced by 38%
2017 2019 2021Greenfield development of Kings Point & North Fork Ridge
Acquisition of Neosho Ridge
Construction Luning Construction
Acquired in
January
Retired 200MW Asbury
Coal Facility
Added 600MW Wind Generation
2018 20212016 2019 20202017
Turquoise RFP & Filing
Turquoise Construction
Luning II RFP
Luning II RFP
Greening the Fleet is a proven playbook
Added 50MW Solar Generation
Added 10MW Solar Generation
AQN
27
AQN
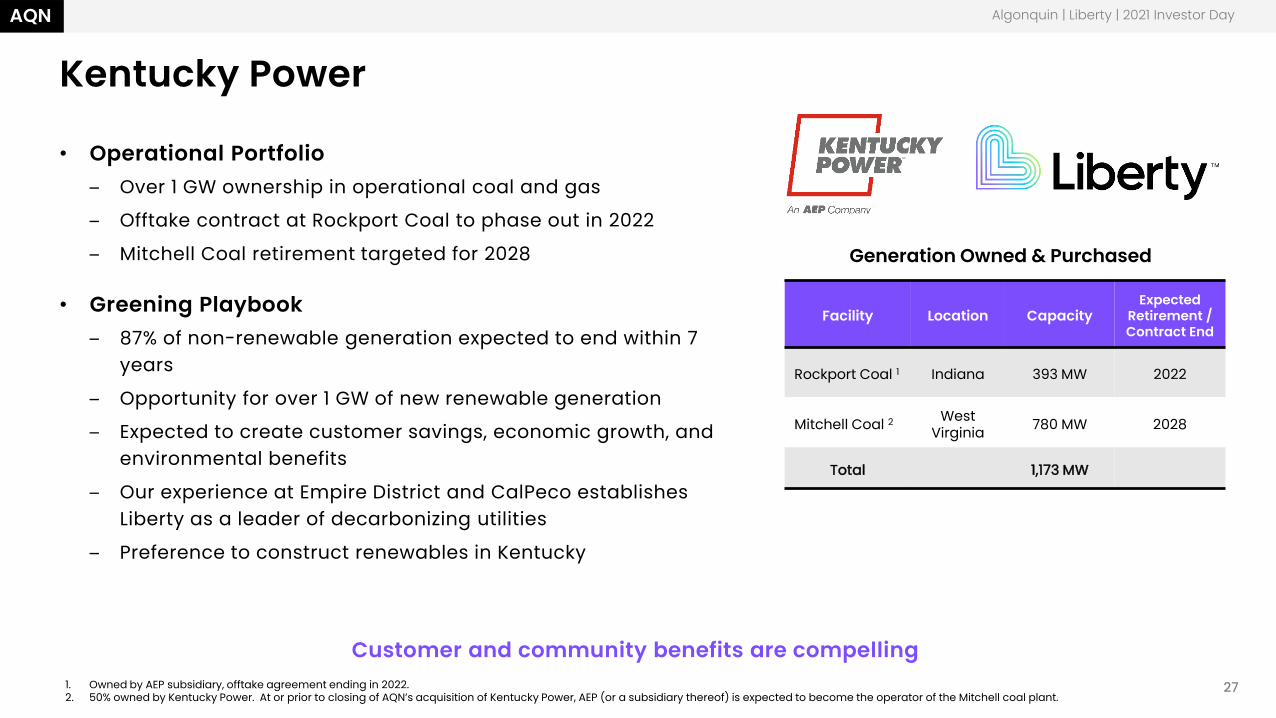
Kentucky Power
Customer and community benefits are compelling
• Operational Portfolio– Over 1 GW ownership in operational coal and gas
– Offtake contract at Rockport Coal to phase out in 2022
– Mitchell Coal retirement targeted for 2028
• Greening Playbook– 87% of non-renewable generation expected to end within 7
years
– Opportunity for over 1 GW of new renewable generation
– Expected to create customer savings, economic growth, and environmental benefits
– Our experience at Empire District and CalPeco establishes Liberty as a leader of decarbonizing utilities
– Preference to construct renewables in Kentucky
Algonquin | Liberty | 2021 Investor Day
Facility Location CapacityExpected
Retirement / Contract End
Rockport Coal 1 Indiana 393 MW 2022
Mitchell Coal 2 West Virginia 780 MW 2028
Total 1,173 MW
1. Owned by AEP subsidiary, offtake agreement ending in 2022.2. 50% owned by Kentucky Power. At or prior to closing of AQN’s acquisition of Kentucky Power, AEP (or a subsidiary thereof) is expected to become the operator of the Mitchell coal plant.
Generation Owned & Purchased

Algonquin | Liberty | 2021 Investor Day
Growth Renewables
AQN
29
AQN
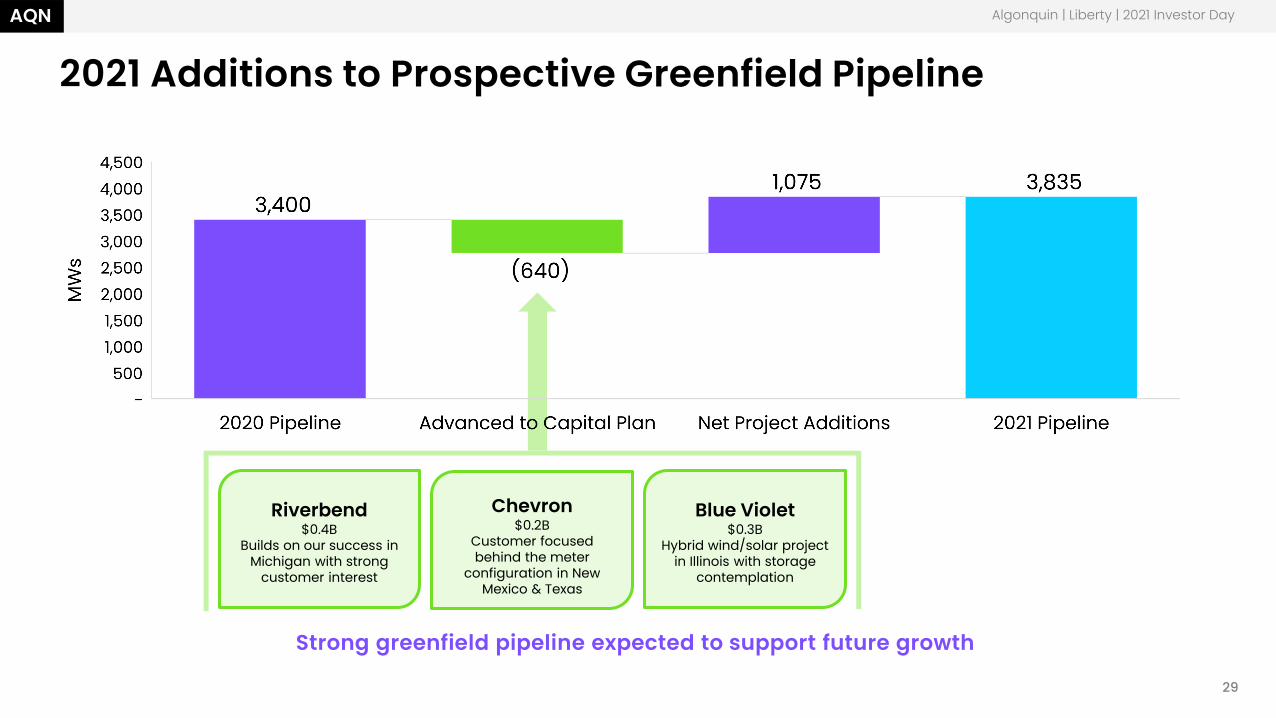
2021 Additions to Prospective Greenfield Pipeline
Strong greenfield pipeline expected to support future growth
Algonquin | Liberty | 2021 Investor Day
Riverbend$0.4B
Builds on our success in Michigan with strong
customer interest
Chevron$0.2B
Customer focused behind the meter
configuration in New Mexico & Texas
Blue Violet$0.3B
Hybrid wind/solar project in Illinois with storage
contemplation
AQNAQN
30
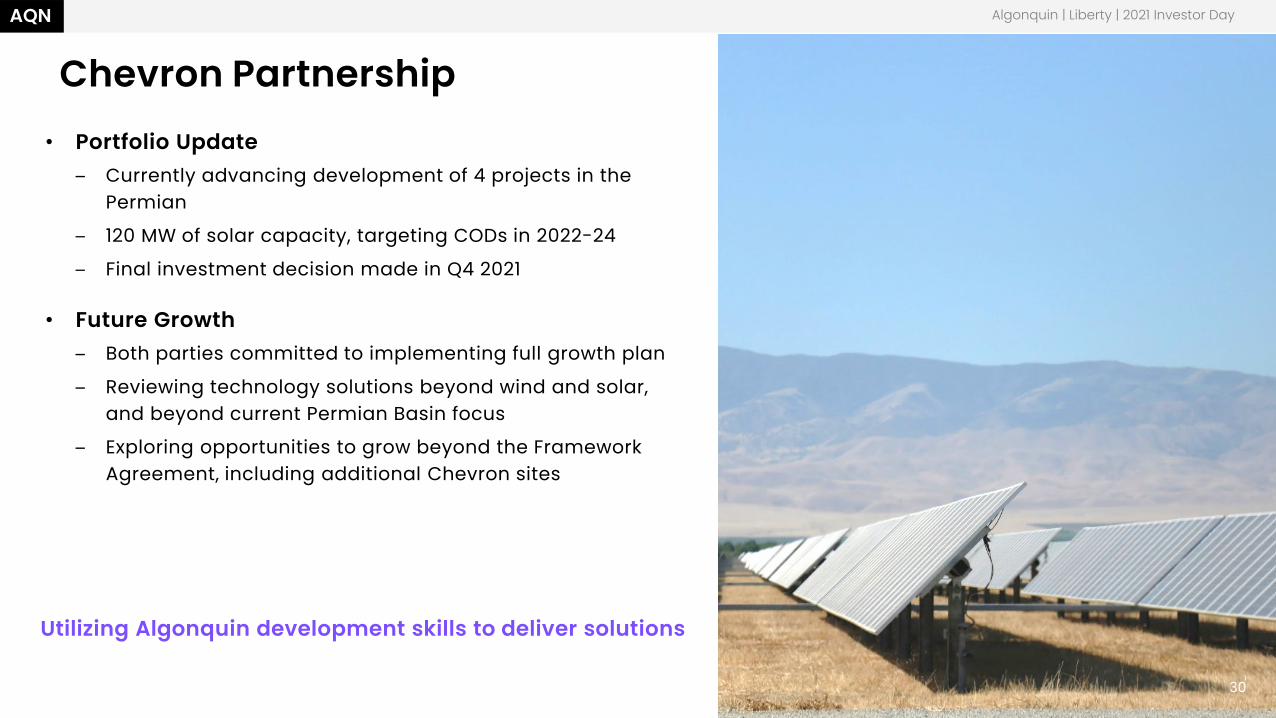
Chevron Partnership
Utilizing Algonquin development skills to deliver solutions
• Portfolio Update– Currently advancing development of 4 projects in the
Permian
– 120 MW of solar capacity, targeting CODs in 2022-24
– Final investment decision made in Q4 2021
• Future Growth– Both parties committed to implementing full growth plan
– Reviewing technology solutions beyond wind and solar, and beyond current Permian Basin focus
– Exploring opportunities to grow beyond the Framework Agreement, including additional Chevron sites
Algonquin | Liberty | 2021 Investor Day
30
AQN
31
AQN
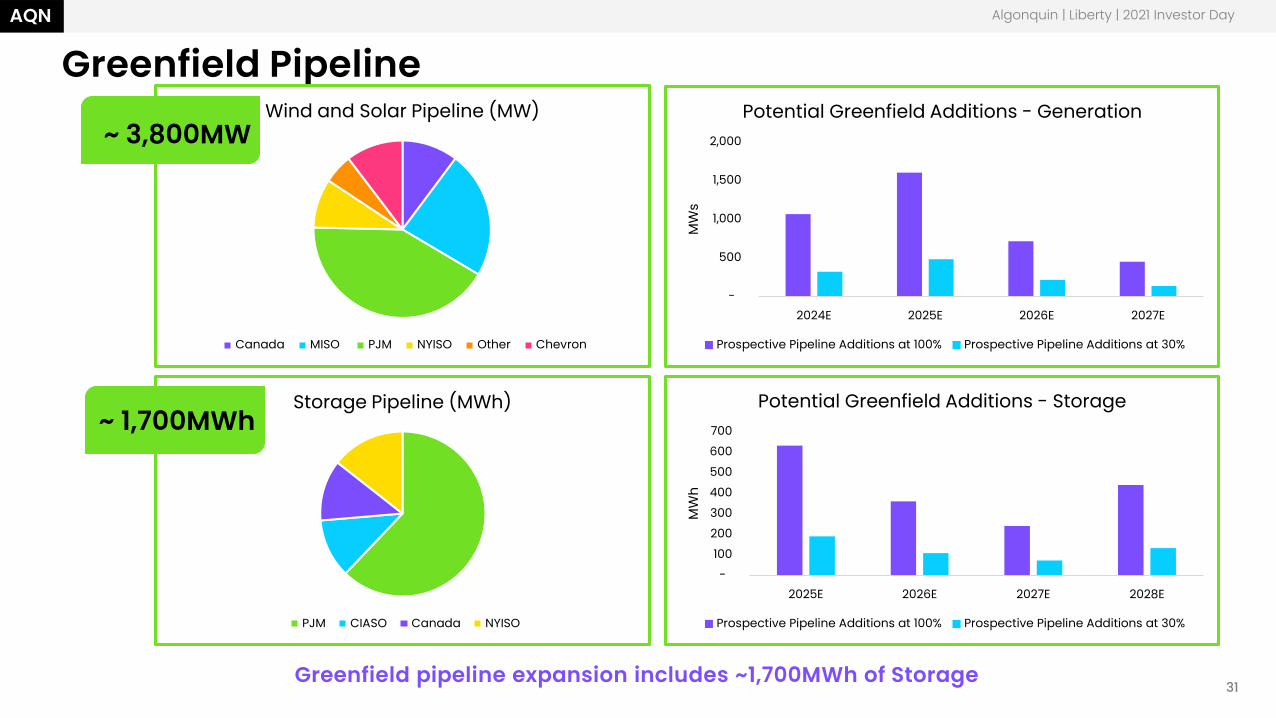
Greenfield Pipeline
Greenfield pipeline expansion includes ~1,700MWh of Storage
Algonquin | Liberty | 2021 Investor Day
Wind and Solar Pipeline (MW)
Canada MISO PJM NYISO Other Chevron
Storage Pipeline (MWh)
PJM CIASO Canada NYISO
~ 3,800MW
~ 1,700MWh
- 100 200 300 400 500 600 700
2025E 2026E 2027E 2028E
MW
h
Potential Greenfield Additions - Storage
Prospective Pipeline Additions at 100% Prospective Pipeline Additions at 30%
-
500
1,000
1,500
2,000
2024E 2025E 2026E 2027E
MW
s
Potential Greenfield Additions - Generation
Prospective Pipeline Additions at 100% Prospective Pipeline Additions at 30%
AQN
32
AQN
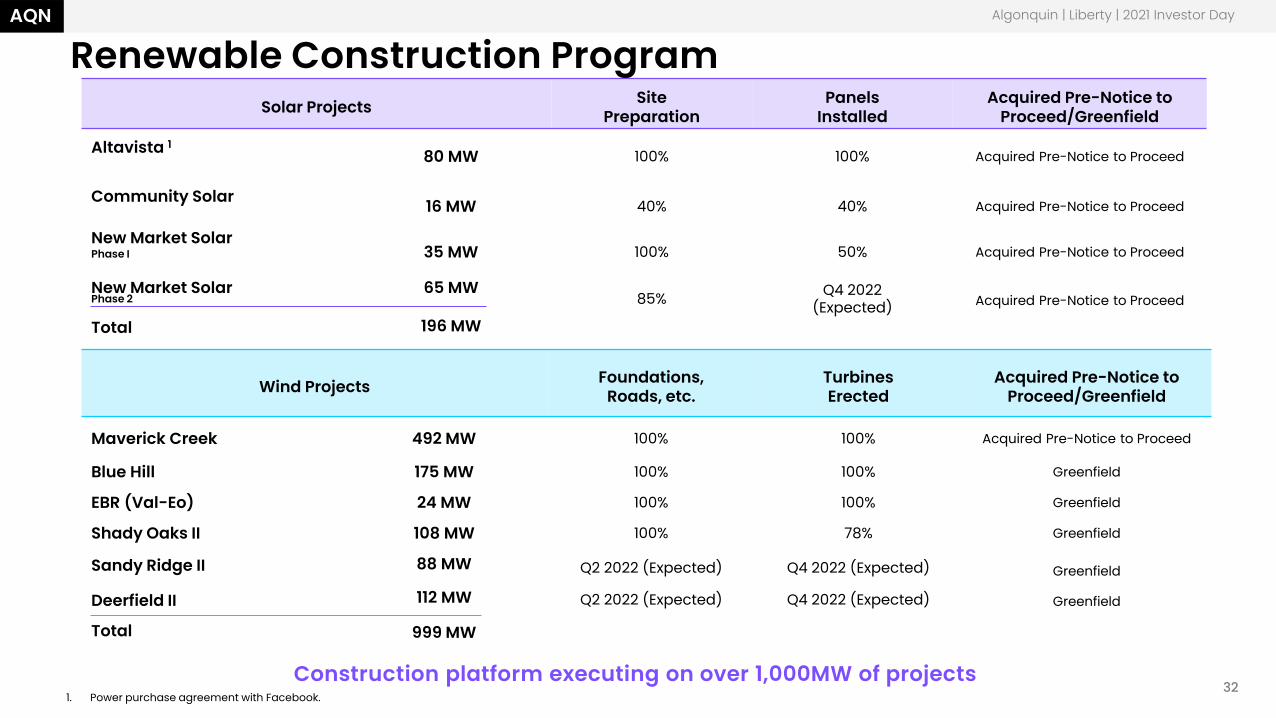
Renewable Construction Program
Construction platform executing on over 1,000MW of projects
Solar Projects Site Preparation
Panels Installed
Acquired Pre-Notice to Proceed/Greenfield
Altavista 1 80 MW 100% 100% Acquired Pre-Notice to Proceed
Community Solar
New Market Solar Phase I
16 MW 40% 40% Acquired Pre-Notice to Proceed
35 MW 100% 50% Acquired Pre-Notice to Proceed
New Market Solar Phase 2
Total
65 MW
196 MW85% Q4 2022
(Expected) Acquired Pre-Notice to Proceed
Wind Projects Foundations, Roads, etc.
Turbines Erected
Acquired Pre-Notice to Proceed/Greenfield
Maverick Creek 492 MW 100% 100% Acquired Pre-Notice to Proceed
Blue Hill 175 MW 100% 100% Greenfield
EBR (Val-Eo) 24 MW 100% 100% Greenfield
Shady Oaks II 108 MW 100% 78% Greenfield
Sandy Ridge II
Deerfield II
Total
88 MW
112 MW
999 MW
Q2 2022 (Expected)
Q2 2022 (Expected)
Q4 2022 (Expected)
Q4 2022 (Expected)
Greenfield
Greenfield
Algonquin | Liberty | 2021 Investor Day
1. Power purchase agreement with Facebook.
AQNAQN
33
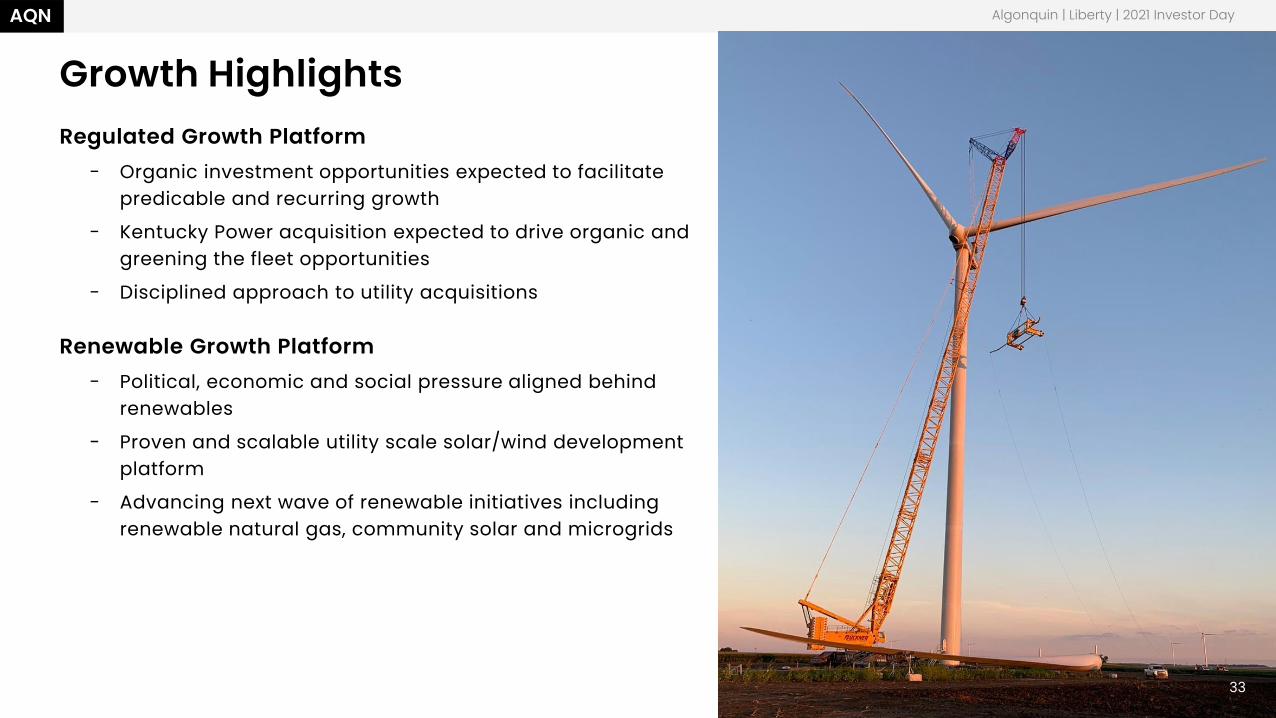
Growth HighlightsRegulated Growth Platform
- Organic investment opportunities expected to facilitate predicable and recurring growth
- Kentucky Power acquisition expected to drive organic and greening the fleet opportunities
- Disciplined approach to utility acquisitions
Renewable Growth Platform- Political, economic and social pressure aligned behind
renewables
- Proven and scalable utility scale solar/wind development platform
- Advancing next wave of renewable initiatives including renewable natural gas, community solar and microgrids
Algonquin | Liberty | 2021 Investor Day
33

Algonquin | Liberty | 2021 Investor Day
Operational Excellence
AQNAQN
35
Johnny Johnston
“Empowering our employees to drive customer improvements, is the foundation to delivering consistent, solid returns for our investors.”
Algonquin | Liberty | 2021 Investor Day
Chief Operating Officer
AQN
36
AQN
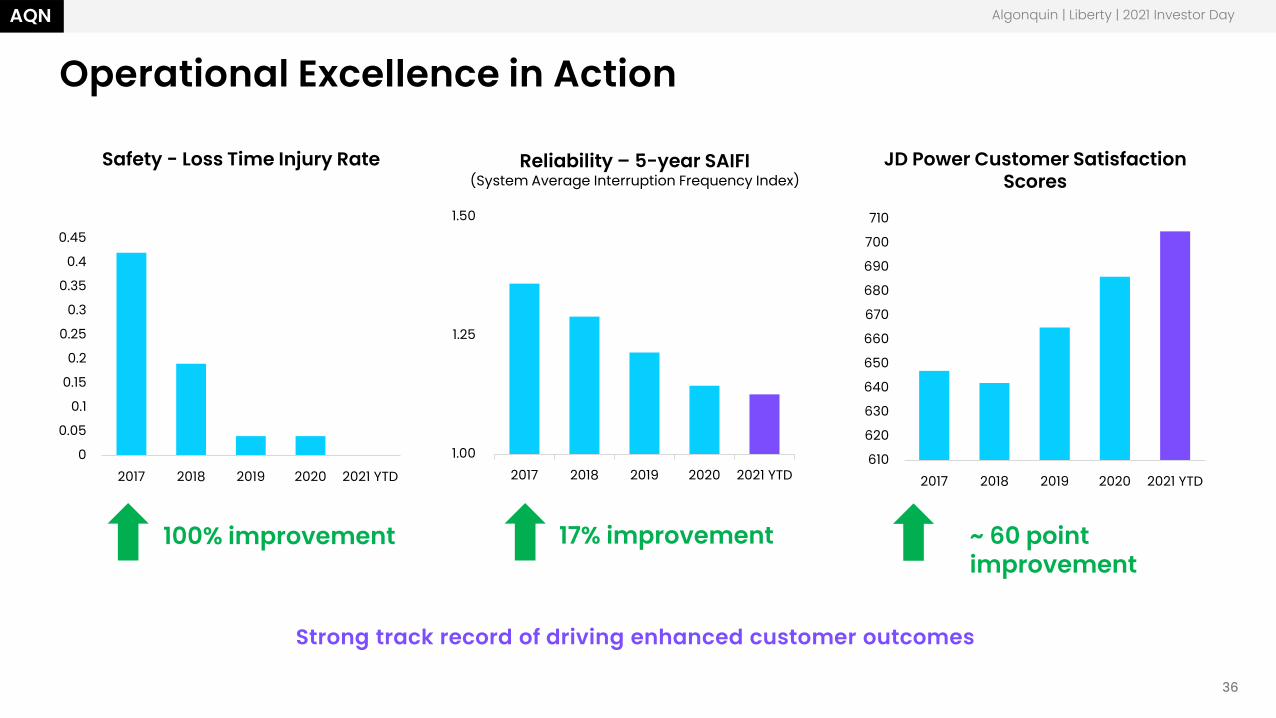
Operational Excellence in Action
Strong track record of driving enhanced customer outcomes
610
620
630
640
650
660
670
680
690
700
710
2017 2018 2019 2020 2021 YTD
Algonquin | Liberty | 2021 Investor Day
100% improvement 17% improvement ~ 60 point improvement
1.00
1.25
1.50
2017 2018 2019 2020 2021 YTD
Safety - Loss Time Injury Rate Reliability – 5-year SAIFI(System Average Interruption Frequency Index)
JD Power Customer Satisfaction Scores
0
0.05
0.1
0.15
0.2
0.25
0.3
0.35
0.4
0.45
2017 2018 2019 2020 2021 YTD
AQN
37
AQN
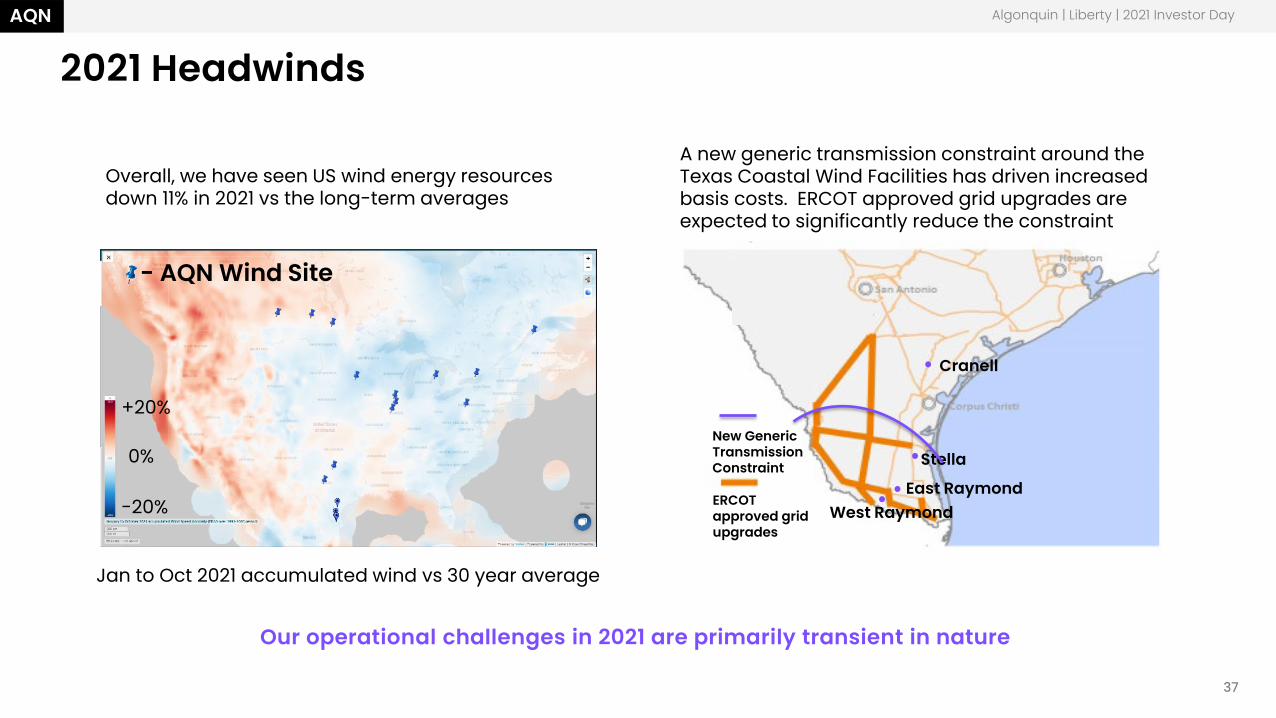
2021 HeadwindsAlgonquin | Liberty | 2021 Investor Day
A new generic transmission constraint around the Texas Coastal Wind Facilities has driven increased basis costs. ERCOT approved grid upgrades are expected to significantly reduce the constraint
East RaymondWest Raymond
Stella
Cranell
New Generic Transmission Constraint
ERCOT approved gridupgrades
Overall, we have seen US wind energy resources down 11% in 2021 vs the long-term averages
Our operational challenges in 2021 are primarily transient in nature
Jan to Oct 2021 accumulated wind vs 30 year average
-20%
+20%
0%
- AQN Wind Site
AQN
38
AQN
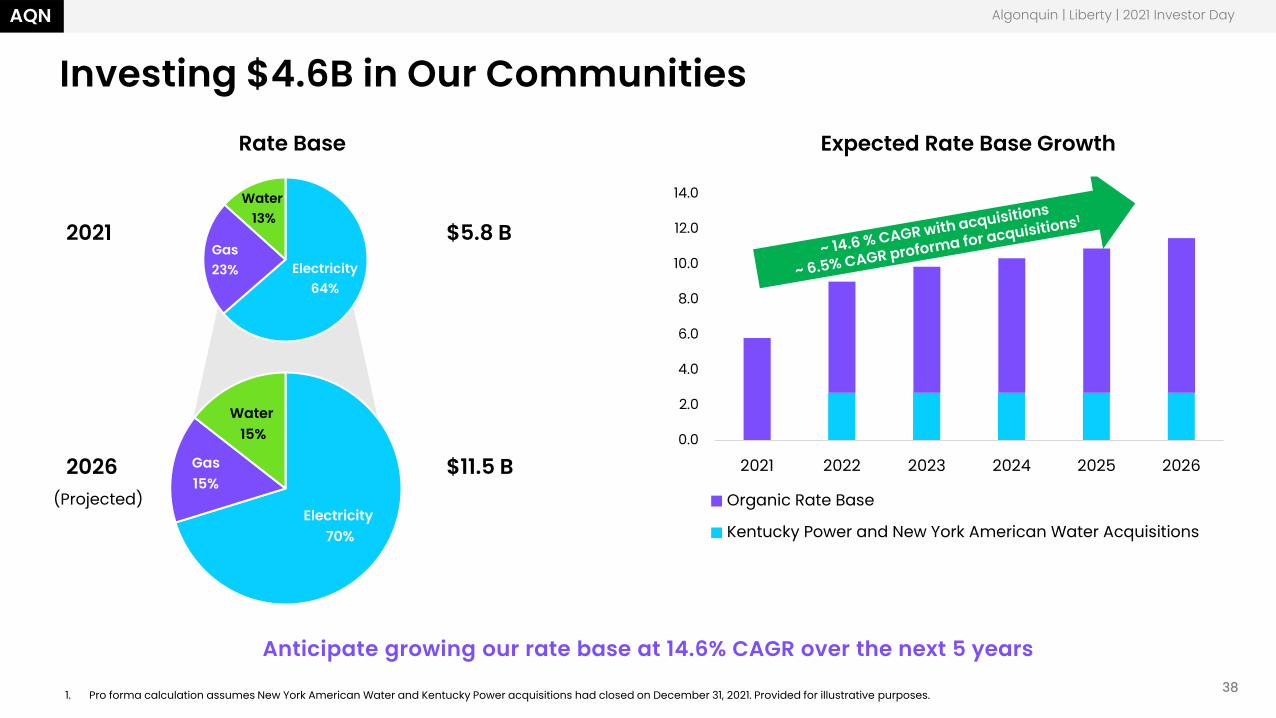
Investing $4.6B in Our Communities
Algonquin | Liberty | 2021 Investor Day
Anticipate growing our rate base at 14.6% CAGR over the next 5 years
Electricity 64%
Gas23%
Water13%
Electricity70%
Gas15%
Water15%
2021
2026(Projected)
Rate Base
$5.8 B
$11.5 B
Expected Rate Base Growth
0.0
2.0
4.0
6.0
8.0
10.0
12.0
14.0
2021 2022 2023 2024 2025 2026
Organic Rate Base
Kentucky Power and New York American Water Acquisitions
1. Pro forma calculation assumes New York American Water and Kentucky Power acquisitions had closed on December 31, 2021. Provided for illustrative purposes.
AQN
39
AQN
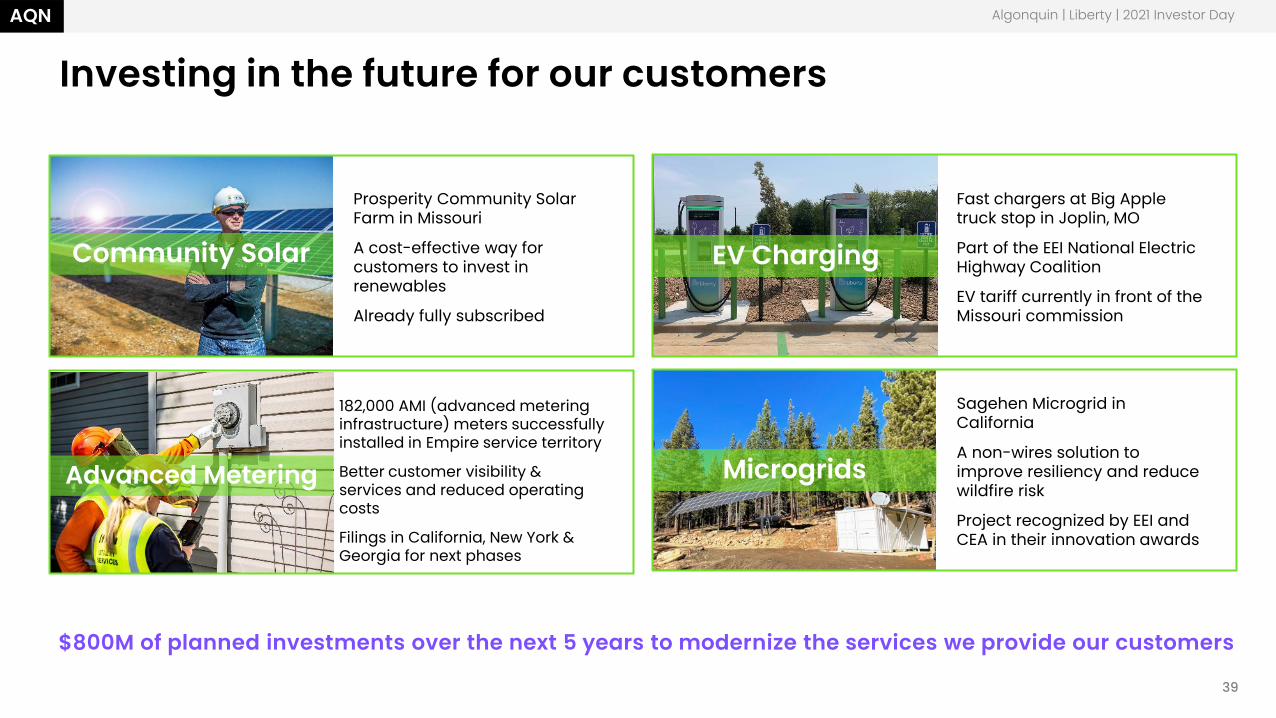
Investing in the future for our customers
Algonquin | Liberty | 2021 Investor Day
$800M of planned investments over the next 5 years to modernize the services we provide our customers
Prosperity Community Solar Farm in Missouri
A cost-effective way for customers to invest in renewables
Already fully subscribed
Sagehen Microgrid in California
A non-wires solution to improve resiliency and reduce wildfire risk
Project recognized by EEI and CEA in their innovation awards
182,000 AMI (advanced metering infrastructure) meters successfully installed in Empire service territory
Better customer visibility & services and reduced operating costs
Filings in California, New York & Georgia for next phases
Fast chargers at Big Apple truck stop in Joplin, MO
Part of the EEI National Electric Highway Coalition
EV tariff currently in front of the Missouri commission
Community Solar
Advanced Metering
EV Charging
Microgrids
AQN
40
AQN
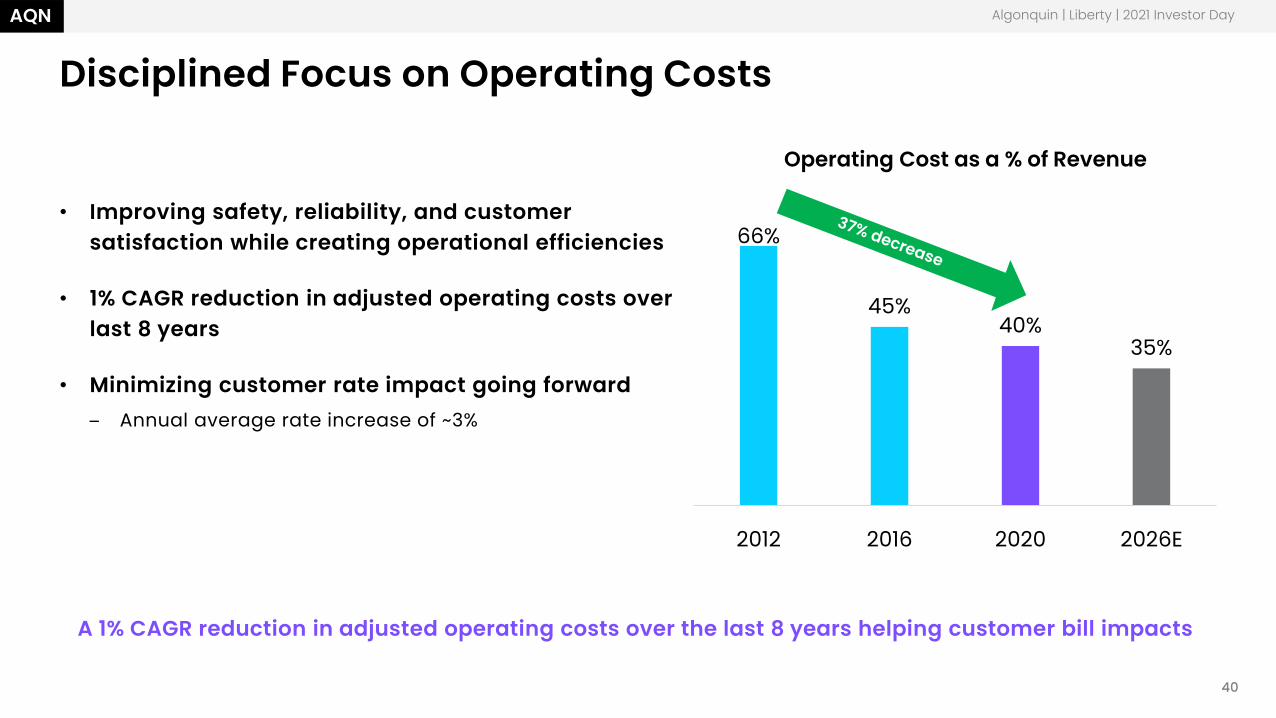
Disciplined Focus on Operating Costs
A 1% CAGR reduction in adjusted operating costs over the last 8 years helping customer bill impacts
• Improving safety, reliability, and customer satisfaction while creating operational efficiencies
• 1% CAGR reduction in adjusted operating costs over last 8 years
• Minimizing customer rate impact going forward– Annual average rate increase of ~3%
Algonquin | Liberty | 2021 Investor Day
Operating Cost as a % of Revenue
66%
45%40%
35%
2012 2016 2020 2026E
AQN
41
AQN
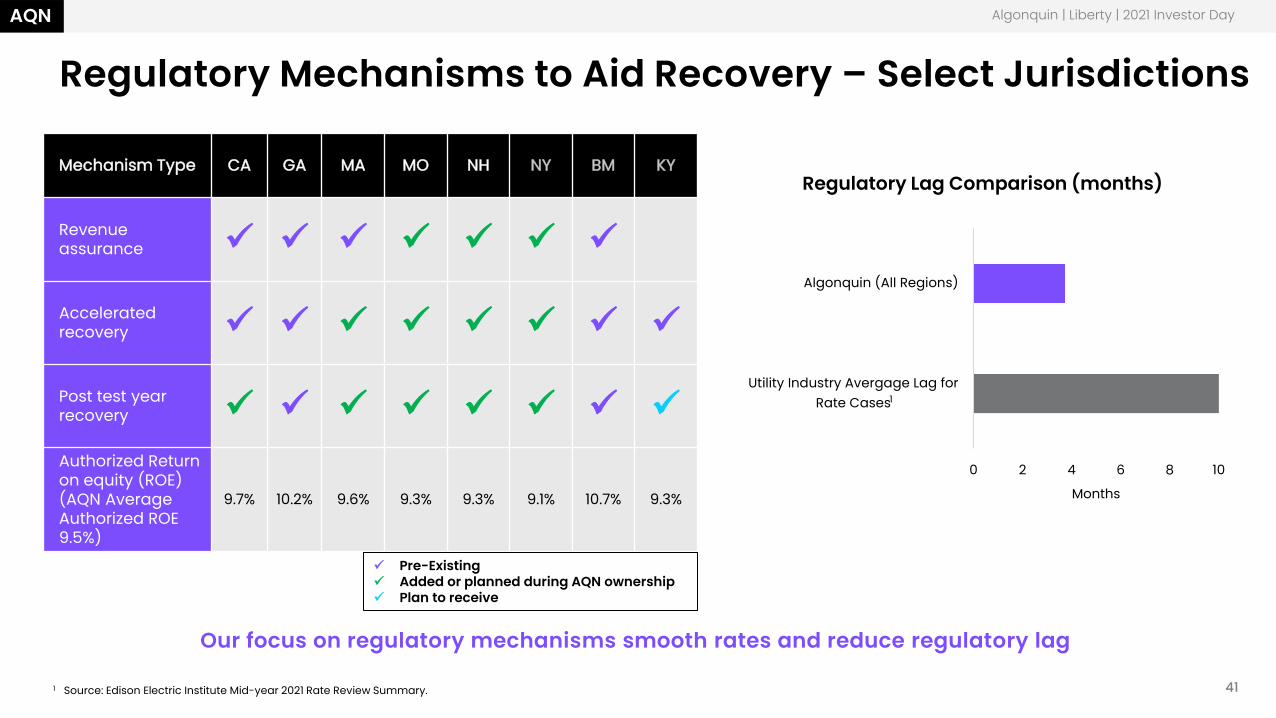
Regulatory Mechanisms to Aid Recovery – Select Jurisdictions
Our focus on regulatory mechanisms smooth rates and reduce regulatory lag
Algonquin | Liberty | 2021 Investor Day
Mechanism Type CA GA MA MO NH NY BM KY
Revenue assurance
Accelerated recovery
Post test year recovery Authorized Return on equity (ROE) (AQN Average Authorized ROE 9.5%)
9.7% 10.2% 9.6% 9.3% 9.3% 9.1% 10.7% 9.3%
Pre-ExistingAdded or planned during AQN ownershipPlan to receive
Regulatory Lag Comparison (months)
1 Source: Edison Electric Institute Mid-year 2021 Rate Review Summary.
0 2 4 6 8 10
Utility Industry Avergage Lag forRate Cases
Algonquin (All Regions)
Months
1
AQN
42
AQN
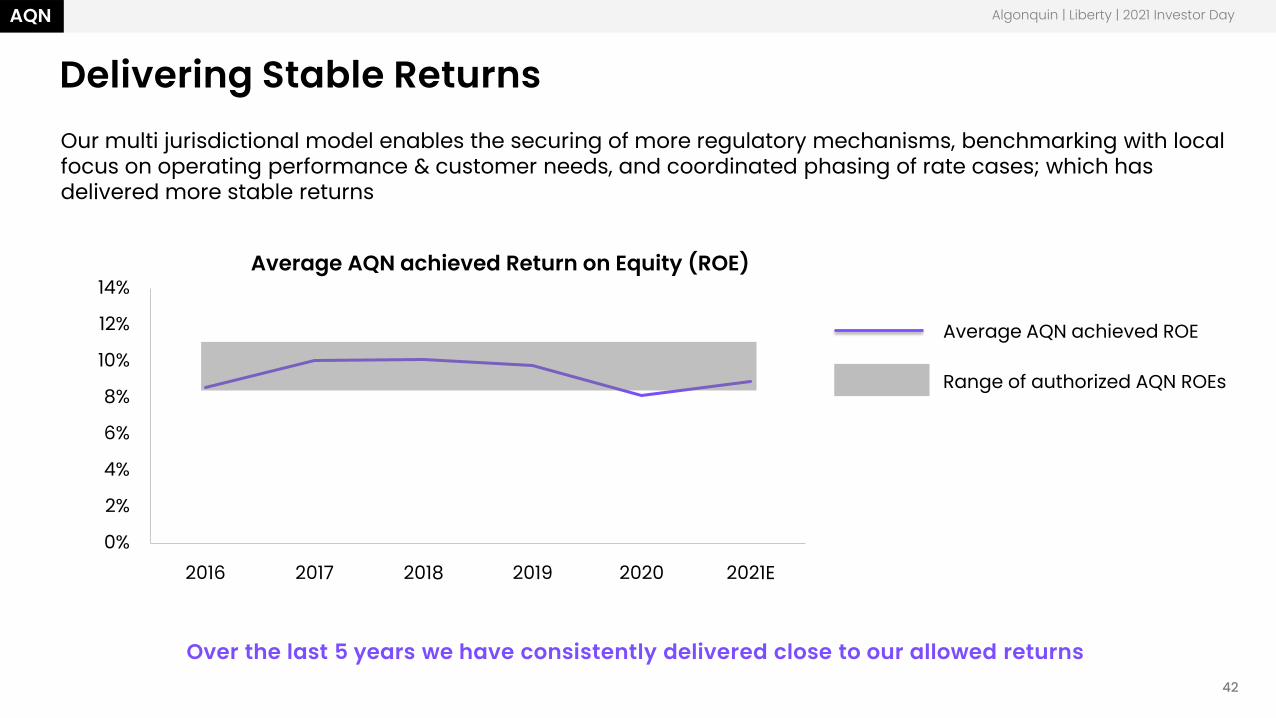
Delivering Stable Returns
Algonquin | Liberty | 2021 Investor Day
Our multi jurisdictional model enables the securing of more regulatory mechanisms, benchmarking with local focus on operating performance & customer needs, and coordinated phasing of rate cases; which has delivered more stable returns
Over the last 5 years we have consistently delivered close to our allowed returns
0%
2%
4%
6%
8%
10%
12%
14%
2016 2017 2018 2019 2020 2021E
Average AQN achieved Return on Equity (ROE)
Average AQN achieved ROE
Range of authorized AQN ROEs
AQN
43
AQN
0%
20%
40%
60%
80%
100%
Pre-AQN Ownership Post AQN Ownership
Ave
Earn
ed R
OE
vs A
llow
ed R
OE
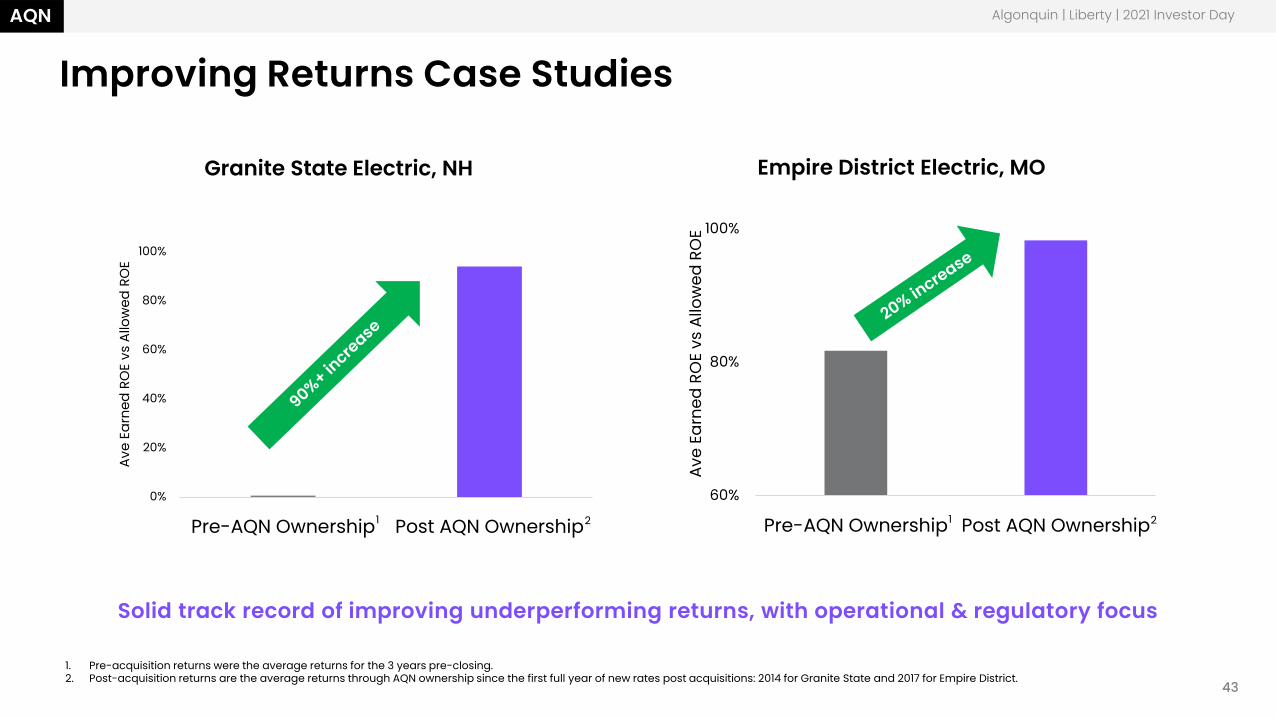
Improving Returns Case Studies
Solid track record of improving underperforming returns, with operational & regulatory focus
60%
80%
100%
Pre-AQN Ownership Post AQN Ownership
Ave
Earn
ed R
OE
vs A
llow
ed R
OE
Granite State Electric, NH Empire District Electric, MO
Algonquin | Liberty | 2021 Investor Day
1 2
1. Pre-acquisition returns were the average returns for the 3 years pre-closing.2. Post-acquisition returns are the average returns through AQN ownership since the first full year of new rates post acquisitions: 2014 for Granite State and 2017 for Empire District.
1 2
AQNAQN
44
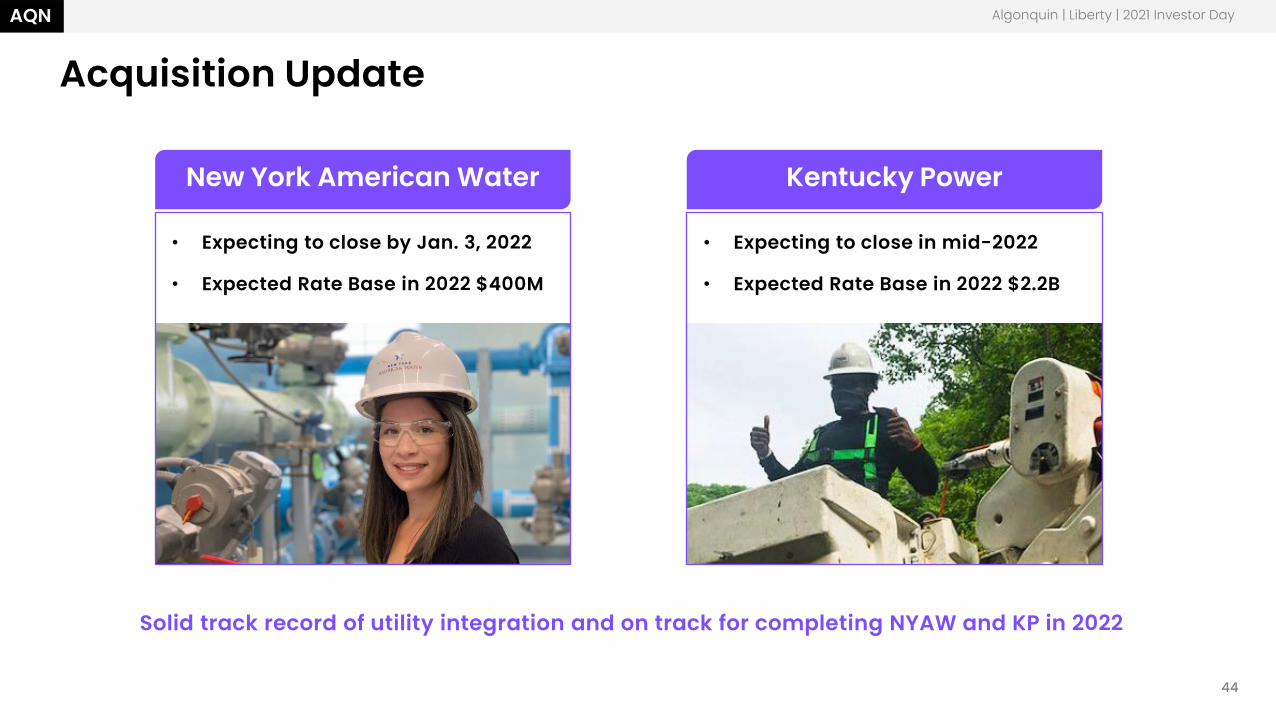
Acquisition Update
Solid track record of utility integration and on track for completing NYAW and KP in 2022
Algonquin | Liberty | 2021 Investor Day
• Expecting to close in mid-2022
• Expected Rate Base in 2022 $2.2B
Kentucky Power
• Expecting to close by Jan. 3, 2022
• Expected Rate Base in 2022 $400M
New York American Water
AQNAQN
45
Operational Excellence Summary
• Our diverse portfolio, helps to reduce risk, provide customer benefit, improve returns, and provide more stable earnings
• Our customer focused 5-year organic capital plan is ~$4.6B
• We are focused on affordability with a 1% CAGR reduction in operating costs over the last 8 years
• We are experienced at integrating utilities, and look forward to bringing on New York American Water and Kentucky Power in 2022
Algonquin | Liberty | 2021 Investor Day
45

Algonquin | Liberty | 2021 Investor Day
Sustainability
AQNAQN
47
George Trisic
“For Algonquin, decarbonization of our
business is a value creation strategy.”
Algonquin | Liberty | 2021 Investor Day
Chief Sustainability Officer
AQNAQN
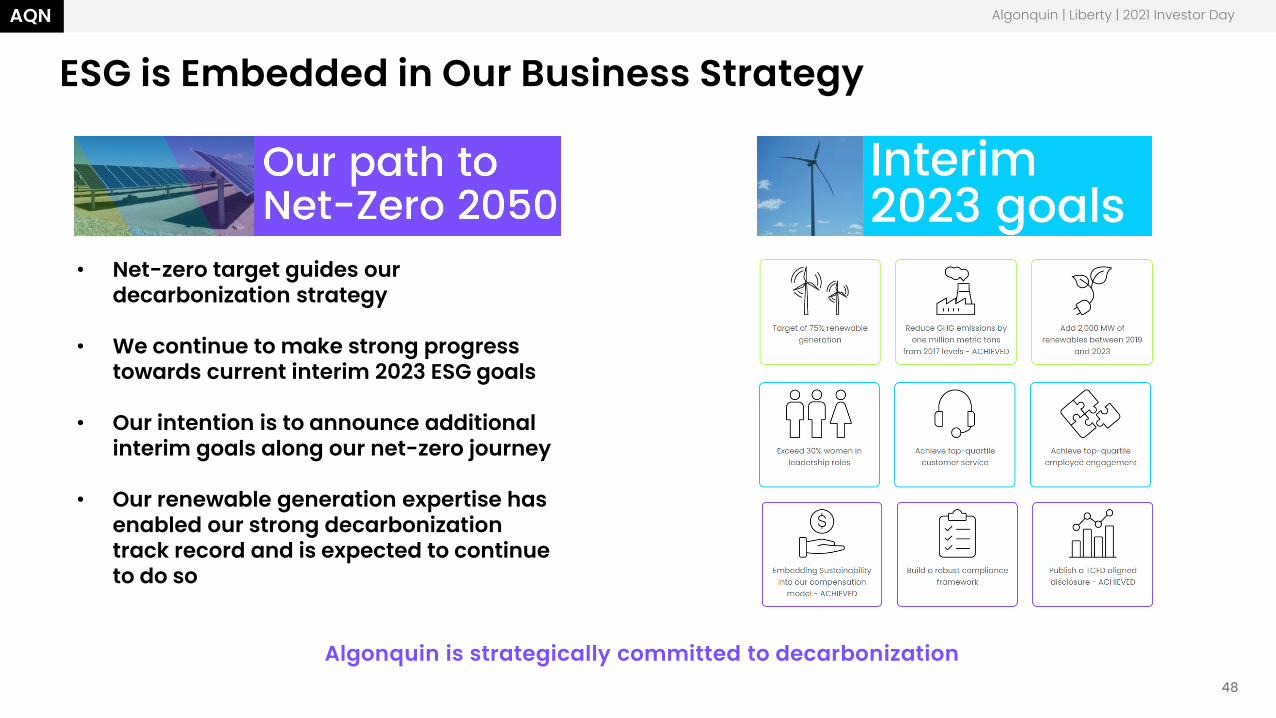
ESG is Embedded in Our Business Strategy
Algonquin | Liberty | 2021 Investor Day
Algonquin is strategically committed to decarbonization
• Net-zero target guides our decarbonization strategy
• We continue to make strong progress towards current interim 2023 ESG goals
• Our intention is to announce additional interim goals along our net-zero journey
• Our renewable generation expertise has enabled our strong decarbonization track record and is expected to continue to do so
48
AQNAQN
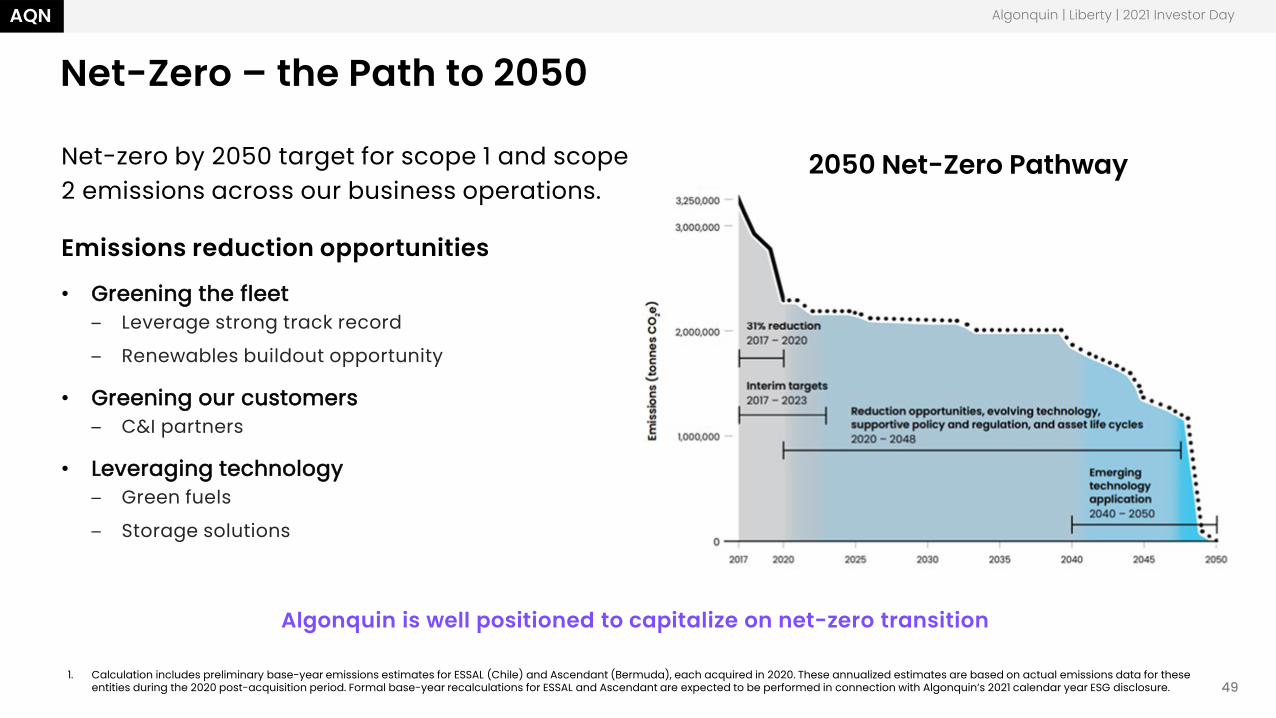
Net-Zero – the Path to 2050
Net-zero by 2050 target for scope 1 and scope 2 emissions across our business operations.
Emissions reduction opportunities
• Greening the fleet– Leverage strong track record
– Renewables buildout opportunity
• Greening our customers– C&I partners
• Leveraging technology– Green fuels
– Storage solutions
Algonquin | Liberty | 2021 Investor Day
Algonquin is well positioned to capitalize on net-zero transition
1. Calculation includes preliminary base-year emissions estimates for ESSAL (Chile) and Ascendant (Bermuda), each acquired in 2020. These annualized estimates are based on actual emissions data for these entities during the 2020 post-acquisition period. Formal base-year recalculations for ESSAL and Ascendant are expected to be performed in connection with Algonquin’s 2021 calendar year ESG disclosure.
1
49
2050 Net-Zero Pathway
AQNAQN
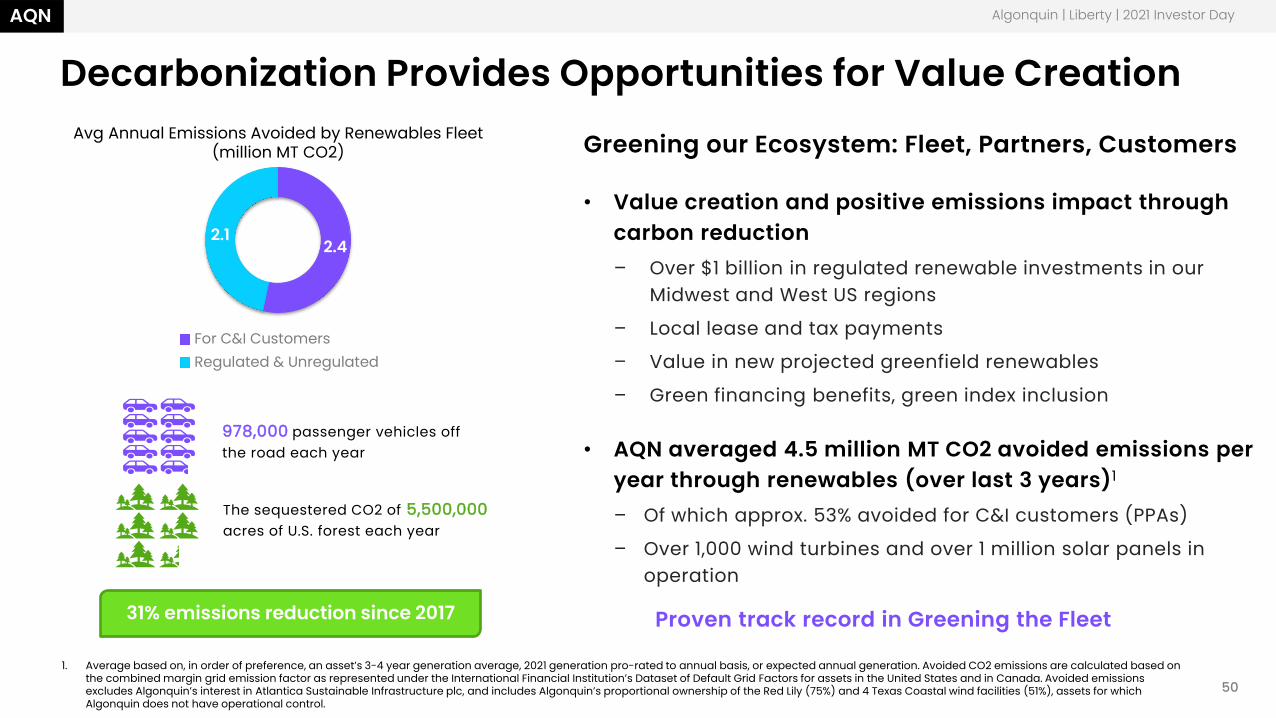
Decarbonization Provides Opportunities for Value Creation
Greening our Ecosystem: Fleet, Partners, Customers
• Value creation and positive emissions impact through carbon reduction– Over $1 billion in regulated renewable investments in our
Midwest and West US regions
– Local lease and tax payments
– Value in new projected greenfield renewables
– Green financing benefits, green index inclusion
• AQN averaged 4.5 million MT CO2 avoided emissions per year through renewables (over last 3 years)1
– Of which approx. 53% avoided for C&I customers (PPAs)
– Over 1,000 wind turbines and over 1 million solar panels in operation
Algonquin | Liberty | 2021 Investor Day
Proven track record in Greening the Fleet
2.42.1
For C&I CustomersRegulated & Unregulated
31% emissions reduction since 2017
978,000 passenger vehicles off the road each year
The sequestered CO2 of 5,500,000acres of U.S. forest each year
1. Average based on, in order of preference, an asset’s 3-4 year generation average, 2021 generation pro-rated to annual basis, or expected annual generation. Avoided CO2 emissions are calculated based on the combined margin grid emission factor as represented under the International Financial Institution’s Dataset of Default Grid Factors for assets in the United States and in Canada. Avoided emissions excludes Algonquin’s interest in Atlantica Sustainable Infrastructure plc, and includes Algonquin’s proportional ownership of the Red Lily (75%) and 4 Texas Coastal wind facilities (51%), assets for which Algonquin does not have operational control.
Avg Annual Emissions Avoided by Renewables Fleet (million MT CO2)
50
AQN
51
AQN
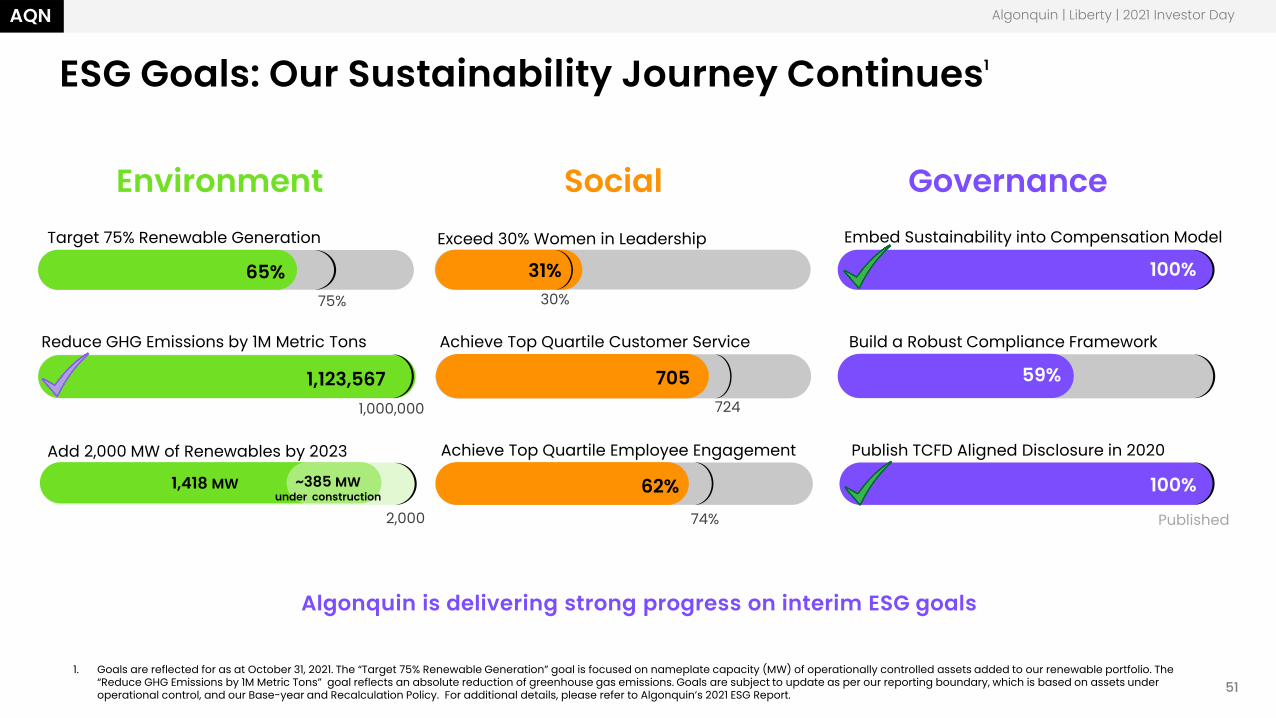
ESG Goals: Our Sustainability Journey Continues1
Algonquin is delivering strong progress on interim ESG goals
Environment
65%
Target 75% Renewable Generation
Reduce GHG Emissions by 1M Metric Tons
1,123,567
Add 2,000 MW of Renewables by 2023
Social Governance
31%Exceed 30% Women in Leadership
Achieve Top Quartile Customer Service
Achieve Top Quartile Employee Engagement
100%
Embed Sustainability into Compensation Model
Build a Robust Compliance Framework
59%
Publish TCFD Aligned Disclosure in 2020
100%
705
62%~385 MWunder construction
1,418 MW
75%
1,000,000
2,000 74%
724
30%
Published
1. Goals are reflected for as at October 31, 2021. The “Target 75% Renewable Generation” goal is focused on nameplate capacity (MW) of operationally controlled assets added to our renewable portfolio. The “Reduce GHG Emissions by 1M Metric Tons” goal reflects an absolute reduction of greenhouse gas emissions. Goals are subject to update as per our reporting boundary, which is based on assets under operational control, and our Base-year and Recalculation Policy. For additional details, please refer to Algonquin’s 2021 ESG Report.
Algonquin | Liberty | 2021 Investor Day
AQN
52
AQN
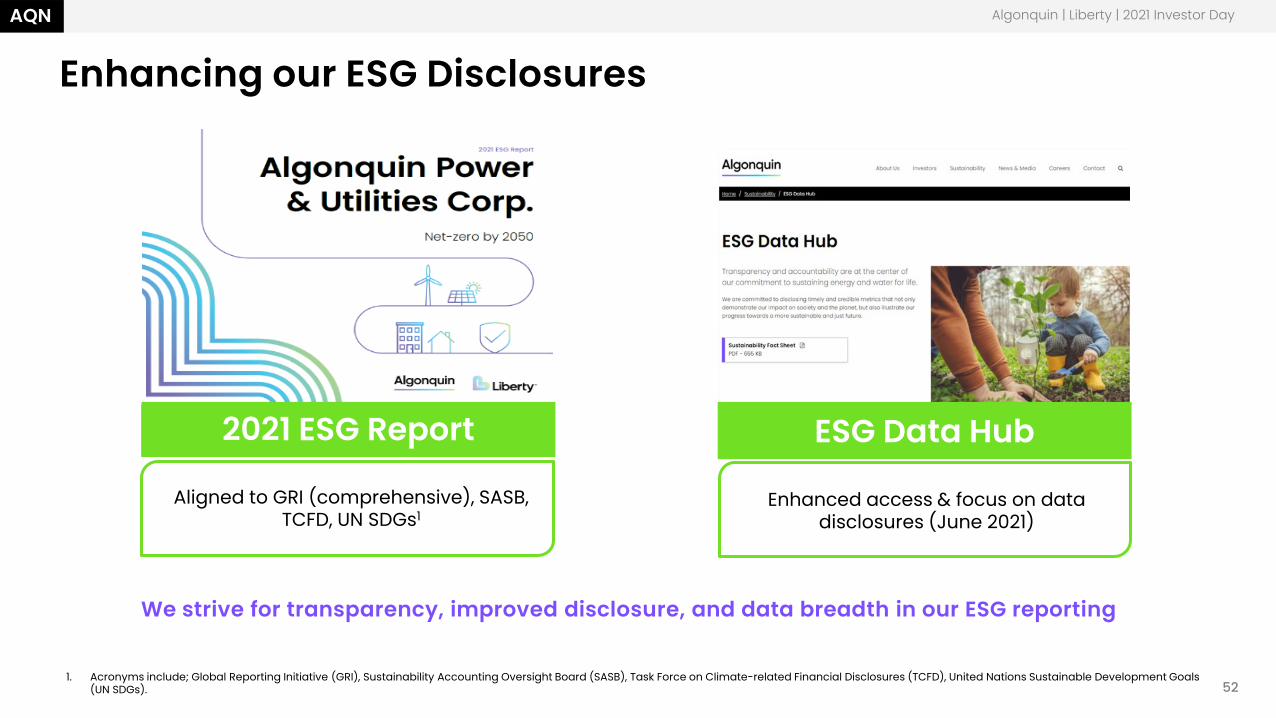
Enhancing our ESG Disclosures
We strive for transparency, improved disclosure, and data breadth in our ESG reporting
Algonquin | Liberty | 2021 Investor Day
1. Acronyms include; Global Reporting Initiative (GRI), Sustainability Accounting Oversight Board (SASB), Task Force on Climate-related Financial Disclosures (TCFD), United Nations Sustainable Development Goals (UN SDGs).
Enhanced access & focus on data disclosures (June 2021)
Aligned to GRI (comprehensive), SASB, TCFD, UN SDGs1
2021 ESG Report ESG Data HubESG Data Hub
AQNAQN
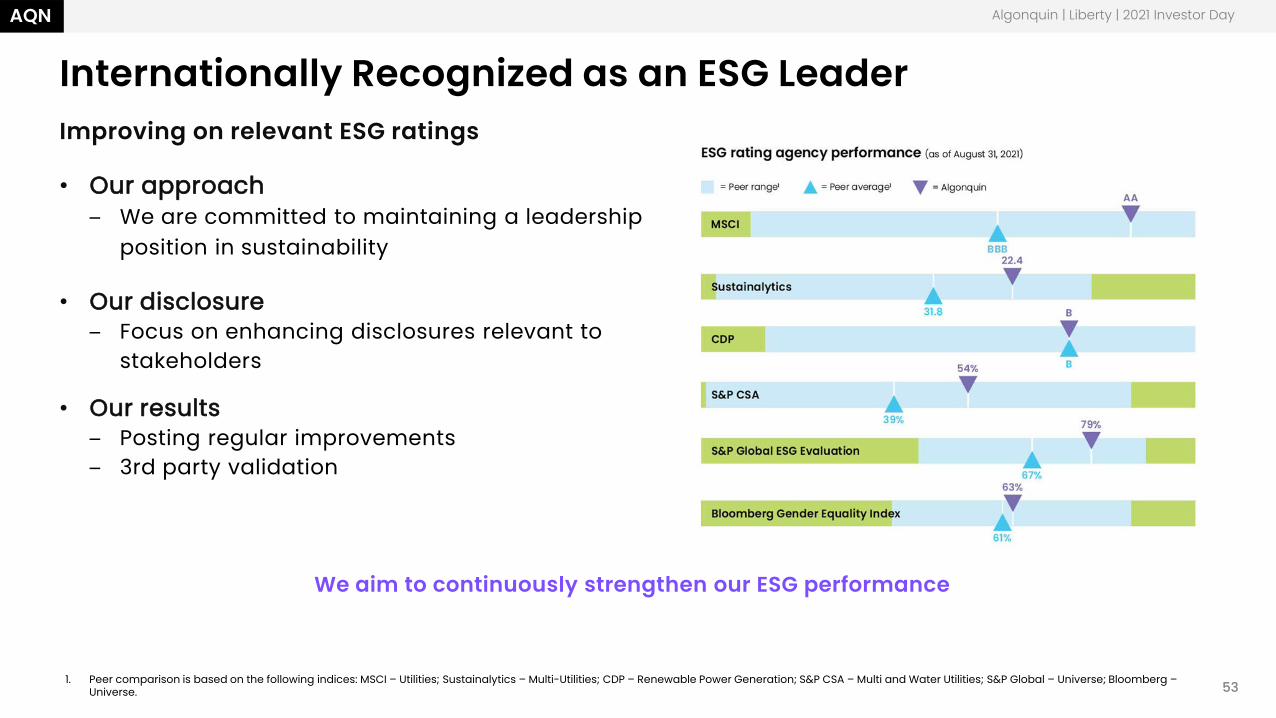
Internationally Recognized as an ESG LeaderImproving on relevant ESG ratings
• Our approach – We are committed to maintaining a leadership
position in sustainability
• Our disclosure– Focus on enhancing disclosures relevant to
stakeholders
• Our results– Posting regular improvements– 3rd party validation
53
Algonquin | Liberty | 2021 Investor Day
We aim to continuously strengthen our ESG performance
1. Peer comparison is based on the following indices: MSCI – Utilities; Sustainalytics – Multi-Utilities; CDP – Renewable Power Generation; S&P CSA – Multi and Water Utilities; S&P Global – Universe; Bloomberg –Universe.
AQNAQN
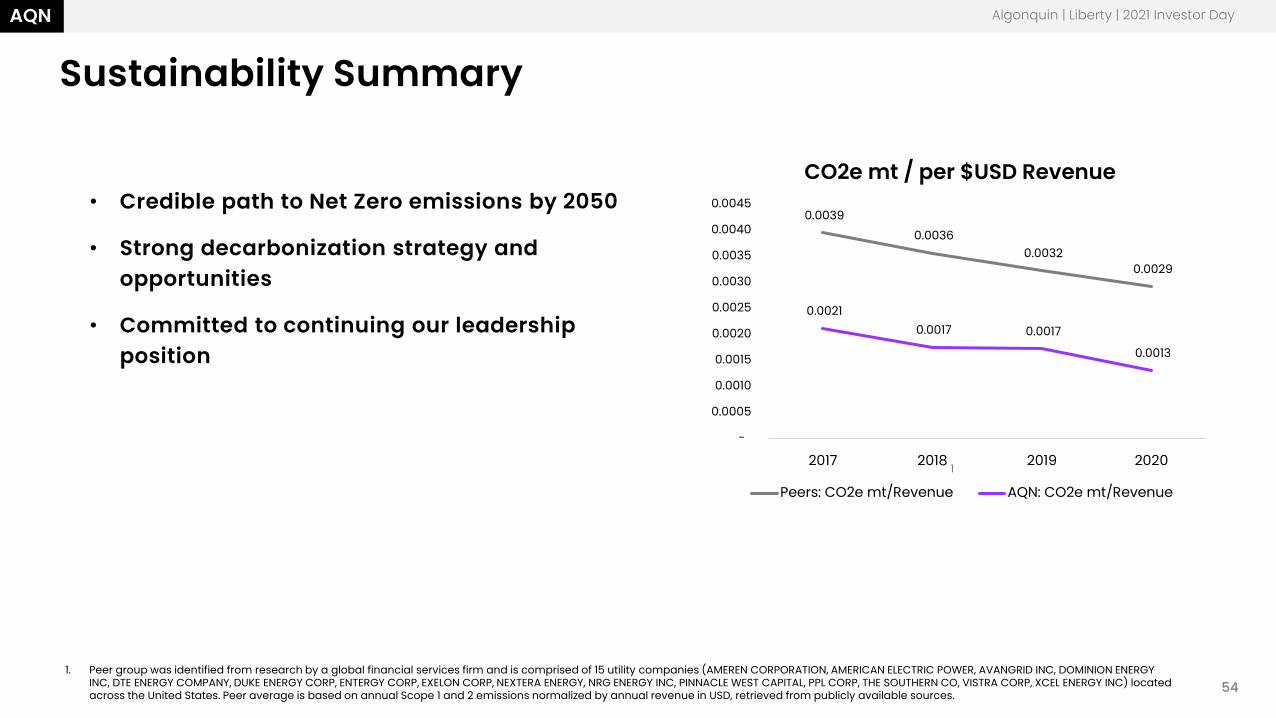
Sustainability Summary
• Credible path to Net Zero emissions by 2050
• Strong decarbonization strategy and opportunities
• Committed to continuing our leadership position
Algonquin | Liberty | 2021 Investor Day
1. Peer group was identified from research by a global financial services firm and is comprised of 15 utility companies (AMEREN CORPORATION, AMERICAN ELECTRIC POWER, AVANGRID INC, DOMINION ENERGY INC, DTE ENERGY COMPANY, DUKE ENERGY CORP, ENTERGY CORP, EXELON CORP, NEXTERA ENERGY, NRG ENERGY INC, PINNACLE WEST CAPITAL, PPL CORP, THE SOUTHERN CO, VISTRA CORP, XCEL ENERGY INC) located across the United States. Peer average is based on annual Scope 1 and 2 emissions normalized by annual revenue in USD, retrieved from publicly available sources.
1
0.0039 0.0036
0.0032 0.0029
0.0021 0.0017 0.0017
0.0013
-
0.0005
0.0010
0.0015
0.0020
0.0025
0.0030
0.0035
0.0040
0.0045
2017 2018 2019 2020
CO2e mt / per $USD Revenue
Peers: CO2e mt/Revenue AQN: CO2e mt/Revenue
54
Algonquin | Liberty | 2021 Investor Day
Financial Overview
AQNAQN
56
Arthur Kacprzak
“Maintaining a strong and resilient balance sheet is a key focus”.
Algonquin | Liberty | 2021 Investor Day
Chief Financial Officer
AQN
57
AQN
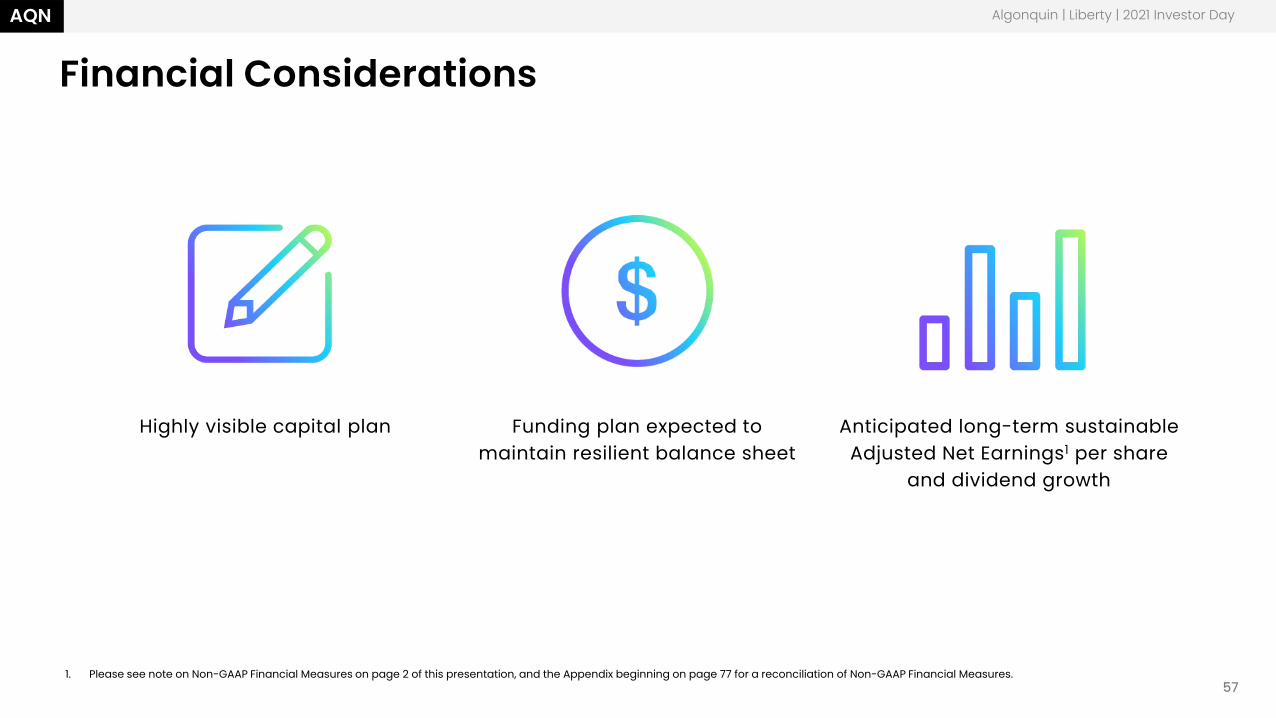
Financial Considerations
Algonquin | Liberty | 2021 Investor Day
1. Please see note on Non-GAAP Financial Measures on page 2 of this presentation, and the Appendix beginning on page 77 for a reconciliation of Non-GAAP Financial Measures.
Highly visible capital plan Funding plan expected to maintain resilient balance sheet
Anticipated long-term sustainable Adjusted Net Earnings1 per share
and dividend growth
AQNAQN
58
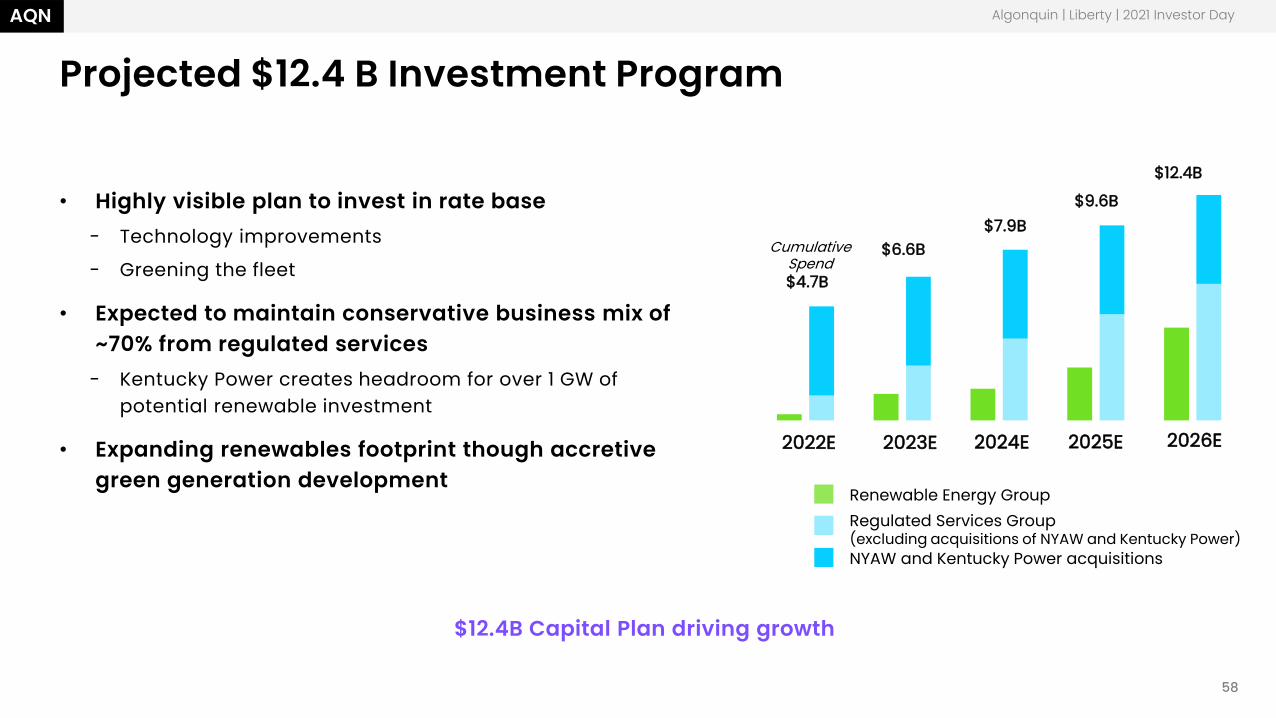
Projected $12.4 B Investment Program
$12.4B Capital Plan driving growth
• Highly visible plan to invest in rate base- Technology improvements
- Greening the fleet
• Expected to maintain conservative business mix of ~70% from regulated services
- Kentucky Power creates headroom for over 1 GW of potential renewable investment
• Expanding renewables footprint though accretive green generation development
Renewable Energy GroupRegulated Services Group (excluding acquisitions of NYAW and Kentucky Power)
2022E 2023E 2024E 2025E 2026E
NYAW and Kentucky Power acquisitions
$6.6B$7.9B
$9.6B
$12.4B
$4.7B
Cumulative Spend
Algonquin | Liberty | 2021 Investor Day
AQN
59
AQN
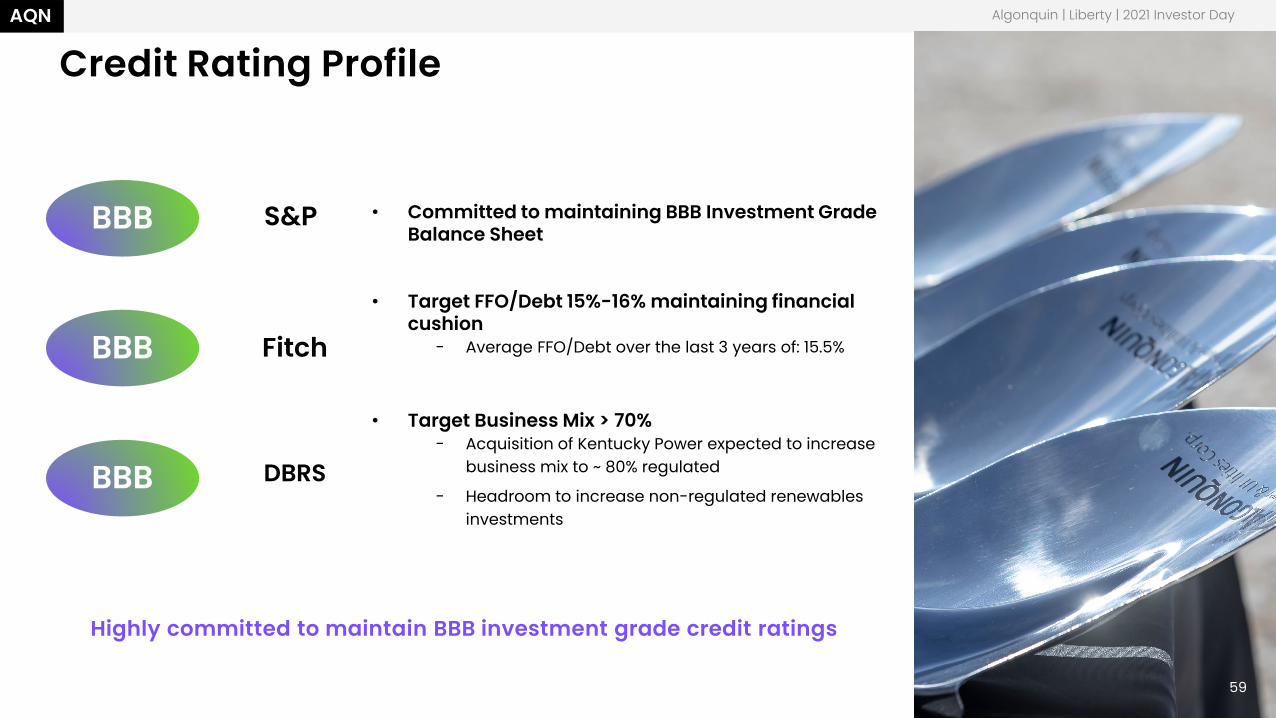
Credit Rating Profile
Highly committed to maintain BBB investment grade credit ratings
Algonquin | Liberty | 2021 Investor Day
BBB S&P
Fitch
DBRS
• Committed to maintaining BBB Investment Grade Balance Sheet
• Target FFO/Debt 15%-16% maintaining financial cushion
- Average FFO/Debt over the last 3 years of: 15.5%
• Target Business Mix > 70%- Acquisition of Kentucky Power expected to increase
business mix to ~ 80% regulated
- Headroom to increase non-regulated renewables investments
BBB
BBB
59
AQN
60
AQN
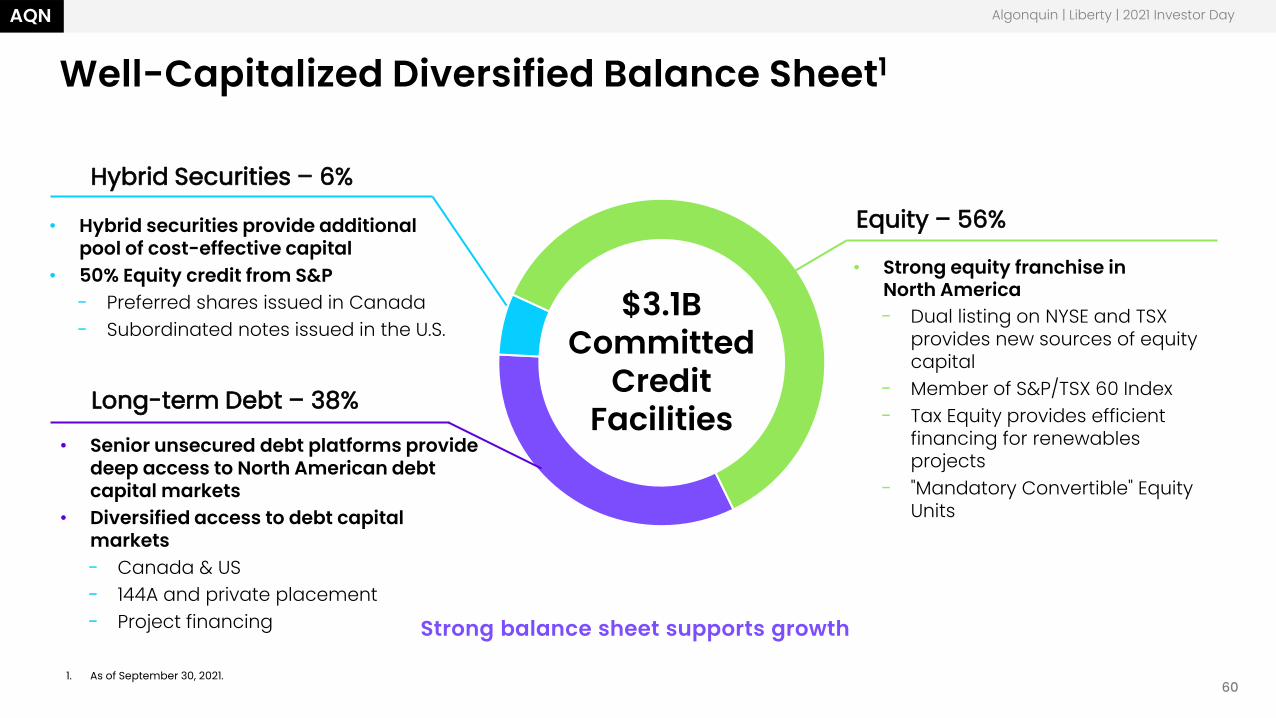
Well-Capitalized Diversified Balance Sheet1
Strong balance sheet supports growth
Algonquin | Liberty | 2021 Investor Day
• Strong equity franchise in North America− Dual listing on NYSE and TSX
provides new sources of equity capital
− Member of S&P/TSX 60 Index− Tax Equity provides efficient
financing for renewables projects
− "Mandatory Convertible" Equity Units
• Hybrid securities provide additional pool of cost-effective capital
• 50% Equity credit from S&P− Preferred shares issued in Canada− Subordinated notes issued in the U.S.
• Senior unsecured debt platforms provide deep access to North American debt capital markets
• Diversified access to debt capital markets− Canada & US− 144A and private placement− Project financing
Equity – 56%
Long-term Debt – 38%
Hybrid Securities – 6%
$3.1B Committed
Credit Facilities
$3.1 B of Committed Credit Facilities
1. As of September 30, 2021.

AQN
61
AQN
Projected 5-Year Funding Plan
Capital needs satisfied through a diverse executable funding plan
Algonquin | Liberty | 2021 Investor Day
Expected Sources Expected Uses
Asset Recycling,
Equity Units,
Common Equity
2022 through 2026
Free Cash Flow
$6.6 B
Debt
Hybrid Debt
Hybrid Debt
$1.5 B
Tax Equity
$12.4 B
$2.0B
$3.0B
$3.1B
$2.1B
ATM/DRIP
Retained Cash
$1.2B
$1.0B
~70% ~30%
Expected additional de-leveraging over the 5-year period
Renewable Energy Group
Regulated Services
Group
NYAW and Kentucky
Power acquisitions
AQN
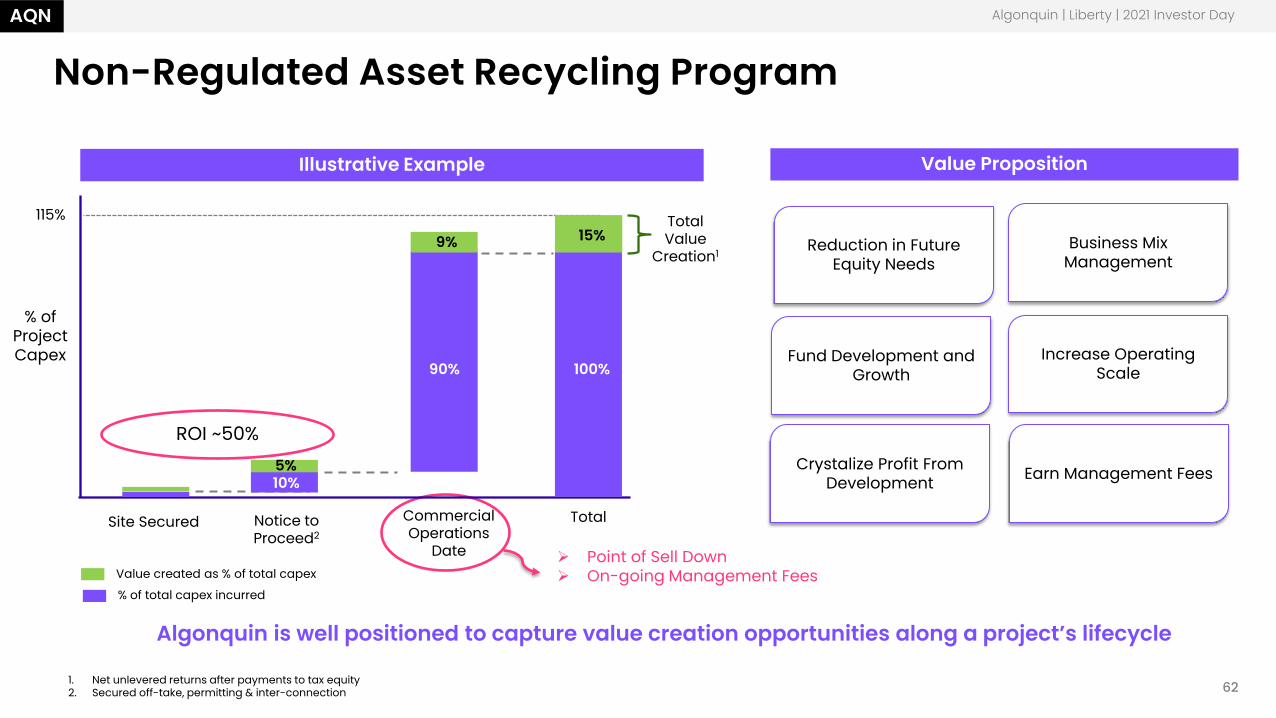
Non-Regulated Asset Recycling Program
Algonquin is well positioned to capture value creation opportunities along a project’s lifecycle
Value Proposition
Reduction in Future Equity Needs
Fund Development and Growth
Business Mix Management
Crystalize Profit From Development
Increase Operating Scale
Illustrative Example
Algonquin | Liberty | 2021 Investor Day
Earn Management Fees
62
Total Value
Creation1
% of Project Capex
115%
Site Secured CommercialOperations
Date
9%
Notice to Proceed2
5%10%
90%
9%
100%
15%
ROI ~50%
Total
% of total capex incurred
Value created as % of total capex
1. Net unlevered returns after payments to tax equity2. Secured off-take, permitting & inter-connection
Point of Sell Down On-going Management Fees
AQN
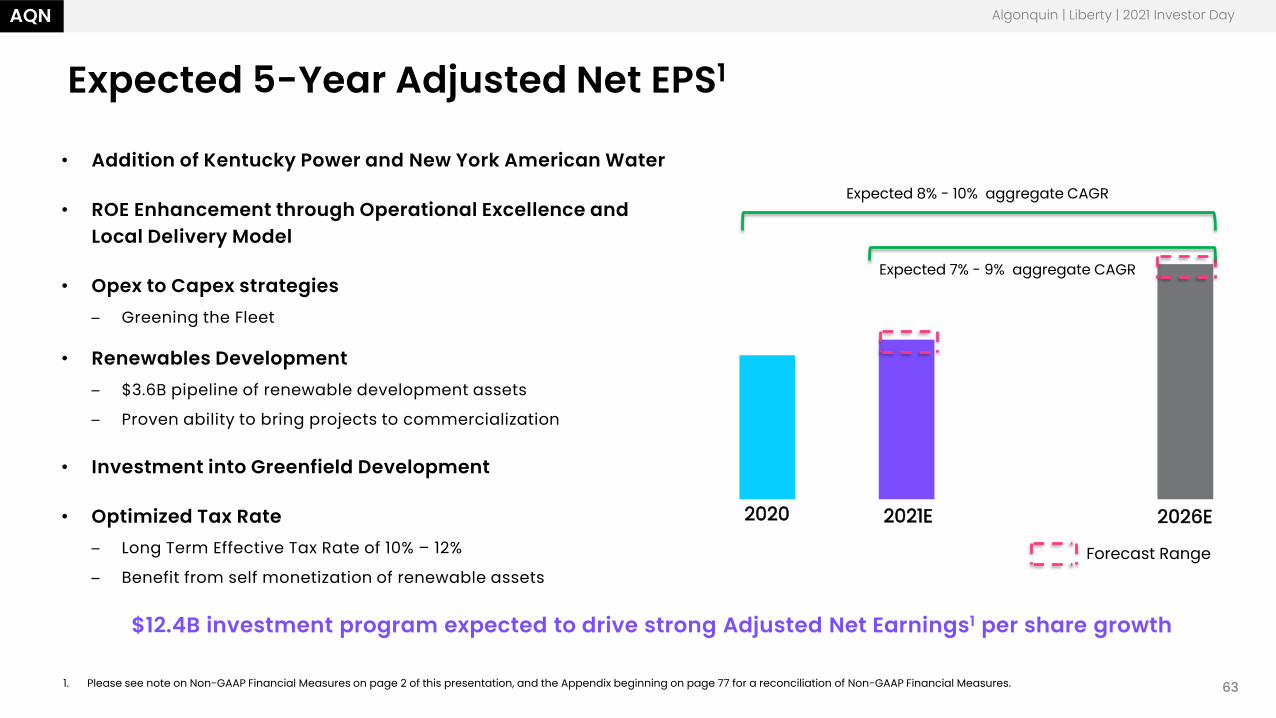
Expected 5-Year Adjusted Net EPS1
• Addition of Kentucky Power and New York American Water
• ROE Enhancement through Operational Excellence and Local Delivery Model
• Opex to Capex strategies– Greening the Fleet
• Renewables Development– $3.6B pipeline of renewable development assets
– Proven ability to bring projects to commercialization
• Investment into Greenfield Development
• Optimized Tax Rate– Long Term Effective Tax Rate of 10% – 12%
– Benefit from self monetization of renewable assets
1. Please see note on Non-GAAP Financial Measures on page 2 of this presentation, and the Appendix beginning on page 77 for a reconciliation of Non-GAAP Financial Measures.
$12.4B investment program expected to drive strong Adjusted Net Earnings1 per share growth
Forecast Range
Expected 7% - 9% aggregate CAGR
2020 2021E 2026E
Algonquin | Liberty | 2021 Investor Day
Expected 8% - 10% aggregate CAGR
63
AQN
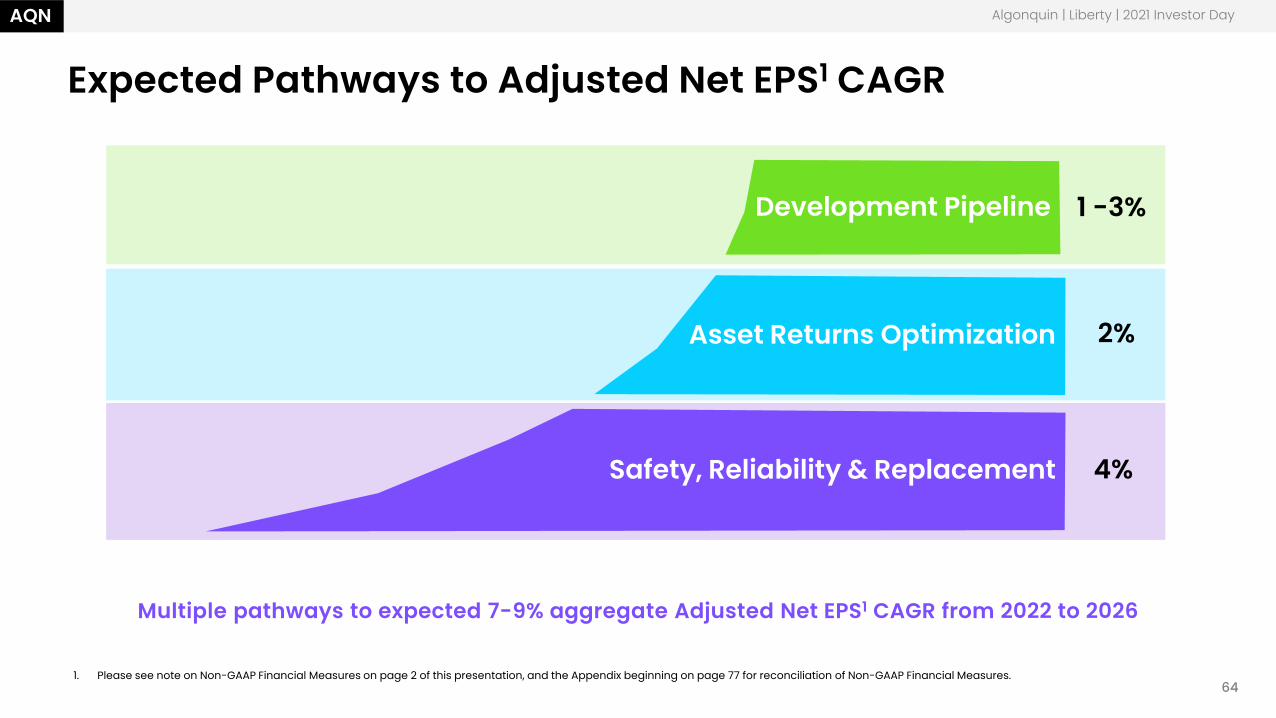
1 -3%
4%
2%
Safety, Reliability & Replacement
Asset Returns Optimization
Development Pipeline
Expected Pathways to Adjusted Net EPS1 CAGR
Multiple pathways to expected 7-9% aggregate Adjusted Net EPS1 CAGR from 2022 to 2026
Algonquin | Liberty | 2021 Investor Day
641. Please see note on Non-GAAP Financial Measures on page 2 of this presentation, and the Appendix beginning on page 77 for reconciliation of Non-GAAP Financial Measures.
AQN
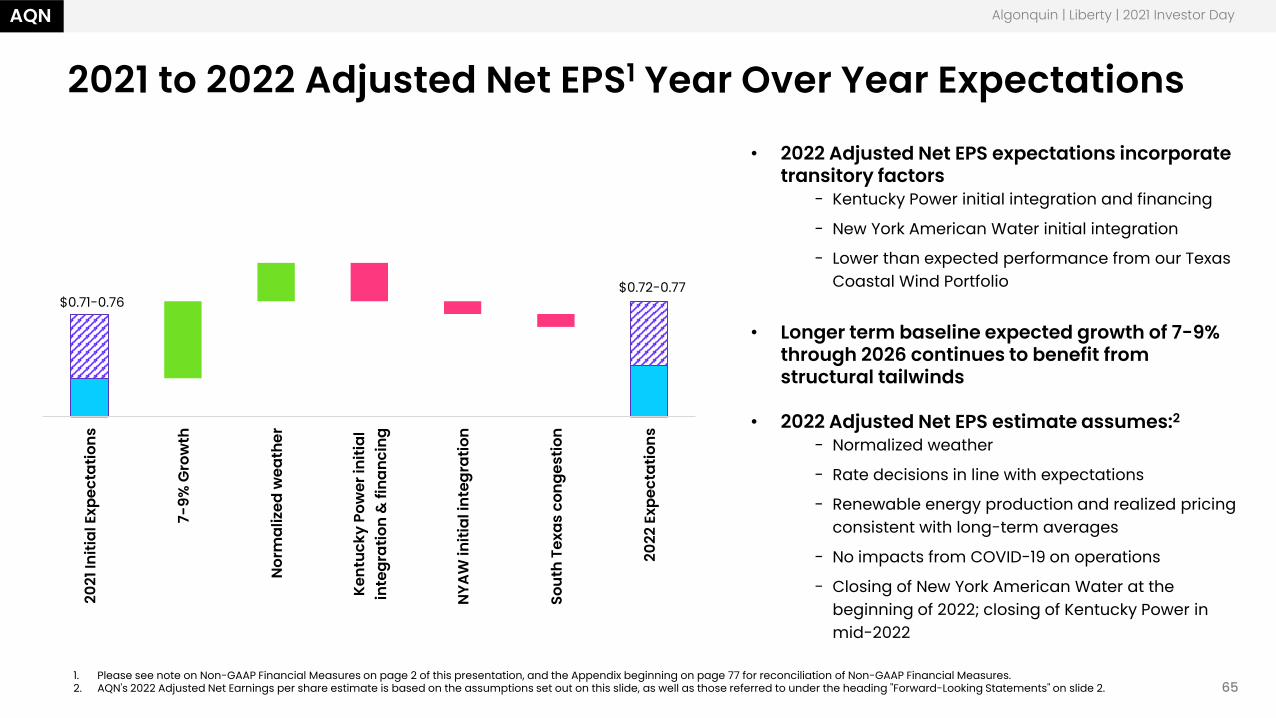
2021 to 2022 Adjusted Net EPS1 Year Over Year Expectations
• 2022 Adjusted Net EPS expectations incorporate transitory factors
- Kentucky Power initial integration and financing
- New York American Water initial integration
- Lower than expected performance from our Texas Coastal Wind Portfolio
• Longer term baseline expected growth of 7-9% through 2026 continues to benefit from structural tailwinds
• 2022 Adjusted Net EPS estimate assumes:2
- Normalized weather
- Rate decisions in line with expectations
- Renewable energy production and realized pricing consistent with long-term averages
- No impacts from COVID-19 on operations
- Closing of New York American Water at the beginning of 2022; closing of Kentucky Power in mid-2022
1. Please see note on Non-GAAP Financial Measures on page 2 of this presentation, and the Appendix beginning on page 77 for reconciliation of Non-GAAP Financial Measures.2. AQN's 2022 Adjusted Net Earnings per share estimate is based on the assumptions set out on this slide, as well as those referred to under the heading "Forward-Looking Statements" on slide 2.
2021
Initi
al E
xpec
tatio
ns
7-9%
Gro
wth
Nor
mal
ized
wea
ther
Kent
ucky
Pow
er in
itial
inte
grat
ion
& fi
nanc
ing
NYA
W in
itial
inte
grat
ion
Sout
h Te
xas
cong
estio
n
2022
Exp
ecta
tions
$0.71-0.76$0.72-0.77
Algonquin | Liberty | 2021 Investor Day
65
AQN
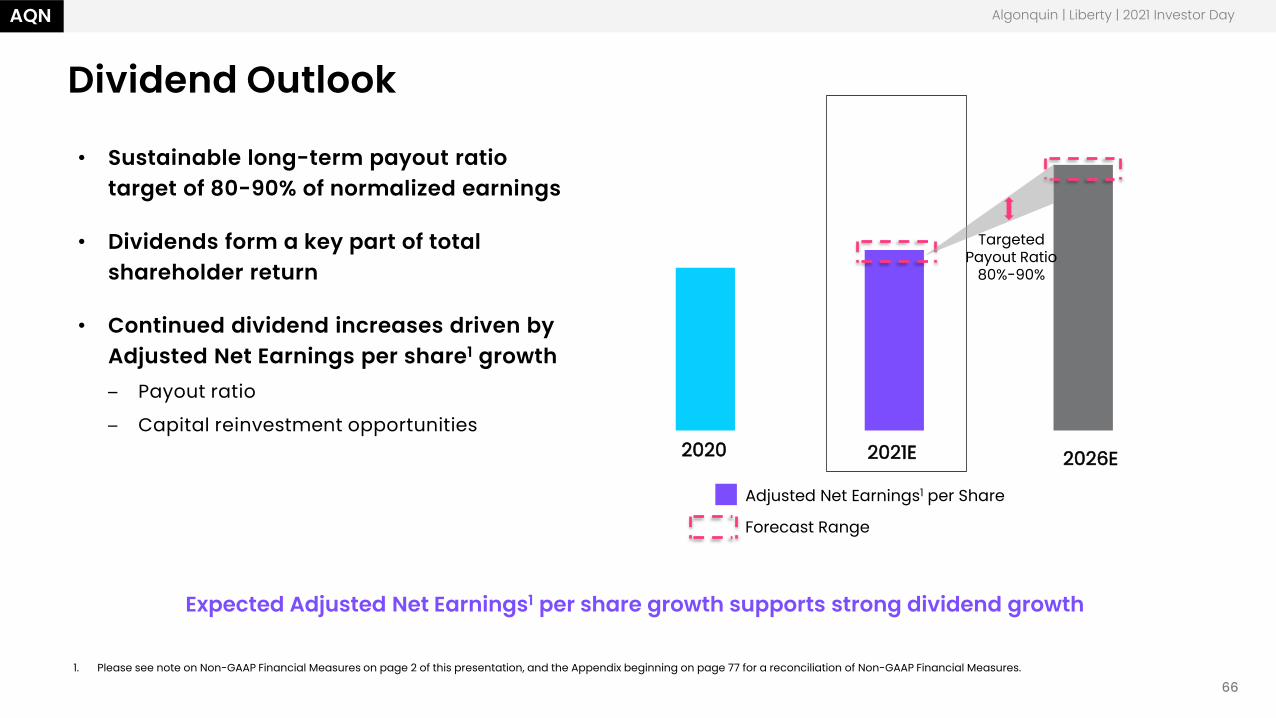
Dividend Outlook
• Sustainable long-term payout ratio target of 80-90% of normalized earnings
• Dividends form a key part of total shareholder return
• Continued dividend increases driven by Adjusted Net Earnings per share1 growth– Payout ratio
– Capital reinvestment opportunities
Expected Adjusted Net Earnings1 per share growth supports strong dividend growth
1. Please see note on Non-GAAP Financial Measures on page 2 of this presentation, and the Appendix beginning on page 77 for a reconciliation of Non-GAAP Financial Measures.
Targeted Payout Ratio
80%-90%
Adjusted Net Earnings1 per Share
Forecast Range
2020 2021E 2026E
Algonquin | Liberty | 2021 Investor Day
66
AQN
Financial Summary• Highly visible 5-year capital plan from 2022 through 2026
• Diverse sources of capital positioned to support future growth
• Commitment to investment grade balance sheet
• Estimated 2022 Adjusted Net EPS of $0.72 to $0.77
• Estimated Adjusted Net EPS1 aggregate CAGR of 7% to 9% from 2022-2026
• Dividend - Sustainable long-term payout ratio target of 80-90% of normalized earnings
Algonquin | Liberty | 2021 Investor Day
1. Please see note on Non-GAAP Financial Measures on page 2 of this presentation, and the Appendix beginning on page77 for a reconciliation of Non-GAAP Financial Measures. 67
AQN
68
AQN
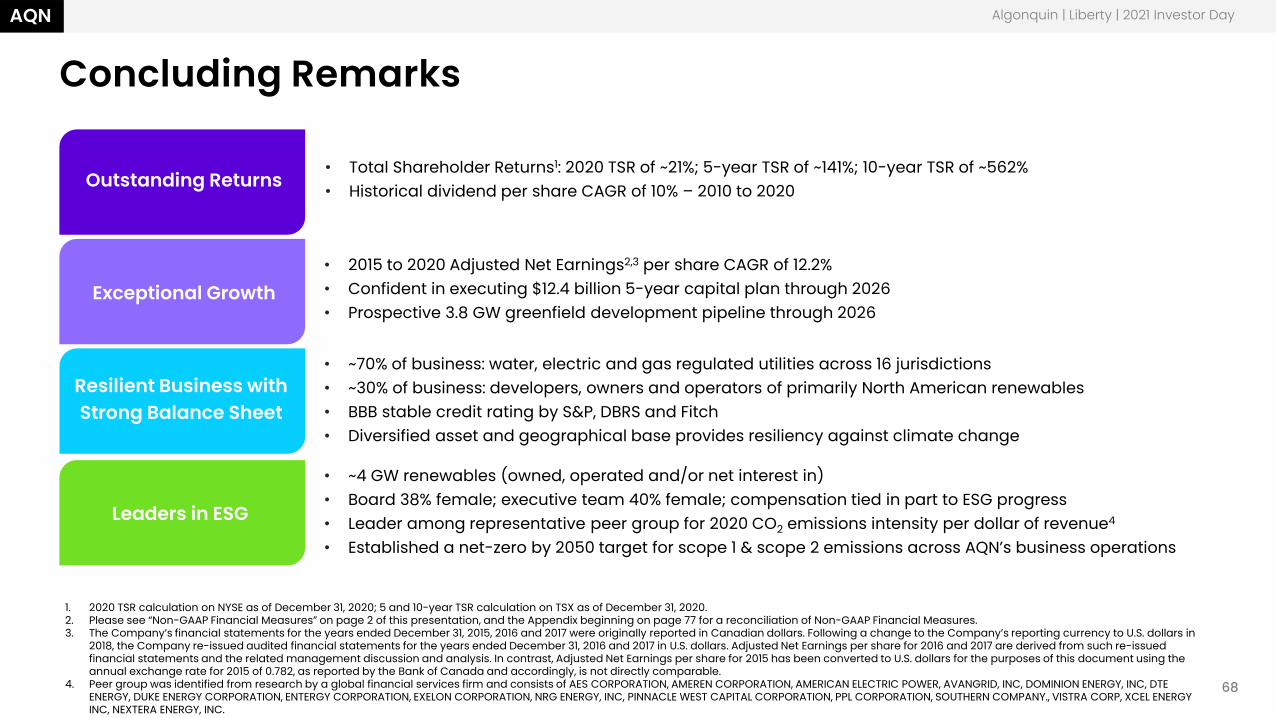
Concluding Remarks
Algonquin | Liberty | 2021 Investor Day
Outstanding Returns
Exceptional Growth
Resilient Business with Strong Balance Sheet
Leaders in ESG
• Total Shareholder Returns1: 2020 TSR of ~21%; 5-year TSR of ~141%; 10-year TSR of ~562%• Historical dividend per share CAGR of 10% – 2010 to 2020
• 2015 to 2020 Adjusted Net Earnings2,3 per share CAGR of 12.2%• Confident in executing $12.4 billion 5-year capital plan through 2026• Prospective 3.8 GW greenfield development pipeline through 2026
• ~70% of business: water, electric and gas regulated utilities across 16 jurisdictions • ~30% of business: developers, owners and operators of primarily North American renewables• BBB stable credit rating by S&P, DBRS and Fitch• Diversified asset and geographical base provides resiliency against climate change
• ~4 GW renewables (owned, operated and/or net interest in)• Board 38% female; executive team 40% female; compensation tied in part to ESG progress• Leader among representative peer group for 2020 CO2 emissions intensity per dollar of revenue4
• Established a net-zero by 2050 target for scope 1 & scope 2 emissions across AQN’s business operations
1. 2020 TSR calculation on NYSE as of December 31, 2020; 5 and 10-year TSR calculation on TSX as of December 31, 2020.2. Please see “Non-GAAP Financial Measures” on page 2 of this presentation, and the Appendix beginning on page 77 for a reconciliation of Non-GAAP Financial Measures.3. The Company’s financial statements for the years ended December 31, 2015, 2016 and 2017 were originally reported in Canadian dollars. Following a change to the Company’s reporting currency to U.S. dollars in
2018, the Company re-issued audited financial statements for the years ended December 31, 2016 and 2017 in U.S. dollars. Adjusted Net Earnings per share for 2016 and 2017 are derived from such re-issued financial statements and the related management discussion and analysis. In contrast, Adjusted Net Earnings per share for 2015 has been converted to U.S. dollars for the purposes of this document using the annual exchange rate for 2015 of 0.782, as reported by the Bank of Canada and accordingly, is not directly comparable.
4. Peer group was identified from research by a global financial services firm and consists of AES CORPORATION, AMEREN CORPORATION, AMERICAN ELECTRIC POWER, AVANGRID, INC, DOMINION ENERGY, INC, DTE ENERGY, DUKE ENERGY CORPORATION, ENTERGY CORPORATION, EXELON CORPORATION, NRG ENERGY, INC, PINNACLE WEST CAPITAL CORPORATION, PPL CORPORATION, SOUTHERN COMPANY., VISTRA CORP, XCEL ENERGY INC, NEXTERA ENERGY, INC.

Questions?
Algonquin | Liberty | 2021 Investor Day
You may now ask a question by dialing one of the numbers below.
If you do not wish to ask a question, please remain connected to the broadcast.
---------------------------------------
Before dialing the conference line, please close your browser to avoid audio feedback.
Toll Free Dial-In Number: (833) 670-0721Toll Dial-In Number: (825) 312-2060Please join the conference call using the following passcode: 9180565
69
AQN
70
AQN
Forward-Looking StatementsCertain written statements included herein and/or oral statements made in connection with the presentation contained herein constitute “forward-looking information” within the meaning of applicable securities laws ineach of the provinces of Canada and the respective policies, regulations and rules under such laws and “forward-looking statements” within the meaning of the U.S. Private Securities Litigation Reform Act of 1995 (collectively,“forward-looking statements”). The words “will”, “expects”, “intends”, “should”, “would”, “anticipates”, “projects”, “forecasts”, “plans”, “estimates” (occasionally denoted herein by the letter “E”), “may”, “outlook”, “aims”,“pending”, “prospective”, “target”, “believes”, “could”, “potential” and similar expressions are often intended to identify forward-looking statements, although not all forward-looking statements contain these identifying words.Specific forward-looking statements contained in or made in connection with this presentation include, but are not limited to statements regarding: the expected performance of Algonquin Power & Utilities Corp. (“AQN”,“Algonquin” or the “Company”); the Company’s expected future growth, earnings, cash flows, funds from operations, revenue, debt and dividends; expected future rate base; capital expenditure and investment plans;development projects (including greenfield opportunities) and the anticipated generation capacity, completion, timing, cost, location, size, success rate, customer benefits and qualification for tax credits of such projects;the Company’s pending acquisitions of New York American Water Company, Inc. (“New York American Water” or “NYAW”) and Kentucky Power Company (“Kentucky Power”) and AEP Kentucky Transmission Company, Inc.,including the expected timing for closing and the financing thereof; the impact and expected benefits of such acquisitions to the Company, including the impact on the Company’s business, operations, customer count, ratebase, business mix, return on equity and financial condition; the Company’s “greening the fleet” plans, including with respect to Kentucky Power and the Mitchell coal plant; expectations regarding the benefits, outcomes andimpacts of transitioning to renewable energy; expectations regarding the timing for the transfer or retirement (for rate-making purposes in Kentucky) of the Mitchell coal plant; the expected non-renewal of the offtakecontract for the Rockport coal plant; expectations regarding the use of proceeds of the Company’s November 2021 C$800 million bought deal common share offering; expectations regarding the levelized cost of energy fromrenewable sources; the Company’s financing plan and expected sources and uses of capital, including the impact thereof on the Company’s balance sheet; projections about liquidity, capital sufficiency and credit ratings;targets and expectations regarding credit metrics; the Company’s corporate development and growth initiatives and the results thereof, including future acquisitions and the expected business mix between the Company’soperating segments; expectations regarding potential future asset dispositions and other capital recycling initiatives, including the anticipated benefits and structure thereof; the Company’s sustainability, decarbonization,environmental, social and governance goals, targets and initiatives (including the Company’s ability to achieve these goals, targets and initiatives and the Company’s expectations with respect thereto); the Company’sexpected growth strategies; anticipated utility rates, regulatory filings, outcomes and initiatives, available regulatory mechanisms and recoverability of investments; expected tax rates; industry data andprojections; expectations regarding safety, reliability and system operating performance; expected future operating costs; expectations regarding legislative changes and initiatives; expectations regarding the Company’sinvestment in emerging technologies, including battery storage, microgrids, community solar and renewable natural gas; grid updates in connection with the Texas Coastal Wind Facilities; and customer expectations, ratesand savings. These statements are based on factors or assumptions that were applied in drawing a conclusion or making a forecast or projection, including assumptions based on historical trends, current conditions andexpected future developments. Since forward-looking statements relate to future events and conditions, by their nature they rely on assumptions and involve inherent risks and uncertainties. AQN cautions that although it isbelieved that the assumptions are reasonable in the circumstances, actual results may differ materially from the expectations set out in the forward-looking statements. Material risk factors and assumptions include thoseset out in this presentation or contained in AQN’s Management Discussion and Analysis for the three and nine months ended September 30, 2021 (the “Interim MD&A”), AQN’s Management Discussion and Analysis for the threeand twelve months ended December 31, 2020 (the “Annual MD&A”), and AQN’s Annual Information Form for the year ended December 31, 2020, each filed with securities regulatory authorities in Canada and the United States.Given these risks, undue reliance should not be placed on these forward-looking statements, which apply only as of their dates. Other than as specifically required by law, AQN undertakes no obligation to update anyforward-looking statements to reflect new information, subsequent or otherwise.
CurrencyIn this presentation, unless otherwise specified or the context requires otherwise, all dollar amounts are expressed in U.S. dollars.
Non-GAAP Financial MeasuresThe terms “Adjusted Net Earnings”, “Adjusted Net Earnings per share” (or “Adjusted Net EPS”), “earnings before interest, taxes, depreciation and amortization” (“EBITDA”), “Adjusted EBITDA”, “Adjusted Funds from Operations”,"Net Energy Sales", "Net Utility Sales" and “Divisional Operating Profit” (together the “Financial Measures”) may be used in this presentation and discussion. The Financial Measures are not recognized measures under U.S. GAAP.There is no standardized measure of the Financial Measures; consequently, AQN’s method of calculating the Financial Measures may differ from methods used by other companies and therefore they may not be comparableto similar measures presented by other companies. An explanation, calculation and analysis of the Financial Measures, including a reconciliation to the most directly comparable U.S. GAAP measure, where applicable, can befound in the Interim MD&A and the Annual MD&A. A reconciliation of certain of the Financial Measures used in the presentation to the most directly comparable U.S. GAAP measure can also be found in the Appendix beginningon page 77 of this presentation.
Market and Industry DataCertain of the information contained in this presentation concerning economic trends and market, peer and industry data and projections is based upon or derived from information by third party or industrysources. The Company provides no assurance with respect to the accuracy of such information nor has the Company independently verified such information or the assumptions upon which projections of future trends arebased. As a result, readers should be aware that any such information and data set forth in this presentation and estimates and beliefs based on such information and data, may not be reliable.
Algonquin | Liberty | 2021 Investor Day
Algonquin | Liberty | 2021 Investor Day
Appendix
AQN
72
AQN
Speaker Biographies
Arun Banskota | PRESIDENT AND CHIEF EXECUTIVE OFFICER
Arun Banskota joined Algonquin as President in February 2020 and took on the President & CEO role in July 2020. Mr. Banskota has over 30 years ofprogressively senior roles with a unique combination of experience in energy development, construction, financing, and operations; P&L management ofmultiple large business units; and 3 start-ups in the clean-tech space. As Managing Director of Global Power, with El Paso Corporation, he had P&Lresponsibility for a 6,500 MW global portfolio of 32 power plants, project development and approximately 10,000 employees. He was on the leadership teamfor a large energy company and has successfully managed project development, financing, and operations for solar, wind, and natural gas projects. Mr.Banskota has led 3 start-ups in the clean-tech space, including utility-scale solar, carbon capture with enhanced oil recovery, and electric vehicleinfrastructure. As President & CEO of EVgo, he was responsible for taking commercial this high growth start-up to build scale and presence in the electricalvehicle infrastructure sector. In his most recent role as the leader for Data Center Global Services and Energy Team at Amazon.com, he was responsible forthe planning, engineering, and delivery of global datacenter capacity for Amazon Web Services, a high-growth global market-leader of cloud services.
Mr. Banskota holds a Masters of Arts from the University of Denver, and a Master of Business Administration from the University of Chicago.
Arthur Kacprzak | CHIEF FINANCIAL OFFICER
Arthur Kacprzak is Chief Financial Officer of Algonquin. Mr. Kacprzak joined Algonquin in 2012 as Vice-President Treasurer, leading the company’s treasuryand corporate finance functions. In this capacity he was responsible for maintaining the company’s investment grade balance sheet and funding itsgrowth initiatives. He was appointed to the role of CFO in September 2020. Prior to joining Algonquin Mr. Kacprzak held various senior level financial positionsand has accumulated over 20 years of experience in corporate finance, treasury, accounting, taxation and management consulting.
Mr. Kacprzak holds a Bachelors of Commerce degree from the University of Toronto and a Global Professional Master of Laws degree from the University ofToronto Faculty of Law. He is a Chartered Accountant as well as a CFA Charterholder.
Algonquin | Liberty | 2021 Investor Day
AQN
73
AQN
Speaker BiographiesJeff Norman | CHIEF DEVELOPMENT OFFICER
Mr. Norman is the Chief Development Officer of Algonquin. He was appointed to the Algonquin executive team in 2015. Mr. Norman cofounded the AlgonquinPower Venture Fund in 2003 and served as President until it was acquired by Algonquin in 2008. Since 2008, Mr. Norman and the business developmentteam have developed and constructed over 1,955 MWs of renewable energy projects and acquired 14 utilities. Mr. Norman has over 28 years of experienceand has reviewed the economic merits of renewable energy projects and utilities throughout North America.
Mr. Norman is a Chartered Accountant and holds a Bachelor of Arts (Chartered Accountancy) and a Masters of Accounting from the University of Waterloo.
Johnny Johnston | CHIEF OPERATING OFFICER
Johnny Johnston is the Chief Operating Officer of Algonquin. Mr. Johnston has over 20 years of international experience in the renewable energy and utilitiesindustry. Prior to joining the Corporation, Mr. Johnston, worked for National Grid where he led the transformation of its U.S. gas business. He has held anumber of senior leadership roles in operations, customer service and strategy working in both the U.K. and U.S. across gas and electric businesses. Mr.Johnston has served on the board of the not-for-profit Heartshare Human Services of New York.
Mr. Johnston holds a Masters degree in Engineering Science from the University of Oxford and a Master of Business Administration degree from theUniversity of Cranfield. Mr. Johnston is a registered Chartered Engineer in the U.K.
George Trisic | CHIEF SUSTAINABILITY OFFICER
George Trisic is the Chief Sustainability Officer of Algonquin. In his role, Mr. Trisic is responsible for leading the sustainability, government affairs andgovernance functions. He has broad experience managing in high growth, start up and expanding businesses across multiple sites and regions. His skill setincludes leading multi-functional groups in finance, human resources, legal and information technology in a senior executive role.
Mr. Trisic holds a Bachelor of Laws Degree from the University of Western Ontario. Additionally, he holds a Chartered Director certification from the DirectorsCollege (McMaster University).
Algonquin | Liberty | 2021 Investor Day
AQN
74
AQN
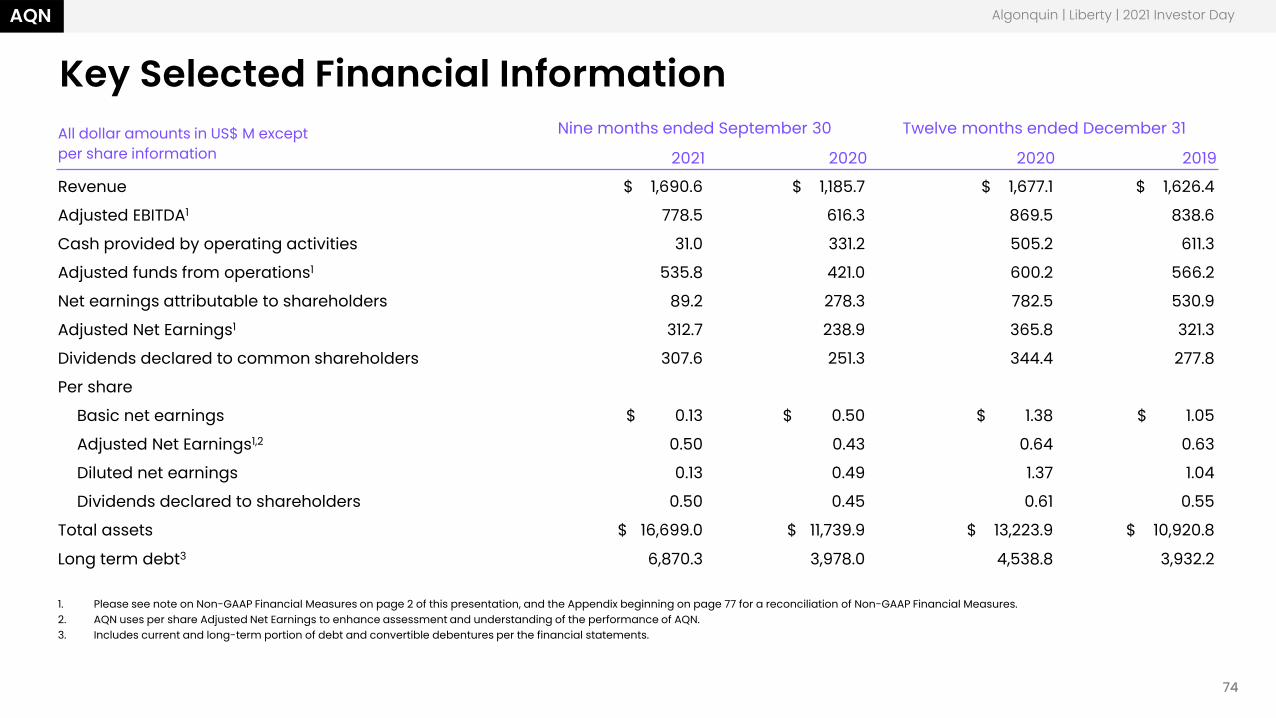
Key Selected Financial Information
Algonquin | Liberty | 2021 Investor Day
All dollar amounts in US$ M except per share information
Nine months ended September 30 Twelve months ended December 31
2021 2020 2020 2019
Revenue $ 1,690.6 $ 1,185.7 $ 1,677.1 $ 1,626.4
Adjusted EBITDA1 778.5 616.3 869.5 838.6
Cash provided by operating activities 31.0 331.2 505.2 611.3
Adjusted funds from operations1 535.8 421.0 600.2 566.2
Net earnings attributable to shareholders 89.2 278.3 782.5 530.9
Adjusted Net Earnings1 312.7 238.9 365.8 321.3
Dividends declared to common shareholders 307.6 251.3 344.4 277.8
Per share
Basic net earnings $ 0.13 $ 0.50 $ 1.38 $ 1.05
Adjusted Net Earnings1,2 0.50 0.43 0.64 0.63
Diluted net earnings 0.13 0.49 1.37 1.04
Dividends declared to shareholders 0.50 0.45 0.61 0.55
Total assets $ 16,699.0 $ 11,739.9 $ 13,223.9 $ 10,920.8
Long term debt3 6,870.3 3,978.0 4,538.8 3,932.2
1. Please see note on Non-GAAP Financial Measures on page 2 of this presentation, and the Appendix beginning on page 77 for a reconciliation of Non-GAAP Financial Measures.2. AQN uses per share Adjusted Net Earnings to enhance assessment and understanding of the performance of AQN.3. Includes current and long-term portion of debt and convertible debentures per the financial statements.
AQN
75
AQN
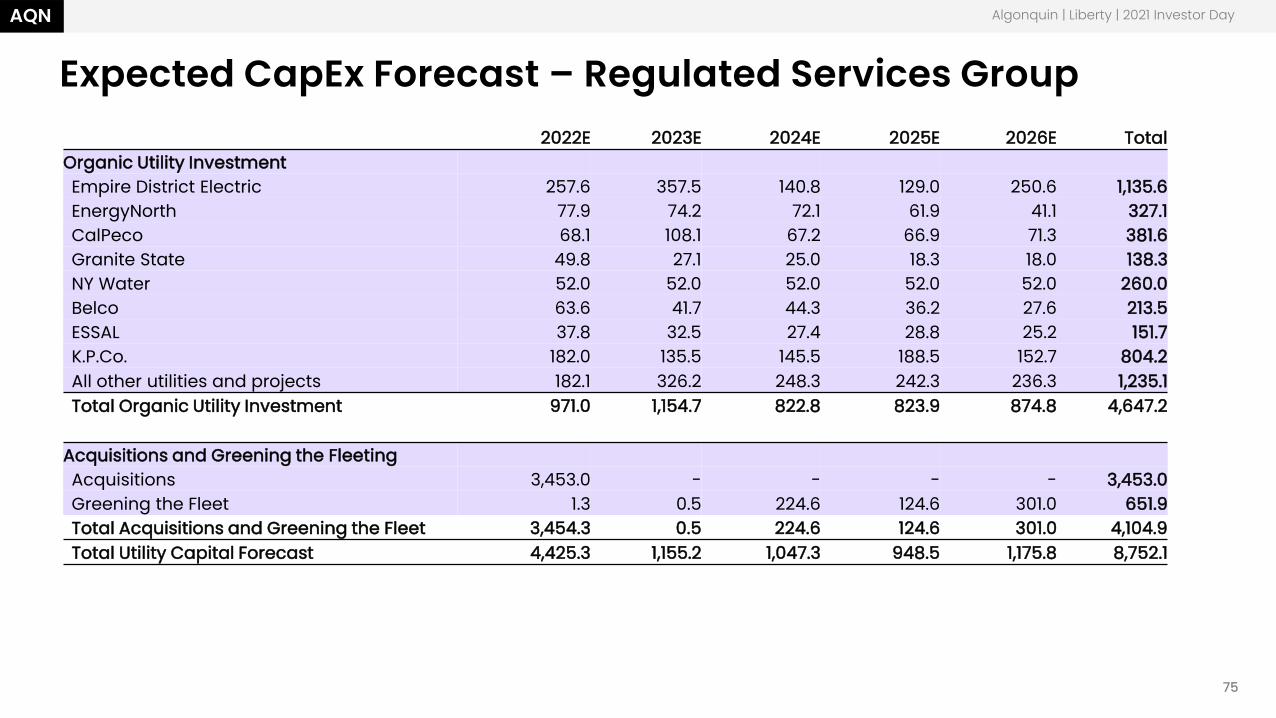
Expected CapEx Forecast – Regulated Services Group
Algonquin | Liberty | 2021 Investor Day
2022E 2023E 2024E 2025E 2026E TotalOrganic Utility InvestmentEmpire District Electric 257.6 357.5 140.8 129.0 250.6 1,135.6EnergyNorth 77.9 74.2 72.1 61.9 41.1 327.1CalPeco 68.1 108.1 67.2 66.9 71.3 381.6Granite State 49.8 27.1 25.0 18.3 18.0 138.3NY Water 52.0 52.0 52.0 52.0 52.0 260.0Belco 63.6 41.7 44.3 36.2 27.6 213.5ESSAL 37.8 32.5 27.4 28.8 25.2 151.7K.P.Co. 182.0 135.5 145.5 188.5 152.7 804.2All other utilities and projects 182.1 326.2 248.3 242.3 236.3 1,235.1Total Organic Utility Investment 971.0 1,154.7 822.8 823.9 874.8 4,647.2
Acquisitions and Greening the FleetingAcquisitions 3,453.0 - - - - 3,453.0Greening the Fleet 1.3 0.5 224.6 124.6 301.0 651.9Total Acquisitions and Greening the Fleet 3,454.3 0.5 224.6 124.6 301.0 4,104.9Total Utility Capital Forecast 4,425.3 1,155.2 1,047.3 948.5 1,175.8 8,752.1
AQN
76
AQN
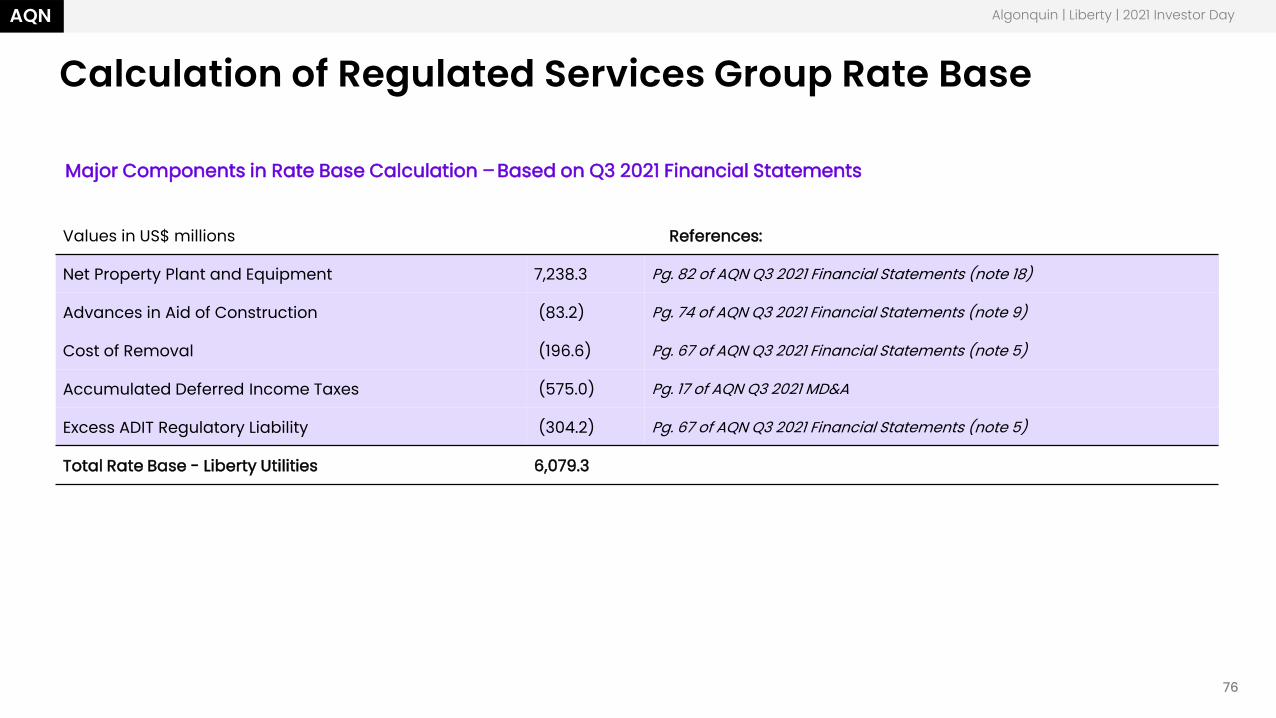
Calculation of Regulated Services Group Rate Base
Algonquin | Liberty | 2021 Investor Day
Values in US$ millions References:
Net Property Plant and Equipment 7,238.3 Pg. 82 of AQN Q3 2021 Financial Statements (note 18)
Advances in Aid of Construction (83.2) Pg. 74 of AQN Q3 2021 Financial Statements (note 9)
Cost of Removal (196.6) Pg. 67 of AQN Q3 2021 Financial Statements (note 5)
Accumulated Deferred Income Taxes (575.0) Pg. 17 of AQN Q3 2021 MD&A
Excess ADIT Regulatory Liability (304.2) Pg. 67 of AQN Q3 2021 Financial Statements (note 5)
Total Rate Base - Liberty Utilities 6,079.3
Major Components in Rate Base Calculation –Based on Q3 2021 Financial Statements
AQN
77
AQN
Reconciliation of Adjusted EBITDA to Net Earnings
Algonquin | Liberty | 2021 Investor Day
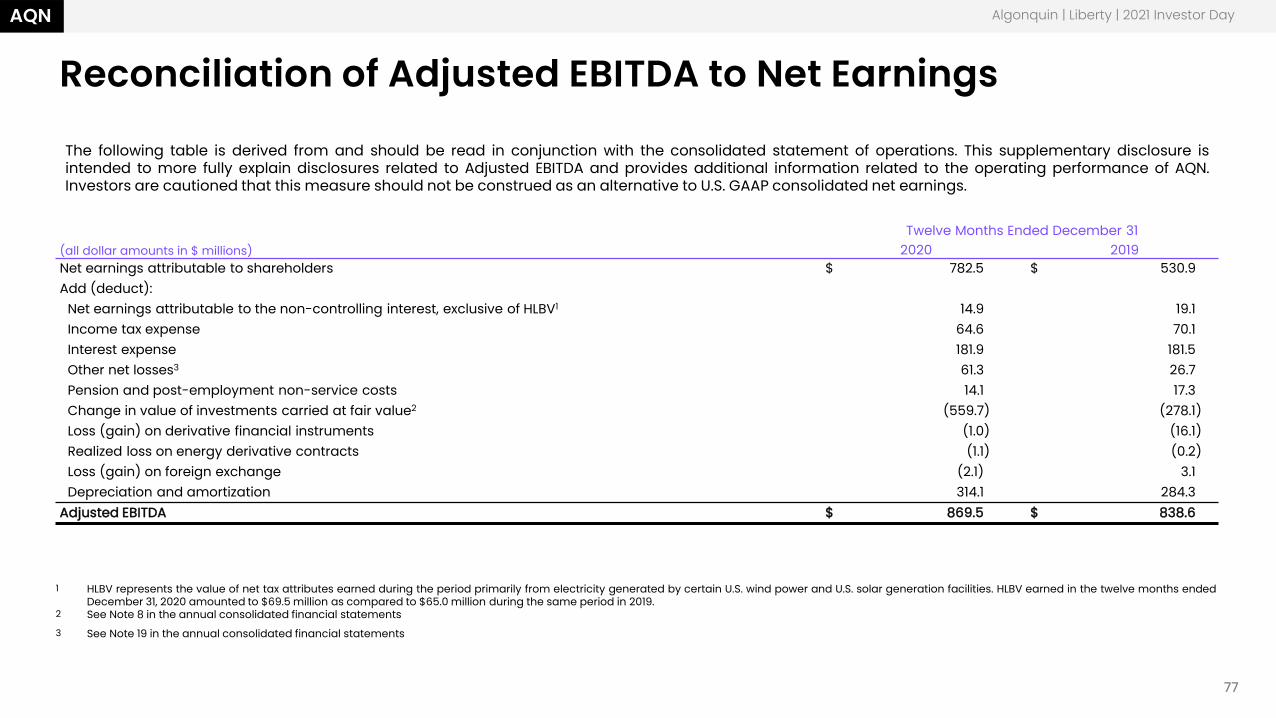
The following table is derived from and should be read in conjunction with the consolidated statement of operations. This supplementary disclosure isintended to more fully explain disclosures related to Adjusted EBITDA and provides additional information related to the operating performance of AQN.Investors are cautioned that this measure should not be construed as an alternative to U.S. GAAP consolidated net earnings.
Twelve Months Ended December 31(all dollar amounts in $ millions) 2020 2019Net earnings attributable to shareholders $ 782.5 $ 530.9Add (deduct):
Net earnings attributable to the non-controlling interest, exclusive of HLBV1 14.9 19.1Income tax expense 64.6 70.1Interest expense 181.9 181.5Other net losses3 61.3 26.7Pension and post-employment non-service costs 14.1 17.3Change in value of investments carried at fair value2 (559.7) (278.1)Loss (gain) on derivative financial instruments (1.0) (16.1)Realized loss on energy derivative contracts (1.1) (0.2)Loss (gain) on foreign exchange (2.1) 3.1Depreciation and amortization 314.1 284.3
Adjusted EBITDA $ 869.5 $ 838.6
1 HLBV represents the value of net tax attributes earned during the period primarily from electricity generated by certain U.S. wind power and U.S. solar generation facilities. HLBV earned in the twelve months endedDecember 31, 2020 amounted to $69.5 million as compared to $65.0 million during the same period in 2019.
2 See Note 8 in the annual consolidated financial statements3 See Note 19 in the annual consolidated financial statements
AQN
78
AQN
Reconciliation of Adjusted EBITDA to Net Earnings
Algonquin | Liberty | 2021 Investor Day
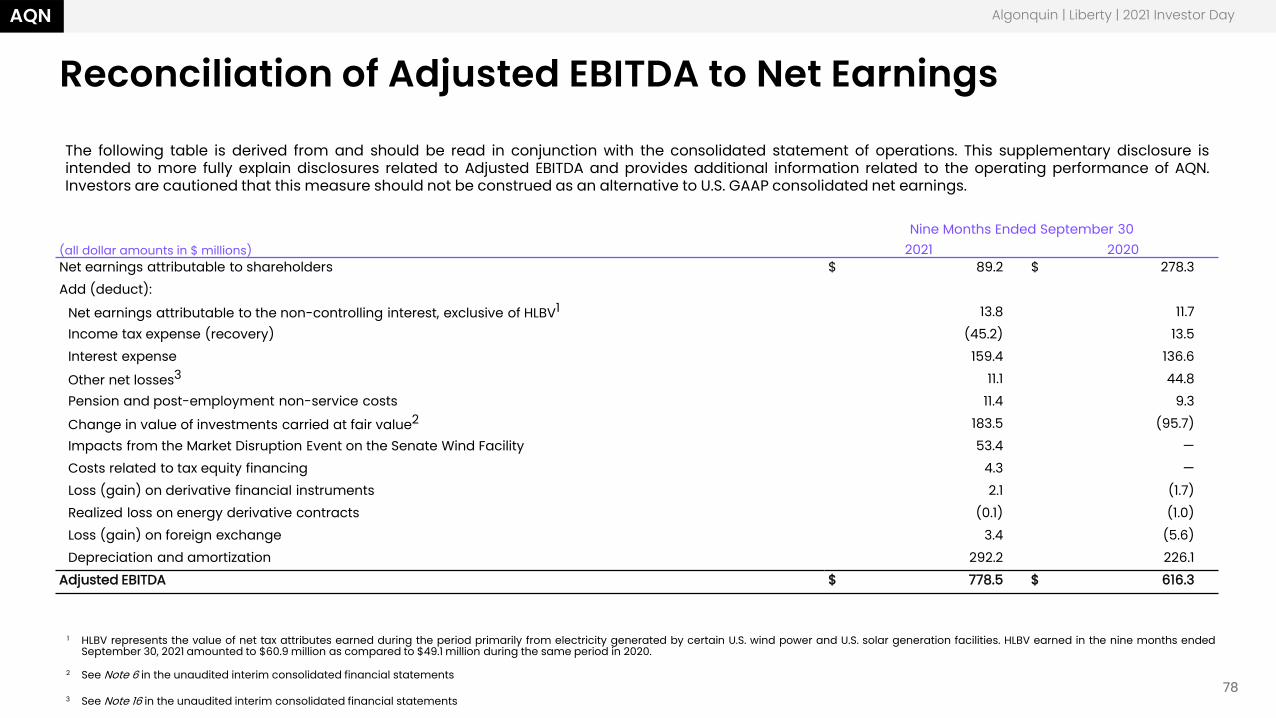
The following table is derived from and should be read in conjunction with the consolidated statement of operations. This supplementary disclosure isintended to more fully explain disclosures related to Adjusted EBITDA and provides additional information related to the operating performance of AQN.Investors are cautioned that this measure should not be construed as an alternative to U.S. GAAP consolidated net earnings.
Nine Months Ended September 30(all dollar amounts in $ millions) 2021 2020Net earnings attributable to shareholders $ 89.2 $ 278.3Add (deduct):
Net earnings attributable to the non-controlling interest, exclusive of HLBV1 13.8 11.7Income tax expense (recovery) (45.2) 13.5Interest expense 159.4 136.6
Other net losses3 11.1 44.8Pension and post-employment non-service costs 11.4 9.3
Change in value of investments carried at fair value2 183.5 (95.7)Impacts from the Market Disruption Event on the Senate Wind Facility 53.4 —Costs related to tax equity financing 4.3 —Loss (gain) on derivative financial instruments 2.1 (1.7)Realized loss on energy derivative contracts (0.1) (1.0)Loss (gain) on foreign exchange 3.4 (5.6)Depreciation and amortization 292.2 226.1
Adjusted EBITDA $ 778.5 $ 616.3
1 HLBV represents the value of net tax attributes earned during the period primarily from electricity generated by certain U.S. wind power and U.S. solar generation facilities. HLBV earned in the nine months endedSeptember 30, 2021 amounted to $60.9 million as compared to $49.1 million during the same period in 2020.
2 See Note 6 in the unaudited interim consolidated financial statements
3 See Note 16 in the unaudited interim consolidated financial statements
AQN
79
AQN
Reconciliation of Adjusted Net Earnings to Net Earnings
Algonquin | Liberty | 2021 Investor Day
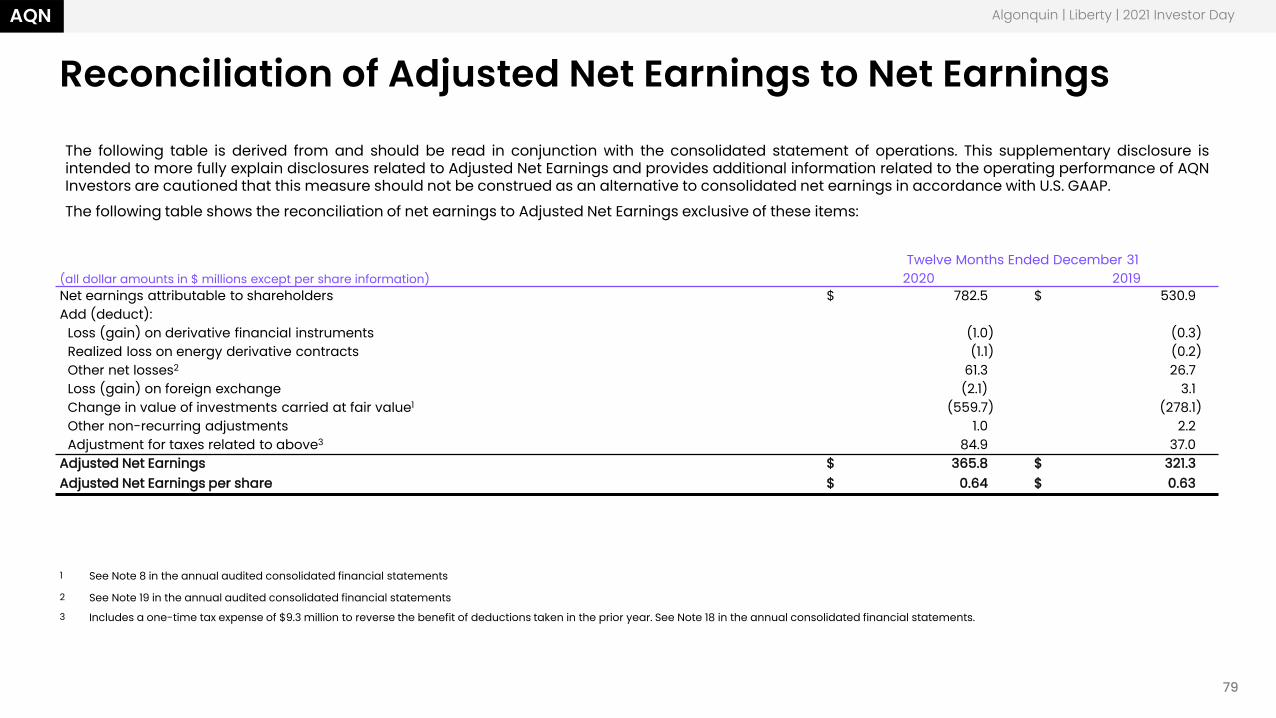
The following table is derived from and should be read in conjunction with the consolidated statement of operations. This supplementary disclosure isintended to more fully explain disclosures related to Adjusted Net Earnings and provides additional information related to the operating performance of AQNInvestors are cautioned that this measure should not be construed as an alternative to consolidated net earnings in accordance with U.S. GAAP.The following table shows the reconciliation of net earnings to Adjusted Net Earnings exclusive of these items:
Twelve Months Ended December 31(all dollar amounts in $ millions except per share information) 2020 2019Net earnings attributable to shareholders $ 782.5 $ 530.9Add (deduct):
Loss (gain) on derivative financial instruments (1.0) (0.3)Realized loss on energy derivative contracts (1.1) (0.2)Other net losses2 61.3 26.7Loss (gain) on foreign exchange (2.1) 3.1Change in value of investments carried at fair value1 (559.7) (278.1)Other non-recurring adjustments 1.0 2.2Adjustment for taxes related to above3 84.9 37.0
Adjusted Net Earnings $ 365.8 $ 321.3Adjusted Net Earnings per share $ 0.64 $ 0.63
1 See Note 8 in the annual audited consolidated financial statements
2 See Note 19 in the annual audited consolidated financial statements3 Includes a one-time tax expense of $9.3 million to reverse the benefit of deductions taken in the prior year. See Note 18 in the annual consolidated financial statements.
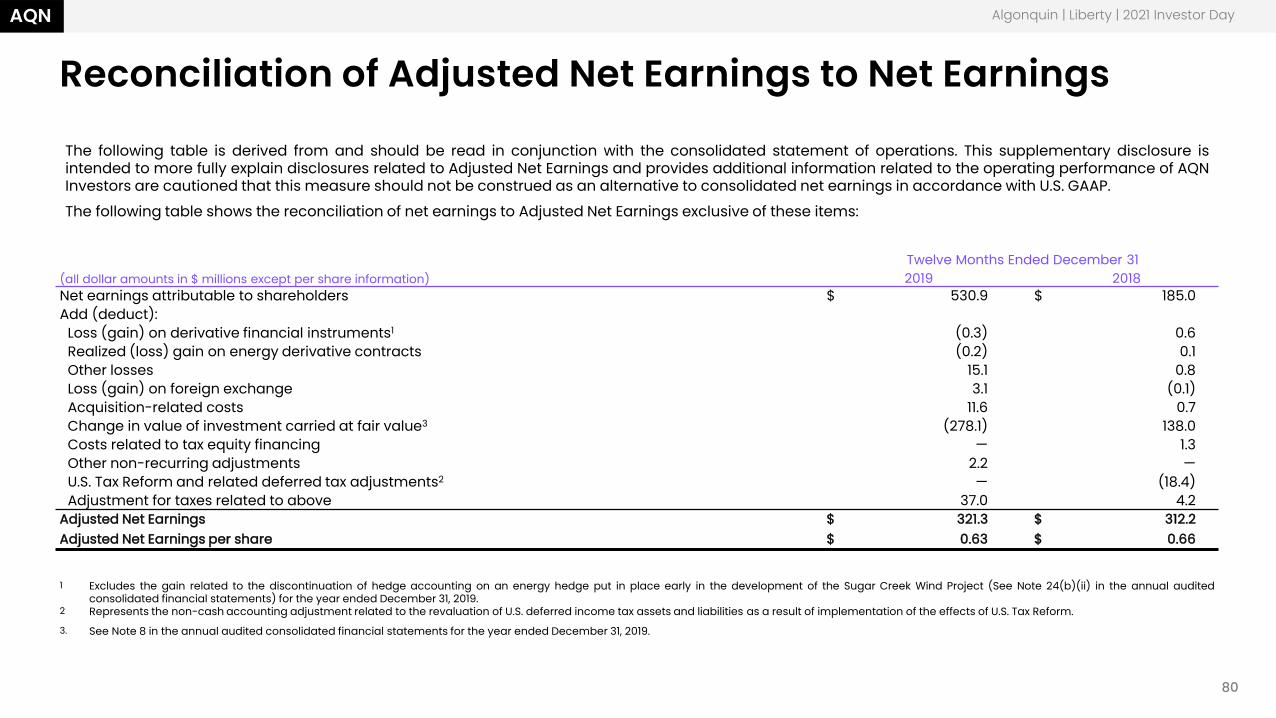
AQN
80
AQN
Reconciliation of Adjusted Net Earnings to Net Earnings
Algonquin | Liberty | 2021 Investor Day
The following table is derived from and should be read in conjunction with the consolidated statement of operations. This supplementary disclosure isintended to more fully explain disclosures related to Adjusted Net Earnings and provides additional information related to the operating performance of AQNInvestors are cautioned that this measure should not be construed as an alternative to consolidated net earnings in accordance with U.S. GAAP.The following table shows the reconciliation of net earnings to Adjusted Net Earnings exclusive of these items:
Twelve Months Ended December 31(all dollar amounts in $ millions except per share information) 2019 2018Net earnings attributable to shareholders $ 530.9 $ 185.0Add (deduct):
Loss (gain) on derivative financial instruments1 (0.3) 0.6Realized (loss) gain on energy derivative contracts (0.2) 0.1 Other losses 15.1 0.8Loss (gain) on foreign exchange 3.1 (0.1)Acquisition-related costs 11.6 0.7Change in value of investment carried at fair value3 (278.1) 138.0Costs related to tax equity financing — 1.3Other non-recurring adjustments 2.2 —U.S. Tax Reform and related deferred tax adjustments2 — (18.4)Adjustment for taxes related to above 37.0 4.2
Adjusted Net Earnings $ 321.3 $ 312.2Adjusted Net Earnings per share $ 0.63 $ 0.66
1 Excludes the gain related to the discontinuation of hedge accounting on an energy hedge put in place early in the development of the Sugar Creek Wind Project (See Note 24(b)(ii) in the annual auditedconsolidated financial statements) for the year ended December 31, 2019.
2 Represents the non-cash accounting adjustment related to the revaluation of U.S. deferred income tax assets and liabilities as a result of implementation of the effects of U.S. Tax Reform.3. See Note 8 in the annual audited consolidated financial statements for the year ended December 31, 2019.
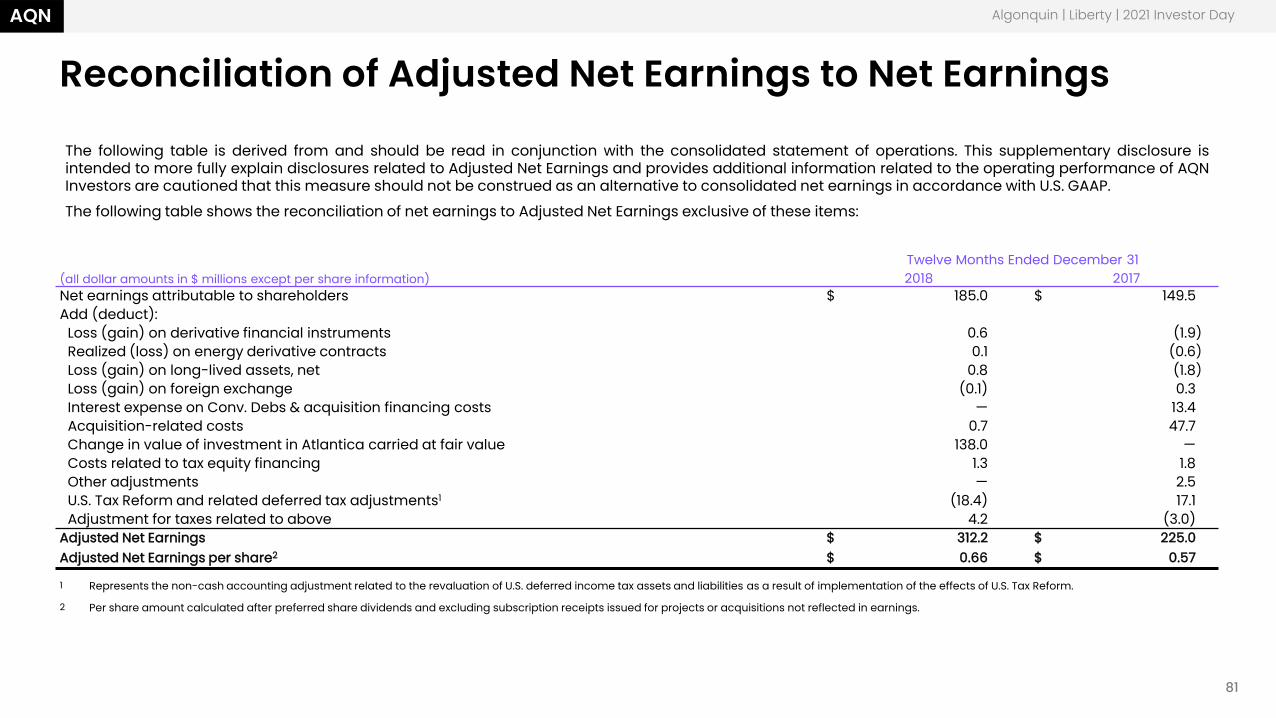
AQN
81
AQN
Reconciliation of Adjusted Net Earnings to Net Earnings
Algonquin | Liberty | 2021 Investor Day
The following table is derived from and should be read in conjunction with the consolidated statement of operations. This supplementary disclosure isintended to more fully explain disclosures related to Adjusted Net Earnings and provides additional information related to the operating performance of AQNInvestors are cautioned that this measure should not be construed as an alternative to consolidated net earnings in accordance with U.S. GAAP.The following table shows the reconciliation of net earnings to Adjusted Net Earnings exclusive of these items:
Twelve Months Ended December 31(all dollar amounts in $ millions except per share information) 2018 2017Net earnings attributable to shareholders $ 185.0 $ 149.5Add (deduct):
Loss (gain) on derivative financial instruments 0.6 (1.9)Realized (loss) on energy derivative contracts 0.1 (0.6)Loss (gain) on long-lived assets, net 0.8 (1.8)Loss (gain) on foreign exchange (0.1) 0.3Interest expense on Conv. Debs & acquisition financing costs — 13.4Acquisition-related costs 0.7 47.7Change in value of investment in Atlantica carried at fair value 138.0 —Costs related to tax equity financing 1.3 1.8Other adjustments — 2.5U.S. Tax Reform and related deferred tax adjustments1 (18.4) 17.1Adjustment for taxes related to above 4.2 (3.0)
Adjusted Net Earnings $ 312.2 $ 225.0Adjusted Net Earnings per share2 $ 0.66 $ 0.57
1 Represents the non-cash accounting adjustment related to the revaluation of U.S. deferred income tax assets and liabilities as a result of implementation of the effects of U.S. Tax Reform.
2 Per share amount calculated after preferred share dividends and excluding subscription receipts issued for projects or acquisitions not reflected in earnings.
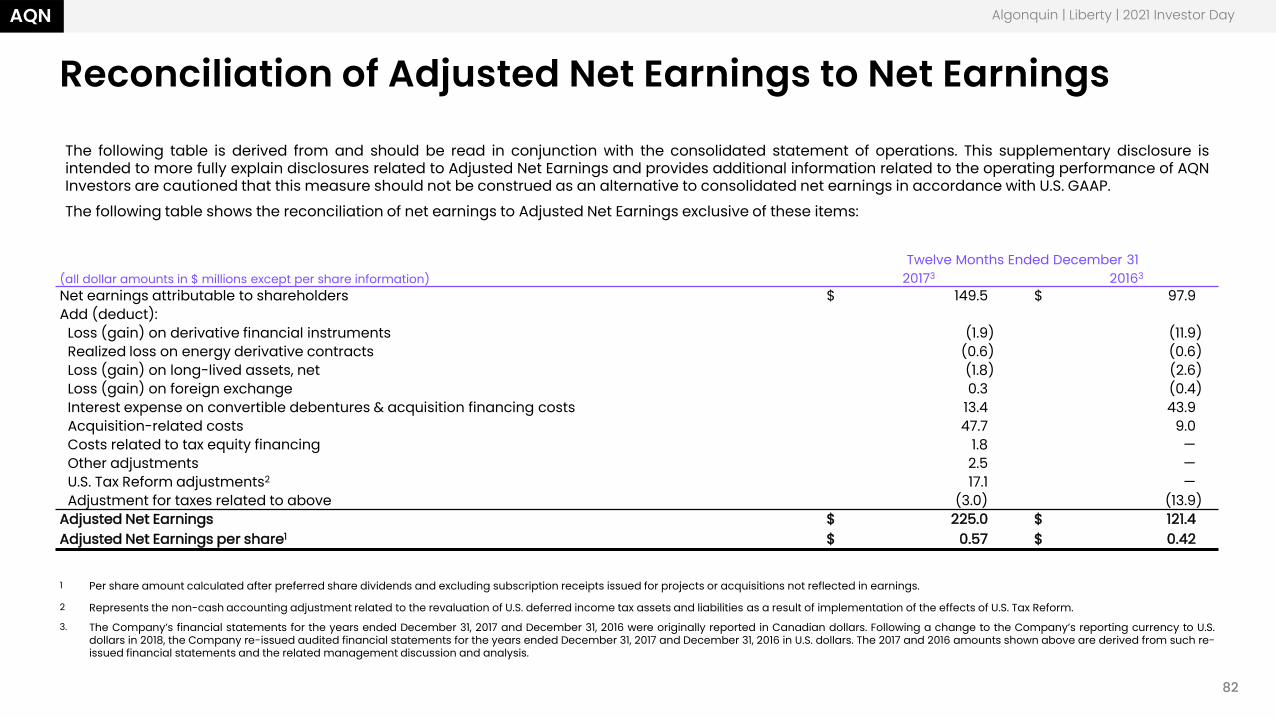
AQN
82
AQN
Reconciliation of Adjusted Net Earnings to Net Earnings
Algonquin | Liberty | 2021 Investor Day
The following table is derived from and should be read in conjunction with the consolidated statement of operations. This supplementary disclosure isintended to more fully explain disclosures related to Adjusted Net Earnings and provides additional information related to the operating performance of AQNInvestors are cautioned that this measure should not be construed as an alternative to consolidated net earnings in accordance with U.S. GAAP.The following table shows the reconciliation of net earnings to Adjusted Net Earnings exclusive of these items:
Twelve Months Ended December 31(all dollar amounts in $ millions except per share information) 20173 20163
Net earnings attributable to shareholders $ 149.5 $ 97.9Add (deduct):
Loss (gain) on derivative financial instruments (1.9) (11.9)Realized loss on energy derivative contracts (0.6) (0.6)Loss (gain) on long-lived assets, net (1.8) (2.6)Loss (gain) on foreign exchange 0.3 (0.4)Interest expense on convertible debentures & acquisition financing costs 13.4 43.9Acquisition-related costs 47.7 9.0Costs related to tax equity financing 1.8 —Other adjustments 2.5 —U.S. Tax Reform adjustments2 17.1 —Adjustment for taxes related to above (3.0) (13.9)
Adjusted Net Earnings $ 225.0 $ 121.4Adjusted Net Earnings per share1 $ 0.57 $ 0.42
1 Per share amount calculated after preferred share dividends and excluding subscription receipts issued for projects or acquisitions not reflected in earnings.
2 Represents the non-cash accounting adjustment related to the revaluation of U.S. deferred income tax assets and liabilities as a result of implementation of the effects of U.S. Tax Reform.3. The Company’s financial statements for the years ended December 31, 2017 and December 31, 2016 were originally reported in Canadian dollars. Following a change to the Company’s reporting currency to U.S.
dollars in 2018, the Company re-issued audited financial statements for the years ended December 31, 2017 and December 31, 2016 in U.S. dollars. The 2017 and 2016 amounts shown above are derived from such re-issued financial statements and the related management discussion and analysis.
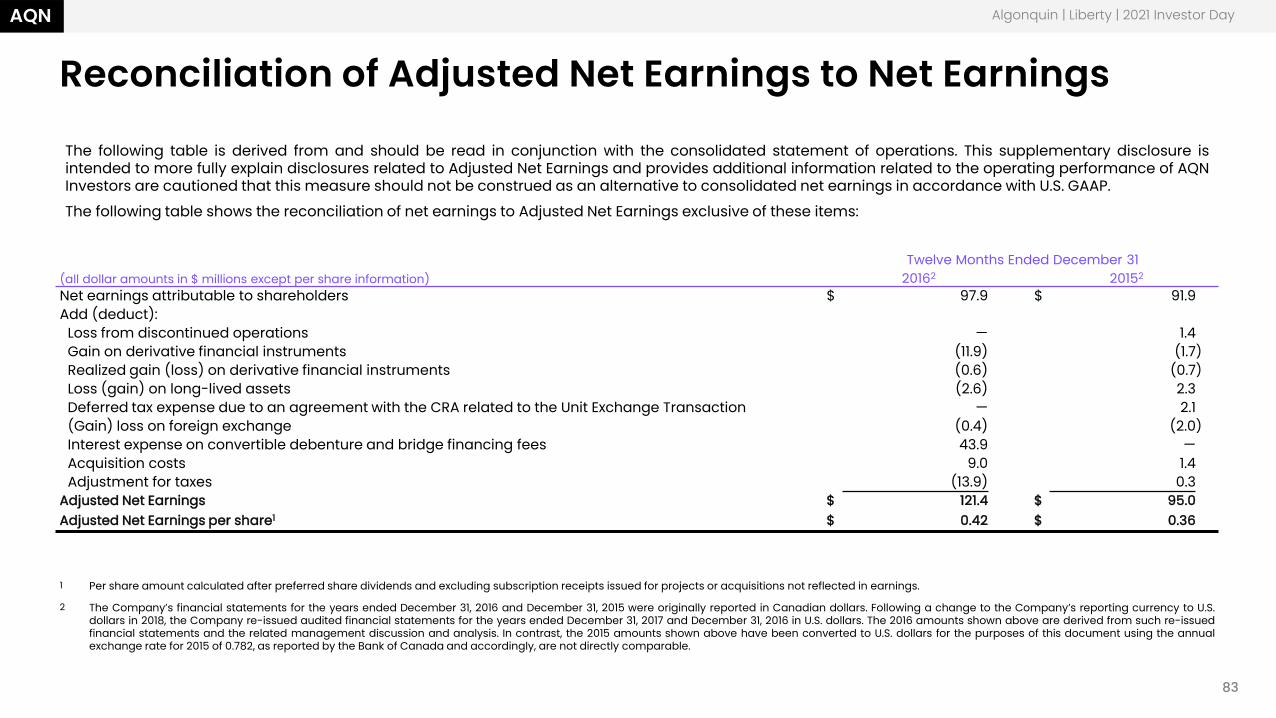
AQN
83
AQN
Reconciliation of Adjusted Net Earnings to Net Earnings
Algonquin | Liberty | 2021 Investor Day
The following table is derived from and should be read in conjunction with the consolidated statement of operations. This supplementary disclosure isintended to more fully explain disclosures related to Adjusted Net Earnings and provides additional information related to the operating performance of AQNInvestors are cautioned that this measure should not be construed as an alternative to consolidated net earnings in accordance with U.S. GAAP.The following table shows the reconciliation of net earnings to Adjusted Net Earnings exclusive of these items:
Twelve Months Ended December 31(all dollar amounts in $ millions except per share information) 20162 20152
Net earnings attributable to shareholders $ 97.9 $ 91.9Add (deduct):
Loss from discontinued operations — 1.4Gain on derivative financial instruments (11.9) (1.7)Realized gain (loss) on derivative financial instruments (0.6) (0.7)Loss (gain) on long-lived assets (2.6) 2.3Deferred tax expense due to an agreement with the CRA related to the Unit Exchange Transaction — 2.1(Gain) loss on foreign exchange (0.4) (2.0)Interest expense on convertible debenture and bridge financing fees 43.9 —Acquisition costs 9.0 1.4Adjustment for taxes (13.9) 0.3
Adjusted Net Earnings $ 121.4 $ 95.0Adjusted Net Earnings per share1 $ 0.42 $ 0.36
1 Per share amount calculated after preferred share dividends and excluding subscription receipts issued for projects or acquisitions not reflected in earnings.
2 The Company’s financial statements for the years ended December 31, 2016 and December 31, 2015 were originally reported in Canadian dollars. Following a change to the Company’s reporting currency to U.S.dollars in 2018, the Company re-issued audited financial statements for the years ended December 31, 2017 and December 31, 2016 in U.S. dollars. The 2016 amounts shown above are derived from such re-issuedfinancial statements and the related management discussion and analysis. In contrast, the 2015 amounts shown above have been converted to U.S. dollars for the purposes of this document using the annualexchange rate for 2015 of 0.782, as reported by the Bank of Canada and accordingly, are not directly comparable.
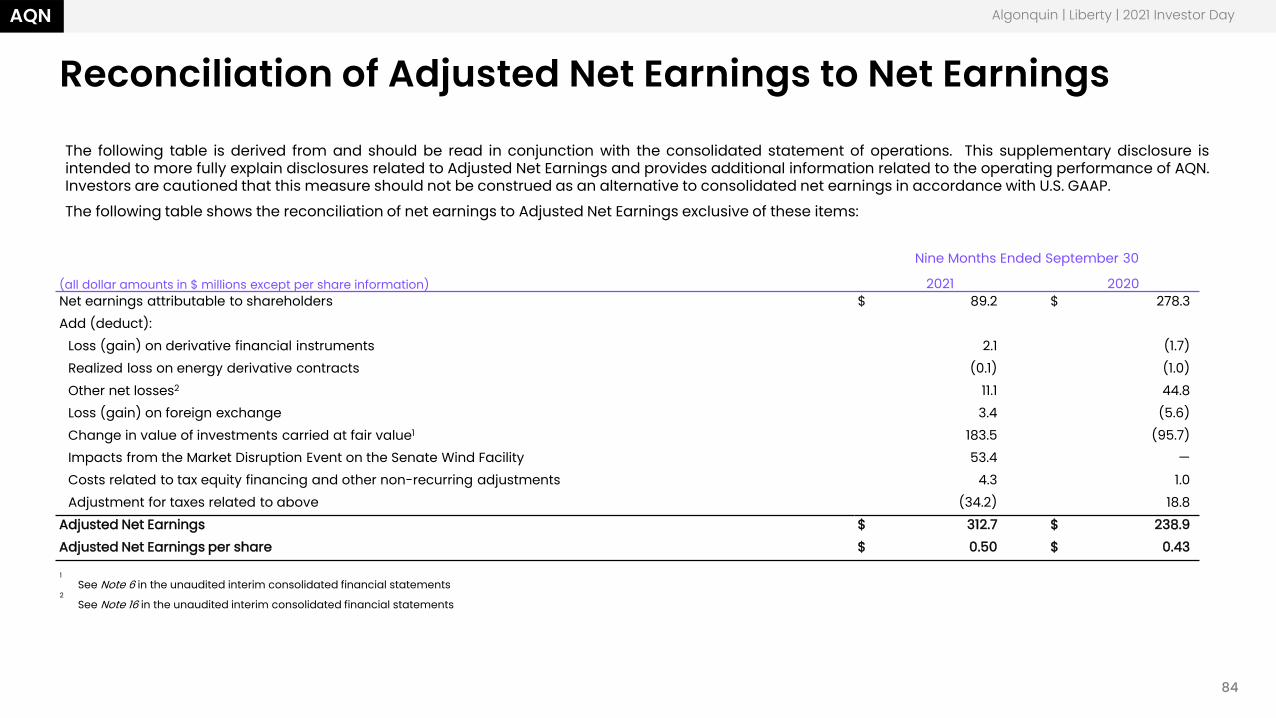
AQN
84
AQN
Reconciliation of Adjusted Net Earnings to Net Earnings
Algonquin | Liberty | 2021 Investor Day
The following table is derived from and should be read in conjunction with the consolidated statement of operations. This supplementary disclosure isintended to more fully explain disclosures related to Adjusted Net Earnings and provides additional information related to the operating performance of AQN.Investors are cautioned that this measure should not be construed as an alternative to consolidated net earnings in accordance with U.S. GAAP.The following table shows the reconciliation of net earnings to Adjusted Net Earnings exclusive of these items:
Nine Months Ended September 30
(all dollar amounts in $ millions except per share information) 2021 2020Net earnings attributable to shareholders $ 89.2 $ 278.3Add (deduct):
Loss (gain) on derivative financial instruments 2.1 (1.7)Realized loss on energy derivative contracts (0.1) (1.0)Other net losses2 11.1 44.8Loss (gain) on foreign exchange 3.4 (5.6)Change in value of investments carried at fair value1 183.5 (95.7)Impacts from the Market Disruption Event on the Senate Wind Facility 53.4 —Costs related to tax equity financing and other non-recurring adjustments 4.3 1.0Adjustment for taxes related to above (34.2) 18.8
Adjusted Net Earnings $ 312.7 $ 238.9Adjusted Net Earnings per share $ 0.50 $ 0.43
1See Note 6 in the unaudited interim consolidated financial statements
2See Note 16 in the unaudited interim consolidated financial statements
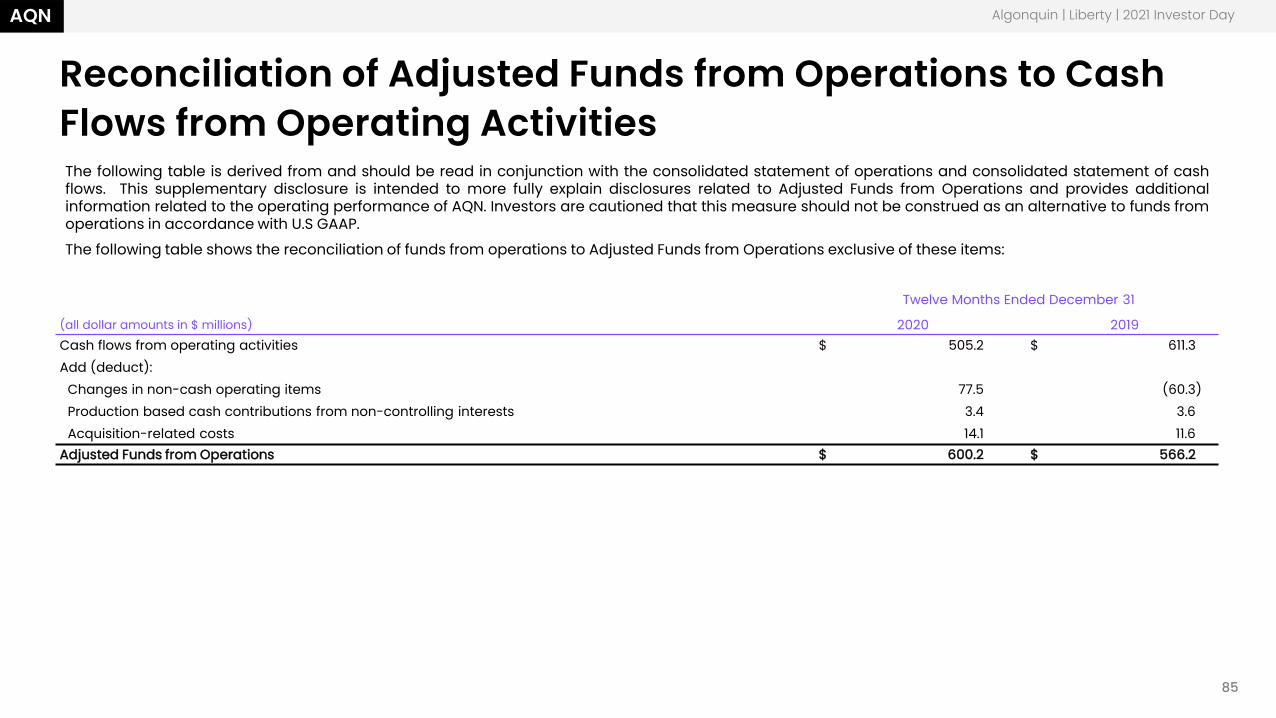
AQN
85
AQN
Reconciliation of Adjusted Funds from Operations to Cash Flows from Operating Activities
Algonquin | Liberty | 2021 Investor Day
The following table is derived from and should be read in conjunction with the consolidated statement of operations and consolidated statement of cashflows. This supplementary disclosure is intended to more fully explain disclosures related to Adjusted Funds from Operations and provides additionalinformation related to the operating performance of AQN. Investors are cautioned that this measure should not be construed as an alternative to funds fromoperations in accordance with U.S GAAP.The following table shows the reconciliation of funds from operations to Adjusted Funds from Operations exclusive of these items:
Twelve Months Ended December 31
(all dollar amounts in $ millions) 2020 2019Cash flows from operating activities $ 505.2 $ 611.3Add (deduct):
Changes in non-cash operating items 77.5 (60.3)Production based cash contributions from non-controlling interests 3.4 3.6Acquisition-related costs 14.1 11.6
Adjusted Funds from Operations $ 600.2 $ 566.2
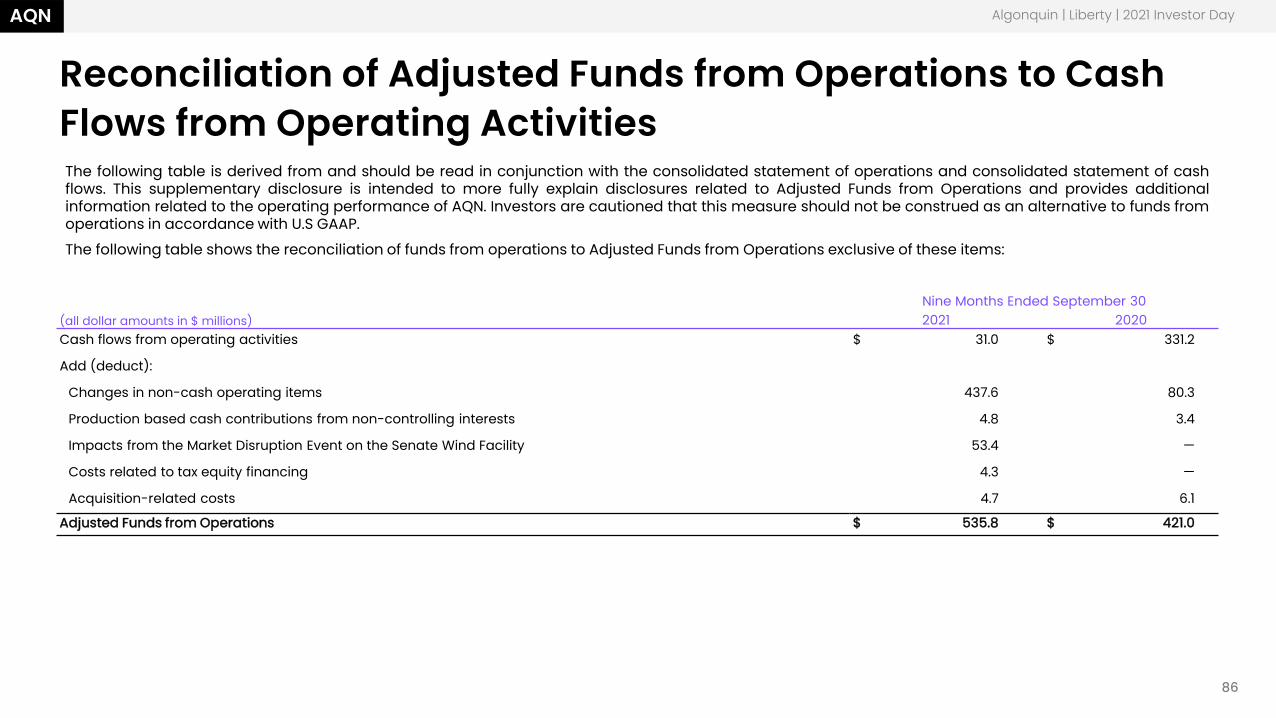
AQN
86
AQN
Reconciliation of Adjusted Funds from Operations to Cash Flows from Operating Activities
Algonquin | Liberty | 2021 Investor Day
The following table is derived from and should be read in conjunction with the consolidated statement of operations and consolidated statement of cashflows. This supplementary disclosure is intended to more fully explain disclosures related to Adjusted Funds from Operations and provides additionalinformation related to the operating performance of AQN. Investors are cautioned that this measure should not be construed as an alternative to funds fromoperations in accordance with U.S GAAP.The following table shows the reconciliation of funds from operations to Adjusted Funds from Operations exclusive of these items:
Nine Months Ended September 30(all dollar amounts in $ millions) 2021 2020Cash flows from operating activities $ 31.0 $ 331.2
Add (deduct):
Changes in non-cash operating items 437.6 80.3
Production based cash contributions from non-controlling interests 4.8 3.4
Impacts from the Market Disruption Event on the Senate Wind Facility 53.4 —
Costs related to tax equity financing 4.3 —
Acquisition-related costs 4.7 6.1
Adjusted Funds from Operations $ 535.8 $ 421.0
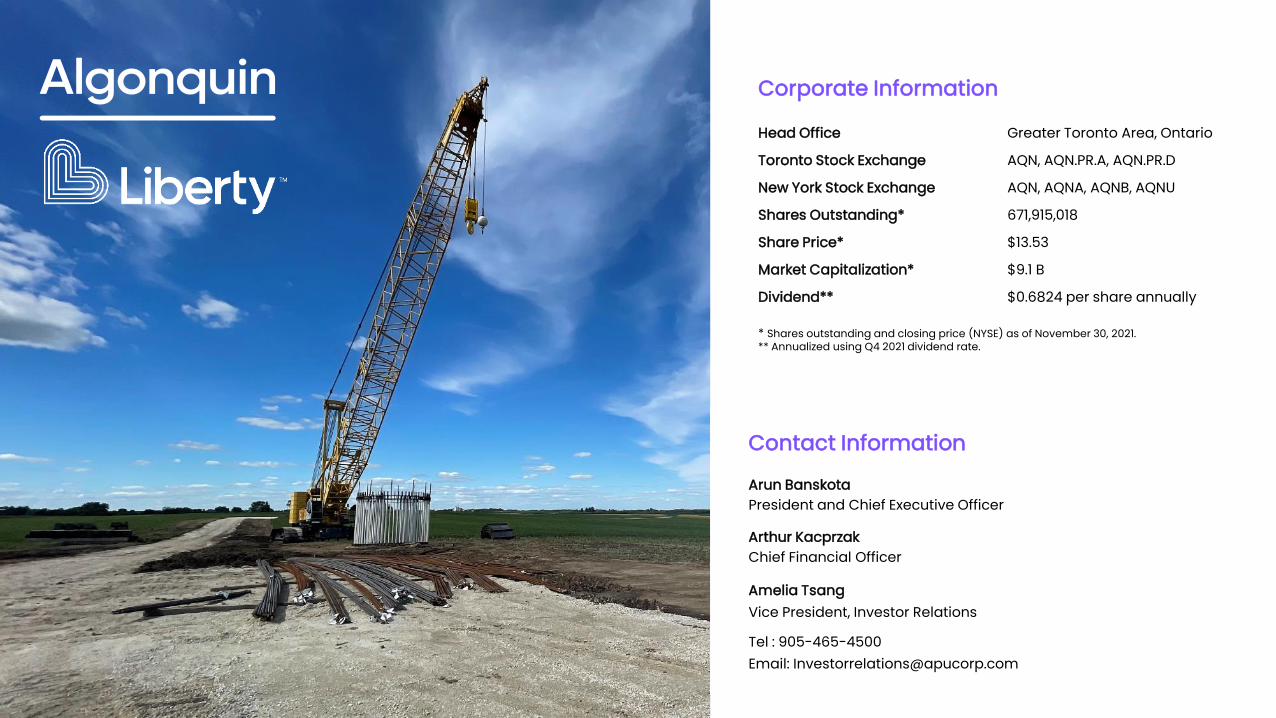
Algonquin | Liberty | 2021 Investor Day
Corporate Information
Head Office Greater Toronto Area, Ontario
Toronto Stock Exchange AQN, AQN.PR.A, AQN.PR.D
New York Stock Exchange AQN, AQNA, AQNB, AQNU
Shares Outstanding* 671,915,018
Share Price* $13.53
Market Capitalization* $9.1 B
Dividend** $0.6824 per share annually
* Shares outstanding and closing price (NYSE) as of November 30, 2021.** Annualized using Q4 2021 dividend rate.
Contact Information
Arun BanskotaPresident and Chief Executive Officer
Arthur KacprzakChief Financial Officer
Amelia TsangVice President, Investor Relations
Tel : 905-465-4500 Email: [email protected]