h1-2021-rs-presentation.pdf - Coloplast's Investor Relations site
81
STRIVE25: SUSTAINABLE GROWTH LEADERSHIP Roadshow presentation H1 2020/21 Coloplast Group - Ostomy Care / Continence Care / Wound & Skin Care / Interventional Urology Making life easier Cartago factory, Costa Rica
-
Upload
khangminh22 -
Category
Documents
-
view
1 -
download
0
Transcript of h1-2021-rs-presentation.pdf - Coloplast's Investor Relations site

STRIVE25: SUSTAINABLE GROWTH LEADERSHIP
Roadshow presentation
H1 2020/21
Coloplast Group - Ostomy Care / Continence Care / Wound & Skin Care / Interventional Urology
Making lifeeasier
Cartago factory, Costa Rica

Forward-looking statements
Coloplast Group - Ostomy Care / Continence Care / Wound & Skin Care / Interventional Urology Page 2
The forward-looking statements contained in this presentation, including forecasts of sales and earnings performance, are not guarantees of future results and are subject to risks, uncertainties and assumptions that are difficult to predict. The forward-looking statements are based on Coloplast’s current expectations, estimates and assumptions and based on the information available to Coloplast at this time.
Heavy fluctuations in the exchange rates of important currencies, significant changes in the healthcare sector or major changes in the world economy may impact Coloplast's possibilities of achieving the long-term objectives set as well as for fulfilling expectations and may affect the company’s financial outcomes.

Q2 organic growth of 2% and underlying EBIT margin of 33%1) –underlying EBIT margin guidance raised to 32-33% from 31-32%
Page 3
• Organic growth of 2% and -1% reported growth in DKK
• Chronic Care growth was negatively impacted by DKK 150m stock building in comparison period and lower growth in new patients due to COVID-19 in Europe, in particular in the UK
• 3% organic growth in Interventional Urology, driven by the Men’s Health portfolio in the US
• 1% organic growth in Wound & Skin Care. Wound Care in isolation grew 9%, driven by Europe and China
• EBIT margin before special items of 33% against 32% in Q2 last year reflecting lower travel and sales & marketing expenses due to COVID-19, efficiency gains and continued commercial investments
• ROIC after tax before special items of 42% impacted by Nine Continents Medical acquisition in November 2020
• Further provision of DKK 200m in Q2 related to Mesh litigation due to increased legal costs. Around 97% of known outstanding cases have been settled. The Coloplast MDL was closed in December 2020.
• Effective as of July 1, 2021, Coloplast was awarded a contract for ostomy products with Vizient, the largest Group Purchasing Organization in the US
• Half year interim dividend of DKK 5.00 per share
• 2020/21 organic growth guidance unchanged, EBIT margin guidance raised
• Organic revenue growth of 7-8% and 4-5% reported growth in DKK
• Reported EBIT margin before special items raised to 32-33% from 31-32% due to efficiency gains and lower costs as a result of COVID-19. Reported EBIT after special items expected to be 31-32%
• Capex of around DKK 1.1bn and effective tax rate of around 23%
REVENUE GROWTH
EBIT
Q2 20/21Q2 19/20
4,7534,823
-1%
+2%
Q2 Highlights
Reported revenue (mDKK)
9,535
H1 19/20 H1 20/21
9,491
+4%
0%
Organic growth
Reported growth
3233
32
34
Q2 19/20 Q2 20/21
1,542 1,577
EBIT (DKKm)
EBIT margin,constant currencies (%)1)
Reported EBITmargin (%)1)
32 33
H1 20/21H1 19/20
3,1133,014
1) Before special items of DKK 200m in Q2 20/21 related to the existing lawsuits in the US alleging injury resulting from the use of transvaginal surgical mesh products

Q2 growth driven by Ostomy Care in Emerging markets, offset by stock building in comparison period and COVID-19 impact in Europe
Page 4
Other developed markets
Emerging markets
Coloplast Group
European markets
Reported revenue Q2DKKm
Organic growthQ2
Geographicarea
-2%
5%
14%
2%
Continence Care
Interventional Urology
Wound & Skin Care
Ostomy Care
Coloplast Group
4%
0%
3%
1%
2%
Reported revenue Q2DKKm
Organic growth Q2
495
603
1,936
1,719
842
2,768
1,143
4,7534,753
Q2 20/21 revenue by business area Q2 20/21 revenue by geography
5%
3%
4%
1%
4%
Organic growthH1
Business area
Organic growth H1
0%
6%
15%
4%

Ostomy Care grew 4% in Q2 driven by Emerging markets; negative impact from stock building in Europe in Q2 last year and COVID-19
Page 5
6
1
10
2
01 1
10
43
6
4
Q2 19/20 Q4 19/20Q3 19/20 Q2 20/21Q1 20/21
1,920 1,870 1,841 1,932 1,936
Revenues (DKKm)Reported growth (%) Organic growth (%)
Ostomy Care performance Comments
Quarterly performance:
• Q2 organic growth of 4% and 1% reported growth
• Growth was driven by solid performance across Emerging markets, and negatively impacted by Europe
• Emerging markets growth was led by China, impacted by an easier comparison period, as well as LATAM and Russia
• Europe was impacted by stock building in Q2 last year, and lower growth in new patients due to COVID-19, particularly in the UK, as only the most acute ostomy surgeries have taken place
• Good growth contribution from the US. Coloplast now has a position on the two largest GPOs, Vizient and Premier
• From a product perspective, growth was driven by the SenSura® Mio portfolio, and in particular SenSura® Mio Convex, as well as the Brava® range of supporting products

Continence Care was flat at 0% in Q2, adversely impacted by stock building last year and lower growth in new patients in Europe and US
Page 6
12
1
-3
12
4 46
0
Q2 20/21Q2 19/20
1,680
Q3 19/20
1,677
Q4 19/20 Q1 20/21
1,776 1,705 1,719
2 2
Reported growth (%) Organic growth (%) Revenues (DKKm)
Continence Care performance Comments
Quarterly performance:
• Q2 organic growth of 0% and -3% reported growth
• Growth was impacted by stock building in comparison period last year in Europe, as well as lower growth in new patients in Europe and the US due to COVID-19
• As a result of COVID-19 patients who are candidates for Intermittent catherization have been de-prioritized or given alternative treatments
• The Collecting Devices and Bowel Management businesses contributed to the weakness in Europe as fewer patients have been treated as a result of COVID-19
• The SpeediCath® intermittent catheters, and in particular SpeediCath Flex and SpeediCath Navi contributed positively to the performance
• During Q2, Coloplast acquired two small US Durable Medical Equipment (DME) catheter dealers to be integrated into Comfort Medical. The revenue contribution in the quarter is immaterial

Interventional Urology grew 3% organically in Q2 as elective procedures within Men’s Health in the US continue to recover
Page 7
507
313
480536
495
5
0
-23
0
53
Q4 19/20Q2 19/20 Q3 19/20 Q2 20/21Q1 20/21
-39
-40
-3
Organic growth (%)Reported growth (%) Revenues (DKKm)
Interventional Urology performance Comments
Quarterly performance:
• Q2 organic growth of 3% and -2% reported growth
• Interventional Urology growth was driven by the US, where elective procedures in particular within Men’s Health continued to recover
• Men’s Health and the Titan® penile implants in the US delivered double digit growth in Q2
• Sales of disposable surgical products in Europe also contributed positively to growth in Q2
• Women’s Health implantable devices had a negative growth contribution, however towards the end of the quarter procedures within Women’s Health in the US began to resume
• The feasibility study in Nine Continents Medical has been completed with satisfactory results and the pivotal study design will be submitted to FDA in Q3

Wound & Skin Care grew 1% organically in Q2, Wound Care alone grew 9% driven by Europe, China and Biatain Fiber launch
Page 8
620556
592 565603
5
-6-3 -3
4
-6
1-2
1
5
9
Q4 19/20Q2 19/20
1
Q1 20/21
-7
-3
-7
Q3 19/20 Q2 20/21
Reported growth (%)
Revenues (DKKm)Organic growth (%)
WC Organic growth (%)
Wound & Skin Care performance Comments
Quarterly performance:
• Q2 organic growth of 1% and -3% reported growth. Wound Care in isolation grew 9% organically in Q2 driven by Europe and China
• Growth in Europe was led by good momentum in Germany, France and Spain
• Solid growth in China following the continued resumption of hospital activity, as well as easier comparison period from Q2 last year
• Biatain® Fiber has been launched in 9 markets and continues to be well received. It contributed meaningfully to growth in Europe, and especially in France and Germany.
• From a product perspective, growth was driven by the Biatain Silicone® and Biatain Fiber® portfolios
• Skin Care and in particular Contract manufacturing detracted from growth in Q2, impacted by lower demand due to COVID-19 and a strong comparison period

• Q2 2020/21 reported revenue decreased by DKK 70m, or -1% compared to Q2 2019/20
• Q2 organic growth of 2% or DKK 102m
• Main drivers of Q2 performance
• European Chronic Care business negatively impacted by DKK 150m stock building in comparison period, as well as continued negative impact from lower growth in patients, in
particular in the UK, due to COVID-19
• Solid growth in Emerging markets led by China and LATAM within Ostomy Care
• Continued recovery in Interventional Urology driven by Men’s Health in US
• Solid growth in Wound Care driven by Europe, China and the recently launched Biatain Fiber® portfolio
• Foreign exchange rates had a negative impact of DKK 175m or -3.7% on reported revenue primarily due to negative development of the USD and Emerging markets currencies against the Danish kroner
Q2 2020/21 reported revenue decreased by 1.5% due to depreciation in USD and Emerging market currencies
Page 9
102 4
Currency effectReported revenue Q2
2019/20
Organic growth (constant
currencies)
Acquired growth*
-175
Reported revenue Q2
2020/21
4,823
4,753
Growth -1.5%2.1%
Revenue development (DKKm) Comments
-3.7%0.1%
*Includes the acquisitions of two US Durable Medical Equipment (DME) dealers in Q2 2020/21

• Q2 gross margin was 68%, on par with Q2 last year
• Positive impact from Global Operations Plan 4 and 5, offset by negative impact from salary inflation and labor shortages in Hungary, as well as extraordinary costs related to COVID-19 and scaling up of activities in Costa Rica
• Positive impact from mix and leverage effect
• Negative impact of 20 bps from FX on gross margin
• Distribution-to-sales at 28%, on par with Q2 last year
• Distribution costs decreased by 2% or DKK 30m against last year reflecting continued lower travel and sales & marketing expenses due to COVID-19
• Continued commercial investments in Asia, Interventional Urology and digital initiatives
• Admin-to-sales cost were 4%, on par with last year, however lower in absolute terms mainly due to timing of legal expenses
• R&D costs were 4% of sales, on par with comparison period
• EBIT before special items increased 2% to DKK 1,577 with a reported margin of 33%, an increase of 120 bps vs. Q2 last year (negative impact of 40 bps from FX)
EBIT margin of 33% in Q2 driven by lower travel & marketing spend due to COVID-19 somewhat offset by commercial investments
EBIT margin Q2 20/21 (Constant
Currencies)1)
33.2
Reported EBIT
margin Q2 19/20
∆ Gross margin
0.6
0.40.2
∆ Other operating
items
∆ R&D-to-sales
Reported EBIT
margin Q2 20/211)
Currency effect
0.0
∆ Admin-to-sales
0.4
∆ Distribution-
to-sales
32.0
33.6
0.0
Page 10
EBIT margin development (%) Comments
1) Before special items of DKK 200m related to the existing lawsuits in the US alleging injury resulting from the use of transvaginal surgical mesh products

FCF driven by solid underlying development in earnings
Page 11
• Free cash flow in H1 2020/21 was DKK 446m compared to DKK 1,181m in H1 2019/20
• Adjusting for acquisitions, mainly Nine Continents Medical, the free cash flow in H1 was DKK 1,455m, up 23% vs. comparison period
• Operating cash flow in H1 2020/21 was up 19% to DKK 1,959m compared to DKK 1,641m last year, positively impacted by higher reported operating profit and a decrease in income tax paid
• Reported EBIT before special items DKK 99m higher than H1 19/20
• NWC-to-sales of 25% for H1 2020/21. NWC-to-sales for FY 2020/21 is expected to be around 24%
• CAPEX-to-sales of 5%, on par with 19/20
• The increase in CAPEX was linked to investments in automation, IT and the new factory in Costa Rica
1) FCF in 2015/16 and 2018/19 adjusted for Mesh payments. FCF in 2016/17 and 2017/18 adjusted for Mesh payments and acquisitions. FCF in 2020/21 adjusted for acquisitions (mostly Nine Continents Medical) and Mesh payments of DKK 200m2) Cash Conversion calculated as FCF ex. Mesh payments, interest payments, tax payments, M&A and marketable securities relative to EBIT before special items. Cash Conversion is trailing twelve months
27 26 25 23 21
15
9398 99 98
90 90
YTD 20/21
4,023 4,079
15/16
4,058
16/17 17/18
4,086
1,455
18/19
3,858
19/20
FCF (DKKm)(1) Cash Conversion(2) FCF-to-Sales (%)
FCF development CommentsFCF development Comments

Breakthrough achieved on waste recycling resulting in 58% of production waste recycled vs. 50% 2025 target
Page 12
Key highlights of our Sustainability strategy and performance in H1 2020/211)
Improving products and packaging
Breakthrough in Hungary on waste recycling, resulting in 58% of the production waste being recycled
Commitment to ambitious science-based climate action for a 1.5°C future
Employee safety and org. health a key priority during COVID-19
Reducing emissions Responsible operations
2025 ambition exceeded in 2021. New target will be formulated and announced in connection to our full-year results
• Breakthrough achieved through a circularity waste pilot
• The waste is shredded and bundled to be recycled into rubber flooring for kindergartens and training courts
• Official supporter of the Task Force on Climate-Related Financial Disclosures (TCFD)
• Targets to reduce emissions from raw materials use to be set during 2021 in collaboration with suppliers2)
• Employee engagement survey conducted in April with 88% participation rate
• Engagement score of 8.2 against a benchmark of 7.9 (Healthcare industry benchmark)
• Score improved compared to November 2020
By the end of 20/21, Coloplast will submit emission reduction targets through the Science Based Targets initiative
Lost-time injury rate3)
declined in H1 2020/21 compared to 2019/20, reflects a large share of the sales organization working from home
1) Numbers will be audited in connection to the FY 20/21 results
2) Represent 50% of Coloplast’s total emissions
3) Number of injuries resulting in absence from work of more than eight hours per one million
working hours
FY 2019/20
58%
H1 2020/21
41%
2025 ambition
50%
2025 ambition
FY 2019/20
2.0
H1 2020/21
2.5
2.1

Organic growth guidance for FY 2020/21 unchanged at 7-8%, EBIT margin guidance raised to 32-33% before special items
*DKK guidance is based on spot rates as of May 5th 2021
GUIDANCE 2020/21 GUIDANCE 2020/21 (DKK)*
7-8%(organic)
4-5%
32-33% before special items
31-32%after special items
~1.1bn
~23%
KEY ASSUMPTIONS
• Double-digit growth in the second half of 2020/21• Resumption of elective procedures and hospital activity across business areas as
vaccines are rolled out• No current knowledge of significant health care reforms• Stable supply and distribution of products across the company
• Leverage effect on fixed costs e.g. distribution, admin and R&D costs• Global Operations Plan 4 (savings of 50bps) and GOP5 partly offset by negative impact
from wage inflation and labour shortages in Hungary and ramp-up costs in Costa Rica• Incremental investments of up to 2% of revenue in Interventional Urology, Asia and
consumer & digital initiatives • Prudent approach to costs and lower travel & marketing spend due to COVID-19 • EBIT is impacted by a further provision of DKK 200m in special items related to the US
Mesh litigation
• Investments in automation initiatives at volume sites in Hungary and China as part of GOP5
• Establishment of new volume site in Costa Rica • Investments in new machines for existing and new products• IT investments
• Reduction of around 0.5%-point due to a temporary increase in the tax-deductible value of R&D expenses in Denmark, offset in 2020/21 by one-time expense related to the inclusion of Nine Continents Medical in Coloplast’s global tax model
TAX RATE
CAPEX (DKKm)
EBIT MARGIN
SALES GROWTH
Page 13

Making it easierto be yourself
LEADING INTIMATE HEALTHCAREIntroduction to Coloplast
Stina

Ostomy Care40%
Continence Care37%
Interventional Urology
10%Wound & Skin Care13%
Coloplast has four business areas all with global sales presence
Group revenue 2019/20 by geography
Page 15
Group revenue 2019/20 by segment
DKK18.5bn
= Coloplast’s global market positionX
1
1
4
5
European markets
58%Other developed
markets25%
Emerging markets
17%
DKK18.5bn

Coloplast specializes in intimate healthcare needs
Page 16
People who have had their intestine redirected to an opening in the abdominal wall
People in need of bladder or bowel management
People with dysfunctional urinary and reproductive systems
WHO ARE OUR TYPICAL USERS HOW DO WE HELP THEM?
SenSura® MioOstomy bag
SpeediCath®
Flexible male urinary catheter
Titan® OTRPenile implant
Biatain® SiliconeFoam wound dressing
Ostomy Care
Continence Care
Interventional Urology
Wound Care
People with difficult-to-heal wounds

The Chronic Care model secures a predictable revenue stream and stable revenue growth
Page 17
New user Installed base of users
One new patient per year… … secures ~10-30 years of predictable revenue stream
The chronic care user flowChronic Care condition
Stable flow of loyal users
Solid reimbursement
Coloplast group revenues
Organic growth (%)Revenue (DKKbn)
03/04 19/20
10
8 8
10
76
76 6
7
9
7 7 78 8
4
6.1
18.5

Page 18
Intimate healthcare is characterized by stable industry trends
01. Demographics
Growing elderly population increases customer base for Coloplast products
01. Surgical and medical trendsEarlier detection and cure, eventually reduces addressable market for Coloplast treatment products
02. Emerging markets
Expanding healthcare coverage for populations in emerging markets increases addressable market
02. Healthcare reforms
Economic restraints drive reimbursement reforms, introduction of tenders, and lower treatment cost
Dri
vers
Lim
ite
rs
Coloplast addressable market growth is 4-5%*
Brian
*Excluding any COVID-19 impact

Coloplast has strong market positions in Europe and great commercial potential outside Europe
Page 19
Ostomy Continence Urology Wound Care
Addressablemarket
Size in DKKGrowth in %*
Coloplast regional market shares
Key competitors
Key drivers and limiters
18 - 19bn4 - 5%
14 - 15bn5 - 6%
11 - 12bn3 - 5%
22 - 24bn2 - 4%
40 - 50%15 - 25%45 - 55%
45 - 55%25 - 35%35 - 45%
20 - 25%15 - 20%5 - 10%
5 - 10%0 - 5%
5 - 10%
35 - 40% 40 - 45% ~15% 5 - 10%
• Ageing population• Increasing access to healthcare• Health care reforms• Re-use of products outside
Europe
• Ageing population• IC penetration potential• Up-selling• Health care reforms• Commoditization
• Ageing, obesity• Underpenetration• Cost consciousness• Clinical requirements• Less invasive/office
procedures
• Ageing, obesity, diabetes• New technologies• Healthcare reforms• Competition• Community treatment
EuropeDevelopedEmerging
Coloplast total market share
*Excluding any COVID-19 impact

We are building the consumer healthcare company of the future
Page 20
COMMERCIAL MODELMACRO TRENDS IMPACT
Consumer preference
Superior, clinicallydifferentiated
products
Clinicalpreference
Payer preference
Data anddigital tools
Ageing population
Channel consolidation
Healthcare consumerism
Digital transformation
Price pressure

Page 21
Our new strategy will drive continued long-term value creation through revenue and earnings growth
Chronic Care
Interventional Urology
Wound & Skin Care
Talent, Leadership &
Culture
SustainabilityUnparalleled efficiency
Innovation
7-9% organic growth p.a.
more than 30% EBIT margin1
1) Constant currencies, based on FX rate as of September 29, 2020

Supporting sustainable development with a strong emphasis on improving our environmental performance
Stina
0 emissions from scope 1&2100% renewable energy
Our mission
Making life easier for people with intimate healthcare needs
Our 2025 priority
Improving products andpackaging
Our 2025 priority
Reducing emissions
80% packaging made from renewable materials50% production waste recycled
1) of which DKK 100 million in capex and DKK 150 million in operating expenses
DKK 250 million1 in investments allocated to sustainability efforts during
Strive25 period
Our on-going commitment
Responsible operations

We will continue to support organic growth by yearly incremental investments of up to 2% of revenue
Page 23
Economics & Government
MarketAttractiveness
Leadership & Organization
CaseFinancials
We expect to invest up to 2%of revenue in incremental OPEX investmentsInnovation
Consumer & Digital
Interventional Urology
Sustainability
Chronic Care
USA
Emerging markets incl. China
Time horizon
Key Investment Decision Drivers Key Investment Areas

We will actively pursue M&A opportunities as a lever for long-term growth
Page 24
Portfolio expansion & adjacencies
Early stage technologies
Channel expansion
Large plays
Opportunitybased
Systematic screening

Page 25
Consumerpreference
Superior, clinicallydifferentiated
products
Clinicalpreference
Payer preference
Data and digital toolsDirect to Consumer
Direct Businesses
Coloplast Consumer Care
We have built key enablers to support the commercial model in our Chronic Care businesses
Data & Digital tools
KEY ENABLERSCOMMERCIAL MODEL

Direct business in Chronic Care serving consumers drives improved outcomes and is a vital component of our growth
Page 26
Control and continuity of product supply
1
2
3
4
Improve patient outcomes
Direct access to consumers
Direct relationship with payers
5
Protect patient pathway
Target the full value pool
6
Size of database 1.8M
# of calls per year 3M
# of samples sent, ‘000 ~750
+30 countrieswith a consumer setup
High single digit growth
rates
MO/TMall
~70% MS~15% MS
~15% MS ~5% MS~30% MS
Coloplast Care presenceDirect presence in top 5 markets and strategic rationale

We have initiated a very ambitious Clinical Performance Program to tackle the biggest issues users face
93worry about leakage2
%
30of users experience skin irritation at least weekly3
%2.7UTIs per user on average every year1
45of users describe UTIs are their
greatest challenge in life1
%*
* People answering ‘not being able to walk: 22%’, ‘not be able to travel: 9% ‘
1) Source: Coloplast IC user survey, January 2016 (n=2,942), (Data-on-file) VV-0122794 2) Source: Ostomy Life Study 2016, ECET Coloplast Pre-Event (n=4,235), (Data-on-file) VV-01916193) Source: OC Usage Pattern Study 2015, (Data-on-file) VV-0147638
WHAT REALLY MATTERS TO PEOPLE USING CATHETERS?
Coloplast Group - Ostomy Care / Continence Care / Wound & Skin Care / Interventional Urology Page 27

We have made significant progress across the Clinical Performance Program
Page 28
Pilot studies conducted with successful results
Initial pilot studies indicated positive outcomes
Pivotal study showed non-significant results
Pilot studies conducted with successful results
Additional pilot study to further test the technology in broader setup
Payer pilots to be conducted for reimbursement processes in key markets
Product device design to be optimised
New pilot study to be completed
Pivotal study to be completed
Further pilot studies in progress
Pivotal study to be completed
Digital ostomy solution
New ostomy platform
New catheter platform
Strive25 strategy period ends in 2025Progress as of today
✓
✓
✓
Product launch expected in first half of strategy
period
Product launch expected in first half of strategy
period
Product launch expected in
second half of strategy period
Simultaneously, continue our launch cadence into existing categories within ostomy care and continence care

19/2016/17 YTD 20/2118/1917/18 Long-term
68.1 67.767.3 68.0 68.0
- 0.1%-points
Profitability supported by scalability and efficiency gains enabling additional investments within distribution and R&D
Page 29
Distribution
Admin
R&D
28.7 28.728.1 29.0 27.8 28-30
+0.6%-points
4.0 3.84.0 4.2 4.1 ~4
+0.1%-points
3.8
16/17 YTD 20/21
18/1917/18 19/20
3.8
Long-term
3.5 3.9 3.9 ~4
+0.3%-points
Gross Profit development, % Development, in % of revenueCost item

Automation, procurement and scale are key to bringing Global Operations to the next level
1. Automation to mitigate growth in blue-collar FTE
2. Continuously work with procurement costs and supply risk mitigation
3. Efficiency and scale on global functions
1) FY 2019/20 Cost of goods sold, DKK 5,932m
Page 30
10%
52%
100%
Salary1 (Direct labour)
Materials1 (RM & SFG)
Production costs1
• Expand supplier base• Reduce risk of supply
disruptions• Increase competitive pressure
• Implement new materials• Run sourcing tenders
~500
19/20
>1,000
20/21 21/22
~200
22/23
~800
# of FTE releasethrough automation
DKK ~450mCAPEX investment over four years (19/20 – 22/23)
• Keeping FTEs stable, while increasing production output
0%
Global functions Volume output
Costs levels to remain at current levels
Like–for-like material costs
DKK
time
0%

A global Business Support and IT landscape enables Coloplast to scale faster and more efficiently
Page 31
Source: Coloplast
IT infrastructure & support
Sales order taking / management
Finance / accounting Master Data
Lead handling(DTC/Coloplast Care) HR support
~90%
100%
100%
100%~70%
100%
Sales subsidiary(Portugal)
New manufacturing(Costa Rica)
M&A/Direct
% of group processes
Global IT landscape (ERP,
CRM etc.)
Global IT infrastructure
Global Business Support Centre
Global Business Services Global business services handle the majority of all global support
Examples of current implementation cases

EBIT margin development continues to be a function of growth, scalability, cost discipline and investment activity
Page 32
1) Constant exchange rates
∆ Gross margin EBIT margin FY 24/251
Reported EBIT margin FY 19/20
Leverage effect/scale
on fixed costs
Incremental investments
~31%
Incremental investment of up to 2% of revenue per year
ILLUSTRATIVE
>30%
EBIT will be positively impacted by:
Leverage effect on fixed costs e.g. distribution, admin and R&D costs especially driven by Europe
EBIT will be negatively impacted by:
Investments in P/L (Commercial & R&D)
EBIT margin (%) Future drivers of EBIT margin

Continued strong development in free cash flow during the Strive25 strategy period
Page 33
CAPEX DKKm
CAPEX in % of revenue
Depreciation in % of revenueNet working capital in % revenue
Net working capital CAPEX(2)
Reported tax rate
Taxation
1) Impacted by provision for Mesh litigation2) Gross investments in PPE & intangibles, excluding acquisitions
23% 23% 23% 23% 24%
Long term
16/17 18/19117/18 19/20
~23%
YTD 20/21
23%
17/18
23%
19/2018/1916/17
23% 24%25%
YTD 20/21
~24%
Long term
685 669 636931
509
4%
16/17
4%
17/18
5%
4%4%
YTD 20/21
4%
4%
18/19
5%
4%5%
19/20
4%
6%
Long term
• DK statutory corporate tax rate lowered to 22% in 2016
• Reduction of around 0.5%-point in 20/21 and 21/22 due to Danish tax reductions for R&D
• YTD 20/21 tax rate impacted by one-time expense related to the inclusion of Nine Continents Medical in Coloplast’s global tax model
• Coloplast tax rate expected to be ~23% for the Strive25 strategy period
• Net working capital expected to be stable, impacted by:
o Growth in mature markets
o Growth in Emerging markets which have long credit times
o Increasing inventory levels on strategic products and raw materials
• YTD 20/21 NWC-to-sales impacted by an increase in trade receivables
• NWC-to-sales for FY20/21 expected at ~24%
• Continued investment in machines and capacity expansion
• Widen factory footprint – the first volume site in Costa Rica became operational in Q2 20/21. Second volume site in Costa Rica under way and scheduled to open by the end of 21/22
• GOP5 investments – focus on Automation
• IT investments
• Sustainability investments
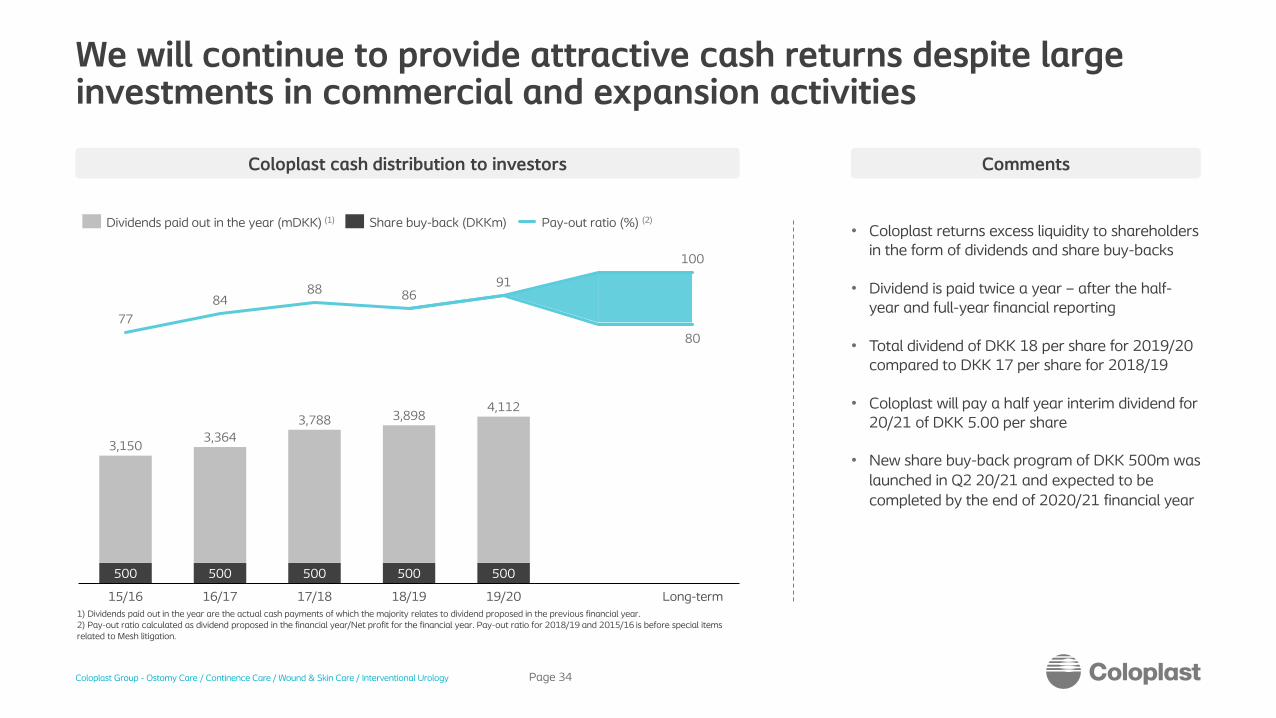
We will continue to provide attractive cash returns despite large investments in commercial and expansion activities
500 500 500 500 500
77
8488 86
80
91
100
0
3,150
15/16 18/1916/17
3,788
17/18 19/20 Long-term
3,364
3,8984,112
Dividends paid out in the year (mDKK) (1) Pay-out ratio (%) (2)Share buy-back (DKKm)
1) Dividends paid out in the year are the actual cash payments of which the majority relates to dividend proposed in the previous financial year. 2) Pay-out ratio calculated as dividend proposed in the financial year/Net profit for the financial year. Pay-out ratio for 2018/19 and 2015/16 is before special items related to Mesh litigation.
Page 34
Coloplast cash distribution to investors Comments
• Coloplast returns excess liquidity to shareholders in the form of dividends and share buy-backs
• Dividend is paid twice a year – after the half-year and full-year financial reporting
• Total dividend of DKK 18 per share for 2019/20 compared to DKK 17 per share for 2018/19
• Coloplast will pay a half year interim dividend for 20/21 of DKK 5.00 per share
• New share buy-back program of DKK 500m was launched in Q2 20/21 and expected to be completed by the end of 2020/21 financial year

In sum, we believe Coloplast can continue to deliver stable shareholder returns through ...
Page 35
• Stable market trends in our
Chronic Care business
• Strong Coloplast Care retention program
and innovative DtC activities
• Increased focus on growing the business
outside Europe
• Additional improvements in manufacturing
by leveraging on global operations footprint
• European leverage will provide funds for further
investments in sales initiatives
• Resulting in strong free cash flow generation
and high return on invested capital
16/17
10%
12/13
9%
14/1508/0906/07 10/11 18/19
4%
33%
YTD 20/21
Organic growth EBIT Margin²)
1) FCF adjusted for Mesh payments in 2013/14, 2014/15, 2015/16, 2016/17, 2017/18, 2018/19, 2020/21 and acquisitions in 2016/17, 2017/18 and 2020/21. Adjustment for Mesh payments includes DKK 500m insurance coverage in 2013/14 and 2014/15 combined. Free cash flow adjusted for DKK 950m acquisition of Nine Continents Medical in Nov 20202) Before special items. Special items 2013/14 include DKK 1bn net provision. Special items 2014/15 include DKK 3bn provision. Special items 2015/16 include DKK 0.75bn provision. Special items 2018/19 include DKK 0.4bn provision. Special items YTD 2020/21 include DKK 0.2bn provision.
Comments
06/07
15%
5%
6%
08/09 12/1310/11 14/15 16/17 18/19
43%
YTD 20/21
FCF to sales1) ROIC after tax2)
Organic growth and EBIT margin development
FCF and ROIC development

Leading intimate healthcare
LEADING INTIMATE HEALTHCAREAppendices
Tabitha

The Coloplast share (COLO-B.CO)
Coloplast share listed on Nasdaq Copenhagen since 1983
~204 billion DKK (~33 billion USD) market cap @ ~1,020 DKK per share (incl. A shares)
Two share classes:
• 18m A shares carry 10 votes (family)
• 198m B shares carry 1 vote (freely traded)
• Free float approx. 54% (B shares)
Page 37
Note: Share capital ownership as per September 20201) Holders of A shares and family hold 68% of the votes in Coloplast
Share Capital Ownership
45%
37%
6%
10%
2%
Holders of A shares and family1
Coloplast A/S
Foreign institutionals
Danish institutions
Other shareholders

Capital structure
• Overall policy is that excess liquidity is returned to shareholders through a combination of dividends and share buy-backs
• Interest bearing debt will be raised in connection with a major acquisition or other special purposes
• Share buy-backs of DKK 500m per year
expected
• Bi-annual dividends
• Increase YTD 20/21 in Net interest bearing debt (NIBD) primarily driven by the acquisition of Nine Continents Medical and dividends
• FY 20/21 NIBD expected to be around DKK 2bn
Page 38
Comments Net interest bearing debt
1) Before special items. Special items Q4 2018/19 includes 0.4bn provision related to US Mesh litigation.
826 754539
0.1x0.1x0.1x
16/17 18/1917/18
0.2x3,450
19/20
1.0x
YTD 20/21
1,162
NIBD (DKKm)NIBD/EBITDA(1)

H1 driven by solid OC growth in Emerging markets, offset by stocking building and COVID-19 impact in Europe
Page 39
Other developed markets
Emerging markets
Coloplast Group
European markets
Reported revenue H1DKKm
Organic growthH1
Geographicarea
0%
6%
15%
4%
Continence Care
Interventional Urology
Wound & Skin Care
Ostomy Care
ColoplastGroup
5%
3%
4%
1%
4%
Reported revenue H1DKKm
Organic growth H1
1,168
1,031
3,868
3,424
1,669
5,505
2,317
9,4919,491
H1 20/21 revenue by business area H1 20/21 revenue by geography
Business area
4%
0%
3%
1%
2%
Organic growth Q2
Organic growthQ2
-2%
5%
14%
2%

• H1 2020/21 reported revenue decreased by DKK 44m compared to H1 2019/20
• H1 organic growth was 4% or DKK 342m
• Main drivers of H1 performance
• European Chronic Care business negatively impacted by DKK 150m stock building in Q2 last year, as well as continued negative impact from lower growth in new
patients, in particular in the UK, due to COVID-19
• Solid growth in Emerging markets within Ostomy Care led by China and LATAM
• Resumption in elective procedures in Interventional Urology driven by Men’s Health in US
• Wound Care in isolation also contributed to growth in H1, driven by Europe, China and the recently launched BiatainFiber® portfolio
• Foreign exchange rates had a negative impact of DKK 389m or -4.1% on reported revenue primarily due to negative development of the USD, GBP and Emerging markets currencies against the Danish kroner
H1 2020/21 reported revenue declined by 0.5%, due to depreciation in USD, GBP and Emerging market currencies
Page 40
342
Reported revenue H1 2019/20
Organic growth (constant
currencies)
Acquired growth*
4 -389
Currency effect Reported revenue H1 2020/21
9,535 9,491
H1 Revenue development (DKKm) Comments
Growth -0.5%3.6% -4.1%0.0%
*Includes the acquisitions of two US Durable Medical Equipment (DME) dealers in Q2 FY 20/21

• H1 gross margin was 68%, on par with last year
• Positive impact on the gross margin from Global Operations Plan 4 and 5, partly offset by wage inflation and labor shortages in Hungary and extraordinary costs related to COVID-19 safety measures
• Negative FX impact on gross margin of 40 bps
• Distribution-to-sales at 28% vs. 29% in H1 last year
• Distribution costs decreased by 5% or DKK 135m against last year reflecting lower travel and sales & marketing expenses due to COVID-19.
• Commercial investments in selected regions and areas, such as Asia, Interventional Urology and consumer & digital intiatives
• R&D costs were 4% of sales, on par with comparison period
• EBIT before special items increased 3% to DKK 3,113m with a
reported margin of 33%, an increase of 120 bps vs. H1 last year (negative impact of 70 bps from FX)
H1 reported EBIT margin of 33% driven by lower commercial spending due to COVID-19
Page 41
H1 EBIT margin development (%) Comments
-0.1
Currency effect
EBIT margin Q2 20/21 (constant
currencies)1)
Reported EBIT
margin H1 19/20
0.1
∆ Gross margin
∆ Other operating
items
Reported EBIT
margin H1 20/211)
32.8
∆ Admin-to-sales
0.1
33.5
∆ Distribution-
to-sales
31.6
0.7
∆ R&D-to-sales
1.3
-0.1
1) Before special items of DKK 200m related to the existing lawsuits in the US alleging injury resulting from the use of transvaginal surgical mesh products

Key Value Ratios
Page 42
1) Before special items. Special items Q4 2018/19 include 0.4bn provision for Mesh litigation, and Q2 2020/21 include DKK 0.2bn for Mesh litigations 2) Gross CAPEX including investment in intangible assets
3.93.7
32.031.9
3.8
4.0
28.1
16/17
4.0
3.9
YTD 20/21
32.7
28.7
17/18 18/19
4.2
3.8
32.3
29.0
4.1
28.7
19/20
3.8
32.0
27.8
R&D-to-Sales (%)Admin-to-Sales (%)
COGS-to-Sales (%) Dist-to-Sales (%)
25.2
4.4
36.3
17/18
23.4
16/17
4.1
18/19
34.7
23.6
3.5
34.6
23.4
36.2
19/20
25.4
5.4
36.9
YTD 20/21
5.0
NWC-to-Sales (%)
CAPEX-to-Sales (%)(2)
EBITDA margin (%) (1)
Profitability drivers Free Cash Flow drivers

Coloplast revenue development by business area
Page 43
8
5
9
67
Organic growth (%)Reported growth (%)Revenue (DKKm)
1) Excluding one-off revenue adjustment related to incorrect management of a contract with U.S Veterans Affairs
67
6 57
6
8
1
19/20
6,643
59
6,2917,166
3,868
7,538
16/17 17/18 18/19 YTD 20/21
Ostomy Care Interventional Urology
Continence Care Wound & Skin Care
10
10
104
1013
-1
YTD 20/2119/2016/17
1,970
6
-7
17/18 18/19
-71,641 1,740 1,835
1,031
7
8
3
7 7
6
-1
9
19/2016/17(1)
6
18/19
8
17/18 YTD 20/21
5,543 5,9266,459 6,819
3,424
38
1
14
0
10
0
-3
16/17 17/18 18/19 YTD 20/2119/20
2,143 2,140 2,344 2,3521,168

Coloplast revenue development by geography and total
Page 44
6 6 2 05
-2
52
16/17
6
17/18 18/19 19/20
2
YTD 20/21
9,394 9,941 10,573 10,820
5,505
15 1611
5 6
19/20
4
17/18
2,317
8
16/17(1)
11
18/19
6 -1
YTD 20/21
3,642 3,791 4,380 4,644
135
35
13 1412
8
15
10
16/17
2,582
17/18
2,717
18/19 19/20 YTD 20/21
2,986 3,0801,669
Organic growth (%)Reported growth (%)Revenue (DKKm)
1) Excluding one-off revenue adjustment related to incorrect management of a contract with U.S Veterans Affairs
6 6
9
0
7 8
8
4 4
16/17
15,528
19/2017/18 18/19 YTD 20/21
3
16,449 17,939 18,544
9,491
Europe Other Developed Markets
Emerging Markets Coloplast group

Segment operating profit (Excludes shared/non-allocated costs)
Page 45
Ostomy and Continence Care
1) Includes DKK 90m one-off revenue adjustment related to incorrect management of a contract with U.S. Veterans Affairs
59 59 57 60 60
Q2 20/21Q2 19/20
2,168
Q3 19/20
2,092
Q4 19/20 Q1 20/21
2,0112,193 2,200
Segment Operating Profit Margin (%)Segment Operating Profit DKKm
179
79
199
244
214
35 25 41 46 43
Q3 19/20Q2 19/20 Q4 19/20 Q1 20/21 Q2 20/21
248230 238 239 252
40 41 4042 42
Q3 19/20Q2 19/20 Q4 19/20 Q1 20/21 Q2 20/21
60 58 57 58 60
FY 19/20FY 18/19FY 16/17
7,3447,798
FY 17/18 YTD 20/21
6,991
4,393
8,318
624 653728
654
458
38 38 37 36
44
YTD 20/21FY 17/18FY 16/17 FY 18/19 FY 19/20
822 826914 941
491
38 39 39 4042
FY 18/19FY 16/17 FY 17/18 FY 19/20 YTD 20/21(1)
Chronic Care Interventional Urology Wound & Skin Care

Exchange rate exposure FY 2020/21 and hedging policy
Page 46
Foreign exchange rate guidance for 2020/21
-410
-280
-170
-190
100HUF
USD
GBP
0
Revenue (DKKm) EBIT (DKKm)
12 months exposure from 10% initial exchange rate drop(1)
36%
20%
14%
13%
17%
USD
EUR
GBP
CNY, JPY, AUD, BRL & ARS
Other
Revenue FX exposure 2020/21(1)
To achieve the objective of a stabile income statement we hedge:
• Key currencies e.g., USD, GBP, HUF using forward contacts and options. Not EUR.
• On average 10-12 months• Selected balance sheet items in
foreign currency and part of the expected rolling 12-month cash flows
• Taking risk. vs. cost of hedging into consideration
Hedging Policy
1) Average exchange rate from 1 October 2019 to 30 September 20202) The exchange rates for ARS are the exchange rates are closing rates for the period. The hyperinflationary economy in Argentina entails that revenue denominated in Argentinian Peso must be adjusted for inflation and be translated at the exchange rate of the balance sheet day (closing rate)3) Estimated average exchange rate is calculated as the average exchange rate year to date combined with the spot rates at 5 May 2021.
CurrencyAverage exchange rate
2019/20(1) Spot rate, 5 May 2021
Estimated average
exchange rate 2020/21(3)
Change in estimated
average exchange rate
compared with last year
Average exchange rate
for H1 2019/20
Average exchange rate
for H1 2020/21
Change in average
exchange rates for H1
compared with same
period last year
Key currencies:
USD 667 619.95 620 -7% 676 621 -8%
GBP 850 861.38 849 0% 868 838 -3%
HUF 2.17 2.07 2.07 -5% 2.23 2.06 -8%
Other selected currencies:
CNY 95 95.74 95 0% 96 95 -2%
J PY 6.18 5.67 5.79 -6% 6.21 5.90 -5%
AUD 452 478.49 472 4% 454 466 3%
BRL 141 113.90 114 -19% 159 114 -28%
ARS(2)
8.34 6.61 6.61 -21% 10.55 6.89 -35%

US Mesh litigation – Overview of financial impact
Page 47
P&L Balance Cash flowAssets
Liabilities
• Insurance coverage of DKK 500m received in 2013/14 and 2014/15
Restricted cash, DKKbn
Total liability, DKKbn
Actual/Expected cash flow, DKKbn
1.2
0.7
14/15 19/20
3.3
18/19
2.4
15/16
1.10.4 0.3
16/17
0.2
17/18
0.10.30.5 0.1 0.10.4
20/21
Other payables Provision
17/18
0.1
19/2014/15 15/16 20/2116/17 18/19
0.5
0.0
0.5
0.0 0.0 0.0
0.30.50.5
16/1713/14 14/15
1.81.6
15/16 17/18
0.4
18/19
0.2
19/20
0.2
20/21
0.2
21/22
0.1
22/23
• A total of DKK 5,850m (DKK 5,350 net of insurance coverage) has been provisioned and is considered sufficient
• Currently around 97% of known cases against Coloplast have been resolved
13/14 14/15 15/16 16/17 17/18 18/19 19/20 20/21
EBIT (before special items) 4,147 4,535 4,846 5,024 5,091 5,556 5,854 3,113
Special items -1,000 -3,000 - 750 0 0 -400 - -200
EBIT 3,147 1,535 4,096 5,024 5,091 5,156 5,854 2,913
EBIT % (before special items) 33 33 33 32 31 31 32 33
EBIT % 25 11 28 32 31 29 32 31

Page 48
Stable global health reforms environment
• U.S.: Reimbursement pressure on OC and CC (Managed Care)
Reimbursement pressure
Europe
• Netherlands: Reimbursement pressure on OC and CC
• France: Reimbursement pressure on WC
Rest of World

CARE helps us increase retention and improve product compliance
Website with reliable advice and useful self assessment tools 24/7
Page 49
- ERP
- CRM
- CMS
Clinically validated content and call protocol
Data shared with clinicians
Self-assessments to identify struggling users
News, tips and inspiration directly in email or mailbox
Advisors available on phone
Free product and supporting products
samples
We co-develop CARE content with local clinicians
CARE is a personal and “high-touch” program
Global program with shared infrastructure

With our DtC marketing program we reach into the community
Page 50
…and with the reach we get several benefits We operate in numerous channels to expose our service and product offering…
Ensureproduct accessibility
Ensure successful experience
Exposeinnovative products
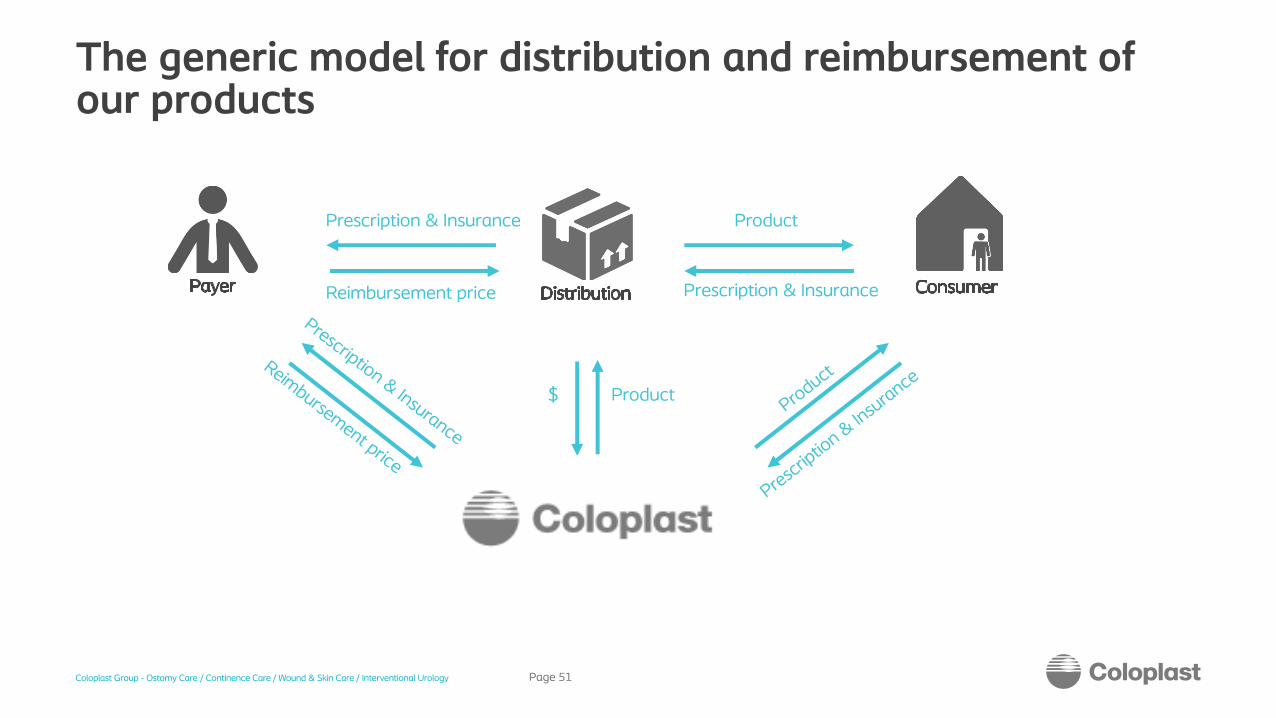
The generic model for distribution and reimbursement of our products
Page 51
Product
Prescription & Insurance
Prescription & Insurance
Reimbursement price
Product$

Interventional Urology at a GlanceFY 18/19
Interventional Urology
Rest of Coloplast business
11%of Coloplast sales
~2billion DKKannual sales
Endourology
Women’s Health
North America Europe
Rest of World
Revenue by Business AreaDKKm, FY 18/19
Revenue by regionDKKm, FY 18/19
Men’s Health
Bladder Health
Organic revenue growth vs. market growth by business areaOrganic growth, % 18/19
Endourology Bladder Women’s HealthMen’s Health
~15% market share in global market of DKK 12-13bn market
growing 3-5% annually
Market1 Coloplast
Men’s Health Women’s HealthEndourology Bladder Health
#2 #3#2
In EU#2
In EU
Market size, DKKbn~5
~3~2 ~3
Coloplast position, FY 18/19
Interventional Urology’s revenue is balanced geographically and across the four business areas
Page 52

• Bladder Drainage
• Benign prostatic hyperplasia (BPH) management
• Laparoscopic Procedures
• Stress Urinary Incontinence (SUI)
• Pelvic Organ Prolapse (POP)
• Erectile Dysfunction
• Male Incontinence
• Testicular Replacement
• Peyronie's Repair
• Stone Management
• Transurethral
• Percutaneous
SPECIALTY INTERVENTIONS
WOMEN’SHEALTH
MEN’SHEALTH
ENDOUROLOGY
Coloplast Interventional Urology is split into four business areas
Page 53
Inflatable Penile Prosthesis
Testicular Prosthesis
Male Slings Slings Biologic grafts
Single Use Cystoscope
No-Tip for stone retrieval device
Double Loop Ureteral Stent
Prostate and bladder chips evacuator
Disposable suction / irrigation device
Foley catheter – Folysil
Surpapubic drainage –Cystodrain, Supraflow, Uristil
Se
lect
pro
du
cts
Source: Company information
Pericardium allograft tissue
Meshes

Inflatable Penile Prosthesis (IPP)
Male incontinence
35-45%
10-15%
35-45%
30-35%
15-20%
<5%
<5%
Men’s Health
Source: Company information; Note: 1 Select segments.
Stress urinary incontinence
Pelvic organ prolapse
We have a strong presence in our categories but there is room to capture market share
Women’s Health
Competitive Share
Coloplast Share
SignificantCompetitors
Endourology1 Bladder Health & Surgery1
Fragmented Competition
Page 54

Coloplast acquires Nine Continents Medical Inc, an early stage company in the large over-active bladder segment
Page 55
Over-active bladder market Company and product description
• Over-active bladder (OAB) is a condition that causes a frequent and sudden urge to urinate
• +80 million people globally suffer from OAB symptoms
• ~40% of the OAB patient population seek treatment and of those about 3 million patients globally are candidates for 3rd line therapies
• 3rd line therapies include Botox, Percutaneous Tibial Nerve Stimulation (PTNS), and Sacral Nerve Stimulation (SNS)
• Today, the market for 3rd line therapies is approx. USD 1bn in size growing mid-single digits
• ITNS (Implantable Tibial Nerve Stimulator) is an innovative 3rd therapy that provides neurostimulation for the treatment of OAB but is not in the market yet
• ITNS builds on the clinically proven mode of action of PTNS
• Nine Continents Medical Inc is an early stage company pioneering an implantable tibial nerve stimulation treatment for over-active bladder
• The device is an implantable tibial nerve stimulator (ITNS), a miniaturized, self-powered unit placed in the lower leg under local anesthesia during a short, minimally invasive procedure
• The device automatically stimulates the tibial nerve, with no patient activation or recharging or doctor visits
• Coloplast expects to begin pivotal studies in 2021, with the ambition to obtain pre-market approval for a Class III device in the US and EU market approvals in the 2024-2025 timeframe
• The acquisition price consists of a USD 145 million upfront cash payment and an additional contingent future milestone payment
• The acquisition is debt financed using existing credit facilities and has no impact on Coloplast’s dividend policy or long-term financial guidance
Source: Coloplast, clinical publications, industry reports
Transaction

The global Advanced Wound Care market remains large and growing despite a challenging 19/20
1) In 19/20, the AWC market declined by -0,5% and has an expected growth rate of 1-3% for 20/212) Includes Alginates & Gelling Fibers
Page 56
Europe
US
RoW
The Advanced Wound Care market remains a significant value pool and is expected to grow despite the pandemic
Source: SmartTRAK, GHX and Cosa
22-24 DKKbngrowing 1-3%1
Silicone Foams and Gelling Fibers are the two biggest categories and grow faster than the market
~45% of the market
Silicone Foams and Gelling Fibers hold
6-8(4-6%)
Others
Silicone Foams
2-4(2-4%)
Gelling Fibers 2
10-12(0-1%)
Market size in DKKbn
22-24 DKKbngrowing 1-3%1
Period analysed: MAT Q3 19/20

The Wound & Skin Care 2025 strategic plan
Page 57
Scale our China businessby strengthening our commercial foundation and accelerate in silicone with 3DFit Technology
Scale our US businessin Acute channel with 3DFit Technology and maximise potential Wound & Skin Care portfolio
Lead with 3DFit Technologythrough new marketing and portfolio initiatives
Launch new pipelineIncluding Biatain Fiber to close portfolio gaps and ensure strong lifecycle management
Build on positive momentum in EU in silicone and 3DFit Technology and increase share of voice in selected markets
Accelerate growth in key EM marketsby investing in specific local opportunities
Seek for accelerationby exploring inorganic opportunities
Margin upliftOptimise sales mix and product profitability
SUSTAINABLE
GROWTH
LEADERSHIP

In US Ostomy Care, innovation is the biggest growth driver and we continue to win across patient pathway
Page 58
We have gained significant share over the last years
Innovation is a key driver, and we will continue to expand our offering of high-quality products
Source: Coloplast
Meanwhile, we continue to drive our penetration and win share across OC patient pathway
Acute
3-5 days
Post-acute care
(incl. HHA)
>60 days
Patients
Community
~10 years
SenSura® Mio portfolio
Patients’ first OC products
80%-90% of acute patients go through
post-acute care
Leverage Direct-to-Consumer engine to
engage users in Community
Bags & Plates acute share
19/2014/15
+6%-pts
Brava® rings

• .
Coloplast has been awarded access to Vizient and Premier GPOs, ensuring a level playing field in ~75% of acute accounts
Page 59
Coloplast has been awarded access to Vizient and Premier, the two largest GPOs in the US
Source: Coloplast, GHX 1. Acute members can be part of more than one GPO2. Coloplast estimates based on primary GPO affiliation* Third party trademarks are the property of their respective owner(s)
Premier TM*
TM*
Health TrustTM*
Acute members1
EstimatedAcute share2
Contract start date
Contract length
Contract type
3,600 ~25% April 1, 2020 3 years Multisource
7,500 ~50% July 1, 2021 3 years Multisource
1,400 ~15% October 1, 2020 3 years Single source

• .
Page 60
As a manufacturer of medical products primarily made of plastic, we have a responsibility to contribute to solving the plastic waste problem, whilst maintaining the highest level of product safety.
Why is this a key priority:
• Redesign packaging for minimal material use and/or switching to bio-based and recycled material in packaging
• Increase waste recycling by using circularity pilots and ChemCycling
How will we achieve this?
As a growing company, we are challenged by a potential increase in our environmental footprint. We are rising to the challenge and setting an ambition of making our production carbon neutral by 2025.
Why is this a key priority:
• Renewable energy usage by switching to Power Purchase Agreements (PPAs) and phasing out natural gas
• Reducing business travel-relatedemissions by being prudent about air travel and converting company cars to electric vehicles
• Limiting the amount of goods transported by air
How will we achieve this?
Our people and culture are at the center of our Strive 25 strategy. Maintaining and developing a safe, inclusive and diverse working environment is key to delivering on our strategy.
Why is this a key priority:
• Reducing loss-time injury rate through job-specific training
• Increasing the % of diverse teams and female representation at VP+ level through natural turnover and senior leadership focus
• Engaged workforce above industry benchmark
How will we achieve this?
Sustainability - key priorities and actionsImproving products and packaging Reducing emissions Responsible operations

• .
H1 2020/21 progress on key sustainability ambitions1)
Page 61
Improving products and packaging Reducing emissions Responsible operations
80%70% 70%Renewable
material in packaging
90%75%75%
Recyclable packaging
Recycled production waste
58%50%
41%
Scope 1+2 emissions
Renewable energy usage
Limit goods transported by air
0%
6% 6%
67%
100%
67%
5%4%4%
Electric company cars
Air travel reduction2)
50%
1% 1%
-45%
-10%
-75%
White-collars trained in Code of Conduct
Loss-time injury rate
Female representation at VP+ level
% of Diverse teams
100% 98% 98%
2.0 2.12.5
24%30%
24%
75%
53% 51%
Employee engagement score3)
8.27.9 7.9
2025 Ambition
H1 20/21
FY 19/20
2025 Ambition
H1 20/21
FY 19/20
2025 Ambition
H1 20/21
FY 19/20
1) Relevant numbers will be audited in connection to the FY 20/21 results
2) Measures the reduction in CO2 air travel related emissions
3) Ambition is to be above industry benchmark, which is currently 7.9

• .
7%
6%
13%
10%
64%
Our 2025 priority: Reducing emissionsWe are committed to reducing emissions while being a growth company
Energy
Our greenhouse
gas emissions in 19/20
*19/20 Scope 1 + 2 emissions: 11,100 tonnes, Scope 3 emissions: 159,700 tonnes
0 Emissions from production
100% Renewable energy (PPAs and phase out
natural gas use)
5% Limit on goods transported by air
50% of company cars are electric
10% Reduction in air travels compared to 18/19 level
Target to reduce emissions among suppliers to be set during 2021
2025 target – Scope 1+2
Business travel
Raw materials
Transport of goods
Other
2025 target – Scope 3
Page 62

Introducing Ostomy Care
Page 63
• Colorectal cancer (est. 45%)• Bladder cancer (est. 10%)• Diverticulitis (est. 15%)• Inflammatory bowel disease (est. 10%)• Other (est. 20%)
• Nurses, mainly stoma care nurses
• People with a stoma• Wholesalers/distribution• Hospital purchasers and GPOs• Surgeons
• Hospital & community nurses
• Hospital buyers• Distributors• Dealers• Wholesalers• Homecare companies
Distribution of revenues*
*Excluding baseplates and supporting products
Key products
Assura® new generation Launched in 1998
Alterna® original Launched in 1991
SenSura®Launched in 2006-2008
SenSura® Mio Launched in 2014
Disease areas
Customer groups
Call points
SenSura® Mio ConvexLaunched in 2015
Urostomy
Ileostomy
Colostomy
SenSura® Mio ConcaveTo be launched in 2018-2019

Introducing Ostomy Care Supporting Products
Page 64
• Nurses, mainly stoma care nurses• People with a stoma• Wholesalers/distributors• Hospital purchasers and GPOs• Surgeons
• Market size of DKK ~3bn• Market growth of 6-8%• Market share 35-40%• Main competitors include: Hollister
Adapt, ConvaTec, 3M Cavilon, Eakin
Market fundamentals
Customer groups & call points
Market value by geography
Brava® is a range of ostomy supporting products
designed to reduce leakage or care for skin, to make
our end-users feel secure. The Brava® portfolio was
launched in 2012.
Brava® Elastic Tape• Elastic so it follows the
body and movements
Brava® Adhesive Remover• Sting free and skin friendly
Brava® Protective Seal• Designed for leakage
and skin protection
Brava® Skin Barrier• Reducing skin problems
without affecting adhesion
Brava® Lubricating Deodorant• Neutralizing odour
Key products
European markets
Other developed markets
Emerging markets
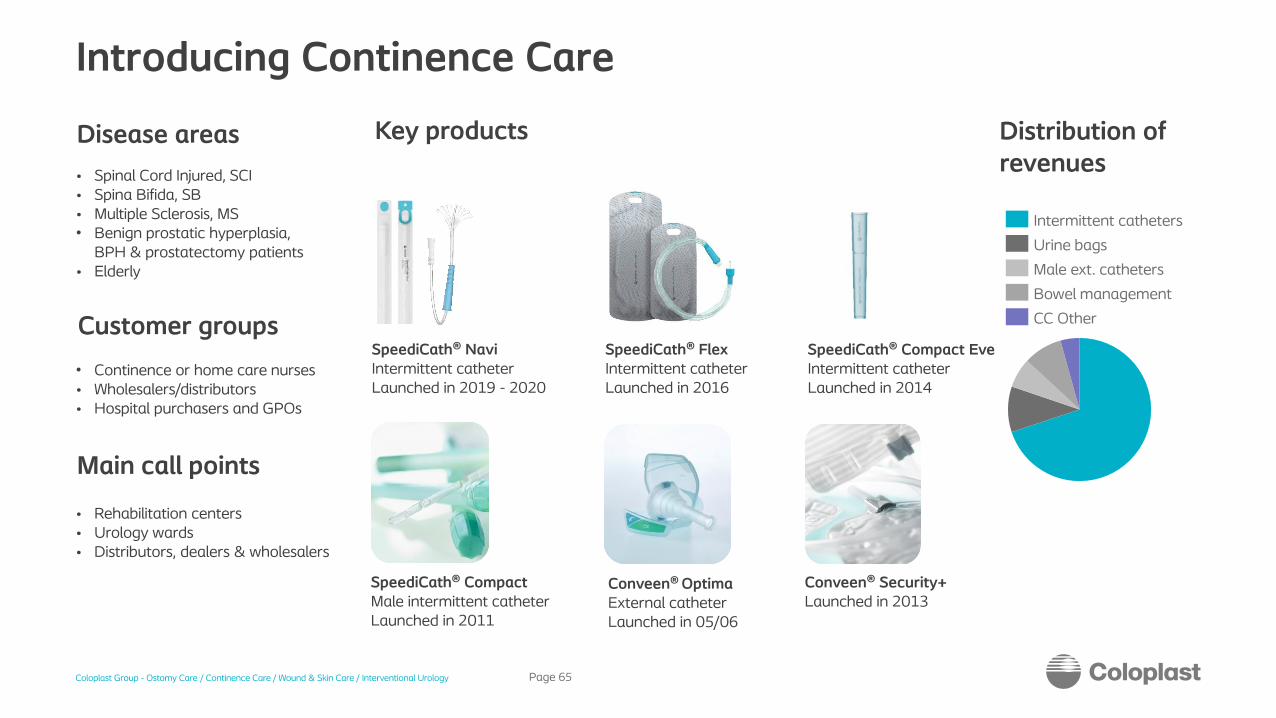
Introducing Continence Care
Page 65
• Spinal Cord Injured, SCI• Spina Bifida, SB• Multiple Sclerosis, MS• Benign prostatic hyperplasia,
BPH & prostatectomy patients• Elderly
• Continence or home care nurses• Wholesalers/distributors• Hospital purchasers and GPOs
• Rehabilitation centers• Urology wards• Distributors, dealers & wholesalers
Distribution of revenues
Key productsDisease areas
Customer groups
Main call points
SpeediCath® Compact Male intermittent catheterLaunched in 2011
Conveen® Optima External catheterLaunched in 05/06
Conveen® Security+Launched in 2013
SpeediCath® Compact Eve Intermittent catheterLaunched in 2014
CC Other
Urine bags
Intermittent catheters
Male ext. catheters
Bowel management
SpeediCath® FlexIntermittent catheterLaunched in 2016
SpeediCath® NaviIntermittent catheterLaunched in 2019 - 2020

Introducing Bowel Management
Page 66
Faecal incontinence (management products only)
• Spinal Cord Injured, SCI• Spina Bifida, SB• Multiple Sclerosis, MS
• Rehab centers• Pediatric clinics• Urology wards
Distribution of revenues
Peristeen® Anal IrrigationLaunched in 2003 Updated in 2011
Anal plugLaunched in 1995
Disease areas Market dynamics
Customer groups
Call points
+ Growing awareness
+ Huge underpenetrated and
unserved population
+ New devices addressing the many
unmet needs
÷ Still taboo area and non-focus for
professionals (doctors)
÷ Very little patient awareness
÷ Training required (nurses, patients)
÷ Lack of reimbursement
Peristeen® Anal Irrigation
Anal plug

Introducing Interventional UrologySurgical treatment of urological disorders
Page 67
• Urinary incontinence• Pelvic organ prolapse• Erectile dysfunction• Enlarged prostate• Kidney and urinary stones
• Surgeons• Purchasing
departments and organizations
• End customers
• Urologists• Uro-gynaecologists• Gynaecologists • Purchasing
departments and organizations
Distribution of revenues
Isiris® cystoscopeLaunched in 2015 Single use devices
JJ stentsLaunched in 1998Single use devices
Titan® OTR penile implantLaunched in 2008 Men’s health – Surgical Urology
Altis® single incision slingLaunched in 2012Women’s health – Surgical Urology
Disease areas
Customer groups
Call points
Key products
Men’s health
Single use devices
Women’s health
Distribution of revenues (WSC)
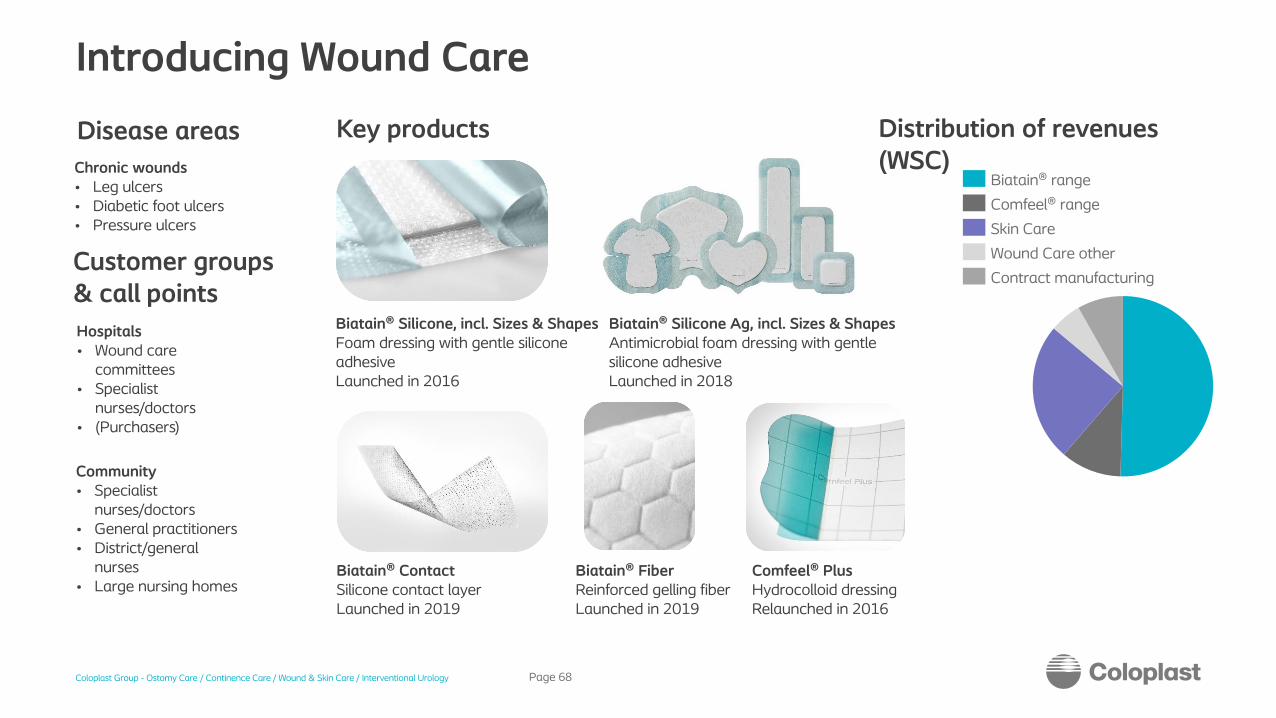
Introducing Wound Care
Page 68
Chronic wounds• Leg ulcers• Diabetic foot ulcers• Pressure ulcers
Hospitals• Wound care
committees• Specialist
nurses/doctors• (Purchasers)
Community• Specialist
nurses/doctors • General practitioners• District/general
nurses • Large nursing homes
Key products
Biatain® Silicone, incl. Sizes & ShapesFoam dressing with gentle silicone adhesiveLaunched in 2016
Disease areas
Customer groups& call points
Biatain® range
Comfeel® range
Skin Care
Wound Care other
Contract manufacturing
Comfeel® PlusHydrocolloid dressingRelaunched in 2016
Biatain® Silicone Ag, incl. Sizes & ShapesAntimicrobial foam dressing with gentle silicone adhesiveLaunched in 2018
Biatain® ContactSilicone contact layerLaunched in 2019
Biatain® FiberReinforced gelling fiberLaunched in 2019

Introducing Skin Care
Page 69
InterDry® AgTextile with antimicrobial silvercomplexUnique solution for skin on skin issues
Sween®Broad line of skin care productsDesigned to increase consistency of care
• Moisture associated skin damage• Incontinence• Skin folds & obesity • Prevention of skin impairments
Hospitals• Clinical Specialists • Supply Chain• Value Analysis Committee
Critic-Aid® Clear / AF Skin ProtectantSuitable for neonate to geriatric patients
EasiCleanse Bath® Disposable Bathing Wipes Improves Patient Experience
Key products
Community• Wound Clinics• Long Term Care• Home Health Agencies• Distribution
Disease areas
Customer groups& call points
Product mix
Protectants & Antifungals
SC Other
Cleansing/Bathing
Moisturizers
Textile

Product market for US Skin Care
Page 70
Market trends• Increasing size and vertical integration
of health systems
• Increasing importance of prevention
• Increasing importance of utilization management
• Increasing scale and vertical integration of market leaders
• US market size estimated at DKK
4-5bn with 2-4% growth
• Market share: 10-15%
• Main competitors include:
• Medline Industries
• Sage Products
US Skin Care at a glance
+ Aging and obese population
+ CMS Value Based Purchasing
+ Increased focus on prevention
+ Increased importance of utilization management
Market drivers/limiters
÷ Consolidation of Providers
÷ Increased competition from both Channel and Manufacturers

The Coloplast organisation
Page 71
Strategic Business UnitsChronic Care
Wound & Skin Care Interventional Urology
Global Operations
Ostomy Care Continence Care
Global Business Support Functions
Sales Regions
Coloplast Group
R&D
Strategic Business UnitsChronic Care
MarketingSales R&DOperationsMarketing Marketing

Kristian VillumsenPresident, CEO• Born 1970• With Coloplast since 2008
Page 72
Allan RasmussenEVP, Operations• Born 1967• With Coloplast since 1992
Anders Lonning-SkovgaardEVP, CFO• Born 1972• With Coloplast since 2006
Paul MarcunEVP, Growth• Born 1966• With Coloplast since 2015
Camilla G. MøhlSVP, People & Culture• Born 1975• With Coloplast since 2016
Nicolai Buhl AndersenEVP, Innovation• Born 1969• With Coloplast since 2005
Coloplast Executive Leadership Team

Income statement
Page 73
Revenue 4,823 4,753 -1% 9,535 9,491 0%
Gros s profit 3,270 3,251 -1% 6,482 6,457 0%
SG&A costs -1,551 -1,500 -3% -3,137 -2,995 -5%R&D costs -182 -177 -3% -351 -363 3%Other operating income/expenses 5 3 -40% 20 14 -30%
Operating profit (EBIT) before s pecial items 1,542 1,577 2% 3,014 3,113 3%Special items - -200 - -200Operating profit (EBIT) 1,542 1,377 -11% 3,014 2,913 -3%Net financial items -157 98 -162% -211 57 3%Tax -318 -345 8% -644 -704 9%
1,067 1,130 6% 2,159 2,266 5%
Gross margin 68% 68% 68% 68%EBIT margin before special items 32% 33% 32% 33%
32% 29% 32% 31%
Earnings per share (EPS), diluted 5.00 5.30 6% 10.12 10.63 5%
Key ratios
EBIT margin
Net profit
Change DKKm Q2 2019/20 Q2 2020/21 Change H1 2019/20 H1 2020/21

Balance sheet
Page 74
Non-current as s ets 6,819 8,542 25%
Current as s ets 6,709 6,707 0%of which:Inventories 1,915 2,289 20%Trade receivables 3,269 3,108 -5%Amounts held in escrow 13 - nmMarketable securities, cash, and cash equivalents 800 675 -16%
Total equity 6,586 6,936 5%Non-current liabilities 1,048 1,491 42%Current liabilities 5,894 6,822 16%of which:Trade payables 664 572 -14%
Return on average invested capital before tax (ROIC)1) 60% 56%
46% 43%
Net asset value per share, DKK 32 29 -8%
1) This item is before S pecial items. After S pecial items, ROIC before tax was 54% /2019/20: 62%) and ROIC after tax was 41% (2019/20: 48%)
Return on average invested capital after tax (ROIC)1)
Key ratios
Equity ratio 49% 45%
Invested capital 10,251 11,682 14%
Balance, total 13,528 15,249 13%
As s ets
Equity and liabilities
DKKm 31 Mar 2020 31 Mar 2021 Change

Cash flow
Page 75
1) Investment in intangibles includes acquisition of Nine Continents Medical, Inc. for DKK 950m2) Net CAPEX including divestment of PPE and excluding finance leases
EBIT 3,014 2,913 -3%
Depreciation and amortisation 422 392 -7%
Change in working capital -499 -465 -7%
Net interest payments -128 -3 -98%
Paid tax -1,100 -998 -9%
Other -68 120 -276%
Investment in intangibles1) -40 -997 nm
CAPEX2) -431 -457 6%
Acquistions of operations - -59 nm
Securities 11 - nm
Cash flow from investments -460 -1,513 229%
Dividends -2,549 -2,765 8%
77 104 35%
-95 -99 4%
1,551 2,391 54%
Net cash flow for the year 165 77 -53%
Drawdown on credit facilities
Free cash flow 1,181 446 -62%
Net aquisition of treasury shares and exercise of share options
Repayment of lease liabilities
DKKm H1 2019/20 H1 2020/21 Change
Cash flow from operations 1,641 1,959 19%
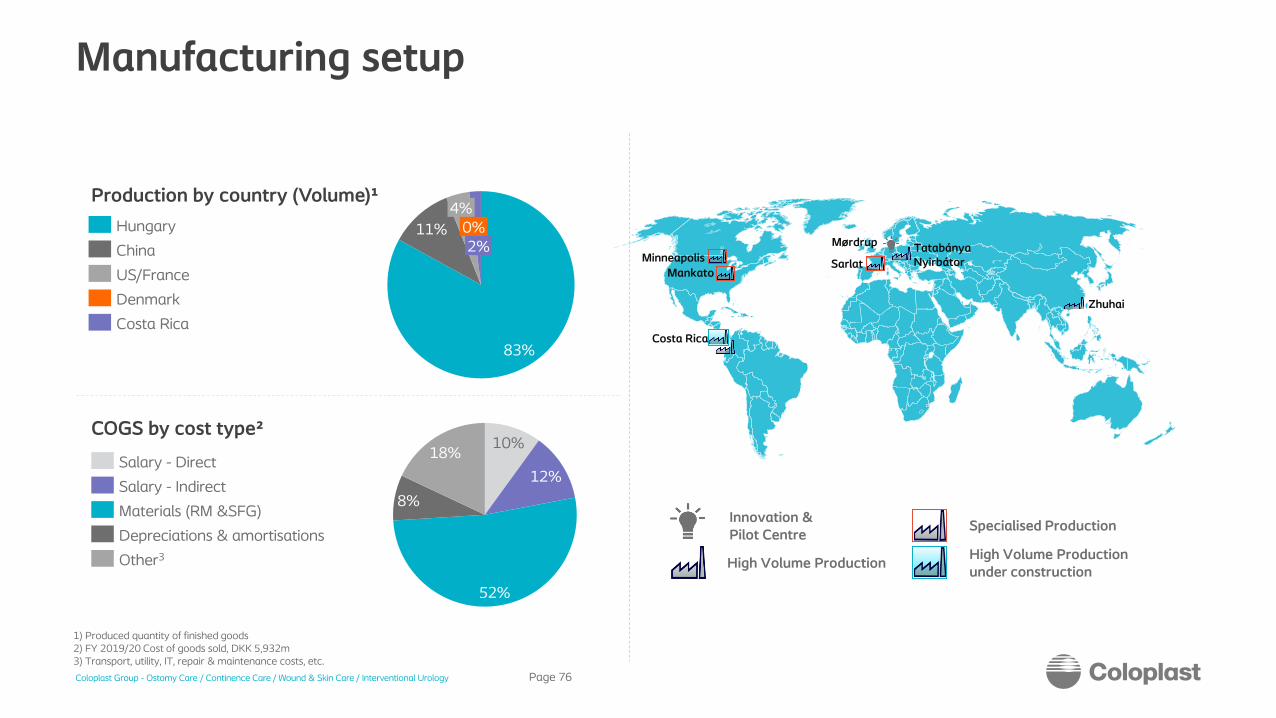
Zhuhai
TatabányaNyirbátorSarlat
Mørdrup
Minneapolis
Mankato
Costa Rica
Manufacturing setup
Page 76
Production by country (Volume)¹
COGS by cost type²
1) Produced quantity of finished goods2) FY 2019/20 Cost of goods sold, DKK 5,932m3) Transport, utility, IT, repair & maintenance costs, etc.
83%
11%
4%0%2%
US/France
Hungary
Costa Rica
China
Denmark
10%
12%
52%
8%
18%Salary - Direct
Salary - Indirect
Depreciations & amortisations
Materials (RM &SFG)
Other3
Innovation & Pilot Centre
High Volume Production
Specialised Production
High Volume Production under construction

Production sites
Page 77
• Continence care products• Ostomy care products• Machine building• Number of employees in production: ~1,000
Hungary
Tatabánya
Tatabánya PDC
• Continence care products• Wound care products • Consumer products• Number of employees in production: ~2,500
• Ostomy care products • Adhesives • Continence care products• Interventional Urology products• Number of employees in production: ~1,850
• Postponement & packaging• Cross docking• Warehousing• Distribution & shipping• Number of employees: ~550
Nyírbátor
Zhuhai
China
Costa Rica
Cartago
• The first high volume production site became operational in Q2 2020/21
• Ostomy Care products• Number of employees in production: ~150
• Second high volume production site expected to be operational by the end of 21/22

Production sites
Page 78
• Pilot development work Ostomy care, Continence care and Wound care
• Adhesives production• Number of employees in production: ~150
Sarlat• Disposable surgical urology products• Number of employees in production: ~175
Minneapolis
Mankato• Skin care products• Ostomy care supporting products• Number of employees in production: ~100
• Interventional Urology products• Number of employees in production: ~100
Mørdrup
Denmark
France
US

Coloplast Sponsored Level 1 ADR programme
Page 79
Benefits of a Coloplast ADR programme to US Investors:
• Coloplast has established a sponsored ADR programme in the US, as a service to US investors by offering an alternative way to trade Coloplast shares, while serving to further broaden the company’s shareholder base over the long term.
• Clear and settle according to normal US standards
• Offer the convenience of stock quotes and dividend payments in US dollars
• Can be purchased/sold in the same way as other US stocks via a US broker
• Provide a cost-effective means of international portfolio diversification
• Ability to acquire the underlying securities directly upon cancellation
For questions about creating Coloplast ADRs, please contact BNY Mellon:
Coloplast Sponsored ADR Programme
Symbol CLPBY
Structure Level 1 ADR
Exchange OTC
CUSIP 19624Y101
DR ISIN US19624Y1010
Ratio 10 ADRs : 1 ordinary share
Country Denmark
Underlying SEDOL B8FMRX8
Underlying ISIN DK0060448595
Depositary Bank BNY Mellon
New YorkRick Maehremail: [email protected]: +1 212 815 2275
LondonMark Lewisemail: [email protected]: +44 (0)20 7964 6089

Contact Investor Relations
Page 80
Holtedam 1DK-3050 HumlebækDenmark
Ellen Bjurgert
Vice President, Investor RelationsTel. direct: +45 4911 3376 Office: +45 4911 1800 [email protected]
Hannah Katrine Larsen
Investor Relations Coordinator & PATel. direct: +45 4911 3616 Office: +45 4911 [email protected]
Aleksandra Dimovska Senior Manager, Investor RelationsTel. direct: +45 4911 2458
Office: +45 4911 [email protected]
Otto Munk MadsenStudent Assistant, Investor RelationsTel. direct: +45 4911 3290
Office: +45 4911 [email protected]

Page 81