Interim report 2012 Q4 Presentation.pdf - Sandvik Group
37
Sandvik fourth quarter 2012 1 Sandvik Interim report on fourth quarter 2012 Strong year for Sandvik
-
Upload
khangminh22 -
Category
Documents
-
view
0 -
download
0
Transcript of Interim report 2012 Q4 Presentation.pdf - Sandvik Group

Sandvik fourth quarter 2012 1
Sandvik Interim report on fourth quarter 2012
Strong year for Sandvik

Sandvik Interim report on fourth quarter 2012
Annual highlights 2012 • Strong year for Sandvik
• Highest invoicing in company history, 98,529 MSEK
• Strong operating cash flow, +11,892 MSEK
• Adjusted EBIT margin 15.0%
• Sandvik 150-year anniversary
Sandvik fourth quarter 2012 2
• Successful implementation of new strategy
• Record invoicing for Mining and Machining Solutions
• Good progress for turnaround programs in Materials Technology and Construction
• Workforce reduced with almost 1,300 employees

Sandvik Interim report on fourth quarter 2012
Quarterly highlights • Structural improvements
• Nonrecurring charges of about 920 MSEK • Adjusted EBIT 3,058 MSEK, 12.6% • ROCE 12 month rolling 19.8%
• Record strong cash flow +4,520 MSEK
• Decreased inventories and strong A/R collection
• Proposed dividend • 3.50 SEK (3.25) per share
Sandvik fourth quarter 2012 3
• Unchanged market conditions • Challenging market conditions for
Mining, Machining Solutions, Materials Technology, parts of Venture
• Weaker market for Construction and parts of Venture
• Changes to Group Executive Management

Sandvik Interim report on fourth quarter 2012
Sandvik fourth quarter 2012 4
Share of Group total
Invoicing (p/v) Q4 2012, change compared with Q4 2011
16%
-5%
20%
+3%
34%
-8%
11%
+13%
9%
-6%
10%
+27%
Invoicing by market

Sandvik Interim report on fourth quarter 2012
Sandvik fourth quarter 2012 5
Invoicing growth vs. Q4 2011
Pie chart representing share of invoicing 2012
-10 to 0%
0 to 10%
> 10%
< -10%
Demand trend compared to preceding quarter
Energy
Automotive
Other
Engineering
Construction
Aerospace
Consumer related
Mining Customer segments

Sandvik Interim report on fourth quarter 2012
-50%
-25%
0%
25%
50%
75%
100%
125%
150%
-10 000
-5 000
0
5 000
10 000
15 000
20 000
25 000
30 000
Order intake Organic order intake change y-o-y
Order intake Order intake 21,070 MSEK • Major mining systems orders
900 MSEK
Change p/v -10%
Sandvik fourth quarter 2012 6

Sandvik Interim report on fourth quarter 2012
-40%
-20%
0%
20%
40%
60%
80%
100%
120%
-10 000
-5 000
0
5 000
10 000
15 000
20 000
25 000
30 000
Invoicing Organic invoicing change y-o-y
Invoicing Invoicing 24,328 MSEK Change p/v +0%
Sandvik fourth quarter 2012 7

Sandvik Interim report on fourth quarter 2012
EBIT and ROCE Q4 2012 Reported
• EBIT 2,134 MSEK • EBIT margin 8.8% • ROCE reported rolling 12 months 19.8% • Underabsorption of fixed costs
Adjusted for nonrecurring charges • EBIT 3,058 MSEK • EBIT margin 12.6%
Sandvik fourth quarter 2012 8
-20%
-10%
0%
10%
20%
30%
40%
-3 000
-2 000
-1 000
0
1 000
2 000
3 000
4 000
5 000
6 000
2000 2001 2002 2003 2004 2005 2006 2007 2008 2009 2010 2011 2012
EBIT EBIT margin ROCE

Sandvik Interim report on fourth quarter 2012
0%
50%
100%
150%
200%
250%
300%
350%
0
500
1 000
1 500
2 000
2 500
3 000
3 500
4 000
4 500
5 000
2007 2008 2009 2010 2011 2012
Operating cash flow
Capex / Depreciation
Cash flow Cash flow from operating activities +4,520 MSEK
Sandvik fourth quarter 2012 9
MSEK

Sandvik Interim report on fourth quarter 2012
Sandvik fourth quarter 2012 10
Net Working Capital
Target
0%
5%
10%
15%
20%
25%
30%
35%
40%
45%
0
5 000
10 000
15 000
20 000
25 000
30 000
35 000
2003 2004 2005 2006 2007 2008 2009 2010 2011 2012
Net working capitalNet working capital / Invoiced sales
MSEK

Sandvik Interim report on fourth quarter 2012
Bridge analysis
Sandvik fourth quarter 2012 11
MSEK Q4 2011 Price/
volume/ Productivity
Currency Structure, one-offs* Q4 2012
Sandvik Group
Invoiced sales 25,104 +80 -600 -250 24,328
EBIT 1,649 -270 - +850 2,134
EBIT margin 6.6% n/a 8.8%
* Includes metal price effects

Sandvik Interim report on fourth quarter 2012
Sandvik fourth quarter 2012 12
Sandvik Mining
Strong invoicing
• Strong invoicing but declining orders • High activity in Africa as gold prices remained high • Declining demand in Asia and Australia, primarily due
to iron ore and coal • Measures to adjust cost level
• Adjusted EBIT 1,373 MSEK (1,389) • Adjusted EBIT margin 14.0% (15.3) • Nonrecurring charges -170 MSEK • Inventory reduction led to underutilization
• ROCE reported rolling 12 months 38.5% • Net working capital 26% (25) of invoicing

Sandvik Interim report on fourth quarter 2012
• Stable market conditions on a lower level • Good demand in North America, particularly aerospace • Declining demand in other market areas
• Adjusted EBIT 1,323 MSEK (1,695) • Adjusted EBIT margin 19.3% (23.0) • Nonrecurring charges -80 MSEK • Inventory reduction led to underutilization
• ROCE reported rolling 12 months 32.0% • Net working capital 26% (24) of invoicing
Sandvik fourth quarter 2012 13
Sandvik Machining Solutions
Stable demand

Sandvik Interim report on fourth quarter 2012
• Sandvik Materials Technology • Stable demand in oil/gas • Adjusted EBIT excluding metal price effects and
nonrecurring charges 381 MSEK, 10.5% • Nonrecurring charges -670 MSEK
• Sandvik Construction • Weakening demand in Europe and China • EBIT 83 MSEK, 3.5% • Inventory reduction led to underabsorption
• Sandvik Venture • High activity for Process Systems • EBIT margin 15.9% • Inventory reduction led to underabsorption
Sandvik fourth quarter 2012 14
Improved profitability

Sandvik Interim report on fourth quarter 2012
• Petra Einarsson New President Sandvik Materials Technology as of 1 February
Changes to Group Executive Management • Jonas Gustavsson
New President Sandvik Machining Solutions as of 1 February
Sandvik fourth quarter 2012 15

Sandvik Interim report on fourth quarter 2012
Summary Q4 2012
Sandvik fourth quarter 2012 16
• Unchanged market conditions
• Further structural measures implemented • Adjusted capacity and cost levels
• Record strong cash flow
• Working capital reductions in the quarter
• Changes to Group Executive Management

Sandvik Interim report on fourth quarter 2012
Summary 2012 • Highest invoicing in company history
• Strong cash flow
• Successful implementation of the new strategy
• Market conditions from strong to challenging
• Proposed dividend of 3.50 SEK per share (3.25) for 2012
Sandvik fourth quarter 2012 17

Sandvik Interim report on fourth quarter 2012
Capital Markets Day 2013
New date, 24 September in Sandviken, Sweden
Sandvik fourth quarter 2012 18

Sandvik Interim report on fourth quarter 2012
Sandvik fourth quarter 2012 19
Q&A

Sandvik Interim report on fourth quarter 2012
Sandvik fourth quarter 2012 20
Back-up slides

Sandvik Interim report on fourth quarter 2012
Quarterly financials
Sandvik fourth quarter 2012 21
MSEK Q4 2011 Q4 2012 vs Q4 2011
Order intake 23,990 21,070 -10%*
Invoicing 25,104 24,328 0%*
EBIT 1,649 2,134 +29%
EBIT margin 6.6% 8.8% -
Operating cash flow +3,312 +4,520 +36%
Cash flow after investing activities +1,604 +3,036 +89%
* Change in price/volume

Sandvik Interim report on fourth quarter 2012
Sandvik Mining Q4 2012
• Order intake 7,683 MSEK • Invoicing 9,812 MSEK • EBIT 1,203 MSEK • ROCE 38.5%
Sandvik fourth quarter 2012 22
-10%
0%
10%
20%
30%
40%
50%
-2 000
0
2 000
4 000
6 000
8 000
10 000
2007 2008 2009 2010 2011 2012
Invoicing EBIT margin ROCE 12 months

Sandvik Interim report on fourth quarter 2012
Sandvik Machining Solutions Q4 2012
• Order intake 6,849 MSEK • Invoicing 6,865 MSEK • EBIT 1,240 MSEK • ROCE 32.0%
Sandvik fourth quarter 2012 23
-10%
0%
10%
20%
30%
40%
50%
-2 000
0
2 000
4 000
6 000
8 000
10 000
2007 2008 2009 2010 2011 2012
Invoicing EBIT margin ROCE 12 months

Sandvik Interim report on fourth quarter 2012
Q4 2012 • Order intake 3,312 MSEK • Invoicing 3,620 MSEK • EBIT -351 MSEK
• Adjusted for metal price effects and nonrecurring items, 381 MSEK, 10.5% of invoicing
• ROCE 4.2%
Sandvik fourth quarter 2012 24
Sandvik Materials Technology
-30%
-20%
-10%
0%
10%
20%
30%
40%
50%
60%
-3 000
-2 000
-1 000
0
1 000
2 000
3 000
4 000
5 000
6 000
2007 2008 2009 2010 2011 2012
InvoicingEBIT marginEBIT margin, excl metal price effect and nonrecurring itemsROCE 12 months
MSEK

Sandvik Interim report on fourth quarter 2012
Q4 2012 • Order intake 1,793 MSEK • Invoicing 2,382 MSEK • EBIT 83 MSEK • ROCE 12.5%
Sandvik fourth quarter 2012 25
Sandvik Construction
-20%
-10%
0%
10%
20%
30%
40%
-2 000
-1 000
0
1 000
2 000
3 000
4 000
2007 2008 2009 2010 2011 2012
Invoicing EBIT margin ROCE 12 months
MSEK

Sandvik Interim report on fourth quarter 2012
Sandvik fourth quarter 2012 26
Sandvik Venture Q4 2012
• Order intake 1,431 MSEK • Invoicing 1,639 MSEK • EBIT 260 MSEK • ROCE 16.6%
-50%
-40%
-30%
-20%
-10%
0%
10%
20%
30%
40%
-5 000
-4 000
-3 000
-2 000
-1 000
0
1 000
2 000
3 000
4 000
2007 2008 2009 2010 2011 2012
Invoicing EBIT margin ROCE 12 months
MSEK
Sandvik Interim report on fourth quarter 2012
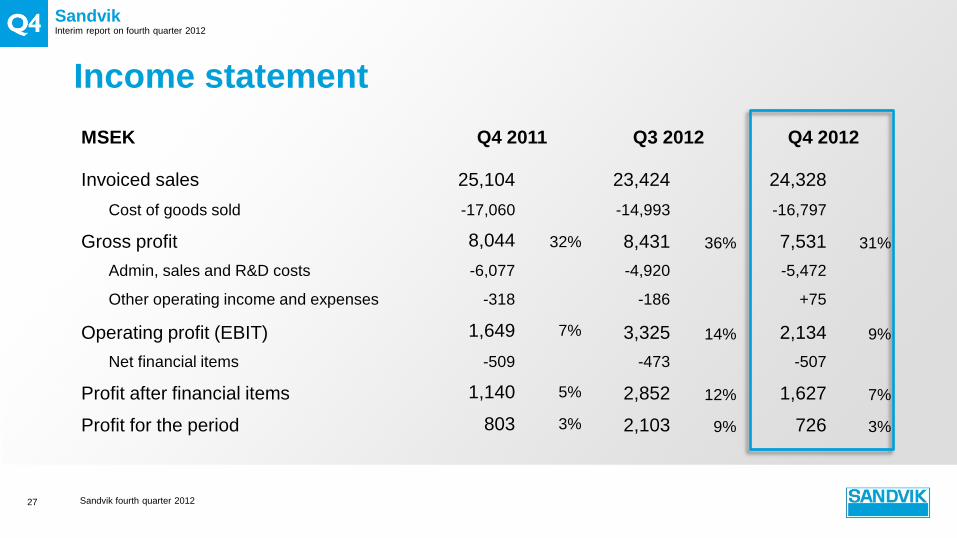
Income statement
Sandvik fourth quarter 2012 27
MSEK Q4 2011 Q3 2012 Q4 2012
Invoiced sales 25,104 23,424 24,328 Cost of goods sold -17,060 -14,993 -16,797
Gross profit 8,044 32% 8,431 36% 7,531 31%
Admin, sales and R&D costs -6,077 -4,920 -5,472
Other operating income and expenses -318 -186 +75
Operating profit (EBIT) 1,649 7% 3,325 14% 2,134 9%
Net financial items -509 -473 -507
Profit after financial items 1,140 5% 2,852 12% 1,627 7%
Profit for the period 803 3% 2,103 9% 726 3%

Sandvik Interim report on fourth quarter 2012
Sandvik fourth quarter 2012 28
MSEK Q4 2011 Price/volume/ productivity Currency Structure,
one-offs Q4 2012
Sandvik Mining Invoiced sales 9,105 +920 -220 - 9,812
EBIT 1,220 -50 -20 50 1,203
EBIT margin 13% n/a 12%
Sandvik Machining Solutions Invoiced sales 7,364 -280 -200 -20 6,865
EBIT 1,549 -350 -30 70 1,240
EBIT margin 21% -127% 18%
Sandvik Materials Technology Invoiced sales 3,940 -140 -50 -130 3,620
EBIT -896 +350 - +200 -351
EBIT margin -23% n/a -10%
Bridge analysis

Sandvik Interim report on fourth quarter 2012
Sandvik fourth quarter 2012 29
Bridge analysis MSEK Q4 2011 Price/volume/
productivity Currency Structure, one-offs Q4 2012
Sandvik Construction Invoiced sales 2,484 -50 -80 +30 2,382
EBIT -255 +70 -40 +300 83
EBIT margin -10% n/a 3%
Sandvik Venture Invoiced sales 2,202 -380 -50 -130 1,639
EBIT 316 -300 - +240 260
EBIT margin 14% -78% 16%

Sandvik Interim report on fourth quarter 2012
Balance sheet
Sandvik fourth quarter 2012 30
MSEK Q4 2011 Q3 2012 Q4 2012 vs Q4 2011
Intangible fixed assets 11,807 11,340 11,423 -3%
Tangible fixed assets 25,702 25,398 25,516 -1%
Financial fixed assets 6,835 6,693 6,265 -8%
Inventories 26,077 26,723 25,508 -2%
Receivables 21,979 22,976 21,511 -2%
Cash and cash equivalents 5,592 9,247 13,829 +147%
Assets held for sale 747 - - -
Total assets 98,739 102,377 104,052 +5%
Total equity 33,891 35,306 36,232 +7%
Interest-bearing liabilities 33,073 35,838 37,203 +12%
Non-interest-bearing liabilities 31,667 31,233 30,617 -3%
Liabilities held for sale 108 - - -
Total equity and liabilities 98,739 102,377 104,052 +5%

Sandvik Interim report on fourth quarter 2012
Loan and duration profile
Sandvik fourth quarter 2012 31
Long term 92% Amount MSEK Average duration
US Private Placement 5,547 7 years Fin institutions, EIB, NIB 5,117 5 years Swedish MTN 8,096 5 years European MTN 9,707 5 years Bank loans 2 214 2 years Share swap 1,552 4 years
Short term 8% Commercial paper 0 0 months Swedish MTN 1,745 5 months Bank loans 983 0 months
Total 34,961 5 years Cash position 13,829 Unutilized revolving credit facilities, 10,600 MSEK

Sandvik Interim report on fourth quarter 2012
Loan maturity profile
Sandvik fourth quarter 2012 32
-10 000
-5 000
0
5 000
10 000
15 000
H12013
H22013
2014 2015 2016 2017 2018 2019 2020 2021 2022 2023 2024 2025 2027 2032
Loan Cash position

Sandvik Interim report on fourth quarter 2012
Financial key figures
Sandvik fourth quarter 2012 33
MSEK Q4 2011 Q1 2012 Q2 2012 Q3 2012 Q4 2012
Cash flow from operations 3,312 1,099 2,293 3,979 4,520
Capex 1,585 1,056 1,114 949 1,429
ROCE, 12 months 16.0% 16.6% 17.2% 19.5% 19.8%
ROE, 12 months 17.3% 18.2% 19.8% 23.6% 23.0%
Net debt/equity ratio 0.8 0.7 0.8 0.7 0.6
EPS, SEK 12 months 4.63 5.00 5.47 6.60 6.51

Sandvik Interim report on fourth quarter 2012
Sandvik fourth quarter 2012 34
Implications of IAS 19 • As of 1 January 2013, revised IAS 19 rules come into effect
• Effects 1 January 2013: • Sandvik’s net pension liability will increase by about 4.8 Bn SEK
• Sandvik’s equity will decrease by about 3.4 Bn SEK
• Increased volatility in net debt and equity
• As of 1 January, Sandvik will exclude Pension liabilities from the Net Debt to
Equity measurement and keep the <0.8 level unchanged
Equivalent to a 0.21 increase in net debt to equity ratio

Sandvik Interim report on fourth quarter 2012
Sandvik fourth quarter 2012 35
Decreased Swedish tax rate
• Tax rate decreased from 26.3% to 22.0% as from 2013
• Reported income tax negatively impacted in Q4 2012 by about 500 MSEK • Reduced value of tax losses carry forwards in Swedish legal entities
• Decreased tax value of taxable amortization on intellectual property rights
• Cash flow in Q4 2012 unaffected
Implications

Sandvik Interim report on fourth quarter 2012
Guidance
Sandvik fourth quarter 2012 36
Metal price effects Given currency rates, stock levels and metal prices at end of December, a negative EBIT effect of about 0 to -50 MSEK is expected for Q1 2013.
Net financial items Net financial items is estimated
to be about 2.2 bn SEK for 2013.
Currency effects Given currency rates at quarter end the effect on EBIT
would be about -300 MSEK for Q1 2013.
Capex Capex is estimated to be
about 5-6 bn SEK for 2013.
Tax rate The tax rate is estimated to
about 25-27% for 2013.

Sandvik Interim report on fourth quarter 2012
Sandvik fourth quarter 2012 37
Cautionary statement
“Some statements herein are forward-looking and the actual outcome could be materially different. In addition to the factors explicitly commented upon, the actual outcome could be materially affected by other factors for example, the effect of economic conditions, exchange-rate and interest-rate movements, political risks, impact of competing products and their pricing, product development, commercialisation and technological difficulties, supply disturbances, and the major customer credit losses.”