July 2021 Investor Relations Presentation - cloudfront.net
75
1 PROPRIETARY | Q22021 July 22, 2021 E A R N I N G S
-
Upload
khangminh22 -
Category
Documents
-
view
1 -
download
0
Transcript of July 2021 Investor Relations Presentation - cloudfront.net

1PROPRIETARY |
Q22021
July 22, 2021
E A R N I N G S
2PROPRIETARY | 2PROPRIETARY |
Forward-looking statementsThis presentation contains certain forward-looking information, including third quarter and full year 2021 guidance, to help you understand Equifax and its business environment. All statements that address operating performance and events or developments that we expect or anticipate will occur in the future, including statements relating to future operating results, improvements in our IT and data security infrastructure, our strategy, our ability to mitigate or manage disruptions posed by COVID-19, the impact of COVID-19 and changes in U.S. and worldwide economic conditions, and similar statements about mortgage and financial markets, our outlook and our business plans are forward-looking statements.
We believe these forward-looking statements are reasonable as and when made. However, forward-looking statements are subject to risks and uncertainties that could cause actual results to differ materially from our historical experience and our present expectations or projections. These risks and uncertainties include, but are not limited to, those described in our 2020 Form 10-K and subsequent SEC filings.
As a result of such risks and uncertainties, we urge you not to place undue reliance on any forward-looking statements. Forward-looking statements speak only as of the date when made. We undertake no obligation to publicly update or revise any forward-looking statements, whether as a result of new information, future events or otherwise, except as required by law.

3PROPRIETARY | 3PROPRIETARY |
This presentation contains certain non-GAAP financial measures, including adjusted EPS attributable to Equifax and adjusted EBITDA, which reflect adjustments for certain items that affect the comparability of our underlying operational performance.
Adjusted EPS attributable to Equifax is defined as net income adjusted for acquisition-related amortization expense, costs related to the 2017 cybersecurity incident, fair value adjustment of equity investments, foreign currency impact of certain intercompany loans, acquisition-related costs other than acquisition amortization, income tax effect of stock awards recognized upon vesting or settlement, Argentina highly inflationary foreign currency adjustment, income tax effects of Q1 2020 gain on fair market value adjustment of equity investment and income tax adjustments.
Adjusted EBITDA is defined as net income excluding income taxes, interest expense, net, depreciation and amortization expense, costs related to the 2017 cybersecurity incident, fair value adjustment of equity investments, foreign currency impact of certain intercompany loans, acquisition-related costs other than acquisition amortization and Argentina highly inflationary foreign currency adjustment.
Free Cash Flow is defined as Cash Provided by Operating Activities Less Capital Expenditures.
Local currency is calculated by conforming the prior period results to the comparable prior period exchange rates. Local currency can be presented for numerous GAAP measures, but is most commonly used by management to analyze operating revenue without the impact of changes in foreign currency exchange rates.
Core revenue growth is defined as revenue growth excluding: (i) the impact on revenue from U.S. mortgage market activity, as measured by changes in total U.S. mortgage credit inquiries; (ii) the extraordinary revenue growth in our unemployment claims business; and (iii) Employee Retention Credit revenue from our recently-acquired HIREtech business.
Core mortgage growth is defined as revenue growth within our mortgage vertical, excluding the impact on revenue from U.S. mortgage market activity, as measured by changes in total U.S. mortgage credit inquiries.
Core non-mortgage growth is defined as revenue growth within our non-mortgage verticals excluding (i) the extraordinary revenue growth in our unemployment claims business; and (ii) Employee Retention Credit revenue from our recently-acquired HIREtech business.
Organic revenue growth is defined as revenue growth, adjusted to reflect an increase in prior year Equifax revenue from the revenue of acquired companies in the prior year period.
Organic non-mortgage revenue growth is defined as revenue growth within our non-mortgage verticals adjusted to reflect an increase in prior year Equifax revenue from the revenue of acquired companies in the prior year period.
These non-GAAP measures are detailed in reconciliation tables which are included with our earnings release and are also posted at www.equifax.com under "Investor Relations/Financial Results/Non-GAAP Financial Measures.
Non-GAAP disclosure statement

4PROPRIETARY |
Leveraging cloud for innovation, new products, and growth
Accelerate Innovation and New Products
Leverage Equifax Cloud Capabilities
Expand Differentiated Data Assets
Put Customers First
Execute Bolt-on M&A
Continue Leadership in Security
One Team, One Equifax
● Continue above-market growth…
● Strong EWS growth, new records, new products, new verticals, penetration
● USIS non-Mortgage growth
● INTL / GCS back to growth
● Execute cloud transformation and migrations in North America, accelerate in International
● Leverage cloud for innovation and new products
● Execute bolt-on M&A… Kount, EWS tuck-ins
EFX 2021 Priorities

5PROPRIETARY | 5PROPRIETARY |
Record setting revenue of $1.2B, up 26%... core growth up 29%, outgrowing underlying markets, 6th quarter of double-digit growth
EWS revenue up 40%, core growth up 46%... EFX’s largest, fastest growing, and most profitable business
USIS up 11%, non-mortgage up 21% Total / 14% organic ... winning in marketplace
International up 25% in local currency
Driving EFX Cloud Data and Technology Transformation
Accelerating innovation and NPIs… delivered 46 new products in 2Q
Integrating acquisitions… Kount, HIREtech, i2Verify
Continued strong outperformance in 2QEFX Delivering:
● 6th Consecutive quarter of double digit growth
● 26% Total / 29% Core Revenue growth
● Organic Non-Mortgage Revenue growth of 18%
● EWS, USIS and Intl all Delivering Double-Digit Revenue Growth
● Adj EPS of $1.98, up 21%
● Raising 2021 guidance

6PROPRIETARY | 6PROPRIETARY |
Note: 08/09 growth was calculated by taking the average growth rates from 4Q08 through 4Q09. Mortgage Market growth is that portion of total growth attributable to fluctuations in mortgage volumes, with USIS mortgage related credit inquiries utilized as a proxy. UC & ERC growth is attributable to the EWS unemployment claims business. ERC growth is attributable to the EWS Employee Retention Credit revenue obtained with the HIREtech acquisition. Core growth is the remainder of total growth and excludes growth attributable to the Mortgage Market and UC & ERC; includes impact from acquisitions excluding acquired UC & ERC revenue. Figures may not foot due to rounding.
2Q Core revenue growth of 29%... total growth up 26%
EFX Revenue Growth Accelerating
Total EFX
✓ Strong 26% growth in 2Q✓ 2Q core growth accelerates to 29%
off 20% in 1Q✓ Strong EWS growth… 40%✓ EWS and USIS outperforming
despite declining mortgage market✓ US B2B Non-mortgage sequential
growth up from 4% in 1Q to 9% in 2Q
Core UC & ERC Mortgage Market
7PROPRIETARY | 7PROPRIETARY |
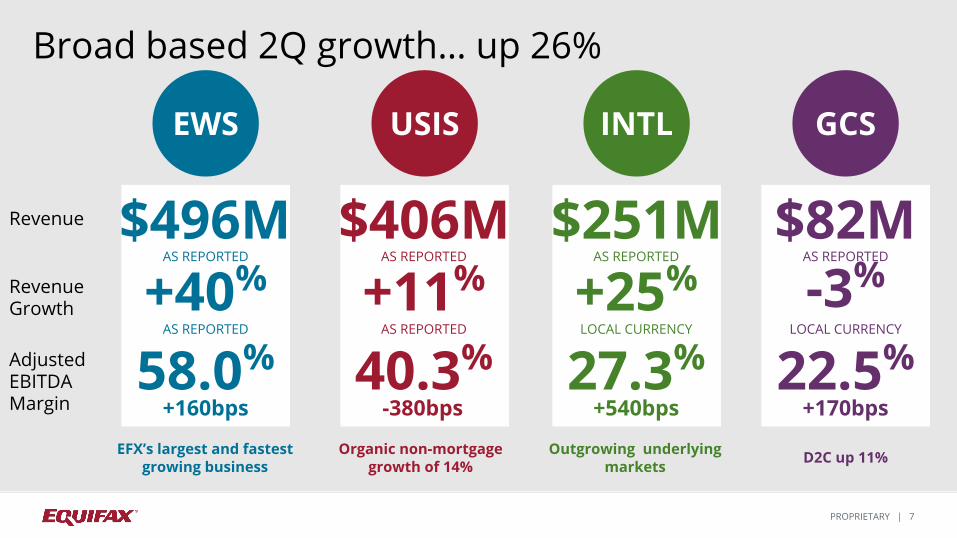
Broad based 2Q growth… up 26%
+40%
EFX’s largest and fastest growing business
Organic non-mortgage growth of 14%
Outgrowing underlying markets D2C up 11%
Revenue Growth
Adjusted EBITDA Margin
EWS USIS INTL GCS
AS REPORTED
+11%AS REPORTED
+25%LOCAL CURRENCY
-3%LOCAL CURRENCY
58.0%+160bps
40.3%-380bps
27.3%+540bps
22.5%+170bps
$496MRevenue $406M $251M $82MAS REPORTED AS REPORTED AS REPORTED AS REPORTED
8PROPRIETARY |
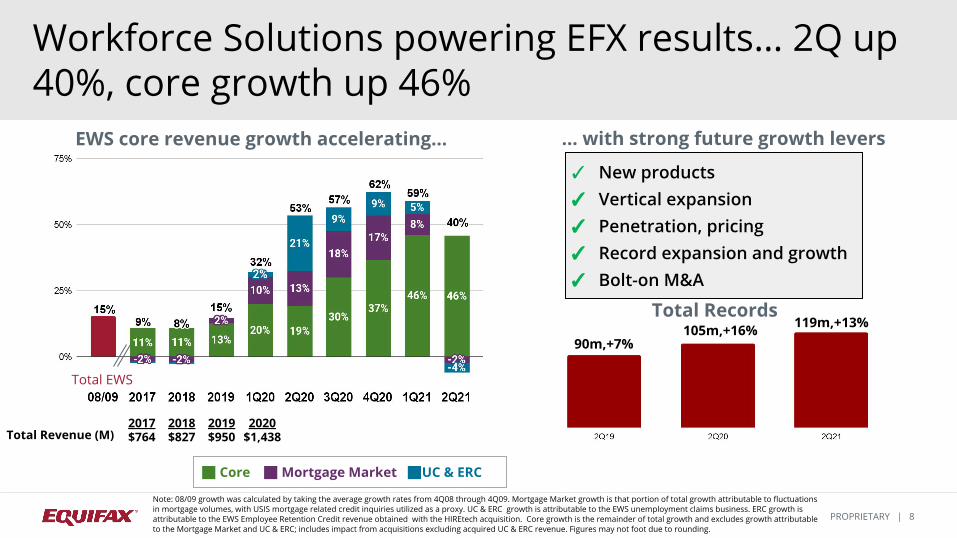
Total EWS
EWS core revenue growth accelerating…
Workforce Solutions powering EFX results… 2Q up 40%, core growth up 46%
… with strong future growth levers
Total Records
90m,+7%
✓ New products✓ Vertical expansion✓ Penetration, pricing✓ Record expansion and growth✓ Bolt-on M&A
105m,+16% 119m,+13%
Total Revenue (M)2020
$1,4382019$950
2018$827
2017$764
Note: 08/09 growth was calculated by taking the average growth rates from 4Q08 through 4Q09. Mortgage Market growth is that portion of total growth attributable to fluctuations in mortgage volumes, with USIS mortgage related credit inquiries utilized as a proxy. UC & ERC growth is attributable to the EWS unemployment claims business. ERC growth is attributable to the EWS Employee Retention Credit revenue obtained with the HIREtech acquisition. Core growth is the remainder of total growth and excludes growth attributable to the Mortgage Market and UC & ERC; includes impact from acquisitions excluding acquired UC & ERC revenue. Figures may not foot due to rounding.
Core UC & ERC Mortgage Market

9PROPRIETARY |
& ERC
Workforce Solutions is EFX’s fastest growing and highest margin business
Growth (Total) 9% 8% 15% 51%
24% ‘17-’20CAGR
2017
BU EBITDA
$2,598
$764
2020
$2,690$1,438
$1,037
$374
$993$800
EWSRest of EFX
23% 35%
27% 45%
43% 49%-- Excl. MTG, UC
12% 12% 12% 4% 1% 37%
1H21
$1,471
$977
40%
$515$573
53%
Revenue
+49%

10PROPRIETARY |
✓ New team and commercial focus
✓ EFX Cloud competitive advantage
✓ NPIs leveraging EFX Cloud✓ Competitive wins from new
cloud capabilities✓ Kount integration driving
ID&F
USIS competitive and winning in marketplace… Core, non-mortgage growth up 18% in 1H
(1%) 2% 16%Growth
Growth Levers
12% 15%(3%) 2% (1%)-- Non-MTG (4%) 18%
15% 10% 22%Total 17% 19%1% (9%) (6%)Non-MTG Flat 15%
USIS Revenue Growth
-- Organic
1Q20 2Q20 3Q20 4Q20 1Q21
11%21%
2Q21
(3%) (9%) 2% (1%) 11% 14%

11PROPRIETARY |
US B2B Mortgage up 25% in 2Q, despite 5% decline in mortgage market
Note: Mortgage Market growth is that portion of total growth attributable to fluctuations in mortgage volumes, with USIS inquiries utilized as a proxy. Core growth is the remainder of total growth and excludes growth attributable to the Mortgage Market. Figures may not foot due to rounding.
EWS Mortgage USIS MortgageUS B2B Mortgage
4% USIS core mortgage growth57% EWS core mortgage growth 30% EWS/USIS core mortgage growth
Mortgage Market Core
12PROPRIETARY |
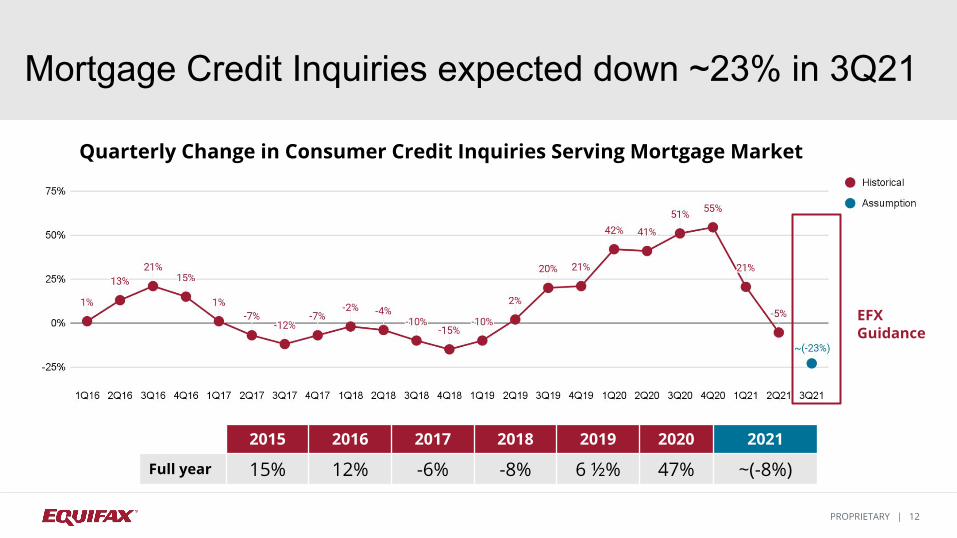
2015 2016 2017 2018 2019 2020 2021
Full year 15% 12% -6% -8% 6 ½% 47% ~(-8%)
EFX Guidance
Mortgage Credit Inquiries expected down ~23% in 3Q21
Quarterly Change in Consumer Credit Inquiries Serving Mortgage Market
13PROPRIETARY |
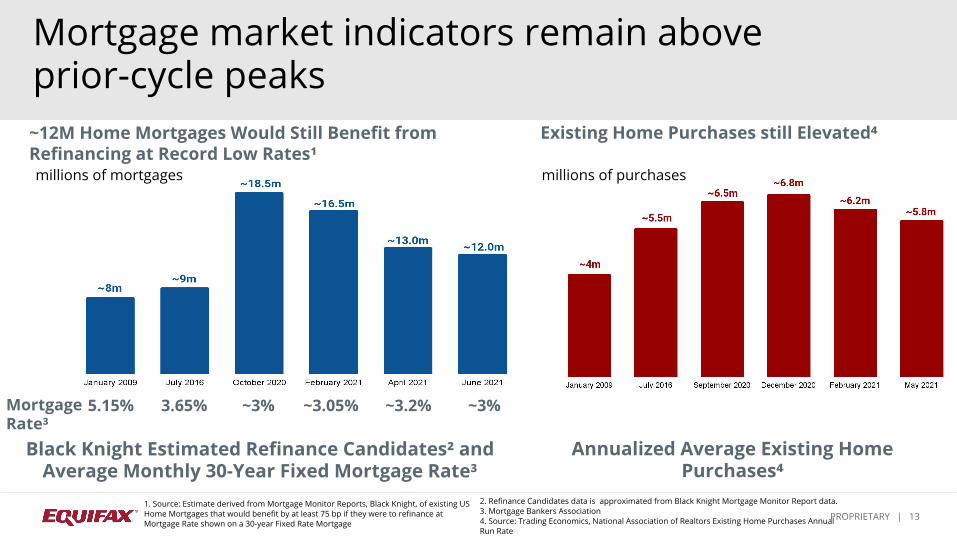
Mortgage market indicators remain above prior-cycle peaks
1. Source: Estimate derived from Mortgage Monitor Reports, Black Knight, of existing US Home Mortgages that would benefit by at least 75 bp if they were to refinance at Mortgage Rate shown on a 30-year Fixed Rate Mortgage
Existing Home Purchases still Elevated⁴
Black Knight Estimated Refinance Candidates² and Average Monthly 30-Year Fixed Mortgage Rate³
Annualized Average Existing Home Purchases⁴
millions of mortgages millions of purchases
2. Refinance Candidates data is approximated from Black Knight Mortgage Monitor Report data. 3. Mortgage Bankers Association 4. Source: Trading Economics, National Association of Realtors Existing Home Purchases Annual Run Rate
5.15% 3.65% ~3% ~3.05% ~3.2%
~12M Home Mortgages Would Still Benefit from Refinancing at Record Low Rates¹
Mortgage Rate³
~3%
millions of purchases

14PROPRIETARY | 14PROPRIETARY |
8.6% -10.5%1
(15.1%) - (9.9%)(2.0%) - 3.2%
$92M - $112M($0.29) - ($0.19) / share($0.04) - $0.06 / share
$1,160M - $1,180M$1.62 - $1.72 / share$1.87 - $1.97 / share
3Q21 Guidance
Adjusted EPS bridge3Q21 (midpoint) vs. 3Q20
Revenue
Pre-tax Income
Adjusted EPS
$102M
($39M)³
($0.24) / share
$60M
($15M)
$3M
($39M)
$102M
3Q21 $ vs 3Q20
Revenue1
Adjusted EPS1
Memo: Adj. EPS excl. Tech Trans.
$1M
% vs 3Q20
Revenue (midpoint)
Gross Margin (Impact of RevenueIncrease less Annual Cost Increases)
Redundant System Cost
Interest Expense / Other Income
Acquisition SG&A / Other Costs
Other²
Sub-Total (midpoint)
Transformation Expense⁴
Pre-Tax Income (midpoint)
($40M)
($16M)1. 3Q21 FX Based on July 2021 Rates. FX Impact is favorable to revenue by ~1.0%.
Acquisitions benefit revenue in 3Q21 by ~1.8% 2. Includes SG&A, Security, Variable Compensation, Other3. Tax rate on Adj EPS: 3Q20: 21.2% / 3Q21 (Guidance): ~23.5%. Higher tax rate in
3Q21 negatively impacts Adj. EPS by ~($0.04).4. Tech Transformation Expense in 3Q21 of ~$40M is equal to $0.25 / share in Adj EPS
* This slide contains forward-looking information, including 2021 guidance. Actual results may differ materially from our historical experience and our present expectations or projections. We undertake no obligation to publicly update or revise any forward-looking statements, whether as a result of new information, future events or otherwise, except as required by law.
($31M)
15PROPRIETARY |
15.3% -16.3%1
4.0% - 6.9%17.9% - 20.8%
$632M - $672M$0.28 - $0.48 / share$1.25 - $1.45 / share
$4,760M - $4,800M$7.25 - $7.45 / share$8.22 - $8.42 / share
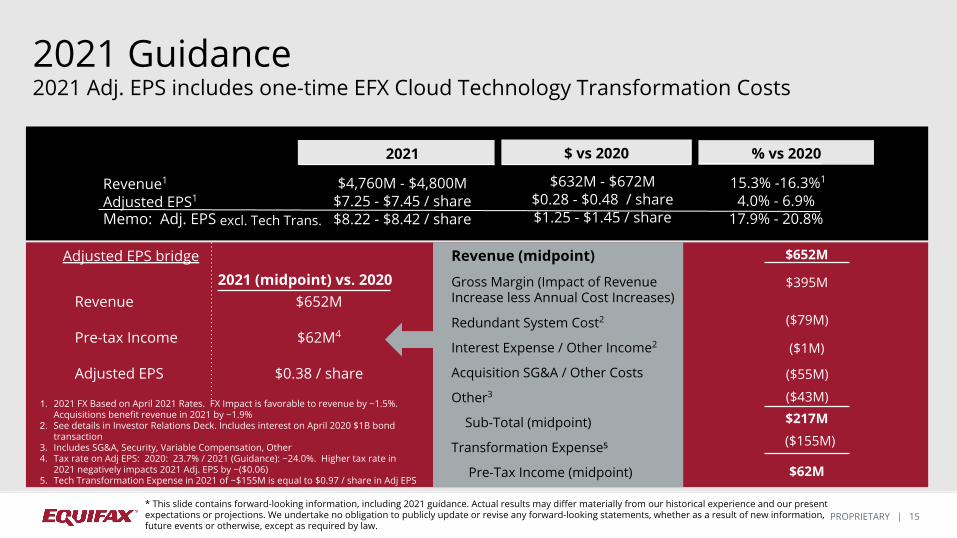
2021 Guidance2021 Adj. EPS includes one-time EFX Cloud Technology Transformation Costs
Adjusted EPS bridge2021 (midpoint) vs. 2020
Revenue
Pre-tax Income
Adjusted EPS
$652M
$62M4
$0.38 / share
$395M
($79M)
($1M)
$62M
$652M
2021 $ vs 2020
Revenue1
Adjusted EPS1
Memo: Adj. EPS excl. Tech Trans.
$217M
% vs 2020
Revenue (midpoint)
Gross Margin (Impact of RevenueIncrease less Annual Cost Increases)
Redundant System Cost2
Interest Expense / Other Income2
Acquisition SG&A / Other Costs
Other3
Sub-Total (midpoint)
Transformation Expense⁵
Pre-Tax Income (midpoint)
($155M)
($55M)
($43M)
* This slide contains forward-looking information, including 2021 guidance. Actual results may differ materially from our historical experience and our present expectations or projections. We undertake no obligation to publicly update or revise any forward-looking statements, whether as a result of new information, future events or otherwise, except as required by law.
1. 2021 FX Based on April 2021 Rates. FX Impact is favorable to revenue by ~1.5%. Acquisitions benefit revenue in 2021 by ~1.9%
2. See details in Investor Relations Deck. Includes interest on April 2020 $1B bond transaction
3. Includes SG&A, Security, Variable Compensation, Other4. Tax rate on Adj EPS: 2020: 23.7% / 2021 (Guidance): ~24.0%. Higher tax rate in
2021 negatively impacts 2021 Adj. EPS by ~($0.06)5. Tech Transformation Expense in 2021 of ~$155M is equal to $0.97 / share in Adj EPS

16PROPRIETARY |
Note: 3Q21 and FY21 denote midpoint of guidance range. Revenue attributable to acquisitions is 0.7% in 2020. Revenue attributable to acquisitions is forecasted to be 1.8% in 3Q21 and 1.9% in 2021. This slide contains forward-looking information, including 2021 guidance. Actual results may differ materially from our historical experience and our present expectations or projections.
EWSUSISINTLGCS
2021 Revenue Growth ~16%... Core ~19%
Total Revenue / Core Revenue Growth (USIS & EWS)59% / 46%19% / 11%
3%(17%)
Total EFX Growth
40% / 46%11% / 13%
25%(3%)
Note: Mortgage Market growth is that portion of total growth attributable to fluctuations in mortgage volumes, with USIS mortgage related credit inquiries utilized as a proxy. UC growth is attributable to the EWS unemployment claims business. ERC growth is attributable to the EWS Employee Retention Credit revenue obtained with the HIREtech acquisition. Core growth is the remainder of total growth and excludes growth attributable to the Mortgage Market and UC & ERC; includes impact from acquisitions excluding acquired UC & ERC revenue. Figures may not foot due to rounding.
2021 Guidance Drivers✓ Mortgage market declining✓ Non-mortgage recovery✓ EWS strength✓ USIS recovery✓ COVID recovery✓ Kount acquisition / ID&F
growth✓ New products
Mortgage MarketCore UC & ERC
Prior midpoint guidance
12%
51% / 27%14% / 0%
(6%)(4%)

17PROPRIETARY |
The Equifax Cloud will accelerate our product innovation, growth, and competitiveness
Equifax CloudThe Equifax CloudTM
Only cloud native data and technology company
Note: The cloud transformation is anticipated to be substantially complete by 2023.

18PROPRIETARY |
Vitality Index¹ and NPIs
Accelerating NPI revenue contribution
2021+NPIs:
85 launched through 2Q
Vitality IndexNPIs
1 Vitality index is percentage of revenue in a given year derived from new product releases over the prior three years and the current year.
2Q21 Product Roll-Outs● Payment Insights - Consumer-permissioned utility and telco data to
improve view of consumers' financial picture and help credit invisibles
● Mortgage 36 and Talent Report Employment Staffing from EWS addressing the income verification needs in the underwriting process and employment verification needs of staffing agencies
● Credit Vitality View App in the UK allowing comparison of market and company credit data trends
● Equifax Affordability Solutions in Australia & New Zealand delivering automated categorized income & expense verifications
93 13458 59
Total1H 85
Leveraging EFX Cloud to accelerate NPI roll-outs

19PROPRIETARY | 19PROPRIETARY |
Differentiated Data at Scale● ACRO: 228M credit records ● NC+: 237M payment records ● TWN: 119M employment records ● CFN & PayNet: 32M businesses/110M tradelines● Kount: Signals from 32B interactions● IXI: $24T+ in financial asset data
DIFFERENTIATED, PROPRIETARY DATA
ADVANCED ANALYTICS
CLOUD-NATIVE DATASCALABLE GLOBAL
PLATFORMSCloud-native Data Fabric
● 10B records keyed and linked● Deployed in 24 global markets● Enables multi-data solutions for
more intelligent decisions
Cloud-native Products and Applications
● Product delivery faster by 45% ● 225 APIs on the Equifax Developer Portal, 6096 users ● 8B+ API calls in the past 6 months
Advanced Analytics ● Build and test attributes faster● Leverage artificial intelligence and
machine learning● Patented, proprietary NDT● Develop models in days vs months ● 320 Data Scientists & Data
Analysts globally
Note: The cloud transformation is anticipated to be substantially complete by 2023.

20PROPRIETARY | 20PROPRIETARY |
✓ 26% Total / 29% Core revenue growth… 6th quarter of double-digit growth
✓ Strong sequential US B2B non-mortgage growth, up 9%
✓ Increased 2021 Guidance
✓ Leveraging EFX cloud for NPIs and growth
✓ Only Equifax capabilities
✓ Bolt-on M&A focus
EFX Strong 2Q record setting revenue of $1.235B up 26%, 29% core growth, sixth consecutive quarter of double-digit growth with sequential improvement
Raising full-year guidance for 2021 revenue and Adjusted EPS… 2021 midpoint revenue growth increased 375 bps to ~16%
EWS substantially outperforming mortgage market, growing records and penetrating new verticals… EFX’s largest and most profitable business
USIS winning in the marketplace… non-mortgage revenue up 21%, organic growth of 14%
Strong International growth of 25% in local currency... outgrowing markets
Leveraging EFX Cloud data and technology investments to accelerate innovation and NPIs
Cloud capabilities and strong cash generation driving bolt-on M&A focus… Data assets, EWS
Strong momentum into Second Half… EFX on offense

21PROPRIETARY |
Q&A

22PROPRIETARY |
Appendix

23PROPRIETARY |
Online / Verific. ~80% 46% 63% 70% 75% 57%
-Mortgage +100% +100% +100% +100% +50%
-Non-Mortgage (4%) 4% 15% 26% 65%Employer Svcs ~20% 75% 37% 35% 17% Flat
-UC / ERC +150% 73% 72% 47% (17%)-WFA, W2, Talent M.³, others (17%) (4%) (6%) (2%) 52%Online ~85% 12% 19% 22% 20% 11%
-Mortgage 47% 57% 60% 25% (2%)
-Non-Mortgage (11%) (5%) Flat 16% 24%Financial Mktg Svcs ~15% 1% (9%) (2%) 12% 14%
Online¹ >55% 25% 36% 43% 44% 31%EWS Employer Services ~11% 75% 37% 35% 17% FlatUSIS Fin. Mktg. Services ~6% 1% (9%) (2%) 12% 14%Total ~73% 28% 32% 37% 38% 25%
Revenue Trends -- US B2B
USB2B
USIS(~33% EFX Rev2)
EWS(~40% EFX Rev2)
% BU Rev² 2Q20 3Q20 4Q20 1Q21 2Q21
1. USIS Online + USIS Mortgage Solutions + EWS Verification Services
2. Based on Q2 2021 revenue3. Includes I9/Onboarding

24PROPRIETARY |Note: Local currency growth rates.1. Based on Q2 2021 reported revenue
% BU Rev¹ 2Q20 3Q20 4Q20 1Q21 2Q21
APAC ~36% (9%) Flat 4% 7% 21%LatAm ~18% (14%) (6%) (1%) 1% 30%Canada ~19% (13%) Flat 3% 13% 26%Europe ~27% (25%) (13%) 4% (5%) 27%- CRA ~19% (20%) (7%) (3%) (5%) 26%- Debt Management ~8% (34%) (26%) 19% (4%) 30%TOTAL 100% (15%) (5%) 3% 3% 25%
Revenue Trends -- International and GCS
Consumer Direct ~55% (3%) 6% 9% 11% 11%Partner ~45% (6%) (10%) (32%) (36%) (17%)
Total (5%) (2%) (13%) (17%) (3%)
INTL(~20% EFX Rev¹)
GCS(~7% EFX
Rev¹)

25PROPRIETARY |
Including One-Time Cloud Transformation Costs
~20.7%
Cloud Transformation Expense ($M)
2021 Guidance -- Continuing Strong Performance
Adj. EBITDA ($M)
Adj. EBITDA margin
Adj. EPS ($ / share) $5.71 $6.97 ~$8.32 ~$7.35
+18.5%
+25.4%
- vPY 22.1% ~19.4% ~5.5%- v2019 (Annualized) ~13.5%
$292 $358 ~$155 ~$155
Revenue ($M) $3,528 $4,128 ~$4,780- vPY 17.0% ~15.8%- v2019 (Annualized) ~16.4%
~15.8%~16.4%
~$4,780
~33.8%
Excluding One-Time Cloud Transformation Costs
* This slide contains forward-looking information, including 2021 guidance. Actual results may differ materially from our historical experience and our present expectations or projections. We undertake no obligation to publicly update or revise any forward-looking statements, whether as a result of new information, future events or otherwise, except as required by law.

26PROPRIETARY |
Dorian Hare • Investor Relations • [email protected]
Copyright © 2021 Equifax Inc. All Rights Reserved. Equifax is a registered trademark of Equifax Inc.

Investor RelationsJuly 2021

28PROPRIETARY |
EFX Overview
Workforce Solutions Overview
Identity and Fraud Overview
Security Transformation
Product and Technology
Supplemental Financial Information
Glossary
Index
p. 29-35
p. 36-41
p. 42-48
p. 49-51
p. 52-57
p. 58-70
p. 71-74

29PROPRIETARY |
Insights Are Created Through Connected and Differentiated Data
Property & ValuationWide-ranging National Data Set & Tools
Consumer DemographicMulti-source Targeting & Segmentation Database
Single-Source VerificationsIRS Transcripts, & Identity
Consumer CreditTraditional & Specialty Finance Records
Telco, Cable & Utility Unique National Data
Employment & IncomeDirect from Employers
Commercial CreditFinancial Trade, Receivables, & Lease Records
Commercial MarketingSmall / Medium Business Profiles
Auto Motor Vehicle Registration & Owner / Buyer Propensity Marketing Data
Asset & WealthAnonymous, Direct Measured Deposits & Investments
A Robust Foundation for Comprehensive Multi-Data Solutions
Education & CredentialsDegree, Graduation, & Professional Licensure
Consumer Consented InformationOpt-in Bank Transaction & Utility Data
Identity & FraudAuthentication, Known Fraud, & Real-Time Transaction Data
Certain data is ingested into the Equifax environment, and curated, enriched, and purposed. Moving from over 70 data silos, multiple sources of data are organized into a seamless, globally-distributed Data Fabric with logical separation and governing rules.

30PROPRIETARY |
AUSTRALIANEW ZEALAND
Broadening Our Global Presence in Important Growth Markets
CANADA UNITED KINGDOM
BRAZIL (~10% interest)
IBERIA
LATAM
INDIA
RUSSIA (50% interest)
UNITED STATES
MEXICO
Consumer Credit
Commercial Credit
Employment & Income
Identity & Fraud Analytics Collections
Key Revenue Drivers

31PROPRIETARY |
2020 Adjusted Adjusted EBITDA
Margin
A Strong Portfolio of Businesses
2020 Vertical Mix2020 Business Mix
Global Consumer Solutions
Workforce Solutions
USIS
GCS
International
Workforce Solutions
USIS
Financial 19%
Telco 3%
Commercial 5%
Consumer 6%
Mortgage 32%
Retail 2%
Auto 6%
Insurance 2%
Government 6%
Corporate(Employers) 9%
Healthcare 2% Other
4%
Resellers 4%2020 Adjusted
Revenue Growth (Constant $)
(4%)
(4%)
51%
14%
29.5%
22.4%
55.7%
44.6%
Note: Figures may not foot due to rounding.

32PROPRIETARY |
Workforce Solutions (WS)Accelerating growth through Work Number expansion, advanced analytical solutions, and
vertical expertise across direct and indirect channelsFocus Areas2020 Revenue Mix - $1,438M
Financial 6%
Commercial 1%
Mortgage 46%
Government 11%
Corporate:Talent Solutions
7%
Healthcare 6%
Auto2%
RECORD GROWTH DIGITAL
MORTGAGE GOVERNMENT
• Emphasis on a self-service, mobile-first customer experience
• Transform technology platforms to accelerate speed-to-market and increase flexibility
• Enhance partnerships and connector relationships to expand The Work Number® coverage, particularly in small to medium businesses
• Drive penetration with increased usage, system-to-system integration, and new states and programs
• Introduce new data solutions for the eligibility decision waterfall
• New Products
• Increasing the number of TWN to ACRO inquiries and utilization of TWN throughout the entire mortgage life cycle.
TALENT SOLUTIONS
• Increase customer value and digital access to data through enhanced solutions
• Leverage employment data in new use cases to grow penetration
I-9
• Grow I-9 Anywhere solution for remote hires with nationwide local completor network
ACQUISITIONS
Note: Figures may not foot due to rounding.
Corporate:Employer Services
20%

33PROPRIETARY |
US Information Solutions (USIS)Strengthen our foundation of assets and capabilities while investing in solutions and
adjacencies that accelerate sustainable growth in existing and new marketsFocus Areas2020 Revenue Mix - $1,483M
Financial 22%
Telco 6%
Commercial 7%
Consumer 5%
Mortgage 43%
Retail 1%
Auto11%
Insurance 3%
Government 3% GROWTH IN CORE
MARKETSBUILD EMERGING
BUSINESSES
INNOVATION ENGINE▪ New Product Innovation … targeting 50 NPIs over two year period▪ Fuel growth from Kount acquisition … leverage best in class AI-driven fraud
control services in digital payments and new account fraud; co-innovate in account opening and ID verification space; vertical expansion in eCommerce & retail
▪ Continue expansion of Luminate and Synthetic ID products▪ Data fabric driving multi-data asset products; leveraging cloud environment
to expand Ignite & Interconnect
▪ Drive Mortgage growth in core credit, digital mortgage, UDM and rental expansion
▪ Fuel growth in Financial Institutions, Digital Identity; expand & mature Auto
▪ Propel Commercial market expansion; continue to drive Paynet & Ansonia synergies; additional bolt-on M&A
▪ Continue Non-Mortgage expansion in Digital Banking & FinTech; synergy opportunities with Kount acquisition
▪ Broaden Marketing Services product offerings
Other 1%
Note: Figures may not foot due to rounding.

34PROPRIETARY |
Focus Areas
International (INTL)Address customer needs through unique data assets to drive insights delivered via strategic
technology platforms complemented by M&A for geographic and domain expansion.
INSIGHTS ID & FRAUDTECHNOLOGY
COLLECTIONS
▪ Build ID & Fraud exchanges
▪ Deployment of Fraud Transaction capabilities
▪ Digital Identity authentication
▪ Deliver cloud-based infrastructure in all markets
▪ Accelerate customer migration to new platforms
▪ Enhance digital consumer services and speed to market
▪ Debt Management & Recoveries (UK Private & Government)
▪ Global Expansion of Cyber Financial
2020 Revenue Mix - $862M
Financial 43%
Telco 7%
Auto 5%
Insurance 3%
Government 8%
Resellers 1% Other
14% ▪ New data (Geo, I/E, Digital) & exchanges
▪ Analytics enabled by Ignite Product Suite
▪ Global InterConnect delivery platform
EXPLORE & DEVELOP
▪ Inorganic growth, bolt on and strategic M&A
▪
▪ Int’l Work Number▪ Access to consumer and
commercial transaction data
Retail 6%
Healthcare <1%
Note: Revenue mix based on reported figures. Figures may not foot due to rounding.
Mortgage 1%
Consumer <1%
Commercial 10%

35PROPRIETARY |
Global Consumer Solutions (GCS)Helping consumers access their data to help them progress financially.
Focus Areas
PARTNERSDIGITAL EXPERIENCE
TECHNOLOGY STRATEGIC MARKETING
• Enable digital experiences that allow consumers easier access to information
• Deliver differentiated experiences for Financial Wellbeing and Identity Protection products.
• Co-innovating new solutions with existing strategic partners
• Help digital lending networks and marketplaces grow
• Engage consumers with targeted media, content and services that help consumers monitor their credit health
• Finalize cloud-based infrastructure to enhance digital consumer services, membership capabilities, and partner solutions
2020 Revenue Mix - $345M
Direct to Consumer 49% Indirect
Partners 51%
Note: Revenue mix based on reported figures. Figures may not foot due to rounding.

36PROPRIETARY |
Workforce Solutions Overview
37PROPRIETARY |
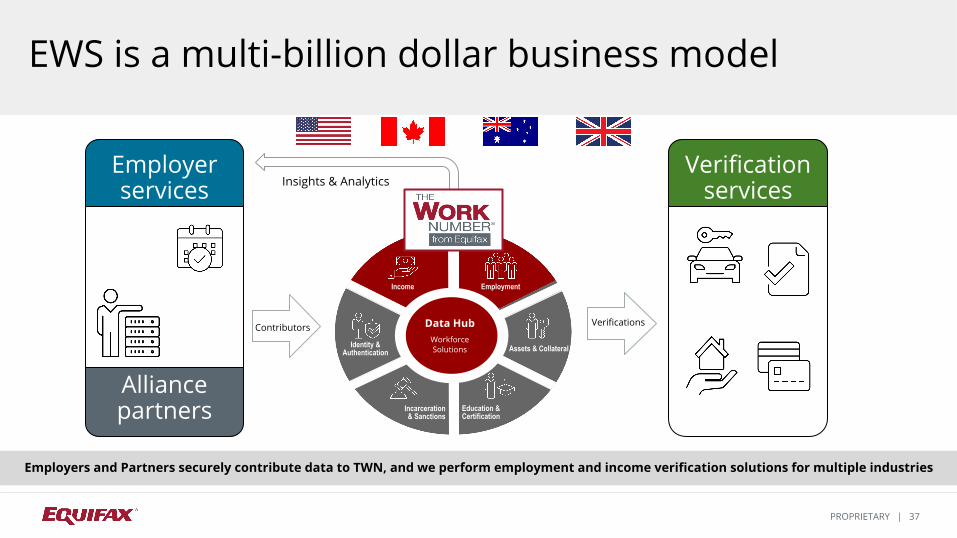
EWS is a multi-billion dollar business model
Employerservices
Alliancepartners
Verificationservices
Contributors Verifications
Insights & Analytics
Employers and Partners securely contribute data to TWN, and we perform employment and income verification solutions for multiple industries
Data HubWorkforceSolutions
Income Employment
Identity &Authentication Assets & Collateral
Education &Certification
Incarceration& Sanctions

38PROPRIETARY | 38PROPRIETARY |
EWS Delivering Strong Growth, Margin Expansion
Total EWS Revenue $764M $827M $950M $1.4B $302M $353M $377M $406M $481M $496M
Revenue by Year 2017- 2020 3-Year CAGR 23%
Revenue by Quarter 2020 - 2021
Note: Talent Solutions is included in Verification Services

39PROPRIETARY |
Multiple Drivers for EWS Revenue Growth
2021 Growth Drivers
✓ TWN Record Growth
✓ Deeper Integration with USIS in Key Verticals: Mortgage, Government, Banking, Auto, FinTech
✓ Expanding Key Employer Verticals: I-9, UC and Talent Solutions
✓ Penetration … more pulls / transactions
✓ New products / use cases
✓ Technology enables distribution … system-to-system, APIs
✓ International expansion
Number of Contributors (Thousands)
~35% increase 2Q2021 vs. 2Q2020
+14M increase 2Q2021 vs. 2Q2020
91M Unique SSNs
~50% BLS non-farm payroll
Number of Records (Millions)

40PROPRIETARY |
EWS Mortgage Growth: Increase Verifications per Loan
Distribution Expansion
Improve Trade Penetration
Increase Verification Pulls
Build Out Connectors
Expand Value Chain
● Grow transaction volumes through connector partners
● Develop new products, new product materials and training guides that educate customer “best-practice”
● Expanding TWN products beyond just loan origination
Revenue ($M)
3-YearCAGR 45%
● % Using System-to-System
Product Innovation

41PROPRIETARY |
Other EWS Key Verticals: Products and Trends
Government
Social Security Administration (SSA)
Payroll Exchange new initiative launches
2H 2021
Talent Solutions
New products provided candidate-based experience reporting developed based
on industry needs
I-9
I-9 Anywhere verification technology offers users a remote, seamless and
secure experience
Unemployment Claims
EWS Unemployment Claim volume reached 20x per day during 2020, peaking
in April
3-YearCAGR 21%
3-YearCAGR 22%
3-YearCAGR 13%
3-YearCAGR 21%
Reve
nue
($M
)

42PROPRIETARY |
Identity and Fraud
43PROPRIETARY | 43PROPRIETARY |
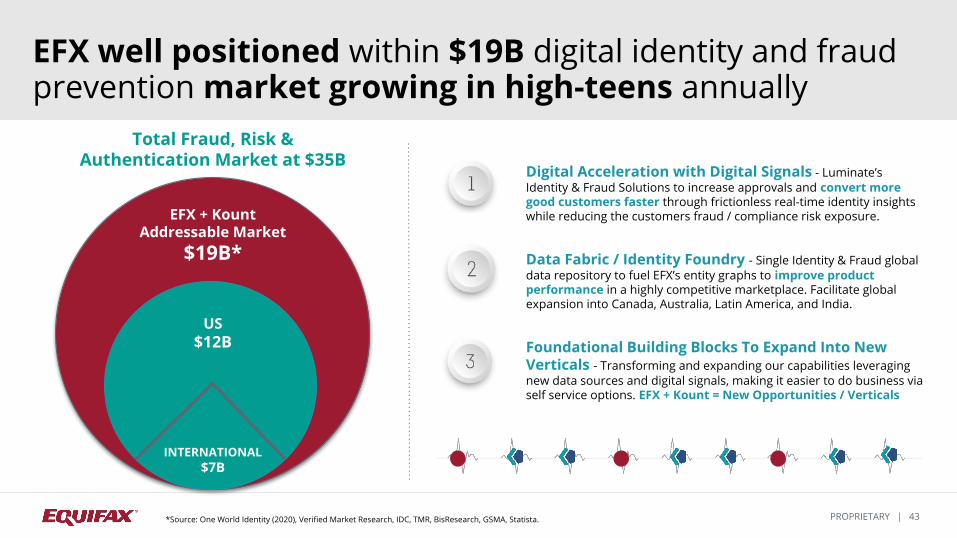
EFX + Kount Addressable Market
$19B*
Total Fraud, Risk & Authentication Market at $35B
US $12B
INTERNATIONAL $7B
Digital Acceleration with Digital Signals - Luminate’s Identity & Fraud Solutions to increase approvals and convert more good customers faster through frictionless real-time identity insights while reducing the customers fraud / compliance risk exposure.
Data Fabric / Identity Foundry - Single Identity & Fraud global data repository to fuel EFX’s entity graphs to improve product performance in a highly competitive marketplace. Facilitate global expansion into Canada, Australia, Latin America, and India.
Foundational Building Blocks To Expand Into New Verticals - Transforming and expanding our capabilities leveraging new data sources and digital signals, making it easier to do business via self service options. EFX + Kount = New Opportunities / Verticals
*Source: One World Identity (2020), Verified Market Research, IDC, TMR, BisResearch, GSMA, Statista.
EFX well positioned within $19B digital identity and fraud prevention market growing in high-teens annually
44PROPRIETARY | 44PROPRIETARY |
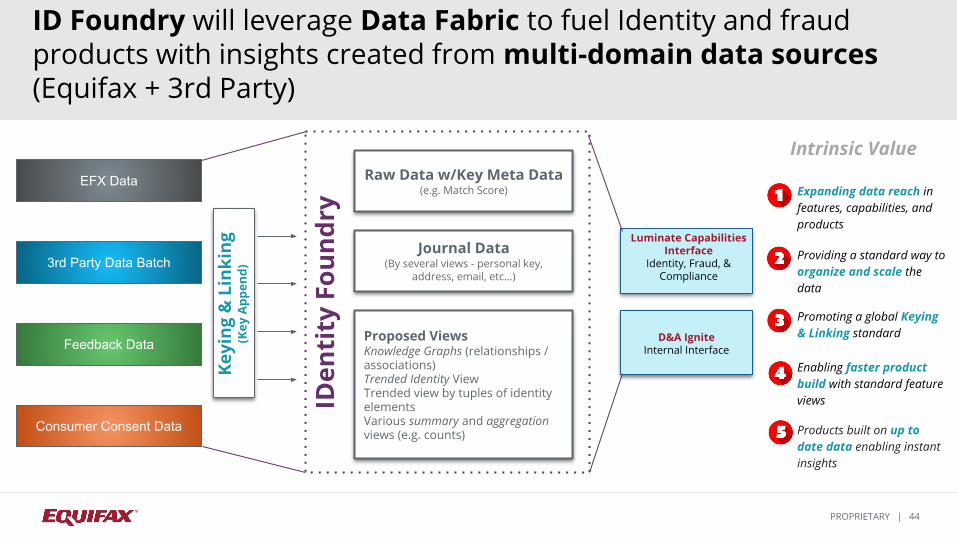
IDen
tity
Fou
ndry
EFX Data
3rd Party Data Batch
Feedback Data
Consumer Consent Data
Keyi
ng &
Lin
king
(Key
App
end)
Raw Data w/Key Meta Data (e.g. Match Score)
Journal Data(By several views - personal key,
address, email, etc…)
Proposed ViewsKnowledge Graphs (relationships / associations)Trended Identity ViewTrended view by tuples of identity elementsVarious summary and aggregation views (e.g. counts)
Luminate Capabilities Interface
Identity, Fraud, & Compliance
D&A Ignite Internal Interface
Intrinsic Value
Expanding data reach in features, capabilities, and products
Providing a standard way to organize and scale the data
Promoting a global Keying & Linking standard
Enabling faster product build with standard feature views
Products built on up to date data enabling instant insights
ID Foundry will leverage Data Fabric to fuel Identity and fraud products with insights created from multi-domain data sources (Equifax + 3rd Party)

45PROPRIETARY | 45PROPRIETARY |
Luminate Plug-In Digital Identity
Biometric Document
Verification
Identity Verification
Adaptive Authentication
Fraud Workbench
Trust Scores
Trust Scores
“Know Your Good Customers”
“Step Up Verification, When Needed”
1 “Quick & Frictionless Authentication”
2
“Provide Customers Confidence In Doing Business”
3
ComplianceAML
4“Help Customers Comply To National / State Laws”
56
“Prevent & Detect Fraud In Our Customer’s Portfolio”
Building On A Trusted Network
Identity Fraud
Luminate Identity, Fraud and Compliance solutions allow customers to connect their identity graphs with Equifax’s to provide seamless experiences while reducing the risk of fraud

46PROPRIETARY | 46PROPRIETARY |
Trust Scores
Solutions are delivered individually or packaged to meet varying customer needs.1 + 1 = ∞
Real-time association of daily “heartbeats” and “life events”
Intermittent ‘life events’
New to Credit Employment Rent & Utility Mortgage
Daily ‘heartbeats’
Frequent transactions at retail merchants, ecommerce sites, grocery stores, gas stations and others...
Together, Equifax and Kount provide a frictionless and safe transactional experience

47PROPRIETARY | 47PROPRIETARY |
Trust Scores
EQUIFAX WITH KOUNT COLLECTS AND CREATES DIVERSE PROPRIETARY DATA
EQUIFAX PRODUCES PROPRIETARY AND ACTIONABLE INSIGHTS
Initial ConsumerInteraction
Consumer“Shops” Application or
Checkout
Kount and Equifax monitor and manage Consumer receives
relevant timely offerings
Manage fraud and compliance
Evaluate fraud risk from first contact
Evaluate propensity and opportunity
Final fraud check / authentications
Establish eligibility
Confirm digital + physical relation
Pre-populate forms
Establish ongoing trust with device
Multifactor options
Friction-free personalization and offer optimization
Equifax + Kount enhances experience throughout the consumer journey, driving customer growth
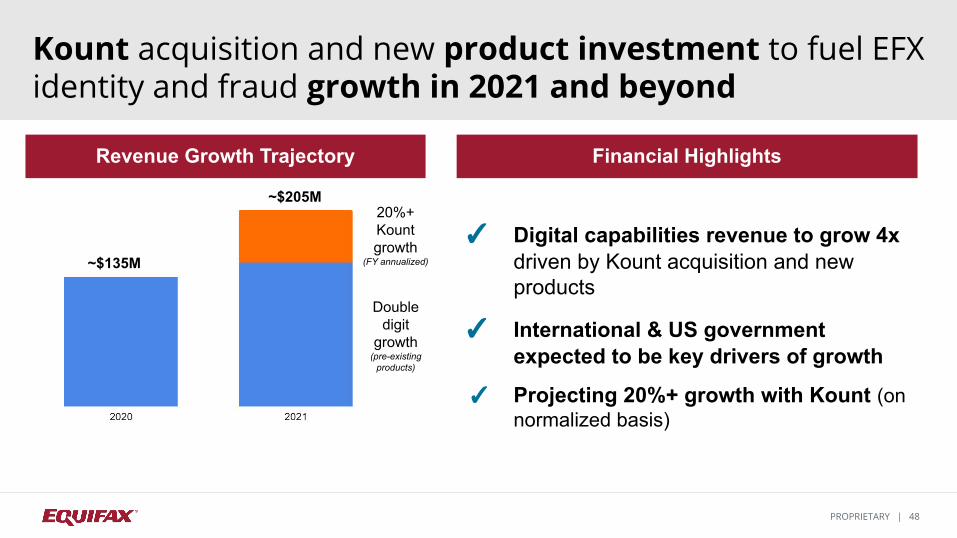
48PROPRIETARY | 48PROPRIETARY |
~$135M
✓ Digital capabilities revenue to grow 4x driven by Kount acquisition and new products
✓ International & US government expected to be key drivers of growth
✓ Projecting 20%+ growth with Kount (on normalized basis)
Revenue Growth Trajectory Financial Highlights
20%+Kount growth
(FY annualized)
Double digit
growth(pre-existing
products)
~$205M
Kount acquisition and new product investment to fuel EFX identity and fraud growth in 2021 and beyond

49PROPRIETARY |
Security Transformation

50PROPRIETARY |
2021 Priorities
As we evolve, we must continue to improve in order to stay ahead of our adversaries while supporting business growth.
We remain on offense, strengthening trust through customer enablement and compliance excellence, fostering innovation across our business, and optimizing execution to deliver frictionless security.
ACT 1BUILD | 2018
When we began our transformation journey we were faced with legacy infrastructure, a talent mix that skewed non-technical, and a reputation deficit to overcome. Our focus was on rapidly reducing risk in our environment while building a sustainable team for the future.
• Talent• Capabilities• Compensating Controls
ACT 2MATURE | 2019
2019 was a year of execution. We worked with the Technology team to make Cloud a reality and to embed security into development processes. We partnered with the external security community to help set and advance security standards. And we successfully regained certifications lost since the 2017 breach.
• Cloud Foundation• Coverage Expansion• Regulations & Certifications
ACT 3LEAD | 2020
In 2020 we built trust, and pursued security leadership as we matured capabilities throughout our program. We optimized our controls, expanded automation to remediate weaknesses, and remained a strong contributor to the advancement of security worldwide.
• Risk Awareness• Capability Automation• Control Assurance
Equifax Security Transformation
We have successfully executed our 3-year security transformation strategy, balancing risk and value to become an industry leader in security.

51PROPRIETARY |
The 4 Cs
Our transformation journey is one of significant growth, and we view our achievements across the categories of culture, controls, compliance, and customers. These are the pillars of our transformation and represent key areas where we must continue to demonstrate progress.
Expanded our cloud assurance tools, increasing visibility into our cloud security posture and driving productive collaborationEstablished a secure cloud environment to support FedRAMP complianceInvested in our on-premise FISMA environment to continue supporting US government customers
CULTURE CONTROLS
COMPLIANCE CUSTOMERS
Activated established crisis management processes to implement COVID-19 safety and security protocols while maintaining operationsEnhanced threat monitoring to manage risk with increases in employees working from homeDeployed a new employee security scorecard globally, measuring and reinforcing key security behaviors around training and phishing
Aligned our controls with the National Institute of Standards and Technology (NIST) Cybersecurity Framework and new NIST Privacy FrameworkEnhanced the M&A integration process to ensure that targets rapidly meet our security standardsContinued to improve our security program maturity as measured by independent third parties
Hosted our inaugural Customer Security Summit, demonstrating our commitment to transparencyContinued supporting the FBI and the US Dept. of Justice, resulting in the indictment of 4 members of the Chinese military for the 2017 cyberattackAdvocated for stronger federal security and privacy legislation with members of Congress and the Cyberspace Solarium Commission
Equifax Security Transformation
In 2020 we continued to mature our security program while demonstrating industry leadership through partnership and innovation.
52PROPRIETARY |
Product and Technology
53PROPRIETARY |
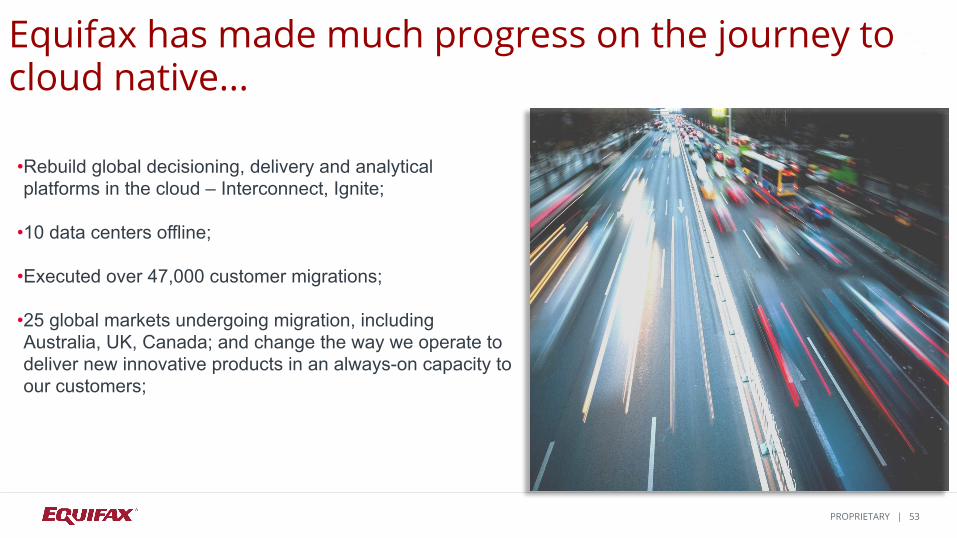
•Rebuild global decisioning, delivery and analytical platforms in the cloud – Interconnect, Ignite;
•10 data centers offline;
•Executed over 47,000 customer migrations;
•25 global markets undergoing migration, including Australia, UK, Canada; and change the way we operate to deliver new innovative products in an always-on capacity to our customers;
Equifax has made much progress on the journey to cloud native...

54PROPRIETARY |
Illustrative Savings¹
Cloud Native Benefits + Accelerated Product Innovation = Financial Results
Security
Always-on
Speed & Latency
Product Velocity
Single Data Fabric
Operating Scale
Product Portability
Cloud Native Benefits
Achieved 40% increase in NPIs
Greater than 30% improvement in time to market
Launched ~135 APIs to keep innovation at the forefront
Over 3K API Developer Portal Users
+
Product InnovationAcceleration
Results
=
1. Illustrative savings are full-year, run-rate figures that are based on 2019 cost / capital spending levels.
~$125MSub-total cost savings
~$240MTotal cash savings (Pre-tax)
~ +15% savings in Technology cost (excl. D&A);
~ +25% reduction in Product Development expense;
~ 35% reduction from current run rate of ~11% of revenue in 2019;
~$90M
~$35M
~$115M

55PROPRIETARY |
DeliveryConvenient and innovative channels through which products are delivered to end users.
ProductsUnique data, analytics or decisioning based solutions crafted to meet the needs of any sized organization across the globe.
PlatformsEquifax Platforms govern strategic data sets to either be delivered to users, data applications, or other products.
Data FabricCertain data is ingested into the Equifax environment, and curated, enriched, and purposed. Moving from over 70 data silos, multiple sources of data are organized into a seamless, globally-distributed Data Fabric with logical separation and governing rules.
Data Sourcing
WealthAuto
PropertyCredit
IncomeKnown
Fraud (KFE)
Consumer Consent
Internal Use
End Users
Customers
Consumers
Government
Partners
Delivery
Mobile
Batch
Stream
APIs
Web
Transmission
Batch
APIs
Web
Products
Platform
s
Analytics (Ignite)
Decisioning (InterConnect)
Identity(Luminate)
WealthAuto
PropertyCredit
IncomeKnown
Fraud (KFE)
Consumer Consent
Telco/Utilities
Employer
Workforce (The Work Number)
Other(ACRO etc…)
Spec
ialty
Fina
nce
Consumer
SpendCollections
Docum
ent
Verifica
tion
Bank
Transactions
Employment& Income
Utility
,
Pay T
V,
& Telec
om
Wea
lth
Identity &
Linka
geConsumer
Credit
Comm
ercialCredit
Deceased
Publ
icRe
cord
s
CorporateH
ierarchyCredit
Inquiries
AutoCom
mercial
LeasesAlternative
Finance
Firmogr
aphics
Prop
erty
Demographics
DDA
Rent
Life
Even
t
Watchlis
t/PEPs
Digital Audiences Education Email
Cura
te
DATA FABRIC
Inge
stCo
nnec
t
AnalyzeM
odelAI/M
L
Supplemental
Expanding
Core
Employer
Marketing
Identity/ Fraud
Verification/Authentication
Collections/Recovery
Risk/Credit
The NEW Equifax End-to-End Data Flow
56PROPRIETARY | 56
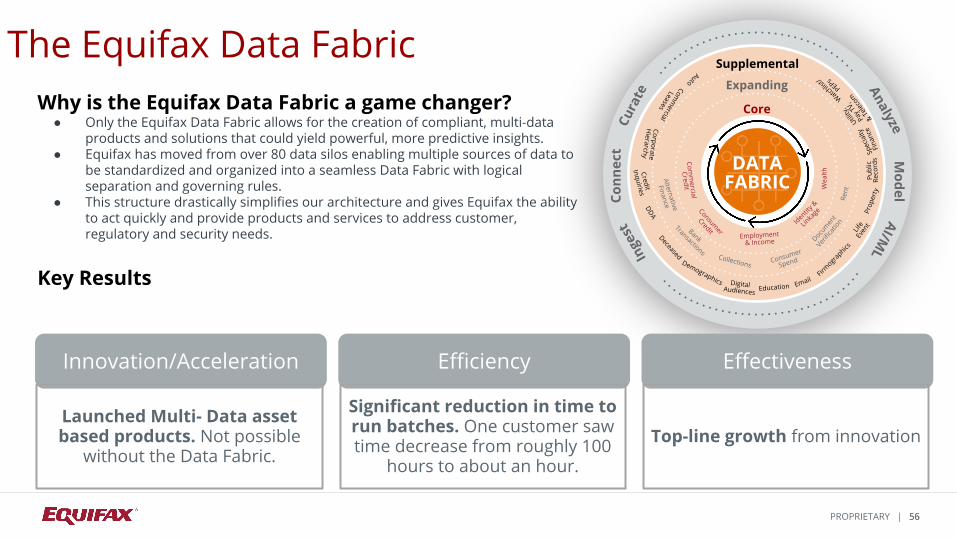
The Equifax Data FabricWhy is the Equifax Data Fabric a game changer?
● Only the Equifax Data Fabric allows for the creation of compliant, multi-data products and solutions that could yield powerful, more predictive insights.
● Equifax has moved from over 80 data silos enabling multiple sources of data to be standardized and organized into a seamless Data Fabric with logical separation and governing rules.
● This structure drastically simplifies our architecture and gives Equifax the ability to act quickly and provide products and services to address customer, regulatory and security needs.
Key Results
Spec
ialty
Fina
nce
Consumer
SpendCollections
Docum
ent
Verifica
tion
Bank
Transactions
Employment& Income
Utility
,
Pay T
V,
& Telec
om
Wea
lth
Identity &
Linka
geConsumer
Credit
Comm
ercialCredit
Deceased
Publ
icRe
cord
s
CorporateH
ierarchyCredit
Inquiries
AutoCom
mercial
LeasesAlternative
Finance
Firmogr
aphics
Prop
erty
Demographics
DDA
Rent
Life
Even
t
Watchlis
t/PEPs
Digital Audiences Education Email
Cura
te
DATA FABRIC
Inge
stCo
nnec
t
AnalyzeM
odelAI/M
LSupplemental
Expanding
Core
Innovation/Acceleration
Launched Multi- Data asset based products. Not possible
without the Data Fabric.
Efficiency
Significant reduction in time to run batches. One customer saw time decrease from roughly 100
hours to about an hour.
Effectiveness
Top-line growth from innovation

57PROPRIETARY |
Focused on the Core
EFX Cloud Transformation on track
TECHNOLOGY
Remediation and
transformation strategy
Build out core infrastructure
Migrate data, products, and
customers
Migrations, decom,
and new capabilities
2019 2020 20212018
Product rationalization showing value
Global platforms deployed and being leveraged
Expanding product
resources and growing NPIs
PRODUCT
Illustrative Savings¹ at 2019 Cost / Capital Spending Levels
~$90M
~$35M
~$125MSub-total cost savings
~$115M
~$240MTotal cash savings (Pre-tax)
~ +15% savings in Technology cost (excl. D&A);
~ +25% reduction in Product Development expense;
~ 35% reduction from current run rate of ~11% of revenue in 2019;
Driving decom and enabling
new markets & products
2022
Scaling cloud-based
products, Increasing NPI
Revenue
1. Illustrative savings are full-year, run-rate figures.

58PROPRIETARY |
Supplemental Financial Information

59PROPRIETARY |
General Corporate Expense, excluding non-recurring costs, was $127 million in 2Q21, as compared to $75 million in 2Q20. The increase is approximately half due to the inclusion of Technology Transformation Costs in Adjusted Operating Income, EBITDA and EPS in 2021. The remainder was primarily due to investments in Security and Corporate Technology, and higher variable compensation expense.
• General Corporate Expense, excluding non-recurring costs, is expected to be ~$140 million in 3Q21, as compared to $109 million in 3Q20. The increase is approaching half due to the inclusion of Technology Transformation Costs in Adjusted Operating Income, EBITDA and EPS in 2021. The remainder was primarily due to investments in Security and Corporate Technology, and higher variable compensation expense.
• General Corporate Expense, excluding non-recurring costs, is expected to be ~$550 million in 2021, as compared to $368 million in 2020. The increase is approximately half due to the inclusion of Technology Transformation Costs in Adjusted Operating Income, EBITDA and EPS in 2021. The remainder was primarily due to investments in Security and Corporate Technology, and higher variable compensation expense.
Capital Expenditures (incurred) in 2021 is expected to be approximately $450 million. Capital Expenditures in 2Q21 was $117 million.
Depreciation and Amortization, excluding amortization of acquired intangible assets, is expected to be approximately $305 million in 2021, and was $77 million in 2Q21.
• Amortization of acquired intangible assets is expected to be approximately $158 million in 2021, and was $40 million in 2Q21.
Interest Expense in 2Q21 was $35 million, down $2 million from 2Q20. • Interest Expense in 3Q21 is expected to be approximately $34 million.• Interest Expense in 2021 is expected to be $139 million.
Other Income and (Expense) in 2Q21 was $9 million of income, flat from 2Q20.• Other Income and Expense in 3Q21 is expected to be approximately $8 million of income, as compared to 3Q20 of $9 million of income. • Other Income and Expense in 2021 is expected to be approximately $34 million of income, as compared to 2020 of $40 million of income.
2021 General Corporate Expense, Capital Spending, D&A, Interest Expense and Other Income and Expense, excluding non-recurring costs

60PROPRIETARY |
2019 - 2021 Effective Income Tax Rate• The effective tax rate used in calculating our GAAP and Adjusted EPS is as follows:
GAAP EPS Adjusted EPS
1Q 2019 13.7% 24.1%2Q 2019 23.3% 24.6%3Q 2019 14.9% 21.2%4Q 2019 46.3% 22.7%FY 2019 8.6% 23.1%FY 2020 23.2% 23.7%1Q 2021 24.4% 25.3%2Q 2021 22.1% 24.2%3Q 2021 Estimate ~23.5%FY 2021 Estimate ~24%
See Earnings Release for reconciliation of non-GAAP measures and related disclosures.

61PROPRIETARY |
2021 Cloud Technology and Data Transformation Impacts
As transformed cloud native systems go into production, we are incurring increased and redundant costs until legacy systems are decommissioned. Increased costs reflect the following:
• Depreciation & Amortization increases (driven by Tech Transformation system investments)• Cloud and Other Operating Costs on new systems, net of savings from legacy system decommissioning
- Cost benefits from elimination of legacy system costs will begin to ramp in 2H21
3Q21$ $ / share
$13M-$17M $0.08-$0.10
Redundant System Costs during Transition (incl. in 2021 and 2020 Adj. Results) - Change from 2020
Decommissioning Savings includes reduced system costs, and related technical, operations, and development cost estimates.
Legacy system decommissioning COGS savings are expected to exceed new Cloud Native System COGS beginning in late-2021
• These net COGS savings will then ramp toward 15% Tech COGS Savings Goal over 2022 and 2023
CY21 $ $ / share
2Q21$
$24M
$ / share
$0.15Technology Transformation Expense (incl. in 2021 Adj. Results)
$ $ / share$
$38M
$ / share
$0.23 ~$40M ~$0.25
$ $ / share
$74M-$84M $0.46-$0.52
~$155M ~$0.97

62PROPRIETARY | 62PROPRIETARY |
2020-22 Cloud Transformation Cost / Benefits Framework
~($50)
2021
Legacy System Savings less Cloud Costs¹ (F/(U)):
1. Impact of cumulative decommissioning savings from 2019 offset by all cloud costs on transformed systems. 2. In 2020, Transformation Expense estimated at $358M excluded from Adjusted Pre-Tax Income and EPS.3. 2021 at midpoint of guidance. 2022 is Preliminary Estimate.
2022
Transformation Expense (One-Time):
Depreciation and Amortizations :
Pre-Tax Adj. Earnings Impact:
2020
~$155
~$305
~$35
~$50
~$345
$85
~$40
Capital Expenditures:
($27)
$358²
$249
$25
$58
~$24
~$56
- % of Revenue³:
vPY vPYvPY
$431 $56 ~$450 ($19)10.5% ~9+% ~8%130 bps+ ~100 bps+
Redundant System Costs / Cloud Cost Savings: $83 ~$80 ~$45
Impact on Adjusted Earnings: ~$105NA² ~$155Impact on GAAP Earnings: ~$105$67 ~$223
Impact on Adjusted Earnings: $83 ~$235Impact on GAAP Earnings: $150 ~$143
Tail-wind
in 2022
~$150~$150
($millions)Operating Cost Impacts (ongoing):

63PROPRIETARY | 63PROPRIETARY |
2020 by the Numbers
+16%Revenue Growth
Adjusted EBITDA Margin
USIS EWS INTL GCS
AS REPORTED+51%
AS REPORTED-4%
LOCAL CURRENCY-4%
LOCAL CURRENCY
44.6%+0bps
55.7%+710bps
29.5%-90bps
22.4%-220bps
+18%
EFX
AS REPORTED
36.2%+240bps
Adjusted EPS $6.97+22%
$1,483MRevenue AS REPORTED
$1,438MAS REPORTED
$862MAS REPORTED
$345MAS REPORTED
$4,127MAS REPORTED

64PROPRIETARY |
Broad Based Execution in 2020 to Strengthen EquifaxUSIS EWS INTL GCS
Revenue: +14% Revenue: +51% C$ Revenue: -4% C$ Revenue: -4%+ 8% non-market mortgage growth+ COVID response: 6 solutions suites,
22 market pulses, & $16m in new sales
+ Launched 29 new products+ Migrated +12k customers to cloud
+ Grew TWN records to 114M+ Significantly expanded TWN record
contributors, 1M++ Mortgage outperforms; Non
Mortgage growth driven by U.C./Talent Solutions/I-9
+ Introduced new products to the marketplace
+ Continued Transformation roll out (IC SaaS, Luminate)
+ Renewed ASNEF in Spain, stepped up India stake to 100%
+ Launched 93 new products
+ Significant expansion of myEquifax subscriber base to 9M members (+300% growth)
+ Strong momentum in D2C - +9% revenue growth in 4Q20
+ Leveraging cloud to drive new logos in Partner business
Security Technology D&A+ Implemented COVID-19 safety and
security protocols including enhanced threat monitoring
+ Deployed a security scorecard to employees globally
+ Expanded cloud assurance tools, increasing visibility into our cloud security posture
+ Hosted our inaugural Customer Security Summit
+ Continued to improve security program maturity as measured by independent third parties
+ 710 applications rebuilt on the cloud & 9 exchanges rebuilt on the Data Fabric including the core consumer risk exchange
+ Made substantial progress on customers migration with over 47K B2B customers migrated.
+ Launched 134 NPIs + Executed the transition of 21K
workers to work from home+ Launched 20+ new Ignite customers
in the cloud in US, UK, Latam and Australia
+ Covid Response - launched new weekly trends, hardship attributes, Ignite sandbox and 32+ products globally
+ Customer Event - Ignite LIVE 2,245+ customers, 29 sessions, 7 cities
+ Explainable AI – patents issued for NDT2 & 3, NDT4 filed
+ Ignite - 280+ global deployments+ TWN - coverage on 90M unique
consumers
2020
65PROPRIETARY |
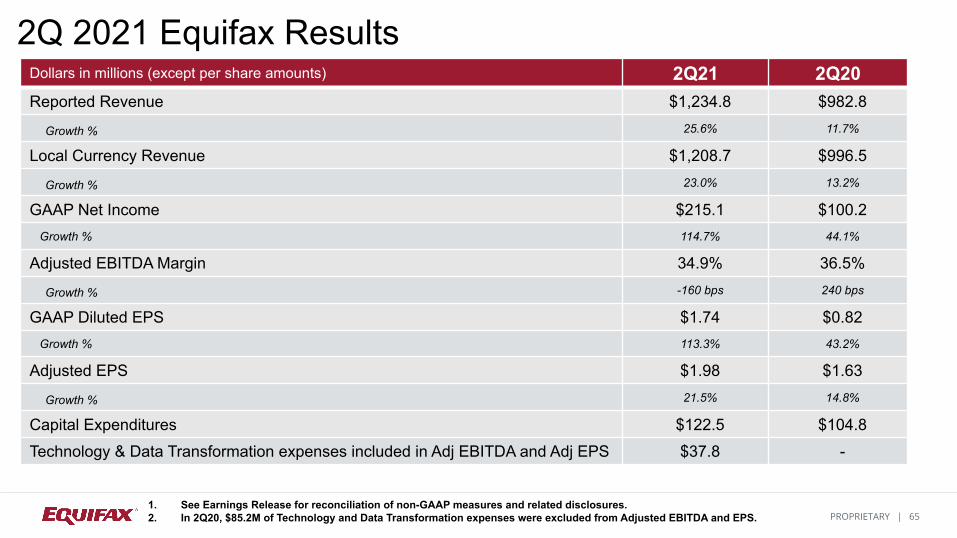
Dollars in millions (except per share amounts) 2Q21 2Q20Reported Revenue $1,234.8 $982.8
Growth % 25.6% 11.7%
Local Currency Revenue $1,208.7 $996.5
Growth % 23.0% 13.2%
GAAP Net Income $215.1 $100.2 Growth % 114.7% 44.1%
Adjusted EBITDA Margin 34.9% 36.5%
Growth % -160 bps 240 bps
GAAP Diluted EPS $1.74 $0.82 Growth % 113.3% 43.2%
Adjusted EPS $1.98 $1.63
Growth % 21.5% 14.8%
Capital Expenditures $122.5 $104.8
Technology & Data Transformation expenses included in Adj EBITDA and Adj EPS $37.8 -
2Q 2021 Equifax Results
1. See Earnings Release for reconciliation of non-GAAP measures and related disclosures.2. In 2Q20, $85.2M of Technology and Data Transformation expenses were excluded from Adjusted EBITDA and EPS.

66PROPRIETARY |
2Q21 Business Unit PerformanceReported
Revenue GrowthLocal Currency
Revenue Growth Adj. EBITDA Margin Adj. EBITDA Margin Growth / (Decline)
Workforce Solutions 40% 40% 58.0% 160 bps
Verification Services 57% 57% N/A N/A
Employer Services -% -% N/A N/A
USIS 11% 11% 40.3% (380 bps)
Online 13% 13% N/A N/A
Mortgage Solutions (4%) (4%) N/A N/A
Financial Marketing 14% 14% N/A N/A
International 39% 25% 27.3% 540 bps
Asia Pacific 40% 21% N/A N/A
Europe 42% 27% N/A N/A
Latin America 29% 30% N/A N/A
Canada 42% 26% N/A N/A
Global Consumer Solutions (2%) (3%) 22.5% 170 bps
See Earnings Release for reconciliation of non-GAAP measures and related disclosures.

67PROPRIETARY |
Dollars in millions (except per share amounts) FY 2020 FY 2019Reported Revenue $4,127.5 $3,507.6
Growth % 17.7% 2.8%
Local Currency Revenue $4,152.1 $3,582.3
Growth % 17.7% 5.0%
GAAP Net Income $520.1 ($384.1) Growth % 235.4% (224.5%)
Adjusted EBITDA Margin 36.2% 33.8%
Growth % 240 bps (60 bps)
GAAP Diluted EPS $4.24 ($3.15) Growth % 234.6% (223.8%)
Adjusted EPS $6.97 $5.71
Growth % 22.1% (3.5%)
Capital Expenditures $421.3 $399.6
FY 2020 Equifax Results
See Earnings Release for reconciliation of non-GAAP measures and related disclosures.

68PROPRIETARY |
FY 2020 Business Unit PerformanceReported
Revenue GrowthLocal Currency
Revenue Growth Adj. EBITDA Margin Adj. EBITDA Margin Growth / (Decline)
Workforce Solutions 51% 51% 55.7% 710 bps
Verification Services 58% 58% N/A N/A
Employer Services 34% 34% N/A N/A
USIS 16% 16% 44.6% 0 bps
Online 16% 16% N/A N/A
Mortgage Solutions 46% 46% N/A N/A
Financial Marketing (1%) (1%) N/A N/A
International (6%) (4%) 29.5% (90 bps)
Canada (3%) (2%) N/A N/A
Latin America (16%) (3%) N/A N/A
Europe (7%) (8%) N/A N/A
Asia Pacific (1%) (1%) N/A N/A
Global Consumer Solutions (4%) (4%) 22.4% (220 bps)
See Earnings Release for reconciliation of non-GAAP measures and related disclosures.

69PROPRIETARY |
Dollars in millions FY18 FY19* 1Q20 2Q20 3Q20 4Q20 FY20*
CYBERSECURITY RELATEDTechnology and Data Transformation¹ $307.2 $292.1 $78.6 $85.2 $83.0 $111.5 $358.5
Product Liability $20.4 $3.9 $- $- $- $- $-
Legal and Investigative Fees $73.6 $41.3 $2.6 $2.1 $0.7 $1.1 $6.5
Litigation and Regulatory Accruals $- $913.3 $- $- $- $- %-
Gross Expenses $401.2 $1,250.6 $81.2 $87.3 $83.7 $112.6 $365.0
Insurance Recoveries ($75.0) ($112.4) $- $- $- $- $-
Net Expenses $326.2 $1,138.2 $81.2 $87.3 $83.7 $112.6 $365.0
OTHER ITEMSInternal resource realignment $46.1 $11.5 $- $- $- $- $-
Other** $18.5 $26.3 $- $- $- $- $-
Total $390.8 $1,176.0 $81.2 $87.3 $83.7 $112.6 $365.0
2018 - 2020 Cybersecurity Related Costs and Other Items
1. Beginning in 2021, Technology and Data Security Costs are included in Adj Oper Inc, Adj EBITDA, and Adj EPS. Detail on these expenditures will be provided in 2021 for comparability to prior periods.
Amounts in the table above have been excluded from GAAP earnings. See Earnings Release for reconciliation of non-GAAP measures and related disclosures.
*FY19 and FY20 amounts are as reported for the full year, which may vary slightly from the sum of all quarters, due to rounding**Included 2019 other items for consistency.
70PROPRIETARY |
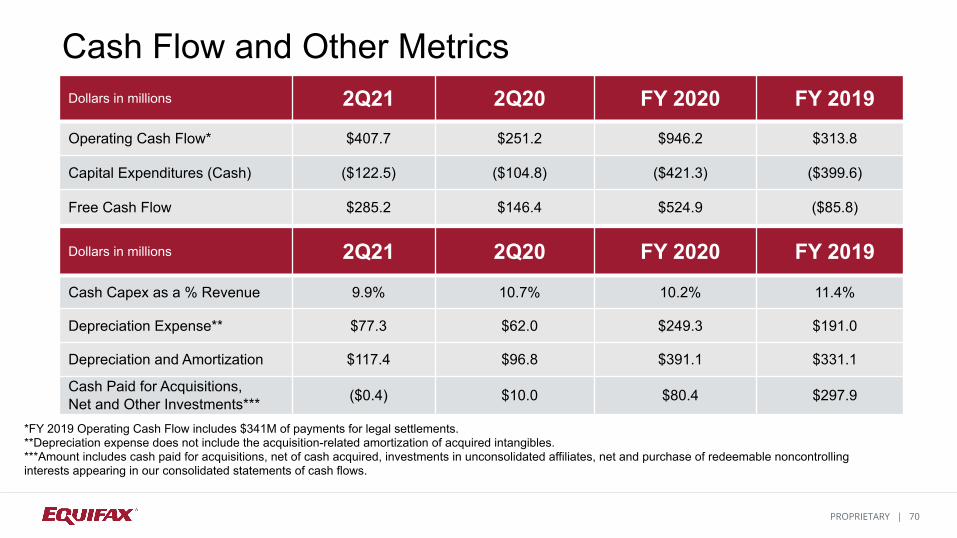
Cash Flow and Other MetricsDollars in millions 2Q21 2Q20 FY 2020 FY 2019
Operating Cash Flow* $407.7 $251.2 $946.2 $313.8
Capital Expenditures (Cash) ($122.5) ($104.8) ($421.3) ($399.6)
Free Cash Flow $285.2 $146.4 $524.9 ($85.8)
Dollars in millions 2Q21 2Q20 FY 2020 FY 2019
Cash Capex as a % Revenue 9.9% 10.7% 10.2% 11.4%
Depreciation Expense** $77.3 $62.0 $249.3 $191.0
Depreciation and Amortization $117.4 $96.8 $391.1 $331.1
Cash Paid for Acquisitions, Net and Other Investments*** ($0.4) $10.0 $80.4 $297.9
*FY 2019 Operating Cash Flow includes $341M of payments for legal settlements.**Depreciation expense does not include the acquisition-related amortization of acquired intangibles.***Amount includes cash paid for acquisitions, net of cash acquired, investments in unconsolidated affiliates, net and purchase of redeemable noncontrolling interests appearing in our consolidated statements of cash flows.

71PROPRIETARY |
Glossary

72PROPRIETARY |
Term Our Definition GLOSSARYClosed Exchange A give-to-get model where data providers determine the content of the database, utilization requirements/obligations, and governance
philosophy; generally, all data providers contribute the same amount/type of data in return for their access to the consolidated data.
LEAN The process of streamlining various processes to improve both operating efficiency and effectiveness.
Data & Analytics (D&A) The organization of our data and analytic professionals responsible for developing new analytic insights used for new products and other research endeavors.
Insights Analytical interpretations of various data assets that enable institutions to make better, more precise, real time decisions.
Fused Scores A statistical process where multiple databases/scores are integrated into a single insight for customers to consume/integrate into their internal IT platforms.
Verticals Our various end-use markets aka industry verticals; reflects how we organize our sales professionals and go-to-market strategies.
Enterprise Selling The process whereby our sales organizations represent ALL of Equifax’s capabilities to their respective vertical focus.
Connectors Institutions that enable broader, more diverse distribution of insights and information.
InterConnect The global IT platform whereby many customers consume our data and insight products; our most common decisioning platform that is and has been developed for global implementation.
Adjusted EBITDA Consolidated Net Income Attributable to Equifax adding back Depreciation & Amortization, taxes, select periodic (i.e. less frequent) one-time items, e.g. restructuring charges, large tax credits, etc., and net Interest Expense (excluding Interest Income).
Adjusted EPS GAAP EPS excluding acquisition amortization and select periodic (i.e. less frequent) one-time items, e.g. restructuring charges, large tax credits, etc.
Adjusted Revenue GAAP revenue excluding charges related to Q3 2019 settlements with commercial customers.

73PROPRIETARY |
Term Our Definition TECHNOLOGY GLOSSARY
Agile A method of project management used in software development that is characterized by the division of tasks into short phases of work and frequent reassessment and adaptation of plans.
API – Application Programming Interface A software intermediary that allows two applications to talk to each other.
Architecture The process by which organizations standardize and organize IT infrastructure to align with business goals.
Automation The use of software to create repeatable instructions and processes to replace or reduce human interaction with IT systems.
Cloud First A strategy where any new or updated IT project will evaluate safe, secure cloud computing options before making any new investments.
Cloud NativeAs defined by the Cloud Native Computing Foundation (CNCF), Cloud native computing uses an open source software stack to deploy applications as microservices, packaging each part into its own container, and dynamically orchestrating those containers to optimize resource utilization.
Data Analytics The process of examining data to draw conclusions about the information they contain.
Data Catalog Metadata containing data objects definitions that enable any user to discover, understand and consume data store in an Enterprise data sources.
Data Center A physical facility that enterprises use to house their business critical applications and information.
Data Encryption The conversion of data from a readable format into an encoded format that can only be read or processed by people with access to a secret key or password.
Data Fabric A converged platform supporting the diverse data management, processing and access needs across all disparate data sources and infrastructure types. A data fabric focuses on the data aspect of cloud computing as the unifying factor.
Data Ingestion The process of obtaining and importing data for immediate use or storage in a database.
Data Insight Information gained from analyzing data that could be used to make better business decisions.

74PROPRIETARY |
Term Our Definition TECHNOLOGY GLOSSARYData Gateway A system that connects to multiple data sources and provides a single and central point of access to connect to each data source.
Data Governance The overall management of the availability, usability, integrity and security of data used in an Enterprise.
Data Lineage Data life cycle that describes the data’s origins and where its transformations over time.
Data Linking A technique for connecting pieces of information that are thought to relate to the same person, family, place or event.
Data Modeling A set of tools and techniques used to understand and analyze how an organization should collect, update and store data.
Data Security The process of protecting data from unauthorized access and data corruption throughout its lifecycle.
Data Silo A collection of information in an organization that is isolated from and not accessible by other parts of the organization.
Data Taxonomy Taxonomy is the science of data classification according to a predetermined system to provide a conceptual framework for discussion, analysis of information retrieval.
Data Tokenization Tokenization is the process of replacing sensitive data such as a Credit Card Primary Account Number (PAN) or Social Security Number with unique identification symbols that retain all the essential information about the data without compromising its security.
Decisioning System A computerized information system that allows to sift through and analyze massive reams of data and compile information that can be used to solve problems and make better decisions.
Deployment Interrelated set of activities that make a software system available to the users.
IVR – Interactive Voice Response A technology that allows a computer to interact with humans through the use of voice.
On Premises Traditional methods of installing and customizing software on the customer’s own computers that reside inside their own data center.

75PROPRIETARY |
Dorian Hare • Investor Relations • [email protected]
Copyright © 2021 Equifax Inc. All Rights Reserved. Equifax is a registered trademark of Equifax Inc.