Preparation and characterization of nonaqueous electrolyte ...

1186 Macromolecules 1986, 19, 1186-1194
(6) Phillips, D.; Roberts, A. J.; Soutar, I. Polymer 1981, 22, 293. (7) Phillips, D.; Roberts, A. J.; Soutar, I. Eur. Polym. J . 1981, 17,
101. (8) Phillips, D.; Roberts, A. J.; Soutar, I. J . Polym. Sci., Polym.
Phys. Ed. 1982, 20, 411. (9) Soutar, I.; Phillips, D.; Roberts, A. J.; Rumbles, G. J . Polym.
Sci., Polym. Phys. Ed. 1982, 20, 1759. (10) De Schryver, F. C.; Demeyer, K.; Van der Auweraer, M.;
Quanten, E. Ann. N.Y. Acad. Sci. 1981, 366, 93. (11) Birks, J. B.; Dyson, D. J.; Munro, I. H. Proc. R. Soc. London
1963, 275, 575. (12) Goldenbere. M.: Emert. J.: Morawetz. H. J . Am. Chem. Soc. , , , ,
1978, 100,7171.’ (13) Liao. T.-P.: Okamoto. Y.: Morawetz, H. Macromolecules 1979,
12, 535. (14) Aspler, J. S.; Guillet, J. E. Macromolecules 1979, 12, 1082. 115) Holden. D. A.: Wane. P. Y.-K.: Guillet. J. E. Macromolecules
“I , ,
1980, 13, 295.~ (16) Fredrickson. G. H.: Frank. C. W. Macromolecules 1983. 16. . , , .
572, 1198. (17) Ediger, M. D.; Fayer, M. D. Macromolecules 1983, 16, 1839. (18) Fredrickson, G. H.; Anderson, H. C.; Frank, C. W. Macro-
molecules 1984, 17, 54. (19) Hargreaves, J. S.; Webber, S. E. Macromolecules 1984.17, 235. (20) Holden, D. A.; Ren, X.-X.; Guillet, J. E. Macromolecules 1984,
17, 1500. (21) Holden, D. A.; KoviFovi, J.; Guillet, J. E.; Engel, D.; Rhein,
T.; Schulz, R. C. Eur. Polym. J . 1983, 19, 1071. (22) Hopff, E. A.; Lussi, H. Makromol. Chem. 1963, 62, 31. (23) Engel, D.; Schulz, R. C. Makromol. Chem. 1981, 182, 3279. (24) Aspler, J. S.; Hoyle, C. E.; Guillet, J. E. Macromolecules 1978,
11, 925.
(25) Bevington, P. R. “Data Reduction and Error Analysis for the Physical Sciences”; McGraw-Hill: New York, 1969.
(26) Holden, D. A,, unpublished results. (27) Bokobza, L.; Jasse, B.; Monnerie, L. Eur. Polym. J . 1977, 13,
921. (28) Nishijima, Y.; Yamamoto, M. Polym. Prep., Am. Chem. Soc.,
Diu. Polym. Chem. 1979, 20 (l), 391. (29) De Schryver, F. C.; Moens, L.; Van der Auweraer, M.; Boens,
N.; Monnerie, L.; Bokobza, L. Macromolecules 1982, 15, 64. (30) De Schryver, F. C.; Vandendriessche, J.; Toppet, S.; Demeyer,
K.; Boens, N. Macromolecules 1982, 15, 406. (31) De Schryver, F. C.; Demeyer, K.; Toppet, S. Macromolecules
1983, 16, 89. (32) Collart, P.; Demeyer, K.; Toppet, S.; De Schryver, F. C. Mac-
romolecules 1983, 16, 1390. (33) Evers, F.; Kobs, K.; Memming, R.; Terrell, D. R. J . Am. Chem.
SOC. 1983, 105, 5988. (34) Itagaki, H.; Okamoto, A.; Horie, K.; Mita, I. Chem. Phys. Lett.
1981, 78, 143. (35) Gupta, A.; Liang, R.; Moacanin, J.; Kliger, D.; Goldbeck, R.;
Horwitz, J.; Miskowski, V. Eur. Polym. J . 1981, 17, 485. (36) Nakahira. T.: Ishizuka. S.: Iwabuchi. S.: Koiima. K. Macro-
molecules 1982, 15, 1217. (37) Pasch. N. F.: Webber. S. E. Chem. Phvs. 1976. 16. 361. (38) Paschi N. F.; Webber, S. E. Macromchcules 1978, 11, 727. (39) Pasch, N. F.; McKenzie, R. E.; Webber, S. E. Macromolecules
1978, 11, 733. (40) Webber, S. E.; Avots-Avotins, P. E. Macromolecules 1979, 12,
708. (41) Kim, N.; Webber, S. E. Macromolecules 1980, 13, 1233. (42) Burkhart, R. D.; AvilBs, R. G.; Magrini, K. Macromolecules
1981, 14, 91.
Electrostatic Interactions between Ions and DNA Estimated with an Electrolyte Tank Mark Troll, Daniel Roitman, Joan Conrad, and Bruno H. Zimm* Department of Chemistry, University of California (Sun Diego), La Jolla, California 92093. Received October 2, 1985
ABSTRACT: By the use of an electrolyte tank, a device that is effectively an analog computer, we find expressions for the electrostatic interactions between models of small ions in solution around a model of a DNA molecule. In this way we can take account of the modifications of Coulomb’s law produced by the polarization charges on the surface of discontinuity in dielectric constant (permittivity) between the low- permittivity DNA and the high-permittivity water. Both the simplest model for the DNA, a circular cylinder, and a more realistic model, a helix, were examined. The effects of the low permittivity of the DNA are (1) to create a short-ranged repulsion between the DNA and ions in the water as the result of an image-charge-like phenomenon; (2) to shield charges on opposite sides of the DNA from each other; (3) to enhance the interaction of charges on the same side of the DNA. The total effect is to raise the energy of charges in the grooves of the helix. The maximum energy increases are several times kBT, even for univalent ions, so the effects of the low permittivity on the ion distribution are expected to be substantial.
Introduction In this paper we attempt to find improved expressions
for the energy of electrostatic interactions between ions in solutions containing large polyelectrolyte molecules, in particular DNA molecules, expressions that can be used in Monte Carlo calculations of the ionic distributions in such solutions. These electrostat ic in te rac t ions a r e fun - damen ta l ly Coulomb interact ions, but they are modified b y t h e d iscont inui ty in pe rmi t t i v i ty (dielectric cons t an t ) between the polyelectrolyte molecule and the solvent. Modifications of the bare Coulomb interaction are implicit i n the well-known treatment of g lobular p ro te ins b y Tanfo rd and Kirkwood,’ but t h e y have not hitherto been considered in a n y detail in the case of long polyelectrolytes such as DNA, as f a r as we know except fo r one s t u d y b y Bailey.2
Elec t ros ta t ic po lar iza t ion fields are induced b y the charged ions at a d iscont inui ty in the permitt ivity. E a c h ion interacts with i t s own polarization field to produce a change i n i t s self-energy. The in t e rac t ion is dependent
0024-9297/86/2219-1186$01.50/0
upon the geometry of the dielectric discontinuity and the distance of the ion from the discont inui ty ; for example, ions are repelled from the plane surface of a low-permit- tivity region by the well-known image-charge effect. Each ion also interacts with the polarization fields of other ions, an interaction that is dependent upon the geometry of the region and the dis tances of both ions f rom the discontin- ui ty; this modifies the usual Coulomb interact ion. Of course, the representation of the sur face between a real molecule and the solvent as a surface between two regions of different pe rmi t t i v i ty can only be an approximat ion . However, i n the present state of ignorance about the hy- dration layers around ions and macromolecules, the ap- proximat ion of a s imple sur face seems to be reasonable. The magn i tude of these in te rac t ions c a n be ca lcu la ted analytically only for a few simple geometries. For others, the magni tudes can be obta ined f rom an analog computer known as an electrolyte tank.3-6
The advantage of the electrolyte tank is simplicity and adap tab i l i t y to a wide var ie ty of shapes represent ing t h e
0 1986 American Chemical Society

Macromolecules, Vol. 19, No. 4, 1986
polyelectrolyte molecule; the disadvantage is lack of pre- cision. The same problems could be solved on a digital computer by relaxation methods, but such calculations are inherently slow when applied to complex surfaces of di- electric discontinuity. Further difficulties are involved with the painstaking adjustment of grids of points to the surfaces and with demonstrating that the results have converged to the correct limit. For these reasons we have chosen to use the tank to make a preliminary survey.
Electrolyte Tank-Theory The electrolyte tank was apparently first described early
in this century and was used subsequently in the design of vacuum tubes and electron microscopes. In practice, an enlarged model of the electrode or dielectric system to be investigated is immersed in an electrolyte solution contained in a large tank. Typically the tank is 3-6 times larger than the model. Currents are applied to the model system and the resulting potentials are measured.
The use of the tank is based upon the principal that a number of different physical fields are described by dif- ferential equations (those of Laplace and Poisson) that are identical except for the meaning of the coefficients. If appropriate corrections are made for differences in distance scales and medium properties, the solution to a particular boundary problem for one field provides the solution for all. In particular, the electrostatic interactions of a con- figuration of charged ions near a polyelectrolyte molecule can be inferred from electrical measurements on a similar configuration of electrodes near a model of the molecule in the tank.
In the real molecular system the total electrostatic en- ergy, U, is the sum of interactions between pairs of charges, ql and q,, plus the self-energies of the charges, terms proportional to q t
Electrostatic Interactions between Ions and DNA 1187
where the slm are coefficients that depend on the config- uration of the system but not on the charges. For example, in a simple system of point charges in a uniform medium of dielectric constant t, where Coulomb’s law applies un- modified, the off-diagonal coefficients are given in terms of the distances between charges, rlm:
slm = 1/4att,rlm
where t, is the capacitivity of the vacuum. Similarly, with one conducting charged sphere of radius a in an infinite uniform medium, the diagonal coefficient is
sll = 1/4aet,a (3)
In a more complex system where surfaces separate re- gions of different dielectric constant, Coulomb’s simple formula no longer applies because of the presence of charges induced at the surfaces, but the coefficients sl, still exist and could be obtained in principle by measurement of the electrostatic potential as follows. Consider a par- ticular charge, 91, to be a small conducting sphere and the potential a t its center to be V,. Since the potential a t a point is defined as the rate of change in energy of the system when a small amount of charge is introduced a t that point
(4 )
the summation including the charge ql, and account having been taken of the fact that slm = s+. In particular, if we put only one of the other charges m in the system, we could
measure the potential a t the position 1 and get directly slm. Actually, it is only necessary to measure potentials in
a model system, the electrolyte tank, which is filled with a conducting fluid and which can be related to the real system as follows. (We are using the procedure of Carter.6) Let V and E be the potential and electrostatic field in the real system, and let V, and Et be those in the model, with X the ratio of the dimensions of the system to those of the model. Then, since the field is the gradient of the potential
E / E , = V/XVt (5)
Remembering that the system is filled with a dielectric fluid of dielectric constant t while the model is filled with a conducting fluid of conductivity CT, we have an expression for the displacement, D, in the system, D = tt,E, and an analogous expression for the current density, J, in the model, J = oE,. Combining these with eq 5, we get
€t,V D = - J
XaVt
The ratio of an area in the system to the corresponding area in the model is X2. Thus the total flux of D through such an area is related to the total flux of J through the corresponding model area by
tt, V XOV,
flux D = X2- flux J ( 7 )
Now consider a closed surface surrounding the charge qm in the system; By Gauss’ theorem the total flux of D through this surface is equal to 4,. Likewise in the model the total flux of J through the corresponding surface is the current, I,, carried by the electrode m. Thus eq 7 becomes
From eq 4, slm is the partial derivative of Vl with respect to qm. If we set all the charges equal to zero except for one, q,, and we set the constant in the potential so the potential vanishes a t infinity, then V, is proportional to qm, and We have
Since the slm are independent of the values of the charges, slm determined in this way is equally valid when other charges are also present. Similarly, with the tank it is not necessary to have more than the two electrodes 1 and m in the tank a t one time, and indeed if 1 = m only one electrode is necessary. The conducting wall of the tank serves as the current sink to complete the circuit and ap- proximates an equipotential surface at infinity if the tank is large enough. If this surface is set a t zero potential and if there is only one current electrode and one voltage electrode in the tank, then we can combine eq 8 and 9 to get an expression for the coefficients slm
(10)
where Rl, = Vt,l/Im are measurable resistance ( I = m) or transresistance ( 1 # m) coefficients. It is thus possible to obtain the coefficients sl, for the real molecular system from measurements of the voltage, V,,,, and current, I,, on electrodes, 1 and m, in the tank.
I t is convenient to express energy in terms of hBT, where kB is Boltzmann’s constant and T i s the temperature and
1188 Troll e t al. Macromolecules, Vol. 19, No. 4, 1986
1 'SHEET \STAINLESS- STEEL TANK
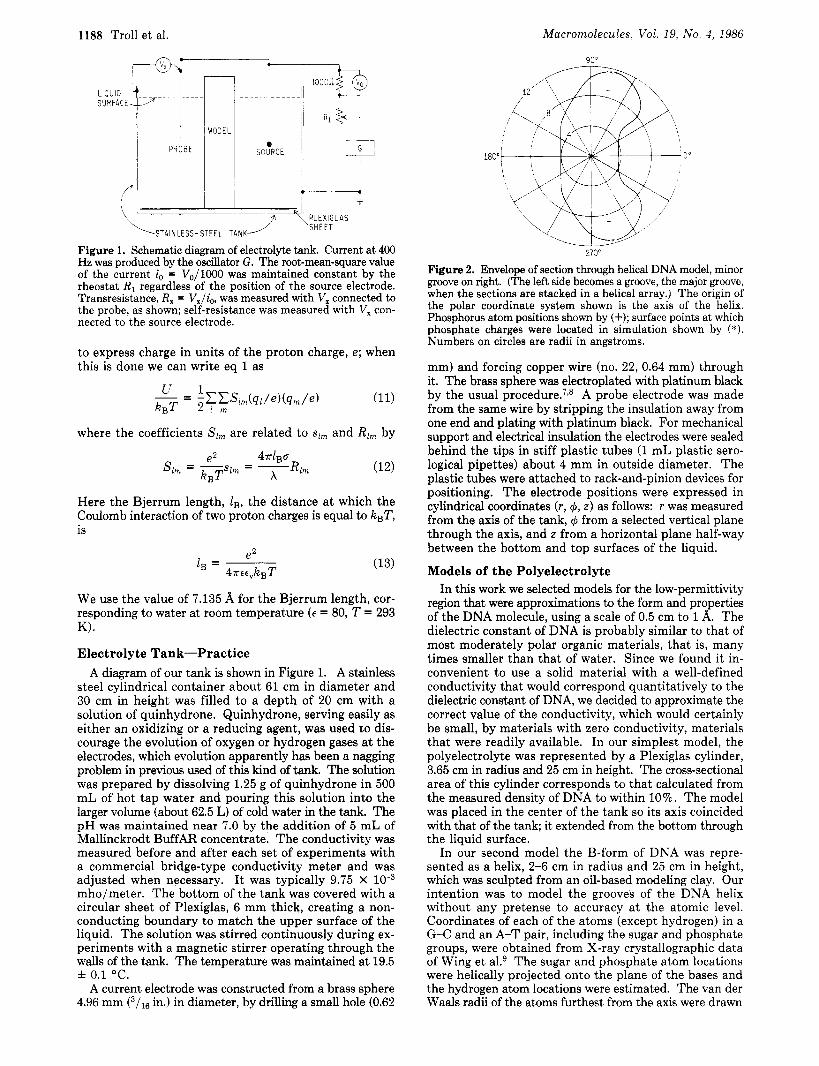
Figure 1. Schematic diagram of electrolyte tank. Current at 400 Hz was produced by the oscillator G . The root-mean-square value of the current io = Vo/lOOO was maintained constant by the rheostat R1 regardless of the position of the source electrode. Transresistance, R, = V,/io, was measured with V, connected to the probe, as shown; self-resistance was measured with V, con- nected to the source electrode.
to express charge in units of the proton charge, e; when this is done we can write eq 1 as
where the coefficients S1, are related to slm and Rl, by
Here the Bjerrum length, I g , the distance at which the Coulomb interaction of two proton charges is equal to kBT, is
We use the value of 7.135 8, for the Bjerrum length, cor- responding to water a t room temperature (e = 80, T = 293 K).
Electrolyte Tank-Practice A diagram of our tank is shown in Figure 1. A stainless
steel cylindrical container about 61 cm in diameter and 30 cm in height was filled to a depth of 20 cm with a solution of quinhydrone. Quinhydrone, serving easily as either an oxidizing or a reducing agent, was used to dis- courage the evolution of oxygen or hydrogen gases a t the electrodes, which evolution apparently has been a nagging problem in previous used of this kind of tank. The solution was prepared by dissolving 1.25 g of quinhydrone in 500 mL of hot tap water and pouring this solution into the larger volume (about 62.5 L) of cold water in the tank. The pH was maintained near 7.0 by the addition of 5 mL of Mallinckrodt BuffAR concentrate. The conductivity was measured before and after each set of experiments with a commercial bridge-type conductivity meter and was adjusted when necessary. It was typically 9.75 X mho/meter. The bottom of the tank was covered with a circular sheet of Plexiglas, 6 mm thick, creating a non- conducting boundary to match the upper surface of the liquid. The solution was stirred continuously during ex- periments with a magnetic stirrer operating through the walls of the tank. The temperature was maintained at 19.5 f 0.1 "C.
A current electrode was constructed from a brass sphere 4.96 mm (3/,6 in.) in diameter, by drilling a small hole (0.62
270'
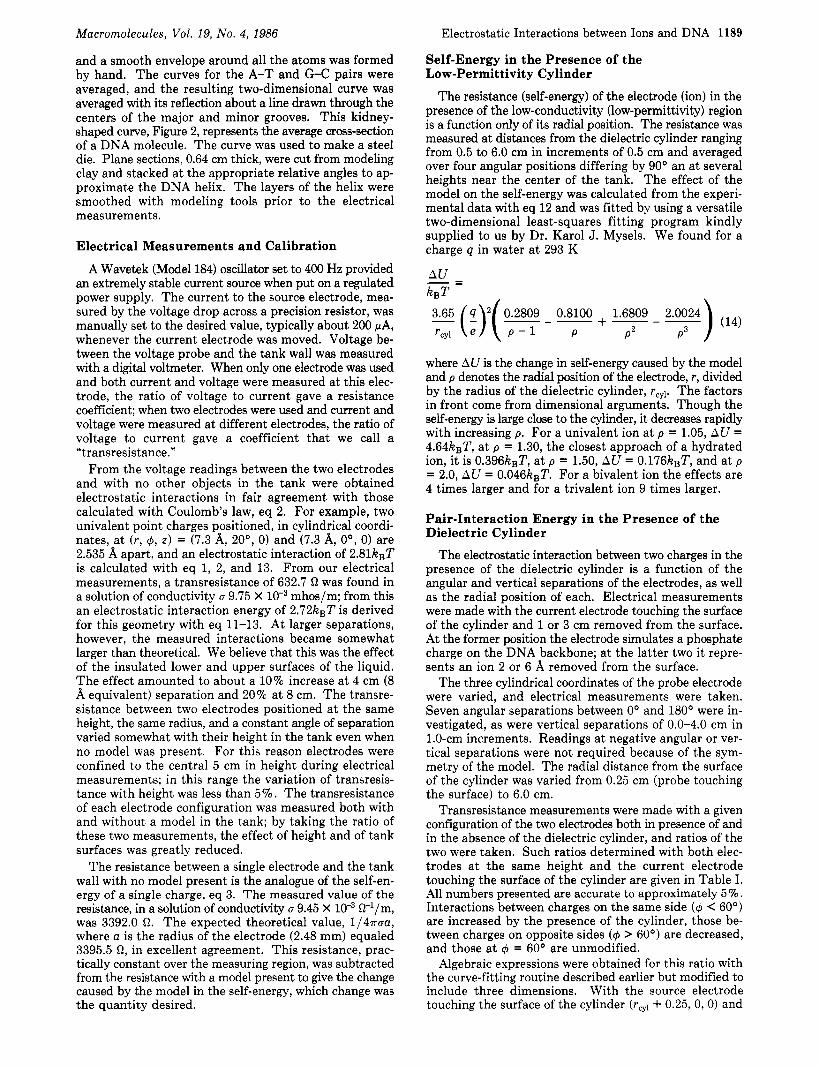
Figure 2. Envelope of section through helical DNA model, minor groove on right. (The left side becomes a groove, the major groove, when the sections are stacked in a helical array.) The origin of the polar coordinate system shown is the axis of the helix. Phosphorus atom positions shown by (+); surface points at which phosphate charges were located in simulation shown by (*). Numbers on circles are radii in angstroms.
mm) and forcing copper wire (no. 22, 0.64 mm) through it. The brass sphere was electroplated with platinum black by the usual p r o c e d ~ r e . ~ , ~ A probe electrode was made from the same wire by stripping the insulation away from one end and plating with platinum black. For mechanical support and electrical insulation the electrodes were sealed behind the tips in stiff plastic tubes (1 mL plastic sero- logical pipettes) about 4 mm in outside diameter. The plastic tubes were attached to rack-and-pinion devices for positioning. The electrode positions were expressed in cylindrical coordinates (P, 4, z ) as follows: P was measured from the axis of the tank, 4 from a selected vertical plane through the axis, and z from a horizontal plane half-way between the bottom and top surfaces of the liquid.
Models of the Polyelectrolyte In this work we selected models for the low-permittivity
region that were approximations to the form and properties of the DNA molecule, using a scale of 0.5 cm to 1 A. The dielectric constant of DNA is probably similar to that of most moderately polar organic materials, that is, many times smaller than that of water. Since we found it in- convenient to use a solid material with a well-defined conductivity that would correspond quantitatively to the dielectric constant of DNA, we decided to approximate the correct value of the conductivity, which would certainly be small, by materials with zero conductivity, materials that were readily available. In our simplest model, the polyelectrolyte was represented by a Plexiglas cylinder, 3.65 cm in radius and 25 cm in height. The cross-sectional area of this cylinder corresponds to that calculated from the measured density of DNA to within 10%. The model was placed in the center of the tank so its axis coincided with that of the tank; it extended from the bottom through the liquid surface.
In our second model the B-form of DNA was repre- sented as a helix, 2-6 cm in radius and 25 cm in height, which was sculpted from an oil-based modeling clay. Our intention was to model the grooves of the DNA helix without any pretense to accuracy at the atomic level. Coordinates of each of the atoms (except hydrogen) in a G-C and an A-T pair, including the sugar and phosphate groups, were obtained from X-ray crystallographic data of Wing et al.9 The sugar and phosphate atom locations were helically projected onto the plane of the bases and the hydrogen atom locations were estimated. The van der Waals radii of the atoms furthest from the axis were drawn
Macromolecules, Vol. 19, No. 4, 1986
and a smooth envelope around all the atoms was formed by hand. The curves for the A-T and G-C pairs were averaged, and the resulting two-dimensional curve was averaged with its reflection about a line drawn through the centers of the major and minor grooves. This kidney- shaped curve, Figure 2, represents the average cross-section of a DNA molecule. The curve was used to make a steel die. Plane sections, 0.64 cm thick, were cut from modeling clay and stacked a t the appropriate relative angles to ap- proximate the DNA helix. The layers of the helix were smoothed with modeling tools prior to the electrical measurements.
Electrical Measurements and Calibration
A Wavetek (Model 184) oscillator set to 400 Hz provided an extremely stable current source when put on a regulated power supply. The current to the source electrode, mea- sured by the voltage drop across a precision resistor, was manually set to the desired value, typically about 200 PA, whenever the current electrode was moved. Voltage be- tween the voltage probe and the tank wall was measured with a digital voltmeter. When only one electrode was used and both current and voltage were measured at this elec- trode, the ratio of voltage to current gave a resistance coefficient; when two electrodes were used and current and voltage were measured at different electrodes, the ratio of voltage to current gave a coefficient that we call a "transresistance."
From the voltage readings between the two electrodes and with no other objects in the tank were obtained electrostatic interactions in fair agreement with those calculated with Coulomb's law, eq 2. For example, two univalent point charges positioned, in cylindrical coordi- nates, a t (r, 4, z ) = (7.3 A, 20°, 0) and (7.3 A, O', 0) are 2.535 A apart, and an electrostatic interaction of 2.81kBT is calculated with eq 1, 2, and 13. From our electrical measurements, a transresistance of 632.7 R was found in a solution of conductivity u 9.75 x mhos/m; from this an electrostatic interaction energy of 2.72kBT is derived for this geometry with eq 11-13. At larger separations, however, the measured interactions became somewhat larger than theoretical. We believe that this was the effect of the insulated lower and upper surfaces of the liquid. The effect amounted to about a 10% increase at 4 cm (8 A equivalent) separation and 20% at 8 cm. The transre- sistance between two electrodes positioned at the same height, the same radius, and a constant angle of separation varied somewhat with their height in the tank even when no model was present. For this reason electrodes were confined to the central 5 cm in height during electrical measurements; in this range the variation of transresis- tance with height was less than 5%. The transresistance of each electrode configuration was measured both with and without a model in the tank; by taking the ratio of these two measurements, the effect of height and of tank surfaces was greatly reduced.
The resistance between a single electrode and the tank wall with no model present is the analogue of the self-en- ergy of a single charge, eq 3. The measured value of the resistance, in a solution of conductivity u 9.45 x W/m, was 3392.0 fl. The expected theoretical value, 1/4m~u, where u is the radius of the electrode (2.48 mm) equaled 3395.5 R, in excellent agreement. This resistance, prac- tically constant over the measuring region, was subtracted from the resistance with a model present to give the change caused by the model in the self-energy, which change was the quantity desired.
Electrostatic Interactions between Ions and DNA 1189
Self-Energy in the Presence of the Low-Permittivity Cylinder
The resistance (self-energy) of the electrode (ion) in the presence of the low-conductivity (low-permittivity) region is a function only of its radial position. The resistance was measured at distances from the dielectric cylinder ranging from 0.5 to 6.0 cm in increments of 0.5 cm and averaged over four angular positions differing by 90' an at several heights near the center of the tank. The effect of the model on the self-energy was calculated from the experi- mental data with eq 12 and was fitted by using a versatile two-dimensional least-squares fitting program kindly supplied to us by Dr. Karol J. Mysels. We found for a charge q in water at 293 K
) (14)
where AU is the change in self-energy caused by the model and p denotes the radial position of the electrode, r, divided by the radius of the dielectric cylinder, rCyl. The factors in front come from dimensional arguments. Though the self-energy is large close to the cylinder, it decreases rapidly with increasing p. For a univalent ion at p = 1.05, AU = 4.64kBT, a t p = 1.30, the closest approach of a hydrated ion, it is 0.396kBT, at p = 1.50, AU = 0.176kBT, and at p = 2.0, AU = 0.046kBT. For a bivalent ion the effects are 4 times larger and for a trivalent ion 9 times larger.
3.65 (!)'( 0.2809 0.8100 1.6809 2.0024 ?cy1 P - 1 P P 2 P3
Pair-Interaction Energy in the Presence of the Dielectric Cylinder
The electrostatic interaction between two charges in the presence of the dielectric cylinder is a function of the angular and vertical separations of the electrodes, as well as the radial position of each. Electrical measurements were made with the current electrode touching the surface of the cylinder and 1 or 3 cm removed from the surface. At the former position the electrode simulates a phosphate charge on the DNA backbone; a t the latter two it repre- sents an ion 2 or 6 A removed from the surface.
The three cylindrical coordinates of the probe electrode were varied, and electrical measurements were taken. Seven angular separations between 0' and 180' were in- vestigated, as were vertical separations of 0.0-4.0 cm in 1.0-cm increments. Readings a t negative angular or ver- tical separations were not required because of the sym- metry of the model. The radial distance from the surface of the cylinder was varied from 0.25 cm (probe touching the surface) to 6.0 cm.
Transresistance measurements were made with a given configuration of the two electrodes both in presence of and in the absence of the dielectric cylinder, and ratios of the two were taken. Such ratios determined with both elec- trodes a t the same height and the current electrode touching the surface of the cylinder are given in Table I. All numbers presented are accurate to approximately 5 % . Interactions between charges on the same side (+ 60') are increased by the presence of the cylinder, those be- tween charges on opposite sides (+ > 60') are decreased, and those a t 4 = 60' are unmodified.
Algebraic expressions were obtained for this ratio with the curve-fitting routine described earlier but modified to include three dimensions. With the source electrode touching the surface of the cylinder (r,,,, + 0.25,0,0) and

1190 Troll et al. Macromolecules, Vol. 19, No. 4 , 1986
Table I Ratios of the Transresistance with Cylinder to That without as a Function of the Position of the Probe Electrode with the
Source Electrode at p = 1.068 (Both at Same Height) P
h deg 1.000 1.137 1.274 1.411 1.548 1.822 2.096 2.356 2.644 20 1.41 1.38 1.36 1.35 1.32 1.29 1.26 1.24 1.22 40 1.14 1.20 1.21 1.21 60 1.02 1.04 1.06 1.07 90 0.80 0.83 0.85 0.87
120 0.67 0.69 0.72 0.73 150 0.59 0.61 0.63 0.65 180 0.57 0.58 0.60 0.62
the probe electrode at (r, 4, z ) , the ratio of the interaction energy to the Coulomb interaction is given by
-0.535 0.253
4.821 2.755 2.697 - - + -) exp(-6) (15)
P2
The symbol 6 = (1.068 + p2 - 2.136~ cos C#J + denotes the distance between the source and probe electrodes divided by the cylinder radius, { is the vertical component of the same distance divided by the cylinder radius, and p represents the radial coordinate of the probe electrode divided by the cylinder radius. The form of this equation was suggested by the theoretical expressions of Skolnick and Fixman, see below. Similar equations were also ob- tained for the other two positions of the source electrode. Comparison to Analytical Calculations of Skolnick and Fixman
An elegant method for the calculation of the electrostatic interaction between point charges in the vicinity of a di- electric cylinder has been devised by Skolnick and Fix- man.lo We present here experimental confirmation of their theoretical predictions.
A discrete source charge is located on the surface of a dielectric cylinder of radius a. This cylinder is assumed to be impermeable to the salt solution in which it is im- mersed and to have a dielectric constant, eo, that may be different from that of the bulk, t.
The potential times 47rte, at a point ( p , 4, z ) due to the placement of a charge on the surface of the cylinder a t (1, 0, 0) is given by Green’s function, G ( p , 4 , ~ ) . All positions are expressed in cylindrical polar coordinates, and all distances are given in units of the radius of the cylinder. An expression for Green’s function was obtained by Skolnick and Fixman through a solution of the linearized Poisson-Boltzmann equation and is given by
m
IzlGtp, 4, 2) = Ho + 2 C H , COS (m4) (16) m = l
We have simplified the expression for the coefficients H , by imposing several special conditions. A value of zero was assumed for the dielectric constant of the cylinder since our experimental measurements were made with a cylinder of Plexiglas, whose conductivity, the analogue of the di- electric constant, is zero. The source charge was placed on the surface of the cylinder, a t p = (1, 4, z ) , in order to facilitate computations. Lastly, a value of zero was as- signed to the Debye screening factor, K , thereby reducing the Poisson-Boltzmann equation to the Laplace equation, which applied in our case, since we have no free charge in the tank. Under these conditions
K,(k) cos (klzl) dk (17)
kKm-l(k) + mKm(k)
1.21 1.19 1.17 1.17 1.15 1.07 1.07 1.07 1.07 1.07 0.88 0.90 0.92 0.93 0.93 0.76 0.77 0.79 0.80 0.81 0.66 0.69 0.71 0.72 0.73 0.64 0.66 0.68 0.69 0.70
where K , is the well-known modified Bessel function. For the small values of z that occurred in our experi-
ments and for values of m 5 10, direct numerical inte- gration of eq 17 is feasible. We performed the integration on a VAX 11-780 computer with the subroutine DCADRE, which employs a cautious Romberg interpolation and is part of the IMSL package.l’ Our usual procedure was to approximate the function enclosed by the integral sign in eq 17, which we call F, by
F = cos (klzl)/m (18)
F = cos (hlzl)/k (19)
for values of k < 0.01, and by
for tz > 1000. In this latter region the integral may be evaluated with
using tabulations of Ci, the cosine integral.
for m > 10, as Skolnick and Fixman approximated the coefficients, H,,
They evaluated the product H, cos(m4) for specific values of z and $I until convergence of the series described by eq 16 had occurred. Large values of m were required only for small values of z.
We chose instead to break eq 16 into the sum of the three series, as suggested by eq 21
1 - L} (23b)
C represents Euler’s constant. Equation 23b is from Gradshteyn and Ryzhik,12 formula 8.526-1; the sum was
[ z 2 + ( 2 ~ m + 4)2]1/2 r m

Macromolecules, Vol. 19, No. 4, 1986 Electrostatic Interactions between Ions and DNA 1191
Table I1 Ratio of Potential of a Charge at p = 1 with the Cylinder to Potential without ( G / G , ) , Comparison of Theoretical with
Experimental Ratios
0 20 40 60 90
120 150 180
z = 0.5480 f = 0.001 z = 0.2740 theory tank theory tank theory tank
p = 1.00 p = 1.07 p = 1.00 p = 1.07 p = 1.00 p = 1.07 1.996 1.698 1.531 1.504 1.418 1.462 1.386 1.412 1.331 1.156 1.137 1.255 1.187 1.192 1.165 1.081 1.017 0.972 1.008 0.992 1.008 0.851 0.800 0.739 0.810 0.767 0.814 0.668 0.667 0.594 0.673 0.570 0.678 0.460 0.586 0.517 0.588 0.535 0.594 0.400 0.557 0.494 0.560 0.509 0.566
evaluated numerically and was found to converge after only 11 terms.
The second summation in eq 22 was evaluated with formula 1.448-2 from Gradshteyn and Ryzhik as
m
C e-'"lzl cos ( m @ ) / m = m = l l
10 1 - - In [ I - 2e-14 cos 4 + e-2121] - e-,lzl cos ( m @ ) / m
(24) The third summation used formula 1.447-2 from Gradsh- teyn and Ryzhik to get
2 m = l
m
X e-mlrl cos (m4) = m = l l
In the absence of the cylinder, Green's function, Go, is
Go = ( z2 + 2(1 - COS 4))-1/2 (26)
Theoretical ratios of GIGo calculated for z = 0.001,0.274, and 0.548 and several values of @ are presented in Table 11, along with our experimental results from the tank. Both the experimental and the theoretical ratios decrease as @ increases from 0' to 180'. Interactions between charges on the same side of the cylinder are increased over the Coulomb values, while those on opposite sides are de- creased. Near an angle @ = 60°, the two Green's functions are nearly identical and their ratio is approximately unity. With the exception of the data for @ > 90°, the experi- mental and theoretical results agree within 10% and usually agree within 6%.
The greater discrepancies a t the larger angles are not unexpected. The experimental quantities from which G and Go are determined are small a t these angles and their ratio is sensitive to the relatively large uncertainties of measurement. Moreover, for these values of 4, the series given in eq 16 is oscillatory in sign and convergence is slow. Deviations between the "correct" values of H , cos (m4) and those obtained from eq 22 are more important here. Fortunately, although the discrepancies are substantial in comparison to the tabulated values, their absolute values remain small.
Along with their derivation of the equations required for the computation of GIGo, Skolnick and Fixman pres- ented calculated values of the ratio a t 4 = 0' and 180'. Dielectric constants of 2 for the cylinder and 80 for the bath were assumed. They found that when z = 0, GIGo = 2.0 a t 4 = 0' and 0.53 at 180'. The former value was compared to the theoretical value of 2.0 for two charges near a plane boundary ( S t r a t t ~ n ' ~ ) in a salt-free solution and the latter to the value of 0.6 for two charges near the
given by the simple Coulomb form
Table I11 Constants for Calculation of Self-Energy of Charge near
Helix r , A
4.64 5.64 6.64 7.64 9.64 11.64 Region 1: Minor Groove
Co 2.1096 1.5207 1.1879 0.9196 0.4962 0.2737
Cz 9.4175 8.3176 8.2025 9.8823 3.7416 0.7070 C, 2.7491 1.1666 0.7799 0.1228 0.2192 -0.05071
Region 2: Major Groove 1.7542 0.8879 0.6011 0.3088 0.2539 8.8812 1.8553 0.2913 0.2266 0.1524
-11.3352 2.4408 2.0607 0.3044 0.2619
Region 3: Rim 1.3981 0.9565 0.0000 2.5144 0.0000 2.6481
surface of a dielectric sphere.13 Our calculated results a t @ = 0' agree with their results, as well as with the theo- retical values for the sphere and the plane.
Self-Energy in the Presence of the Low-Permittivity Helix
The self-energy of an ion in the vicinity of the low- permittivity helix is a function of the radial position of the ion, as well as its absolute angular position. For purposes of determining absolute angular orientation, a value of zero was assigned to @ at the center of the minor groove in the horizontal plane of measurement.
Prior to fitting our experimental data to arithmetic ex- pressions, we found it convenient to divide the data into three categories. Ions in the first, centered (with angles in radians) about @o = 0, (5.672 5 4, 4 5 0.611) are asso- ciated with the minor groove, ions in the second, centered about @o = a, (2.356 5 @ 5 4.102) belong to the major groove, and ions in the third, centered about 1.309 radians (75'), lie near the rim of the helix.
AU,,dr)/kBT = Co(r ) + C,(r)(@ - $o)2 + Cdr)(4 - @0)4
(27) were determined for each of the three angular regions at six radial positions of the current electrode. Values of the self-repulsion energy at other distances were computed by linear interpolation in l / r . Since this formula is intended for use in computer programs, all angles are specified in radians; the values of 4o are given above in the text. Values of the functions required in eq 27 are presented in Table I11 as a function of the angular region and of r.
In Table IV self-energies in units of kBT for the DNA helix are compared to self-energies calculated with eq 14 for the cylinder. Entries are given for the electrode placed at the center of the minor groove (6 = 0), the center of the major groove (4 = a), and along the rim of the helix (4 =
Formulas of the form

1192 Troll et al. Macromolecules, Vol. 19, No. 4 , 1986
cavity in the model, placed the electrode in the cavity, and filled the rest of the cavity with a material of low but not zero conductivity. Even so, we would then have been representing the phosphate as a point charge, which is probably not proper. Furthermore, it would not have been clear just how large to make the cavity! In view of these uncertainties, we elected to take the simpler but less re- alistic course described above.
Because of the symmetry of the DNA helix, the inter- action between a probe electrode at (P, $, h) and a current electrode at one phosphate is identical with that between a probe electrode at ( r , -4, -h) and a current electrode at the other phosphate. Similarly, with the current electrode in the center of a groove, equal transresistances are mea- sured with the probe electrode at ( r , $, h) or ( r , -$, -h). For these reasonsn, transresistances need be determined only for positive values of h.
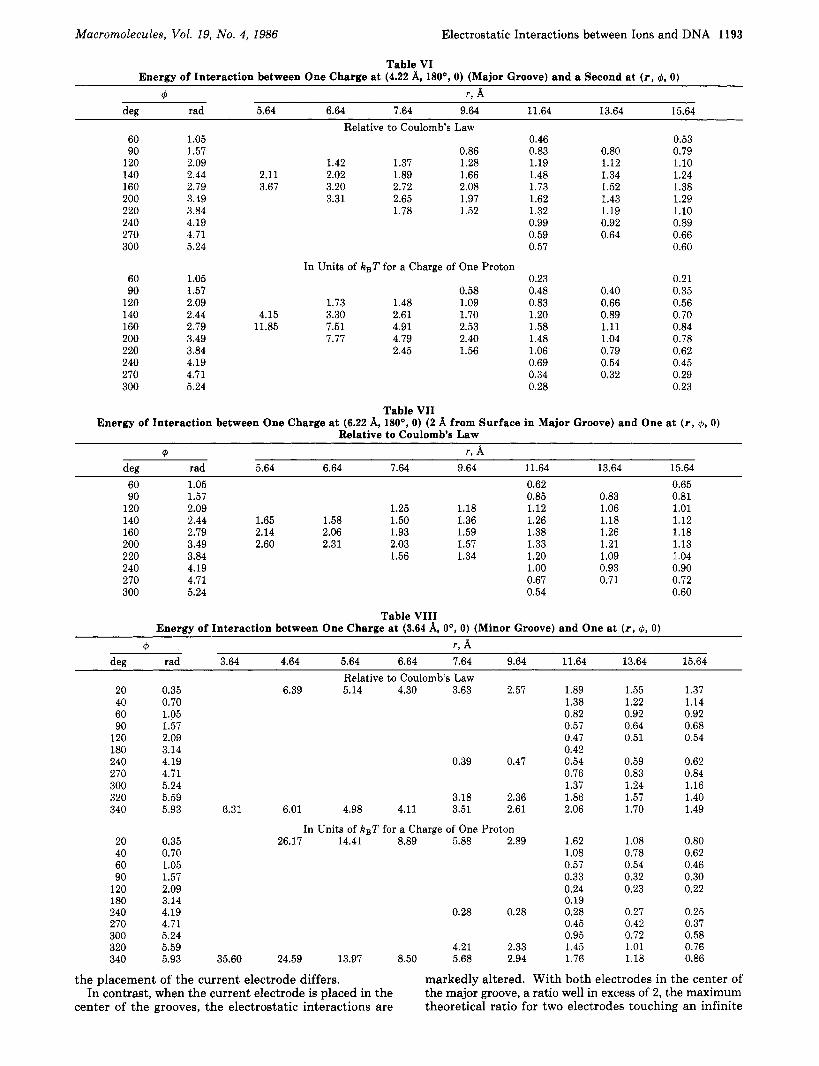
Some data indicating the extent of modification of the electrostatic energy by the low-permittivity helix are presented in Tables V-IX. The tabulated data were de- termined with the current electrode touching the surface of the helix and at the position corresponding to one phosphate ion (Table V), a t the position corresponding to the center of the major groove (Tables VI and VII), and at the position corresponding to the center of the minor groove (Tables VI11 and IX). The radial positions of the electrode are given in the tables. Values in the first half of each table are expressed as the quotient of the inter- action with the solid and the interaction without (Cou- lomb’s law). Points on the left side of each table for which no entries are tabulated lie within the volume of the helix; vacant spaces in the rest of the table indicate missing data. In the second part of each table is given the energy of the interaction of two univalent ions in units of kBT.
The data determined with the current electrode at the phosphate ion position (Table V) are similar to those de- termined with the electrode touching the surface of the cylinder (Table I). Different distances are tabulated be- cause the radius of the helix varies with angle and because
Table IV Self-Energy of a Univalent Ion near a Helix as a Function
of Radius Equal to the Helix at the Given Angle self-energy, hsT
of Position: Comparison to the Self-Energy near a Cylinder
h deg r, 8, rhelin, A
5.68 6.68
75 12.40 11.40 13.40
180 5.06 4.06 6.06 7.06
0 4.68 3.68 helix cvlinder 2.081 0.918 1.505 0.304 1.176 0.146 0.773 1.487 0.240 0.574 1.754 0.513 1.356 0.323 0.758 0.161
1.309). The distance of the electrode from the helical surface is tabulated. The cylinder in each case was as- signed a radius equal to the radius of the helical surface a t the given angle.
Pair-Interaction Energy in the Presence of the Dielectric Helix
In the presence of the dielectric helix the electrostatic interaction between two charges is a function of five var- iables: the angular and radial positions of each charge and their vertical separation. This number of variables is sufficiently large that a complete experimental determi- nation of all the pairwise interactions in the vicinity of the helix is unattractive with our apparatus. Consequently, we measured interactions with the current electrode placed only at certain important positions: on the rim of the helix a t the angular positions corresponding to each of the phosphate ions, and at the surface of the helix in the centers of the major and minor grooves and at 1 and 3 cm removed from these surfaces. The radial, angular, and vertical positions of the voltage probe electrode were varied in the manner described previously for the cylinder.
We note that the electrode representing the phosphate charge was placed just outside the surface of the model. I t would have been more realistic to have excavated a
Table V Energy of Interaction between One Charge at (11.874 A, 2 8 5 O , 0) (Phosphate Rim) and One at ( r , c), 0)
4 r , A deg rad 3.64 4.64 5.64 6.64 7.64 9.64 11.64 13.64 15.64
Relative to Coulomb’s Law 15 0.26 0.90 0.90 0.90 0.89 0.85 0.83 0.82 0.82 45 0.79 0.71 0.70 0.70 0.70 75 1.31 0.58 0.61 0.63
105 1.83 0.54 0.56 0.58 0.59 135 2.36 0.58 0.60 0.62 0.62 0.63 165 2.88 0.63 0.65 0.66 0.68 0.70 0.70 0.71 195 3.40 0.70 0.72 0.74 0.76 0.78 0.80 0.80 225 3.93 0.85 0.80 0.84 0.87 0.90 0.91 245 4.28 0.90 0.95 0.97 0.97 265 4.63 1.17 1.17 1.15 1.08 305 5.32 1.15 1.15 1.09 325 5.67 0.92 0.95 0.97 0.98 0.98 345 6.02 1.00 0.93 0.99 0.92 0.92 0.91 0.91 0.91 0.90
In Units of kBT for a Charge of One Proton 15 0.26 0.51 0.49 0.47 0.45 0.40 0.36 0.32 0.30 45 0.79 0.30 0.25 0.23 0.21 75 1.31 0.20 0.18 0.17
105 1.83 0.20 0.17 0.16 0.15 135 2.36 0.23 0.21 0.19 0.18 0.17 165 2.88 0.30 0.28 0.28 0.26 0.24 0.23 0.21 195 3.40 0.39 0.38 0.37 0.36 0.34 0.31 0.29 225 3.93 0.59 0.55 0.55 0.53 0.50 0.46 245 4.28 0.83 0.84 0.78 0.69 265 4.63 1.93 2.05 1.72 1.27 305 5.32 1.89 1.73 1.28 325 5.67 0.81 0.88 0.86 0.79 0.69 345 6.02 0.68 0.64 0.69 0.64 0.63 0.60 0.55 0.50 0.46
Macromolecules, Vol. 19, No. 4, 1986 Electrostatic Interactions between Ions and DNA 1193
Table VI Energy of Interaction between One Charge at (4.22 A, M O O , 0) (Major Groove) and a Second at ( r , 9,O)
deg rad 5.64 6.64 7.64 9.64 11.64 13.64 15.64 9 r , 8,
60 90
120 140 160 200 220 240 270 300
60 90
120 140 160 200 220 240 270 300
1.05 1.57 2.09 2.44 2.11 2.79 3.67 3.49 3.84 4.19 4.71 5.24
1.05 1.57 2.09 2.44 4.15 2.79 11.85 3.49 3.84 4.19 4.71 5.24
Relative to Coulomb’s Law
0.86 1.42 1.37 1.28 2.02 1.89 1.66 3.20 2.72 2.08 3.31 2.65 1.97
1.78 1.52
In Units of k,T for a Charge of One Proton
0.58 1.73 1.48 1.09 3.30 2.61 1.70 7.51 4.91 2.53 7.77 4.79 2.40
2.45 1.56
0.46 0.83 1.19 1.48 1.73 1.62 1.32 0.99 0.59 0.57
0.23 0.48 0.83 1.20 1.58 1.48 1.06 0.69 0.34 0.28
0.80 1.12 1.34 1.52 1.43 1.19 0.92 0.64
0.40 0.66 0.89 1.11 1.04 0.79 0.54 0.32
0.53 0.79 1.10 1.24 1.38 1.29 1.10 0.89 0.66 0.60
0.21 0.35 0.56 0.70 0.84 0.78 0.62 0.45 0.29 0.23
Table VI1 Energy of Interaction between One Charge at (6.22 A, M O O , 0) (2 A from Surface in Major Groove) and One at ( r , 9, 0)
Relative to Coulomb’s Law 9 r , A
deg rad 5.64 6.64 7.64 9.64 11.64 13.64 15.64 60 1.05 0.62 0.65 90 1.57 0.85 0.83 0.81
120 2.09 1.25 1.18 1.12 1.06 1.01 140 2.44 1.65 1.58 1.50 1.36 1.26 1.18 1.12 160 2.79 2.14 2.06 1.93 1.59 1.38 1.26 1.18 200 3.49 2.60 2.31 2.03 1.57 1.33 1.21 1.13 220 3.84 1.56 1.34 1.20 1.09 1.04 240 4.19 1.00 0.93 0.90 270 4.71 0.67 0.71 0.72 300 5.24 0.54 0.60
Table VI11 Enerev of Interaction between One Charge at (3.64 A. 0’. 0) (Minor Groove) and One at ( r . b. 0)
~
9 deg rad 3.64 4.64 5.64 6.64 7.64 9.64 11.64 13.64 15.64
20 0.35 40 0.70 60 1.05 90 1.57
120 2.09 180 3.14 240 4.19 270 4.71 300 5.24 320 5.59 340 5.93
20 0.35 40 0.70 60 1.05 90 1.57
120 2.09 180 3.14 240 4.19 270 4.71 300 5.24 320 5.59 340 5.93
Relative to Coulomb’s Law 6.39 5.14 4.30 3.63 2.57
0.39 0.47
3.18 2.36 6.31 6.01 4.98 4.11 3.51 2.61
In Units of kBT for a Charge of One Proton 26.17 14.41 8.89 5.88 2.89
0.28 0.28
4.21 2.33 35.60 24.59 13.97 8.50 5.68 2.94
1.89 1.38 0.82 0.57 0.47 0.42 0.54 0.76 1.37 1.86 2.06
1.62 1.08 0.57 0.33 0.24 0.19 0.28 0.45 0.95 1.45 1.76
1.55 1.22 0.92 0.64 0.51
0.59 0.83 1.24 1.57 1.70
1.08 0.78 0.54 0.32 0.23
0.27 0.42 0.72 1.01 1.18
1.37 1.14 0.92 0.68 0.54
0.62 0.84 1.16 1.40 1.49
0.80 0.62 0.46 0.30 0.22
0.25 0.37 0.58 0.76 0.86
the placement of the current electrode differs. In contrast, when the current electrode is placed in the
center of the grooves, the electrostatic interactions are
markedly altered. With both electrodes in the center of the major groove, a ratio well in excess of 2, the maximum theoretical ratio for two electrodes touching an infinite

1194 Troll e t al. Macromolecules, Vol. 19, No. 4 , 1986
Table IX Energy of Interaction between One Charge at (5.64 A, Oo, 0) (2 8, from Surface in Minor Groove) and One at (c, 4, 0) Relative
to Coulomb’s Law 4 r, 8,
deg rad 4.64 5.64 6.64 7.64 9.64 11.64 13.64 15.64 20 0.35 4.39 4.07 3.58 3.08 2.16 1.61 1.36 1.22 40 60 90
120 240 270 300 320 340
0.70 1.05 1.57 2.09 4.19 4.71 5.24 5.59 3.25 3.05 2.80 5.93 3.85 3.74 3.43
plane surface, is observed. The increased interaction is even more striking when both electrodes are positioned in the minor groove. The lack of symmetry in the data of Tables VI-IX, particularly a t the radial positions near the helix, is due to imperfections in our clay model and im- precision in our angle measurements. Ratios a t other lo- cations can be calculated from a three-dimensional linear interpolation in r , h, and 4.
The data in these tables is only a sample of the total data set, which includes values of h up to 8 A. The whole set is too extensive to publish here, but the authors will be glad to make it available privately if requested.
Comments and Conclusions The exact analogy between the current pattern in the
electrolyte tank and the electric-field pattern in a system of dielectric media is helpful in understanding qualitatively the various effects of low-dielectric objects on the inter- actions of charges. A low-conductivity object in a region of higher conductivity diverts the current flow, and analogously a low-permittivity region diverts the electric field. Consequently, a modest-sized low-permittivity region interposed between two charges diminishes their interac- tion; effectively, it shields the two charges from each other. A low-conductivity object brought near to one electrode concentrates the current flow from the electrode in the remaining high-conductivity space and hence increases the electric field there; analogously the field of a charge in a high-permittivity object is increased. Thus the potential and self-energy of such a charge is increased, and its in- teraction with near-neighboring charges is increased.
Applying these ideas to our problem, we see that the interaction of charges on the opposite sides of the low- permittivity cylinder and helix is diminished in comparison to Coulomb’s law, while that of charges on the same side is increased. Also, the energies of charges near the surfaces of these objects are increased; that is, charges are repelled by low-permittivity objects.
We now consider specific cases, taking the cylinder first. Here the self-energy is infinity for a point charge right on the surface but falls rapidly with increasing distance. For a univalent ion a t p = 1.30, approximately the closest possible approach of a hydrated ion to a cylinder model of DNA, the energy is only 0.396kBT, at p = 1.50, 0.176kBT, and at p = 2.0, o.046kBT. However, the energies are 4 times larger for a bivalent ion and for a trivalent ion 9 times larger, and thus for these ions the self-energies can be considerable.
The pair-interaction energies with the cylinder are, as expected, enhanced in comparison to Coulomb’s law when the charges are within about 60” of each other in angular position and diminished otherwise. Thus the total inter-
1.27 1.04 0.63
0.43 0.49 0.54 0.45 0.52 0.59
0.79 1.30
2.53 2.01 1.63 2.98 2.27 1.83
1.13 0.92 0.70 0.58 0.65 0.85 1.19 1.41 1.54
1.07 0.92 0.74 0.61 0.67 0.86 1.13 1.29 1.37
action energy of a radially symmetrical array of charges is practically the same as if the cylinder were not present. This is in fact to be expected, since an infinitely long hollow cylindrically symmetrical tube of charge creates no field within itself (it is the same as the surface charge on an infinite cylindrical conductor) and thus has no inter- action with a low-permittivity object placed within it. As a corollary, the effects considered in this paper are of no consequent for the Poisson-Boltzmann equation applied to an infinite charged cylinder in an ionic solution, since the symmetrical ion distribution assumed with this equation does not interact with the dielectric material of the cylinder.
In the case of ions in one of the grooves of the DNA helix, both their self-energies and their interaction energies are increased in comparison to Coulomb’s law. In effect, their fields are focused by the grooves. The self-energy increase can be much more than a factor of 2 (Table IV). The interaction increase can also be large, Tables VI-IX. The actual magnitude of the interaction energies can be much larger than kBT, as seen even for univalent ions in Tables VI-IX. The effects of these increases should be to diminish considerably the occup’ation of the grooves by ions, especially polyvalent ions, in comparison to the ex- pectation from Coulomb’s law alone. This is probably the most important conclusion that we can draw from this work.
Acknowledgment. This work was supported by Grant GM-11916 from NIH.
References and Notes Tanford, C.; Kirkwood, J. W. J. Am. Chem. SOC. 1957, 79,5333, 5340, 5348. Bailey, J. M. Biopolymers 1973, 12, 559. McArthur, E. D. Electronics 1932, 4 , 192. Zworykin, V. K.; Morton, G. A.; Ramberg, E. G.; Hillier, J.; Vance, A. W. “Electron Optics and the Electron Microscope”, Wiley: New York, 1946; pp 389-396. Einstein, P. A. Br. J . Appl. Phys. 1951, 2, 49. Carter, G. W. “The Electromagnetic Field in Its Engineering Aspects”; American Elsevier: New York, 1967; p 75. Shoemaker, D. P.; Garland, C. W.; Steinfeld, J. I.; Nibler, J. W. “Experiments in Physical Chemistry”, 4th ed.; McGraw- Hill: New York, 1981; Chapter 19. Daniels. F. W.: Williams, J. W.: Bender. P.: Albertv. R. A. “Experimental’ Physical Chemistry”, 6th ed:; McGraw-Hill: New York, 1962; p 474. Wina. R.: Drew. H.: Takano. T.: Broka. C.: Tanaka. S.: Itakura. K.; Dickerson, R. E. Nature (London) 1980, 287, 755. Skolnick, J.; Fixman, M. Macromolecules 1978, 11, 867. IMSL International and Statistical Libraries, Inc.: Houston, TX, 1975. Gradshteyn, I. S.; Ryzhik, I. M. “Table of Integrals, Series, and Products”; Jeffrey, A., Ed.; Academic Press: New York, 1980. Stratton, J. A. “Electromagnetic Theory”; McGraw-Hill: New York, 1941; p 204.
Copyright © 2022 FDOKUMEN