Human Anatomy & Physiology Fluid, Electrolyte, and Acid ...
11
10/26/2014 1 Human Anatomy & Physiology PowerPoint ® Lecture Slides prepared by Barbara Heard, Atlantic Cape Community College C H A P T E R © 2013 Pearson Education, Inc. © Annie Leibovitz/Contact Press Images Fluid, Electrolyte, and Acid-Base Balance 26 © 2013 Pearson Education, Inc. Body Water Content • Infants: 73% or more water (low body fat, low bone mass) • Adult males: ~60% water • Adult females: ~50% water (higher fat content, less skeletal muscle mass) – Adipose tissue least hydrated of all • Water content declines to ~45% in old age © 2013 Pearson Education, Inc. Fluid Compartments • Total body water = 40 L • Two main fluid compartments – Intracellular fluid (ICF) compartment: 2/3 in cells – Extracellular fluid (ECF) compartment: 1/3 outside cells • Plasma: 3 L • Interstitial fluid (IF): 12 L in spaces between cells – Usually considered part of IF: lymph, CSF, humors of the eye, synovial fluid, serous fluid, and gastrointestinal secretions © 2013 Pearson Education, Inc. Figure 26.1 The major fluid compartments of the body. Total body water Volume = 40 L 60% of body weight Intracellular fluid (ICF) Volume = 25 L 40% of body weight Interstitial fluid (IF) Volume = 12 L 80% of ECF Plasma Volume = 3 L, 20% of ECF Extracellular fluid (ECF) Volume = 15 L 20% of body weight © 2013 Pearson Education, Inc. Electrolyte Concentration © 2013 Pearson Education, Inc. Electrolyte Concentration • For single charged ions (e.g. Na + ), 1 mEq = 1 mOsm • For bivalent ions (e.g. Ca 2+ ), 1 mEq = 1/2 mOsm • 1 mEq of either provides same amount of charge
-
Upload
khangminh22 -
Category
Documents
-
view
3 -
download
0
Transcript of Human Anatomy & Physiology Fluid, Electrolyte, and Acid ...

10/26/2014
1
Human Anatomy & PhysiologyNinth Edition
PowerPoint® Lecture Slides
prepared by
Barbara Heard,
Atlantic Cape Community
College
C H A P T E R
© 2013 Pearson Education, Inc.© Annie Leibovitz/Contact Press Images
Fluid, Electrolyte, and Acid-Base Balance
26
© 2013 Pearson Education, Inc.
Body Water Content
• Infants: 73% or more water (low body fat,
low bone mass)
• Adult males: ~60% water
• Adult females: ~50% water (higher fat
content, less skeletal muscle mass)
– Adipose tissue least hydrated of all
• Water content declines to ~45% in old age
© 2013 Pearson Education, Inc.
Fluid Compartments
• Total body water = 40 L
• Two main fluid compartments
– Intracellular fluid (ICF) compartment: 2/3 in
cells
– Extracellular fluid (ECF) compartment: 1/3
outside cells
• Plasma: 3 L
• Interstitial fluid (IF): 12 L in spaces between cells
– Usually considered part of IF: lymph, CSF, humors of the
eye, synovial fluid, serous fluid, and gastrointestinal
secretions
© 2013 Pearson Education, Inc.
Figure 26.1 The major fluid compartments of the body.
Total body water
Volume = 40 L60% of body weight
Intracellular fluid (ICF)
Volume = 25 L40% of body weight
Interstitial
fluid (IF)
Volume = 12 L80% of ECF
Pla
sm
a
Vo
lum
e =
3 L
, 20%
of E
CF
Extracellular
fluid (ECF)
Volume = 15 L20% of body weight
© 2013 Pearson Education, Inc.
Electrolyte Concentration
© 2013 Pearson Education, Inc.
Electrolyte Concentration
• For single charged ions (e.g. Na+), 1 mEq
= 1 mOsm
• For bivalent ions (e.g. Ca2+), 1 mEq = 1/2
mOsm
• 1 mEq of either provides same amount of
charge

10/26/2014
2
© 2013 Pearson Education, Inc.
Extracellular and Intracellular Fluids
• Each fluid compartment has distinctive
pattern of electrolytes
• ECF
– All similar
• Major cation: Na+
• Major anion: Cl–
– Except: higher protein, lower Cl– content of
plasma
© 2013 Pearson Education, Inc.
Extracellular and Intracellular Fluids
• ICF:
– Low Na+ and Cl–
– Major cation: K+
– Major anion HPO42–
– More soluble proteins than in plasma
© 2013 Pearson Education, Inc.
Figure 26.2 Electrolyte composition of blood plasma, interstitial fluid, and intracellular fluid.
Blood plasma
Interstitial fluid
Intracellular fluid
Sodium
Potassium
Calcium
Magnesium
Bicarbonate
Chloride
Hydrogen phosphate
Sulfate
Na+
K+
Ca2+
Mg2+
HCO3–
Cl–
HPO42–
SO42–
Na+ K+ Ca2+ Mg2+ HCO3– Cl– HPO4
2– SO42– Protein
anions
Total solute concentration (m
Eq/L)
160
140
120
100
80
60
40
20
0
© 2013 Pearson Education, Inc.
Figure 26.3 Exchange of gases, nutrients, water, and wastes between the three fluid compartments of the body.
Lungs Gastrointestinaltract
Kidneys
Blood
plasma
O2 CO2 Nutrients H2O Ions NitrogenouswastesInterstitial
fluid
O2 CO2 Nutrients H2O,Ions
H2O,Ions
Nitrogenouswastes
Intracellular
fluid in tissue cells
© 2013 Pearson Education, Inc.
Water Balance and ECF Osmolality
• Water intake must = water output = ~ 2500
ml/day
• Water intake: beverages, food, and
metabolic water
• Water output: urine (60%), insensible
water loss (lost through skin and lungs),
perspiration, and feces
© 2013 Pearson Education, Inc.
Figure 26.4 Major sources of water intake and output.
Metabolism 10%
Foods 30%
Beverages 60%
Feces 4%
Sweat 8%
Insensible loss
via skin and
lungs 28%
Urine 60%
Average output
per dayAverage intake
per day
250 ml
750 ml
1500 ml
2500 ml
100 ml
200 ml
700 ml
1500 ml

10/26/2014
3
© 2013 Pearson Education, Inc.
Maintenance of Body fluid Osmolality
• Osmolality maintained at ~ 280 – 300
mOsm
• Rise in osmolality
– Stimulates thirst
– ADH release
• Decrease in osmolality
– Thirst inhibition
– ADH inhibition
© 2013 Pearson Education, Inc.
Figure 26.5 The thirst mechanism for regulating water intake.
ECF osmolality Plasma volume(5 –10%)
Blood pressure
Granular cellsin kidney
Renin-angiotensin-aldosterone mechanism
Angiotensin II
Dry mouth
SalivaOsmoreceptorsin hypothalamus
Hypothalamic thirst center
Sensation of thirst;person takes a
drink
Water moistens mouth, throat;
stretches stomach,intestine
Water absorbed from GI tract
ECF osmolalityPlasma volume
Initial stimulus
Physiological response
Result
Increases, stimulates
Reduces, inhibits
© 2013 Pearson Education, Inc.
Regulation of Water Output: Influence of
ADH
• Other factors may trigger ADH release
– Large changes in blood volume or pressure
• E.g., BP ADH release due to blood vessel
baroreceptors and renin-angiotensin-aldosterone
mechanism
• Factors lowering blood volume: intense sweating,
vomiting, or diarrhea; severe blood loss; traumatic
burns; and prolonged fever
© 2013 Pearson Education, Inc.
Figure 26.6 Mechanisms and consequences of ADH release.
ECF osmolalityNa+ concentration
in plasma
Plasma volume(5–10%), BP
Stimulates
Osmoreceptorsin hypothalamus
Inhibits
Baroreceptorsin atria and
large vesselsStimulates
Stimulates
Negativefeedbackinhibits
Posterior pituitary
Releases ADH
Antidiuretic hormone (ADH)
Targets
Collecting ductsof kidneys
Effects
Water reabsorption
Results in
ECF osmolalityPlasma volume
Scant urine
© 2013 Pearson Education, Inc.
Disorders of Water Balance
• Principal abnormalities of water balance
– Dehydration
– Hypotonic hydration
– Edema
© 2013 Pearson Education, Inc.
Disorders of Water Balance: Hypotonic
Hydration
• Cellular overhydration, or water intoxication
• Occurs with renal insufficiency or rapid excess water ingestion
• ECF osmolality hyponatremia net osmosis into tissue cells swelling of cells severe metabolic disturbances (nausea, vomiting, muscular cramping, cerebral edema) possible death
• Treated with hypertonic saline

10/26/2014
4
© 2013 Pearson Education, Inc.
Slide 1Figure 26.7b Disturbances in water balance.
Excessive
H2O entersthe ECF
ECF osmotic
pressure fallsH2O moves
into cells by osmosis; cells swell
Consequences of hypotonic hydration (water gain).
If more water than solutes is gained, cells swell.
1 2 3
© 2013 Pearson Education, Inc.
Disorders of Water Balance: Edema
• Atypical accumulation of IF tissue swelling
(not cell swelling)
• Result of fluid out of blood or fluid into blood
• fluid out of blood caused by
– Increased capillary hydrostatic pressure or
permeability
• Capillary hydrostatic pressure increased by incompetent
venous valves, localized blood vessel blockage, congestive
heart failure, blood volume
• Capillary permeability increased by ongoing inflammatory
response
© 2013 Pearson Education, Inc.
Edema
• fluid returning to blood result of
– Imbalance in colloid osmotic pressures, e.g.,
hypoproteinemia ( plasma protein levels
low colloid osmotic pressure)
• Fluids fail to return at venous ends of capillary
beds
• Results from protein malnutrition, liver disease, or
glomerulonephritis
© 2013 Pearson Education, Inc.
Electrolyte Balance
• Electrolytes are salts, acids, bases, some
proteins
• Electrolyte balance usually refers only to
salt balance
• Salts control fluid movements; provide
minerals for excitability, secretory activity,
membrane permeability
• Salts enter body by ingestion and
metabolism; lost via perspiration, feces,
urine, vomit
© 2013 Pearson Education, Inc.
Central Role of Sodium
• Most abundant cation in ECF
– Sodium salts in ECF contribute 280 mOsm of
total 300 mOsm ECF solute concentration
• Only cation exerting significant osmotic
pressure
– Controls ECF volume and water
distribution
– Changes in Na+ levels affects plasma volume,
blood pressure, and ECF and IF volumes
© 2013 Pearson Education, Inc.
Table 26.2 Sodium Concentration and Sodium Content

10/26/2014
5
© 2013 Pearson Education, Inc.
Regulation of Sodium Balance: Aldosterone
• Regardless of aldosterone presence
– 65% Na+ reabsorbed in proximal tubules; 25%
reclaimed in nephron loops
– Na + never secreted into filtrate
• Water in filtrate follows Na+ if ADH is
present
– Na+ in urine water loss
© 2013 Pearson Education, Inc.
Aldosterone
• Aldosterone decreased urinary output;
increased blood volume
– By active reabsorption of remaining Na+ in
distal convoluted tubule and collecting duct
• Also causes increased K+ secretion
© 2013 Pearson Education, Inc.
Regulation of Sodium Balance: Aldosterone
• Renin-angiotensin-aldosterone
mechanism main trigger for aldosterone
release
– Granular cells of JGC secrete renin in
response to
• Sympathetic nervous system stimulation
• filtrate NaCl concentration
• stretch (due to blood pressure) of granular
cells
© 2013 Pearson Education, Inc.
Regulation of Sodium Balance: Aldosterone
• Renin catalyzes production of
angiotensin II
– Prompts aldosterone release from adrenal
cortex
– Na+ reabsorption by kidney tubules
• Aldosterone release also triggered by
elevated K+ levels in ECF
• Aldosterone brings about its effects slowly
(hours to days)
© 2013 Pearson Education, Inc.
Figure 26.8 Mechanisms and consequences of aldosterone release.
K+ concentrationin the ECF
Body Na+ contenttriggers renin release,
increasing angiotensin II
Stimulates
Adrenal cortex
Releases
Aldosterone
Targets
Kidney tubules
Effects
Na+ reabsorption K+ secretion
Restores
Homeostatic plasmalevels of Na+ and K+
© 2013 Pearson Education, Inc.
Figure 26.9 Mechanisms and consequences of ANP release.
Stretch of atriaof heart due to BP
Releases
Atrial natriuretic peptide(ANP)
Targets
JG complexof the kidney
Hypothalamus and posterior pituitary
Adrenal cortex
EffectsEffects
Renin release*
ADH releaseAldosterone
release
InhibitsInhibits
Angiotensin II
Vasodilation
Collecting ducts of kidneys
Na+ and H2O reabsorption
Effects
Blood volume
Blood pressure
Results in
Results in
Negativefeedback

10/26/2014
6
© 2013 Pearson Education, Inc.
Influence of other Hormones
• Female sex hormones
– Estrogens: NaCl reabsorption (like
aldosterone)
• H2O retention during menstrual cycles and
pregnancy
– Progesterone: Na+ reabsorption (blocks
aldosterone)
• Promotes Na+ and H2O loss
• Glucocorticoids: Na+ reabsorption and
promote edema
© 2013 Pearson Education, Inc.
Systemicblood pressure/volume
Stretch in afferent arterioles
Filtrate NaClconcentration in ascending
limb of nephron loop
Inhibits baroreceptorsin blood vessels
Granular cellsof kidneys
Sympathetic nervous system
Release
Renin Systemic arterioles
Catalyzes conversion Causes
Angiotensinogen(from liver)
Angiotensin I Vasoconstriction
Results in
Converting enzyme (in lungs)
Angiotensin II
Peripheral resistance
Posterior pituitary
Releases
Systemic arterioles Adrenal cortex
Secretes
ADH (antidiuretichormone)
Causes
Vasoconstriction Aldosterone
Results in Targets
Collecting ducts of kidneys
Causes
Causes
Peripheral resistance Distal kidney tubules
Na+ (and H2O)reabsorption
H2O reabsorption
Blood volume
Results in
Blood pressure
(+) stimulates
ADH release and effects
Renin-angiotensin-aldosteroneMechanism
Neural regulation (sympathetic nervous system effects)
(+) (+)
(+)
(+)
(+)
(+)
(+)(+)
(+)
(+)
Figure 26.10 Mechanisms regulating sodium and water balance help maintain blood pressure homeostasis.
© 2013 Pearson Education, Inc.
Regulation of Potassium Balance
• Importance of potassium
– Affects RMP in neurons and muscle cells
(especially cardiac muscle)
• ECF [K+] RMP depolarization reduced
excitability
• ECF [K+] hyperpolarization and
nonresponsiveness
© 2013 Pearson Education, Inc.
Regulation of Potassium Balance
• Hyperkalemia - too much K+
• Hypokalemia - too little K+
• Both disrupt electrical conduction in heart
– Sudden death
© 2013 Pearson Education, Inc.
Regulation of Potassium Balance
• K+ part of body's buffer system
• H+ shifts in and out of cells in opposite
direction of K+ to maintain cation balance,
so
– ECF K+ levels rise with acidosis
– ECF K+ levels fall with alkalosis
• Interferes with activity of excitable cells
© 2013 Pearson Education, Inc.
Influence of Plasma Potassium
Concentration
• Most important factor affecting K+
secretion is its concentration in ECF
• High K+ diet K+ content of ECF K+
entry into principal cells K+ secretion
• Low K+ diet or accelerated K+ loss reduces
its secretion

10/26/2014
7
© 2013 Pearson Education, Inc.
Regulation of Potassium Balance
• Influence of aldosterone
– Stimulates K+ secretion (and Na+
reabsorption) by principal cells
– Adrenal cortical cells directly sensitive to K+
content of ECF
• Increased K+ in adrenal cortex causes
– Release of aldosterone K+ secretion
• Abnormal aldosterone levels severely
influence K+ levels
© 2013 Pearson Education, Inc.
Regulation of Calcium
• 99% of body's calcium in bones
– Calcium phosphate salts
• Ca2+ in ECF important for
– Blood clotting
– Cell membrane permeability
– Secretory activities
– Neuromuscular excitability - most important
© 2013 Pearson Education, Inc.
Regulation of Calcium
• Hypocalcemia excitability and
muscle tetany
• Hypercalcemia inhibits neurons and
muscle cells, may cause heart arrhythmias
• Calcium balance controlled by parathyroid
hormone (PTH) from parathyroid gland
– Rarely deviates from normal limits
© 2013 Pearson Education, Inc.
Influence of PTH
• PTH promotes increase in calcium levels
by targeting
– Bones – osteoclasts break down matrix,
releasing calcium and phosphate to blood
– Kidneys – increases calcium reabsorption;
decreases phosphate ion reabsorption
– Small intestine – increases calcium
absorption (indirectly through stimulation of
kidney to activate vitamin D precursor)
© 2013 Pearson Education, Inc.
Influence of PTH
• 98% filtered calcium reabsorbed due to PTH
• If ECF calcium levels normal PTH secretion inhibited
• 75% of filtered phosphates reabsorbed in PCT
– PTH inhibits this by decreasing the Tm
• Phosphate reabsorption also affected by insulin (increases it) and glucagon (decreases it)
© 2013 Pearson Education, Inc.
Figure 16.13 Effects of parathyroid hormone on bone, the kidneys, and the intestine.
Osteoclast activity
in bone causes Ca2+
and PO43- release
into blood
Hypocalcemia
(low blood Ca2+
)
PTH release from
parathyroid gland
Ca2+ reabsorption
in kidney tubule
Activation of
vitamin D by kidney
Ca2+ absorptionfrom food in small
intestine
Ca2+ in blood
Initial stimulus
Physiological response
Result

10/26/2014
8
© 2013 Pearson Education, Inc.
Regulation of Anions
• Cl– is major anion in ECF
– Helps maintain osmotic pressure of blood
– 99% of Cl– is reabsorbed under normal pH
conditions
• When acidosis occurs, fewer chloride ions
are reabsorbed
• Other anions have transport maximums
and excesses are excreted in urine
© 2013 Pearson Education, Inc.
Acid-base Balance
• pH affects all functional proteins and
biochemical reactions, so closely
regulated
• Normal pH of body fluids
– Arterial blood: pH 7.4
– Venous blood and IF fluid: pH 7.35
– ICF: pH 7.0
• Alkalosis or alkalemia: arterial pH >7.45
• Acidosis or acidemia: arterial pH <7.35
© 2013 Pearson Education, Inc.
Acid-base Balance
• Most H+ produced by metabolism
– Phosphorus-containing protein breakdown
releases phosphoric acid into ECF
– Lactic acid from anaerobic respiration of
glucose
– Fatty acids and ketone bodies from fat
metabolism
– H+ liberated when CO2 converted to HCO3– in
blood
© 2013 Pearson Education, Inc.
Acid-base Balance
• Concentration of hydrogen ions regulated
sequentially by
– Chemical buffer systems: rapid; first line of
defense
– Brain stem respiratory centers: act within 1–3
min
– Renal mechanisms: most potent, but require
hours to days to effect pH changes
© 2013 Pearson Education, Inc.
Acid-base Balance: Chemical Buffer
Systems
• Strong acids dissociate completely in
water; can dramatically affect pH
• Weak acids dissociate partially in water;
are efficient at preventing pH changes
• Strong bases dissociate easily in water;
quickly tie up H+
• Weak bases accept H+ more slowly
© 2013 Pearson Education, Inc.
A strong acid such as
HCI dissociates
completely into its ions.
A weak acid such as
H2CO
3does not
dissociate completely.
Figure 26.11 Dissociation of strong and weak acids in water.
10/26/2014
9
© 2013 Pearson Education, Inc.
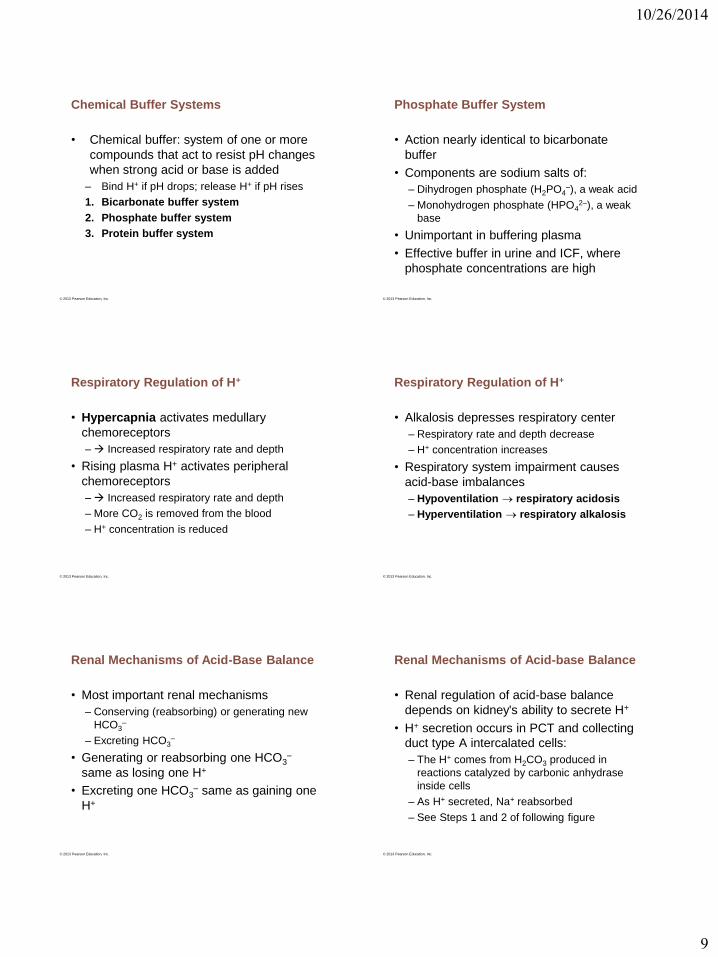
Chemical Buffer Systems
• Chemical buffer: system of one or more
compounds that act to resist pH changes
when strong acid or base is added
– Bind H+ if pH drops; release H+ if pH rises
1. Bicarbonate buffer system
2. Phosphate buffer system
3. Protein buffer system
© 2013 Pearson Education, Inc.
Phosphate Buffer System
• Action nearly identical to bicarbonate
buffer
• Components are sodium salts of:
– Dihydrogen phosphate (H2PO4–), a weak acid
– Monohydrogen phosphate (HPO42–), a weak
base
• Unimportant in buffering plasma
• Effective buffer in urine and ICF, where
phosphate concentrations are high
© 2013 Pearson Education, Inc.
Respiratory Regulation of H+
• Hypercapnia activates medullary
chemoreceptors
– Increased respiratory rate and depth
• Rising plasma H+ activates peripheral
chemoreceptors
– Increased respiratory rate and depth
– More CO2 is removed from the blood
– H+ concentration is reduced
© 2013 Pearson Education, Inc.
Respiratory Regulation of H+
• Alkalosis depresses respiratory center
– Respiratory rate and depth decrease
– H+ concentration increases
• Respiratory system impairment causes
acid-base imbalances
– Hypoventilation respiratory acidosis
– Hyperventilation respiratory alkalosis
© 2013 Pearson Education, Inc.
Renal Mechanisms of Acid-Base Balance
• Most important renal mechanisms
– Conserving (reabsorbing) or generating new
HCO3–
– Excreting HCO3–
• Generating or reabsorbing one HCO3–
same as losing one H+
• Excreting one HCO3– same as gaining one
H+
© 2013 Pearson Education, Inc.
Renal Mechanisms of Acid-base Balance
• Renal regulation of acid-base balance
depends on kidney's ability to secrete H+
• H+ secretion occurs in PCT and collecting
duct type A intercalated cells:
– The H+ comes from H2CO3 produced in
reactions catalyzed by carbonic anhydrase
inside cells
– As H+ secreted, Na+ reabsorbed
– See Steps 1 and 2 of following figure

10/26/2014
10
© 2013 Pearson Education, Inc.
Slide 1Figure 26.12 Reabsorption of filtered HCO3– is coupled to H+ secretion.
Filtrate intubule lumen
Nucleus
PCT cell
ATPase
Peri-tubular
capillary
ATPase
CA * CA
Tight
junction
Primary active transport
Secondary active transport
Simple diffusion
Transport protein
Carbonic anhydraseCA
CO2 combines with water within the tubule cell, forming H2CO3.
H2CO3 is quickly split, forming
H+ and bicarbonate ion (HCO3−).
H+ is secreted
into the filtrate.
For each H+ secreted, a HCO3
− enters the peritubular capillary blood either via symport with Na+ or via antiport with CI−.
Secreted H+
combines with HCO3− in
the filtrate, forming carbonic acid (H2CO3). HCO3
− disappears from the filtrate at the same rate that HCO3
− (formed within the tubule cell) enters the peritubular capillary blood.
CO2 diffuses into the tubule cell, where it triggers further H+
secretion.
1 2
3a
3b
4
56
3a
4
5
2
6
1
3b
The H2CO3 formed in the filtrate dissociates to release CO2 and H2O.
© 2013 Pearson Education, Inc.
Renal Mechanisms of Acid-base Balance
• Rate of H+ secretion changes with ECF
CO2 levels
– CO2 in peritubular capillary blood rate
of H+ secretion
– System responds to both rising and falling H+
concentrations
© 2013 Pearson Education, Inc.
Figure 26.13 New HCO3– is generated via buffering of secreted H+ by HPO4
2– (monohydrogen phosphate).
Filtrate intubule lumen
Nucleus
Tight junction Peri-tubularcapillary
(new)ATPase
Type Aintercalatedcell of collecting duct
out in urine
CO2 combines with water within the type A intercalated cell, forming H2CO3.
H2CO3 is quickly split, forming H+ and bicarbonate ion (HCO3
−).
H+ is secreted into the filtrate by a H+ ATPase pump.
The H2PO4−
is excreted in the urine.
Primary active transportSecondary active transportSimple diffusionFacilitated diffusion
Transport protein
Ion channel
Carbonic anhydrase
Slide 1
For each H+
secreted, a HCO3
− entersthe peritubular capillary blood via an antiport carrier in a HCO3
− -CI−
exchange process.
SecretedH+ combines with HPO4
2−
in the tubular filtrate, FormingH2PO4
−.
1
2
3a 3b
4
5
1 2 3a
3b
4
5
© 2013 Pearson Education, Inc.
Ammonium Ion Excretion
• More important mechanism for excreting
acid
• Involves metabolism of glutamine in PCT
cells
• Each glutamine produces 2 NH4+ and 2
"new" HCO3–
• HCO3– moves to blood and NH4
+ is
excreted in urine
• Replenishes alkaline reserve of blood
© 2013 Pearson Education, Inc.
Figure 26.14 New HCO3– is generated via glutamine metabolism and NH4
+ secretion.
1
PCT cells metabolizeglutamine toNH4
+and HCO3−.
This weak acid NH4+
(ammonium) is secreted intothe filtrate, taking the place ofH+ on a Na+ -H+ antiport carrier.
For each NH4+ secreted,
a bicarbonate ion (HCO3−)
enters the peritubular capillary
blood via a symport carrier.
The NH4+ is
excreted in the urine.
NucleusFiltrate intubule lumen
PCT tubule cells
Glutamine Glutamine
Deamination,
oxidation, and
acidification
(+H+)
Glutamine
Primary active transport
Secondary active transport
Simple diffusion
Transport protein
Tight junction
out in urine
(new)
ATPase
Peri-tubular
capillary
2a 2b
2b2a1
3
3
Slide 1
© 2013 Pearson Education, Inc.
Bicarbonate Ion Secretion
• When body in alkalosis, type B
intercalated cells
– Secrete HCO3–
– Reclaim H+ to acidify blood

10/26/2014
11
© 2013 Pearson Education, Inc.
Bicarbonate Ion Secretion
• Mechanism is opposite of bicarbonate ion
reabsorption process by type A
intercalated cells
• Even during alkalosis, nephrons and
collecting ducts conserve more HCO3–
than they excrete
© 2013 Pearson Education, Inc.
Respiratory Acidosis and Alkalosis
• Most important indicator of adequacy of
respiratory function is PCO2level (normally
35–45 mm Hg)
– PCO2above 45 mm Hg respiratory acidosis
• Common cause of acid-base imbalances
• Due to decrease in ventilation or gas exchange
• CO2 accumulates in blood
• Characterized by falling blood pH and rising PCO2
© 2013 Pearson Education, Inc.
Respiratory Acidosis and Alkalosis
• PCO2below 35 mm Hg respiratory
alkalosis
– Common result of hyperventilation often due
to stress or pain
• CO2 eliminated faster than produced
© 2013 Pearson Education, Inc.
Metabolic Acidosis and Alkalosis
• Metabolic acidosis – low blood pH and
HCO3–
– Causes
• Ingestion of too much alcohol ( acetic acid)
• Excessive loss of HCO3– (e.g., persistent diarrhea)
• Accumulation of lactic acid (exercise or shock),
ketosis in diabetic crisis, starvation, and kidney
failure
© 2013 Pearson Education, Inc.
Metabolic Acidosis and Alkalosis
• Metabolic alkalosis much less common
than metabolic acidosis
– Indicated by rising blood pH and HCO3–
– Causes include vomiting of acid contents of
stomach or by intake of excess base (e.g.,
antacids)
© 2013 Pearson Education, Inc.
Respiratory Compensation
• Changes in respiratory rate and depth
• In metabolic acidosis
– High H+ levels stimulate respiratory centers
– Rate and depth of breathing elevated
– Blood pH is below 7.35 and HCO3– level is
low
– As CO2 eliminated by respiratory system,
PCO2falls below normal