Physiology of Decompressive Stress
37
CHAPTER 3 Physiology of Decompressive Stress Jan Stepanek and James T. Webb ... upon the withdrawing of air ... the little bubbles generated upon the absence of air in the blood juices, and soft parts of the body, may by their vast numbers, and their conspiring distension, variously streighten in some places and stretch in others, the vessels, especially the smaller ones, that convey the blood and nourishment: and so by choaking up some passages, ... disturb or hinder the circulation of the blouod? Not to mention the pains that such distensions may cause in some nerves and membranous parts.. —Sir Robert Boyle, 1670, Philosophical transactions Since Robert Boyle made his astute observations in the 17th century, humans have ventured into the highest levels of the atmosphere and beyond and have encountered problems that have their basis in the physics that govern this environment, in particular the gas laws. The main problems that humans face when going at altitude are changes in the gas volume within body cavities (Boyle’s law) with changes in ambient pressure, as well as clinical phenomena secondary to formation of bubbles in body tissues (Henry’s law) secondary to significant decreases in ambient pressure. In the operational aerospace setting, these circumstances are of concern in high-altitude flight (nonpressurized aircraft >5,486 m (18,000 ft), rapid decompression at altitude, flying after diving, and in space operations in the context of extravehicular activities (EVAs). This chapter will focus on pressure changes occurring in the aerospace environment, the associated pathophysiology, pathology, and avenues for risk mitigation and treatment. Although diving decompression illness and altitude decompression illness are evolved gas disorders, they have very distinct dynamics and clinical pictures as a result of the different gas dynamics and physics; the discussion in this chapter will focus on altitude decompression illness as opposed to diving decompression illness. For a detailed discussion of acute hypoxia, hyperventi- lation, and respiratory physiology the reader is referred to Chapter 2, for details on the operational space environment and the potential problems with decompressive stress see Chapter 10, and for diving related problems the reader is encouraged to consult diving and hyperbaric medicine monographs. THE ATMOSPHERE Introduction Variations in Earthbound environmental conditions place limits and requirements on our activities. Even at sea level, atmospheric environmental conditions vary considerably due to latitude, climate, and weather. Throughout the range of aerospace operations, crewmembers and their craft face even larger variations in atmospheric properties that require life support systems and personal equipment for survival and preservation of optimal function. Understanding the physical nature of our atmosphere is crucial to understanding how it can affect human physiology and what protective measures must be employed. Constituents and Properties of the Atmosphere The standard atmosphere of Earth at sea level pressure is expressed as 760 millimeters of mercury (mm Hg), which 46
-
Upload
khangminh22 -
Category
Documents
-
view
2 -
download
0
Transcript of Physiology of Decompressive Stress

C H A P T E R 3
Physiology of DecompressiveStressJan Stepanek and James T. Webb
. . . upon the withdrawing of air . . . the little bubbles generated uponthe absence of air in the blood juices, and soft parts of the body, mayby their vast numbers, and their conspiring distension, variouslystreighten in some places and stretch in others, the vessels, especiallythe smaller ones, that convey the blood and nourishment: and so bychoaking up some passages, . . . disturb or hinder the circulation ofthe blouod? Not to mention the pains that such distensions maycause in some nerves and membranous parts..
—Sir Robert Boyle, 1670, Philosophical transactions
Since Robert Boyle made his astute observations in the17th century, humans have ventured into the highest levelsof the atmosphere and beyond and have encounteredproblems that have their basis in the physics that govern thisenvironment, in particular the gas laws. The main problemsthat humans face when going at altitude are changes inthe gas volume within body cavities (Boyle’s law) withchanges in ambient pressure, as well as clinical phenomenasecondary to formation of bubbles in body tissues (Henry’slaw) secondary to significant decreases in ambient pressure.In the operational aerospace setting, these circumstances areof concern in high-altitude flight (nonpressurized aircraft>5,486 m (18,000 ft), rapid decompression at altitude,flying after diving, and in space operations in the context ofextravehicular activities (EVAs). This chapter will focus onpressure changes occurring in the aerospace environment,the associated pathophysiology, pathology, and avenues forrisk mitigation and treatment.
Although diving decompression illness and altitudedecompression illness are evolved gas disorders, they havevery distinct dynamics and clinical pictures as a result ofthe different gas dynamics and physics; the discussion inthis chapter will focus on altitude decompression illness asopposed to diving decompression illness.
For a detailed discussion of acute hypoxia, hyperventi-lation, and respiratory physiology the reader is referred to
Chapter 2, for details on the operational space environmentand the potential problems with decompressive stress seeChapter 10, and for diving related problems the readeris encouraged to consult diving and hyperbaric medicinemonographs.
THE ATMOSPHERE
IntroductionVariations in Earthbound environmental conditions placelimits and requirements on our activities. Even at sea level,atmospheric environmental conditions vary considerablydue to latitude, climate, and weather. Throughout the rangeof aerospace operations, crewmembers and their craft faceeven larger variations in atmospheric properties that requirelife support systems and personal equipment for survival andpreservation of optimal function. Understanding the physicalnature of our atmosphere is crucial to understanding how itcan affect human physiology and what protective measuresmust be employed.
Constituents and Propertiesof the AtmosphereThe standard atmosphere of Earth at sea level pressure isexpressed as 760 millimeters of mercury (mm Hg), which
46

C H A P T E R 3 P H Y S I O L O G Y O F D E C O M P R E S S I V E S T R E S S 47
T A B L E 3 - 1aThe Atmosphere of Earth
GasPercentage inAtmosphere
Partial Pressure(mm Hg)
Nitrogen 78.084 593.44Oxygen 20.948 159.20Argon 0.934 7.10Carbon dioxide 0.031 0.24Other gases 0.003 0.02Total 100.000 760.00
aClean, dry air at 15◦C (59◦F), sea level; mean of values every 15◦
between 15◦ N and 75◦ N; Ref: U.S. Standard Atmosphere, 1962.
is equivalent to 1,013.2 millibars [mb or hectoPascals, hPa,hundreds of Pascals (newtons per square meter)], 14.7 psi,and 29.92 in. of Hg. Constituents of the atmosphere webreathe are shown in Table 3-1 and these percentagesare consistent throughout the atmosphere of interest toaerospace physiology.
Atmospheric ZonesTemperature and its variation provide much of the basisfor subdivisions of Earth’s atmosphere into regions definedin Figure 3-1. The lowest zone, the troposphere, is the onlyregion of Earth’s atmosphere capable of supporting humanhabitation without artificial support. The troposphere startsat the Earth’s surface and extends to the tropopause, between5 and 9 mi [8 to 14.5 kilometer (km); 26,000–48,000 ft].At its higher levels, above 20,000 ft (3.8 mi; 6 km),at least some degree of artificial support is required inthe form of supplemental oxygen. A linear decrease intemperature characterizes the troposphere from sea level(15◦C) to the tropopause, typically at approximately 35,000 ft(10.7 km), where the temperature is approximately −55◦C.The lapse rate, that is, the rate of decreasing temperaturewith increase in altitude in the troposphere, is −2◦C orapproximately −3.5 F per 1,000 ft. Approximately 80% of theatmospheric mass and most of the weather phenomena occurin the troposphere. Variations in temperature, pressure,and humidity in the troposphere account for extremedifferences in the environmental conditions we experienceas weather.
The tropopause is the division between the troposphereand stratosphere. Aircraft jet engines perform with greaterefficiency at lower temperatures, which is one reason cruiseis planned near the tropopause where the temperature islowest. The stratosphere starts just above the tropopause andextends up to 50 km (31 mi). Ninety-nine percent of themass of the air is located in the troposphere and stratosphere.The temperature throughout the lower part of stratosphere isrelatively constant. Compared to the troposphere, this part ofthe atmosphere is dry and less dense. The temperature in thisregion increases gradually to −3◦C due to the absorptionof ultraviolet (UV) radiation. This radiation reaching the
lower stratosphere from the sun is responsible for creationof ozone, the ozone layer, or ozonosphere. In the process ofozone production and in reactions with ozone, nearly all ofthe UV radiation is absorbed including the most hazardousform to life, UV-C (wavelengths <280 nm). Much of UV-B(wavelengths between 280 and 320 nm) is also absorbed,although the UV-B reaching the surface is sufficient to bea major cause of melanoma cancers and sunburn. Most ofthe UV-A (wavelengths between 320 and 400 nm) reachesthe Earth’s surface, but is needed by humans for productionof vitamin D. Although flight in the upper troposphere andlower stratosphere involves exposure to more UV radiationthan on the surface, no health risk is currently associatedwith routine flying operations (see Chapter 8). Flight abovethe stratosphere and space flight involve risk of exposure tosignificant levels of radiation.
The higher regions of the atmosphere, 50,000 ft andabove, are so thin that pressure suits are required tosustain life. Temperature variations result from variableabsorption of the sun’s energy in several forms and thermalprotection must be incorporated for any exposure in theseregions. In the higher regions, flight of air-breathing aircraftbecomes impossible and control surfaces are no longereffective. Further description will be left to the referencesand recommended reading.
The subdivision of the zones described in the precedingtext relates to the ability of humans to function based on thepartial pressure of oxygen available and need for artificialpressure to sustain life (Table 3-2).
AltitudeAltitude is measured in many different ways using differentstandards for different purposes. On low-altitude mapsprovided to pilots, the height of physical features of Earth,like mountains and airfields, is measured in feet above meansea level (MSL). MSL is the average height of the surface ofthe sea for all stages of the tide over a 19-year period, usuallydetermined from hourly height readings. With properly set,calibrated, and functioning altimeters, feet above MSL is thealtitude viewed by the pilot in an aircraft. This is also known aspressure altitude (PA), the altitude in the Earth’s atmosphereabove the standard datum plane, standard sea level pressure,measured by a pressure altimeter. Pilots are quite interestedin the height of their aircraft above the ground. This altitude,above ground level (AGL), is determined by subtracting theelevation in feet above MSL of the ground below the aircraftfrom the elevation of the aircraft. The routine determinationof a safe altitude on a route between navigational aids to avoidterrain and towers is usually viewed on low-level navigationalmaps as the minimum en route altitude (MEA), whichis the altitude between radio fixes that assures acceptablenavigational signal coverage and meets obstruction clearancerequirements between those fixes. Flying at that altitude witha properly set altimeter ensures adequate separation fromobstacles for the entire route segment. PA is the height inthe atmosphere at which a given value of standard pressureexists. With 29.92 in. of Hg set in the Kollsman window of the

48 P H Y S I O L O G Y A N D E N V I R O N M E N T
Altitude
km mL
600 372
120 74
85 53
60 3750 31
15 90 0
Thermosphere
Mesopause
Mesosphere
Stratopause
Stratosphere
Tropopause
Troposphere
Temperature°C
−100 −60
−148 −76
0
32
20
68
200
392
1,750
3,182°F
FIGURE 3-1 Zones of Earth’s atmosphere.
altimeter, PA is displayed in feet on the altimeters of UnitedStates Air Force (USAF) aircraft. Because hectoPascals area standard in parts of the world, some confusion can arisewhen pilots ‘‘assume’’ that, for example, 988 means 29.98 in.of Hg when given by an air traffic controller as an altimetersetting because some controllers in the United States leaveoff the ‘‘2.’’
Air Density, Pressure, and TemperatureThe density of air is affected by its pressure, which decreasesexponentially with increasing altitude, reaching 50% ofsea level density and pressure at approximately 18,000 ft(5.49 km). This relationship is affected in any specificlocale by deviations from standard temperature and pressure.Figure 3-2 graphically shows how atmospheric pressure isaffected by altitude. The curve depicts how each 10,000-ftincrease in altitude results in less change in pressure; 0 to10,000 ft changing by 237 mm Hg, 10,000 to 20,000 ft
changing by 173 mm Hg, and 40,000 to 50,000 ft changingby only 54 mm Hg.
During takeoff, landing, and low-level phases of flight,aircraft altimeters are routinely set to the field altimetersetting to account for variations in local pressure. Thisprocedure avoids significant errors in altitude of the airfieldversus what is indicated on the altimeter. Temperaturevariations from the standard temperature of 15◦C alsoproduce errors, which affect terrain clearance. For instance,an aircraft flying at 5,000 ft in −40◦C (e.g., Alaska in thewinter) would be more than 1,200 ft lower than the indicatedaltitude after correction for local barometric pressure (PB).Local PB in the United States is based on inches of Hg. Thissetting would show the altitude of 0 ft at sea level on such aday. As the local pressure varies, altimeters are set to higheror lower settings to yield the correct field elevation on anaircraft altimeter at a designated point on that field. Above18,000 ft (flight level 180; altitude in ft/100), altimeters

C H A P T E R 3 P H Y S I O L O G Y O F D E C O M P R E S S I V E S T R E S S 49
T A B L E 3 - 2
Physiological Divisions of the Atmosphere
PhysiologicalDivision
Altitude andPressure Range Problems Solutions
Physiologicalzone
0–10,000 ft0–3,048 m760–523 mm Hg
Trapped gas expansion/contraction during changes inpressure result in middle ear or sinus blocks; shortnessof breath, dizziness, headache, or nausea inunacclimatized individuals or with exercise
Acclimatization or reducedperformance
Physiologicallydeficient zone
10,000–50,000 ft3,048–15,240 m523–87 mm Hg
Oxygen deficiency progresses from minor reductions incognitive and physical capabilities at 10,000 ft to deathover approximately 25,000 ft (possibly lower) withoutsupplemental oxygen
Supplemental O2 and PBA allowsgood performance toapproximately 35,000 ft withprogressively less capability
Space equivalentzone
Above 50,000 ft>15,240 m<87 mm Hg
Survival requires assisted PBAa or, above approximately63,000 ft, a full pressure suit and delivery of 100% O2
to supply at least 140 mm Hg O2
Pressurized cabin or pressure suitwith 100% O2
aPBA = positive pressure breathing for altitude.(Physiological Training, Air Force Pamphlet 160–5, 1976.)
are routinely set to 29.92 in. of Hg to provide adequateand standardized clearance for aircraft altitude separation.Although the inches of Hg standard for altimeter settingsare a pressure indication, it is not normally used in aviationfor describing total atmospheric pressure at a given altitude.Elevation is typically measured in ft, meters (m), or km andpressure in psia, mm Hg, or mb.
Light and SoundDiffusion of light in the lower atmosphere accounts forthe blue color of the sky as viewed from Earth’s surface,a phenomenon which significantly dissipates as low asapproximately 50,000 ft where the blackness of space beginsto become apparent. The speed of sound is 761 mph (340 m/s;1,116 ft/s) at sea level and slower, 660 mph (295 m/s)at 50,000 ft where the temperature is approximately 75◦Clower. The speed of sound is a function of the square root ofthe temperature in ◦K (◦C + 273).
The Gas LawsA basic understanding of the gas laws is necessary tocomprehend the physical nature of the atmosphere andhow it interacts with human physiology. The gas laws definephysical properties of our atmosphere and provide a basis for
understanding how they affect our function during exposureto reduced atmospheric pressure.
Boyle’s LawRobert Boyle (1627–1691) was an Anglo-Irish scientistnoted for his work in physics and chemistry. In 1662,Boyle published the finding which states that at a constanttemperature, the volume of gas is inversely proportional toits pressure. P1 and V1 are the initial pressure and volume,and P2 and V2 are the final pressure and volume. Solvingthis equation for the volume of a contained gas at a differentpressure quantitatively describes trapped gas expansion withreduced pressure.
P1 × V1 = P2 × V2 or P1/P2 = V2/V1
Solving this equation to find the volume of a liter of drygas taken from sea level to 20,000 ft and 40,000 ft, assumingunrestricted expansion, would result in the following:
1.0 L at sea level
(760 mm Hg ×1 L)/349 mm Hg = 2.2 L at 20,000 ft
(760 mm Hg ×1 L)/141 mm Hg = 5.4 L at 40,000 ft
The problem becomes more complicated by the inclusionof water vapor in the lungs and other spaces in the body as
FIGURE 3-2 Atmospheric pressureversus altitude. Altitude (ft)
mm
Hg
00 10,000 20,000 30,000 40,000 50,000 60,000 70,000
100200300400500600700800

50 P H Y S I O L O G Y A N D E N V I R O N M E N T
described in the section Trapped Gas, Section 3. Figure 3-4shows the volume and diameter of a wet gas sphere at variouspressures and graphically shows how Boyle’s law works ontrapped gases during decompression and recompression, de-scent.
Dalton’s LawJohn Dalton (1766–1844) was an English chemist andphysicist. In 1803, he observed that the total pressure ofa mixture of gases is equal to the sum of the partial pressuresof each gas in the mixture.
PT = P1 + P2 + P3 + . . . Pn
Because the standard atmosphere at sea level is760 mm Hg, Dalton’s law indicates that the sum of partialpressures of the gases that make up the standard atmospheremust equal 760 mm Hg. The pressure of each gas in a mix-ture of gases is independent of the pressure of the other gasesin that mixture. Multiplying the percentage of a gas in themixture times the total pressure of the mixture yields thepartial pressure of that gas.
The standard atmosphere does not include water vaporpressure, primarily due to its variation in the Earth’satmosphere between 0% and 100% relative humidity. Thisvariation amounts to 0% to 6.2% of 760 mm Hg, or 0 to47 mm Hg at body temperature, 37◦C.
Henry’s LawWilliam Henry (1775–1836) was an English chemist who, in1803, published his findings that the amount of a gas in asolution varies directly with the partial pressure of that gasover the solution. This relationship explains why dissolvednitrogen transitions to a gas phase in blood and tissues duringdecompressions sufficient to result in supersaturation. Theresulting bubbles of nitrogen with minor amounts of oxygen,carbon dioxide, and water vapor can cause decompressionsickness (DCS).
Charles and Gay-Lussac’s LawJacques Alexandre Cesar Charles (1746–1823) was a Frenchinventor, scientist, mathematician, and balloonist. In 1783,he made the first balloon using hydrogen gas; upon release,it ascended to a height of approximately 3 km (2 mi). In1787, he discovered the relationship between the volume ofgas and temperature, known variously as Gay-Lussac’s law orCharles’s law.
V1/V2 = T1/T2 or V1/T1 = V2/T2
Charles did not publish his findings and Joseph LouisGay-Lussac first published the finding in 1802, referencingCharles’ work. The temperature is in Kelvin degrees, where◦K = ◦C + 273. At absolute zero, −273◦C, the Kelvintemperature is 0◦K. The distinction between Boyle’s lawand Charles’ law is what is held constant, whereas the othertwo parameters are varied. Boyle’s law describes changesin volume with respect to pressure when temperatureis held constant. Charles’ law describes how volume
changes with temperature when pressure is held constant.Although Charles’ law is very important from an engineeringand chemistry standpoint, the temperature of humanbody is usually rather constant at body temperature,limiting its effect on physiology. Changes in all threeparameters (volume, pressure, and temperature) are betterdescribed by the Ideal Gas law, which includes the threeparameters in one equation with other factors to improveaccuracy.
PV = nRT
where P = pressure, V = volume, T = temperature, n = num-ber of moles, and R = universal gas constant = 8.3145 J/mol K.
Gaseous DiffusionExperiments of Thomas Graham (1805–1869), a Britishchemist, showed that the diffusion of a gas is inverselyproportional to the square root of its molecular weight.Therefore, gases of lower molecular weight diffuse morerapidly than gases of higher molecular weight. Diffusion ofa gas is also affected by its solubility in the surroundingmedia and the difference in concentration of the gas betweentwo adjacent volumes. A larger difference in concentrationproduces greater diffusion. A gas with greater solubilityin its solvent, for example tissue or fluids, means moremolecules of it will be available to diffuse as limited bythe other factors. Gaseous diffusion is fundamental tothe physiologic processes of lung and cellular respiration.It further applies to the process of denitrogenation,removal of nitrogen from the body, by breathing 100%oxygen.
Chronic HypoxiaTerrestrial EnvironmentThe historical distinction between hypoxia in the terrestrialand extraterrestrial/aerospace environment has becomeincreasingly blurred in recent decades. The time at acertain pressure (i.e., altitude) and the time and modalityto get to that pressure govern the physiology that will bediscussed. The advent of ultra–long-haul flight operations inenvironments of decreased ambient pressure in civilian airtransport operations (1) and potentially in future explorationclass spaceflight missions, as well as rapid transport ofcivilian and military personnel to and prolonged sojournin high-altitude environments make it very important forthe aerospace medicine practitioner to be familiar with theconcepts of operational significance that can play a role inthose environments. The following paragraphs will reviewoperational considerations and relevant clinical terrestrialsyndromes.
AcclimatizationAltitude acclimatization is a process that occurs uponexposure to a hypobaric and hypoxic environment. Differentprocesses occur with the common goal to protect the bodytissues against the hypoxic challenge of the environment and

C H A P T E R 3 P H Y S I O L O G Y O F D E C O M P R E S S I V E S T R E S S 51
T A B L E 3 - 3
Processes of Acclimatization and RelevantTerminology
Acute Acclimatization(Accommodation) Minutes
Rise in Heart Rate,Increased Ventilation
Chronicacclimatization
Days Increase in hemoglobin(initial decrease inplasma volumefollowed by increasedred cell mass), increasedcapillary density
Adaptation Years Alterations in hypoxicventilatory response
to allow for continued performance. Many of these processesoccur at different speeds and can be summarized in differentgroupings (Table 3-3).
Owing to the processes discussed in the precedingtext, it is difficult to answer the simple question as tohow much time is needed to acclimatize to a givenaltitude, but the key aspects in acclimatization rest in thecardiorespiratory system and the blood that adapt in daysto few weeks.
Unfortunately, there is no one single parameter thatallows us to physiologically quantify and assess the level anddegree of acclimatization. In addition to the lack of a singlereliable parameter to assess acclimatization, we are facedwith significant interindividual variation in speed and degreeof acclimatization. A good clinical rule is to always inquireabout past performance at altitude and presence or absenceof signs and symptoms of acute mountain sickness (AMS);past performance is a guide to future performance in similarenvironments and exposures. Special attention needs to begiven to any preexisting cardiac or pulmonary disease orconditions that may be exacerbated by exposure to a hypoxicenvironment.
There are only scarce data addressing acclimatization andthe effects of age and gender. There does not appear to bea significant difference in acclimatization between men andwomen, and older age appears to confer some protectionfrom AMS.
Preacclimatization is a technique used to achieve somedegree of acclimatization preceding the exposure in thehigh-altitude environment. This can be accomplished byusing an analog environment such as an altitude chamberor sojourns at altitude; good data to show consistentacclimatization benefit of intermittent hypoxic exposureswith nitrogen admixture to the breathing gas (e.g., sleepingin a hypoxic environment) are lacking at this point.The benefits of acclimatization appear to dissipate overa period of 2 to 3 weeks, and it should be noted thatpulmonary edema has been described in native highlanderswith reexposure to altitude after as little as 12 days at lowaltitude (2).
Operational ConsiderationsReduced Exercise CapabilityAerobic performance is significantly impaired as altitude andmaximal oxygen consumption in acclimatized subjects fallsfrom 4 to 5 L/min to approximately 1 L/min at the altitudeof Mount Everest. The demands of the hypoxic environmentlead to a significant reduction in exercise capacity and manyan account of expeditions at extreme altitudes, especiallywithout supplemental oxygen, is filled with vivid descriptionsas to the extreme difficulty of exercise (3).
Any attempt to exercise or be physically active at highaltitude is accompanied by markedly elevated levels of ven-tilation. It is noteworthy that ventilation is usually expressedwith reference to ambient pressure, body temperature, andwith the gas saturated with water vapor [referred to asbody temperature and pressure saturated (BTPS)]. This mea-surement reference takes into account more accuratelythe volume of gas moved by the chest and lungs. An-other measurement condition is STPD, which stands forthe measurement of ventilation in conditions of StandardTemperature, Pressure, and Dry gas. The latter shows muchsmaller volume changes at altitude and has no overt relation-ship to the actual mechanics of breathing (lung/chest wallmovements). Oxygen consumption and carbon dioxide pro-duction are traditionally reported in STPD reference units,such that the values are altitude independent.
Ventilation measurements at high altitudes can reachnear maximum voluntary ventilation levels driven by thepowerful hypoxic drive through the peripheral chemorecep-tors; during the 1981 Everest expedition at 8,300 m (Pb271 mm Hg), Pizzo recorded maximum ventilation witha respiratory rate of 86 breaths/min and a tidal volume of1.26 L/min resulting in a mean ventilation of 107 L/min (4,5).
Reduced Cognitive AbilityThe exposure to any hypoxic environment has operationalramifications in that it can sharply reduce the effectiveness ofan operator, especially in the first few days following insertioninto a high-altitude terrestrial environment. Especially inthe first week at altitude, consideration should be given toadequate rest periods (taking into account the temporarydegradation of sleep quality at altitude), decreased taskintensity, and if possible decreased operational tempo. Inaddition to the known decrements in cognitive performanceassociated with varying degrees of hypoxia, the developmentof severe headaches and neurologic symptoms and signs, aswell as pulmonary symptomatology may be harbingers of aclinically relevant high altitude–related illness such as high-altitude cerebral edema (HACE) or high-altitude pulmonaryedema (HAPE).
Relevant Clinical Terrestrial Syndromes Relatedto High AltitudeThe emphasis in the discussion of high altitude–related clini-cal syndromes must be prevention. The hostile environmentof extreme high altitudes coupled with the intense desire toaccomplish a set goal (e.g., climbing a mountain, executing a

52 P H Y S I O L O G Y A N D E N V I R O N M E N T
mission) in the context of highly motivated and driven teammembers may at times be a dangerous combination.
The education of all team members about disease entitiesand their symptoms that can arise at high altitudes (6,7) is ofimportance such that everybody may be able to observe theirteam members and peers. The emergence of any concerningsigns or early behavioral alterations such as falling behind,change in attitude, lethargy, and so on should prompt height-ened vigilance and early evaluation. Monitoring the dynamicsof any signs and symptoms will allow the team to avoid badoutcomes, and to enable any team member with worseningsymptoms to descend while they are still able to walk.
Acute Mountain SicknessAMS is a syndrome encompassing headache, anorexia,lassitude, nausea, and a feeling of malaise. It can beencountered in 15% to 30% of Colorado resort skiers (8) andin up to 67% of climbers on Mount Rainier (9). Many peoplebecome symptomatic even at intermediate altitudes of 6,000to 6,500 ft. Rapid ascent to altitude (flying, driving) maymarkedly exacerbate the risk. Symptoms usually manifestwithin hours to first few days at altitude.
The scoring of AMS can be accomplished by usingLake Louise consensus scale or a subset of questions ofthe environmental symptom questionnaire (ESQ). The ESQconsists of 67 questions in its ESQ III version. Clinically,it is most relevant to insist that headache be present forthe diagnosis of AMS. Most practitioners prefer the LakeLouise scoring system due to its simplicity, consisting of aself-assessment (most important), clinical assessment, andafunctional score. Symptomatic therapy with nonsteroidalanti-inflammatory over-the-counter medications relievesthe symptoms of headaches. Use of acetazolamide (acarbonic anhydrase inhibitor) is useful in the treatmentof symptoms, but more importantly in the prophylaxisof the condition. The latter is advisable if historically asubject has had past episodes of severe mountain sickness orrapid exposure to a significant altitude is expected. Carbonicanhydrase inhibitors will facilitate acclimatization to altitude.Other agents can be used for symptom control, such asdexamethasone or other steroids. The disadvantage of usingsteroids for the treatment of mountain sickness is their lackof effect on acclimatization and their side effect profile. Arebound effect, that is, reoccurrence of mountain sicknessafter cessation of steroids at altitude is possible.
If available oxygen will alleviate symptoms of mountainsickness, severe cases may benefit from use of a portablehyperbaric chamber (10), especially in the setting of high-altitude expeditions.
The occurrence of the ataxia in a subject with severemountain sickness should be taken very seriously as it maybe a harbinger of early high-altitude cerebral edema, which ifpresent may preclude safe self-evacuation by going to loweraltitude.
High-Altitude Cerebral EdemaHACE usually occurs several days after altitude exposurein the context of mountain sickness. The differentiation
between severe mountain sickness and HACE rests in thedevelopment of ataxia, impaired cognition, and higher cor-tical functions (hallucinations, inability to make decisions,severe mental slowing, irrational behavior, errors) as well asneurologic deficits in addition to the symptoms of severemountain sickness as described earlier (11).
The occurrence of HACE in a hostile high-altitudeenvironment will incapacitate the patient and lead to theneed of an evacuation, thereby putting other participantspotentially at risk. Avoidance of passive transport to extremealtitude and avoidance of ascending with symptoms ofmountain sickness are important factors to avoid unnecessarybad outcomes. HACE may occur together with HAPE.Treatment of HACE consists of descent, the administration ofsteroids (e.g., dexamethasone), oxygen, and if available, useof a portable hyperbaric chamber with the goal of renderingthe patient ambulatory, thereby allowing for further descentfrom altitude.
High-Altitude Pulmonary EdemaHAPE is a noncardiogenic pulmonary edema, which canoccur in up to 1% to 2% of subjects at 12,000 ft(3,650 m), and there appears to be a genetic predispositionin some patients. A careful history will allow identificationof this subpopulation. Significant exaggerated elevationsof pulmonary arterial pressures in susceptible subjects inresponse to hypoxia at altitude appear to be causal factors inthe pathogenesis of this condition.
Incidence depends on rate of ascent and peak altitudereached; reports from Pheriche (4,243 m) showed anincidence of 2.5% (12); Indian troops flown to an altitude of3,500 m had an incidence of 0.57% (13).
Symptoms of HAPE are breathlessness, chest pain,headache, fatigue, and dizziness. Signs include mild ele-vation of temperature, dry cough (especially on exertion),hemoptysis, tachycardia, tachypnea, and cyanosis.
X-rays frequently reveal a pattern of irregular, patchy,later confluent infiltrates in both lower- and mid-lung fields,whereas the apices can be spared at times.
Lowering the pulmonary arterial pressures to providerelief can be accomplished with oxygen and vasodilatorssuch as nifedipine and other agents such as phosphodiesteraseinhibitors, which are currently under study for clinical usein this condition.
For individuals that have genetic disposition to thiscondition, use of prophylactic nifedipine may be a viableoption to prevent HAPE.
Alternatively, the ambient pressure can be increased ina portable hyperbaric chamber to achieve improvement andthereby allow for transportability to lower altitude.
Chronic Mountain Sickness (Monge’s Disease)Chronic mountain sickness is a disease entity that canbe found in populations remaining at altitude for manyyears. The key findings include erythrocytosis and relatedsymptoms such as headaches, dizziness, physical fatigue andmental slowing, anorexia, and dyspnea on exertion, cyanosis,and a ruddy complexion. Pulmonary hypertension and right

C H A P T E R 3 P H Y S I O L O G Y O F D E C O M P R E S S I V E S T R E S S 53
heart failure may also be present. Obvious contributingcauses would be chronic obstructive lung disease, obstructivesleep apnea or sleep-disordered breathing conditions causinghypoxia, and other pulmonary pathology, making the patientmore hypoxic and thereby enhancing the erythrocytosiseven further. Relocation to low altitude in the absence ofpulmonary pathology or other contributing causes is usuallycurative.
Laboratory investigations reveal an increased red cellcount, hemoglobin concentration, and packed red bloodcell volume. PaO2 is decreased and PCO2 is elevated. Theincrease in alveolar–arterial oxygen tension gradient is likelyattributable to increased blood flow to poorly ventilatedareas. The electrocardiogram shows right ventricular hyper-trophy and increased pulmonary arterial pressures as well asblood viscosity (14–17).
High-Altitude Retinal HemorrhagesHigh-altitude retinal hemorrhages (HARH) may be seenin many climbers at very high altitude. The hemorrhagesare typically without symptoms and tend to disappearspontaneously over a couple of weeks upon return fromaltitude. There appears to be a correlation between retinalhemorrhages and HACE (16,17). The subject may developsymptoms if these hemorrhages are close to the macula. Thedistribution of these hemorrhages and cotton wool spots isof a periarteriolar and perivenous distribution. Typically, notreatment is required and recovery is spontaneous.
High-Altitude DeteriorationExtended stays at altitudes greater than 5,000 m typically re-sult in significant weight loss. Field studies and observationsfrom expeditions certainly introduce a variety of confound-ing factors, such as cold, limited food supplies or lack ofpalatable food, or the increased need to burn calories foractivities of climbing or walking. It is remarkable that similarobservations were made in altitude chamber studies, such asthe Operation Everest studies that were 40 days in length,and revealed, despite an unlimited diet and comfortable en-vironmental conditions, that the subjects still lost weight.An increase in basal metabolic rate has been invoked as acausal factor. Furthermore, changes in intestinal absorptionof carbohydrates, protein, and fat in the context of hypoxiamay also play a role above 5,000 m (15).
Extraterrestrial EnvironmentActivity outside of the habitat will be required on aregular basis from any Moon- or Mars-based facility toaccomplish the objectives of exploration. The pressure suitused during exploration must keep the explorer functionalin the absence of an atmosphere on the Moon and nearvacuum (4.5 mm Hg) on the surface of Mars. The suit shouldhave as little negative impact on the mission as possible,which means freedom of movement and minimal fatigue.Current National Aeronautics and Space Administration(NASA) EVA suits employ 100% oxygen at 4.3 psia(226 mm Hg) (18,19), which provide more oxygen thanavailable in sea level air. These current suits are too restrictive
and heavy for use on Mars or the Moon, and unlessdramatic advances in suit technology are achieved, a 4.3psia EVA suit pressure may not be feasible. Therefore,a much lower suit pressure may need to be considered.Avoiding DCS during the transition from habitat pressure toa suit pressure below approximately 3.7 psia (192 mm Hg)would also require a lower habitat pressure. A hypoxicenvironment in the habitat and during exploration could beexperienced on a daily basis. Some physiologic changes willoccur, which are analogous to terrestrial altitude-inducedchanges.
Adaptive Changes to a Hypobaric Hypoxic EnvironmentAdaptation to a low level of hypoxia in an artificial habitatenvironment (acclimation) could be tolerated the same wayacclimatization allows thousands of humans to visit or liveat high-terrestrial altitudes (3,100 m; 519 mm Hg, 10,200 ft)without supplemental oxygen. Although considerable im-provement in function occurs after a few days of exposureto 3,100 m, ventilatory acclimatization would take about aweek (20,21). Low gravitational forces on the Moon and Marsmay reduce the workload and effect of any hypoxia duringroutine activity. Although the lower gravity on Mars (38%of Earth) may reduce the impact of pressure suit weight,mass is still a potential problem in terms of momentumand balance during exploration. Many factors will determinethe potential atmospheres of Moon and Mars habitats, al-though some degree of acclimation to hypoxia is likely to benecessary.
Lower Total PressureAny reduction in total pressure reduces the effectivenessof electronic cooling fans and complicates atmosphericcontrol and circulation. The engineering challenge mustmeet the need for close tolerances on levels of humidity,carbon dioxide, and oxygen levels to maintain comfort andphysiologic function. Detection and removal of pollutantsshould be an extrapolation and refinement of the progressmade during the International Space Station (ISS) habitation.
Water BalanceMaintenance of a comfortable level of humidity in a low-pressure habitat, for example 40% relative humidity and atemperature at 20◦C (68◦F), could help to reduce respiratorylosses of water. This level of humidity with relatively fullcoverage clothing would also aid in reducing insensitivewater loss.
Operational ConsiderationsReduced Cognitive AbilityAcute exposure to 3,048 m (523 mm Hg, 10,000 ft) inEarth’s atmosphere produces documented decrements insome cognitive tests (22,23), particularly those involvinglearning new tasks. In another study, 12-hour exposures to10,000 ft (3,048 m) with rest or mild exercise producedno significant negative impact on cognitive function, butminor negative effects were observed on night vision

54 P H Y S I O L O G Y A N D E N V I R O N M E N T
goggle performance under operational lighting (starlight)conditions. Increased reports of headache during the restingexposures at altitude may indicate imminent mild AMS (24).The USAF does not require its aircraft pilots to usesupplemental oxygen at or below 10,000 ft during theirroutine acute exposures.
Reduced Exercise CapabilityEven after acclimatization, maximal oxygen uptake is lowerat 10,000 ft than at sea level for any individual (25). However,the effect on the submaximal effort during extraterrestrialexploration is unknown.
CommunicationA reduced total pressure for a Moon or Mars habitat andpressure suits will affect vocal cord efficiency in sounddevelopment, although above a total pressure of 226 mm Hg(4.4 psi; 30,000 ft), verbal communication has not beena problem. Because communication between pressure-suited explorers will require electronic transfer, appropriateamplification and filtration could compensate for lower vocalcord efficiency at suit pressures in the 141 mm Hg (2.7 psia;40,000 ft) range.
Fire SafetyThe National Fire Protection Association (NFPA) hasdeveloped an equation that allows calculation of themaximum percentage of oxygen that avoids designationas an atmosphere of increased burning rate. The NFPA 99B:Standard for Hypobaric Facilities (2005;3.3.3.3) definesatmosphere of increased burning rate on the basis of a12 mm/s burning rate (at 23.5% oxygen at 1 atmospheresabsolute (ATA). The equation defining such an atmosphere(NFPA 99B Chapter 3 Definitions; 3.3.3.3) is:
23.45/(Total Pressure in Atmospheres)(0.5)
The factor 23.45 is the highest percentage of oxygen atsea level, which does not create an atmosphere of increasedburning rate.
Even if a pressurized transportation system were usedon the surface, continuous wear of a pressure suit wouldlikely be required to provide adequate safety in the event ofpressurization failure. The pressure suit must be designed toprovide a sufficient level of oxygen and total pressure (min-imum of approximately 141 mm Hg O2; 2.7 psia) to allownormal physiologic function of an acclimated individual andfor extensive mobility and maneuverability. If a pressure suitemploying as much as 4.3 psi differential cannot be made tomeet these requirements, a lower suit pressure may need to beconsidered.
Decompression illness (DCI) is a term used to encompassDCS and arterial gas embolism (AGE). DCS is a clinicalsyndrome following a reduction in ambient pressuressufficient to cause formation of bubbles from gases dissolvedin body tissues. DCS follows dose–response characteristicsat each involved tissue-site, the pathophysiological sequencethat may or may not follow, and clinical symptoms that mayoccur subject to multiple moderating factors (environmental
and operational tissue factors as well as marked individualsusceptibility).
Historical AspectsSir Robert Boyle did pioneering work in the field of high-altitude medicine and was the first to observe bubbleformation in vivo in one of his experimental animals duringdecompression in a hypobaric chamber
‘‘I shall add on this occasion . . . what may seem somewhat strange,what I once observed in a Viper . . . in our Exhausted Receiver,namely that it had manifestly a conspicuous Bubble moving toand fro in the waterish humour of one of its Eyes.’’
Subsequent clinical evidence of DCS in humans came fromair-pressurized mineshaft operations. M. Triger, a Frenchmining engineer, reported in 1841 pain and muscle crampsin coal miners (26). In 1854, two French physicians, B. Poland T. J. J. Watelle, gave an account of the circumstances inwhich the disease develops upon exiting the compressed airenvironment: ‘‘One pays only on leaving’’ and recognizedas well that recompression ameliorated the symptoms. Theywere the first to use the term caisson disease named forthe compressed air environment the workers were exposedto—analogous to the diving bells (caissons) (27).
In 1869, the French physician L. R. de Mericourtpublished the first comprehensive medical report on DCSin divers (27). The French physiologist Paul Bert describedin his classic treatise La pression barometrique (1878) therelationship between bubbles and symptoms of DCS duringrapid decompression (28).
The advent of balloons and aircraft with sufficientperformance to attain significant altitudes brought theclinical syndrome into the realm of aerospace medicine. In1906, H. Von Schrotter described in his book Der Sauerstoffin der Prophylaxe und Therapie der Luftdruckerkrankungenthe symptoms he experienced in a steel chamber afterascending in 15 minutes to 8,994 m (29,500 ft) closelyresembling caisson disease (29). Von Schroetter discountedthat hypothesis, but Boycott, Damant, and Haldane reviewedhis account and wrote in an article in 1908 (30):
‘‘Although he concludes that these symptoms could not have beendue to caisson disease, we think in view of the data given byDamant and ourselves, that he was probably mistaken, and thatthe risk of caisson disease at very low pressure ought to be takeninto account.’’
This is the first clear reference to altitude DCS in the literature.In 1917, Professor Yandell Henderson provided a detailedtheory in which he postulated that it would be possible to getDCS from altitude exposure (31).
J. Jongbloed described in his thesis in 1929 (32,33) theeffects of simulated altitude on human subjects and calledattention to the similarities of compressed air illness and DCSof altitude. In 1931, Barcroft et al. (34) described pain in theknees experienced in the hypobaric chamber while exercisingat altitudes of 9,160 m (30,000 ft), which in hindsight were

C H A P T E R 3 P H Y S I O L O G Y O F D E C O M P R E S S I V E S T R E S S 55
most likely manifestations of DCS. In the United States,Dr. H. Armstrong researched the effects of decreased PBon the aviator and described in 1939 bubble formation thathe experienced himself while at altitude in the hypobaricchamber (35):
‘‘. . . Then I noticed a series of small bubbles in the tendonsof my fingers . . . I was certain in my mind they representedaeroembolism..’’
In 1938, Boothby and Lovelace reported a case of transientparaplegia in a fellow physiologist (Dr. J. W. Heim) during anascent to 10,670 m (35,000 ft) while on oxygen; the paraplegiadisappeared upon repressurization to ground level. This caseillustrated the potential for serious neurologic DCS at altitudeand spurred more research (36).
The recent decades of research have introduced newmonitoring capabilities, which have allowed investigation ofthe bubble manifestation of the disease under controlledlaboratory conditions. Ultrasonic echo-imaging Dopplermeasurements as an index for gas evolution have enhancedour capability to investigate the in vivo venous gas phase. Thedegree of venous bubbles present is graded on a numericalscale referred to as a venous gas emboli (VGE) score. The firstsuch scoring system was devised by Spencer in 1976 (37); onthis 0 to 4 scale a score of 0 refers to no bubbles and a score of4 refers to an observation with numerous bubbles obscuringthe heart sounds.
The experimental work carried out in the 1970s and 1980shas shown that bubbles can be detected in the circulationof healthy individuals after decompressions without anyclinical signs of DCS (38). This confirms the early hypothesisby Behnke (1947), who postulated the existence of ‘‘silentbubbles’’ (39). The paradigm of ‘‘bubbles = DCS’’ appearsnot to be true in many, if not most cases, and recentresearch focuses on the pathophysiological cascade that canbe started by the in vivo gas phase (bubbles) in the differenttissue compartments and the dose–response relationshipsleading to clinically evident DCS manifestations. Thisexplains why the demonstration of VGE in the cardiacchambers correlates poorly with the development of DCS. Asignificant proportion of subjects do have detectable VGE,but do not develop DCS and some develop DCS withoutevident VGE (38). As more research data becomes available,there is a trend to recognize certain degree of DCS as anormal physiological response to a defined time-pressureprofile environment with the caveat of possible individualpredisposition and other factors.
TerminologyThe clinical syndrome of DCI was first recognized inthe diving/compressed air environment and later foundrecognition in the area of aerospace medicine; this explainsthe wide variety of terms used to describe the disorderand certain specific clinical manifestations. The termdecompression sickness is a direct translation from theGerman term Druckfallkrankheit, which was introduced by
Benzinger and Hornberger in 1941 (40). Currently, altitudedecompression sickness or simply decompression sickness isthe term most widely used and accepted in the aerospacemedicine literature.
Older terms include aeroembolism, aeropathy, dys-barism, high-altitude diver’s disease, high-altitude caissondisease, mechanicobaropathy, aerobullosis, and aeroarthro-sis. Decompression illness is a term that was introduced toencompass DCS and arterial gas embolism. There is also thedistinct possibility for VGE to become arterialized either bycrossing the pulmonary filter or crossing through a shuntingmechanism from right to left side of the heart (41). The termDCI should not be used synonymously with DCS to avoidconfusion in an area with already broad terminology.
The typical clinical manifestations of DCS have receivedidiomatic descriptions over time, the classical limb and jointpains are referred to as bends, a term that was used byfellow workers to describe the particular gait—‘‘doing theGrecian bend’’—of workers emerging from caisson workduring the construction of the piers of the Brooklyn Bridgein the 1870s (26). Respiratory disturbances are commonlyreferred to as the chokes, skin irritation as creeps or diversitch, and disturbances of the central nervous system (CNS)with vestibular involvement have been labeled with the termstaggers.
There are distinct and very important differencesbetween hyperbaric (diving) DCS and hypobaric (altitude)DCS, despite many shared commonalities in history,pathophysiology, and nomenclature (Table 3-4). This is avery important point as there is a tendency to indiscriminatelytransfer information and inferences from one field of researchto another, which at times may be a valid thing to do, moreoften than not though may be unwise and not justified,thereby leading to potentially erroneous conclusions.
The operational significance of DCS is different inhyperbaric versus hypobaric operations in that a diver willget DCS after mission completion (ascent to the surface fromdepth), whereas an aviator will experience DCS during hismission at altitude. Furthermore, the aviator will have thepotential to endanger others if he or she loses control of hisaircraft due to DCS, whereas the diver will likely be puttingonly himself as an individual at risk.
BUBBLE FORMATION: THEORETICCONSIDERATIONS
The physical principle responsible for bubble formationwith decreases in ambient pressure is the concept ofsupersaturation, which is based on Henry’s gas law thatstates that the amount of gas dissolved in any liquid ortissue is proportional to the partial pressure of that gas withwhich it is in contact. A good example that illustrates thephysical characteristics of Henry’s law as it applies to DCSis the opening of a bottle of carbonated beverage. Beforeopening, few, if any bubbles are visible in the liquid as the gaspressure above the liquid is in equilibrium with the liquid,

56 P H Y S I O L O G Y A N D E N V I R O N M E N T
T A B L E 3 - 4
Differences between Hypobaric (altitude) andHyperbaric (Diving) Decompressive Stress (DCS)
Relevant Differences between Altitude and Diving DCS
Altitude DCS Diving DCS
1. Decompression startsfrom ground level tissuenitrogen saturated state
2. Breathing gas is usuallyhigh in O2 to prevent hy-poxia and promote deni-trogenation
3. The time of decompressedexposure to altitude islimited
4. Premission denitrogena-tion (preoxygenation) re-duces DCS risk
5. DCS usually occurs dur-ing the mission
6. Symptoms are usuallymild and limited to jointpain
7. Recompression to groundlevel is therapeutic anduniversal
8. Tissue PN2 decreases withaltitude exposure to verylow levels
9. Metabolic gases becomeprogressively more im-portant as altitude
10. There are very few docu-mented chronic sequelae
1. Upward excursions fromsaturation diving are rare
2. Breathing gas mixtures areusually high in inert gas dueto oxygen toxicity concerns
3. The time at surface pressurefollowing decompression isnot limited
4. The concept of preoxygena-tion is generally not appli-cable
5. DCS risk is usually greatestafter mission completion
6. Neurologic symptoms arecommon
7. Therapeutic chamber re-compression is time limitedand sometimes hazardous
8. Tissue PN2 increases withhyperbaric exposure to veryhigh levels
9. Inert gases dominate
10. Chronic bone necrosis andneurologic damage havebeen documented
Pilmanis AA, Petropoulos L, Kannan N, et al. Decompression sick-ness risk model: development and validation by 150 prospective hypobaricexposures. Aviat Space Environ Med 2004;75:749–759.
on lowering the pressure above the liquid by opening thebottle, the liquid–gas system re-equilibrates to the loweredambient pressure by offgassing bubbles.
The mechanisms that are involved in the hyperbaricdiving environment as well as the hypobaric altitude en-vironment are thought to be the same in regard to DCS,although the bubble dynamics appear to be different. De-compression to altitude results in a slower release of bubblescompared to the same absolute ratio of pressure change in ahyperbaric environment (42).
The current theories of bubble formation involvetwo main mechanisms. De novo formation of bubblesalso referred to as de novo nucleation, requires very highdegrees of supersaturation and formation of bubbles frompreexisting gas nuclei (bubble nuclei), which requirespressure differentials of only fractions of an atmosphere.
The current working hypothesis for the formation ofin vivo bubbles favors the gas nuclei mechanism. Viscousadhesion, which is the mechanism by which negativepressures are generated in a liquid between moving surfaces(e.g., joints), is of sufficient magnitude to cause de novobubble formation. This mechanism has been invoked toexplain vacuum phenomena in joints, the cracking of joints,and the formation of autochthonous (in situ) bubbles in thewhite matter of the spinal cord (43). The following discussionwill highlight these mechanisms and factors influencingbubble growth.
The mechanisms and moderating factors in the humanbody tissues that lead to bubble formation/propagation,clinical symptoms of DCS, and moderating variables are stillincompletely understood.
Factors Influencing Bubble FormationBubble NucleiThe conceptual idea of the presence of ‘‘bubble nuclei’’ or‘‘bubble formation centers’’ in the tissues derives from thephysics limiting bubble growth. Very small bubbles shouldhave a propensity to dissolve and disappear due to their veryhigh surface tension. Surface tension is inversely proportionalto the bubble radius (law of LaPlace), which would raise theinternal pressure of the microbubbles above the externalabsolute pressure, thereby leading to their dissolution. Thiswould suggest that larger bubbles should not be able to existif there are no smaller bubbles that precede them, whichis an obviously wrong conclusion. If we assume that wewould need to create bubbles de novo, then experimentalevidence shows that forces of approximately 100 to 1,400ATA are needed. We know that bubble formation occurs atmuch lower pressure differentials in animals and humans(fractions of 1 ATA). Bubbles can form in fluids at lowlevels of supersaturation if forces act to pull objects apartwhich are in close proximity, a process called tribonucleation.Furthermore there is experimental evidence showing thatcompression of animals (shrimp, crabs, and rats) beforehypobaric exposure markedly decreases bubble formationand DCS (44). These observations are consistent with theexistence of gas nuclei that allow bubble formation at muchlower pressure gradients (fractions of 1 ATA). The currentunderstanding of the dynamics of bubble nuclei is thatthey are generated by motion (and possibly other factors,see section Mechanical Supersaturation in subsequent text)and that there is a dynamic equilibrium between generationand destruction of gas nuclei in the tissues (45).
SupersaturationDuring decompression from any atmospheric pressure, somequantity of inert gas in the tissues must diffuse into the blood,travel to the lungs, and leave the body in the expired airbecause the quantity of inert gas that can remain dissolvedin tissue is directly proportional to the absolute ambientpressure.
Supersaturation is defined by the following equation:
Supersaturation =∑Pg+
∑Pv−∑
Pa

C H A P T E R 3 P H Y S I O L O G Y O F D E C O M P R E S S I V E S T R E S S 57
FIGURE 3-3 Synopsis of the different mechanismsinvolved in bubble formation.
Cause
Supersaturation
a. de novo nucleation
— high pressures required (∆P ~100 atm)
b. preexisting gas nuclei
— relatively low pressures suffice (∆P = fraction of 1 atm)
— viscous adhesion → tribonucleation
(=“mechanical supersaturation”)
Mechanism Effect
Bubbleformation
Pg: sum of the tensions of all dissolved gases; Pv: sum of anyvapor pressure (e.g., water); Pa: local absolute pressure.
In summary, we can say that supersaturation can occurwhen either local absolute pressure is low or when the sumof the dissolved gases and vapor pressures is high.
During ascent, the reduction in PB creates a conditionwhereby the tissue inert gas tension (PN2 = nitrogen gaspartial pressure) is greater than the total PB. This situationis called supersaturation. Therefore, if the decompressionexceeds some critical rate for a given tissue, that tissuewill not unload the inert gas rapidly enough and willbecome supersaturated. The probability of bubble formationincreases with increasing supersaturation.
Supersaturation due to negative pressure occurs inmany mechanical processes resulting in a local reductionof absolute pressure in a liquid system. The flow of aliquid through a local narrowing in a tube, for example,results in a local drop in pressure (Bernoulli principle),which in turn can lead to transient bubble formation(Reynold’s cavitation). Sound waves are well known to causeacoustic cavitation in liquid systems. A further mechanism ofbiological interest is viscous adhesion (Figure 3-3). Viscousadhesion describes the forces generated when two surfacesin a liquid are pulled apart; the negative pressures that canbe generated can reach thousands of negative atmospheres.The amount of supersaturation that can be mechanicallygenerated by viscous adhesion is directly proportional tothe liquid viscosity and indirectly proportional to the cubeof the distances between the two surfaces. Bubbles thatare generated by this mechanism are said to be generated bytribonucleation. This mechanism is invoked in the generationof the cracking of joints by pulling apart their articularsurfaces, resulting in the generation of a vapor-filled bubble,which collapses upon release of the traction, as well as in theappearance of vacuum phenomena (gaseous cavitation) injoints under traction and in the spinal column within disks,facet joints, and vertebrae (43,45).
Critical SupersaturationApparently, a level of supersaturation is reached which thebody can tolerate without causing the inert gas to come out of
solution to form bubbles. Once the critical supersaturationratio is reached, however, bubbles develop which can lead toDCS. The English physiologist J. S. Haldane first describedthe concept of critical supersaturation in 1908 (30). Haldanewas commissioned by the British Admiralty to investigate anddevise safe decompression procedures for Royal Navy divers,and his work demonstrated that humans could be exposedto hyperbaric pressures and subsequently decompressedwithout having DCS as long as the total pressure reductionwas no greater than 50%. Haldane devised the concept oftissue half-time to define the ability of a particular tissue tosaturate/desaturate with nitrogen by 50% (i.e., a tissue wouldbe saturated 50% after the passing of one tissue half-time). Hepostulated that the body tissues with different perfusion ratescan be adequately represented by half-times of 5, 10, 20, 40,and 75 minutes (five-tissue model, constant allowable ratio).Haldane argued that the human body could hypotheticallytolerate a 2:1 decrease in ambient pressure without gettingDCS symptoms (‘‘2-to-1’’ rule). Further operational researchshowed that the Haldane diving tables consisting of Table 1for shorter dives up to 30-minute decompression time and,up to a depth of 204 ft sea water (fsw) and Table 2 forlonger dives (with bottom times >1 hour and decompressiontimes of >30 minutes) were overly conservative for Table 1and not safe enough for Table 2. Current theory isbased on variable allowed ratio for different tissues; thisis influenced by tissue nitrogen half-time, time, and �P.This is the reason why no current decompression schedulesuse Haldane’s 2-to-1 rule, but it is discussed here to showa mathematical concept. If Haldane’s 2-to−1 relationshipof allowable total pressure change is converted to a PN2
to PB relationship, the critical supersaturation ratio (R)would be:
R = PN2
PB
For example,
R = PN2 at 2ATA
PB at 1ATA[1]
R = (2)(0.79)
1= 1.58
1= 1.58

58 P H Y S I O L O G Y A N D E N V I R O N M E N T
In fact, there are apparently a number of critical supersat-uration ratios for the various mathematical compartments,representing different tissues.
A person living at sea level and breathing atmospheric airwill have a dissolved PN2 of 573 mm Hg in all body tissuesand fluids, assuming that PB equals 760 mm Hg; PAO2 equals100 mm Hg; PACO2 equals 40 mm Hg; and PAH2O equals47 mm Hg.
PB (sea level) = 760 mm Hg
= � (partial pressures of all alveolar gases)
= PH2O (47 mm Hg) + PCO2 (40 mm Hg)
+ PO2 (100 mm Hg) + PN2 (573 mm Hg)
If that person is rapidly decompressed to altitude, a state ofsupersaturation will be produced when an altitude is reachedwhere the total PB is less than 573 mm Hg, a condition thatoccurs at an altitude of 2,287 m (7,500 ft). Therefore, thealtitude threshold above which an individual living at sea levelwould encounter supersaturation upon rapid decompressionis 2,287 m (7,500 ft).
The lowest altitude where a sea-level acclimatized personmay encounter symptoms of DCS may be lower than3,962 m (13,000 ft) (46). However, recent data revealed a 5%threshold at 5,944 m (19,500 ft) (47) using a probit analysis ofmore than 120 zero-prebreathe, 4-hour exposures with mildexercise to generate an onset curve showing less than 0.001%DCS at 13,000 or below. The degree of supersaturation at5,489 m (18,000 ft) can be expressed as a ratio, as follows:
R = PN2
/PB [2]
If the tissue PN2 equals 573 mm Hg and PB equals 372 mm Hg,then R equals 573/372, or 1.54. This value approaches thecritical supersaturation ratio expressed by Haldane. Theincidence of altitude DCS reaches 50% by 7,010 m (23,000 ft)with zero prebreathe and mild exercise at altitude (47).
Symptoms can occur at much lower altitudes when‘‘flying after diving’’ or ‘‘diving at altitude and driving tohigher altitude’’ (diving in mountain lakes). Many cases ofDCS have been documented in divers who fly too soon aftersurfacing. Altitudes as low as 1,524 to 2,287 m (5,000 to7,500 ft) may be all that is necessary to induce bubbleformation in a diver who has made a safe decompression tothe surface. The problem involves the higher tissue PN2 thatexists after diving. The Undersea and Hyperbaric MedicalSociety’s recommended surface interval between diving andflying ranges from 12 to 24 hours depending on the type andfrequency of diving (48).
Factors Influencing Bubble GrowthUpon decompression to altitude, the factors causing a bubbleto grow are as follows:
1. Boyle’s law (P1V1 = P2V2) expansion due to reducedpressure
2. Entrance of nitrogen from tissues in the state of super-saturation
3. Entrance of O2 and CO2 (negligible effect duringdecompression from hyperbaric exposures, significantin hypobaric exposures)
Boyle’s Law EffectsOnce a bubble is formed, its size will increase if thetotal pressure is decreased (Boyle’s law: P1V1 = P2V2).During hyperbaric therapy, bubble size is reduced duringcompression. The surface tension of a bubble is inverselyrelated to bubble size and opposes bubble growth. Therefore,as total pressure within the bubble is increased, the surfacetension opposing bubble growth also is increased. Once acritically small bubble size is achieved, the surface tensionis so high that the bubble can no longer exist. The bubblecollapses, and its gases are dissolved (44,49).
Gaseous CompositionNitrogen, or another inert gas, is generally considered to bethe primary gas involved in symptomatic bubbles. If nitrogenwere the only gas initially present in the newly formedbubble, an immediate gradient would be established for thediffusion of other gases into the bubble. Hence, a bubble willquickly have a gaseous composition identical to the gaseouscomposition present in the surrounding tissues or fluids.When bubbles are produced upon decompression fromhyperbaric conditions, gases other than nitrogen representonly a small percentage of the total gas composition ofthe bubble. Exposure to a hypobaric environment decreasesthe partial pressures of all gases including nitrogen. Thepartial pressures of O2 and CO2 at the tissue level are closeto independent from hypobaric or hyperbaric conditionsbecause appropriate levels are a prerequisite for life. If weassume that a bubble were to be present at sea level (1 ATA)with O2 and CO2 representing 6%, respectively, of its totalvolume and pressure and we decompress to an altitude of5,487 m (18,000 ft, 1/2 ATA), then O2 and CO2 wouldeach account for 12% (together 24%) of the total volumeand pressure of the bubble. If the decompression wereinstantaneous then O2 and CO2 would each account for6% of the bubble volume, but the partial pressure would behalf of the sea level partial pressures, which would cause animmediate influx of O2 and CO2 into the bubble accountingfor 12% growth in bubble volume in this example. Thisexample (45) illustrates the importance of the metabolicgases O2 and CO2 in hypobaric exposures; at this point itis also valuable to remember the important contribution ofwater vapor to bubble formation and gas behavior in generalin a hypobaric environment (Figure 3-9B), especially as weapproach water vapor pressure (47 mm Hg) and, thereforeArmstrong’s line (zone) at 63,000 ft.
Hydrostatic PressureThe tendency for gases to leave solution and enlarge a seedbubble can be expressed by the following equation introducedby Harvey in 1944 (50):
�P = t − Pab [3]

C H A P T E R 3 P H Y S I O L O G Y O F D E C O M P R E S S I V E S T R E S S 59
where �P is the differential pressure or tendency for the gasto leave the liquid phase, t is the total tension of the gas inthe medium, and Pab is the absolute pressure (i.e., the totalPB on the body plus the hydrostatic pressure).
Within an artery at sea level, t equals 760 mm Hg. Theabsolute pressure, Pab, is 760 mm Hg plus the mean arterialblood pressure (100 mm Hg), or 860 mm Hg. Therefore,
�P = 760 mm Hg − (760 mm Hg + 100 mm Hg)
�P = −100 mm Hg [4]
When the value of �P is negative, there is no tendency towardbubble formation or growth. If the value for �P becomes zeroor positive, bubble formation or growth is likely to occur.
Within a great vein at sea level, PO2 equals 40 mm Hg,PCO2 equals 46 mm Hg, and PH2O equals 47 mm Hg; there-fore, t equals 706 mm Hg and PN2 is 573 mm Hg. Absolutepressure, Pab, is 760 mm Hg plus the mean venous pressure(which in the great veins in the chest may be 0 mm Hg).Therefore,
�P = 706 mm Hg − (760 mm Hg + 0 mm Hg)
�P = −54 mm Hg [5]
By suddenly exposing a person to an altitude of 5,490 m(18,000 ft) without time for equilibration at the new pressure,venous �P would have a large positive value:
�P = 706 mm Hg − (380 mm Hg + 0 mm Hg)
�P = +326 mm Hg [6]
The value for t in the earlier equation can also be increasedin local areas by high levels of CO2 production. Hence,in muscular exercise, a high local PCO2 associated witha reduction in PB causes higher positive values of �Pthan with a reduction in PB alone. It is important toappreciate that this is a highly localized process, unlessthe exercise is at anaerobic levels; situations of this natureare not likely to occur for more than a few minutes inthe operational aerospace environment due to the ensuingfatigue.
Hydrostatic pressure is, therefore, considered to be a forceopposing bubble formation or bubble growth and includesnot only blood pressure and cerebrospinal fluid pressure butalso local tissue pressure (turgor), which varies directly withblood flow.
Influence of Tissue Perfusion and DiffusionThe rate of inert gas washout from tissues is dependenton perfusion; therefore, factors that alter tissue perfusioninfluence inert gas washout. Studies in the hypobaricenvironment have shown that exercise before exposurereduces the risk of DCS while prebreathing oxygen (DCSincidence decreased from 90% to 20%) (51). The putativemechanism for these effects is the increase in cardiacoutput with increased peripheral circulation as well asvascular volume shifts to the chest during immersion.Negative pressure breathing has similar effects to immersionwith increases in cardiac output and increased inert
gas washout (52). Changes in body position do havesimilar influence on inert gas washout; supine positionhas similar effects to immersion compared to the erectbody position. Effects of temperature—in the context oftissue perfusion—are mediated by changes in vasculartone, as warm temperature will result in vasodilatationand enhanced inert gas washout, whereas lowering of thetemperature results in vasoconstriction and decreased inertgas washout.
Pathophysiology of BubblesThe presence of bubbles in tissues has direct and indirecteffects. The location of bubbles is important in this context;extravascular bubbles can cause local tissue distortion,dysfunction, and possibly local ischemic changes. Thepainful sensations of joint pain are thought to be relatedto compressive effects on periarticular, peripheral nervefibers. Intravascular bubbles are of lesser importance inthe context of hypobaric DCS unlike their role in divingDCS, they may—depending on their location within thevasculature and the tissue—cause symptoms due to localrelative hypoperfusion. The indirect effects of bubbles aremore complex in nature; the interaction of cells (blood,tissue, endothelium) with the bubble surface leads tothe release of mediators, which in turn may influencechemotaxis for leucocytes (polymorphonuclear neutrophils)with subsequent generation of oxygen radicals, complementactivation, activation of the intrinsic coagulation pathway,generation of arachidonic acid metabolites, release ofendothelium-derived mediators to name just a few. Themodulation of these tissue reactions depends furthermoreon the target tissues, the bubble load (dose–response), localfactors such as degree of ischemia, collateral circulation,reperfusion injury, and environmental factors, for example,hypoxia, exercise, temperature, and rapidity of ambientpressure change (44,49,53).
The putative fate of bubbles formed during decompres-sion is summarized in Figure 3-4. It is important to emphasizethat our knowledge is far from complete and that the ex-travascular bubble dynamics are of more relevance to altitudeDCS compared to the intravascular bubbles of diving DCS.
Target Organs of Bubbles Created duringDecompressive StressLungsVGE results in a dose-dependent increase of pulmonaryartery pressure and subsequent increase in pulmonaryvascular resistance (54). These changes can be attributedto mechanical obstruction of the pulmonary vascular bedand vasoconstriction; hypobaric exposures of greater than24,000 ft (7,315 m) did not result in appreciable increasesin pulmonary arterial pressures (55). In cases with largegas loads that overwhelm the capacity of the pulmonarycirculation filter, the embolization of the pulmonary vascularbed results in ventilation–perfusion mismatching leading todecreased peripheral arterial O2 saturation and decreasedend-tidal CO2 levels (56).

60 P H Y S I O L O G Y A N D E N V I R O N M E N T
Secondary effects
PMN-activation, platelet aggregation,complement activation, induction of
coagulation, release of localmediators (histamin, serotonin, TXA2,
endothelin), endothelial injury...
Bubble-tissue/bloodinteraction
— local
— distant
Pulmonarybarotrauma
Extravascularbubbles
Microvasculardamage
lymphatics
Skin Pruritus
Lungs Chokes?
Joints Pain
bone ASN?
PNS Mild sensory dysfunction?
CNS Inner ear: staggers/spinal DCS/ cerebral DCS?
edema
VGE Heart AGE
Lungs
Filtration andExhalation
(venousbubbles)
(arterialbubbles)
Otherorgans
SimpleAGE
no N2SS+N2SS
DCStype II
(bubblegrowth)
Chokes?/pulmonary
edema
CNS
AVshunts
TPP
Decompression
FIGURE 3-4 Synopsis of the putative pathophysiological pathways of bubbles in decompressionsickness (DCS), bold arrows indicate the major physiological pathway for elimination of inert gas,question marks indicate lack of scientific literature proving the postulated relationship.PMN, neutrophilic leucocytes TXA2, thromboxane A2; VGE, venous gas emboli; AV, arteriovenous;AGE, arterial gas emboli; TPP, transpulmonary passage; CNS, central nervous system; N2SS, nitrogensupersaturation; DCS type II, serious neurologic (cerebral) decompression sickness; ASN, aseptic bonenecrosis; PNS, peripheral nervous system.
In experimental animal studies, large doses of VGE canimpair cardiac output and arterial blood pressure (likely dueto right ventricular failure and decreased myocardial per-fusion). Left ventricular end-diastolic pressure is typicallynot altered. In addition to the hemodynamic effects of pul-monary VGE, there is evidence of bronchoconstriction andsubsternal discomfort as well as paroxysmal coughing andpermeability changes in the pulmonary vascular bed leadingto fluid shifts and pulmonary congestion/edema (57–59).
The lungs are a very efficient filter mechanism thatremoves VGE from the circulation. This mechanism can beoverloaded possibly resulting in spillover of venous bubblesinto the arterial circulation (transpulmonary passage ofbubbles) (55). Venous bubbles that undergo transpulmonarypassage become arterialized and hence can pose the risk ofAGE (44,49,55).
HeartMorphologic abnormalities or variations of the cardiacanatomy resulting in opportunities for shunting betweenthe right and left side of the heart [such as large atrial septaldefects (ASDs) or a patent foramen ovale (PFO)] can result
in arterialization of venous bubbles and may theoreticallyrepresent an increased risk for AGE (44,49,55).
Central Nervous SystemWhen bubbles reach the cerebral vasculature and result in anocclusion to blood flow, the vessels react with a temporaryvasoconstriction followed by a marked dilation of the down-stream microcirculation and venules. Experimental evidenceexists for transport of cerebral gas bubbles through the cap-illaries into the venous bed. This fact has been offered as anexplanation for the fact that approximately 60% of diverswith cerebral DCS recover before recompression therapy isinitiated; furthermore, this has led to the speculation thatneurologic defects following cerebral gas embolism are likelydue to secondary changes in the microvasculature (endothe-lium) as opposed to the transient obstruction to blood flowby the bubbles. Autochthonous bubble formation within thewhite matter of the spinal cord has been implicated in thepathogenesis of spinal cord DCS as well as epidural vein bub-bles and AGE. Experimental studies on cats have shown thatsevere cardiac arrhythmias and hypertension can be inducedby injection of air into the vertebral arteries. This has led to

C H A P T E R 3 P H Y S I O L O G Y O F D E C O M P R E S S I V E S T R E S S 61
the conclusion that the cardiac dysfunction in DCS may beclosely linked to cerebral embolism (53).
BloodThe interaction of blood components and endothelium withthe bubble surface results in a cascade of changes (44,60)Most of the data in this context relate to and emanatefrom diving-related DCS as opposed to altitude DCS.Thrombocyte aggregation with a low platelet count has beenreported. Neutrophils sequester in the pulmonary vascularbed with activation of the intrinsic coagulation pathway,presumably by activation of the contact system activatorHageman factor, and endothelial damage through release ofoxygen radicals. Platelets and leucocytes have been shownby electron microscopy to adhere to circulating bubbles. Inaddition, activation of the complement system takes place;its contribution to the pathophysiologic sequence in DCShowever is not clear (49,61).
Human studies in diving DCS have shown increasesin hematocrit (hemoconcentration) and decreased plateletcount in serious cases of DCS, suggesting microvasculardamage with loss of plasma volume (61,62).
Incidence DataThe incidence of altitude DCS in the altitude chambertraining environment varies among facilities and countries;European military training facilities (UK) have reportedfive cases of DCS type I (pain only) over a 5-year period(1983–1987) among 12,000 exposures to 7,622 m (25,000 ft)equal to a rate of 0.41 per 1,000 exposures (62). Dataregarding the incidence of DCS in inside observers inthe United Kingdom has not been formally reported;anecdotal evidence corroborates its existence (62,63). TheUnited States Navy (USN) reported 41 cases in 20,778exposures to 7,622 m (25,000 ft) from January 1996 toOctober 2000 (63). This equals a rate of 2 per 1,000 exposures;inside observers experienced a rate of 0.18% and trainees0.21%. The experience of U.S. Army for the years 1984 to1989 was 42 cases of DCS in 21,498 exposures (0.195 per1,000 exposures; inside observer to student rate ratio was3.17) (64). The USAF reported for 1985 to 1987 (exposuresto 7,622 m (25,000 ft) 34 cases among 80,048 exposures,which translates into an incidence rate of 0.042% (0.4 per1,000 exposures) (65).
The flight incidence for the USAF during the period 1980to 1990 was 49 DCS incidents, which translates to a DCSmishap rate of approximately 0.2 to 0.3 per 100,000 flyinghours (66).
For a discussion regarding EVA risk in space operationssee Chapter 10.
From the operational perspective of the aviator, DCSdoes not pose a significant risk for any single mission inview of the above numbers; it is a rare event and veryserious outcomes (death, disability) are exceptionally rare(one fatality in aviation since 1959) (67). In the past,the threat to the aviator was the reporting process itselfbecause the fact that DCS was experienced did result in
grounding of a capable operator. This aspect probablydid introduce reporting bias into the reported incidencefigures (operational underreporting). To reduce a possiblesource of reporting bias, negative consequences of reportingshould be avoided and detailed education on the possiblesigns and symptoms of DCS should be given to aircrew(recognition of a symptom is based on the knowledge ofa symptom). Reporting of DCS symptoms has becomea physiologic incident without punitive ramifications forthe flying career of the aviator and as a result datafrom extreme altitude operation environments (e.g., U2surveillance aircraft) started to emerge (68). A similarsituation in the operational environment was encounteredwith G-induced loss of consciousness (G-LOC). Therewas no obvious G-LOC problem apparent among militaryaviators until a targeted survey, without penalty for reportingincidents, was done and only then the real incidence ofG-LOC emerged.
Factors Thought to Affect DecompressiveSicknessAttempts have been made to correlate the incidence ofboth diving-induced and altitude-induced DCS with variousenvironmental and physiological factors. A review of theexisting data documenting the presence or absence ofassociation of these factors with altitude DCS is summarizedin the next sections.
Altitude AttainedWith increasing altitude, the incidence of DCS increases, asdoes the ratio of severe to mild cases. The severity of the caseswill increase with increasing altitude (47,69).
In a review of 145 cases of altitude-induced DCSnecessitating treatment, Davis et al. (70) reported that 13%of these cases occurred with altitude exposures of 7,622 m(25,000 ft) or below and 79% occurred with exposures of9,146 m (30,000 ft) or greater.
Duration of ExposureAt all altitudes above 5,488 m (18,000 ft), the longerthe duration of exposure, the greater the incidence withDCS occurring after 5 hours of exposure to 25,000and 27,500 ft even after 1 hour of prebreathes. Somesubjects, however, will not develop DCS at a given altitude(individual susceptibility), even after extended periods oftime (71).
Combination of Environmental Factors to PredictDecompression Sickness RiskPilmanis et al. (72) developed an Altitude Decompres-sion Sickness Risk Assessment Computer (ADRAC) modelthat uses altitude, time at altitude, level of activity, andpreoxygenation time for various time, exposure, and preoxy-genation scenarios (Figures 3-5A, 3-5B & 3-6).
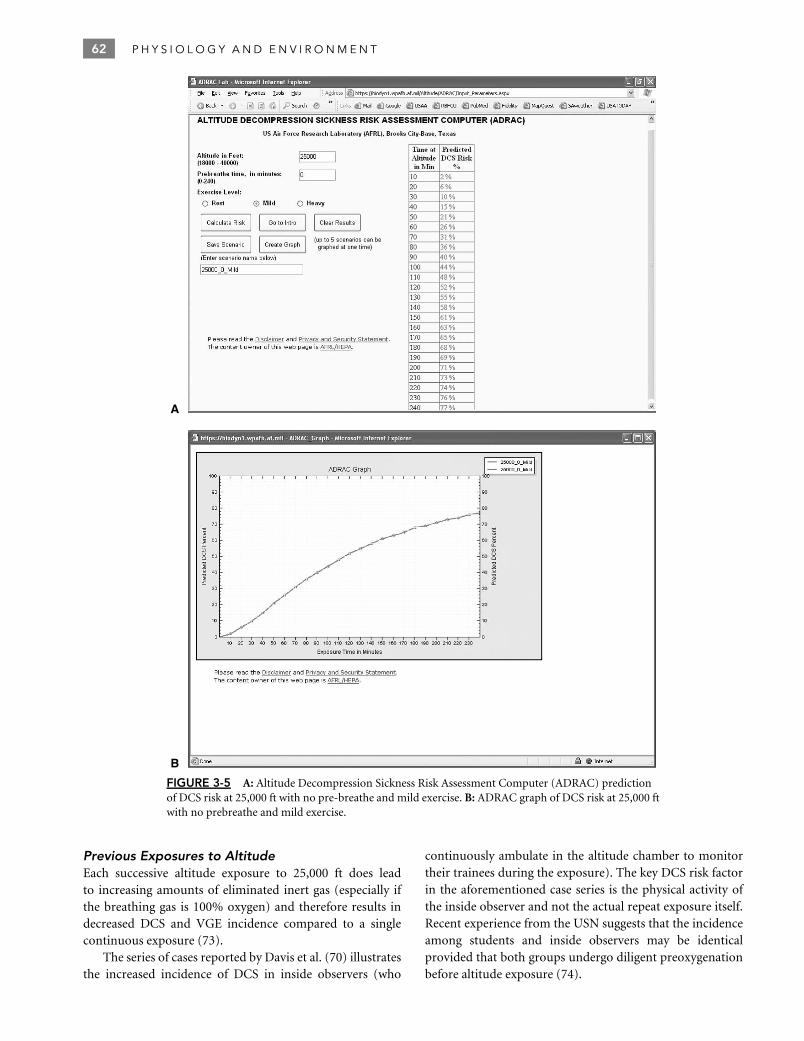
62 P H Y S I O L O G Y A N D E N V I R O N M E N T
A
B
FIGURE 3-5 A: Altitude Decompression Sickness Risk Assessment Computer (ADRAC) predictionof DCS risk at 25,000 ft with no pre-breathe and mild exercise. B: ADRAC graph of DCS risk at 25,000 ftwith no prebreathe and mild exercise.
Previous Exposures to AltitudeEach successive altitude exposure to 25,000 ft does leadto increasing amounts of eliminated inert gas (especially ifthe breathing gas is 100% oxygen) and therefore results indecreased DCS and VGE incidence compared to a singlecontinuous exposure (73).
The series of cases reported by Davis et al. (70) illustratesthe increased incidence of DCS in inside observers (who
continuously ambulate in the altitude chamber to monitortheir trainees during the exposure). The key DCS risk factorin the aforementioned case series is the physical activity ofthe inside observer and not the actual repeat exposure itself.Recent experience from the USN suggests that the incidenceamong students and inside observers may be identicalprovided that both groups undergo diligent preoxygenationbefore altitude exposure (74).

C H A P T E R 3 P H Y S I O L O G Y O F D E C O M P R E S S I V E S T R E S S 63
FIGURE 3-6 Zero-preoxygenation altitudethreshold curves for decompressive sickness(DCS) and venous gas emboli (VGE).
1009080706050
Inci
denc
e (%
)
40302010
11,000 13,000 15,000 17,000
Altitude (thousands of ft)
19,000 21,000
DCS
VGE
23,000 25,0000
Flying Following DivingIf an individual breathes a gas at pressures greater thansea level before altitude exposure, his/her susceptibility toDCS will significantly increase. Retrospective case reviewsas well as prospective animal and human investigationshave resulted in a number of recommendations by variousagencies as to the sea level surface interval necessary to safelyfly after diving. Recent studies by Pollock et al. showed noapparent increase in DCS risk after dry resting 60 fsw/60 minair dives followed at least 12 hours later by a resting 25,000 ft3-hour flight while on 100% oxygen (75). The Underseaand Hyperbaric Medical Society reviewed this material andrecommended the following (48):Dive Schedule Minimum Surface Interval
1. No-decompression divesa. Less than 2 hours accumulated dive time in the
48 hours preceding surfacing from the last dive wait12 hours
b. Multiday, unlimited diving wait 24 hours2. Dives requiring decompression stops (but not including
saturation dives) wait 24 to 48 hours
Saturation diving presents complex problems and is beyondthe scope of this chapter. The interested reader is referredto the specialized literature on the subject (see list ofRecommended Reading in reference section).
AgeRecent work (47) showed increased DCS risk with age inmales and decreased DCS risk with age in females, with allsubjects showing no difference due to the opposite effectsof age based on gender. Height had no effect. Factors thatdid correlate with increased risk included higher body massindex and lower physical fitness.
GenderRetrospective studies indicated initially that the incidenceof DCS in female subjects is significantly higher thanin males (70,76,77). Prospective studies have not re-vealed any significant differences between male and fe-male for DCS symptoms (47,78). Of note, women usinghormonal contraception showed significantly higher DCSsusceptibility compared to those not using hormonal con-traception during the latter 2 weeks of the menstrualcycle (47).
ExerciseThe association between physical exertion at altitude andDCS has been well established. During World War II, altitudechambers were used to select out bends-prone individualsfrom aircrews. The subjects were taken to an altitude of12,195 m (40,000 ft) and exercised at altitude until halfof them developed bends. The remaining bends-resistantsubjects were assigned to high-altitude, unpressurizedbomber missions. The effect of exercise on the incidenceof DCS is equivalent to increasing the exposure altitude 915to 1,524 m (3,000 to 5,000 ft). Recent studies on the effect ofmild versus strenuous exercise at 10,671 m (35,000 ft) haveshown that both significantly increase DCS incidence (79).
Exercise during oxygen prebreathe has been shownto significantly decrease DCS risk by increasing inert gaswashout (increased perfusion) (51,80–82). The method hasbeen used successfully to provide additional protectionfor high-altitude reconnaissance pilots (83) and duringpreparation for EVA from the ISS (84).
InjuryNo convincing evidence exists to associate previous injurywith DCS. On the basis of theoretic considerations, however,it is thought that during the acute stages of injury a jointmay have increased susceptibility to DCS pain because ofperfusion changes associated with the injury and/or healingmechanisms.
Body BuildFor a long time, a basic tenet of diving and aerospacemedicine has been that obesity increases the susceptibility toDCS; data from work from the United States Air Force Schoolof Aerospace Medicine (USAFSAM) tended to confirm thesehistoric tenets showing an increased DCS risk with increasedbody mass index (47,85).
Other FactorsTemperatureNo good correlation exists between the frequency of DCSand the ambient temperature, with the exception of workdone by Balldin in the context of warm water immersion andits effects on increased nitrogen washout (52).
HypoxiaThere is significant overlap between the symptoms of DCSand hypoxia. Hence, careful distinction between the two

64 P H Y S I O L O G Y A N D E N V I R O N M E N T
entities needs to be made. There is anecdotal evidencesuggesting an association of hypoxia and DCS (86). Thefew published studies suggest no effect of hypoxia (87–89).
Acid–Base BalanceElevated PCO2 has been associated with the incidenceof severe DCS in several studies (39,90,91). Deliberatehyperventilation at altitude has been found to decrease thepain associated with DCS. The question arises as to whetherthe contribution of elevated PCO2 affects bubble growth orprimary modulation of pain perception by altered acid–basebalance.
DehydrationIndividuals with an overall high average daily fluid intakewere found to be less susceptible to DCS than a comparablegroup of individuals with a restricted fluid intake over2 weeks. These findings were corroborated in three separatestudies (92–94).
Effects of MicrogravityUnder microgravity conditions, fluid shifts (increase incentral blood volume) occur, which may have an effecton pulmonary perfusion and modify nitrogen washoutdynamics from tissues. Static unloading may producefewer bubble nuclei. These effects constitute physiologicalinference without controlled studies under microgravity tocorroborate them at this point. To date, there has not beena confirmed DCS event during EVA in the United Statesand international space programs. Further information willaccrue from the medical investigation programs on theISS. The effect of ambulatory (walking during exposure)versus nonambulatory exposures with the same metaboliccost of activity while decompressed yielded no differencein DCS risk (95), or in total joint pain DCS (96). Thesepapers concluded that walking under 1-G conditions duringexposure would not produce DCS levels higher than duringsupine exposures emulating weightlessness. However, thedistribution of joint pain was different with the upperbody developing more DCS than the lower body duringnonambulatory exposures with the reverse true duringambulatory exposures (96).
Patent Foramen OvaleThis is an area of current investigation and controversy dueto its potential impact on selection of personnel for work inenvironments that may put the individual at risk for DCS.Hypothetically, a PFO could allow arterialization of venousgas bubbles by transforaminal passage of bubbles from theright atrium to the left atrium and make them a possible riskfactor for cerebral DCS/AGE (97).
Longitudinal data to define the risks in hyper- orhypobaric environments are not available in the literature.A meta-analysis of the relationship between DCS and PFOin diving showed a risk ratio of 2.52 for PFO, with anincidence of 5.7 cases of type II DCS per 10,000 dives (98).Clinically silent cerebral lesions [magnetic resonance imaging
(MRI), T2 weighted images] in divers with hemodynamicallysignificant PFO have been described (99); the clinicalsignificance of this finding is unclear at this point intime.
The data in the altitude DCS setting are sparse at thispoint; a clear relationship between altitude DCS and PFOhas yet to be firmly established. No link between PFO andDCS (41) was found in the six cases of left ventricular gasemboli (LVGE) observed throughout 1,075 subject exposureswhere echo-imaging of the right and left heart was used.Of the five subjects with LVGE who were evaluated forPFO, three were negative by transthoracic echocardiography(TTE) or transesophageal contrast echocardiography (TEE),one was positive for PFO by TEE, and one displayed asinus venosus by TEE. It is important to keep in mind thata significant proportion of asymptomatic, healthy adultsdo have a PFO (prevalence 27.3%) (100). The publishedliterature does not allow the conclusion that subjects shouldbe disqualified from hypobaric duties based on the presenceof a PFO alone. The presence of a history of events suggestiveof a right to left shunt should trigger further appropriatetesting as clinically indicated.
Miscellaneous FactorsLower physical fitness was shown to be related to increasedDCS risk (47,85) in both females and males (p <0.05);the least fit (lowest third of VO2) 254 versus the most fit(highest third VO2) 254 subjects whose VO2 were evaluated.A later analysis with a larger sample size showed a significantrelationship between lower physical fitness and increasedsusceptibility to DCS (p <004).
Preventive MeasuresProtection against DCS is based on controlling the tissuenitrogen-to-ambient pressure ratio (PN2/PB). When an inertgas, such as nitrogen, is breathed, the tension of the gasdissolved in tissue fluids increases until equilibrium with thepartial pressure of the gas in the respired medium is reached.With pressure reduction (decompression), supersaturationcan occur. Some degree of supersaturation can be tolerated.The critical PN2/PB ratio differs for each body tissue. Whenthe safe limits of decompression are exceeded, gas separatesfrom solution in the blood and other tissues. This process isthe initiating event for DCS, although there is considerablevariability between and among individuals as to whether ornot DCS results from any event causing bubble formation.For diving, safe decompression limits vary with time and thedepth of the dive and are published as decompression tablesin a variety of diving manuals, one of which is the USNDiving Manual (101).
The aviator is protected from DCS in two ways,aircraft pressurization and denitrogenation (102). Aircraftpressurization is a method of maintaining the aircraft cabinpressure and, therefore, the physiologic altitude to which theaviator is exposed, at a considerably lower PA than the actualaltitude at which the aircraft is flying. With adequate aircraft

C H A P T E R 3 P H Y S I O L O G Y O F D E C O M P R E S S I V E S T R E S S 65
pressurization, the individual is not exposed to reduced PB
where bubbles can form.Denitrogenation is a method by which one breathes
100% O2 for the purpose of eliminating N2 from the bodybefore going to altitude. This method is used to protectthe individual who must ascend to high altitudes that canproduce DCS. With 100% O2 breathing, O2 replaces othertissue-dissolved gases, including N2. Therefore, the amountof N2 in each body tissue is reduced before ambient pressurereduction occurs. The PN2/PB ratio is reduced, because thevalue for PN2 is reduced, thereby decreasing the risk.
For example, an aviator rapidly ascends from sealevel (PB = 760 mm Hg) to 5,488 m (18,000 ft) (PB =380 mm Hg). The aircraft pressurization system maintainspressure in the cabin at 2,439 m (8,000 ft) (PB = 565 mm Hg).Assuming that all tissues are saturated at sea level (PN2 =573 mm Hg) and that offgassing occurring during the rapidascent is insignificant, the PN2/PB ratio would be 1.01:
PN2
PB= 573 mm Hg
565 mm Hg= 1.01 [7]
If the aircraft were not pressurized the PN2/PB ratio wouldbe 1.51:
PN2
PB= 573 mm Hg
380 mm Hg= 1.51 [8]
If unpressurized flight occurred to 9,140 m (30,000 ft)(PB = 226 mm Hg) the PN2/PB ratio would be 2.54:
PN2
PB= 573 mm Hg
226 mm Hg= 2.54 [9]
If before unpressurized flight to 9,146 m (30,000 ft) theaviator had denitrogenated at sea level for a long period oftime such that one half of the total N2 was eliminated fromhis body, the PN2/PB ratio would be 1.27:
PN2
PB= 287 mm Hg
226 mm Hg= 1.27 [10]
The process of denitrogenation is very effective in eliminatingN2 from the body. When 100% O2 is breathed usinga tightly fitted mask, an alveolar N2 pressure of nearlyzero is established and a marked pressure differential(∼573 mm Hg) between the alveoli and body tissues results.N2 rapidly diffuses from the tissues into the blood, where itis transported to the lung and is exhaled. The amount of N2
eliminated depends on time and tissue perfusion.Figure 3-7 shows the total amount of N2 washed out
of the body by denitrogenation. Assuming that the averageperson contains 1,200 cm3 of dissolved N2, slightly morethan 350 cm3 can be eliminated by prebreathing 100% O2
for 30 minutes. Denitrogenation before initiating ascent toaltitude significantly reduces the incidence of altitude DCSas does the operational use of inflight denitrogenation with100% O2 at or below 4,878 m (16,000 ft) (103). Once begun,denitrogenation should ideally not be interrupted althoughrecent evidence indicates that breaks in prebreathe, up to 60minutes in the middle of a 1-hour prebreathe, may not resultin increased DCS risk (104).
0100
200
300
400500600
800
Nitr
ogen
elim
inat
ion
(mL)
1,0001,200
30 60 90 120Minutes
Decompression sickness
150 180 210 240
FIGURE 3-7 Denitrogenation curve while breathing 100% oxy-gen.
Denitrogenation eliminates nitrogen from various tissuesat different rates. These rates are dependent on the solubilityof nitrogen in specific tissues but, more importantly, also onthe circulatory perfusion of the tissues. Therefore, all body tis-sues come into equilibrium with each other and with respiredgas at different times. As a practical matter, then, with altitudeexposure (pressure reduction), the PN2/PB ratio of certaintissues may exceed the critical value for bubble formation,whereas the PN2/PB ratio of other tissues remains within a saferange. This fact may partially explain why signs and symp-toms of DCS occur at characteristic locations in the body.
MANIFESTATIONS OF DECOMPRESSIONSICKNESS
In DCS, bubbles can form in all parts of the body.Various target organs, however, seem to be affected mostreadily, and the effects on these anatomic locations accountfor the signs and symptoms seen. In this section, theclinical manifestations of bubble formation and the classicsyndromes of DCS will be described.
ClassificationDCS symptoms have been categorized as type I (pain only)and type II (serious) since introduction of the nomenclaturein 1960 by Golding et al. (105). This categorization wascreated to separate the symptoms into groups based on theirresponse to treatment during or after decompression fromcaisson work on the Dartford Tunnel in England. This systemwas somewhat analogous to the four-table treatment scenar-ios used at that time by the USN as described by Donnell andNorton (106). The four hyperbaric Treatment Tables (I–IV;I-A, and II-A without oxygen available) involved treating in-creasing symptom severity with more aggressive hyperbaricprofiles. The Golding classification in type I and type II DCShas significant clinical shortcomings in the context of hypo-baric DCS. Type I and type II DCS do not represent mutuallyexclusive categories; therefore, it is possible that a subjectmay have features of both concomitantly. Furthermore thestatic classification does not take into account that DCS is a

66 P H Y S I O L O G Y A N D E N V I R O N M E N T
dynamic process, therefore, a patient may transition from atype I DCS class to a type II DCS over time.
The dynamic nature of the condition should be docu-mented by repeat assessments of the clinical examination(especially neurologic examination), response to treatment,progression, relapse of symptoms, time to onset of symp-toms (latency), time to start of recompression therapy, aswell as results of any investigations. The adherence to DCSexamination/assessment checklists may prove valuable tomaximize reproducibility of data collection and subsequentanalysis.
The USN uses the type I and type II categories of DCS forthe Master Diver to determine treatment of diving DCS. TheMaster Diver provides hyperbaric oxygen (HBO) treatmentas needed for USN divers in the absence of a physician on-site(a telephone consultation with the diving physician is partof the process), creating a need for clear guidelines regardingtreatment. USAF physicians determine treatment for altitudeDCS based on the symptoms and their severity. An accuratedescription of a case of altitude DCS involves stating thedynamic evolution of each symptom (107) (Table 3-5).
• Spontaneously resolving• Static• Relapsing• Progressive
Each symptom should be stated with the time intervalfrom its onset to the commencement of treatment. Progres-sive, limb-pain DCS occurring 1 hour before commencementof treatment would provide essential information in deter-mining treatment, unlike ‘‘type I DCS.’’ The timeline ofany relapsing or progressive symptoms should be furtherdescribed to include an indication of change and level ofintensity. In addition, the response to recompression shouldbe indicated (complete recovery, incomplete recovery, ornone) to guide any further treatment options. The carefuldocumentation of pertinent results of any investigations andtests and their respective timing is also of importance toallow for additional parameters for decision making in thecontext of treatment (Table 3-6).
Decompression Sickness PainAltitude DCS pain is seen in 65% to 80% of the cases ofaltitude-induced DCS (108–110). It tends to be localizedin and around the large joints of the body. Sometimessmaller joints, such as interphalangeal areas, may be affected,particularly if these joints underwent significant activemotion during altitude exposure.
DCS pain is deep and aching in character and rangesfrom very mild (joint awareness) to so severe that the patientdoes not wish to move the affected joint. Active and passivemovement of the joint tends to aggravate the discomfort,
T A B L E 3 - 5
Decompressive Stress—Classification and Clinical Consideration
Key Clinical Descriptors Affected Organ/Tissue Signs and Symptoms
Evolution of symptoms: spontaneousresolution/static/relapsing/progressive
Joints, pain only Mild discomfort at the beginning (ache, ‘‘niggles’’),progressing to severe, dull, deep, throbbing pain; nosingle, tender points; relieved by external compression
Response to therapeutic interventions:Pressure/oxygen
Meticulous documentation of timeline
Vital signs: heart rate, respiratory rate, degreeof pain, measure of oxygenation
Cutaneous andlymphaticmanifestations
Transient pruritus (especially trunk, ears, wrists, hands)colloquially known as creeps, possibly associated with ascarlatiniform rash; truncal peau d’orange,
Cutis marmorata: marbled/mottled skin lesions [confluentrings of pallor surrounded by cyanosis (blanches to touch)]
Cardiovascular Circulatory collapse after preceding severe bends, chokes, orother neurologic symptoms
Rhythm disturbances (e.g., first degreeAV-block)Pulmonary (‘‘chokes’’) 1. Substernal pain (worse with inspiration)
2. Dyspnea (with or without cyanosis)3. Dry, nonproductive cough (paroxysms after deep inspi-
ration)
Careful neurologic examination so as to avoidsubtle progressive signs
Neurologic: cerebrumand cranial nerves
Altered mental status (impaired memory, judgment,aphasias), frank delirium, fatigue, visual disturbances(sctomas, diplopia, blurred vision), personality changes,loss of consciousness, headache; vertigo, nausea, vomitus,tinnitus
Cerebellum Abnormal Romberg test, abnormal gaitSpinal cord Sensory/motor deficits, abnormal tendon-reflexes, frank
paralysis/paresisVestibular (‘‘staggers’’) Vertigo, nausea, vomiting, occasional nystagmus
(Francis J. The classification of decompression illness. Hypobaric Decompression Sickness. San Antonio, Brooks Air Force Base, Texas: AerospaceMedical Association and Undersea & Hyperbaric Medicine Society, 1990. Published June 1992; the table is not part of the old reference, rather a summarytable and created by the author (Stepanek).)

C H A P T E R 3 P H Y S I O L O G Y O F D E C O M P R E S S I V E S T R E S S 67
T A B L E 3 - 6
Management of Altitude Decompression Sickness
Carefully Assess DCS Symptoms
1. Joint pain or skin symptoms only; A–D; not, 2A. Symptoms present in <2 hr?
Surface level oxygenWorsen or fail to improve?
Treatment Table 5Worsen or fail to improve?
Treatment Table 6Worsen or fail to improve?
Consider extensions and tailing divesuntil resolution or until symptomsplateau
B. Symptoms present in 2 to 6 hr?Treatment Table 5
Worsen or fail to improve?Treatment Table 6
Worsen or fail to improve?Consider extensions and tailing dives
until resolution or until symptoms plateauC. Symptoms present >6 hr?
Treatment Table 6Worsen or fail to improve?
Consider extensions and tailing dives untilresolution or until symptoms plateau
D. Symptoms present >36 hr?Reconsider diagnosis of DCS
2. Neurologic, pulmonary, or cardiac symptomsTreatment Table 6
Worsen or fail to improve?Consider extensions or Treatment Table 6A and tailing
dives until resolve or symptoms plateau
Courtesy of Hyperbaric Medicine Group at Brooks City Base, SanAntonio, TX.
whereas local pressure, such as with an inflated blood pressurecuff, tends to relieve the pain temporarily, although otherinvestigators (111) found the technique to be unreliable.
The pain may occur during the altitude exposure, ondescent, shortly after descent, or, in rare cases, only becomemanifest many hours after descent. In nearly all cases, DCSpain occurring at altitude will be relieved by descent becauseof the increase in PB. In rare cases, DCS pain relieved byreturning to ground level will recur at ground level. In thesecases, as well as those cases where pain is not relieved bydescent, HBO therapy is the definitive form of treatment.It is important not to treat DCS pain with analgesics as itsdisappearance may serve as an indicator of the success ofhyperbaric therapy.
Thoracoabdominal pain should not be classified as simpleDCS pain, but rather as neurologic DCS likely due to spinalchord involvement and treated appropriately (112).
ChokesThe syndrome called chokes is rare in both diving andaviation, accounting for less than 4% of DCS cases (108,110)
during research exposures. However, this condition maybe a life-threatening disorder. The mechanism of chokes ismultiple pulmonary gas emboli. The characteristic clinicalpicture consists of the triad of substernal chest pain, dyspnea,and a dry nonproductive cough, although only three casesof chokes with the full triad were found during a review of2,525 exposures with 1,030 cases of DCS and 29 cases ofchokes (108). Rudge has reviewed the USAF experience from1966 to 1994 and found that the single most consistentlypresent clinical sign in their series of 15 patients wassubsternal pain (113). In most cases, the pain is madeworse on inhalation. Patients with chokes feel generally andseverely ill. Altitude-induced chokes will invariably progressto collapse of the individual if the altitude is maintained. Theaviator with chokes may need hyperbaric chamber therapy,although some may resolve during descent before or duringground level oxygen therapy (108).
Neurologic Decompression SicknessNeurologic DCS presents a clinical picture with signs andsymptoms referable to the nervous system. It has becomeapparent that one should probably limit the term neurologicDCS to those cases in which there is involvement of theCNS. Peripheral nerve involvement with mild paresthesia iscommonly associated with altitude DCS and does not appearto increase the gravity of the disorder from a prognosticpoint of view unless it presents in a dermatomal pattern. CNSinvolvement, however, can herald significant and permanentneurologic deficits, particularly if aggressive and propertreatment is not instituted promptly.
CNS involvement occurs in 4% of cases of altitudeDCS (109). It presents in one of two forms—spinal cord formor brain form. The spinal cord form is seen almost exclusivelyfollowing diving and is extremely rare following altitudeexposure. The brain form of the disorder is more commonlyseen following altitude exposure and is uncommon but notrare following diving exposure. The reasons for the variancein the incidence of brain and spinal cord neurologic DCS indiving and altitude exposure have not been elucidated yet.The clinical manifestations of the two forms of this disorderwill be discussed separately.
Spinal Cord Decompression SicknessIn many cases, the first symptom of spinal cord DCS is theinsidious onset of numbness or paresthesia of the feet. Thesensory deficit spreads upward, accompanied by an ascendingweakness or paralysis to the level of the spinal lesion. Othercases begin with girdling abdominal or thoracic pain, whichprecedes the onset of sensory and motor deficits. Within 30minutes of onset, the entire clinical picture of a partial orcomplete transverse spinal cord lesion may manifest.
The culprit lesions in spinal cord DCS have been welldocumented as bubbles formed in or embolized to theparaspinal venous plexus. Poorly collateralized segmentalvenous drainage of the spinal cord and normally sluggishblood flow through the paraspinal venous plexus can resultquickly in mechanical blockage of venous drainage bybubbles and solid elements formed at the blood–bubble

68 P H Y S I O L O G Y A N D E N V I R O N M E N T
interface. This blockage, in turn, results in a congestive, or‘‘red,’’ infarct of the spinal cord (50). This is extremely rarein altitude DCS and may be found more frequently in divingDCS cases.
Brain Form of Decompression SicknessIn most cases, the clinical picture of a patient having thebrain form of DCS is one of spotty sensory and motorsigns and symptoms not attributable to a single brain locus.Headache, at times of a migrainous nature, is commonlypresent. Visual disturbances, consisting of scotomas, tunnelvision, diplopia, or blurring, are common. At times, extremefatigue or personality changes that range from emotionallability to a significantly flattened affect are the presentingsymptoms.
For the physician not acquainted with the clinicalpicture of multiple brain lesions, the diagnosis can be verydifficult. A number of these patients have been misdiagnosedas hysterical and have progressed to vasomotor collapsebecause proper and immediate definitive treatment was notrendered.
Circulatory ManifestationsGenerally, circulatory impairment is manifested as shockfollowing the development of chokes or severe neuro-logic impairment (secondary collapse). Circulatory collapsewithout other symptoms preceding the development ofshock (primary collapse) occurs rarely. The so-called post-decompression collapse following altitude exposure, with theshock state occurring after descent to the ground level, hasbeen described as a separate type of circulatory impairment.It probably is not separate but rather represents delay inonset as sometimes seen with other types of altitude DCS.
Possible mechanisms of circulatory collapse includedirect involvement of the vasomotor regulatory centeror massive blood vessel endothelial damage by bubbles,with a subsequent loss of intravascular volume. Extremehemoconcentration has been documented in many cases,with hematocrits up to 70% (61).
Circulatory collapse is marked by its lack of response tofluid replacement, which is similar to the lack of responsecommonly seen in cases of severe head injury that results ina central sympathectomy.
Cutaneous Signs and SymptomsSkin symptoms may present as pruritus or formication only(‘‘creeps’’). It is important to keep in mind that some of theseskin DCS manifestations may also be mediated by involve-ment of peripheral nervous system elements. The sensationgenerally passes within 20 to 30 minutes, and no treatmentis necessary. A transient scarlatiniform skin rash may occur.Skin symptoms, however, may present with the appearanceof mottled or marbled skin lesions; this condition is alsoreferred to as cutis marmorata. This condition does not ap-pear to carry excess risk for neurocirculatory compromise inhypobaric DCS (114)—in contrast to diving DCS, where it isa clear warning sign of more serious DCS—as was previously
hypothesized (71). Therapy depends on the circumstances,in case of cutis marmorata in the setting of diving a full USN-Treatment Table 6 would be warranted, in the setting ofhypobaric exposure an immediate USN-Treatment Table 5may be appropriate depending on how rapidly the conditionresolves following repressurization to ground level. Cutismarmorata associated with diving must alert the treatingphysician to the potential imminent development of moreserious DCS manifestations and should be treated analogousto type II DCS (102).
Pitting edema, if seen alone, is considered a minormanifestation of DCS in that it will resolve spontaneouslywithout sequelae. Pitting edema is thought to arise fromlymphatic blockage by bubbles. It rarely results from altitudeexposure. Localized pain in lymph nodes may occur as welland recompression typically provides prompt pain relief.
Constitutional Signs and SymptomsFollowing decompressions to altitude, mild, transient fatigueis frequently encountered in the operational as well asresearch setting in subjects and chamber attendants. Thissymptom is usually ignored, although it may be accompaniedby distinct malaise and lack of appetite. The significanceand etiology of this fatigue has not been thoroughlyinvestigated, but it may represent mild impairment ofmental and nervous function. Severe exhaustion should alertthe clinician; this may be an indicator of concomitant orimpending more severe DCS and should prompt a detailedphysical examination to avoid missing other subtle signs andsymptoms (112).
Chronic EffectsAseptic bone necrosis is a debilitating condition, commonamong divers and caisson workers. It has been described inmerely one well-documented case following altitude expo-sure (115,116). The evidence to link aseptic bone necrosiswith altitude DCS is anecdotal at best. From the diving lit-erature we know that areas of bone infarction, if located injuxta-articular locations, rapidly lead to erosion of overlyingcartilage and severe osteoarthritis. The shoulders, knees, andhips are the only joints affected. Early lesions are asymp-tomatic and are only found on radiographic surveys. Theexact relationship between aseptic bone necrosis and episodesof DCS is unknown. The disease is seen when compressed airexposure occurs on a regular and frequent basis and is seldomseen in less than 1 year after beginning such exposures.
DIAGNOSIS AND MANAGEMENTOF DECOMPRESSION SICKNESS
DCS rarely occurs unless one of the following conditionsexists:
1. Exposure to altitudes greater than 5,488 m (18,000 ft)2. Exposure to altitude shortly following exposure to com-
pressed gas breathing [e.g., self-contained underwater

C H A P T E R 3 P H Y S I O L O G Y O F D E C O M P R E S S I V E S T R E S S 69
breathing apparatus (scuba) diving or hyperbaric chamberexposure]. DCS has occurred while flying in pressur-ized aircraft at a cabin altitude as low as 1,372 m(4,500 ft) following scuba diving in the preceding3 hours
The following procedures are highly recommended in allcases of DCS (including DCS pain only) persisting after adive or after a flight:
1. Administer 100% O2 using a well-fitted aviator’s mask oranesthesia mask.
2. If a hyperbaric chamber is on-site, the patient should beimmediately treated according to the proper TreatmentTable.
3. If there is no on-site hyperbaric chamber, arrangementsshould be made to immediately transport the patient tothe nearest hyperbaric facility capable of administeringproper treatment. The patient should be kept on 100%O2 by mask while awaiting and during transportationto the chamber. If the patient has DCS pain only, thesymptoms of which clear completely without recurrencewithin 2 hours postexposure while awaiting transport, thetransport to the hyperbaric chamber can be cancelled. Ifthe symptoms occur outside of the 2-hour time windowpostexposure, then a hyperbaric therapy (TreatmentTable 6) is advisable.
4. If DCS pain is relieved while awaiting transport butrecurs, the patient should be transported to the hyperbaricchamber and treated even if symptoms are relieved againafter recurrence.
5. Any patient with signs or symptoms of persisting neu-rologic DCS, chokes, or circulatory collapse should beimmediately transported to the nearest hyperbaric cham-ber for treatment, regardless of whether the symptomspersist.
6. Transportation must be at or near the ground level PB
of the site at which the patient embarks. Aircraft usedfor the movement of these patients must possess thispressurization capability. In no case should the cabin PAbe more than 305 m (1,000 ft) higher than the PA at thepoint of embarkation. If at all possible, it is best to avoidmoving patients to a hyperbaric chamber located at a PAgreater than 1,067 m (3,500 ft) higher than the point ofembarkation.
7. Personnel tending to the patient during transportand during recompression therapy should be able toprovide advanced cardiac life support (ACLS). It iscrucial for the inside attendants to rigorously complywith recommended decompression stops and oxygenbreathing at depth to avoid excess nitrogen onloadingduring hyperbaric therapy with the attendant risk ofDCS upon decompression from the respective TreatmentTable.
8. Return to flying no earlier than 72 hours after resolution ofpain-only DCS or complete resolution of any neurologicsigns/symptoms.
HYPERBARIC THERAPYFOR DECOMPRESSION SICKNESS
Physiologic Basis of Hyperbaric TherapyHyperbaric therapy is achieved by applying physical factorsrelated to the pressure environment. The elevation of thepartial pressure of inspired gases (O2 with hyperbaricO2 therapy) and the subsequent increase in the amountof the various gases that enter into physical solution inbody fluids (washout dynamics) are of key importance.The use of hyperbaric O2 therapy for treating DCS resultshypothetically in some bubble size reduction, a positivenitrogen gradient to reduce the size of bubbles and resolvethem, perfusion of ischemic tissues, and correction of localtissue hypoxia.
When an individual is exposed to a change in PB,a bubble deep within the body tissues responds to thepressure change. During compression, the surrounding PB
is increased, producing a reduction in bubble volume inaccordance with Boyle’s law. Clinically, it is important toweigh the potential risk of use of high pressures (risk ofoxygen toxicity and nitrogen onloading during air breaks)for a prolonged period of time versus the modest decreasein the physical size of any bubble (Figure 3-7). Duringcompression, the bubble becomes smaller and the surfacetension increases.
Applying hyperbaric pressure in treating DCS will,therefore, either eliminate the bubbles entirely or reduce theirsize to a significant extent. The amount of size reduction willdepend on the absolute bubble size at the onset of therapy.Although some bubbles may not be eliminated completely bythe initial application of pressure, their reduction in size aidsin partially restoring circulation in the case of intravascularbubbles and reducing the mechanical effects of extravascularbubbles.
Bubbles that are too big to resolve upon the initialapplication of pressure will continue to decrease in size withthe time spent at increased pressure while breathing 100%oxygen to continue denitrogenation. This gradual decreasein size is due to the diffusion of gases from the bubble to thesurrounding tissues and fluids. Diffusion of gases from thebubble occurs because the partial pressure of gases withinthe bubble increases when the volume is reduced duringcompression. The elevated partial pressure of gases inside thebubble creates a gradient favorable for inert gas eliminationfrom the bubble as tissue denitrogenation continues, aspresented in Figure 3-8. This principle is the foundation ofthe efficacy of hyperbaric O2 therapy. The oxygen windowis equal to the partial pressure difference between thepartial pressure of N2 in the bubble and alveolar N2 partialpressure. We can therefore understand that breathing highpartial pressures of O2 will increase the oxygen window bymaximizing the above-mentioned partial pressure differencebetween the alveoli (zero nitrogen while breathing 100%oxygen) and the bubbles and body tissues. Figure 3-8also shows that if the individual breathes air, the favorablegradient will lessen with time as the surrounding tissues and

70 P H Y S I O L O G Y A N D E N V I R O N M E N T
Compression
Breathing air
Breathing 100% oxygen
Bubble
PN2
∆PN2(1)
∆PN2(2)
Tissue
Time
Notes:
(1) ∆PN2 Decreases with time of
compression- breathing air
(2) ∆PN2 Decreases with time of
compression- breathing O2
FIGURE 3-8 Bubble nitrogen gradients whenbreathing pure oxygen.
fluids approach equilibrium at the new N2 partial pressure.Therefore, the bubble will be resolved more rapidly if theindividual breathes 100% O2 because a favorable gradient fornitrogen elimination from a bubble will improve with time,and the bubble will more rapidly diminish in size. Duringhyperbaric therapy, the patient intermittently breathes 100%O2 at increased pressure. Breathing 100% O2 provides anincreased gradient for eliminating N2 from evolved bubblesand aids in their resorption. The increased gradient alsospeeds the elimination of N2 from supersaturated tissues, andthereby helps prevent further bubble formation. Therefore,if a sufficient time is spent at depth, all bubbles will resolve.
Hyperbaric oxygenation results in increased O2 tension inthe capillaries surrounding ischemic tissue. The increased O2
tension extends the O2 diffusion distance from functioningcapillaries and corrects the local tissue hypoxia. Overcomingthe tissue hypoxia tends to disrupt the vicious cycle ofhypoxia-induced tissue damage that causes tissue edema andinterferes with circulation and oxygenation.
Treatment of Altitude DecompressionSicknessAlthough the vast majority of DCS cases occurring ataltitude will be completely relieved by descent to groundlevel, approximately 6.9% of cases may persist and requiretreatment (117). In addition, less than 1% of patients willexperience the initial onset of symptoms of DCS afterdescent, so-called delayed cases. Deaths from altitude DCSare exceptionally rare in contrast to diving induced DCS.
Before 1959, more than 17,000 cases of altitude-inducedDCS were documented. Of these cases, 743 were reported asserious, including 17 fatalities. Davis et al. (71), comment-ing on a review of these 17 fatalities, made the followingobservations. All died in irreversible shock that was unre-sponsive to fluid replacement and drug therapy. Almost allcases began as simple DCS pain, neurologic manifestations,or chokes, which only after several hours progressed to cir-culatory collapse and death. It should be noted that none of
the 17 fatalities were treated by hyperbaric therapy. In theirreview of 145 cases of altitude DCS treated in hyperbaricchambers, these same authors emphasized that shock was theinitial clinical picture in only one case, whereas seven othercases began with other manifestations and progressed toshock. In this series of patients, no fatalities occurred amongthose who were treated in hyperbaric chambers (71). In 1988,another fatality (68) occurred due to exposure to 8,537 m(28,000 ft) for more than 30 minutes secondary to a faultycanopy seal in a F-100 flight. The aviator had symptoms ataltitude, delayed landing and complained of persistent dysp-nea after landing, and finally reported to the emergency roomwith a 1-hour delay after landing; hyperbaric therapy wasinitiated 3 hours after presentation (transport to hyperbaricfacility). The patient, who was overweight and 51 years, died5.5 hours after presentation during hyperbaric therapy (USNTreatment Table 6A) with pulmonary symptoms (‘‘chokes’’)terminating in ventricular fibrillation.
As early as 1945, Behnke (40) advocated the use ofcompression therapy to treat cases of altitude DCS thatdid not resolve upon descent to ground level. It was notuntil 1959 that a USAF aviator was successfully treated bycompression (106). In 1963, Downey et al. (118) using ahuman serum in vitro model, demonstrated the persistence,at ground level, of bubbles formed at altitude. Uponcompression to pressures greater than sea level, the bubblescleared. In vivo confirmation of Downey’s work was reportedby Leverett et al. in 1963 (119).
Because many physicians have no training in recognitionor treatment of altitude DCS, it is important for aircrewto be aware of the symptoms of DCS and the need toseek medical attention from informed personnel. AltitudeDCS is typically resolved during descent to a lower altitudewhile breathing 100% oxygen in accordance with currentUSAF directives. Continued breathing of 100% oxygen onthe ground for 2 hours is sometimes effective treatment forselect mild cases of DCS that do not resolve completelyduring descent (120). The reason for resolution of symptoms
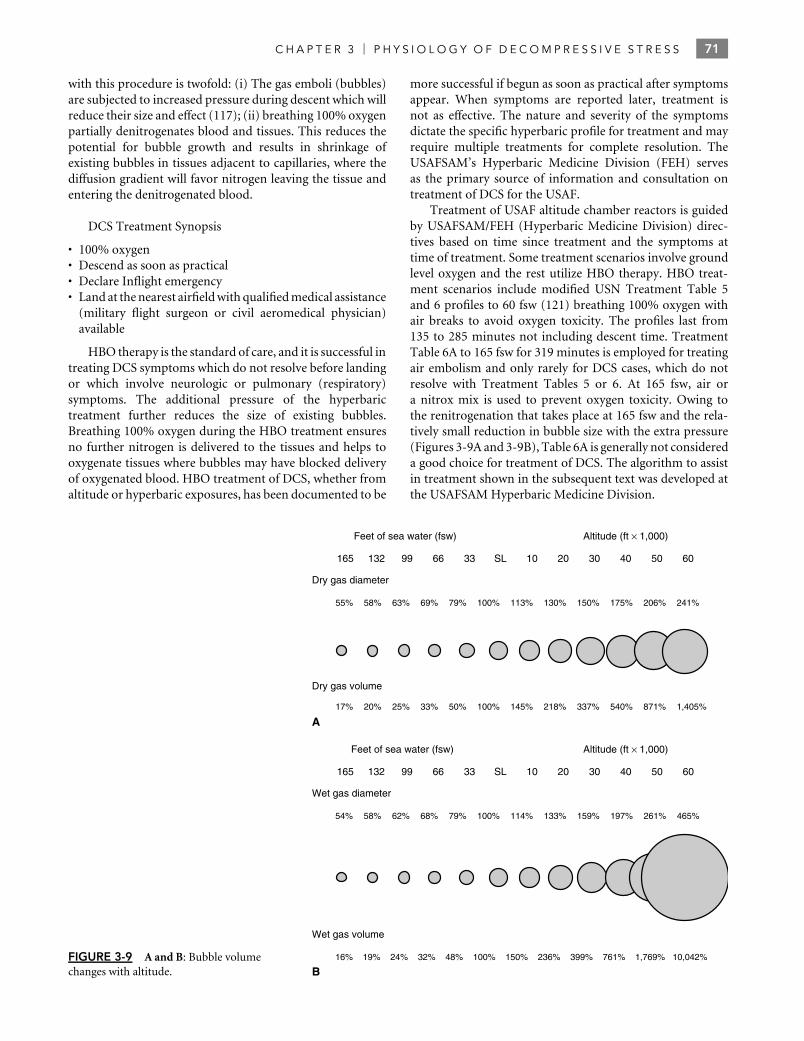
C H A P T E R 3 P H Y S I O L O G Y O F D E C O M P R E S S I V E S T R E S S 71
with this procedure is twofold: (i) The gas emboli (bubbles)are subjected to increased pressure during descent which willreduce their size and effect (117); (ii) breathing 100% oxygenpartially denitrogenates blood and tissues. This reduces thepotential for bubble growth and results in shrinkage ofexisting bubbles in tissues adjacent to capillaries, where thediffusion gradient will favor nitrogen leaving the tissue andentering the denitrogenated blood.
DCS Treatment Synopsis
• 100% oxygen• Descend as soon as practical• Declare Inflight emergency• Land at the nearest airfield with qualified medical assistance
(military flight surgeon or civil aeromedical physician)available
HBO therapy is the standard of care, and it is successful intreating DCS symptoms which do not resolve before landingor which involve neurologic or pulmonary (respiratory)symptoms. The additional pressure of the hyperbarictreatment further reduces the size of existing bubbles.Breathing 100% oxygen during the HBO treatment ensuresno further nitrogen is delivered to the tissues and helps tooxygenate tissues where bubbles may have blocked deliveryof oxygenated blood. HBO treatment of DCS, whether fromaltitude or hyperbaric exposures, has been documented to be
more successful if begun as soon as practical after symptomsappear. When symptoms are reported later, treatment isnot as effective. The nature and severity of the symptomsdictate the specific hyperbaric profile for treatment and mayrequire multiple treatments for complete resolution. TheUSAFSAM’s Hyperbaric Medicine Division (FEH) servesas the primary source of information and consultation ontreatment of DCS for the USAF.
Treatment of USAF altitude chamber reactors is guidedby USAFSAM/FEH (Hyperbaric Medicine Division) direc-tives based on time since treatment and the symptoms attime of treatment. Some treatment scenarios involve groundlevel oxygen and the rest utilize HBO therapy. HBO treat-ment scenarios include modified USN Treatment Table 5and 6 profiles to 60 fsw (121) breathing 100% oxygen withair breaks to avoid oxygen toxicity. The profiles last from135 to 285 minutes not including descent time. TreatmentTable 6A to 165 fsw for 319 minutes is employed for treatingair embolism and only rarely for DCS cases, which do notresolve with Treatment Tables 5 or 6. At 165 fsw, air ora nitrox mix is used to prevent oxygen toxicity. Owing tothe renitrogenation that takes place at 165 fsw and the rela-tively small reduction in bubble size with the extra pressure(Figures 3-9A and 3-9B), Table 6A is generally not considereda good choice for treatment of DCS. The algorithm to assistin treatment shown in the subsequent text was developed atthe USAFSAM Hyperbaric Medicine Division.
FIGURE 3-9 A and B: Bubble volumechanges with altitude.
Feet of sea water (fsw)
165
165
132 99 66 33 SL 10 20 30 40 50 60
Dry gas diameter
55% 58% 63% 69% 79% 100% 113% 130% 150% 175% 206% 241%
Dry gas volume
17% 20% 25% 33% 50% 100% 145% 218% 337% 540% 871% 1,405%
Feet of sea water (fsw)
132 99 66 33 SL 10 20 30 40 50 60
Wet gas diameter
54% 58% 62% 68% 79% 100% 114% 133% 159% 197% 261% 465%
Wet gas volume
16% 19% 24% 32% 48% 100% 150% 236% 399% 761% 1,769% 10,042%
A
B
Altitude (ft × 1,000)
Altitude (ft × 1,000)

72 P H Y S I O L O G Y A N D E N V I R O N M E N T
Of the approximately 1,000 cases of DCS observed insubjects during 20 years of altitude DCS research chamberactivity at Brooks City Base, 89 subjects were treatedwith HBO by the Hyperbaric Medicine Division, all withcomplete resolution of symptoms. The remaining cases weresuccessfully treated with 2 hours of ground level oxygen(GLO) (120) or with no treatment.
Treatment ProceduresIf the aviator had only symptoms of joint pain that resolvedupon recompression to one ATA from altitude, then theindividual may be treated with 2 hours of 100% GLO,followed by 24 hours of observation. Should symptomspersist after recompression to ground level from altitude orrecur, then transfer to a hyperbaric treatment facility shouldbe arranged. The use of surface level 100% oxygen as atherapeutic modality applies only under select circumstances:
1. Altitude (NOT diving)-induced DCS only, bends painonly
2. Pain during the exposure or within 2 hours of exitingthe altitude exposure
3. NOT for paresthesiae, neurologic symptoms or respira-tory (chokes) symptoms
4. Successful therapy is disappearance of all symptoms after2 hours of surface level 100% oxygen
5. Oxygen therapy should be continued for 1 hour after allsymptoms have resolved
6. Minimum of 2 hours of oxygen is advisable even ifsymptoms resolve immediately
7. Maximum time on surface level 100% oxygen is 3 hours8. If symptoms worsen or recur go to Treatment Table 5
or 69. If symptoms do not improve in 30 to 60 minutes go to
Treatment Table 5 or 610. If symptoms do not resolve completely within 2 hours
go to Treatment Table 5 or 6
The importance of a thorough but expeditious patientexamination cannot be overemphasized; some patientsmay not report/be aware of subtle neurologic symptomsthat actually might alter therapy. In case of a cleartherapeutic emergency, that is, cardiovascular collapse,severe chokes, marked neurologic deficit, the neurologicexamination is clearly not essential as a first priority.The patient presenting with stable symptoms, after ahyperbaric recompression, with a recurrence of symptomsor before initiating patient transport represents the situationwhere a thorough, repeat neurologic examination is mostvaluable. The examination may allow reclassification intoa different treatment algorithm possibly modifying yourchoice of treatment tables as discussed in the subsequenttext. The examination should allow a clearer definition of theanatomic area affected (supratentorial/infratentorial, spinalcord, peripheral nerves, muscle/musculoskeletal). Ideally,in the interest of reproducibility and consistency, such anexamination should follow a standard protocol, possibly inthe form of a DCS examination checklist (122).
Although a number of treatment tables are used success-fully throughout the world, the USN Treatment Tables areconsidered authoritative for treating DCS in this country.Before 1964, air Treatment Tables were used in the ther-apy of DCS. The therapeutic success was not satisfactoryand therefore Goodman and Workman (123) developed theoxygen Treatment Tables now labeled as Tables 5 and 6.The oxygen Treatment Tables were adopted by the USN in1967 and have proved to be highly effective in treating DCS.Lack of response or worsening symptoms for pain-only DCSafter ground level oxygen therapy warrants use of Treat-ment Table 5. If the symptoms do not disappear or worsenon a Treatment Table 5, then the patient is committed toTreatment Table 6.
Treatment Table 6 is reserved as a first step for casesinvolving the CNS or cardiopulmonary systems and forrecurrences of previously treated DCS. The USN TreatmentTable 7 is used only in life-threatening situations when othertreatment tables have failed to resolve symptoms of serioustype II DCS or cerebral gas embolism. Because patientstreated on Table 7 will be in the hyperbaric chamber forat least 48 hours, this treatment should only be undertakenwhen all medical and nonmedical care of the patient can beprovided in the chamber for this period of time. When longdelays between onset and treatment occur, the manifestationsof DCS become more serious. They seem to be aggravatedby the development of secondary edema and vascularobstruction or impairment from thrombosis. Hyperbaricoxygenation in such circumstances probably provides morebenefit than does the mechanical compression of bubbles.
Patients should stay in the vicinity of the treatment facilityfor at least 24 hours after hyperbaric therapy. Furthermore,exercise, alcohol, flying, diving, or altitude exposure shouldbe avoided for 72 hours after the hyperbaric treatment.Patients should be told to stay well hydrated and expect somedegree of fatigue after the hyperbaric chamber treatment.Delayed ear pain may occur, which may be prevented byperforming a Toynbee or Valsalva maneuver before going tobed and again the next morning.
Adjuvants to Hyperbaric TherapyOxygen and hyperbaric therapy are the only definitive treat-ments for DCS. In serious cases of DCS, a marked loss ofintravascular volume can occur by transudation of plasmaacross damaged capillary walls. Hemoconcentration produc-ing hypoperfusion of tissue and sludging of red blood cellsshould be avoided or corrected by prompt and adequate ad-ministration of rehydration. Patients with CNS or respiratoryDCS or arterial gas embolism should receive intravenous (IV)Ringer’s lactate or normal saline solution (121). Solutionscontaining only Dextrose (e.g., D5W) should be avoided asthey may contribute to edema as the dextrose is metabolized.Patients who are fully conscious may receive oral rehydra-tion, typically 1 to 2 L of water, juice, or noncarbonateddrinks are adequate. Frequent checks of urinary output arethe best guide to the adequacy of the fluid therapy. Urinaryoutput should be maintained at 1 to 2 mL/kg/hr.

C H A P T E R 3 P H Y S I O L O G Y O F D E C O M P R E S S I V E S T R E S S 73
Dexamethasone, 20 mg IV followed by 4 mg intramus-cularly every 6 hours, may be useful in the prevention ortreatment of CNS edema (124). IV methylprednisolone withan initial dose of 30 mg/kg followed by constant IV infusionat a rate of 5.4 mg/kg/hr may be used as well. Aside from thepossible benefits in the treatment of cerebral edema, there iscurrently no conclusive evidence for a beneficial therapeuticimpact of corticosteroid therapy on DCS outcome.
In cases of neurologic DCS affecting the spinal cordresulting in immobility, the prophylactic use of hep-arin, preferably low molecular weight heparin (LMWH),is recommended to prevent deep venous thrombosis(DVT) (125,126). Heparin per se does not appear to have abeneficial effect in the treatment of DCS aside from the pre-vention of DVT (127,128) and may hypothetically increasethe risk of bleeding (spinal chord, brain, and inner ear mayshow evidence of hemorrhage in severe DCS). In spinal chordDCS, an indwelling urinary catheter should be placed becausethese patients commonly develop a neurogenic bladder.
The use of Lidocaine in antiarrhythmic doses (loadingdose 1.5 mg/kg, followed by a maintenance drip rate of1 mg/min) as a neuroprotective agent in DCS is currentlyunder investigation; several studies have shown favorableresults (129).
The use of IV perfluorocarbon emulsions combinedwith 100% O2 in the prevention as well as therapyof DCS has shown promising results in animal studiesand may become available for clinical use (130–133).Perfluorocarbon emulsions function as very efficient oxygenand nitrogen carriers, thereby improving tissue oxygenationand denitrogenation.
Cases of DCS following diving do not result in neardrowning as frequently as do cases of cerebral air embolism;nevertheless, the possibility of near drowning must beconsidered and treatment begun when warranted. In suchcases, intensive pulmonary care is mandatory. Endotrachealintubation, assisted ventilation with monitoring of end-tidalCO2 (57), and appropriate correction of acidosis may benecessary.
None of the earlier procedures should delay movement ofthe patient to a hyperbaric chamber except when necessary asimmediate life-sustaining measures. It is just as important,however, to institute or continue such procedures afterhyperbaric therapy is begun as part of the overall intensivecare management of serious cases.
Return to Flying DutyAeromedical disposition of aircrew who have DCS variesamong the different branches of the US Department ofDefense. The USAF has policies in place that allow returnto flying duty 72 hours after a simple, fully resolved case ofDCS not involving CNS symptoms. The aviator needs to beseen by his local flight surgeon who documents a normalneurologic examination before returning the aviator to flyingstatus. DCS with neurologic involvement usually requires72 hours of grounding. DCS with neurologic involvementthat resolves without residual deficits requires a clearing
evaluation by a neurologist, concurrence with the decision toreturn to flying status by the hyperbaric medicine physicianat the Davis Hyperbaric Laboratory in San Antonio andthe Major Command flight surgeon before return to flyingstatus. Aviators with residual deficits after a DCS incidentare disqualified from flying duties. The aviator may applyfor a waiver and the decision will be made on a case-by-case basis after review and examination by the AeromedicalConsultation Service at Brooks City Base and their emanatingrecommendation will be the basis for the final waiver decisionat Major Command level.
The USN follows the following policies: a simple, singleepisode of type I (pain only) DCS event results in groundingof the aviator for a period of 3 to 7 days. The aviator mayreturn to flying duty thereafter, provided there are no resid-ual deficits on physical examination. Type II DCS requiresgrounding for 14 to 30 days; return to flying status is possibleprovided there are no residual deficits on physical examina-tion by the flight surgeon. Aviators with residual neurologicdeficits may apply for a waiver and a review by the HyperbaricMedicine Committee at the Naval Aerospace Medical Insti-tute will consider each application on a case-by-case basis.
DIRECT EFFECTS OF PRESSURECHANGES
Gas contained within body cavities is saturated with watervapor, the partial pressure of which is related to bodytemperature. Because body temperature is relatively constant(37◦C), the partial pressure of the water vapor is also constantat 47 mm Hg. Therefore, the following relationship can beexpressed as Boyle’s law with reference to wet gas:
Vi (Pi − PH2O) = Vf (Pf − PH2O) [11]
where Vi is the initial volume of the gas; Vf is the final volumeof the gas; Pi is the initial pressure of the gas in the cavityin mm Hg; Pf is the final pressure of the gas in the cavityin mm Hg; and PH2O is the partial pressure of water vapor(47 mm Hg at 37◦C). Over a given pressure reduction, wetgas will expand to a greater degree than dry gas (Figures 3-9Aand 3-9B). The relative gas expansion is a ratio of the finalvolume of the gas (Vf ) to the initial volume (Vi) of the gasand is expressed in the following equation:
Relative gas expansion = Vf
Vi= Pi − PH2O
Pf − PH2O
= (Pi − 47)
(Pf − 47)[12]
Figure 3-10 illustrates the increased volume of wet gases at agiven pressure over that of a dry gas.
When one experiences a change in ambient pressure, apressure differential is established between gas-containingbody cavities and the external environment. To the extentthat gas can move between body cavities and the externalenvironment, this pressure differential will be relieved. It canalso be relieved by a change in the volume of the body cavity

74 P H Y S I O L O G Y A N D E N V I R O N M E N T
11,887.2
5 Vol
3 Vol
2 Vol
7 Vol
5 Vol
3 Vol
2 Vol
1 Vol 1 Vol
Pressurealtitude
in meters(ft)
Dry airexpansion
Wet airexpansion
(39,000)
10,363.2
(34,000)
7,620
(25,000)
5,029.2
(16,500)
12,192
(40,000)
11,887.2
(39,000)
9,144
(30,000)8,534.4
(28,000)
6,096
(20,000)
3,048
(10,000)
5,486.4
(18,000)
FIGURE 3-10 Volumes of wet and dry gases.
(compliance). When the pressure differential is not relieved,pathologic effects on involved tissues are likely to occur. Themagnitude of the pathologic effects is related to the ratioof the pressure of the gas within the affected body cavityto the ambient pressure and not to the absolute value ofthe pressure differential. This is predictable from examiningthe pressure–volume relationships of Boyle’s law. Therefore,divers, for example, experience more difficulties with themechanical effects of pressure change when descending fromsea level to 33 fsw [10 meter seawater (msw)] (Equations 13and 14), than they do when descending from 99 to 132fsw (30 to 40 msw) (Equations 15 and 16). Note that thepressure differential is identical for both circumstances, butthe pressure ratio is considerably different.Pressure differential:
Pf − Pi = 1520 mm Hg − 760 mm Hg
= 760 mm Hg [13]
Pressure ratio,
Pf
Pi= 1520 mm Hg
760 mm Hg= 2 [14]
Pressure differential:
Pf − Pi = 3800 mm Hg − 3040 mm Hg
= 760 mm Hg [15]
Pressure ratio,
Pf
Pi= 3800 mm Hg
3040 mm Hg= 1.25 [16]
Medically significant pressure changes occur in both flyingand diving. There is a marked difference, however, betweenthese two operations with respect to the magnitude and rate
of the pressure changes. An aviator descending to sea levelfrom 7,620 m at 1,520 m/min (25,000 ft at 5,000 ft/min)will experience a total pressure change of 478 mm Hg at arate of 2.3 mm Hg/s. A diver descending from sea level to165 fsw (50 msw) at a rate of 60 ft/min (18 m/min) willexperience a total pressure change of 3,800 mm Hg at a rateof 23 mm Hg/s.
In general, it is possible to successfully cope with thechanges in PB that occur within the flying or diving envelopes.As long as the pressure in the various body cavities canequalize with the ambient pressure, large pressure changescan be tolerated. For example, meaningful work has beenperformed by aviators at pressures equivalent to 0.1 (ATA)atm abs (17,982 m or 59,000 ft) and by divers at pressuresequivalent to 69 atm abs (686 m or 2,250 ft).
If equalization of pressure is not attained, difficultiesranging from mild discomfort to severe pain, tissue damage,and complete incapacitation will be experienced. The areasof primary concern are the lungs, middle and inner ear,paranasal sinuses, teeth, and the gastrointestinal tract.
The Lungs: Pulmonary Barotraumaand Arterial Gas EmbolizationUnless air is continually exchanged between the lungsand the outside environment during changes in ambientpressure, severe pathologic disorders can result from theeffects of Boyle’s law. Airflow during pressure change willnot occur with voluntary breathholding or the apneic phaseof tonoclonic seizure.
Consider the potential problem of a breathholdingdescent during diving. The average total lung capacity is5,800 cm3. The residual volume (i.e., the volume to which thelungs can be reduced with forceful expiration) is 1,200 cm3.If the air volume within the lungs is reduced below 1,200 cm3,the actual lung volume will decrease no further due to theelastic and fibrous skeletal structure of the lung tissue. Thevolume deficit is made up by the leakage of plasma andwhole blood into the lungs. This is the classic description ofthe pathologic condition called lung squeeze and is morecommon in breathholding diving than in descent fromaltitude. To achieve lung squeeze, the air volume withinthe lungs must be reduced to approximately 20% of theoriginal volume. To achieve this on descent from altitude, anaviator would have to make a breathholding descent from11,890 m (39,000 ft) to sea level. A breathholding dive to 132fsw (40 msw), however, will result in such a fivefold decreasein the original lung volume. Such a dive is well within thecapabilities of many expert divers.
In compressed gas diving, respirable gas is supplied tothe diver from the surface, from a diving bell or hyperbaricchamber, or from a scuba. The gas may be supplied throughregulators designed to match intrapulmonary gas pressureto the surrounding ambient pressure. The compressedgas–supplied diver avoids lung squeeze on descent but runsan added risk on ascent. During ascent to the surface, the divermust continually equilibrate the intrapulmonary pressureto the surrounding pressure. This equilibration is usually
C H A P T E R 3 P H Y S I O L O G Y O F D E C O M P R E S S I V E S T R E S S 75
accomplished by releasing gas from the lungs by normalbreathing or, in the event of the loss of gas supply at depth, byslow continual exhalation on ascent. Failure to do so results inintrapulmonary gas expansion according to Boyle’s law and,after the elastic limit of the thorax is reached, a relative riseof intra-alveolar pressure. A rise in intra-alveolar pressureof 50 to 100 mm Hg above ambient pressure is sufficient toforce gas into extra-alveolar compartments, resulting in oneor more of the clinical conditions grouped under the termpulmonary overpressure accidents/pulmonary barotrauma.
Pressure differentials sufficient to cause a pulmonaryoverpressure accident in the compressed gas–supplied divercan occur on ascents as shallow as from 2 m (6.6 ft) to thesurface. In the aviator, concern regarding pulmonary baro-traumas is justified as well. Sufficient pressure differentialscan be attained due to rapid decompression at high altitude,possibly coupled with exacerbating factors such as concomi-tant performance of an anti-G straining maneuver against aclosed glottis and concomitant positive pressure breathing.
Autopsies of fatalities following pulmonary overpressureaccidents have demonstrated extra-alveolar gas in essentiallyevery tissue examined. Following such an accident, however,the clinical picture seen will be that of arterial gas embolism,mediastinal and subcutaneous emphysema, and/or pneu-mothorax. The latter two manifestations are recognized byphysical and radiographic examination and are managed byconventional measures. The manifestations of arterial gasembolism have an immediate onset following the rapid pres-sure reduction and may include loss of consciousness, local orgeneralized seizures, visual field loss or blindness, weakness,paralysis, hypoesthesia, or confusion. A patient presentingwith any of these signs or symptoms within 15 minutes ofexposure to a rapid pressure reduction must be assumedto have suffered an arterial gas embolism and be treatedemergently for such.
Predisposing FactorsIn addition to breathholding during ascent, pulmonaryoverpressure accidents can also occur as a consequence ofpreexisting disease that limits the egress of gas from the lungs.Therefore, the risk is increased by asthma, chronic bronchitis,air-containing pulmonary cysts, and other obstructiveairway disease. Some pulmonary overpressure accidentshave occurred without demonstrable cause in patients whoexhaled during ascent and had no subsequent lung disorders.In these cases, local pulmonary air trapping is thought tohave occurred by redundant tissue, mucous plugs, or similarmechanisms establishing a one-way valve in a small airpassage, which allowed gas to pass during compression butnot during decompression.
In the context of aeromedical evacuations of casualties,it is important to remember that an increasing numberof cases of gas embolism are caused by the introductionof air or other gas into the arterial or venous systemduring surgical procedures or following the establishmentof indwelling arterial catheters. With the increasing useof indwelling catheters and surgical procedures involving
invasive instrumentation of the cardiovascular system, thenumber of gas embolism cases has also increased. Stoneyet al. (134) have estimated that the accidental introduction ofair through arterial lines occurs in more than 1 in 1,000 cases.
DiagnosisThe most difficult differential diagnosis is between gas em-bolism and neurologic DCS when decompression is involved.This diagnosis is important because of the need to select aproper Treatment Table. The key factor in reaching a properdiagnosis is the time before the onset of symptoms and his-tory. The onset is immediate with gas embolism, with symp-toms usually occurring swiftly after rapid pressure reduction.
The diagnosis of a surgical gas embolism should beconsidered in any patient with indwelling arterial or venouslines (particularly a central line). The sudden onset ofseizure or coma is frequently the presenting sign. Venousgas embolism is more common and much less of aproblem due to the microfiltration capability of the lungs.Nonetheless, it may present as a systemic embolism in thepresence of a PFO with right to left shunting, ASD/PFO,pulmonary microcirculation, or through arteriovenous (AV)shunts (42).
In surgical cases, general anesthesia may mask theunusual symptoms; however, failure of the patient toawaken normally or the presentation of an unexplainedneurologic deficit should alert one to the diagnosis of possibleintraoperative gas embolism. A neurologic examination mayreveal a myriad of CNS findings depending on the locationof the gas. Funduscopic examination may reveal arteriolarbubbles in some instances. Computed tomographic (CT)scanning or MRI of the head may be used diagnosticallywhen it is immediately available, but therapy should not bedelayed while waiting for an imaging procedure.
In the diagnosis and treatment of gas embolism, time andappropriate life support measures (ACLS) are of the essence.Although some patients survive a delay of up to 24 hours,the experience of treatment facilities, with a mortality rangeof 20% to 25%, indicates that time from embolization totreatment is a most important factor.
TreatmentTo provide effective therapy for gas embolism, it is importantto remember the basic difference between DCS (air or gasbubbles evolving from solution) and gas embolism (gasbubbles that enter the arterial or venous circulation directly).Although the manifestations of DCS are diverse, they arerarely fatal when treated by proper hyperbaric therapywithin hours to days of occurrence. Conversely, the onsetof gas embolism is a sudden, dramatic, and immediatelylife-threatening event. Bubbles obstruct the systemic orpulmonary arterial circulation. As decompression continues,they expand to produce local endothelial cell damageand herniation into the vessel walls. In addition, plasmaproteins react to the invading bubbles by denaturization andattachment to the bubble wall. Activation and agglutinationof platelets to the bubbles occur (61), with release of very
76 P H Y S I O L O G Y A N D E N V I R O N M E N T
potent vasoactive amines and prostaglandins, which produceimmediate hypoxia symptoms that may appear as neurologicdeficits.
The rationale for hyperbaric therapy for DCS alsoapplies to the management of gas embolism: mechanicalcompression of bubbles and hyperbaric oxygenation oftissues. Because of the massive amounts of air that are oftenintroduced into the cerebral circulation of gas embolismvictims, it is usually necessary to mechanically compress theentrapped air maximally.
The Trendelenburg (30◦ head-low) position has beenconsidered the ideal position to further decrease thelikelihood of further introducing air volume into the CNS.This position increases cerebral hydrostatic pressure and, insome cases, forces small bubbles from the arterial circulationacross the cerebral capillary bed into the venous circulation,where they produce less potential harm to the victim. Atthe same time, this position may enhance cerebral edemaformation. It is currently not a routine recommendation,unless the patient benefits from the augmented cardiacoutput. Supine positioning of the patient is preferred. Itmust be emphasized that 100% O2 breathing cannot beadministered at 6 ATA abs (Treatment Table 6A) due tothe extremely short time to CNS O2 toxicity. Convulsiveseizures would occur in less than 5 minutes. Elevated oxygenpercentages, however, can be administered in the form of50/50 Nitrox (a mixture of 50% O2 and 50% N2). Thismixture will assist in correcting tissue hypoxia and ischemiabecause of the improved oxygen diffusion distance.
When it has been determined that maximum benefithas been attained from the mechanical compression of theentrapped air, the patient must be brought to shallowerdepths so that 100% O2 can be administered. Because ofthe advantages of treating with 100% O2, the USN DivingManual suggests initial compression to 2.8 atm abs (18 mswor 60 fsw) for one 20-minute oxygen breathing period beforemaking the decision on whether to pressurize to 6 ATA(50 msw or 165 fsw) (102).
Hyperbaric therapy is the only definitive treatment forAGE. All other methods are adjunctive in nature. As soonas the diagnosis is made, the patient should be placed in thechamber and rapidly compressed with air to 60 fsw (18 msw,2.8 ATA). The patient is placed on 100% O2 for a 20-minutebreathing period. If symptoms improve, treatment continueson Table 6. If symptoms do not change or worsen, the patientis compressed to 6 ATA (165 fsw, 50 msw) and treatmentcontinues on Table 6A.
Variation from the standard Table 6A is potentiallyharmful to both the patient and inside observers and shouldnot be done without prior consultation with experts in divingmedicine.
Adjunctive measures that should be used in the treatmentof AGE are IV fluids and possibly steroids in pharmacologicdoses (see also discussion ‘‘adjunctive measures to hyperbarictherapy’’ in the preceding text). Hemoconcentration isfrequently seen in AGE and may be related to tissue hypoxiaand edema. Divers are also commonly dehydrated secondary
to pressure diuresis and lack of normal oral fluid intake.Vigorous hydration is important to minimize sludging andobstruction of microvascular blood flow caused by theelevated hematocrit, while avoiding fluid overload. Balancedsaline solution (Ringer’s lactate) or isotonic saline withoutdextrose should be administered intravenously at the rate of1 L/hr until the patient voids or is catheterized for at least500 mL. Sugar (glucose) is specifically not given to preventfurther dehydration secondary to glycosuria and a resultantosmotic diuresis as well as the potential for edema formation.Once adequate hydration is achieved, the rate is slowed to150 to 200 mL/hr for the remainder of the treatment.
Dexamethasone may be administered intravenously ina dose of 20 mg followed by 4 mg intramuscularly every6 hours for 24 to 48 hours (124); this may prove to bebeneficial in cases with evidence of cerebral edema. Till now,there is no conclusive evidence showing a clear therapeuticbenefit of corticosteroids in this context; therefore, thequestion of their use remains open in this setting. Thereis furthermore no supportive evidence for the idea thatsteroids may increase an individual’s susceptibility to oxygentoxicity. Anticoagulant or antiplatelet medications are notrecommended as routine therapy of AGE, unless neurologicsymptoms cause an inability to walk, in that case adjunctiveDVT prophylaxis with LMWH should be initiated (125–128).
Transport of PatientsOne-hundred percent O2 should be started as soon as pos-sible, using a tightly fitted aviator’s or anesthesia-type mask.The patient should be placed in a recumbent position whileawaiting and during transport to the hyperbaric chamber. Iftransport is required, it is of utmost importance to maintainnear sea-level pressure. The use of ‘‘low-flying’’ helicoptersis contraindicated if ground transportation is available. Evenslight decreases in pressure cause bubble enlargement andmay significantly alter the clinical course of the patient.
During transport, IV fluids should be administered usingbalanced saline solutions or normal saline. Patients havingCNS or respiratory DCS or AGE should be accompaniedduring transport by personnel capable of providing intensiverespiratory and ACLS care.
Immediate hyperbaric therapy is essential. Good re-sponse, however, has been seen in some cases after longdelays before reaching the chamber. This makes it manda-tory to give the patient the benefit of a trial of compressionand hyperbaric O2 even in the late case. Of course, everyminute that elapses before the start of compression makesthe prognosis more guarded.
Return to Flying Duties after Arterial GasEmbolizationA decision as to when and if to return a person to flying dutiesfollowing AGE is complex. Consideration must be given tothe circumstances under which the gas embolism occurredand the presence or absence of underlying pulmonarypathology (as predictors of recurrence) as well as evidencefor residual neurologic pathology. A rational approach is

C H A P T E R 3 P H Y S I O L O G Y O F D E C O M P R E S S I V E S T R E S S 77
to consider a cerebral gas embolism ahead injury. Thepatient evaluation strategies following head injuries usedby the appropriate regulating agencies (Federal AviationAdministration or military authorities) provide a basis fordecisions on return to flying duties. In no case, however,should a patient return to such duties earlier than 3 weeksfollowing such an incident to assure complete pulmonaryhealing has occurred.
Other Gas-Containing CavitiesDirect effects of pressure change on the ear, paranasalsinuses, and teeth are described in Chapter 15 and Chapter 20.This section addresses effects on the body and the importantdistinction between wet and dry gas and the implications ofpressure changes on medical equipment.
Water Vapor and Gas ExpansionThe mechanical effects of expansion and contraction of atrapped physiologic gas follow Boyle’s law closely due to therelatively constant temperature of human tissue where gasesare located. During decompression (ascent), trapped gaseswould expand because a differential pressure develops asthe external pressure decreases. Many trapped gases remainessentially constant in volume due to their structure, forexample, sinuses and the middle ear. Instead of respondingby increasing volume, these trapped gases exert a differentialpressure on surrounding tissues, which can cause severe,potentially disabling pain and potential physical damage totissues.
The constant pressure (47 mm Hg) of water vapor at bodytemperature plays an increasing role in gas expansion duringascent as the partial pressures of the other expanded gasesdecrease. For example, water vapor makes up only 1% of thevolume of a trapped gas bubble at 6 atmospheres (165 fsw)and 6% at sea level, but 33% of a trapped gas bubble at40,000 ft. Due, in part, to the water vapor occupying more ofthe available pressure in alveoli, PAO2 becomes extremely lowabove 45,000 ft. Even with 30 mm Hg of additional pressureapplied to the lungs through pressure breathing for altitude(PBA) at 50,000 ft and 60 mm Hg of PBA at 60,000 ft, thePAO2 is the same as breathing air above 18,000 ft.
At this writing, no pulse oximetry results have beenobtained from humans using current oxygen equipmentduring exposure to 60,000 ft in an altitude chamber whilebreathing 100% oxygen with 70 mm Hg of PBA.
Above 63,000 ft, Armstrong’s line, an unprotected humanwould experience vaporization of tissue water because theambient pressure is 47 mm Hg, the same as the partialpressure of water at body temperature. The vaporizationof body water above Armstrong’s line is referred to asebullism. Ebullism is different from embolism, which resultsfrom respiratory air being forced into the circulation byan overpressure in the lungs. The altitude or pressure atwhich ebullism occurs varies with the temperature andpressure in specific tissues. As an example, peripheral tissuesare at a lower temperature than internal tissues and couldebullize at a lower pressure (higher altitude). Similarly, blood
pressure in the arterial system would result in ebullism atlower pressure, higher altitude, than 63,000 ft. Any artificialincrease in pressure around the body would also lower thepotential for ebullism. One mechanism is a pressure suit andanother is pressure PBA, which keeps the lung at a higherpressure. Although not protecting the rest of the body, PBAcan at least provide a temporary increase in oxygen availableto the tissues. Current equipment is inadequate to providesufficient partial pressure of oxygen to tissues above 60,000 ft,even with assisted pressure breathing for altitude (APBA).This involves the use of a counterpressure jerkin worn toallow 60 mm Hg of pressure to be tolerated for more than acouple minutes.
Effects of Trapped Gases during Pressure ChangeBecause the volume of a sphere is a function of the cube of itsradius and the diameter only twice the radius, a large volumechange represents a relatively small change in diameter.However, it is the pressure differential, not volume change,which results in most of the effects listed in the subsequenttext.
• Expansion of trapped gastrointestinal gas.• Barotitis media (ear block) may be defined as an acute
or chronic traumatic inflammation of the middle ear pro-duced by a pressure differential (either positive or negative)between the air in the tympanic cavity and contiguous airspaces and that of the surrounding atmosphere. To alle-viate the pressure differential, several maneuvers can beperformed (Toynbee, Valsalve, Frenzel, etc.). The Toynbeemaneuver entails pinching your nose, closing your mouth,and swallowing, thereby resulting in decreasing nasopha-ryngeal pressure against middle ear and Eustachian tubepressure. The Valsalva maneuver involves increasing thenasopharyngeal pressure against a closed Eustachian ori-fice; pinching your nose and blowing while your mouth isalso closed. The Frenzel maneuver may also be performedby thrusting the jaw forward to open the Eustachian tube,thereby providing a path for equalization of pressure.
• Barosinusitis (sinus block) is an acute or chronic inflam-mation of one or more of the nasal accessory sinusesproduced by a pressure difference (usually negative) be-tween the air in the sinus cavity and the surroundingatmosphere. The condition is characterized by pain in theaffected region typically during descent; this pain can de-velop suddenly and be so severe that the individual will beseverely distracted and incapacitated.
• Barodontalgia (tooth pain) is also a case of a trappedgas exerting positive or negative pressure on surroundingtissue as a result of the difference between the pressureinside the tooth or the apical root of the tooth in themaxillary sinus and the pressure outside the tooth.
• Lung overinflation due to breath-hold or inadequateequalization of pressure during decompression can resultin serious problems.• Pulmonary overexpansion
• Pulmonary embolism (air in arterial circulation)

78 P H Y S I O L O G Y A N D E N V I R O N M E N T
• Pneumothorax (air in lung pleural cavity)• Pneumomediastinum (air in the mediastinum)
The Gastrointestinal TractGas is normally contained in the stomach and the largebowel. As previously discussed, wet gases expand to agreater extent than do dry gases. Expansion within theclosed confines of the gastrointestinal tract during ascentcan cause stretching of the enclosing organ and produceabdominal pain. In addition to pain, respiration can alsobe compromised by gas expansion, forcing the diaphragmupward. If pain is allowed to proceed and relief is not obtainedby belching or the passing of flatus, flight operations will bejeopardized. Severe pain may cause a vasovagal reaction withhypotension, tachycardia, and fainting. The best treatmentof gastrointestinal tract discomfort due to gas expansion isthe avoidance of gas-producing foods. Chewing gum maypromote air swallowing and should be avoided at least duringascent. The crewmember should be instructed to pass gaswhen discomfort occurs. Abdominal massage and physicalactivity may promote the passage of gas. If this is unsuccessful,a descent should be initiated to an altitude at which comfortis achieved.
Other Gas-Containing CavitiesDirect effects of pressure change on the ear, paranasal sinuses,and teeth are described in Chapter 18. This section addressesthese effects on the gastrointestinal system and on medicalequipment.
Effects of Pressure Change on Medical EquipmentVarying volumes of gas may be trapped in medical equipmentbeing used in the aerospace or hyperbaric environment.Examples of such equipment include drip chambers for IVfluids, endotracheal cuffs, water traps used with chest tubes,and sphygmomanometer cuffs.
During ascent, an unvented sphygmomanometer cuffwill inflate and tighten around a patient’s arm. If air is usedto inflate an endotracheal cuff, significant ambient pressurereductions, particularly as seen with ascents from hyperbaricenvironments, can cause tracheal mucosal sloughing ifallowed to persist. A wise precaution is to inflate endotrachealcuffs with normal saline rather than air in such environments.Water levels in water traps should be checked often or openedto ambient pressure when significant changes in pressureoccur. The air space in IV line drip chambers will decreasein volume with increased pressure in hyperbaric chambers.Additional air will have to be added to the drip chamberto monitor the drip rate. On ascent, the volume of air willincrease, and if added air is not replaced with fluid, IV airwill inadvertently be administered.
The possible effects of changes in pressure on all medicalequipment should be considered before such equipment isused either in a hyperbaric chamber or in flight. Whenpossible, the equipment should be functionally tested in thepressure environment in which it is to be used before it isused with patients.
EbullismWith the planned expansion of the operational ceiling fornew, modern fighter aircraft (e.g., F-22 Raptor, Eurofighter2000) to 18,287 m (60,000 ft), we are approaching the at-mospheric zone which may result in human exposures toambient pressures below 47 mm Hg. This is the equivalentof the saturated water vapor pressure at body tempera-ture (37◦C). Upon exposure to such an environmentalpressure, spontaneous boiling and degassing of body tis-sues and fluids will occur. This process is referred to asebullism and the pressure-equivalent altitude at which itis expected to occur is referred to as the Armstrong line[19,201 m (63,000 ft)]. Owing to variations in pressureand temperature in the body, ebullism may occur in ex-posed human tissues as low as 16,763 m (55,000 ft), orhigher in the case of tissue below body temperature andpartly pressurized by an anti-G suit or a counterpressurejerkin. Therefore, referring to the ‘‘Armstrong line’’ as‘‘Armstrong zone’’ would probably be more appropriate.The data that are available on the physiological changesoccurring in this extreme pressure environment are de-rived from animal studies and a few accidental humanexposures (135).
Animal studies (unprotected exposures) have shownrapid loss of consciousness (within 9–12 seconds), immediatetissue hypoxia, rapid increase in venous pressures, circulatoryarrest (in seconds), apnea, and spastic rigidity within30 seconds followed by flaccid paralysis. Provided thatthe structural integrity of lungs, heart, and cerebrum ismaintained, recovery after exposures to 90 to 210 seconds ofa hard vacuum is possible.
In one case of accidental exposure to 36,574 m(120,000 ft) during a test of a space suit, pressurizationof the suit was lost and the subject remembered the sensationof his saliva boiling on his tongue. Rapid recompressionresulted in regaining of consciousness at 4,267 m (14,000 ft)and the subject was not hospitalized after the incident and didnot have any apparent complications. In a second incident,an individual was exposed to 22,554 m (74,000 ft) for 3 to5 minutes in an industrial setting without any protectiveequipment. The individual was comatose with decerebrateposturing and had frank pulmonary hemorrhage afterthe exposure. Aggressive HBO and intensive care therapyresulted in full recovery without any evidence of neurologicdeficits after the incident (1 year after the exposure neurologictesting was above baseline) (134).
There are currently no medical treatment protocolsavailable for ebullism, as it was thought that such anexposure would likely not be survivable. The cases givenin the preceding text illustrate the need for aggressivetherapy aimed at reestablishing pulmonary gas exchangeand support circulation. Hyperbaric O2 therapy or at least100% ground level O2 needs to be considered together withaggressive intensive care therapy.
The quest to fly higher and dive deeper has expandedman’s pressure environmental envelope well beyond thatto which he is physiologically adapted. Pathologic changes

C H A P T E R 3 P H Y S I O L O G Y O F D E C O M P R E S S I V E S T R E S S 79
resulting from exposure to these environments have definednew sets of clinical syndromes specifically related topressure changes. Studies of the pathophysiology underlyingthese syndromes have unmasked two separate categoriesof disorders: indirect effects of pressure change resultingfrom the evolution of gas from solution and direct effectsof pressure change on gas-containing body cavities. Inaddition, it is now recognized that the pressure environmentrepresents a physiologic continuum from the increasedpressures encountered by divers to the decreased pressuresencountered by aviators and astronauts. This continuum isdramatically exemplified by the diver who surfaces safelyonly to experience DCS a few hours later while flying at lowaltitude.
As we have learned more about the physiologic changesthat occur with changes in pressure, we have been able todevelop rational treatment methods to cope with the medicaldisorders they bring about. Therefore, hyperbaric therapy,with specific treatment profiles for mild and severe DCS andfor gas embolism, has lessened mortality and the incidence ofpermanent residual deficits. Adjuvants to hyperbaric therapyare increasing our ability to deal with these disorders.
CONCLUDING REMARKS
Advances in technology have allowed the development ofsystems capable of transporting air and space crewmembersinto increasingly more severe pressure environments. Theincreased altitudes in the operational ceilings of the nextgeneration fighter aircraft as well as the extensive EVA nec-essary to construct the ISS have drawn renewed attention tothe disease processes associated with the changes in ambientpressure in the operational aerospace environment. Techno-logic advances have made possible the development of thelife-support equipment necessary to prevent the pathophys-iologic consequences of exposure to these environments.Unfortunately, the development of practical, effective life-support systems tends to lag behind the development oftransport systems. Historically, this lag resulted from a lackof knowledge about the physiologic consequences of expo-sure to hostile environments. The effective and safe useof advanced flying and diving systems depends on ourability to educate the operators about the risk and symp-tomatology of DCS, efficient reporting mechanisms of DCSincidents, continuous reassessment of our clinical classifica-tion, documentation and evaluation of DCS, and the creationof effective risk-mitigation, risk-quantification, and risk-prediction strategies for the environment the operators face.
ACKNOWLEDGMENTS
Segments from the third edition’s chapter, DecompressionSickness, authored by Jan Stepanek are included. We aregrateful for the patient, critical review of the manuscript andcomments by the editorial team. I appreciate the expertise,
perspective, and contribution of my coauthor James Webb.I thank Dr. Hursh from the Brooks City Base Davis Hyper-baric Facility for his review of the aspects of manifestationsof DCS and therapy of DCS and AGE.
REFERENCES
1. Muhm JM, Rock PB, McMullin DL, et al. Effect of aircraft-cabinaltitude on passenger discomfort. N Engl J Med 2007;357(1):18–27.
2. Wu T. A Tibetan with chronic mountain sickness followed byhigh altitude pulmonary edema on reentry. High Alt Med Biol2004;5(2):190–194.
3. Messner R. Everest, expedition to the ultimate. Seattle: TheMountaineers, 1999:275.
4. West JB. Climbing Mt. Everest without oxygen: an analysis of max-imal exercise during extreme hypoxia. Respir Physiol 1983;52(3):265–279.
5. West JB, Hackett PH, Maret KH, et al. Pulmonary gas exchangeon the summit of Mt. Everest. J Appl Physiol 1983;55(3):678–687.
6. Hackett PH, Roach RC. High-altitude illness. N Engl J Med 2001;345(2):107–114.
7. Klocke DL, Decker WW, Stepanek J. Altitude-related illnesses.Mayo Clin Proc 1998;73(10):988–992; quiz 992–3.
8. Honigman B, et al. Acute mountain sickness in a general touristpopulation at moderate altitudes. Ann Intern Med 1993;118(8):587–592.
9. Hackett PH, Roach RC. High-altitude medicine. In: Auerbach P,ed. Wilderness medicine. Philadelphia: Mosby, 2001.
10. Sampson JB, Cymerman A, Burse RL, et al. Procedures for themeasurement of acute mountain sickness. Aviat Space EnvironMed 1983;54(12 Pt 1):1063–1073.
11. Markovic D, Kovacevic H. Recompression therapy of mountainsickness. Arh Hig Rada Toksikol 2002;53(1):3–6.
12. Roach R, Stepanek J, Hackett PH. In: Pandolf BR, ed. Medicalaspects of harsh environments. Washington, DC: Office of theSurgeon General of the United States Army, Borden Institute,Walter Reed Army Medical Center, 2002:765 ff.
13. Hackett PH, Rennie D, Levine HD. The incidence, importance,and prophylaxis of acute mountain sickness. Lancet 1976;2(7996):1149–1155.
14. Menon ND. High-altitude pulmonary edema: a clinical study.N Engl J Med 1965;273:66–73.
15. Sime F, Monge C, Whittembury J. Age as a cause of chronicmountain sickness (Monge’s disease). Int J Biometeorol 1975;19(2):93–98.
16. Ward MP, West JB. High altitude medicine and physiology, 3rd ed.New York: Oxford University Press, 2000:433.
17. Wiedman M, Tabin G. High-altitude retinal hemorrhage as aprognostic indicator in altitude illness. Int Ophthalmol Clin 1986;26(2):175–186.
18. Wiedman M. High altitude retinal hemorrhage. Arch Ophthalmol1975;93(6):401–403.
19. Nicogossian A, Huntoon CL, Pool SL, et al. eds. Space physiologyand medicine. Philadelphia: Lea & Febiger, 1998:300.
20. Asker JR. US, Russian suits serve diverse EVA goals. Aviat WeekSpace Technol 1995;143(3):40–43.
21. West JB. Improving oxygenation at high altitude: acclimatizationand O2 enrichment. High Alt Med Biol 2003;4(3):389–398.
22. Denison DM, Ledwith F, Poulton EC. Complex reaction times atsimulated cabin altitudes of 5,000 feet and 8,000 feet. AerospaceMed 1996;10:1010–1013.
23. Ernsting J. Prevention of hypoxia-Acceptable compromises. AviatSpace Environ Med 1978;49:495–502.
24. West JB. Acclimatization to high altitude: truths and misconcep-tions. High Alt Med Biol 2003;4(4):401–402.

80 P H Y S I O L O G Y A N D E N V I R O N M E N T
25. Balldin UT, Dart TS, Whimore J, et al. The effects of 12 hoursof low grade hypoxia at 10,000 ft at night in special operationsforces aircraft operations on cognition, night vision goggle visionand subjective symptoms. USAF, Air Force Research Laboratory,2007:40; www.dtic.mil.
26. Lenfant C, Sullivan K. Adaptation to high altitude. N Engl J Med1971;284(23):1298–1309.
27. Kindwall E. A short history of diving and diving medicine. In:Bove AA, ed. Diving medicine. Philadelphia: WBSaunders, 1997.
28. Bert P. La pression barometrique. Columbus: College BookCompany, 1943. ed. 1878, Paris, France.: Masson.
29. Von Schrotter H. Der Sauerstoff in der Prophylaxe und Therapieder Luftdruckerkrankungen. Berlin:1906.
30. Boycott A, Damant GCC, Haldane JS. The prevention ofcompressed-air illness. J Hyg Camb 1908;8:342–443.
31. Henderson Y. Effects of altitude on aviators. Aviation 1917;2:145–147.
32. Jongbloed J, Bijdrage tot de Physiologie der Vliegers op grooteHoogten, in Habilitation Thesis. University of Utrecht, 1929.
33. Jongbloed J, The composition of alveolar air in man at altitudesup to 14’000meters; partly without oxygen supply: the mechanicaleffect of very low atmospheric pressure, in: Intenational. AirCongress. Vth Congress, The Hague, 1930:1418.
34. Barcroft J, Margaria R, Douglas. Muscular exercise at low barom-etric pressures. Arch Sci Biol 1931;16:609–615.
35. Engle E, Lott A, Man in flight: biomedical achievements inaerospace, in Doctors in the sky.. Annapolis: Leeward Publications,Inc.; 1979:62.
36. Boothby W, Lovelace WR. Oxygen in aviation. J Aviat Med 1938;9:172–198.
37. Spencer MP. Decompression limits for compressed air deter-mined by ultrasonically detected blood bubbles. J Appl Physiol1976;40(2):229–235.
38. Bayne CG, Hunt WS, Johanson DC, et al. Doppler bubble detectionand decompression sickness: a prospective clinical trial. UnderseaBiomed Res 1985;12(3):327–332.
39. Behnke A. A review of physiologic and clinical data pertainingto decompression sickness. United States Naval Medical ResearchInstitute, 1947.
40. Benzinger T, Hornberger W, Die Druckfallkrankheit derHohenflieger. No.34. Schriften der deutschen Akademie der Luft-fahrtforschung, 1941.
41. Pilmanis AA, Meissner FW, Olson RM. Left ventricular gas emboliin six cases of altitude-induced decompression sickness. AviatSpace Environ Med 1996;67(11):1092–1096.
42. Piccard J. Aeroemphysema and the birth of gas bubbles. Proc StaffMeet Mayo Clin 1941;16:700–704.
43. Vann R, Gerth WA. Physiology of decompression sickness.Hypobaric decompression sickness. Brooks AFB, Texas: Proceedingsof a workshop at the Armstrong Laboratory, 1992.
44. Vann R. Chapter 11: Mechanisms and risk of decompression. In:Bove AA, ed. Diving medicine. WB Saunders, 1997.
45. Van Liew H. Bubble dynamics. Hypobaric decompression sickness.Brooks AFB, Texas: Armstrong Laboratory, 1992.
46. Kumar KV, Waligora JM, Calkins DS. Threshold altitude resultingin decompression sickness. Aviat Space Environ Med 1990;61(8):685–689.
47. Webb JT, Kannan N, Pilmanis AA. Gender not a factor for altitudedecompression sickness risk. Aviat Space Environ Med 2003;74(1):2–10.
48. Sheffield PJ. Flying after diving guidelines: a review. Aviat SpaceEnviron Med 1990;61(12):1130–1138.
49. Dutka A, Francis TJ. Pathophysiology of decompression sickness.In: Bove AA, ed. Diving medicine. Philadelphia: WBSaunders:1997.
50. Harvey E, Barnes DK, McElroy AH, et al. Bubble formation inanimals: I. Physical factors J Cell Comp Physiol 1944;24(1):1–22.
51. Webb JT, Fischer MD, Heaps CL, et al. Exercise-enhanced pre-oxygenation increases protection from decompression sickness.Aviat Space Environ Med 1996;67(7):618–624.
52. Balldin UI, Lundgren CE. Effects of immersion with the head abovewater on tissue nitrogen elimination in man. Aerosp Med 1972;43(10):1101–1108.
53. Butler B. Cardiopulmonary effects of decompression bubbles.Hypobaric decompression sickness. Brooks AFB, Texas: Proceedingsof a workshop at the Armstrong Laboratory; 1992.
54. Bove AA, Hallenbeck JM, Elliott DH. Circulatory responsesto venous air embolism and decompression sickness in dogs.Undersea Biomed Res 1974;1(3):207–220.
55. Diesel DA, Ryles MT, Pilmanis AA, et al. Non-invasive measure-ment of pulmonary artery pressure in humans with simulatedaltitude-induced venous gas emboli. Aviat Space Environ Med2002;73(2):128–133.
56. Chang JL, Albin MS, Bunegin L, et al. Analysis and comparisonof venous air embolism detection methods. Neurosurgery 1980;7(2):135–141.
57. Khan MA, Alkalay I, Suetsugu S, et al. Acute changes in lungmechanics following pulmonary emboli of various gases in dogs.J Appl Physiol 1972;33(6):774–777.
58. Harvey E, Whiteley AH, McElroy WD, et al. Bubble formation inanimals II. Gas nuclei and their distribution in blood and tissues.J Cell Comp Physiol 1944;24:23–34.
59. Ring GC, Blum AS, Kurbatov T, et al. Size of microspheres passingthrough pulmonary circuit in the dog. Am J Physiol 1961;200:1191–1196.
60. Philp RB. A review of blood changes associated with compression-decompression: relationship to decompression sickness. UnderseaBiomed Res 1974;1(2):117–150.
61. Brubakk A, Vik A, Flook V. Gas bubbles and the lung. In:Lundgren MJ. ed. The lung at depth. Basel: Marcel Dekker Inc,1999.
62. Harding R. DCS-experience outside North America. Hypobaricdecompression sickness. Brooks AFB, Texas: Armstrong Laboratory,1992.
63. Rice G, Anderson D. Altitude DCS following Naval altitudechamber operations (January 1996–October 2000, in AerospaceMedical Association Scientific Meeting, Reno, 2001. Abstract No.66.
64. Weien R Altitude decompression sickness: the US army expe-rience. Hypobaric decompression sickness.. Brooks AFB, Texas:Armstrong Laboratory, 1992.
65. Baumgartner N, Weien RW Decompression sickness due to USAFaltitude chamber exposure(1985–1987). Hypobaric decompressionsickness. Brooks AFB, Texas: Armstrong Laboratory, 1990.
66. Kemper G USAF aircraft operations: DCS-mishaps.Hypobaricdecompression sickness. Brooks AFB, Texas: Armstrong Laboratory,1992.
67. Neubauer JC, Dixon JP, Herndon CM. Fatal pulmonary decom-pression sickness: a case report. Aviat Space Environ Med 1988;59(12):1181–1184.
68. Bendrick GA, Ainscough MJ, Pilmanis AA, et al. Prevalence ofdecompression sickness among U−2 pilots. Aviat Space EnvironMed 1996;67(3):199–206.
69. Haske TL, Pilmanis AA. Decompression sickness latency as afunction of altitude to 25,000 feet. Aviat Space Environ Med 2002;73(11):1059–1062.
70. Davis JC, Dunn JM, Gates GA, et al. Altitude decompressionsickness: hyperbaric therapy results in 145 cases. Aviat SpaceEnviron Med 1977;48(8):722–730.
71. Webb JT, Pilmanis AA. Altitude decompression sickness between6858 and 9144 m following a 1-h prebreathe. Aviat Space EnvironMed 2005;76(1):34–38.
72. Pilmanis AA, Petropoulos LJ, Kannan N, et al. Decompressionsickness risk model: development and validation by 150 prospec-tive hypobaric exposures. Aviat Space Environ Med 2004;75(9):749–759.

C H A P T E R 3 P H Y S I O L O G Y O F D E C O M P R E S S I V E S T R E S S 81
73. Pilmanis AA, Webb JT, Kannan N, et al. The effect of repeatedaltitude exposures on the incidence of decompression sickness.Aviat Space Environ Med 2002;73(6):525–531.
74. Rice GM, Vacchiano CA, Moore JL Jr, et al. Incidence ofdecompression sickness in hypoxia training with and without30-min O2 prebreathe. Aviat Space Environ Med 2003;74:56–61.
75. Pollock NW, Natoli MJ, Gerth WA, et al. Risk of decompressionsickness during exposure to high cabin altitude after diving. AviatSpace Environ Med 2003;74(11):1163–1168.
76. Piwinski S, Cassingham R, Mills J, et al. Decompression sicknessincidence over 63 months of hypobaric chamber operation. AviatSpace Environ Med 1986;57(11):1097–1101.
77. Weien RW, Baumgartner N. Altitude decompression sickness: hy-perbaric therapy results in 528 cases. Aviat Space Environ Med 1990;61(9):833–836.
78. Webb JT, Pilmanis AA, O’Connor RB. An abrupt zero-preoxygenation altitude threshold for decompression sicknesssymptoms. Aviat Space Environ Med 1998;69(4):335–340.
79. Webb JT, Krause KM, Pilmanis AA, et al. The effect of exposure to35,000 ft on incidence of altitude decompression sickness. AviatSpace Environ Med 2001;72(6):509–512.
80. Webb JT, Pilmanis AA, Fischer MD, et al. Enhancement of preoxy-genation for decompression sickness protection: effect of exerciseduration. Aviat Space Environ Med 2002;73(12):1161–1166.
81. Webb JT, Pilmanis AA, Balldin UI. Altitude decompressionsickness at 7620 m following prebreathe enhanced with exerciseperiods. Aviat Space Environ Med 2004;75(10):859–864.
82. Boothby WL, Lovelace WR, Benson OO. Accumulated nitrogenelimination at rest and at work (walking on a treadmill). NRC-report MAYO AERO MEDICAL UNIT USA, Rochester, MNNovember 1940.
83. Hankins TC, Webb JT, Neddo GC, et al. Test and evaluationof exercise-enhanced preoxygenation in U−2 operations. AviatSpace Environ Med 2000;71(8):822–826.
84. Gernhardt M, Conkin J, Foster PP, et al. Design of a 2-hourprebreathe protocol for space walks from the international spacestation. Abstract 43. Aerospace Medical Association 70th AnnualScientific Meeting 2000. Houston, May 14–18, 2000.
85. Webb JT, Pilmanis AA, Balldin UI, et al. Altitude decompressionsickness susceptibility: influence of anthropometric and physio-logic variables. Aviat Space Environ Med 2005;76(6):547–551.
86. Macmillan A. Decompression illness and hyperbaric therapy.In: Ernsting J, Nicholson A, et al. eds. Aviation Medicine.Butterworth-Heinemann, 1999.
87. Motley H, Chinn HI, Odell FA. Studies on bends J Aviat Med1945;16:210–234.
88. Smith H. The effect of anoxia on the incidence of decompressionsickness at 35′000 feet. In: Report to Director of Medical Sciences(Air). Number 2. Regina: Clinical Investigation Unit RCAF, Jan.1943.
89. Smith H, The effect of anoxia on the incidence of decompressionsickness at 35′000 feet. In: Report to Director of medical sciences(Air). Number 2. Regina: Clinical Investigation Unit RCAF, 1943.
90. Burkhardt W, Thometz AF, Ivy AC. The effect of deliberatehyperventilation on the incidence of ‘‘intolerable’’ cases of bendsand chokes. 1944.
91. Hodes R, Larrabee MG. The relation between alveolar carbondioxide tension and susceptibility to decompression sickness. AmJ Physiol 1946;147:603–615.
92. Stewart C, Smith HW, McAlpine HA, et al. The incidence ofdecompression sickness on consecutive daily ascents to 35′000 ft.Number 2. Regina: Clinical Investigation Unit RCAF, 1942.
93. Warwick O. The apparent relationship of fluid balance to theincidence of decompression sickness. Number 2. Regina: ClinicalInvestigation Unit RCAF, 1942.
94. Warwick O. Further studies on the relationship of fluid intakeand output to the incidence of decompression sickness. Number 1.Halifax: Flying personnel Medical Section, ‘‘Y’’ Depot RCAF, 1943.
95. Balldin UI, Pilmanis AA, Webb JT. The effect of simulatedweightlessness on hypobaric decompression sickness. Aviat SpaceEnviron Med 2002;73(8):773–778.
96. Webb JT, Beckstrand DP, Pilmanis AA, et al. Decompressionsickness during simulated extravehicular activity: ambulation vs.non-ambulation. Aviat Space Environ Med 2005;76(8):778–781.
97. Moon R. Patent foramen ovale (PFO) and decompression illnessin space. In Aerospace Medical Association Meeting. Houston, 2000
98. Bove A, Risk of decompression sickness with patent foramenovale. Undersea Hyperb Med 1998;25(3):175–178.
99. Knauth M, Ries S, Pohlmann S, et al. Cohort study of multiplebrain lesions in sport divers: role of a patent foramen ovale. BrMed J 1997;314(7082):701–705.
100. Hagen PT, Scholz DG, Edwards WD. Incidence and size of patentforamen ovale during the first 10 decades of life: an autopsy studyof 965 normal hearts. Mayo Clin Proc 1984;59(1):17–20.
101. United States Navy. United States navy diving manual. NAVSEA0910-LP−708−8000. USN; 1999.
102. Lovelace WR, Gagge AP. Aero medical aspects of cabin pressur-ization for military and commercial aircraft. J Aeronaut Sci 1946;13(3):143–150.
103. Webb JT, Pilmanis AA, Kannan N, et al. The effect of staged decom-pression while breathing 100% oxygen on altitude decompressionsickness. Aviat Space Environ Med 2000;71(7):692–698.
104. Webb J, Pilmanis AA, Balldin U. The effect of a 60 min air breathingbreak during preoxygenation on altitude decompression sicknessrisk. Aerospace Medical Association scientific program. Orlando:Aviation Space & Environmental Medicine, 2006.
105. Golding FC, Griffiths P, Hempleman HV, et al. Decompressionsickness during construction of the Dartford Tunnel. Br J Ind Med1960;17:167–180.
106. Donnell AJ, Morgan CP. Successful use of the recompressionchamber in severe decompression sickness with neurocirculatorycollapse. Aerosp Med 1960;31:1004.
107. Francis J The classification of decompression illness. Hypobaricdecompression sickness. San Antonio, Brooks Air Force Base,Texas: Aerospace Medical Association and Undersea & HyperbaricMedicine Society, 1992.
108. Balldin UI, Pilmanis AA, Webb JT. Pulmonary decompressionsickness at altitude: early symptoms and circulating gas emboli.Aviat Space Environ Med 2002;73(10):996–999.
109. Balldin UI, Pilmanis AA, Webb JT. Central nervous systemdecompression sickness and venous gas emboli in hypobaricconditions. Aviat Space Environ Med 2004;75(11):969–972.
110. Ryles MT, Pilmanis AA. The initial signs and symptoms of altitudedecompression sickness. Aviat Space Environ Med 1996;67(10):983–989.
111. Rudge FW, Stone JA. The use of the pressure cuff test in the diag-nosis of decompression sickness. Aviat Space Environ Med 1991;62(3):266–267.
112. Clark J The neurologic evaluation of decompression sickness.Hypobaric decompression sickness. San Antonio, Brooks Air ForceBase, Texas.: Aerospace Medical Association and Undersea &Hyperbaric Medicine Society, 1992.
113. Rudge FW. Variations in the presentation of altitude-inducedchokes. Aviat Space Environ Med 1995;66(12):1185–1187.
114. Conkin J, Pilmanis AA, Webb JT. Case descriptions and observationsabout cutis marmorata from hypobaric decompressions. NASA, 2002.
115. Macmillan A. Sub-atmospheric decompression sickness. In:Ernsting J, Nicholson AN, Rainford DJ, eds. Aviation medicine.Butterworth-Heinemann, 1999.
116. Hodgson CJ, Davis JC, Randolph CL Jr, et al. Seven year follow-upx-ray survey for bone changes in low pressure chamber operators.Aerosp Med 1968;39(4):417–421.
117. Muehlberger PM, Pilmanis AA, Webb JT, et al. Altitudedecompression sickness symptom resolution during descent toground level. Aviat Space Environ Med 2004;75(6):496–499.

82 P H Y S I O L O G Y A N D E N V I R O N M E N T
118. Downey VM, Worley TW, Hackworth R, et al. Studies on bubblesin human serum under increased and decreased atmosphericpressures. Aerosp Med 1963:116–118.
119. Leverett S, Bitter HL, McIver RG. Studies in decompression sickness:circulatory and respiratory changes associated with decompressionsickness in anesthetized dogs. Brooks Air Force Base, San Antonio,Texas: United States Air Force School of Aerospace Medicine,1963.
120. Krause KM, Pilmanis AA. The effectiveness of ground level oxygentreatment for altitude decompression sickness in human researchsubjects. Aviat Space Environ Med 2000;71(2):115–118.
121. Jooste PL, Wolfswinkel JM, Schoeman JJ, et al. Epileptic-typeconvulsions and magnesium deficiency. Aviat Space Environ Med1979;50:734–735.
122. Webb J. Aerospace physiology reference. USAFSAM, 2007.123. Goodman M, Workman RD. U.S.N.E.D. Unit. AFP 160–5
Chapter 1–5, Minimal recompression oxygen breathing approachto treatment of decompression sickness in divers and aviators.Washington, DC: Government Printing Office, 1965.
124. Catron PW, Flynn ET Jr. Adjuvant drug therapy for decompressionsickness: a review. Undersea Biomed Res 1982;9(2):161–174.
125. Spadaro M, Moon RE, Fracia PJ, et al. Life threateningpulmonary thromboembolism in neurological decompressionillness. Undersea Biomed Res 1992;19:41–42.
126. Moses J, David MT, Stevenson KM, et al Pulmonary embolism asa sequela to neurological decompression sickness. Pressure 1998;28:8–9.
127. Reeves E, Workman RD. Use of heparin for the therapeutic-prophylactic treatment of decompression sickness. Aerosp Med1971;42(1):20–23.
128. Inwood M. Experimental evidence in support of the hypothesisthat intravascular bubbles activate the hemostatic process.Symposium on blood-bubble interactions in decompression sickness.Defence and Civil Institute of Environmental Medicine, 1973.
129. Evans DE, Catron PW, McDermott JJ, et al. Effect of lidocaineafter experimental cerebral ischemia induced by air embolism.J Neurosurg 1989;70(1):97–102.
130. Herren JI, Kunzelman KS, Vocelka C, et al. Angiographic andhistological evaluation of porcine retinal vascular damage andprotection with perfluorocarbons after massive air embolism.Stroke 1998;29(11):2396–2403.
131. Lynch PR, Krasner LJ, Vinciquerra T, et al. Effects of intravenousperfluorocarbon and oxygen breathing on acute decompressionsickness in the hamster. Undersea Biomed Res 1989;16(4):275–281.
132. Novotny JA, Bridgewater BJ, Himm JF, et al. Quantifying theeffect of intravascular perfluorocarbon on xenon eliminationfrom canine muscle. J Appl Physiol 1993;74(3):1356–1360.
133. Spiess BD, McCarthy RJ, Tuman KJ, et al. Treatment of de-compression sickness with a perfluorocarbon emulsion (FC−43).Undersea Biomed Res 1988;15(1):31–37.
134. Stoney WS, Alford WC, Burns GR, et al. Air embolism andother accidents using pump oxygenators. Ann Thorac Surg 1980;29(4):336–340.
135. Pilmanis A. Decompression hazards at very high altitudes. Raisingthe operational ceiling. Brooks AFB, Texas: Proceedings of aworkshop at the Armstrong Laboratory, 1995.
SUGGESTED READINGS
Adler HF. Dysbarism. Aeromedical Review 1B64.. Brooks Air Force Base,Texas: United States Air Force School of Aerospace Medicine, 1964.
Bennett P, Elliotts DH. In: Brubakk A, Neuman T, eds. Physiology andmedicine of diving, 5th ed. Baltimore: WB Saunders, 2002.
Bove AA, Davis JC. Diving medicine, 4th ed. Philadelphia: WBSaunders,2004.
Clamann HG. Decompression sickness. In: Randel HW, ed. Aerospacemedicine. Baltimore: Williams & Wilkins, 1971.
Davis JC, Hunt TK, eds. Hyperbaric oxygen therapy. Bethesda: UnderseaMedical Society, 1977.
Engle E, Lott A. Man in flight: biomedical achievements in aerospace.Annapolis: Leeward Publications, 1979.
Folarin VA. Flight surgeon’s checklist, 6th ed. Society of USAF flightsurgeons, 2000.
Foster PP, Boriek AM, Butler BD. Patent foramen ovale and paradoxicalsystemic embolism: a bibliographic review [Review]. Aviat SpaceEnviron Med 2003;74(6 Pt 2):B1–64.
Fryer DI. Subatmospheric decompression sickness in man. Slough:Technovision Services. The Advisory Group for Aerospace Researchand Development, NATO, 1969.
Gradwell D, Ernsting J. Aviation medicine, 4th ed. Butterworth-Heinemann, 2007.
Gray JS, Mahady SCF, Masland RL. Studies on altitude decompressionsickness III. The effects of denitrogenation. J Aviat Med 1946;17:606.
Green RD, Leitch DR. Twenty years of treating decompression sickness.Aviat Space Environ Med 1987;58:362–366.
Kindwall EP, ed. Hyperbaric medicine practice. Flagstaff: Best PublishingCompany, 1994.
Lundgren CE, Miller JN. The lung at depth. Lung biology in health anddisease. Vol. 132. New York: Marcel Dekker Inc, 1999.
Malconian MK, Rock P, Devine J. Operation Everest II: altitudedecompression sickness during repeated altitude exposure. AviatSpace Environ Med 1987;58:679–682.
Pilmanis AA. Hypobaric decompression sickness. Brooks AFB, Texas:Proceedings of a workshop at the Armstrong Laboratory, 1990.
Pilmanis AA, Petropoulos L, Kannan N. Decompression sickness riskmodel: development and validation by 150 prospective hypobaricexposures. Aviat Space Environ Med 2004;75:749–759.
Pilmanis AA, Sears WJ. Raising the operational ceiling. Brooks AFB,Texas: Proceedings of a workshop at the Armstrong Laboratory,1995.
Saary MJ, Gray JW. A review of the relationship between patentforamen ovale and type II decompression sickness [Review]. AviatSpace Environ Med 2001;72(12):1113–1120.
Surgeon General, USAF. German aviation medicine, World War II. Vols.I and II. Department of the Air Force. US Government PrintingOffice. 1950.
Thalmann ED. Principles of U.S. Navy recompression treatment fordecompression sickness. In: Moon RE, Sheffield PJ, eds. Treatmentof decompression illness. Rockville: Undersea and Hyperbaric MedicalSociety, Proceedings of the forty-fifth Undersea and HyperbaricMedical Society Workshop, 1996.
USAF Aerospace physiology handbook. USAFSAM, AFP 160–5Chapter 1–5, 2007. Access to the ADRAC website: the user canregister at http://biodyn1.wpafb.af.mil/altitude/login/Login.aspx?ReturnUrl=%2faltitude%2fDefault.aspx, and may be granted accessprivileges to the use of the ADRAC model.
Naval Aerospace Medical Institute. Physiology of flight.1991 bubblerelated diseases. United States Naval Flight Surgeon’s Manual, 3rd ed.http://www.vnh.org/FSManual/01/09BubbleRelatedDisease.html.
Ward MP, Milledge JS, West JB. High altitude medicine and physiology,3rd ed. London: Arnold, 2000.
Webb JT, Kannan N, Pilmanis AA. Gender not a factor for altitudedecompression sickness risk. Aviat Space Environ Med 2003;74(1):2–10.
West JB. High life. American Physiological Society, Oxford UniversityPress, 1998.
Wilmshurst P, Edge CJ, Bryson P. Long-term adverse effects of scubadiving. Lancet 1995;346:384.