An estimation of the wire-duct electrostatic precipitator efficiency
Upload
independentCategory
view
0download
0
Author's personal copy
Electrostatic effects on deposition of multiple phospholipid bilayersat oxide surfaces
Timothy A. Oleson a, Nita Sahai a,b,c,d,!, Joel A. Pedersen b,e
aDepartment of Geoscience, 1215 West Dayton Street, University of Wisconsin, Madison, WI 53706, USAb Environmental Chemistry and Technology Program, 680 North Park Street, University of Wisconsin, Madison, WI 53706, USAcMaterials Science Program, 1509 University Avenue, University of Wisconsin, Madison, WI 53706, USAdNASA Astrobiology Institute, 1215 West Dayton Street, University of Wisconsin, Madison, WI 53706, USAeDepartment of Soil Science, 1525 Observatory Drive, University of Wisconsin, Madison, WI 53706, USA
a r t i c l e i n f o
Article history:Received 28 May 2010Accepted 20 August 2010Available online 31 August 2010
Keywords:Supported phospholipid bilayerDipalmitoylphosphatidylcholineOxideSilicaAluminaMultiple bilayersAdsorptionIsotherm
a b s t r a c t
We investigated electrostatic effects on the formation of multiple supported phospholipid bilayers (SPB)by varying the oxide substrate, ionic strength, the presence of divalent Ca2+, and phospholipid (PL) head-group charge. Whereas the current understanding of processes and forces controlling SPB formation isbased primarily on studies involving planar substrates, we report results from experiments usingaqueous suspensions of quartz (a-SiO2) and corundum (a-Al2O3) particles. Using fluorescent dye-loadeddipalmitoylphosphatidylcholine (DPPC) vesicles, we determined that the vesicles underwent oxideparticle-induced rupture and formed supported planar bilayers rather than a supported vesicle layer.Adsorption isotherms of DPPC at pH 7.2 in solutions of varying ionic strength set by NaCl, andwith or with-out 2 mM Ca2+, support our hypotheses that van der Waals forces predominantly account for two DPPCbilayers, and that adsorption beyond the second bilayer occurs at low ionic strength due to extension ofthe electric double-layer near the oxide surface. In contrast, adsorption isotherms of anionic dipalmitoyl-phosphatidylserine (DPPS) and cationic dipalmitoylethylphosphatidylcholine (DPEPC) show thatadsorption of highly charged bilayers is decreased or prevented altogether due to bilayer-oxide and/orbilayer–bilayer repulsion. Results have potential implications for biomedical, industrial, and environmen-tal remediation applications involving SPBs and for proto-cell stability in origin-of-life hypotheses.
! 2010 Elsevier Inc. All rights reserved.
1. Introduction
Oxide-supported phospholipid bilayers (SPBs) have an array ofcurrent and potential applications in studies of cell membrane-re-lated function and dynamics [1–6], as well as in biomedical devicesincluding bilayer-coated micropatterned biosensors and circuits[3,6–8], biocompatibilized implant devices [7,9–11], and advanceddrug-delivery mechanisms [6,12]. Supported multi-bilayers havebeen suggested as appealing alternatives to single SPBs in situa-tions where finer control over membrane composition and/or na-tive membrane fluidity are desired [13]. Supported phospholipidbilayers have also been used as a means of templating controllednano-particle growth [14–16], and may be effective agents in pre-venting biofouling [5], in enhancing oil and ore recovery [17–19],and for passivation of hazardous particles in the environment[20,21]. Furthermore, debate continues on the role of lipid-sub-
strate interactions in determining the fate of inhaled mineral dustsin the body [22–28]; in mediating biomineralization processessuch as production of magnetite in bacteria [29], silica and calcitein diatoms and coccoliths, respectively [30,31], or of pathologicmineralization (e.g., calcium oxalate (kidney stones), calcium pyro-phosphate dihydrate (pseudogout)) in humans [32,33]; and in theevolution of pre-biotic membranes [34–36].
Substantial effort has been made to understand the fundamen-tal characteristics of SPBs including the kinetics and mechanismsof formation following adsorption of vesicles from solution, as wellas membrane structure and dynamics [6,37–39]. Substrate surfacechemistry, charge, and morphology affect membrane propertiessuch as fluidity, permeability, domain formation, asymmetricmolecular distribution across leaflets in mixed bilayers, and ther-motropic behavior [38–57]. Depending on the potential applica-tion, a need exists to investigate mechanisms of vesicle ruptureand SPB formation in particle suspensions, as compared to the pla-nar single-crystal surfaces that have predominantly been used inpast studies. Differences between oxide particles and planar sub-strates of identical chemical composition have been noted for sur-face acid–base reactions and phospholipid vesicle and bilayer
0021-9797/$ - see front matter ! 2010 Elsevier Inc. All rights reserved.doi:10.1016/j.jcis.2010.08.057
! Corresponding author at: Department of Geoscience, 1215 West Dayton Street,University of Wisconsin, Madison, WI 53706, USA. Fax: +1 608 262 0693.
E-mail addresses: [email protected] (T.A. Oleson), [email protected] (N. Sahai), [email protected] (J.A. Pedersen).
Journal of Colloid and Interface Science 352 (2010) 327–336
Contents lists available at ScienceDirect
Journal of Colloid and Interface Science
www.elsevier .com/locate / jc is
Author's personal copy
adsorption [58–60]. Consistent studies that comprehensivelyexamine different particulate substrates and lipids under a rangeof solution conditions are limited.
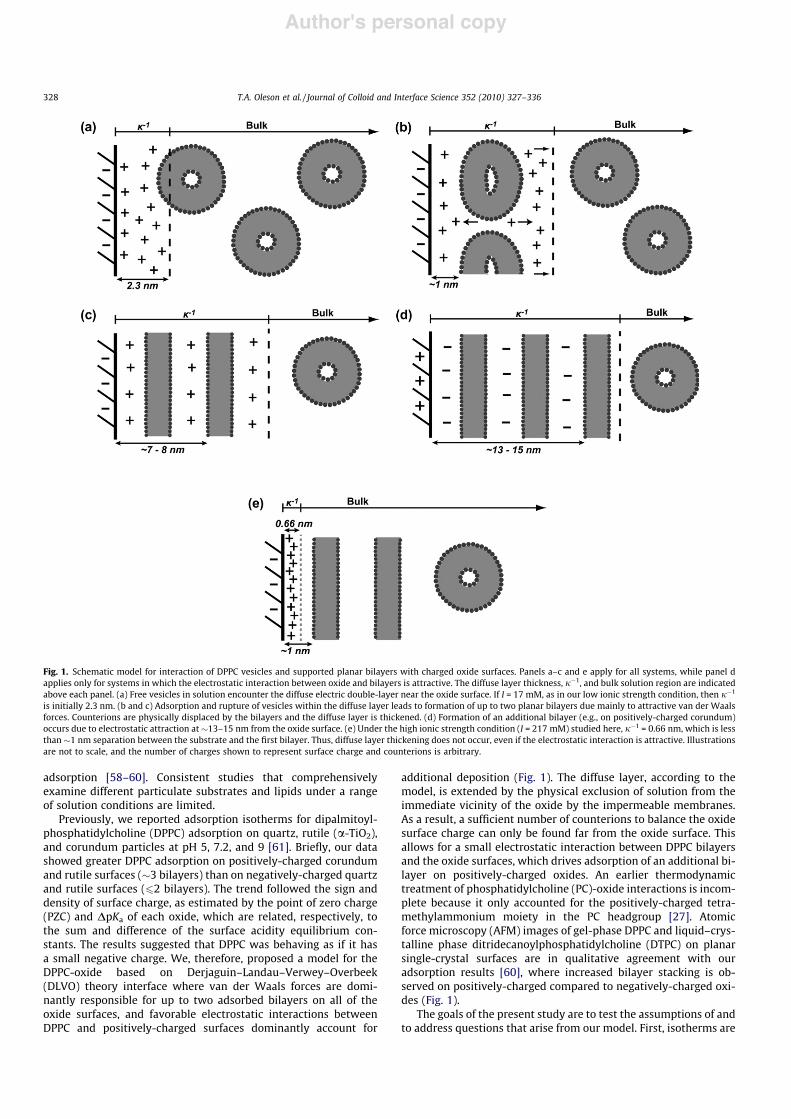
Previously, we reported adsorption isotherms for dipalmitoyl-phosphatidylcholine (DPPC) adsorption on quartz, rutile (a-TiO2),and corundum particles at pH 5, 7.2, and 9 [61]. Briefly, our datashowed greater DPPC adsorption on positively-charged corundumand rutile surfaces (!3 bilayers) than on negatively-charged quartzand rutile surfaces (62 bilayers). The trend followed the sign anddensity of surface charge, as estimated by the point of zero charge(PZC) and DpKa of each oxide, which are related, respectively, tothe sum and difference of the surface acidity equilibrium con-stants. The results suggested that DPPC was behaving as if it hasa small negative charge. We, therefore, proposed a model for theDPPC-oxide based on Derjaguin–Landau–Verwey–Overbeek(DLVO) theory interface where van der Waals forces are domi-nantly responsible for up to two adsorbed bilayers on all of theoxide surfaces, and favorable electrostatic interactions betweenDPPC and positively-charged surfaces dominantly account for
additional deposition (Fig. 1). The diffuse layer, according to themodel, is extended by the physical exclusion of solution from theimmediate vicinity of the oxide by the impermeable membranes.As a result, a sufficient number of counterions to balance the oxidesurface charge can only be found far from the oxide surface. Thisallows for a small electrostatic interaction between DPPC bilayersand the oxide surfaces, which drives adsorption of an additional bi-layer on positively-charged oxides. An earlier thermodynamictreatment of phosphatidylcholine (PC)-oxide interactions is incom-plete because it only accounted for the positively-charged tetra-methylammonium moiety in the PC headgroup [27]. Atomicforce microscopy (AFM) images of gel-phase DPPC and liquid–crys-talline phase ditridecanoylphosphatidylcholine (DTPC) on planarsingle-crystal surfaces are in qualitative agreement with ouradsorption results [60], where increased bilayer stacking is ob-served on positively-charged compared to negatively-charged oxi-des (Fig. 1).
The goals of the present study are to test the assumptions of andto address questions that arise from our model. First, isotherms are
Fig. 1. Schematic model for interaction of DPPC vesicles and supported planar bilayers with charged oxide surfaces. Panels a–c and e apply for all systems, while panel dapplies only for systems in which the electrostatic interaction between oxide and bilayers is attractive. The diffuse layer thickness, j"1, and bulk solution region are indicatedabove each panel. (a) Free vesicles in solution encounter the diffuse electric double-layer near the oxide surface. If I = 17 mM, as in our low ionic strength condition, then j"1
is initially 2.3 nm. (b and c) Adsorption and rupture of vesicles within the diffuse layer leads to formation of up to two planar bilayers due mainly to attractive van der Waalsforces. Counterions are physically displaced by the bilayers and the diffuse layer is thickened. (d) Formation of an additional bilayer (e.g., on positively-charged corundum)occurs due to electrostatic attraction at!13–15 nm from the oxide surface. (e) Under the high ionic strength condition (I = 217 mM) studied here, j"1 = 0.66 nm, which is lessthan !1 nm separation between the substrate and the first bilayer. Thus, diffuse layer thickening does not occur, even if the electrostatic interaction is attractive. Illustrationsare not to scale, and the number of charges shown to represent surface charge and counterions is arbitrary.
328 T.A. Oleson et al. / Journal of Colloid and Interface Science 352 (2010) 327–336

Author's personal copy
ambiguous with respect to the morphology of adsorbed lipid. Wasit, then, reasonable to assume in our previous study that vesiclesruptured upon adsorption to form planar bilayers, rather thanremaining intact to form a supported vesicle layer? The adsorptionof intact vesicles versus planar bilayers was tested by measuringrupture of fluorescent dye-loaded vesicles. We have developed anovel method of calculating ‘‘rupture factors” (R), which providea simple description of vesicle adsorption with rupture (RP 1)versus adsorption of intact vesicles (R = 0) on the oxide particles.
Secondly, if vesicle rupture does occur as assumed in our pro-posed model, do van der Waals and electrostatic interactions ac-count for multiple bilayer adsorption at the large distances(!13–15 nm) expected from the oxide surface? In particular, canwe predictably alter observed multiple DPPC bilayer adsorptionby changing the ionic strength (and thus the electric double-layerthickness), surface charge, and lipid headgroup charge? Electricdouble-layer thickness and surface charge were varied by increas-ing the ionic strength with NaCl and by addition of 2 mM Ca2+,respectively. Divalent alkaline earth cations, particularly Ca2+, arephysiologically and environmentally significant and have beenfound to bind to PC bilayers [62] and promote SPB formation[39]. We predicted that increasing ionic strength would inhibitDPPC adsorption beyond two bilayers on corundum, while additionof Ca2+ would promote additional adsorption on quartz. The effectof net headgroup charge on adsorption was examined by using an-ionic dipalmitoylphosphatidylserine (DPPS) and cationic dipal-mitoylethylphosphatidylcholine (DPEPC), both of which haveidentical hydrocarbon tails to DPPC, with our oxides.
Finally, is it reasonable to suggest that lipid bilayers act to ex-tend the electric double-layer? We address the first and secondquestions experimentally in the present study. In a companionstudy, we address the second and third questions theoreticallyby calculating interaction energies for the same systems studiedhere [63].
2. Experimental
2.1. Materials
Zwitterionic 1,2-dipalmitoyl-sn-glycero-3-phosphocholine(DPPC, C40H80NO8P; Tm = 41.5 "C [64,65]), anionic 1,2-dipalmi-toyl-sn-glycero-3-phospho-L-serine (DPPS sodium salt, C38H73-NO10PNa; Tm = 54 "C [64,66]), and cationic 1,2-dipalmitoyl-sn-gly-cero-3-ethylphosphocholine (DPEPC chloride salt, C42H85NO8PCl;Tm # 42 "C [67,68]) all of >99% purity in chloroform (DPPC, DPEPC)or chloroform:methanol:water (DPPS), were purchased from Avan-ti Polar Lipids, Inc. (Alabaster, AL). The lipids were used withoutfurther purification. N-(2-Hydroxyethyl)piperazine-N0-2-ethane-sulfonic acid (HEPES; pKa # 7.55 at 20 "C; DpH/DT = "0.015 [69])of molecular biology grade was purchased from Fisher Scientific,Inc. (Pittsburgh, PA). Mixed isomers of 5-(and-6-)-carboxyfluores-cein (CF) were purchased from Invitrogen (Carlsbad, CA). Corun-dum (a-Al2O3, !2.5 lm diameter, identified as Al2O3 of 99.7%purity by the supplier, Sigma–Aldrich) and Min-U-Sil# 5 naturalquartz particles (a-SiO2, 1.4 ± 0.15 lm diameter, !98.3% purity,US Silica, Berkeley Springs, WV) were cleaned prior to use by re-peated dialysis against deionized (DI) water. Characterization ofparticles for size, specific surface area, mineral phase, and mor-phology has been described previously [61]. Electrophoretic mobil-ities for quartz particles (ja # 300–1000) were determined at25 "C by laser Doppler velocimetry with phase analysis light scat-tering using a Zetasizer Nano ZS# (Malvern Instruments, Worces-tershire, UK). Zeta (f-) potentials shown in Table 1 werecalculated from the electrophoretic mobilities using the Smolu-chowski approximation, and are the means of at least four mea-
surements. Reproducible f-potentials for the corundum particlescould not be obtained due to rapid sedimentation of the particles,although previous studies have reported values in the vicinityof +20 mV at pH 7.2 [70,71], consistent with a PZC of !8–9[59,70]. All other reagents (ACS grade or higher) were purchasedfrom either Fisher or Sigma–Aldrich (St. Louis, MO). Water usedin these experiments was purified with a Barnstead Nanopure Dia-mond# system (Dubuque, IA) to a resistivity of 18.2 MX-cm.
2.2. Vesicle solution preparation
Buffer solutions containing 50 mM HEPES were prepared andadjusted to pH 7.2 at ambient temperature (!22 "C) with 1 MNaOH, giving an ionic strength of 17 mM. At 55 "C, the measuredpH of this buffer was 6.7, in agreement with DpH/DT = "0.015[69]. Appropriate concentrations of NaCl (200 mM) or CaCl2(2 mM) were added as necessary to create the high ionic strengthand Ca2+-bearing solutions. Electrolyte concentrations are providedin Table 2.
Glassware used in the preparation of vesicle solutions was pre-treated with Sigmacote# (Sigma–Aldrich), a silanizing reagent thatproduces a hydrophobic film on glass, to minimize lipid loss to theglass surface. Necessary volumes of lipid were dispensed into glassvials, and solvent (chloroform) was removed under a light nitrogenflow to create a thin film on the inside of the vial, followed by con-tinued drying under vacuum for >2 h. In the case of DPPS, the vialwas gently heated while under a nitrogen flow to drive off water inthe solvent. Dried lipid was rehydrated with buffer, heated in awater bath at 55–65 "C (i.e., above the gel–liquid crystalline, Lb–La, phase transition temperature, Tm, for the lipid in use) with occa-sional vortexing, and stored at 0 "C for no more than one week.
Prior to use, lipid solutions were heated above Tm in the samemanner as above and bath-sonicated to maximum clarity to pro-duce small unilamellar vesicles (SUV). Following sonication, thesolutions were centrifuged at ambient temperature for 1 h at30,000g to remove excess multilamellar structures. The SUV-con-taining supernatant was then pipetted off for use. Average vesiclesizes (Table 2) were measured at 25 "C by Dynamic Light Scatteringusing a Zetasizer Nano ZS#. Vesicle f-potentials (Table 1, ja # 8–30) were determined as above for quartz particles.
2.3. Adsorption isotherms
Batch adsorption experiments were conducted in triplicate asfollows. Oxide suspensions were prepared by adding 650 lL of buf-fer to polypropylene microcentrifuge tubes containing knownmasses of oxide, followed by brief vortexing and sonicating to dis-perse the particles. Vesicle solutions of varying concentration wereproduced by dilution of a stock solution with additional buffer. Ali-quots of a given diluted vesicle solution (250 lL) were added tonine microcentrifuge tubes containing either 650 lL of an oxidesuspension (3$, ‘‘samples”) or 650 lL of buffer alone (6$,‘‘blanks”). The total volume in each tube was 900 lL, particle load-ing was 1–3 mgmL"1, and initial PL concentrations ranged from 0
Table 1Zeta potentials measured for quartz particles and vesicles.a
Oxide/vesicle f-Potential (mV)
Low I Low I + Ca2+ High I High I + Ca2+
Quartz "42 ± 1.7 "39 ± 3.2 "25 ± 1.9 "26 ± 2.2DPPC "0.37 ± 1.6 11 ± 3.4 "2.3 ± 1.6 4.0 ± 0.12DPPS "51 ± 5.1DPEPC 76 ± 6.0
a Reproducible f-potentials were not obtained for corundum. See Section 2.1 ofthe text for explanation.
T.A. Oleson et al. / Journal of Colloid and Interface Science 352 (2010) 327–336 329

Author's personal copy
to !1.2 mM (!0.9 mg mL"1). Tubes were capped, vortexed thor-oughly, and placed in a water bath at 11–14 "C above Tm for 12–24 h (tubes containing DPPC and DPEPC were heated to 55 "C;tubes containing DPPS were heated to 65 "C). One hour has previ-ously been shown to be sufficient for achieving equilibrium for PCon silica [72,73]. During this time, the tubes were removed fromthe bath at least once to be re-vortexed and cooled to room tem-perature (i.e., temperature-cycled) before being returned to thebath. Following final removal from the bath, the tubes were cooledfor !30 min before the samples and three of the six blanks werecentrifuged at room temperature for 1 h at 24,000g. Finally, super-natants were collected, and triplicate aliquots (50 lL) of all sam-ples and blanks were assayed for [PL] using a method in whichphosphorous, released from the PL by acid digestion, is complexedwith molybdate and detected at k = 797 nm with a UV–vis spectro-photometer (UV-Mini 1240#, Shimadzu Corp., Kyoto, Japan), as de-scribed previously [61,74].
From the above procedure, we obtained values for the initialphospholipid concentration prior to interaction with the oxide([PL]initial blank (ib), aqueous (aq)), the concentration remaining in thesupernatant following interaction and centrifugation ([PL]final (f),
aq), as well as the concentration remaining in the supernatant fol-lowing centrifugation but without interaction ([PL]centrifuged blank
(cb), aq). The concentration of PL adsorbed ([PL]ads) was calculatedas:
%PL&ads ' %PL&cb; aq " %PL&f ;aq (1)
The quantity [PL]cb, aq was used instead of [PL]ib, aq in Eq. (1) to ac-count for non-adsorbed lipid that was sedimented from suspensionduring centrifugation. Values of [PL]ads were then normalized to theavailable oxide surface area (i.e., mass of oxide used $ oxide specificsurface area), to obtain isotherms in terms of amount of PL adsorbed(in lmol m"2) versus the equilibrium PL concentration ([PL]equilib-rium (eq), aq) in solution, where
%PL&eq; aq ' %PL&ib; aq " %PL&ads (2)
In the following adsorption isotherm figures, curves drawnthrough the data are box-averaged fits (where the value at a givenpoint is averaged with the two preceding and two followingpoints), and are shown only to guide the reader’s eye. Error esti-mates are made based on triplicate PL assay of each of three exper-imental replicates for a given [PL]ib, aq. Error bars shown indicateone standard deviation and are determined by calculating errorpropagation through Eq. (1). As with [PL]ads, the error estimatesare normalized to the available oxide surface area. Thus, the errorsare inversely proportional to the total surface area, typically result-
ing in larger apparent errors for the corundum particles, whichhave a smaller measured BET specific surface area (1.17 m2 g"1)than do the quartz particles (6.04 m2 g"1).
2.4. Fluorescence experiments
Oxide-induced rupture of DPPC vesicles was determined bycomparing the fluorescence of CF-loaded vesicle solutions beforeand after interaction with oxide particles for [DPPC]eq, aq = !0.05and 0.7 mM. The technique relies on the fluorescence self-quench-ing (FSQ) behavior of CF, where fluorescent emission at high con-centration is markedly reduced compared to emission at lowconcentration [75,76]. Hence, a large increase in fluorescent inten-sity is observed when CF-loaded vesicles rupture and release theircontents into the bulk solution. Two sets of experiments were con-ducted, one of which was heated to 55 "C (i.e., above Tm = 41.5 "C)for 15 min and then allowed to cool, whereas the other set was leftat room temperature (!22 "C) without cycling through the transi-tion temperature. The amount of adsorbed DPPC was also deter-mined as in the batch experiments described above (Section 2.3).A detailed description of the experimental procedure (Section S1)and the formalism for calculation of rupture factors (Section S2)are provided in the Supporting information.
3. Results and discussion
3.1. Rupture versus intact adsorption of vesicles
We had assumed in our previous work that DPPC vesicles rup-tured and formedmultiple planar bilayers at oxide surfaces (Fig. 1).This was a reasonable assumption given that the adsorption pla-teaus corresponded to multiples of the expected single bilayer cov-erage [61]. Our assumption was also supported by AFM imagesshowing planar bilayers of DPPC and DTPC on single-crystal planaroxide surfaces [60]. Furthermore, cycling through Tm is an inherentpart of our experimental protocol for measuring adsorption iso-therms, and previous studies have reported increased rupture ofdimyristoyl-PC (DMPC), mixed DMPC/DPPC, and palmitoyloleoyl-PC (POPC) vesicles on SiO2 with increasing temperature and/or attemperatures above Tm [38,77]. However, intact vesicle adsorptionhas been observed on TiO2 under experimental conditions similarto those under which rupture occurs on SiO2 [78,79]. Based onour adsorption isotherms alone, therefore, we could not rule outthe possibility that intact DPPC vesicles adsorbed, forming a sup-ported vesicle layer which would change the interpretation ofthe isotherms and, consequently, our model. The fluorescence
Table 2Solution conditions and corresponding vesicle sizes.
Lipid Solution conditions (mM)a 1/je (nm) Average vesicle hydrodynamicdiameterf (nm)
Polydispersityf
[Na+] [Ca2+] [HEPES"]b [Cl"] Ic
DPPC ‘‘Low I” 17 0 17 0 17 2.3 44.2 0.236‘‘High I” 217 0 17 200 217 0.66 39.0 0.237‘‘Low I + Ca2+” 17 2 17 4 23 2.0 37.0 0.151‘‘High I + Ca2+” 217 2 17 204 223 0.65 39.5 0.181
DPPS 17 0 17 0 17d 2.3 37.7 0.218
DPEPC 17 0 17 0 17d 2.3 47.0 0.334
a All solutions prepared to pH 7.2 (at !22 "C) in 50 mM HEPES.b [HEPES"] calculated based on pH 7.2 and pKa, HEPES # 7.55.c Ionic strength, I = (!)Ri(ciz2i ), where ci and zi are the concentration and valence of the ith ion, respectively.d DPPS and DPEPC solutions contain additional Na+ and Cl", respectively, equimolar to the lipid concentration in each solution. These additional portions are small
(6!1.2 mM) and thus have been neglected in the calculation of I.e Calculated assuming e = ewater # 80.f Z-average hydrodynamic diameters and polydispersities are means of three separate measurements. Polydispersity is defined here as r2/Z2
D , where r is the standarddeviation about the Z-average hydrodynamic diameters, ZD.
330 T.A. Oleson et al. / Journal of Colloid and Interface Science 352 (2010) 327–336

Author's personal copy
experiments in the current work were designed to address this as-pect of our model.
The effects of temperature cycling through Tm and of DPPC con-centration on vesicle rupture and the amount of DPPC adsorbed,determined using CF-loaded vesicles, are reported in Table 3. Ofthe eight conditions examined, rupture factors fall within the idealrange of 0 (adsorption as intact vesicles) to 1 (all adsorbed DPPC isfrom ruptured vesicles) for only two conditions. Values of R > 1indicate oxide-induced rupture not only of adsorbed vesicles butalso of additional vesicles that do not remain adsorbed to the oxidesurface, whereas R < 0 has no logical physical meaning and is thustreated as equivalent to zero (see Supporting information,Section S2).
The most important observation from Table 3 is that, for allcases, the rupture factor is larger when the temperature is cycledthrough the La–Lb phase transition. The rupture factor increasesby !1.5 $ for quartz, compared to greater than 4$ for corundum.Increased rupture occurs with passage through Tm, possibly be-cause of the coexistence of liquid–crystalline and gel-phase lipiddomains when T # Tm. The boundaries between these domainsare unstable due to differences in acyl chain packing [80], and lipidmembranes typically show increased permeability during phasetransitions and at boundaries between distinct phases [80–82].Decreasing membrane rigidity [77] and increasing vesicle-oxidecontact area with increasing temperature [45] may also be respon-sible for inducing vesicle rupture.
Interestingly, R > 1 under all conditions for quartz, indicatingthat vesicle rupture occurs regardless of DPPC concentration andwhether the temperature is cycled or not. The presence of the sur-face alone is, thus, enough to induce vesicle rupture on quartz,even in the gel-phase. Again, though, rupture is enhanced whenthe temperature is cycled. Vesicle rupture is interpreted, therefore,as a cooperative effect of temperature cycling and the presence ofthe quartz particles.
For corundum, the degree to which rupture increases with tem-perature depends on DPPC concentration. With temperature cy-cling through Tm at low DPPC concentration, R changes from !0to >1, indicating a complete reversal from adsorption of intact ves-icles. At higher concentration, R changes from 0.2 to 0.8, represent-ing partial but increasing degree of rupture. Thus, gel-phase DPPCvesicles show little tendency to rupture on corundum, and cyclingof the temperature above Tm is necessary to induce significant rup-ture. These results are represented schematically in Fig. 2.
The reasons for the difference in DPPC behavior on quartz andcorundum with regard to vesicle rupture are unclear at present.One possibility is the morphology of the quartz versus the corun-dum particles (see Supporting information, Section S3). The quartzparticles are a crushed natural sample with sharp, angular edges. Incontrast, the corundum particles are synthetic, with mostly flatsurfaces and smooth edges. The sharp edges of the quartz particlesmay induce rupture more effectively (particularly during, e.g., vor-texing) than the smooth edges of the corundum particles. Crushingof quartz particles is also known to generate surface free radicalsthat can induce lipid peroxidation [83,84], potentially leading to
rupture. Finally, it is possible that differences in the hydrophilicityof the two oxides may affect vesicle rupture. Quartz has a smallerdielectric constant than corundum and is, thus, a slightly lesshydrophilic oxide [27,85]. Previous work has suggested that mixedhydrophilic/hydrophobic surfaces effectively induce vesicle rup-ture [86,87]. Our results are in agreement with past work showingsimilar behavior of PC on these oxides [37,38,51,88–91]. Clearly,the two oxides affect vesicle/membrane stability differently, andthe nuances of this cooperative effect deserve further study.
We have also considered the potential effects of the CF-dye re-leased from the ruptured vesicles on the adsorption isotherms. Weseparately determined that CF adsorbs on the corundum particlesin the absence of DPPC at both low and high [CF]aq, and on quartzat high [CF]aq at pH 7.4 (see Supporting information, Section S4). Atthe experimental pH = 7.4, the dominant CF species in solution isthe trivalent anion [75]. The tri-anion can evidently adsorb bymeans other than electrostatic bonding, such as covalent and/orhydrogen bonding, explaining the affinity of CF for both oxides athigh [CF]aq (Fig. S2). Comparison of the amounts of DPPC adsorbedwith or without CF present indicates that adsorption is reduced oncorundum in the presence of CF at both DPPC concentrations andon quartz at the higher concentration (Fig. 3). The decrease in DPPCadsorption in the fluorescence experiments is, thus, consistentwith CF adsorption on the oxide surfaces and increased electro-static repulsion between DPPC and the particles.
Table 3Adsorption of DPPC and rupture factors from fluorescence experiments.
Oxide Uncycled Cycled w/o CFa
[DPPC]eq, aq (mM) Adsorption (lmol m"2) Rupture factor, R Adsorption (lmol m"2) Rupture factor, R Adsorption (lmol m"2)
Quartz 0.04 5.2 ± 0.2 2.2 5.1 ± 0.2 3.6 !6.50.7 4.8 ± 0.2 2.2 5.7 ± 0.3 3.1 !10
Corundum 0.07 3.0 ± 0.3 "0.2 3.7 ± 0.3 1.4 !60.7 4.9 ± 0.7 0.2 5.7 ± 0.7 0.8 !14
a ‘‘w/o CF” refers to DPPC adsorption on the oxides in the absence of CF under the analogous low I (I = 17 mM) condition. Values in this column are estimated based on thedata in Fig. 3a.
Fig. 2. Schematic summary of fluorescence experiments and rupture tendencies atboth [DPPC]eq, aq investigated. Interaction with quartz particles causes rupture ofDPPC vesicles both when vesicles are cycled through Tm (a) as well as when they areleft in the gel-phase (T < Tm; not cycled) (b). In comparison, vesicles rupture in thepresence of corundum only when they are cycled through Tm (c), but adsorb asintact vesicles when left in the gel-phase (d). Approximate rupture factors, R, areshown for each scenario. Green-filled vesicles indicate that CF cargo is still present,while empty vesicles denote rupture of additional, non-adsorbed vesicles (impliedby R > 1). Illustrations are not to scale.
T.A. Oleson et al. / Journal of Colloid and Interface Science 352 (2010) 327–336 331

Author's personal copy
In summary, despite some limitations, the rupture factors pro-vide a first-order indicator of oxide-induced vesicle rupture. Ourresults confirm the interpretation of our isotherms as representingpredominantly stacked bilayers.
3.2. Model of the DPPC-oxide interface
Our proposed DLVO theory-based model for the DPPC-oxideinterface (Fig. 1) suggested that up to two bilayers adsorbed at con-centrations greater than !0.5 mM due to van der Waals attractionpredominantly, regardless of oxide surface charge, and that addi-tional bilayer(s) adsorbed depending on the favorability of theelectrostatic interaction. There is also a strong, but short-range(!1–3 nm), hydration force that likely arises from repulsion ofadjacent solvated surfaces, as well as from steric repulsion due tothermal motion of the bilayers [92–94]. At small oxide-bilayer(and bilayer–bilayer) separations, it is the balance of the repulsivehydration and attractive van der Waals interactions that leads tothe existence of a thin water layer between an oxide surface anda supported bilayer or between two bilayers. In this way, the
hydration interactions undoubtedly contribute in our systems,although they are not expected to play a determining role in multi-ple SPB deposition at an oxide surface according to our model.
Assumption of an electrostatic component in the DPPC-oxideinteraction may appear counterintuitive due to the net neutralcharge on the zwitterionic PC headgroup (Fig. 4a). We justify itbased on our prior observation of decreasing maximum adsorptionwith increasing negative oxide surface charge (and of greateradsorption on positively-charged rather than negatively-chargedoxides) [61], implying that DPPC bilayers behave as if they are, atleast slightly, negatively-charged. The origin of this charge, per-haps due to minor acidic impurities in the purchased DPPC stock[95], is uncertain, but it is consistent with slightly negative f-potentials for PC vesicles under similar conditions that are often re-ported in the literature [95–101]. Furthermore, we measured zetapotentials for DPPC vesicles under the low and high ionic strengthconditions of "0.37 ± 1.6 mV and "2.3 ± 1.6 mV, respectively(Table 1).
Assuming reasonable estimates of !5 and !1–2 nm for bilayerand water interlayer thicknesses [102], respectively, the electro-static interaction would have to occur over a substantial distanceof !13–15 nm to potentially explain deposition of a third bilayer(Fig. 1). We proposed, therefore, that the impermeable bilayersphysically displace electrolyte solution as they are successively ad-sorbed near the oxide surface. This effectively extends, or thickens,the diffuse counterion layer (and, hence, the electrostatic interac-tion) out to distances where the oxide surface charge is eventuallybalanced. The Debye length, j"1, defines the thickness of the dif-fuse layer away from a charged particle, and is given by,
j"1 '
Piniz2i e
2
ee0kT
0
B@
1
CA
"1=2
(3)
Fig. 3. Adsorption of DPPC from free vesicle solution on quartz or corundumparticles in 50 mM HEPES at pH 7.2 under different electrolyte conditions: (a) low I,(b) high I, and (c) low I + 2 mM Ca2+. See Table 2 for detail of electrolyte conditions.Fit lines are shown to guide the eye. Adsorption measured in fluorescenceexperiments on quartz (dark green) and corundum (light green) are also presentedfor both cycled (solid symbols) and uncycled (open symbols) conditions in panel a.Single DPPC bilayer coverage is estimated to be !5–6 lmol m"2.
Fig. 4. Adsorption of DPPC from free vesicle solution under low I (I = 17 mM), high I(I = 217 mM), low I + 2 mM Ca2+ (I = 23 mM), or high I + 2 mM Ca2+ (I = 223 mM,quartz only) conditions in 50 mM HEPES at pH 7.2 on (a) quartz or (b) corundumparticles. See Table 2 for detail of electrolyte conditions. Fit lines are shown to guidethe eye. The chemical structure of DPPC is shown in panel a.
332 T.A. Oleson et al. / Journal of Colloid and Interface Science 352 (2010) 327–336

Author's personal copy
where ni is the number density concentration of ion i, z is the va-lence of ion i, e is the electronic charge, e0 is the permittivity of freespace, e is the dielectric constant of the medium, k is the Boltzmannconstant, and T is absolute temperature. For such extension to oc-cur, though, the initial diffuse layer must be thicker than the!1 nm separation [44,51,103,104] that exists between the first ad-sorbed bilayer and the oxide surface. Based on the low ionicstrength conditions in our previous work and in this study, diffuselayer thicknesses of !2–3 nm were predicted from Eq. (3) (Table 2;also, Table 2 in Ref. [61]). If the initial diffuse layer thickness is lessthan the separation between the first bilayer and the oxide (Fig. 1e),no counterions will be displaced and the electrostatic interactionwill not be extended. This is the scenario in the case of the high io-nic strength condition here (j"1 = 0.66 nm; Table 2). A theoreticalfoundation for these hypotheses based on extended-DLVO theoryis presented in the companion study [63] to this work.
3.3. Effect of varying ionic strength on DPPC adsorption
In this study, we tested the assumptions of the proposed model,by measuring adsorption isotherms of DPPC on quartz and corun-dum at pH 7.2 at different electrolyte conditions that would affectthickness of the diffuse layer as well as oxide and bilayer surfacecharge. In particular, we compare maximum observed adsorptionfrom isotherms on the oxides at low ionic strength (I = 17 mM),high ionic strength (I = 217 mM), low ionic strength with 2 mMCa2+ (I = 23 mM), and high ionic strength with 2 mM Ca2+
(I = 223 mM) (Fig. 3; Table 2). The isotherms are replotted inFig. 4 in order emphasize the effects of solution conditions for eachoxide. Surface coverage of a bilayer is calculated based on DPPChead group size. Values of 0.57 nm2 and 0.64 nm2 per moleculehave been reported in the liquid–crystalline (La) phase [102,105],whereas typical values for the gel (Lb) phase are !0.48–0.52 nm2
[102]. Given this variation, and allowing for incomplete coverageor defects (i.e., <100% surface coverage by bilayers), we estimatethat !5–6 lmol m"2 corresponds to one bilayer coverage.
The low I condition (I = 17 mM; Fig. 3a), with j"1 = 2.3 nm (Eq.(3), Table 2), is the reference system for the current study, onwhich our proposed model is largely based. Results obtained hereare consistent with prior data for the same oxide particles undersimilar solution conditions [61]. Adsorption on both quartz andcorundum reaches !8–10 lmol m"2 with [DPPC]eq, aq # 0.5 mM(Fig. 3a). Whereas no additional adsorption occurs on quartz abovethis concentration, DPPC adsorbs on corundum up to !15–18 lmol m"2 at [DPPC]eq, aq # 1.0 mM (Fig. 3a). As expected, theobserved maximum coverages indicate roughly two stacked bilay-ers on negatively-charged quartz and three on positively-chargedcorundum. The quartz data suggest that the van der Waals attrac-tion is strong enough to account for deposition of two DPPC bilay-ers despite a repulsive electrostatic interaction, but it is not strongenough to account for a third bilayer. Considering the magnitudefor the van der Waals interaction between quartz or corundumand DPPC is expected to be similarly small at the separation dis-tance between either oxide and a third bilayer (!13–15 nm)1
[63], the observed difference in adsorption attests to the determin-ing role of the electrostatic interaction in these systems as explainedabove.
At high I = 217 mM, the diffuse layer (j"1 = 0.66 nm; Eq. (3), Ta-ble 2) is compressed relative to the reference low I condition, and isless than the expected !1 nm separation distance between the firstbilayer and the oxide (Fig. 1e). We, therefore, predicted depositionof two bilayers on both oxides because the prerequisite for diffuselayer thickening in our model was not satisfied. In agreement withthis prediction, the maximum adsorption observed on both oxideswas !8–10 lmol m"2 at [DPPC]eq, aq P 0.8 mM (Fig. 3b). Compres-sion of the diffuse layer, and, thus, attenuation of the electrostaticinteraction, had little apparent effect in the quartz system (Fig. 4a)because adsorption was already limited to the two bilayers ac-counted for by van der Waals attraction. Adsorption on corundum,however, is decreased by roughly one bilayer at high I compared tolow I (Fig. 4b) due to the attenuation. Although the electrostaticinteraction in this system is still attractive and contributes toadsorption of up to two DPPC bilayers, it is evidently not strong en-ough to account for an additional bilayer due to the diffuse layercompression.
3.4. Effect of Ca2+ on DPPC adsorption
With 2 mM Ca2+ added to the low I buffer (I = 23 mM), we ex-pected an increase in DPPC adsorption on quartz due to a reversalin the electrostatic interaction from repulsive to attractive or, atleast, reduced repulsion. Previous studies have shown that mMconcentrations of Ca2+, as was investigated here, typically promotevesicle rupture and accelerate bilayer formation on substrates suchas SiO2 and mica [39,77]. Under our low I + Ca2+ conditions,j"1 = 2.0 nm (Table 2) is thicker than the !1 nm water layer, sowe predicted that a reversed electrostatic interaction would leadto adsorption of three bilayers on the quartz particles. The maxi-mum observed coverage is !13–15 lmol m"2 at [DPPC]eq,aq P 0.8 mM (Figs. 3c and 4a). The range of this coverage estimateindeed indicates adsorption of significant portions of or a completethird bilayer. The maximum adsorption observed is also notablyincreased under this condition compared to the reference low Icondition without Ca2+ (Fig. 4a). Our measured f-potential forquartz particles at low I without Ca2+ was "47 ± 1.7 mV, comparedto "39 ± 3.2 mV with Ca2+ (Table 1). Thus, the potential becameless negative with the addition of 2 mM Ca2+, but it did not reverse,consistent with previous work [92,106–108]. A positive f-potentialof 11 ± 3.4 mV was measured for DPPC vesicles at low I with Ca2+
(Table 1), also consistent with previous studies [99,109,110], dueto binding of Ca2+ to the phosphate moiety in the PC headgroup[62,111–114]. Thus, adding Ca2+ reversed the electrostatic interac-tion, leading to additional DPPC adsorption on quartz ashypothesized.
If Ca2+ binding to DPPC leads to a positive vesicle potential, thenwe might also expect to see a decrease in adsorption on corundumto two bilayers due to the reversed electrostatic interaction. Athigh DPPC concentration (>!0.7 mM), the error bars on the dataoverlap with those of the high I (i.e., two bilayers), as expected,but also with the reference low I (i.e., three bilayers) system(Figs. 3c and 4b), so a conclusive interpretation is not possible.Overlap with the reference case could be explained if Ca2+ ionsare only weakly bound to DPPC and are expelled from the interfa-cial region by repulsion from the positively-charged corundumsurface, resulting in DPPC behavior similar to the reference case.An analogous Ca2+ expulsion phenomenon has been reported foradjacent DPPC bilayers as they were brought into close proximity[111,112].
Finally, in the system with 2 mM Ca2+ at high ionic strength, thediffuse layer is compressed to j"1 = 0.65 nm (Table 2). Thus,despite the attractive electrostatic interaction between quartzand DPPC, adsorption of only two bilayers was expected, andwas indeed observed (Fig. 4a). Corresponding data for corundum
1 Hamaker constants of !6 $ 10"21 J and !8.5 $ 10"21 J, respectively, were calcu-lated for the interaction of DPPC with quartz or corundum across the low ionicstrength buffer studied here (see Ref. [63]). The van der Waals interaction for DPPC-buffer-corundum is, thus, expected to be of greater magnitude than that for DPPC-buffer-quartz at short separation distances. However, the difference between themagnitudes decreases with increasing oxide-bilayer separation distance, and at thedistance of a third bilayer the difference is negligible.
T.A. Oleson et al. / Journal of Colloid and Interface Science 352 (2010) 327–336 333

Author's personal copy
are omitted due to large errors that preclude worthwhileinterpretation.
Note that we previously presented adsorption isotherms forDPPC on quartz and corundum in a high ionic strength solutioncontaining both 107 mM NaCl and 2 mM Ca2+, which indicatedcontinuously increasing adsorption on both oxides with increasing[DPPC]eq, aq [61]. Our earlier data, however, did not include theterm [PL]cb, aq discussed in Section 2.3. While this makes little dif-ference at low ionic strength, the effect is significant in the pres-ence of Ca2+ due to increased aggregation and sedimentation ofDPPC during centrifugation. We conclude, therefore, that our pre-viously published isotherms at high [NaCl] and 2 mM Ca2+ (Fig. 3in Ref. [61]) were incorrect in that apparent amounts of DPPC ad-sorbed are spuriously high.
In summary, with the exception of one experiment (highI + Ca2+ on corundum; results not shown) where the uncertaintiesassociated with measurements were too large to draw meaningfulconclusions, our results for the remaining seven experimentsabove yielded results that are in agreement with modelexpectations.
3.5. Multiple DPPC bilayer formation
Multiple DPPC bilayers were observed to form at [DPPC]eq,aq > !0.6 mM on quartz and corundum particles under all solutionconditions studied here. Most SPB studies involving PC, however,have reported only a single bilayer on oxide substrates. The maindifference between our studies and most others is the use of partic-ulate oxides versus planar oxide supports. Partial and whole sec-ond PC bilayers on planar oxide substrates have been reportedpreviously [13,52,60,115,116], although these have most oftenbeen deposited manually using Langmuir–Blodgett and/or Lang-muir–Schaeffer techniques [13,115,116]. The effects of substratemorphology on the number of bilayers deposited are of ongoinginterest to us. One possible explanation is that the three-dimen-sional morphology of a particle allows multiple bilayers to formvia vesicle deposition because the bilayers can wrap around the en-tire particle, thereby forming enclosed stable supported bilayers.The two-dimensional planar substrates used in most studies (e.g.,Refs. [37,39,77,89,103,117]) do not allow similar enclosed bilayersto form, so stacked bilayers could be more easily dislodged by per-turbations in the experimental system due to, for example, solventflushing. In earlier work, we obtained adsorption isotherms at pH7.2 for liquid–crystalline phase DTPC (Tm = 14 "C) on the sameoxide particles studied here, as well as images of adsorbed DTPC(and DPPC) bilayers on corresponding planar oxide substrates byAFM [60]. The DTPC isotherms showed similar results to our DPPCresults presented here and previously [61]. Multiple DTPC andDPPC bilayer stacking was observed on corundum by AFM,whereas only a single bilayer (or single bilayer patches) was ob-served on the remaining substrates studied (SiO2 glass, rutile,and mica), all of which were negatively-charged [60]. Thus, thetrend of increased PC adsorption with decreasing negative oxidesurface charge was consistent, regardless of the substratemorphology.
Only a few other studies of phospholipid adsorption on similaroxide particles have been presented. Bayerl and Bloom reportedformation of single DMPC bilayers on 1.5 lm glass beads in waterwithout added salt for lipid concentrations corresponding to[DPPC]eq, aq # 0.1–0.2 mM [118]. The interaction time of the vesi-cles and beads was only 60 s in their experiments, which is perhapsnot long enough to allow for multiple bilayer deposition. Even so,their results do not differ greatly from ours for DPPC adsorptionon quartz particles, which are most comparable to their glassbeads. Figs. 3 and 4 show that adsorption increases roughly fromone to two bilayers on quartz between [DPPC]eq, aq # 0.1 and
0.2 mM. More recently, Mornet et al. imaged single dioleoyl-PC(DOPC) and POPC bilayers adsorbed on silica nanoparticles (meandiameter = 110 nm) at pH 7.4 and 150 mM NaCl with an initial li-pid concentration of !0.06 mM [51]. This observation is in agree-ment with our isotherms, which indicate only a single DPPCbilayer adsorbed at such low PC concentration (Figs. 3 and 4). Workby Carmona-Ribeiro and co-workers investigating DPPC adsorptionon silica nanoparticles over a small pH range (6.4–8.2) [72], andover a range of ionic strengths (0–150 mM NaCl) at pH 6.3 [119]yielded isotherms of similar shape to those presented here.Adsorption may have been underestimated in their studies dueto aggregation of their Aerosil OX-50 particles (mean diame-ter = 50 nm). Aggregation would decrease the silica surface areaavailable for DPPC adsorption relative to the measured particleBET surface area used for surface area normalization, thus leadingto aberrant depression of the isotherms. We have previously ob-served such behavior with Aerosil OX-50 and Aerosil 200 particles(unpublished data). In all cases, their isotherms still indicatedadsorption of greater than one bilayer at [DPPC]eq, aq > !0.1 mM,in agreement with our work, although no detailed explanationwas offered [72,119].
3.6. Effect of varying headgroup charge on phospholipid adsorption
Adsorption isotherms of anionic DPPS and cationic DPEPC onquartz and corundum under the same low ionic strength condi-tions discussed above (Table 2) are shown in Fig. 5. These phospho-lipids represent opposing scenarios of negative and positive bilayersurface potentials, respectively. We measured f-potentials of"51 ± 5.1 mV and +76 ± 6.0 mV, respectively, for the DPPS andDPEPC vesicles used here (Table 1). The same estimate of bilayercoverage (!5–6 lmol m"2) used for DPPC is also used for DPPSbased on similar area per lipid [120]. The area per lipid for DPEPC
Fig. 5. Adsorption of (a) DPPS and (b) DPEPC from free vesicle solution onto quartzor corundum particles in 50 mM HEPES at pH 7.2. Fit lines are shown to guide theeye. Chemical structures of DPPS and DPEPC are also shown. Single DPPS bilayercoverage is estimated to be !5–6 lmol m"2, whereas single DPEPC coverage isestimated to be !4–5 lmol m"2.
334 T.A. Oleson et al. / Journal of Colloid and Interface Science 352 (2010) 327–336

Author's personal copy
is larger than for DPPC, particularly in the gel-phase (!0.78 nm2)[105], so that !4–5 lmol m"2 is estimated to represent bilayercoverage. As with oxide-bilayer interactions, bilayer–bilayer inter-actions are governed by van der Waals, electrostatic, and hydrationforces. Beyond!1–3 nm, repulsive hydration (and steric) forces arediminished so that bilayer–bilayer interaction is controlled by thefirst two contributions [92,121].
Coverage of DPPS on quartz is <1 lmol m"2 over the concentra-tion range (0 to !1 mM) investigated (Fig. 5a). Such low adsorptionis due to the expected oxide-bilayer electrostatic repulsion be-tween the DPPS vesicles and the negatively-charged quartz surface,and is in agreement with previous work with QCM-D showing noadsorption of DPPS-rich mixed-lipid vesicles on quartz [39]. Maxi-mum adsorption of only !3–4 lmol m"2 on corundum corre-sponds to majority coverage of the oxide surface by one bilayer(Fig. 5a). Adsorption is likely limited to a single bilayer on posi-tively-charged corundum due to electrostatic bilayer–bilayerrepulsion between the adsorbed bilayer and free vesicles. Thesum of the oxide-bilayer and bilayer–bilayer van der Waals attrac-tions, along with the attractive oxide-bilayer electrostatic interac-tion, are evidently not sufficiently strong to overcome this bilayer–bilayer repulsion. This result is consistent with the previous obser-vation that, under ionic strength conditions (10 mM NaCl) similarto ours, DPPS inter-bilayer spacing was found to be indefinitelylarge, implying strong bilayer–bilayer repulsion [122]. In our work,the repulsion was overcome upon addition of 2 mM Ca2+ to DPPSsolutions as evidenced by the rapid aggregation of vesicles and pre-cipitation from suspension as multilamellar lipid masses. Thisaggregation and precipitation, however, prevented measurementof adsorption in this system.
Because DPEPC is cationic, and based on the measured f-poten-tial (+76 mV), we predicted greater adsorption on quartz than oncorundum, and near-zero adsorption on the latter similar to DPPSon quartz. Adsorption of !3 lmol m"2 is achieved on both oxidesat low [DPEPC]eq, aq 6 0.3 mM, followed by an increase up to a max-imum of !4 lmol m"2 on quartz, corresponding to one bilayer, and!8 lmol m"2, or two bilayers, on corundum (Fig. 5b). Thus, neitherof our predictions was confirmed. The fact that DPEPC adsorption islimited to one bilayer on quartz (similar to DPPS on corundum,Fig. 5a) again suggests the role of bilayer–bilayer electrostaticrepulsion in preventing additional adsorption. Intriguingly, roughlytwo DPEPC bilayers were observed on corundum at high [DPEPC]eq,aq # 1.0 mM (Fig. 5b).We infer that the van derWaals attraction be-tween corundum and DPEPC is strong enough to overcome both theoxide-bilayer and bilayer–bilayer repulsions. This cannot be con-firmed directly from the results here, although a plausible explana-tion is based on the observed thermotropic behavior of DPEPC.Above Tm, DPEPC forms bilayers with separate, opposing leaflets,similar to DPPC and DPPS. Whereas the latter two lipids maintainthis structure upon cooling below Tm, DPEPC forms chain-interdig-itated single-leaflet bilayers or vesicles inwhich adjacentmoleculeshave oppositely oriented headgroups [68,105]. Interdigitation re-sults in a large gel-phase molecular area of 0.78 nm2 for DPEPC[105] compared to DPPS (0.54 nm2) [120] and DPPC (!0.50 nm2)[102], and also leads to a decrease in bilayer thickness [68,105].Coincidental reduction in the inter-bilayer water thickness be-tween DPEPC bilayers [68,105] results in smaller bilayer + waterlayer repeat distances of 4.3–4.9 nm in the gel-phase. This is sub-stantially thinner than for liquid–crystalline DPEPC (5.1–5.9 nm),or for gel and liquid–crystalline DPPC (6.3–6.7 nm) [68,102,105].Given a!1 nm separation between the oxide and the first DPEPC bi-layer plus the 4.3–4.9 nm repeat distance, a second bilayer couldpotentially approach to within !5.5–6 nm of the oxide surface,compared to !7.5–8 nm for a second DPPC bilayer. van der Waalsattraction between corundum and DPEPC at this distance may bestrong enough to account for deposition of two bilayers. It appears,
however, that van der Waals attraction is not strong enough be-tween quartz and DPEPC to overcome the bilayer–bilayer repulsion,thus limiting adsorption to one bilayer in this case. To our knowl-edge, this is the first study of supported bilayer systems involvingDPEPC. These interesting and unexpected results merit furtherstudy for clarification.
4. Conclusions
We have successfully tested several predictions based on ourpreviously proposed model for explaining deposition of multiplestacked DPPC bilayers on oxide surfaces and, in doing so, havedemonstrated the validity of the model. Oxide particle-inducedvesicle rupture is enhanced at both quartz and corundum surfaceswhen the vesicles are subjected to cycling through the main (gel toliquid-crystal) phase transition temperature, with adsorptionoccurring as planar bilayers rather than as intact vesicles. Stackingof greater than two bilayers occurs only for bilayers of sufficientlylow magnitude of surface charge. In such cases, the combination ofoxide-bilayer electrostatic and van der Waals forces determinesthe number of adsorbed layers, with a dependence on oxide-bi-layer separation distance and diffuse layer thickness. For bilayersof significant charge, electrostatic repulsion between bilayers over-comes attractive oxide-bilayer interactions and limits adsorptionto a maximum of two bilayers.
Our results contribute to the systematic study of lipid adsorp-tion on a variety of oxide particles and over a range of solution con-ditions, with biomedical and biogeochemical implications. Theappropriate combination of oxide surfaces, phospholipid head-groups, and physiological conditions could help stabilize multipleSPBs, which may have improved biomimetic properties comparedto their single SPB counterparts [13]. Supported multiple bilayersmay potentially be used in biomedical implants, biosensors, and li-pid-encapsulated drug-delivery mechanisms. Furthermore, studiesof pre-biotic cellular evolution have used lipid vesicles as model‘‘proto-cells” [123]. Our results indicate that the stability of suchproto-cells in the natural geological environment may depend, inpart, on the mineral surfaces with which they are in contact.
Acknowledgments
We acknowledge and thank Profs. Judith Burstyn and Eric Roden(University of Wisconsin–Madison) for use of the spectrofluorime-ter and UV–vis spectrophotometer, respectively.We also thank Pro-fessor Jim Weisshaar, Tingting Wang, and Jamie Ellis (University ofWisconsin–Madison) for helpful consultation regarding planningand execution of our fluorescence experiments. Min-U-Sil 5 quartzparticles were generously donated by U.S. Silica. This work wasfunded by the following grants to N.S.: NSF Career Award (EAR0346889), American Chemical Society Petroleum Research Fund(41777-AC2), and a Wisconsin Alumni Research Foundation(WARF) Award. T.A.O. was supported by the Van Hise Graduate Fel-lowship through the Department of Geoscience, University of Wis-consin–Madison, as well as a Graduate Grant-in-Aid of Researchfrom the American Association of Petroleum Geologists (AAPG).
Appendix A. Supplementary material
Supplementary data associated with this article can be found, inthe online version, at doi:10.1016/j.jcis.2010.08.057.
References
[1] L.B. Margolis, Biochim. Biophys. Acta 779 (1984) 161.[2] H.M. McConnell, T.H. Watts, R.M. Weis, A.A. Brian, Biochim. Biophys. Acta 864
(1986) 95.
T.A. Oleson et al. / Journal of Colloid and Interface Science 352 (2010) 327–336 335

Author's personal copy
[3] E. Sackmann, Science 271 (1996) 43.[4] I. Reviakine, W. Bergsma-Schutter, A. Brisson, J. Struct. Biol. 121 (1998) 356.[5] K. Glasmästar, C. Larsson, F. Höök, B. Kasemo, J. Colloid Interface Sci. 246
(2002) 40.[6] E.T. Castellana, P.S. Cremer, Surf. Sci. Rep. 61 (2006) 429.[7] B. Kasemo, Surf. Sci. 500 (2002) 656.[8] B.A. Cornell, V.L.B. Braach-Maksvytis, L.G. King, P.D.J. Osman, B. Raguse, L.
Wieczorek, R.J. Pace, Nature 387 (1997) 580.[9] M. Tirrell, E. Kokkoli, M. Biesalski, Surf. Sci. 500 (2002) 61.[10] J.H. Collier, P.B. Messersmith, Annu. Rev. Mater. Res. 31 (2001) 237.[11] C. Susin, M. Qahash, J. Hall, L. Sennerby, U.M.E. Wikesjö, J. Clin. Periodontol.
35 (2008) 270.[12] S.M. Moghimi, A.C. Hunter, J.C. Murray, FASEB J. 19 (2005) 311.[13] G. Fragneto, T. Charitat, F. Graner, K. Mecke, L. Perino-Gallice, E. Bellet-
Amalric, Europhys. Lett. 53 (2001) 100.[14] S. Bégu, S. Girod, D.A. Lerner, N. Jardiller, C. Tourné-Péteilh, J.-M. Devoisselle, J.
Mater. Chem. 14 (2004) 1316.[15] H. El Rassy, E. Belamie, J. Livage, T. Coradin, Langmuir 21 (2005) 8584.[16] H.K. Baca, C. Ashley, E. Carnes, D. Lopez, J. Flemming, D. Dunphy, S. Singh, Z.
Chen, N.G. Liu, H.Y. Fan, G.P. López, S.M. Brozik, M. Werner-Washburne, C.J.Brinker, Science 313 (2006) 337.
[17] D.W. Fuerstenau, Pradip, Adv. Colloid Interface Sci. 114 (2005) 9.[18] K.A. Becraft, G.L. Richmond, J. Phys. Chem. B 109 (2005) 5108.[19] K. Urum, T. Pekdemir, Chemosphere 57 (2004) 1139.[20] X. Zhang, M.J. Borda, M.A.A. Schoonen, D.R. Strongin, Langmuir 19 (2003)
8787.[21] J. Hao, C. Cleveland, E. Lim, D.R. Strongin, M.A.A. Schoonen, Geochem. Trans. 7
(2006) 8.[22] N. Sahai, M.A.A. Schoonen, H.C.W. Skinner, in: N. Sahai, M.A.A. Schoonen
(Eds.), Reviews in Mineralogy and Geochemistry, vol. 64, MineralogicalSociety of America, Chantilly, VA, 2006, pp. 1–4.
[23] G. Attik, R. Brown, P. Jackson, O. Creutzenberg, I. Aboukhamis, B.H. Rihn, Inhal.Toxicol. 20 (2008) 1101.
[24] B. Fubini, C.O. Areán, Chem. Soc. Rev. 28 (1999) 373.[25] M. Maier, B. Hannebauer, H. Holldorff, P. Albers, J. Occup. Environ. Health 48
(2006) 1314.[26] V. Murashov, M. Harper, E. Demchuk, J. Occup. Environ. Hyg. 3 (2006) 718.[27] N. Sahai, J. Colloid Interface Sci. 252 (2002) 309.[28] N. Sahai, Elements 3 (2007) 381.[29] D.A. Bazylinski, R.B. Frankel, in: P.M. Dove, J.J. De Yoreo, S. Weiner (Eds.),
Reviews in Mineralogy and Geochemistry, vol. 54, Mineralogical Society ofAmerica, Washington, DC, 2003, pp. 217–247.
[30] C.C. Perry, in: P.M. Dove, J.J. De Yoreo, S. Weiner (Eds.), Reviews inMineralogy and Geochemistry, vol. 54, Mineralogical Society of America,Washington, DC, 2003, pp. 291–327.
[31] J.R. Young, K. Henriksen, in: P.M. Dove, J.J. De Yoreo, S. Weiner (Eds.), Reviewsin Mineralogy and Geochemistry, vol. 54, Mineralogical Society of America,Washington, DC, 2003, pp. 189–215.
[32] D.R. Talham, R. Backov, I.O. Benitez, D.M. Sharbaugh, S. Whipps, S.R. Khan,Langmuir 22 (2006) 2450.
[33] P. Dalal, K. Zanotti, A. Wierzbicki, J.D. Madura, H.S. Cheung, Biophys. J. 89(2005) 2251.
[34] J.T. Trevors, Antonie Van Leeuwenhoek 71 (1997) 363.[35] M.M. Hanczyc, S.M. Fujikawa, J.W. Szostak, Science 302 (2003) 618.[36] D. Deamer, J.P. Dworkin, S.A. Sandford, M.P. Bernstein, L.J. Allamandola,
Astrobiology 2 (2002) 371.[37] I. Reviakine, A. Brisson, Langmuir 16 (2000) 1806.[38] E. Reimhult, F. Höök, B. Kasemo, Langmuir 19 (2003) 1681.[39] R.P. Richter, R. Bérat, A.R. Brisson, Langmuir 22 (2006) 3497.[40] F.F. Rossetti, M. Textor, I. Reviakine, Langmuir 22 (2006) 3467.[41] R.P. Richter, N. Maury, A.R. Brisson, Langmuir 21 (2005) 299.[42] S.D. Connell, D.A. Smith, Mol. Membr. Biol. 23 (2006) 17.[43] Y.F. Dufrêne, G.U. Lee, Biochim. Biophys. Acta 1509 (2000) 14.[44] J. Kim, G. Kim, P.S. Cremer, Langmuir 17 (2001) 7255.[45] V. Chan, K.T. Wan, Langmuir 18 (2002) 3134.[46] C.S. Lee, C.D. Bain, Biochim. Biophys. Acta 1711 (2005) 59.[47] M. Junglas, B. Danner, T.M. Bayerl, Langmuir 19 (2003) 1914.[48] A.F. Xie, R. Yamada, A.A. Gewirth, S. Granick, Phys. Rev. Lett. 89 (2002)
246103.[49] K.J. Seu, A.P. Pandey, F. Haque, E.A. Proctor, A.E. Ribbe, J.S. Hovis, Biophys. J. 92
(2007) 2445.[50] J. Liu, J.C. Conboy, J. Phys. Chem. C 111 (2007) 8988.[51] S. Mornet, O. Lambert, E. Duguet, A. Brisson, Nano Lett. 5 (2005) 281.[52] R. Tero, T. Ujihara, T. Urisu, Langmuir 24 (2008) 11567.[53] L. Wiegart, S.M. O’Flaherty, B. Struth, Langmuir 21 (2005) 1695.[54] I. Zawisza, A. Lachenwitzer, V. Zamlynny, S.L. Horswell, J.D. Goddard, J.
Lipkowski, Biophys. J. 85 (2003) 4055.[55] X. Bin, I. Zawisza, J.D. Goddard, J. Lipkowski, Langmuir 21 (2005) 330.[56] K. Furukawa, K. Sumitomo, H. Nakashima, Y. Kashimura, K. Torimitsu,
Langmuir 23 (2007) 367.[57] J.T. Groves, S.G. Boxer, Acc. Chem. Res. 35 (2002) 149.[58] G.V. Franks, L. Meagher, Colloid Surf. A 214 (2003) 99.[59] G.V. Franks, Y. Gan, J. Am. Ceram. Soc. 90 (2007) 3373.[60] J. Xu, M.J. Stevens, T.A. Oleson, J.A. Last, N. Sahai, J. Phys. Chem. C 113 (2009)
2187.[61] T.A. Oleson, N. Sahai, Langmuir 24 (2008) 4865.
[62] J. Marra, J. Israelachvili, Biochemistry 24 (1985) 4608.[63] T.A. Oleson, N. Sahai, J. Colloid Interface Sci. (2010) 316.[64] D. Marsh, CRC Handbook of Lipid Bilayers, CRC Press, Boca Raton, FL, 1990.[65] H.C. Liu, J.G. Turcotte, R.H. Notter, Langmuir 11 (1995) 101.[66] G. Cevc, A. Watts, D. Marsh, Biochemistry 20 (1981) 4955.[67] R. Lewis, I. Winter, M. Kriechbaum, K. Lohner, R.N. McElhaney, Biophys. J. 80
(2001) 1329.[68] R. Koynova, R.C. MacDonald, Biochim. Biophys. Acta 1613 (2003) 39.[69] R.M.C. Dawson, D.C. Elliott, W.H. Elliott, K.M. Jones, Data for Biochemical
Research, third ed., Oxford University Press, Oxford, 1986. p. 424.[70] R.J. Kershner, J.W. Bullard, M.J. Cima, Langmuir 20 (2004) 4101.[71] Y.-K. Leong, B.-C. Ong, J. Chem. Eng. Jpn. 37 (2004) 187.[72] R. Rapuano, A.M. Carmona-Ribeiro, J. Colloid Interface Sci. 226 (2000) 299.[73] R. Rapuano, A.M. Carmona-Ribeiro, J. Colloid Interface Sci. 193 (1997) 104.[74] G. Rouser, S. Fleischer, A. Yamamoto, Lipids 5 (1970) 494.[75] J.N. Weinstein, E. Ralston, L.D. Leserman, R.D. Klausner, P. Dragsten, P.
Henkart, R. Blumenthal, in: G. Gregoriadis (Ed.), Liposome Technology, vol. 3,CRC Press, Boca Raton, FL, 1984, pp. 183–204.
[76] P. Vermette, L. Meagher, E. Gagnon, H.J. Griesser, C.J. Doillon, J. ControlledRelease 80 (2002) 179.
[77] B. Seantier, C. Breffa, O. Félix, G. Decher, J. Phys. Chem. B 109 (2005) 21755.[78] E. Reimhult, F. Höök, B. Kasemo, J. Chem. Phys. 117 (2002) 7401.[79] F.F. Rossetti, M. Bally, R. Michel, M. Textor, I. Reviakine, Langmuir 21 (2005)
6443.[80] K. Jørgensen, O.G. Mouritsen, Thermochim. Acta 328 (1999) 81.[81] A. Carruthers, D.L. Melchior, Biochemistry 22 (1983) 5797.[82] D. Papahadjopolous, K. Jacobson, S. Nir, T. Isac, Biochim. Biophys. Acta 311
(1973) 330.[83] X. Shi, Y. Mao, L.N. Daniel, U. Saffiotti, N.S. Dalal, V. Vallyathan, Environ.
Health Perspect. 102 (1994) 149.[84] B. Fubini, in: A.P. Legrand (Ed.), The Surface Properties of Silicas, John Wiley &
Sons, Chichester, UK, 1998, pp. 415–464.[85] N. Sahai, Environ. Sci. Technol. 36 (2002) 445.[86] A. Efremov, J.C. Mauro, S. Raghavan, Langmuir 20 (2004) 5724.[87] A.T.A. Jenkins, R.J. Bushby, S.D. Evans, W. Knoll, A. Offenhäusser, S.D. Ogier,
Langmuir 18 (2002) 3176.[88] P. Nollert, H. Kiefer, F. Jähnig, Biophys. J. 69 (1995) 1447.[89] C.A. Keller, K. Glasmästar, V.P. Zhdanov, B. Kasemo, Phys. Rev. Lett. 84 (2000)
5443.[90] D. Stroumpoulis, A. Parra, M. Tirrell, AIChE J. 52 (2006) 2931.[91] E. Reimhult, M. Zach, F. Höök, B. Kasemo, Langmuir 22 (2006) 3313.[92] J. Israelachvili, Intermolecular and Surface Forces, second ed., Academic Press,
London, 1992 (399-402).[93] R. Podgornik, V.A. Parsegian, Langmuir 8 (1992) 557.[94] T.J. McIntosh, S.A. Simon, Biochemistry 25 (1986) 4058.[95] M. Edvardsson, S. Svedhem, G. Wang, R. Richter, M. Rodahl, B. Kasemo, Anal.
Chem. 81 (2009) 349.[96] S.A. Tatulian, Biochim. Biophys. Acta 736 (1983) 189.[97] S.A. Tatulian, Eur. J. Biochem. 170 (1987) 413.[98] K. Makino, T. Yamada, M. Kimura, T. Oka, H. Ohshima, T. Kondo, Biophys.
Chem. 41 (1991) 175.[99] K. Satoh, Biochim. Biophys. Acta 1239 (1995) 239.[100] H.I. Petrache, T. Zemb, L. Belloni, V.A. Parsegian, PNAS 103 (2006) 7982.[101] S. Jackson, M.D. Reboiras, I.G. Lyle, M.N. Jones, Faraday Discuss. Chem. Soc. 85
(1986) 291.[102] J.F. Nagle, S. Tristram-Nagle, Biochim. Biophys. Acta 1469 (2000) 159.[103] P.S. Cremer, S.G. Boxer, J. Phys. Chem. B 103 (1999) 2554.[104] C.M. Ajo-Franklin, C. Yoshina-Ishii, S.G. Boxer, Langmuir 21 (2005)
1377.[105] I. Winter, G. Pabst, M. Rappolt, K. Lohner, Chem. Phys. Lipids 112 (2001) 137.[106] R.J. Hunter, Foundations of Colloid Science, second ed., Oxford University
Press, Oxford, UK, 2001. pp. 509–511.[107] A. Foissy, J. Persello, in: A.P. Legrand (Ed.), The Surface Properties of Silicas,
John Wiley & Sons, Ltd., Chichester, UK, 1998, pp. 365–414.[108] A. Kaya, Y. Yukselen, Can. Geotech. J. 42 (2005) 1280.[109] A. McLaughlin, C. Grathwohl, S. McLaughlin, Biochim. Biophys. Acta 513
(1978) 338.[110] A.D. Bangham, R.M.C. Dawson, Biochim. Biophys. Acta 59 (1962) 103.[111] L.J. Lis, V.A. Parsegian, R.P. Rand, Biochemistry 20 (1981) 1761.[112] L.J. Lis, W.T. Lis, V.A. Parsegian, R.P. Rand, Biochemistry 20 (1981) 1771.[113] J.J. McManus, J.O. Rädler, K.A. Dawson, J. Phys. Chem. B 107 (2003)
9869.[114] C.G. Sinn, M. Antonietti, R. Dimova, Colloid Surf. A 282–283 (2006) 410.[115] T. Charitat, E. Bellet-Amalric, G. Fragneto, F. Graner, Eur. Phys. J. B 8 (1999)
583.[116] S. Lecuyer, G. Fragneto, T. Charitat, Eur. Phys. J. E 21 (2006) 153.[117] S.J. Johnson, T.M. Bayerl, D.C. McDermott, G.W. Adam, A.R. Rennie, R.K.
Thomas, E. Sackmann, Biophys. J. 59 (1991) 289.[118] T.M. Bayerl, M. Bloom, Biophys. J. 58 (1990) 357.[119] S.P. Moura, A.M. Carmona-Ribeiro, J. Colloid Interface Sci. 313 (2007) 519.[120] J.J. López Cascales, J.G. de la Torre, S.J. Marrink, H.J.C. Berendsen, J. Chem.
Phys. 104 (1996) 2713.[121] H. Nabika, A. Fukasawa, K. Murakoshi, Langmuir 22 (2006) 10927.[122] M.E. Loosley-Millman, R.P. Rand, V.A. Parsegian, Biophys. J. 40 (1982) 221.[123] D.W. Deamer, J.P. Dworkin, Top. Curr. Chem. 259 (2005) 1.
336 T.A. Oleson et al. / Journal of Colloid and Interface Science 352 (2010) 327–336
1
Electronic Supporting Information for:
Electrostatic Effects on Deposition of Multiple Phospholipid Bilayers at Oxide Surfaces
Timothy A. Oleson a, Nita Sahai a, b, c, d, *, and Joel A. Pedersen b, e
a Department of Geoscience, 1215 West Dayton Street, University of Wisconsin, Madison, Wisconsin 53706, USA b Environmental Chemistry and Technology Program, 680 North Park Street, University of Wisconsin, Madison, Wisconsin 53706, USA c Materials Science Program, 1509 University Avenue, University of Wisconsin, Madison, Wisconsin 53706, USA d NASA Astrobiology Institute, 1215 West Dayton Street, University of Wisconsin, Madison, Wisconsin 53706, e Department of Soil Science, 1525 Observatory Drive, University of Wisconsin, Madison, Wisconsin 53706 * Corresponding author: Department of Geoscience, 1215 West Dayton Street, University of Wisconsin, Madison, Wisconsin 53706, USA; telephone: +1 608 262 4972; fax: +1 608 262 0693 Author e-mail addresses: [email protected], [email protected], [email protected]

2
S1. Procedure for Fluorescence Experiments
Solutions containing 50 mM CF were prepared in 50 mM HEPES buffer and the pH was
adjusted with 1 M NaOH to the minimum value (7.4) at which all CF dissolved. CF solutions
were stored in the dark at 4°C when not in use. Dried DPPC portions were rehydrated with the
50 mM CF solution in the same manner as described in the main text (Section 2.2).
Additionally, the solutions were subjected to five freeze-thaw cycles to ensure thorough
encapsulation of the dye [1, 2], and were stored at 0°C. Following re-warming to above Tm, bath
sonication, and centrifugation, resulting supernatants were sequentially passed through two
columns containing Sephadex G-25® gel (PD-10 column, GE Healthcare, Chalfont St. Giles,
UK) to separate CF-loaded vesicles from excess CF in the solution [2, 3]. The columns were
pre-equilibrated with 50 mM HEPES buffer, and elution was achieved under gravity. Eluates
were immediately diluted with buffer to the appropriate [DPPC] and experiments were carried
out using the batch adsorption procedure described in the main text (Section 2.3). The notable
difference is that, for a given initial [DPPC], six (instead of three) replicates of both the oxide-
bearing samples and the centrifuged blanks were prepared, along with three un-centrifuged
blanks. To gauge the effect of cycling the vesicles through the Tm in the presence of the oxide
particles, three of the six sample and centrifuged blank replicates were heated to 55°C for 15 min
(“cycled”), while the remaining three replicates of both were left at ambient temperature (~22°C;
“uncycled”). The cycled samples and blanks were heated for 15 min, as opposed to ≥ 1 h for the
batch experiments without CF, because longer heating induced increased dye leakage from intact
vesicles. All samples and blanks were then allowed to sit for an additional hour at ambient
temperature prior to centrifugation at 24,000g for 1 h. Supernatant solutions were collected and
assayed for [DPPC].

3
Triplicate aliquots of all sample and blank supernatants were diluted 20 – 40× with
additional buffer to optimize the measured fluorescent signal as estimated from the Beer-
Lambert Law (molar absorptivity of CF at λ = 492 nm is ~75,000 M-1cm-1) [4]. Fluorescence
intensity measurements were performed on solutions in 1 × 1 cm polystyrene fluorescence
cuvettes with a PC1 Photon Counting Spectrofluorimeter (ISS, Champaign, IL) equipped with a
300 W high-pressure xenon arc source lamp. Excitation and emission wavelengths were set at
490 and 520 nm, respectively, using monochromators with bandpass widths adjusted to 4 nm.
Emitted signal was detected at 90° to the incident beam with a photomultiplier tube. Following
measurement of the initial fluorescent intensities of all samples and blanks, 50 µL of a 1% (v/v)
Triton X-100 (ICN Biomedicals, Inc., Aurora, OH) detergent solution in DI water was added to
disrupt vesicles and liberate all remaining entrapped CF into the bulk solution. Total fluorescent
intensities for all samples and blanks were then obtained and corrected for the slight volume
dilution upon addition of the detergent. Triton X-100 does not interfere with CF fluorescence
under the conditions of our experiments [5].
S2. Calculation of Rupture Factors from Fluorescence Measurements
The technique described above is similar to a previously reported fluorescence method
used to gauge particle-induced vesicle rupture [6]. Unlike the earlier method, fluorescence
changes in the present work were not observed in situ because of the need to centrifuge samples
in order to also measure adsorption. Rather, changes in fluorescent intensity were deduced based
on differences between blank and sample measurements following centrifugation. Direct
comparison of the raw fluorescent intensities across experiments is only of limited qualitative
value because of variation in the total lipid and CF contents, and hence in the resulting

4
fluorescent yield. This is particularly true for comparison between samples containing different
oxides, but also for like samples at different DPPC concentrations. Furthermore, a number of
factors, including available oxide surface area, CF leakage, and instrument performance may
vary across experiments and contribute to different intensity scaling for each. We have therefore
devised a new method for normalizing our data to a scale ideally spanning zero to one,
proportional to the amount of rupture, for comparison across experiments. We make use of both
measured fluorescent intensities and corresponding adsorption measurements.
We describe here the method for calculating what we have termed “rupture factors” (R)
calculated from intensity measurements obtained using the fluorescence technique described
above (also see Section 2.4 of the main text). The R for a given experiment describes the degree
of rupture of carboxyfluorescein (CF)-loaded vesicles induced by interaction with suspended
particles.
The measured fluorescent intensity is due to CF release from vesicles ruptured by
interaction with oxides (IORV, for oxide-ruptured vesicles), CF remaining in unruptured vesicles
(IURV, for unruptured vesicles) that are subsequently forced to rupture by addition of Triton X-
100 detergent (ITRV, for Triton-ruptured vesicles), and from leakage of CF from unruptured
vesicles (IURL, for leakage from unruptured vesicles).
For the centrifuged blank (CB) without oxide particles, the measured fluorescent intensity
before addition of Triton X-100 detergent (BT) is given by,
ICB, BT = ICB, URV + IURL (S1)
After addition of Triton X-100 (AT), the measured intensity of the centrifuged blank is given by,
ICB, AT = ICB, TRV + IURL (S2)

5
Based on knowledge of the self-quenching behavior of CF, we expect a ~10× increase in
fluorescent intensity when the CF in unruptured vesicles (at 50 mM) is released by addition of
Triton X-100 and diluted (~2000×) into the bulk solution [4]. This provides the general relation:
IURV = 0.1 × ITRV (S3)
Equations (S1) – (S3) provide three linear equations for three unknowns (ICB, URV, ICB, TRV, and
IURL), and can be solved as follows. Rearranging (S2), we obtain,
IURL = ICB, AT – ICB, TRV (S4)
Combining (S1) and (S3) yields,
ICB, BT = 0.1 × ICB, TRV + IURL (S5)
and combining (S4) and (S5) yields,
ICB, BT = 0.1 × ICB, TRV + ICB, AT – ICB, TRV (S6)
Rearranging (S6) gives,
ICB, TRV = (ICB, AT – ICB, BT) / 0.9 (S7)
For the oxide particle suspensions (OX), the measured fluorescent intensity before
addition of Triton X-100 (BT) is given by,
IOX, BT = IORV + IOX, URV + IURL (S8)
and after addition of Triton X-100, we have,
IOX, AT = IORV + IOX, TRV + IURL (S9)
Subtracting (S8) from (S9) yields,
IOX, AT – IOX, BT = IOX, TRV – IOX, URV (S10)
Substituting (S3) into (S10) leads to,
IOX, TRV = (IOX, AT – IOX, BT) / 0.9 (S11)

6
If we use IURL determined above from the centrifuged blank as a proxy for the leaked intensity in
the oxide-bearing samples, IORV can be calculated from (S9) as,
IORV = IOX, AT – IOX, TRV – IURL (S12)
To compare measured intensities across experiments, we can calculate the theoretical fluorescent
intensity expected from oxide-ruptured vesicles (IORV, THEOR) based on the molar concentration of
lipid adsorbed to the oxide ([PL]ads) as,
IORV, THEOR = IPL, aq · [PL]ads (S13)
where IPL, aq is the fluorescent intensity expected per unit lipid concentration in solution and is
calculated using the aqueous lipid concentration of the centrifuged blank ([PL]cb, aq),
IPL, aq = ICB, TRV / [PL]cb, aq (S14)
Finally, the rupture factor (R) can be calculated as the ratio of the measured and expected
intensities of oxide-induced rupture,
R = IORV / IORV, THEOR (S15)
Operationally, six measured values are required to calculate a rupture factor: ICB, BT, ICB, AT, IOX,
BT, IOX, AT, [PL]ads, and [PL]cb, aq. The experimentally obtained values used to calculate rupture
factors for the present work are provided in Table S1.
Table S1. Measured Adsorption Values and Fluorescent Intensities used to Calculate Rupture Factors
Oxide [DPPC]eq
(mM) Temperature
Cycling ICB, BT ICB, AT [PL]cb, aq (mM) IOX, BT IOX, AT [PL]ads (mM)
Quartz 0.04 No 17705 44279 0.075 53619 61964 0.043
0.04 Yes 35579 56945 0.076 79215 85532 0.040
0.7 No 12334 62009 0.675 21801 63578 0.057
0.7 Yes 29727 71200 0.688 41165 78342 0.060
Corundum 0.07 No 17705 44279 0.075 17053 44004 0.010
0.07 Yes 35579 56945 0.076 40955 62592 0.012
0.7 No 12334 62009 0.675 12924 65137 0.021
0.7 Yes 29727 71200 0.688 31282 76320 0.022

7
From Equation S15, it is evident that if there is agreement between the measured IORV
and expected theoretical IORV, THEOR, then R = 1 and we conclude that all lipid adsorbed to the
oxide particles was from ruptured vesicles. By contrast, if IORV < IORV, THEOR, then R < 1, and we
conclude that the rupture efficiency is < 100%. In other words, some of the lipid adsorbed to the
oxide particles must have still been in the form of intact vesicles. If no rupture of adsorbed
vesicles occurs, then IORV = 0 and R = 0. Values of R > 1 indicate rupture of additional vesicles
that do not remain adsorbed to the oxide surface. The mechanism by which this occurs is unclear
from our work, although it could be enhanced for the quartz particles used, which have sharper
edges than the synthetic corundum particles (see Supporting Information of Reference [7] for
SEM images). These values could also represent cases where lipid has desorbed from the
surface following vesicle rupture, and has re-assembled as empty vesicles in the bulk solution [8,
9]. Out-of-range values < 0, on the other hand, imply that intact vesicles adsorbed to the oxide
somehow take up additional CF. This is physically unrealistic given the steep osmolarity
gradient between internal (intravesicle) and external (bulk) solutions. A small value of R < 0
may be due to the use of the leaked intensity determined for the centrifuged blank sample as an
estimate for leakage from the oxide-bearing samples. Below are worked examples for the cases
of R = 1 and R = 0 using hypothetical data:

8
Case 1: R = 1
Suppose we have the following values from fluorescence and adsorption measurements:
ICB, BT 30,000 arb. units IOX, BT 35,000 ICB, AT 72,000 IOX, AT 76,000 [PL]cb, aq 0.70 mM [PL]ads 0.077 mM.
From S7, ICB, TRV = (ICB, AT – ICB, BT) / 0.9 = 46666.7
Then from S4, IURL = ICB, AT – ICB, TRV = 25333.3
From S11, IOX, TRV = (IOX, AT – IOX, BT) / 0.9 = 45555.6
Then from S12, IORV = IOX, AT – IOX, TRV – IURL = 5111.1
From S14, IPL, aq = ICB, TRV / [PL]cb, aq = 66666.7 mM-1
Then from S13, IORV, THEOR = IPL, aq · [PL]ads = 5133.3
Finally, from S15, R = IORV / IORV, THEOR ≈ 1.0
Therefore, we conclude 100% rupture efficiency in this case. [Note that although IOX, BT > ICB, BT
due to oxide-induced rupture, (IOX, AT – IOX, BT) < (ICB, AT – ICB, BT) because the increase in
intensity upon subsequent addition of detergent is smaller for the oxide-bearing sample than for
the blank.] To illustrate the difficulty in trying to compare rupture across experiments directly
from the raw fluorescent intensities, imagine we have the following data for a different oxide
sample:
ICB, BT 30,000 arb. units IOX, BT 38,000 ICB, AT 72,000 IOX, AT 76,000 [PL]cb, aq 0.70 mM [PL]ads 0.127 mM.
Following the same sequence of calculations as above, we again get R ≈ 1.0. If we used only the
raw fluorescence measurements, however, and did not account for the increased adsorption
([PL]ads), we would interpret the latter scenario as representing greater rupture because IOX, BT =

9
38,000 > 35,000. While it is correct that the absolute amount of rupture is greater, the
normalized, or proportional, rupture is the same as in the initial scenario.
Case 2: R = 0
Suppose we have the following values from fluorescence and adsorption measurements (Note
that the data for the centrifuged blank and for [PL]ads are the same as in Case 1):
ICB, BT 30,000 arb. units IOX, BT 29,800 ICB, AT 72,000 IOX, AT 70,000 [PL]cb, aq 0.70 mM [PL]ads 0.077 mM.
From S7, ICB, TRV = (ICB, AT – ICB, BT) / 0.9 = 46666.7
Then from S4, IURL = ICB, AT – ICB, TRV = 25333.3
From S11, IOX, TRV = (IOX, AT – IOX, BT) / 0.9 = 44666.7
Then from S12, IORV = IOX, AT – IOX, TRV – IURL = 0
From S14, IPL, aq = ICB, TRV / [PL]cb, aq = 66666.7 mM-1
Then from S13, IORV, THEOR = IPL, aq · [PL]ads = 5133.3
Finally, from S15, R = IORV / IORV, THEOR = 0
Therefore, we conclude 0% rupture and that the lipid adsorbed to the particles as intact vesicles.

10
S3. Morphology of the Oxide Particles Used in the Present Study
a) Quartz
b) Corundum
Figure S1. Secondary electron emission images collected by scanning electron microscopy showing the general morphologies of the oxide particles used in this study. Quartz particles are shown to be predominantly angular in shape (a), whereas the corundum particles are mostly round-edged and tabular, with some particles possessing angular shapes (c). Note the different scale bars in (a) versus (b).

11
S4. CF Adsorption on Corundum and Quartz
Adsorption of CF on the oxide particles in the absence of DPPC was determined using a
similar protocol as for the rupture/adsorption experiments with DPPC. Solutions containing CF
were diluted from a ~50 mM stock and then mixed with suspensions containing known masses
of either quartz or corundum particles (in 50 mM HEPES at pH 7.4). The suspensions were
vortexed, heated to 55°C for 20 min, and then cooled for 1.5 h. Following centrifugation for 1 h
at 24,000g, an aliquot of the supernatant was removed and subsequently diluted further in buffer
to optimize the measured fluorescent signal. Oxide-bearing samples were compared with blank
samples of the same initial [CF]solution to determine the amount adsorbed. Figure S1 shows CF
adsorption on quartz and corundum for two different [CF]solution. We observe non-zero
adsorption on both oxides at [CF]solution = 50 µM. At [CF]solution = 0.5 µM, a small amount of
adsorption is seen on corundum, whereas the value for quartz is within error of 0, and thus is
considered negligible. Solution concentrations of CF for these experiments were chosen to
approximate conditions in our rupture/adsorption experiments when little or no rupture occurred
([CF]solution = 0.5 µM), or when complete rupture of all vesicles occurred ([CF]solution = 50 µM).
Figure S2. Adsorption of CF on quartz and corundum particles in 50 mM HEPES at pH 7.4.
12
References
[1] J. M. Johnson, T. Ha, S. Chu, S. G. Boxer, Biophys. J. 83 (2002) 3371.
[2] L. E. Yandek, A. Pokorny, A. Florén, K. Knoelke, U. Langel, P. F. F. Almeida, Biophys. J.
92 (2007) 2434.
[3] J. N. Weinstein, S. Yoshikami, P. Henkart, R. Blumenthal, W. A. Hagins, Science 195 (1977)
489.
[4] J. N. Weinstein, E. Ralston, L. D. Leserman, R. D. Klausner, P. Dragsten, P. Henkart, R.
Blumenthal, in: G. Gregoriadis (Ed.), CRC Press, Boca Raton, FL, 1984, Vol. 3, pp. 183-
204.
[5] P. Vermette, L. Meagher, E. Gagnon, H. J. Griesser, C. J. Doillon, J. Control. Release 80
(2002) 179.
[6] S. Jackson, M. D. Reboiras, I. G. Lyle, M. N. Jones, Faraday Discuss. Chem. Soc. 85 (1986)
291.
[7] T. A. Oleson, N. Sahai, Langmuir 24 (2008) 4865.
[8] D. Stroumpoulis, A. Parra, M. Tirrell, AIChE J. 52 (2006) 2931.
[9] E. Reimhult, M. Zach, F. Höök, B. Kasemo, Langmuir 22 (2006) 3313.
Copyright © 2022 FDOKUMEN