An estimation of the wire-duct electrostatic precipitator efficiency
16
Journal o/Electrostatics, 26 (1991) 99-114 Elsevier 99 An estimation of the wire-duct electrostatic precipitator efficiency S. Abdel-Sattar Electrical Engineering Department, Faculty o[ Engineering, Assiut University, Assiut, Egypt (Received August 16, 1990; accepted in revised form October 11, 1990) Summary In this paper, a simple and fast method for estimating the saturated profiles of the field inten- sity, ions and particles charge density, ions and particles current density, relative precipitated dust and the overall precipitation efficiencyof the wire-duct electrostatic precipitators is reported. Both ions and particles in space surrounding the energized wires are taken into consideration. This method is based on simple expressions which define the ionized field in the interelectrode spacing surrounding the HV wires of the wire-duct electrostatic precipitator in presence of dust particles and under saturated conditions. The precipitation efficiency of the electrostatic precipitators under saturated conditions is also estimated for cement industry. The effect of some parameters on the precipitation efficiency is also reported, The precipitation efficiencyof the wire-duct electrostatic precipitator as influenced by both the applied voltage and the gas flow speed is discussed in this paper. The present findings are correlated to the physics of electrical corona discharge. I. Introduetion In recent years, electrostatic precipitation has been used in a wide variety of chemical processing, power generation, transport applications, industrial ap- plications, including coal-fired boilers, cement kilns, solid waste incinerators, paper mill recovery boilers, petroleum refining catalytic cracking units, sinter plants, basic oxygen furnaces, coke oven batteries, and glass furnaces. The most common geometry for electrostatic precipitation is the wire-duct electrostatic precipitator, Fig. 1, where the gas flows between grounded parallel plates of sheet metal and high voltage electrodes. These electrodes are a series of equally spaced long wires weighted and hanging between the plates or are supported there by rigid frames. Theoretical as well as experimental analysis in wire-tube electrostatic pre- cipitators have received the attention of different investigators [2-6]. Most models depend on numerically solving of the main system of equations describ- ing the precipitator geometry with a certain choice of boundary conditions, 0304-3886/91/$03.50 © 1991 Elsevier Science Publishers B.V. All rights reserved. J
Transcript of An estimation of the wire-duct electrostatic precipitator efficiency

Journal o/Electrostatics, 26 (1991) 99-114 Elsevier
99
An estimation of the wire-duct electrostatic precipitator efficiency
S. Abdel-Sattar Electrical Engineering Department, Faculty o[ Engineering, Assiut University, Assiut, Egypt
(Received August 16, 1990; accepted in revised form October 11, 1990)
Summary
In this paper, a simple and fast method for estimating the saturated profiles of the field inten- sity, ions and particles charge density, ions and particles current density, relative precipitated dust and the overall precipitation efficiency of the wire-duct electrostatic precipitators is reported. Both ions and particles in space surrounding the energized wires are taken into consideration. This method is based on simple expressions which define the ionized field in the interelectrode spacing surrounding the HV wires of the wire-duct electrostatic precipitator in presence of dust particles and under saturated conditions.
The precipitation efficiency of the electrostatic precipitators under saturated conditions is also estimated for cement industry. The effect of some parameters on the precipitation efficiency is also reported, The precipitation efficiency of the wire-duct electrostatic precipitator as influenced by both the applied voltage and the gas flow speed is discussed in this paper. The present findings are correlated to the physics of electrical corona discharge.
I. Introduetion
In recent years, electrostatic precipitation has been used in a wide variety of chemical processing, power generation, transport applications, industrial ap- plications, including coal-fired boilers, cement kilns, solid waste incinerators, paper mill recovery boilers, petroleum refining catalytic cracking units, sinter plants, basic oxygen furnaces, coke oven batteries, and glass furnaces.
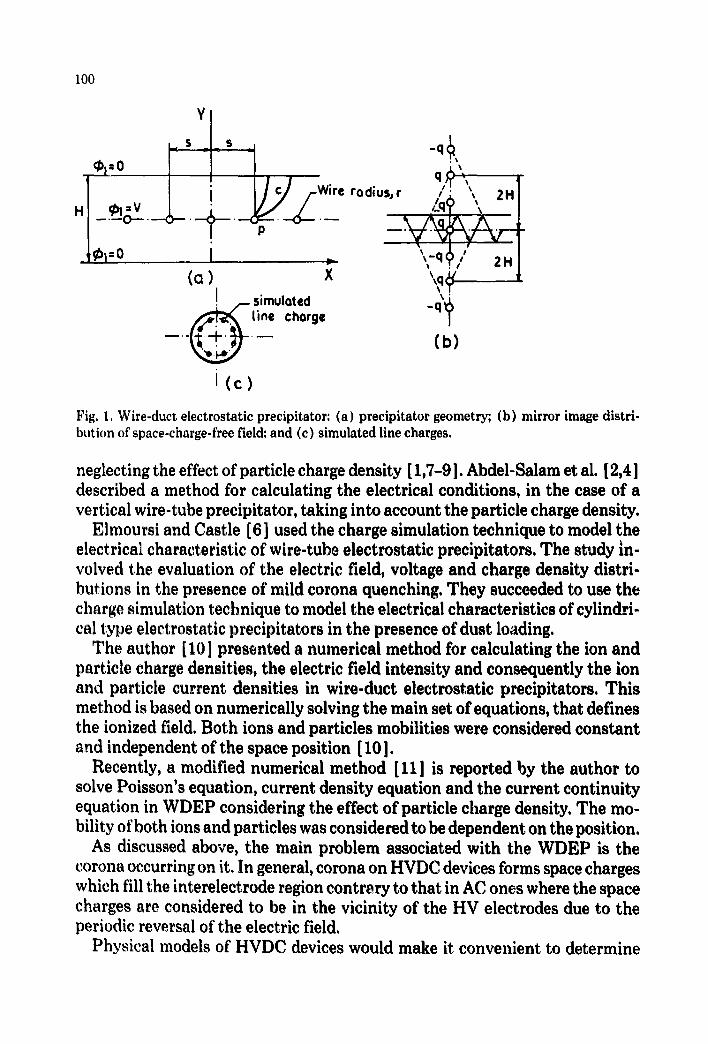
The most common geometry for electrostatic precipitation is the wire-duct electrostatic precipitator, Fig. 1, where the gas flows between grounded parallel plates of sheet metal and high voltage electrodes. These electrodes are a series of equally spaced long wires weighted and hanging between the plates or are supported there by rigid frames.
Theoretical as well as experimental analysis in wire-tube electrostatic pre- cipitators have received the attention of different investigators [2-6]. Most models depend on numerically solving of the main system of equations describ- ing the precipitator geometry with a certain choice of boundary conditions,
0304-3886/91/$03.50 © 1991 Elsevier Science Publishers B.V. All rights reserved. J
I00
@i=0
-±.
Y
' " radiusjr /,i, \~ 2H
', _ J . , '
(a) x ~ . ~ simulated
line chorge "q~)
(b)
(c)
Fig. 1. Wire-duct electrostatic precipitator: (a) precipitator geometry; (b) mirror image distri- bution of space-charge-free field; and (c) simulated line charges.
neglecting the effect of particle charge density [ 1,7-9 I. Abdel-Salam et al. [ 2,4 ] described a method for calculating the electrical conditions, in the case of a vertical wire-tube precipitator, taking into account the particle charge density.
Elmoursi and Castle [6 ] used the charge simulation technique to model the electrical characteristic of wire-tube electrostatic precipitators. The study in- volved the evaluation of the electric field, voltage and charge density distri- butions in the presence of mild corona quenching. They succeeded to use the charge simulation technique to model the electrical characteristics of cylindri- cal type electrostatic precipitators in the presence of dust loading.
The author [10] presented a numerical method for calculating the ion and particle charge densities, the electric field intensity and consequently the ion and particle current densities in wire-duct electrostatic precipitators. This method is based on numerically solving the main set of equations, that defines the ionized field. Both ions and particles mobilities were considered constant and independent of the space position [10].
Recently, a modified numerical method [11] is reported by the author to solve Poisson's equation, current density equation and the current continuity equation in WDEP considering the effect of particle charge density. The mo- bility of both ions and particles was considered to be dependent on the position.
As discussed above, the main problem associated with the WDEP is the corona occurring on it. In general, corona on HVDC devices forms space charges which fill the interelectrode region contrery to that in AC ones where the space charges are considered to be in the vicinity of the HV electrodes due to the periodic reversal of the electric field.
Physical models of HVDC devices would make it convenient to determine

101
the performance of full scale devices by means of laboratory tests with smaller dimensions and lower applied voltages. Modeling of WDEP accounting for its geometry is much more complicated. The problem can be solved exactly only in the cases of the electrostatic and the saturated corona [12,13]. In reality, the exact solution of the nonsaturated ionized field is extremely difficult due to the nonlinear nature of the problem. All attempts in the literature as shown before were based on some simplifying assumptions.
In this paper, the author suggests an easy, fast and simple method to esti- mate the electrical and precipitated profiles at the plate surface of the WDEP and under saturated conditions. This method is based on simple expressions and the space-charge-free solution. The space charge of both ions and particles are considered. The derived expressions are function of the length of the field line terminated to the lateral position on the collecting electrode.
2. Method of analysis
Calculations [ 10,11 ] show that the field intensity E at any position X on the grounded plate and underneath the HV wires beyond the corona onset value can be represented by
E=A+BV (I)
where V is the applied voltage and A and B are constants depending on the position X along the grounded plate and the corresponding corona onset value at such plate surface.
For saturated corona [12,13], the corona onset voltage and the onset field are zeros and the saturated field intensity E, at any position on the grounded plate can be given in the form
E, fBV. (2)
Equation (2) means that the relation between the saturated field intensity and the applied voltage at constant position X, which is equivalent to a con- stant field line length L terminated to such position, is a straight line with slope B. It is well known that, the higher the distance X, the longer the field line length L and the lower is the saturated field intensity. This can be satisfied by assuming the constant B, in eqn. (2), equals K,/L. Then eqn. (2) becomes
E, fK , V/L (3)
where K, is a constant. This constant depends on the intersection position of the field line with the grounded plate.
For saturated corona where the wire charge density is very small, and by integrating Poisson's equation (~'.E=p/eo), one can find the saturated value of the ion charge density Pi,, close to the grounded plate, as
pi, = K2eo V/L 2 (4)

102
where ~o is the air permittivity and/(2 is another constant. In this case the value of the charge density means only the component due to ions saturated charge density. The total saturated space charge density Ps, at the grounded plate, is given as
ps = pis-F Pp. (5)
The influence of particle charge pp, near the grounded electrodes, on the field may be approximated by assuming that the particle concentration Cp is con- stant over a given cross section of the precipitator. The particle's specific sur- face Sp, the surface per unit volume of gas, is given [ 14 ] as
Sp.- 47tr2p Cp (6)
where rp is the radius of an assumed spherical particle. The dust particle is charged by an ion-bombardment process, which is the dominant particle- charging mechanism in most precipitator applications [14-16 ]. The limiting value of particle charge density pp is given as
pp--~oFSpEss (7)
where F is a constant with F= 3 for conducting particles and Fffi 3~/(~ + 2) for particles of relative permittivity ~. Es~ is the charging field intensity and is given as
E~ ( ffi K~ V/L) is the saturated field intensity with space charge presence and E~, is the space-charge-free field intensity which is defined as Eo ffi K'~ V/L; then eqn. (8) becon~es
WL. $~ubstituting in eqn. (7) one can find
(9)
with
The mobility Kp of the dust particle essentially charged to Q is determined by balancing the electrical force with Stokes drag force [4] and it is given by
K.=pp/ ( 6 Cpvrp) (11)
where v is the gas viscosity. The substitution of eqn. (10) in eqn. (11) leads to
KpfF2V/L and l?,~ffir~/(6~Cpvrp). (12)
Substituting eqns. (4) and (10) in eqn. (5), the total saturated value of space charge is given as
ppffiF~ V/L (10)

103
ps-K2coV/L2 + F~ V/L. (13)
The saturated current density J~ at the grounded plate is given by
Js= (Kip,,-t-gppp) Es (14)
with Ki and Kp as the mobility of both ions and particles respectively. It has been anticipated that the overall precipitation efficiency of the elec-
trostatic precipitator ~/is the ratio between the overall weight of the precipi- tated dust Wp and the total weight of the inlet dust W~, i.e.
Wp/Wi. (15)
The overall relative precipitated dust in weight Wp/Wi along the collecting plates is given by the area under the distribution of the relative precipitated dust RPD. The relative precipitated dust on the collecting plates and under- neath the wires changes from one position to another. At any distance X from the symmetry axis Y, Fig. 1, consider an infinitesimal element of width (ix, length D, equals the precipitator length, and thickness 1-1/2. The relative pre- cipitated dust at such position and through the element is given as
(dw/W)- - (2 a~/H) dt
with OJp as the migration velocity of the particle at such position and dt as the incremental travelling time of the particle. Integrate this equation from the inlet to the outlet positions of the precipitator. In other words the integration conditions are:
tffi0 and Wffi Wi at input position
tffi T and Wffi Wo at output position.
T is the total travelling time of the particulate dust along the precipitator and it depends on the dust flow direction and not on the position X. It is measured from it8 entrance instant up to the departure instant from the precipitator. The value of the particle travelling time is given as TfD/oJg with Wg as the gas velocity. According to the above basis, one can fined an expression of the RPD at position X as
RPD= ( Wi- Wo)/Wi= 1 - e - 2~D/(HwR). (16)
In general, one can write, RPD ffi 1 - e- ~'~p with ~ as the specific collecting area which is defined as the ratio between the precipitator collecting area and the gas flow rate.
A solid particle, spherical in shape is considered in order to obtain the equa- tion of its migration velocity at position X. It is necessary to anticipate that the forces acting on the solid particle are in equilibrium. The forces which are considered in present work are the resisting force and the electrostatic force of

104
d~
1.15
1.10
l'0~ I
|.01
0.90t~// 0 . 8 5 ~ - 0.8 0
0.55 0,65 0 35 0.85 Ratio LI H
Fig. 2. Factors Kl (solid curve) and K2 (dashed one) versus ratio L/If.
the medium [ 14-16 ]. According to the above analysis and neglecting the force of inertia, one can find an expression of the particle migration velocity as
w,,=[2e,,r,,FK~(K,-K~)/(3v)] [V/L] 2. (17)
The overall efficiency of the electrostatic precipitator ~/is the average value of the RPD through the total precipitator width. According to the symmetry around X--0, YffiH/2 and XffiS/2, the present analysis is focused in the re- gion which is defined by 0 ~ X<~ S/2 and 0 ~< Y~/-//2. Equations (3) and (13)- (17) describe the lateral distribution of the satu-
rated values over the grounded plate and underneath the energized wires of the WDEP, These equations depend on the values of factors K~ and K~ for field intensity with and without space charge respectively and K2 for space charge density. The method presented before [10,11] is used here only to determine the values of factors K~ and K2. Different dimensions of the wire-duct electro- static precipitators are used. The average values of these factors are calculated and plotted as shown in Fig. 2. For any normalized length (L/H) of the field line, terminated to normalized position (X/H) on the grounded plate, one can find the corresponding values of the factors K~ and Ks.
3. Computational steps
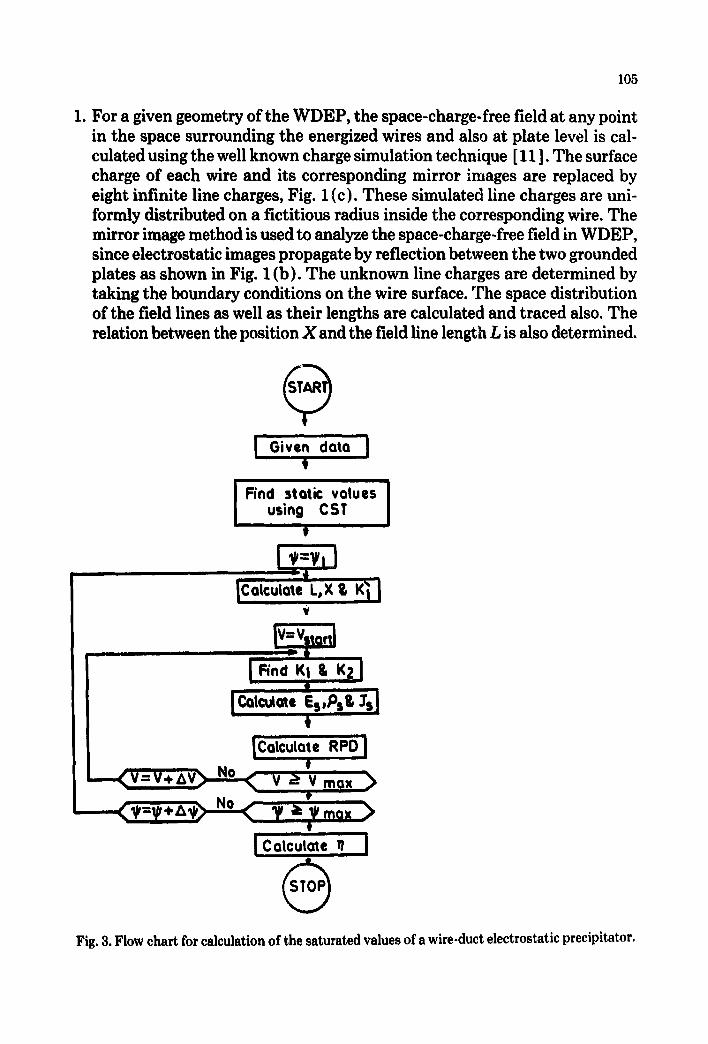
According to the analysis presented above, the following method is suggested by the author in order to estimate the electrical and precipitated profiles at grounded plate and underneath HV wires of the WDEP. The main steps of this method are shown in Fig. 3 as a flow chart and also summarized as follows:
105
1. For a given geometry of the WDEP, the space-charge-free field at any point in the space surrounding the energized wires and also at plate level is cal- culated using the well known charge simulation technique [ 11]. The surface charge of each wire and its corresponding mirror images are replaced by eight infinite line charges, Fig. 1(c). These simulated line charges are uni- formly distributed on a fictitious radius inside the corresponding wire. The mirror image method is used to analyze the space-charge-free field in WDEP, since electrostatic images propagate by reflection between the two ~ounded plates as shown in Fig. 1 (b). The unknown line charges are determined by taking the boundary conditions on the wire surface. The space distribution of the field lines as well as their lengths are calculated and traced also. The relation between the position X and the field line length L is also determined.
J ,Given data i
Coiculole L,X t, v
Rnd KI II,
Es,.osv, J's
I i'Calcutate RPOJ
I
i,,.colc.to . I
Fig. 3. Flow chart for calculation of the saturated values of a wire-duct electrostatic precipitator.
106
2. At any position X on the plate level, at which the field line (with length L) is terminated or emanated, the value of the space-charge-free field intensity per unit applied voltage is obtained by using the obtained results from step number 1. This value is considered as the value of the factor K~. This field line is emanated from or terminated at the energized wire with angle ~ ( = 91~) clockwise with the Y-direction.
3. According to the normalized value of the field line length, find the suitable values of factors K~ and K2 by using Fig. 2.
4. The saturated values of field intensity, charge density, current density, par- ticle drift velocity and the relative precipitated dust are calculated using eqns. (3) and (13)-(17) at starting voltage V~,t.
5. Repeat the last steps for all points on the plate level corresponding to all flux lines emanated from the wire surface till the maximum emanating angle ~mx. This determines the electrical and precipitation conditions along the plate surface at a certain value of the applied voltage V.
6. Calculate the precipitation efficiency at such value of the applied voltage by integrating the relative precipitated dust along the grounded plate.
7. Increment the applied voltage V by step ,tV and repeat steps 1-5 to deter- mine the lateral values at all the applied voltage values till the maximum applied voltage Vmax.
4. Resu l t s and discuss ion
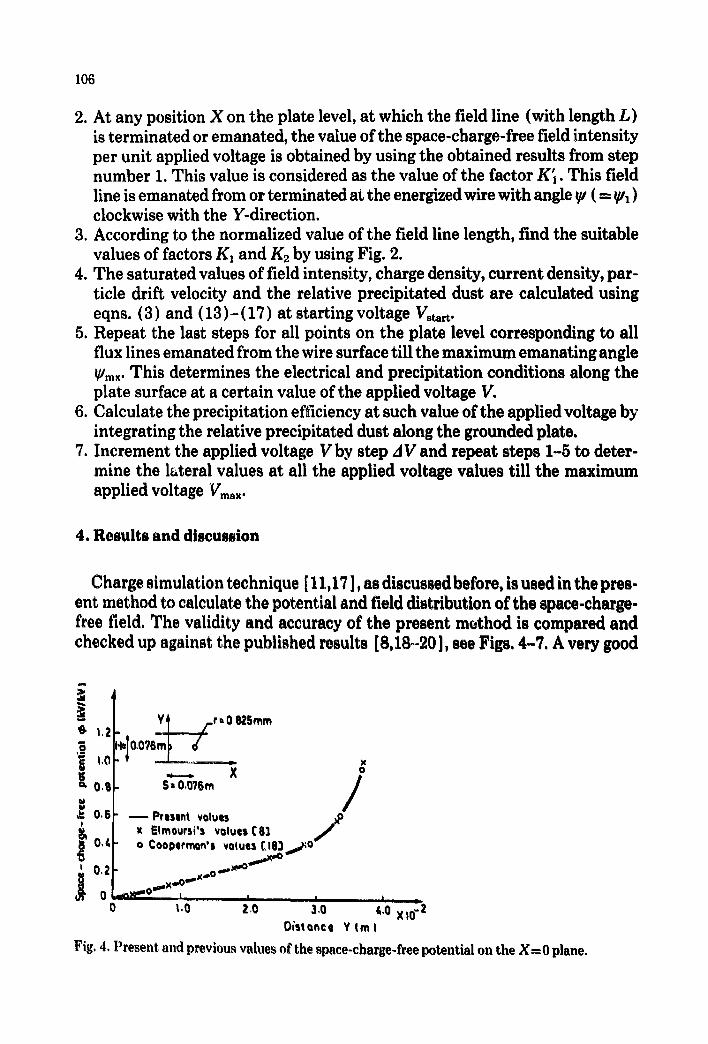
Charge simulation technique [ 11,17 ], as discussed before, is used in the pres- ent method to calculate the potential and field distribution of the space-charge- free field. The validity and accuracy of the present method is compared and checked up against the published results [8,18-20], see Figs. 4-7. A very good
- Y ~ t.r. 0 ~.Smm
0.07
U
~" 0.8 U u
I
0 0
X 0 X
S* O,O'/Sm /
Present voluu x EImoursi's values(8] ~ " • ¢oopcrr~n's vatues ClO:)~o
I I |
1.0 2.0 3.0 t,.O X10-2 Oiston¢¢ Y (ml
Fig, 4, Present and previous values of the space-charge-free potential on the X - 0 plane.

107
x,o 2
,T, 3.o
,o 2.0
0 4.0 Xl0 -2 Y l m l
Y I / r : 0.825mm
Hf[O.OT6m I o J-
- - Present calculations x Elmours~'s values [ 8 ] o B~hm's values (193 x
/ .~--ax-~- o~....o,,~-T.o x ~ °x"~.
1.0 2.0 3.O
Distance
Fig. 5. Present and previous values of the space-charge-free field intensity through the X-- 0 plane.
+
| ox ~ox ~ox
i i..io,_ t o .
,[ ;c Present values
x Etmours|'s vQluss [8.1 0 ,, o B6hm~s. values IC193 I
0 ).0 LO 3,0 I L
4,0 X l(f 2 Distance X (rn)
Fig. 6. Present and previous values of the space-charge-free field intensity at Yffi 0 plane.
agreement has been seen between the present values and the previous ones which were obtained from both mathematical [18-20] and numerical [8] models. Cement dust is used in present analysis as particles [ 11 ]. The cement dust
has been assumed to have a concentration Cd of 18 g/m 3, a specific gravity Sg of 1.69 g/cm 3 and the particles are considered as conducting particles with a dominant particle diameter of 60 ltm. The gas velocity v is taken as 184 × 10 - 7
Ns/m ~ [4]. The particle concentration can be calculated as Cp=3Cd/ (4~Sgr3p). Felici's model [21] is used in present analysis. The original geome-

I08
"1 'l ,,-"°"" 6o .:io.3,. <~ _-
~ 5 m X
& 3 , Present values
x Sekor,s values [201
" l o p / _ . _ . _ , I
in 0p.__^.---x-T-~ x i o 5 Io ~S x~d 2
Distance Y (rnl
Fig. 7. Present and previous values of the space-charge, free field intensity at X-0 plane.
0,85L o,o / o o.,o~ /
0.0 0 .Z 0.4
Ratio Xl H
Fig. 8. The relation between normalized fie]d line length and its intersection position at plate surface.
o
e ~i, 6o, o ~ 6 ~ o /
o.o !,o.o F / j -= 20.I1 _ 2 0 , 0
~. 0,01~ , I J I ~ J t ~ 0.0 0.02 0.06 0.10 0,1t ~ 110 10.0 iOO 30.0 t,0.O S00
(a) Ois tonct X ! m ,~ (b) Appl i id voltage V I kv)
Fig. 9(a), Lateral distribution of the satu- rated field intensity upon the plate of the WDEP at different applied voltages ( V= 10, 20, 30, 40 and 50 kV from bottom to top respectively).
Fig. 9 (b). The saturated field intensity versus the applied voltage (for L/H=O.5, 0.507, 0.587 and 0.839 from top to bottom respectively).
try of this wire-duct electrostatic precipitator model has a wire of 0.127 mm radius and a plate-to-plate spacing H of 0.2 m.
Figure 8 shows the relations between the field line length L normalized to the plate-to-plate spacing H and the intersection position X at plate surface
109
' • 60.0
tO.O / . . . . . . . . . - - '
o~ 0.00 0.06 0.0$ O.IZ ff 0 .0 ~ , , ~ , , , } 0.0 IO.O 20.0 30.0 60.0 50.0
(a) Distance X Im ) (b) Applied voltoge V (kv)
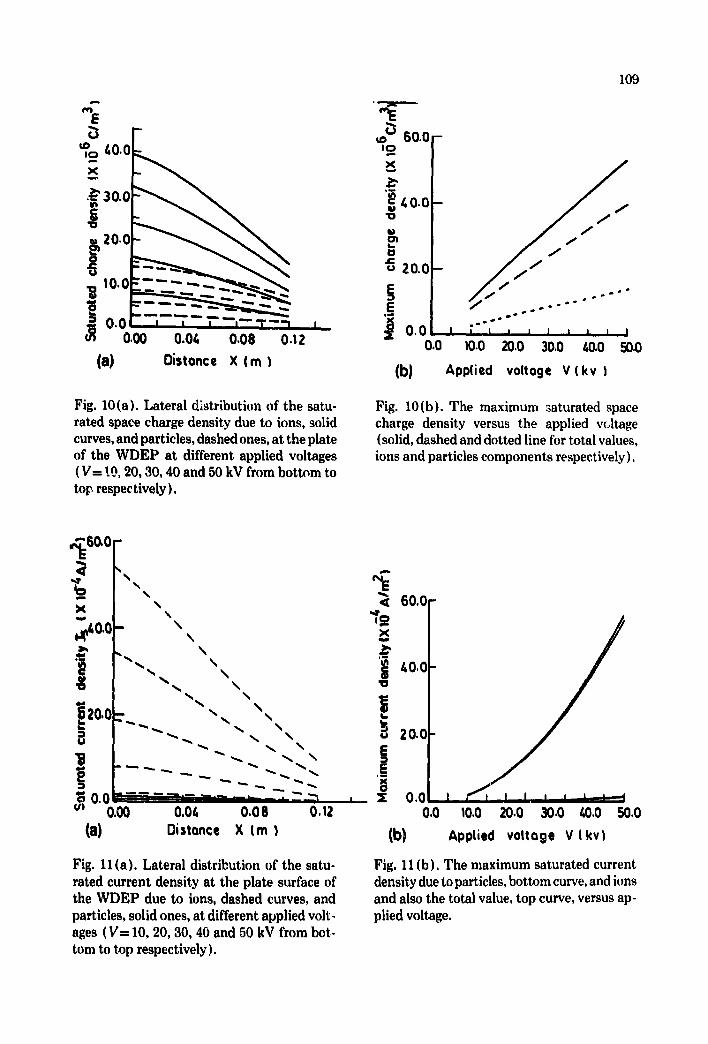
Fig. lO(a). Lateral distribution of the satu- rated space charge density due to ions, solid curves, and particles, dashed ones, at the plate of the WDEP at different applied voltages ( V= !9. 20, 30, 40 and 50 kV from bottom to tar, respectively).
Fig. 10(b). The maximum saturated space charge density versus the applied voltage { solid, dashed and dotted line for total values, ions and particles components respectively).
| , 60.0 ,o.o I- , ,
l " , , " \ 40,0[- / -___ .
0.0- . . . . . . . . . . . . . . - - ' - - '~ , X O.OL I ~ I I , , i ~
v, 0.00 0.06 0.0B 0.1Z 0.0 10.0 20.0 30,0 40.0 50.0
(a) Distance X Im ) (b) Applied voltage V I kv}
Fig. 11(a). Lateral distribution of the satu- rated current density at the plate surface of the WDEP due to ions, dashed curves, and particles, solid ones, at different applied volt. ages (V= 10, 20, 30, 40 and 50 kV from bot- tom to top respectively).
Fig. 11 (b). The maximum saturated current density due to particles, bottom curve, and ions and also the total value, top curve, versus ap- plied voltage.

110
• - ~ ~ 100. IO0.O I
n,,
I =~® 6o.o I ~ \ ~= 6o.o I "a.
\ °'°°F ,o I 0.01 I I I I I I I 0 . 0 I l ! ' I , , , , i
0.00 0.04 0.08 0.t2 0.0 t0.0 Z0.O 30.0 t,0.O 50.0
(a) D i s t a n c e X ( m I (b ) A p p l i e d v o l t a g e V (kv l
Fig. 12 (a). Lateral distribution of the relative precipitated dust at the plate of the WDEP at different applied voltages (V-10, 20, 30, 40 and 50 kV from bottom to top respectively).
Fig. 12(b). The relation between the RPDm and the applied voltage.
°°°r, / ": ~00~ ~ ,00
0 , 0 ! ' ' t i I I = I I I 0 , 0 ~ 0.0 t0.0 Z0,0 ~ 0 40.0 50.0
Applied voltage V ikvl
Fig. 13. The relation between the precipita- tion efficiency of the WDEP and the applied voltage.
0.0 1,0 2.0 3.0 4.0
Precipitator length (m)
Fig. 14. The specific collecting area (SCA) versus the precipitator length for oJgffi 10, 8, 6, 4 and 2 m/s from bottom curve to top one respectively.
normalized also to the spacing H. Different models as well as different dimen- sions are taken into consideration.
Figure 9 (a) shows the present calculations of the lateral distribution of the

.~ 50.
40.
~ 3o.o[- 20.01 , i , , , ,
0.00 0.04 0.08 0.12
(a) Distance X ( m )
Fig. 15 (a). Lateral distribution of the relative precipitated dust at the plate of the WDEP at different specific collecting area ( = 0.2, 0.5, 1, 2 and >.>. 3 respectively from bottom to top).
111
,., 90.0
~ 80.0 G.
E 7 0 0 -
E ' ; 6O 0 - 0 Z
50.0 -
40.0 0.0
(b)
F
I I I I I I I 1.0 2,0 3.0
Specific co l tec t ing o r e o SCA (seclml
Fig. 15(b). The relation between the RPDm and the SCA.
~SO.¢ m
i I i
1.0 40.¢ , i J
0.0 2.0 3.0
- 9 0 . 0 ~ 80.0
?O.C
i ! 60.C
S p e c i f i c c o t l e c t i n g o r e G S C A ( s e c l m )
Fig. 16. The relation between the precipitation efficiency and the specific collecting area of the WDEP.
saturated field intensity along the plate surface and underneath the wire of the original geometry. Different applied voltages are considered. The saturated field intensity versus the applied voltage and at different ratio (L/H) is shown in Fig. 9 (b). The saturated charge distribution for both ions and particles on the plate surface of the same model at different applied voltages is shown in Fig. 10(a). The saturated charge density for both ions and particles at any position on the grounded plate changes linearly with the applied voltage is

112
shown in Fig. 10 (b). The corresponding saturated current density along the plate level and at different applied voltages is shown in Fig. 11(a). The maxi- mum current density versus the applied voltage for ions, particles and the total value are shown in Fig. 11 (b).
It is seen that the saturated values at any position on the plate level of the WDEP increase with the applied voltage, Figs. 9-11. This can be attributed to the fact that the space charge density over the interelectrode spacing increases with increasing the applied voltage. Therefore the flux lines of the ionized field are expected to be more constricted with an increase in the applied voltage. This means that the ions emitted from the wire will be convected along flux lines, which are constricted close to the central axis of the wire where the ap- plied field is very high. A symmetry appears around the maximum vahm of each distribution on the grounded plate which lies directly underneath the wire. This is in agreement with previous findings in corona discharge [22,23 ]. This confirms that the saturated distribution of the electrical values over the plate level of the WDEP is characterized by a Gaussian curve whose peak is located directly underneath the wire.
Figure 12 (a) shows the lateral distribution of the relative precipitated dust RPD over the collecting plate of the WDEP and underneath its energized wire at different applied voltage. The relation between the maximum value of the RPD (i.e. at X--0) and the applied voltage of the same geometry is shown in Fig. 12 (b). The dimensions of the original geometry are kept constant except for the applied voltage which ranges from 10 to 50 kV. It is seen that the value of the RPD increases by increasing the distance X at constant applied voltage (Fig. 12 (a)). Also by increasing the applied voltage and at certain position X, the RPD increases as shown in Fig, 12 (b).
The overall precipitation efficiency increases with the applied voltage as shown in Fig. 13. It is well known, as mentioned before, that the relative pre- cipitated dust and then the overall precipitation efficiency assuming constant value of the du~t concentration will be effected by the particle migration ve- locity ~op and the specific collecting area ~ which is defined as the ratio between the precipitator collecting area and the gas flow rate. The most important pa- rameters of the specific collecting area are the precipitator length D, gas ve- locity w~ and the plate-to-plate spacing H. For a certain value of the spacing distance H, the relation between the specific collecting area (SCA) and the precipitator length at different values of the gas velocity is shown in Fig. 14.
Figure 15 (a) shows the effect of specific collecting area on the lateral distri- bution of the relative precipitated dust on the plate surface and underneath HV wires of the WDEP. All the data of the original model, mentioned before, are kept constant except the applied voltage which is considered 50 kV. It is seen that the value of the relative precipitated dust at certain position on the plate surface increases with the specific collecting area as shown in Fig. 15 (b). The overall precipitation efficiency increases by increasing the specific col-

113
lecting area as shown in Fig. 16. The applied voltage is considered also 50 kV and the rest parameters remain constant.
5. Conclusions
On the basis of the presented analysis, the following conclusions can be drawn concerning the wire-duct electrostatic precipitators: 1. Both absolute and normalized saturated profiles over the grounded plate
and underneath HV wires of the wire-duct electrostatic precipitators are estimated in presence of dust particles using simple expressions.
2. The precipitation efficiency of the WDEP with saturated condition is also estimated.
3. Relations between the electrical and collection values and the length of the field line at any position over the plate surface of the WDEP under saturated conditions are determined.
4. These expressions are considered to be a practical guide for the designers and also as a fast estimation for finding the electrical and collection quantities.
Aeknowledgement
The author, who is on a sabbatical leave from Assiut University of Egypt, wishes to acknowledge the Alexander yon Humboldt Foundation, Germany for the financial support he received during this work.
References
1 J.R. McDonald, W.B. Smith and H.W. Spencer, A mathematical model for calculating elec- trical conditions in wire-duct electrostatic precipitation devices, J. Appl. Phys., 48 (1977) 2231-2243.
2 M. Abdel-Salam and L. Fouad, Electrostatic precipitation under high temperature, IEEE/ IAS Conference, Chicago, IL, 1984, pp. 1201-1206.
3 P. Cooperman, A theory for space--charge limited currents with application to electrical precipitation, AIEE Trans., (March 1960) 47-50.
4 M. Abdel-Salam, L. Fouad, S. EI-Hazek and M. Abou-Hussein, Wire-tube electrostatic pre- cipitator for cement factories, IEEE/IAS Conference, San Francisco, CA, 1982, pp. 1129- 1135.
5 M. Abdel-Aziz, Economical temperature and velocity optimization of pipe type precipitator, IEEE/IAS Conference, Toronto, Ont., 1978.
6 A.A. Elmoursi and G.S.P. Castle, The analysis of corona quenching in cylindrical precipita- tors using charge simulation, IEEE Trans., IA.22 (1) (1986) 80-85.
7 G.A. Kallio and D.E. Stock, Computation of electrical conditions inside wire-duct electro- static precipitators using a combined finite element, finite difference technique, J. Appl. Phys., 59(6) (1986) 1799-1806.
8 A.A. Elmoursi and G.S.P. Castle, Modeling of corona characteristics in a wire-duct precipi- tator using the charge simulation technique, IEEE Trans., IA-23 ( 1 ) (1987) 95-102.

114
9 T. Ohkubo, Y. Nomoto, T. Adachi and K.J. McLean, Electric field in a wire-duct type elec- trostatic precipitator, J. Electrostat., 18 (1986) 289-303.
10 S. Abdel-Sattar and A.A. Ibrahim, On the wire-duct electrostatic precipitator, IEEE/IAS Annual Meeting, Part II (1986) 1113-1118.
11 S. Abdel-Sattar and S. Singer, Electrical conditions in wire-duct electrostatic precipitators, J. Electrostat., 26(1) (1991) 1-20.
12 L.E. Zaffanella, Space charge effects of HVDC transmission line corona full scale and model line tests, Proc. 1984 Japan-US Science Seminar, 1984, pp. 109-122.
13 S. Abdel-Sattar, On the saturated corona profiles at ground surface and underneath HVDC lines, Acta Phys. Hungarica, 67 (1990).
14 A.D. Moore, Electrostatics and Its Applications, Wiley, New York, 1973. 15 H.J. White, Particle charging in electrostatic precipitation, AIEE Trans., 70 (1951) 1186-
1191. 16 H. Brauer and Y.B.G. Varma, Air Pollution Control Equipment, Springer, Berlin/Heidel-
berg/New York, 1981. 17 H. Singer, H. Steinbigler and P. Weig, A charge siw.,,lation method for the calculation of HV
fields, IEEE Trans., PAS-93 (1974) 1660-1668. 18 P. Cooperman, Report No. 46, Research Cottrell Inc., Bound Brook, NJ, 1952. 19 J. B~hm, Back discharge in electrostatic gas cleaning, Staub-Reinhalt. Luft, 30(3) (March
1970). 20 S. Sekar and H. Stomberg, On the prediction of current-voltage characteristics for wire-plate
precipitators, J. Electrostat., 10 (1981) 35-43. 21 N.J. Feliei, Recent advances in the analysis of DC ionized electric field--part II, Direct Curr.,
8 (1963) 278-287. 22 M. Abde|-Salam, M. Farghally and S. AbdeI-Sattar, DC corona discharge monopolar bundle
wires, Acta Phys. Hungarica, 54 (3-4) (1983) 313-331. 23 M. Abdel-Salam, M. Farghally and S. Abdel-Sattar, Monopolar corona on bundle conductors,
IEEE Trans,, PAS-101 (1982) 4079-4089. 24 P.A. LawLess and R.F. Airman, An integrated electrostatic precipitator model for microcom-
puters, VIII Symposium on the Transfer and Utilization of Particulate Control Technology, San Diego, CA, 1990,
25 P.A. Lawless and N. Pinks, An advanced mkrocomputer model for electrostatic precipitators, VIII Symposium on the Transfer and Utilization of Particulate Control Technology, San Diego, CA, 1990,