Electrochemical determination of guanine and adenine by CdS microspheres modified electrode and...
7
Biosensors and Bioelectronics 26 (2010) 314–320 Contents lists available at ScienceDirect Biosensors and Bioelectronics journal homepage: www.elsevier.com/locate/bios Electrochemical determination of guanine and adenine by CdS microspheres modified electrode and evaluation of damage to DNA purine bases by UV radiation A. Ferancová a,b,∗ , S. Rengaraj a , Y. Kim c , J. Labuda b , M. Sillanpää a,d a University of Eastern Finland, Laboratory of Applied Environmental Chemistry, Patteristonkatu 1, FI-50100 Mikkeli, Finland b Institute of Analytical Chemistry, Slovak University of Technology in Bratislava, Radlinskeho 9, 81237 Bratislava, Slovakia c Department of Chemical Engineering, Kwangwoon University, Wolgye, Nowon, Seoul 139-701, Republic of Korea d LUT Faculty of Technology, Lappeenranta University of Technology, Patteristonkatu 1, FI-50100 Mikkeli, Finland article info Article history: Received 21 April 2010 Received in revised form 4 August 2010 Accepted 12 August 2010 Available online 19 August 2010 Keywords: CdS microsphere Chitosan Electrochemical sensor Adenine Guanine abstract Sensitive electrochemical sensor based on a composite of novel pearl-like CdS microspheres and chitosan (CdS–CHIT/GCE) was constructed and characterized using cyclic voltammetry. Single-stranded (ssDNA) and double-stranded (dsDNA) deoxyribonuleic acid were electrochemically adsorbed onto CdS–CHIT/GCE and a significant difference in electrochemical impedance spectra of the ssDNA/CdS–CHIT/GCE and dsDNA/CdS–CHIT/GCE electrodes was found. Electrocatalytic properties of CdS allowed to use the CdS–CHIT/GCE successfully for the trace determination of simple guanine and adenine with nanomo- lar detection limits by differential pulse voltammetry (DPV). Moreover, damage to the DNA purine bases, guanine and adenine, liberated in previously hydrolyzed calf thymus dsDNA, caused by UV-B, UV-C, and visible light was evaluated. While only minor changes in anodic DPV response of guanine and adenine could be seen after 60 min exposition to UV-B and visible light, total degradation of DNA bases was observed after 20 min exposure to UV-C. A great potential of the CdS microspheres used as the interface at the nucleic acid based biosensors was demonstrated. © 2010 Elsevier B.V. All rights reserved. 1. Introduction In recent years, different metal and semiconductor nanopar- ticles have widely been used in electrochemical sensors and biosensors (Gill et al., 2008; Chaniotakis and Sofikiti, 2008; Frasco and Chaniotakis, 2009; Wang and Hu, 2009). They exhibit unique optical, electrochemical and catalytic properties, moreover, their small size allows the miniaturization of final sensors. Gold, sil- ver or platinum nanoparticles as well as semiconducting quantum dots, such as CdS, ZnS or PbS, have excellent biocompatibility and they are often used in bioconjugation with biological materials (Willner et al., 2007). Nanomaterials were used to improve the glu- cose oxidase immobilization as well as signal transduction between enzyme redox center and electrode surface (Huang et al., 2005). Guanine adsorbed onto nickel oxide or zinc oxide nanoparticles ∗ Corresponding author at: University of Eastern Finland, Laboratory of Applied Environmental Chemistry, Patteristonkatu 1, FI-50100 Mikkeli, Finland. Tel.: +358 40 3553703; fax: +358 15 336013. E-mail addresses: Adriana.Ferancova@uef.fi, [email protected] (A. Ferancová), [email protected] (S. Rengaraj), [email protected] (Y. Kim), [email protected] (J. Labuda), Mika.Sillanpaa@uef.fi (M. Sillanpää). modified electrode exhibited high electrocatalytic activity towards insulin and l-cysteine (Salimi et al., 2008; Hallaj et al., 2009). Cad- mium sulphide enhanced the electron transfer rate and allowed the electrochemical determination of hemoglobin (Liu et al., 2006). Direct electrochemistry of hemoglobin modified with CdS was used for the determination of hydrogen peroxide (Xu et al., 2007). In the case of DNA biosensors, metal and semiconductor nanoparticles are widely used as label tags for the amplification of detection of DNA hybridization (Kang et al., 2007; Karadeniz et al., 2007; Zhu et al., 2005; Hansen et al., 2006). On the other hand, DNA immobi- lized at the electrode surface together with metal nanoparticles was used to enhance the electron transfer between the redox species and the electrode and showed the electrocatalytic activity towards hydrogen peroxide (Gu and Hasebe, 2006; Lo et al., 2008). TiO 2 nanoparticles and Au nanoparticles modified electrodes were also used for the electrocatalytic determination of guanine and adenine (Ardakani et al., 2008; Liu et al., 2008). Electrochemical sensors and biosensors are frequently used for the detection of damage to DNA (Diculescu et al., 2005). DNA and its components adsorbed or covalently attached at the surface of electrode can give important information about the stage of DNA molecule. Therefore, the development of new sensitive sensors is not important only for the trace determination of DNA bases, but 0956-5663/$ – see front matter © 2010 Elsevier B.V. All rights reserved. doi:10.1016/j.bios.2010.08.026
Transcript of Electrochemical determination of guanine and adenine by CdS microspheres modified electrode and...

Emr
Aa
b
c
d
a
ARRAA
KCCEAG
1
tbaosvdt(ceG
ET
(j
0d
Biosensors and Bioelectronics 26 (2010) 314–320
Contents lists available at ScienceDirect
Biosensors and Bioelectronics
journa l homepage: www.e lsev ier .com/ locate /b ios
lectrochemical determination of guanine and adenine by CdS microspheresodified electrode and evaluation of damage to DNA purine bases by UV
adiation
. Ferancováa,b,∗, S. Rengaraja, Y. Kimc, J. Labudab, M. Sillanpääa,d
University of Eastern Finland, Laboratory of Applied Environmental Chemistry, Patteristonkatu 1, FI-50100 Mikkeli, FinlandInstitute of Analytical Chemistry, Slovak University of Technology in Bratislava, Radlinskeho 9, 81237 Bratislava, SlovakiaDepartment of Chemical Engineering, Kwangwoon University, Wolgye, Nowon, Seoul 139-701, Republic of KoreaLUT Faculty of Technology, Lappeenranta University of Technology, Patteristonkatu 1, FI-50100 Mikkeli, Finland
r t i c l e i n f o
rticle history:eceived 21 April 2010eceived in revised form 4 August 2010ccepted 12 August 2010vailable online 19 August 2010
a b s t r a c t
Sensitive electrochemical sensor based on a composite of novel pearl-like CdS microspheres and chitosan(CdS–CHIT/GCE) was constructed and characterized using cyclic voltammetry. Single-stranded (ssDNA)and double-stranded (dsDNA) deoxyribonuleic acid were electrochemically adsorbed onto CdS–CHIT/GCEand a significant difference in electrochemical impedance spectra of the ssDNA/CdS–CHIT/GCE anddsDNA/CdS–CHIT/GCE electrodes was found. Electrocatalytic properties of CdS allowed to use the
eywords:dS microspherehitosanlectrochemical sensordenineuanine
CdS–CHIT/GCE successfully for the trace determination of simple guanine and adenine with nanomo-lar detection limits by differential pulse voltammetry (DPV). Moreover, damage to the DNA purine bases,guanine and adenine, liberated in previously hydrolyzed calf thymus dsDNA, caused by UV-B, UV-C, andvisible light was evaluated. While only minor changes in anodic DPV response of guanine and adeninecould be seen after 60 min exposition to UV-B and visible light, total degradation of DNA bases wasobserved after 20 min exposure to UV-C. A great potential of the CdS microspheres used as the interface
biose
at the nucleic acid based. Introduction
In recent years, different metal and semiconductor nanopar-icles have widely been used in electrochemical sensors andiosensors (Gill et al., 2008; Chaniotakis and Sofikiti, 2008; Frascond Chaniotakis, 2009; Wang and Hu, 2009). They exhibit uniqueptical, electrochemical and catalytic properties, moreover, theirmall size allows the miniaturization of final sensors. Gold, sil-er or platinum nanoparticles as well as semiconducting quantumots, such as CdS, ZnS or PbS, have excellent biocompatibility andhey are often used in bioconjugation with biological materials
Willner et al., 2007). Nanomaterials were used to improve the glu-ose oxidase immobilization as well as signal transduction betweennzyme redox center and electrode surface (Huang et al., 2005).uanine adsorbed onto nickel oxide or zinc oxide nanoparticles∗ Corresponding author at: University of Eastern Finland, Laboratory of Appliednvironmental Chemistry, Patteristonkatu 1, FI-50100 Mikkeli, Finland.el.: +358 40 3553703; fax: +358 15 336013.
E-mail addresses: [email protected], [email protected]. Ferancová), [email protected] (S. Rengaraj), [email protected] (Y. Kim),[email protected] (J. Labuda), [email protected] (M. Sillanpää).
956-5663/$ – see front matter © 2010 Elsevier B.V. All rights reserved.oi:10.1016/j.bios.2010.08.026
nsors was demonstrated.© 2010 Elsevier B.V. All rights reserved.
modified electrode exhibited high electrocatalytic activity towardsinsulin and l-cysteine (Salimi et al., 2008; Hallaj et al., 2009). Cad-mium sulphide enhanced the electron transfer rate and allowedthe electrochemical determination of hemoglobin (Liu et al., 2006).Direct electrochemistry of hemoglobin modified with CdS was usedfor the determination of hydrogen peroxide (Xu et al., 2007). In thecase of DNA biosensors, metal and semiconductor nanoparticlesare widely used as label tags for the amplification of detection ofDNA hybridization (Kang et al., 2007; Karadeniz et al., 2007; Zhuet al., 2005; Hansen et al., 2006). On the other hand, DNA immobi-lized at the electrode surface together with metal nanoparticles wasused to enhance the electron transfer between the redox speciesand the electrode and showed the electrocatalytic activity towardshydrogen peroxide (Gu and Hasebe, 2006; Lo et al., 2008). TiO2nanoparticles and Au nanoparticles modified electrodes were alsoused for the electrocatalytic determination of guanine and adenine(Ardakani et al., 2008; Liu et al., 2008).
Electrochemical sensors and biosensors are frequently used for
the detection of damage to DNA (Diculescu et al., 2005). DNA andits components adsorbed or covalently attached at the surface ofelectrode can give important information about the stage of DNAmolecule. Therefore, the development of new sensitive sensors isnot important only for the trace determination of DNA bases, but
nd Bio
miscb
mepespgoc
2
2
rTwTaiAtu
pTsm0s(rtL6
gatoswt8p(sw(
2
ecTtw
A. Ferancová et al. / Biosensors a
ore sensitive sensors are also able to detect very small changesn the electrochemical properties of DNA bases. This can help totudy and evaluate the oxidation damage to DNA, some structuralhanges, interaction of DNA with other molecules as well as possi-ilities of DNA protection.
The aim of this work was to prepare novel pearl-like CdSicrospheres and use them for the modification of glassy carbon
lectrode (GCE) surface in the form of composite with the biocom-atible polymer chitosan. It was shown that the CdS microspheresnhance the electron transfer rate of redox indicator and repre-ent material attractive for the electroanalytical applications. Therepared sensors have been applied to the trace determination ofuanine and adenine, both as simple reagents and the productsf acid calf thymus DNA hydrolysis. Damage to the purine basesaused by various kinds of UV radiation was also evaluated.
. Experimental
.1. Apparatus and reagents
The SEM measurements were performed by Hitachi S-4800 highesolution field emission scanning electron microscope (HR-SEM).he chemical states and the relative composition of the samplesere studied by means of X-ray photoelectron spectroscopy (XPS).
he X-ray source employed Al K� radiation (1486.7 eV) from an Alnode. The photoemitted electrons from the sample were analyzedn a hemispherical energy analyzer at a pass energy of Ep = 20 eV.ll spectra were obtained with an energy step of 0.1 eV and a dwell
ime of 50 ms. A software package (Avantage Thermo VG) has beensed to analyze the XPS data and fit the curves.
Voltammetric measurements were performed with an Autolabotentiostat (PGSTAT12) and software GPES (Metrohm Autolab,he Netherlands). Electrochemical impedance spectroscopic mea-urements were carried out with the same device using impedanceodule and software FRA at ambient temperature over a 10 kHz to
.1 Hz frequency range with a 10 mV amplitude. A three-electrodeystem was used consisting of working glassy carbon electrodeGCE) with geometric surface area 71 mm2, silver/silver chlorideeference electrode (Ag/AgCl 3 M KCl) and Pt counter electrode. Theemperature was 20 ± 2 ◦C. UV–vis spectra were performed using aambda 45 UV/VIS spectrometer (PerkinElmer) in the range from00 nm to 200 nm.
The CdS microspheres were synthesized using analyticalrade cadmium nitrate (Cd(NO3)2·4H2O) (Sigma–Aldrich 99%)nd thioacetamide (C2H5NS) (Sigma–Aldrich 99%) without fur-her purification. Chitosan (Acros Organics) was used in the formf 0.035% solution in acetic acid of pH 5.0. Calf-thymus double-tranded DNA (dsDNA) was obtained from Sigma. Its stock solutionith the concentration of 5 mg/mL was prepared in a solution con-
aining 1 × 10⁻² M Tris–HCl and 1 × 10⁻³ M EDTA adjusted to pH.0. A stock solution of 1 × 10⁻³ M K3[Fe(CN)6] (Sigma) was pre-ared in deionized water. Na2HPO4 (Riedel-de Haën) and NaH2PO4Merck) were used for the preparation of 0.1 M phosphate bufferolutions (PBS). Acetic acid (Merck) and sodium acetate (Merck)ere used for the preparation of 0.2 M acetate buffer solutions
ABS).
.2. Synthesis of CdS microspheres
In a typical synthesis, 3 g of Cd(NO3)2·4H2O and 2 g of thioac-
tamide (TAA) were dissolved in 100 mL of deionized water andontinuously stirred for 30 min to form a clear solution. Here theAA serve as the S2− source to form CdS. The solution was thenransferred into a flask and then refluxed at ∼105 ◦C for 30 minhich yielded a yellow colour precipitate which was harvested byelectronics 26 (2010) 314–320 315
centrifugation and washed several times using deionized water andethanol to remove the possible remaining cations and anions, andthen dried in an oven at 70 ◦C for 24 h. Finally, the products werecalcined at 350 ◦C for 2 h for further characterization purpose.
2.3. Preparation of DNA samples
Single-stranded DNA (ssDNA) was prepared by thermal denat-uration of commercial calf thymus dsDNA (see Section 2.1) duringwhich the hydrogen bonds were broken (Pruneanu et al., 2006).Solution of 0.3 mg/mL dsDNA in 0.1 M PBS was heated at high tem-perature of 95 ◦C during 15 min. After heating, rapid cooling ofsolution during 10 min in ice bath was provided. The hydrolyzedDNA was prepared by acid treatment of dsDNA (Shen and Wang,2009). 3 mg of dsDNA were dissolved in 1 mL 1.0 M HCl and heatedin boiling water bath for 60 min. After heating 1 mL of 1.0 M NaOHwas added and solution was diluted to final volume of 10 mL using0.1 M PBS.
2.4. Preparation of modified electrodes
CdS–CHIT/GCE: CdS–CHIT composite was prepared by dispers-ing of 7 mg of CdS in 1 mL of CHIT solution and sonicated for 10 minto obtain a homogeneous mixture. 2 �l of final dispersion weredropped onto the polished GCE surface and let to evaporate todryness.
ssDNA/CdS–CHIT/GCE and dsDNA/CdS–CHIT/GCE: ssDNA ordsDNA was electrochemically adsorbed at the surface ofCdS–CHIT/GCE from its 6 �g/mL solution in 0.2 M ABS of pH 5.0at the potential of +0.5 V vs. Ag/AgCl during 300 s under stirring.The resulting sensor was thoroughly rinsed with deionized water.
2.5. Voltammetric determination of guanine and adenine
Guanine and adenine were first potentiostatically accumulatedfrom their solutions in 0.1 M PBS of pH 7.4 at the potential of +0.5 Vfor appropriate time. Differential pulse voltammetric (DPV) scanwas recorded in the potential range from 0.0 V to 1.3 V with a scanrate of 10 mV/s. After each measurement the electrode surface wasregenerated by immersing in 0.5 M PBS for 240 s at open circuitunder stirring.
2.6. Evaluation of damage to DNA bases
A solution of hydrolyzed DNA with the concentration of 3 �g/mLin 0.1 M PBS of pH 7.4 was exposed to radiation for various time.After exposure DPV signals of guanine and adenine were measuredafter 600 s accumulation at +0.5 V using scan rate of 10 mV/s.
3. Results and discussion
3.1. Morphology and composition analysis of CdS microspheres
SEM was employed to examine the detailed microstructure andmorphology of the CdS microspheres (Fig. 1). The synthesized CdSproducts are composed of micro and submicro spheres and thesize of the microspheres vary between 2 �m and 3 �m in diameter(Fig. 1A). The high magnification image (Fig. 1A, inset) of a micro-sphere reveals that the maximum diameter of the microsphere isaround 2.5 �m. Further magnification images reveal that a micro-
sphere is constructed by thousands of small nanoparticles (Fig. 1B)and the size of these particles tends to be very uniform approx-imately 30–40 nm. Similar observations have also been reportedby Zhang et al. (2008) for the CdS microspheres prepared by self-assembly method.
316 A. Ferancová et al. / Biosensors and Bioelectronics 26 (2010) 314–320
F e mica
cspitX3aaChaad
3e
cptps(maiwpat
ig. 1. SEM images of CdS microspheres (A) and the high magnification images of thnalysis (C).
The XPS measurements were also carried out to determine thehemical composition of the microspheres. From the XPS surveypectrum of the CdS microspheres (Fig. 1C) it is clear that noeaks other than Cd, S, C and O elements are observed. The bind-
ng energies of Cd 3d5/2 and Cd 3d3/2 are in good agreement withhe previously reported values for CdS (Veseley and Langer, 1971;iong et al., 2009), i.e. 405.2 eV and 411.9 eV for Cd 3d5/2 and Cdd3/2. The peaks for S 2p obtained at 161.5 eV and 162.8 eV alsogree well with the previous reports. The Cd 3d5/2 and S 2p3/2 peakreas were determined for the quantitative elemental analysis ofd and S in the products, and an atomic ratio of approximately 1:1as been obtained, which further confirmed that the final productsre pure CdS. The observed C and O peaks can be attributed to thebsorption of these elements on the surface of the microspheresue to their exposure to the air atmosphere.
.2. Electrochemical characterisation of prepared modifiedlectrodes
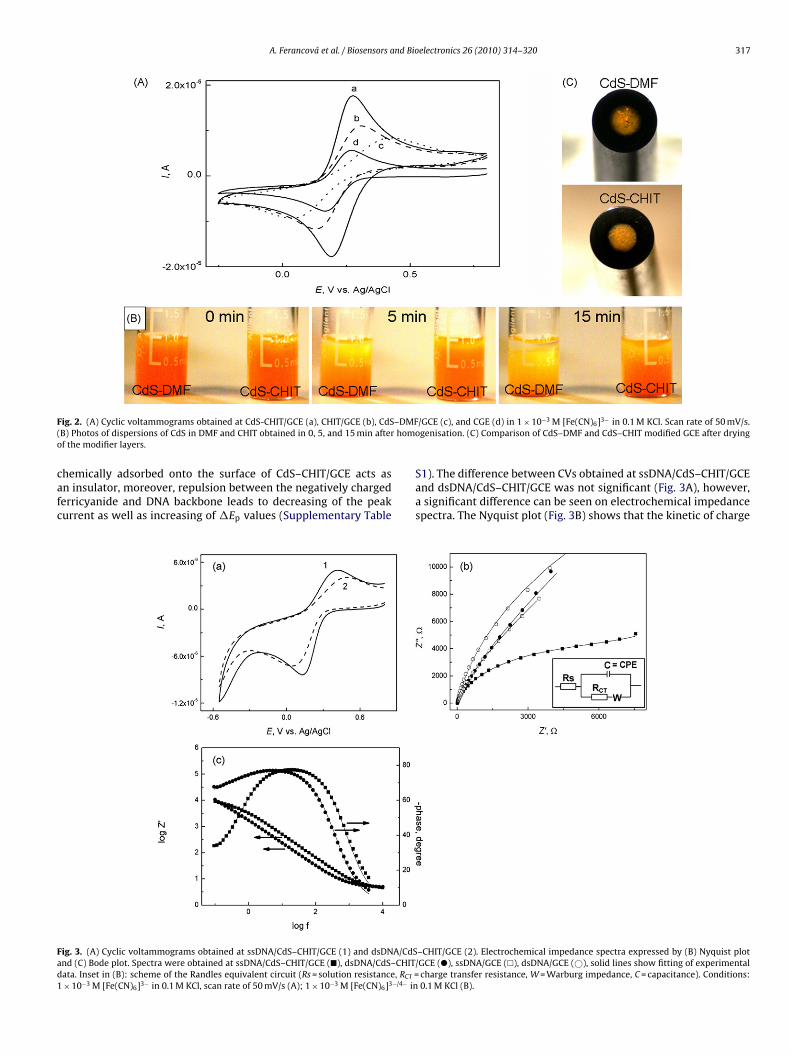
Chitosan (CHIT) and dimethylformamide (DMF), which areommonly used to disperse nanomaterials, were tested for the dis-ersing of CdS in order to prepare stable and sensitive layer ofhe modifier at the GCE surface. CHIT is pseudonatural cationicolymer with good biocompatibility and high positive charge den-ity what is convenient for the electrostatic DNA immobilizationHayatsu et al., 1997). Fig. 2A shows a comparison of cyclic voltam-
ograms (CV) of 1 × 10⁻³ M [Fe(CN)6]3− obtained at CdS–DMF/GCEnd CdS–CHIT/GCE. Both modifiers, CdS–CHIT as well as CdS–DMF,
ncreased the peak current in comparison to bare GCE, however,e observed significant differences in the peak currents and peakotential separations obtained at CdS–CHIT/GCE (Fig. 2A curve b)nd CdS–DMF/GCE (Fig. 2A curve c). While CdS–CHIT decreasedhe �Ep (�Ep = 85 mV) and enhanced the reversibility of the redox
rosphere surface (B). The survey spectrum of the CdS microsphere obtained by XPS
process, the CdS–DMF modifier deteriorated the electrochemi-cal properties of the sensor (�Ep = 386 mV). Better properties ofCdS–CHIT/GCE can be partially justified by electrostatic interactionbetween the positively charged CHIT and negatively charged ferri-cyanide complex. However, from the comparison of CVs obtainedat CdS–CHIT/GCE (Fig. 2A curve a) and CHIT/GCE (Fig. 2A curveb) it follows that CdS significantly improves the electron transferproperties of the final sensor. The stability of the dispersion canbe considered as another reason for better properties of CdS–CHITcomposite in comparison to CdS–DMF. Photos in Fig. 2B demon-strate the dispersing ability of DMF and CHIT. The dispersion ofCdS–CHIT was stable 15 min while in the case of CdS–DMF thesedimentation of CdS was very fast and separation of phases is vis-ible already after 5 min from homogenisation. This behavior canhave strong impact on the quality and properties of the modifierlayer because the modified electrodes were prepared by casting thedrop of modifier dispersion onto the electrode surface following byfree drying. The modifier layer of CdS–CHIT was dry after 9 minwhile time of 44 min was necessary for drying of the CdS–DMFlayer. It means that the separation of the phases proceeds alsoin drop of CdS–DMF during drying and leads to defects in CdSdistribution at the electrode surface. Photos of dry layers of bothmodifiers are shown in Fig. 2C. In both cases the modifier layercovers whole surface of the electrode, however, significant differ-ence in distribution of CdS in both layers and better homogeneity ofCdS–CHIT is visible. To obtain complex information about modifiedelectrodes, the short-term and long-term stability was tested. Thelayer of CdS–CHIT was stable during several days and its stability
allowed more than 100 measurements while CdS–DMF could beused only for several measurements after preparation. ThereforeCdS–CHIT/GCE was used in further experiments.Next, the behavior of DNA modified electrodes, i.e. ssDNA anddsDNA at CdS–CHIT/GCE, was examined (Fig. 3). DNA electro-
A. Ferancová et al. / Biosensors and Bioelectronics 26 (2010) 314–320 317
F –DMF( homo
cafc
Fad1
ig. 2. (A) Cyclic voltammograms obtained at CdS-CHIT/GCE (a), CHIT/GCE (b), CdSB) Photos of dispersions of CdS in DMF and CHIT obtained in 0, 5, and 15 min afterf the modifier layers.
hemically adsorbed onto the surface of CdS–CHIT/GCE acts asn insulator, moreover, repulsion between the negatively chargederricyanide and DNA backbone leads to decreasing of the peakurrent as well as increasing of �Ep values (Supplementary Table
ig. 3. (A) Cyclic voltammograms obtained at ssDNA/CdS–CHIT/GCE (1) and dsDNA/CdSnd (C) Bode plot. Spectra were obtained at ssDNA/CdS–CHIT/GCE (�), dsDNA/CdS–CHITata. Inset in (B): scheme of the Randles equivalent circuit (Rs = solution resistance, RCT =× 10−3 M [Fe(CN)6]3− in 0.1 M KCl, scan rate of 50 mV/s (A); 1 × 10⁻³ M [Fe(CN)6]3−/4− in
/GCE (c), and CGE (d) in 1 × 10⁻³ M [Fe(CN)6]3− in 0.1 M KCl. Scan rate of 50 mV/s.ogenisation. (C) Comparison of CdS–DMF and CdS–CHIT modified GCE after drying
S1). The difference between CVs obtained at ssDNA/CdS–CHIT/GCEand dsDNA/CdS–CHIT/GCE was not significant (Fig. 3A), however,a significant difference can be seen on electrochemical impedancespectra. The Nyquist plot (Fig. 3B) shows that the kinetic of charge
–CHIT/GCE (2). Electrochemical impedance spectra expressed by (B) Nyquist plot/GCE (�), ssDNA/GCE (�), dsDNA/GCE (©), solid lines show fitting of experimental
charge transfer resistance, W = Warburg impedance, C = capacitance). Conditions:0.1 M KCl (B).
318 A. Ferancová et al. / Biosensors and Bioelectronics 26 (2010) 314–320
F re (C)a .5 V, s
tifiTdt
dsie(
Fdo
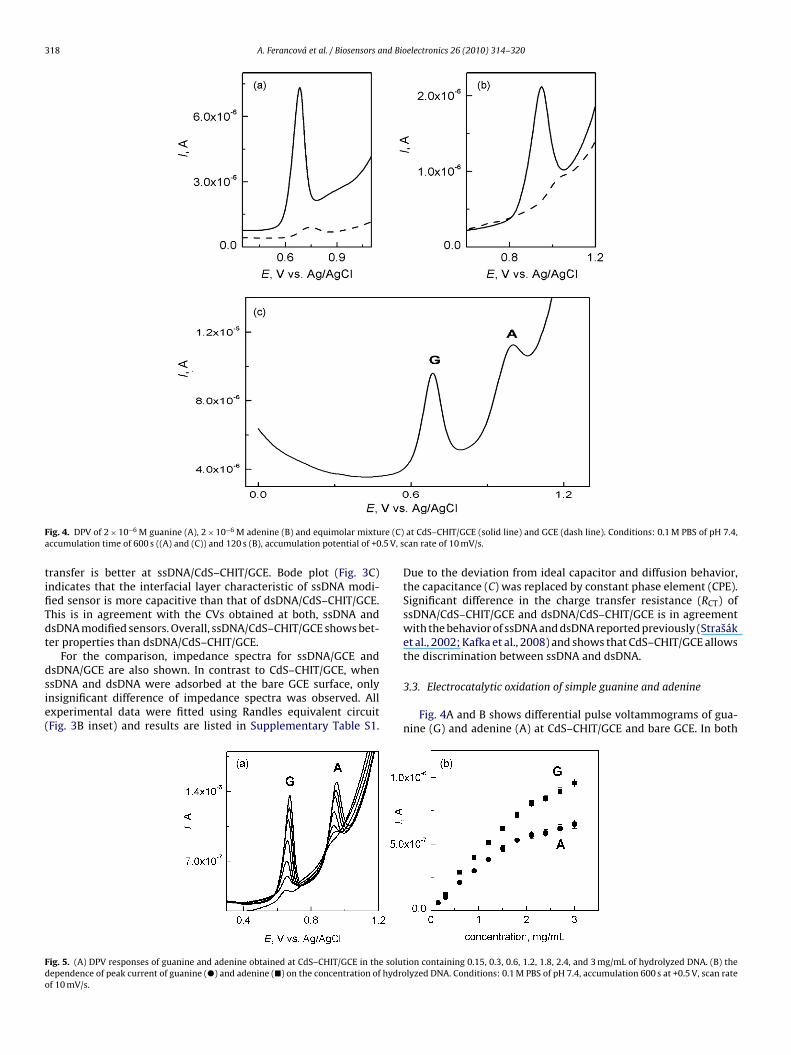
ig. 4. DPV of 2 × 10⁻⁶ M guanine (A), 2 × 10⁻⁶ M adenine (B) and equimolar mixtuccumulation time of 600 s ((A) and (C)) and 120 s (B), accumulation potential of +0
ransfer is better at ssDNA/CdS–CHIT/GCE. Bode plot (Fig. 3C)ndicates that the interfacial layer characteristic of ssDNA modi-ed sensor is more capacitive than that of dsDNA/CdS–CHIT/GCE.his is in agreement with the CVs obtained at both, ssDNA andsDNA modified sensors. Overall, ssDNA/CdS–CHIT/GCE shows bet-er properties than dsDNA/CdS–CHIT/GCE.
For the comparison, impedance spectra for ssDNA/GCE and
sDNA/GCE are also shown. In contrast to CdS–CHIT/GCE, whensDNA and dsDNA were adsorbed at the bare GCE surface, onlynsignificant difference of impedance spectra was observed. Allxperimental data were fitted using Randles equivalent circuitFig. 3B inset) and results are listed in Supplementary Table S1.ig. 5. (A) DPV responses of guanine and adenine obtained at CdS–CHIT/GCE in the solutependence of peak current of guanine (�) and adenine (�) on the concentration of hydrof 10 mV/s.
at CdS–CHIT/GCE (solid line) and GCE (dash line). Conditions: 0.1 M PBS of pH 7.4,can rate of 10 mV/s.
Due to the deviation from ideal capacitor and diffusion behavior,the capacitance (C) was replaced by constant phase element (CPE).Significant difference in the charge transfer resistance (RCT) ofssDNA/CdS–CHIT/GCE and dsDNA/CdS–CHIT/GCE is in agreementwith the behavior of ssDNA and dsDNA reported previously (Strasáket al., 2002; Kafka et al., 2008) and shows that CdS–CHIT/GCE allowsthe discrimination between ssDNA and dsDNA.
3.3. Electrocatalytic oxidation of simple guanine and adenine
Fig. 4A and B shows differential pulse voltammograms of gua-nine (G) and adenine (A) at CdS–CHIT/GCE and bare GCE. In both
ion containing 0.15, 0.3, 0.6, 1.2, 1.8, 2.4, and 3 mg/mL of hydrolyzed DNA. (B) thelyzed DNA. Conditions: 0.1 M PBS of pH 7.4, accumulation 600 s at +0.5 V, scan rate
A. Ferancová et al. / Biosensors and Bioelectronics 26 (2010) 314–320 319
F on exl nset:1 NA soC scan r
ctp0oltadca
mT0pibo1wa+ow
p1o
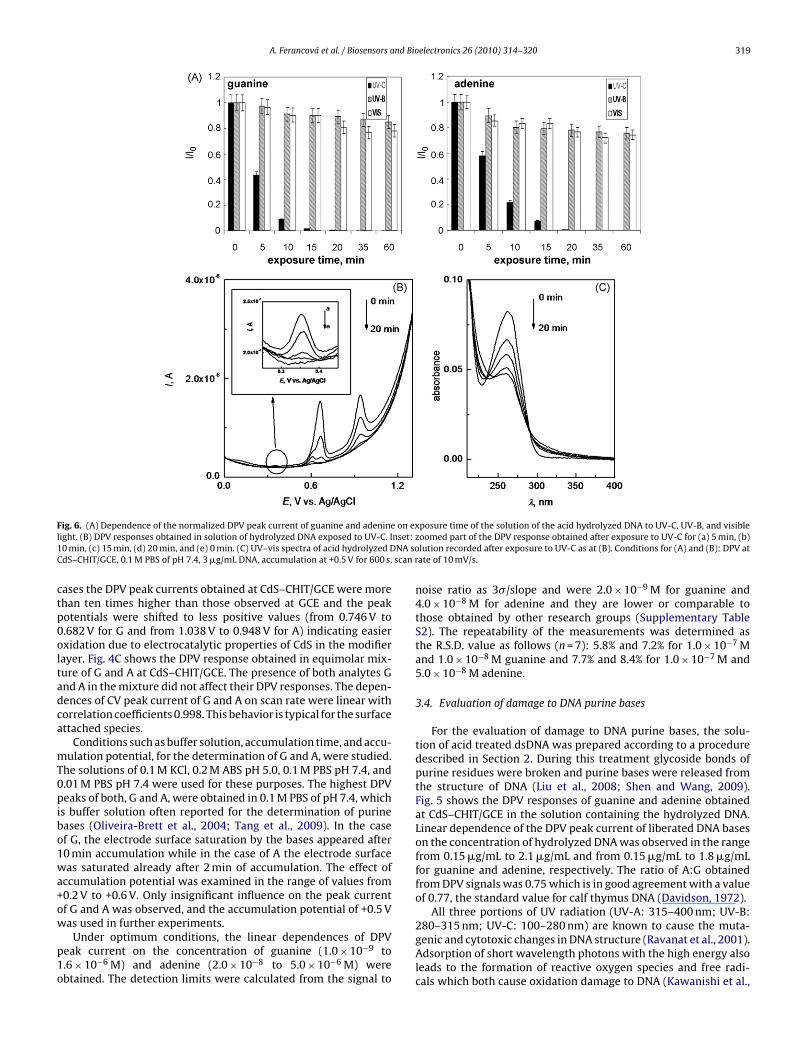
ig. 6. (A) Dependence of the normalized DPV peak current of guanine and adenineight. (B) DPV responses obtained in solution of hydrolyzed DNA exposed to UV-C. I0 min, (c) 15 min, (d) 20 min, and (e) 0 min. (C) UV–vis spectra of acid hydrolyzed DdS–CHIT/GCE, 0.1 M PBS of pH 7.4, 3 �g/mL DNA, accumulation at +0.5 V for 600 s,
ases the DPV peak currents obtained at CdS–CHIT/GCE were morehan ten times higher than those observed at GCE and the peakotentials were shifted to less positive values (from 0.746 V to.682 V for G and from 1.038 V to 0.948 V for A) indicating easierxidation due to electrocatalytic properties of CdS in the modifierayer. Fig. 4C shows the DPV response obtained in equimolar mix-ure of G and A at CdS–CHIT/GCE. The presence of both analytes Gnd A in the mixture did not affect their DPV responses. The depen-ences of CV peak current of G and A on scan rate were linear withorrelation coefficients 0.998. This behavior is typical for the surfacettached species.
Conditions such as buffer solution, accumulation time, and accu-ulation potential, for the determination of G and A, were studied.
he solutions of 0.1 M KCl, 0.2 M ABS pH 5.0, 0.1 M PBS pH 7.4, and.01 M PBS pH 7.4 were used for these purposes. The highest DPVeaks of both, G and A, were obtained in 0.1 M PBS of pH 7.4, which
s buffer solution often reported for the determination of purineases (Oliveira-Brett et al., 2004; Tang et al., 2009). In the casef G, the electrode surface saturation by the bases appeared after0 min accumulation while in the case of A the electrode surfaceas saturated already after 2 min of accumulation. The effect of
ccumulation potential was examined in the range of values from0.2 V to +0.6 V. Only insignificant influence on the peak currentf G and A was observed, and the accumulation potential of +0.5 V
as used in further experiments.Under optimum conditions, the linear dependences of DPVeak current on the concentration of guanine (1.0 × 10⁻⁹ to.6 × 10−6 M) and adenine (2.0 × 10⁻⁸ to 5.0 × 10⁻⁶ M) werebtained. The detection limits were calculated from the signal to
posure time of the solution of the acid hydrolyzed DNA to UV-C, UV-B, and visiblezoomed part of the DPV response obtained after exposure to UV-C for (a) 5 min, (b)lution recorded after exposure to UV-C as at (B). Conditions for (A) and (B): DPV atate of 10 mV/s.
noise ratio as 3�/slope and were 2.0 × 10⁻⁹ M for guanine and4.0 × 10−8 M for adenine and they are lower or comparable tothose obtained by other research groups (Supplementary TableS2). The repeatability of the measurements was determined asthe R.S.D. value as follows (n = 7): 5.8% and 7.2% for 1.0 × 10⁻⁷ Mand 1.0 × 10⁻⁸ M guanine and 7.7% and 8.4% for 1.0 × 10⁻⁷ M and5.0 × 10−8 M adenine.
3.4. Evaluation of damage to DNA purine bases
For the evaluation of damage to DNA purine bases, the solu-tion of acid treated dsDNA was prepared according to a proceduredescribed in Section 2. During this treatment glycoside bonds ofpurine residues were broken and purine bases were released fromthe structure of DNA (Liu et al., 2008; Shen and Wang, 2009).Fig. 5 shows the DPV responses of guanine and adenine obtainedat CdS–CHIT/GCE in the solution containing the hydrolyzed DNA.Linear dependence of the DPV peak current of liberated DNA baseson the concentration of hydrolyzed DNA was observed in the rangefrom 0.15 �g/mL to 2.1 �g/mL and from 0.15 �g/mL to 1.8 �g/mLfor guanine and adenine, respectively. The ratio of A:G obtainedfrom DPV signals was 0.75 which is in good agreement with a valueof 0.77, the standard value for calf thymus DNA (Davidson, 1972).
All three portions of UV radiation (UV-A: 315–400 nm; UV-B:
280–315 nm; UV-C: 100–280 nm) are known to cause the muta-genic and cytotoxic changes in DNA structure (Ravanat et al., 2001).Adsorption of short wavelength photons with the high energy alsoleads to the formation of reactive oxygen species and free radi-cals which both cause oxidation damage to DNA (Kawanishi et al.,
3 nd Bio
2rttCcgboaeaenr2ttDaatsC
4
wttsscpiti
gdviludvgAsasi
20 A. Ferancová et al. / Biosensors a
001). However, the genotoxic effect of the visible light was alsoeported (Pflaum et al., 1998; Botta et al., 2008). In our experimentshe damage to DNA purine bases was performed by an exposure ofhe hydrolyzed DNA solution to different kinds of radiation, UV-, UV-B, and visible light (Na vapour lamp). Fig. 6A shows theorresponding dependences of normalized DPV peak currents ofuanine and adenine on the time of exposure to radiation. As cane seen, in the case of UV-B and visible light only minor changesccur and after 60 min exposure the DPV signals of guanine anddenine were decreased almost in 20%. In the case of UV-C, how-ver, a rapid degradation of both purine bases was observed alreadyfter 5 min and the total degradation was reached after 20 minxposure. Together with the rapid decrease of DPV response alsoew signals of oxidation products of guanine and adenine becameemarkable at the potential of 0.35 V and 0.60 V (Fig. 6B). After0 min exposure to UV-C no DPV signals were detected indicatinghe total degradation of both purine bases as well as their oxida-ion products. The degradation of the simple bases of hydrolyzedNA was also verified using UV–vis spectroscopy where the peakt 260 nm, typical for DNA, was evaluated. A rapid decrease in thebsorbance in dependence on time of exposure of hydrolyzed DNAo UV-C (Fig. 6C) is caused by damage to DNA. The trend corre-ponds to damage to DNA bases detected in this work using thedS–CHIT/GCE electrode (Fig. 6B).
. Conclusions
Novel electrochemical sensor based on CdS–CHIT compositeas prepared and characterized. The CdS–CHIT/GCE modified elec-
rode showed enhanced reversibility, stability, and sensitivity dueo the electrocatalytic properties of CdS. The preparation of theensor is very easy and not time consuming. Moreover, it washown that dsDNA as well as ssDNA can be simply adsorbed electro-hemically at the CdS–CHIT/GCE surface without any potentiostaticre-treatment as it is required in the case of GCE. The layers of
mmobilized dsDNA and ssDNA were stable, and the sensors allowhe discrimination between ssDNA and dsDNA using electrochem-cal impedance spectroscopy.
The conditions for the trace detection of simple DNA bases,uanine and adenine individually and in their mixture, using theeveloped CdS–CHIT/GCE were optimized. Both DNA bases pro-ided more than 10 times higher DPV responses at CdS–CHIT/GCEn comparison to bare GCE what leads to nanomolar detectionimits. CdS–CHIT/GCE was then successfully applied to the eval-ation of damage to DNA by its previous acid treatment as well asamage to the liberated purine bases caused by UV-C, UV-B, andisible light. It was shown that UV-C caused total degradation ofuanine and adenine after 15 min of exposure of their solution.
lthough the UV-B and visible light radiation did not exhibit sotrong degradation of bases, their significant effect can be detecteds well. Hence, in this work, a great potential of the CdS micro-pheres used as the interface at the nucleic acid based biosensorss demonstrated.electronics 26 (2010) 314–320
Acknowledgements
This research project has been supported by a Marie Curie Trans-fer of Knowledge Fellowship of the European Community’s SixthFramework Programme under contract number MTKD-CT-2006-042637. A.F. and J.L. thank also the Scientific Grant Agency of theSlovak Republic (VEGA 1/0852/08).
Appendix A. Supplementary data
Supplementary data associated with this article can be found, inthe online version, at doi:10.1016/j.bios.2010.08.026.
References
Ardakani, M.M., Taleat, Z., Beitollahi, H., Salavati-Niasari, M., Mirjalili, B.B.F.,Taghavinia, N., 2008. J. Electroanal. Chem. 624, 73–78.
Botta, C., Di Giorgio, C., Sabatier, A.-S., De Méo, M., 2008. J. Photochem. Photobiol. B91, 24–34.
Chaniotakis, N., Sofikiti, N., 2008. Anal. Chim. Acta 615, 1–9.Davidson, N., 1972. The Biochemistry of the Nucleic Acids, seventh ed. Cox and
Nyman, Norfolk, UK.Diculescu, V.C., Paquim, A.-M.C., Brett, A.M.O., 2005. Sensors 5, 377–393.Frasco, M.F., Chaniotakis, N., 2009. Sensors 9, 7266–7286.Gill, R., Zayats, M., Willner, I., 2008. Angew. Chem. Int. Ed. 47, 7602–7625.Gu, T., Hasebe, Y., 2006. Biosens. Bioelectron. 21, 2121–2128.Hallaj, R., Salimi, A., Akhtari, K., Soltanian, S., Mamkhezri, H., 2009. Sens. Actuators
B 135, 632–641.Hansen, J.A., Mukhopadhyay, R., Hansen, J.Ø., Gothelf, K.V., 2006. J. Am. Chem. Soc.
128, 3860–3861.Hayatsu, H., Tanaka, Y., Negishi, K., 1997. Nucl. Acids Symp. Ser. 37, 139–140.Huang, Y., Zhang, W., Xiao, H., Li, G., 2005. Biosens. Bioelectron. 21, 817–821.Kafka, J., Pänke, O., Abendroth, B., Lisdat, F., 2008. Electrochim. Acta 53,
7467–7474.Kang, J., Li, X., Wu, G., Wang, Z., Lu, X., 2007. Anal. Biochem. 364, 165–170.Karadeniz, H., Erdem, A., Caliskan, A., Pereira, C.M., Pereira, E.M., Ribeiro, J.A., 2007.
Electrochem. Commun. 9, 2167–2173.Kawanishi, S., Hiraku, Y., Oikawa, S., 2001. Mutat. Res. 488, 65–76.Liu, H., Wang, G., Chen, D., Zhang, W., Li, C., Fang, B., 2008. Sens. Actuators B 128,
414–421.Liu, M., Shi, G., Zhang, L., Cheng, Y., Jin, L., 2006. Electrochem. Commun. 8,
305–310.Lo, P.-H., Kumar, A., Chen, S.-M., 2008. Colloids Surf. B 66, 266–273.Oliveira-Brett, A.M., Piedade, J.A.P., Silva, L.A., Diculescu, V.C., 2004. Anal. Biochem.
332, 321–329.Pflaum, M., Kielbassa, C., Garmyn, M., Epe, B., 1998. Mutat. Res. 408,
137–146.Pruneanu, S., Ali, Z., Watson, G., Hu, S., Lupu, D., Biris, A.R., Olenic, L., Mihailescu, G.,
2006. Part. Sci. Technol. 24, 311–320.Ravanat, J.-L., Douki, T., Cadet, J., 2001. J. Photochem. Photobiol. B 63, 88–102.Salimi, A., Noorbakhash, A., Sharifi, E., Semnani, A., 2008. Biosens. Bioelectron. 24,
792–798.Shen, Q., Wang, X., 2009. J. Electroanal. Chem. 632, 149–153.Strasák, L., Dvorák, J., Hason, S., Vetterl, V., 2002. Bioelectrochemistry 56, 37–41.Tang, C., Yogeswaran, U., Chen, S., 2009. Anal. Chim. Acta 636, 19–27.Veseley, C.J., Langer, D.W., 1971. Phys. Rev. B: Condens. Matter Mater. Phys. 4,
451–462.Wang, F., Hu, S., 2009. Microchim. Acta 165, 1–22.Willner, I., Baron, R., Willner, B., 2007. Biosens. Bioelectron. 22, 1841–1852.
Xiong, S., Zhang, X., Qian, Y., 2009. Cryst. Growth Des. 9, 5259–5265.Xu, Y., Liang, J., Hu, C., Wang, F., Hu, S., He, Z., 2007. J. Biol. Inorg. Chem. 12,421–427.Zhang, B., Jian, J.K., Zheng, Y., Sun, Y., Chen, Y., Cui, L., 2008. Mater. Lett. 62,
1827–1830.Zhu, N., Chang, Z., He, P., Fang, Y., 2005. Anal. Chim. Acta 545, 21–26.