
Nucleoside modification with boron clusters and their metal complexes.
Upload
independentCategory
view
3download
0
This article appeared in a journal published by Elsevier. The attachedcopy is furnished to the author for internal non-commercial researchand education use, including for instruction at the authors institution
and sharing with colleagues.
Other uses, including reproduction and distribution, or selling orlicensing copies, or posting to personal, institutional or third party
websites are prohibited.
In most cases authors are permitted to post their version of thearticle (e.g. in Word or Tex form) to their personal website orinstitutional repository. Authors requiring further information
regarding Elsevier’s archiving and manuscript policies areencouraged to visit:
http://www.elsevier.com/copyright
Author's personal copy
Structural studies of human purine nucleoside phosphorylase: Towardsa new specific empirical scoring function
Luis Fernando Saraiva Macedo Timmers a,1, Rafael Andrade Caceres a,b,1, Ana Luiza Vivan a,Lisandra Marques Gava c, Raquel Dias a, Rodrigo Gay Ducati d,e, Luiz Augusto Basso b,e,Diogenes Santiago Santos b,e,*, Walter Filgueira de Azevedo Jr. a,b,*
a Faculdade de Biociências, Laboratório de Bioquímica Estrutural, Pontifícia Universidade Católica do Rio Grande do Sul, Porto Alegre, RS, Brazilb Programa de Pós-Graduação em Medicina e Ciências da Saúde, Pontifícia Universidade Católica do Rio Grande do Sul, Porto Alegre, RS, Brazilc Universidade Estadual de Campinas, Campinas, SP, Brazild Programa de Pós-Graduação em Biologia Celular e Molecular, Universidade Federal do Rio Grande do Sul, Porto Alegre, RS, Brazile Centro de Pesquisas em Biologia Molecular e Funcional, Instituto de Pesquisas Biomédicas, Pontifícia Universidade Católica do Rio Grande do Sul, Porto Alegre, RS, Brazil
a r t i c l e i n f o
Article history:Received 23 May 2008and in revised form 20 August 2008Available online 30 August 2008
Keywords:Empirical scoring functionsDockingVirtual screeningQuinazolinoneEnzymologyMolecular dynamics
a b s t r a c t
Human purine nucleoside phosphorylase (HsPNP) is a target for inhibitor development aiming at T-cellimmune response modulation. In this work, we report the development of a new set of empirical scoringfunctions and its application to evaluate binding affinities and docking results. To test these new func-tions, we solved the structure of HsPNP and 2-mercapto-4(3H)-quinazolinone (HsPNP:MQU) binary com-plex at 2.7 Å resolution using synchrotron radiation, and used these functions to predict ligand positionobtained in docking simulations. We also employed molecular dynamics simulations to analyze HsPNP intwo conditions, as apoenzyme and in the binary complex form, in order to assess the structural featuresresponsible for stability. Analysis of the structural differences between systems provides explanation forinhibitor binding. The use of these scoring functions to evaluate binding affinities and molecular dockingresults may be used to guide future efforts on virtual screening focused on HsPNP.
� 2008 Elsevier Inc. All rights reserved.
Purine nucleoside phosphorylase (PNP)2 (EC 2.4.2.1) is a key en-zyme of the purine salvage pathway, responsible for the inter-con-version between (deoxy)nucleosides and bases, which in turn maybe converted to uric acid for excretion or reused in nucleic acid bio-synthesis [1]. This enzyme catalyzes the reversible cleavage, in thepresence of inorganic phosphate (Pi), of N-glicosidic bonds of purinenucleosides and deoxynucleosides, except adenosine, to generate al-pha-ribose 1-phosphate and the corresponding purine base [2]. Thereaction proceeds with inversion of configuration, from beta-nucleo-sides to alpha-ribose 1-phosphate [3].
Interest in this enzyme stems from the discovery that muta-tions in the locus encoding for Homo sapiens PNP (HsPNP) causeT-cell impairment in human beings, though keeping normal levelsof B-cells [4,5]. The activation of helper T-cells requires that theyrecognize a complex formed between an antigen and a class IIMHC (Major Histocompatibility Complex) protein on the surfaceof antigen-presenting cells with appropriate costimulation. Theseresults in interleukin-2 release which, in turn, leads to T-cell clonalexpansion with activity against cells exhibiting the stimulatoryantigen. However, most naive T-cells receive no antigenic signaland undergo apoptosis. Cellular nucleic acids from the apoptosedcells are recycled. Naive T-cells have the ability to transport andphosphorylate deoxyguanosine (dGuo) to deoxyguanosine triphos-phate (dGTP), which accumulates relative to normal cells [6]. Thereare two enzymes that utilize dGuo as a substrate in humans, PNPand deoxycytidine kinase (dCyK). PNP catalyzes the phosphorolysisof dGuo to guanine and ribose 1-phosphate. The normal role ofdCyK in dividing T-cells is the salvage of deoxycytidine to formdeoxycytidine triphosphate (dCTP), and dGuo predominantlyundergoes phosphorolysis by PNP because dGuo has a higher affin-ity for PNP than for dCyK [7]. When dGuo accumulates beyond nor-mal levels, dCyK catalyzes the conversion of dGuo todeoxyguanosine monophosphate (dGMP), which is then convertedto dGTP. Accumulated dGTP inhibits ribonucleotide reductase, thus
0003-9861/$ - see front matter � 2008 Elsevier Inc. All rights reserved.doi:10.1016/j.abb.2008.08.015
* Corresponding authors. Address: Centro de Pesquisas em Biologia Molecular eFuncional, PUCRS, Av. Ipiranga, 6681 Prédio, 92A, Porto Alegre 90619-900, RS,Brazil. Fax: +55 51 33203629.
E-mail addresses: [email protected] (D.S. Santos), [email protected] (W.F.de Azevedo).
1 L.F.S.M.T. and R.A.C. contributed equally to this work.2 Abbreviations used: PNP, purine nucleoside phosphorylase; Pi, inorganic phos-
phate; HsPNP, homo sapiens PNP; MHC, major histocompatibility complex; dGuo,deoxyguanosine; dGTP, deoxyguanosine triphosphate; dCyK, deoxycytidine kinase;dCTP, deoxycytidine triphosphate; dGMP, deoxyguanosine monophosphate; NP-I,class I of nucleoside phosphorylases; MQU, 2-mercapto-4(3H)-quinazolinone; MD,molecular dynamics; SPC/E, simple point charge extended; RMSD, root mean-squaredeviation; RMSF, root mean-square fluctuation; RDS, rigid-body docking simulations;HB, hydrogen bonds; DMSO, dimethyl sulfoxide.
Archives of Biochemistry and Biophysics 479 (2008) 28–38
Contents lists available at ScienceDirect
Archives of Biochemistry and Biophysics
journal homepage: www.elsevier .com/ locate /yabbi
Author's personal copy
preventing the conversion of ribonucleoside diphosphates to corre-sponding deoxyribonucloside diphosphates. Depletion of deoxyri-bonucleotides ultimately results in the inhibition of DNAsynthesis and cell replication, leading to suppression of prolifera-tion of immature T-cells [8–10]. Inhibition of PNP enzyme activityleads to an increase in dGuo concentration that will, in turn, triggerthat cascade of events ultimately leading to inhibition of cell pro-liferation [6]. Accordingly, HsPNP has been proposed as a targetfor drug design, aiming the enzyme inhibition for treatment ofimmunological disorders [11], which include type IV autoimmunedisorders such as rheumatoid arthritis, psoriasis, inflammatory bo-wel disorders, and multiple sclerosis [12], and T-cell proliferativedisorders such as organ transplant rejection, T-cell lymphoma,and T-cell leukemia [6]. Moreover, PNP inhibitors can also be usedto avoid cleavage of anticancer and antiviral drugs, since many ofthese drugs mimic natural purine nucleosides and can thereby becleaved by HsPNP before accomplishing their therapeutic role[13,14]. HsPNP is classified, based on substrate specificity andstructural characteristics, as belonging to the class I of NucleosidePhosphorylases (NP-I) [15]. The crystallographic structure is a tri-mer and analysis of HsPNP in solution, using SAXS, confirmed thatthe crystallographic trimer is conserved in solution [16,17].
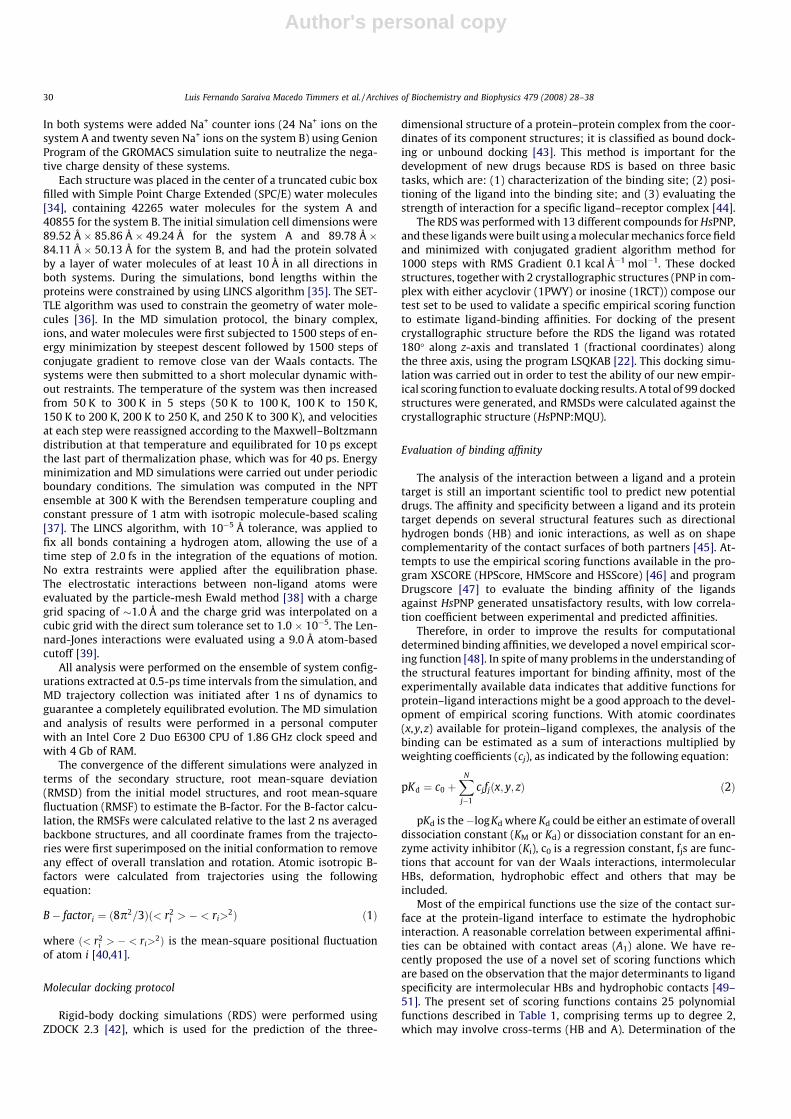
The 2-mercapto-4(3H)-quinazolinone (MQU, Fig. 1) is a deriva-tive of quinazolinone. Quinazolinones are good lead compoundsfor design of inhibitors of human erythrocyte PNP. Quinazoli-none-based inhibitors irreversibly inactivate human erythrocytePNP, probably by reductive addition and cross-linking of Glu201and Glu259, both of which are active site residues [18].
In the present work, we describe the crystallographic structureof HsPNP in complex with MQU, which was resolved at 2.7 Å, usingrecombinant HsPNP and synchrotron radiation. We also presentmolecular dynamics simulations to give detailed information onthe dynamics properties of the crystallographic structures ofHsPNP in apo form and in complex with MQU. The analysis ofmolecular dynamics trajectory indicated that functionally animportant motif has both a very stable structure and tertiaryarrangement. In addition, this structural data together with previ-ously published crystallographic structures of HsPNP were em-ployed to propose a set of specific empirical scoring functions.These scoring functions were able to estimate pKd and also identifythe best results obtained from molecular docking, which providesfor the first time a set of reliable and specific empirical scoringfunctions, which were developed for analysis of interaction of li-gands with HsPNP. In addition, experimental determination of Kd
for MQU confirmed the predicted low affinity of this ligand forHsPNP.
Materials and methods
Crystallization and data collection
Recombinant HsPNP was expressed and purified as previouslydescribed [19]. HsPNP:MQU was crystallized using the experimen-tal conditions described elsewhere [20,21]. Rhombohedral-shaped
crystals with dimensions up to 0.5 mm were obtained overnight. Inbrief, a PNP solution was concentrated to 13 mg mL�1 potassiumphosphate buffer (pH 7.1) and incubated in presence of 0.6 mM li-gand (Sigma). Hanging drops were equilibrated by vapor diffusionat 25 �C against reservoir containing 17% saturated ammoniumsulfate solution in 0.05 M citrate buffer (pH 5.3).
In order to increase the resolution of the HsPNP:MQU crystal,data were collected from a flash-cooled crystal at 100 K. Prior toflash cooling, up to 50% by volume of glycerol was added to thecrystallization drop. X-ray diffraction data were collected at awavelength of 1.431 Å using the Synchrotron Radiation Source(Station PCr, Laboratório Nacional de Luz Síncrotron, LNLS, Campi-nas, SP, Brazil) and a CCD detector (MARCCD) with an exposuretime of 30 s per image at a crystal to detector distance of120 mm. X-ray diffraction data were processed to 2.7 Å resolutionusing the program MOSFLM and scaled with the program SCALA[22].
Upon cooling the cell parameters shrank from a = b = 142.90 Å,and c = 165.20 Å to a = b = 138.66 Å, and c = 159.37 Å. Volume ofthe unit cell for HsPNP:MQU binary complex was 2.65 � 10�6 Å3,which is in accordance with one monomer in the asymmetric unitwith a Vm value of 4.70 Å3 Da�1 (the values for unit cell and Vm
were calculated with the Matthews Probabilities online [23]).Assuming a value 0.26 cm3 g�1 for the protein partial specific vol-ume, the calculated solvent content in the crystal is 74% and thecalculated crystal density is 1.10 g cm�3.
Crystal structure
The crystal structure of the HsPNP:MQU was determined bystandard molecular replacement methods using the programAMoRe [24], incorporated in the CCP4 program package [22], usingas search model the structure of HsPNP apoenzyme (PDB accessioncode: 1M73) [25,26]. Structure refinement was performed usingREFMAC [22]. The atomic positions obtained from molecularreplacement were used to initiate the crystallographic refinement.The overall stereochemical quality of the final model forHsPNP:MQU complex was assessed by the program PARMODEL[27]. The trimeric structure and atomic models were superposedusing the program LSQKAB from CCP4 [22].
Molecular dynamics simulation protocol
HsPNP is biologically active as a trimer. Hence, to better under-stand HsPNP structural and dynamics features, molecular dynam-ics (MD) simulation was carried out. The trimeric structure ofHsPNP was built following the crystallographic HsPNP (PDB accesscode: 1PF7). Attempts to simulate the dynamics behavior of HsPNPas a monomeric system generated unreliable results, since Phe159from the adjacent monomer is part of the active site, as previouslydescribed [28].
MD simulations were performed with the GROMACS [29] pack-age using the Gromos 96.1 (53A6) [30] force field. The MQU topol-ogy was generated with the PRODRG program [31]. Accurate forcefields are essential for reproducing the conformational and dy-namic behavior of condensed-phase systems. Gromos 96.1 forcefields are well parameterized for proteins but the parameters forsmall molecules are still limited for simulation of more compli-cated biological systems. Thus, for the atomic charges in theMQU molecules GAMESS [32] was employed, and the ligand(MQU) was submitted to single-point ab initio calculations at RHF6-31G* level in order to obtain Lowdin derived charges. Manipula-tion of structures was performed with Pymol program [33]. Thefirst system was composed by apoenzyme HsPNP (system A) andthe second by HsPNP enzyme and MQU ligand (system B). The sim-ulations for these systems were performed by a time period of 4 ns.Fig. 1. Molecular formula of 2-mercapto-4(3H)-quinazolinone.
Luis Fernando Saraiva Macedo Timmers et al. / Archives of Biochemistry and Biophysics 479 (2008) 28–38 29
Author's personal copy
In both systems were added Na+ counter ions (24 Na+ ions on thesystem A and twenty seven Na+ ions on the system B) using GenionProgram of the GROMACS simulation suite to neutralize the nega-tive charge density of these systems.
Each structure was placed in the center of a truncated cubic boxfilled with Simple Point Charge Extended (SPC/E) water molecules[34], containing 42265 water molecules for the system A and40855 for the system B. The initial simulation cell dimensions were89.52 Å � 85.86 Å � 49.24 Å for the system A and 89.78 Å �84.11 Å � 50.13 Å for the system B, and had the protein solvatedby a layer of water molecules of at least 10 Å in all directions inboth systems. During the simulations, bond lengths within theproteins were constrained by using LINCS algorithm [35]. The SET-TLE algorithm was used to constrain the geometry of water mole-cules [36]. In the MD simulation protocol, the binary complex,ions, and water molecules were first subjected to 1500 steps of en-ergy minimization by steepest descent followed by 1500 steps ofconjugate gradient to remove close van der Waals contacts. Thesystems were then submitted to a short molecular dynamic with-out restraints. The temperature of the system was then increasedfrom 50 K to 300 K in 5 steps (50 K to 100 K, 100 K to 150 K,150 K to 200 K, 200 K to 250 K, and 250 K to 300 K), and velocitiesat each step were reassigned according to the Maxwell–Boltzmanndistribution at that temperature and equilibrated for 10 ps exceptthe last part of thermalization phase, which was for 40 ps. Energyminimization and MD simulations were carried out under periodicboundary conditions. The simulation was computed in the NPTensemble at 300 K with the Berendsen temperature coupling andconstant pressure of 1 atm with isotropic molecule-based scaling[37]. The LINCS algorithm, with 10�5 Å tolerance, was applied tofix all bonds containing a hydrogen atom, allowing the use of atime step of 2.0 fs in the integration of the equations of motion.No extra restraints were applied after the equilibration phase.The electrostatic interactions between non-ligand atoms wereevaluated by the particle-mesh Ewald method [38] with a chargegrid spacing of �1.0 Å and the charge grid was interpolated on acubic grid with the direct sum tolerance set to 1.0 � 10�5. The Len-nard-Jones interactions were evaluated using a 9.0 Å atom-basedcutoff [39].
All analysis were performed on the ensemble of system config-urations extracted at 0.5-ps time intervals from the simulation, andMD trajectory collection was initiated after 1 ns of dynamics toguarantee a completely equilibrated evolution. The MD simulationand analysis of results were performed in a personal computerwith an Intel Core 2 Duo E6300 CPU of 1.86 GHz clock speed andwith 4 Gb of RAM.
The convergence of the different simulations were analyzed interms of the secondary structure, root mean-square deviation(RMSD) from the initial model structures, and root mean-squarefluctuation (RMSF) to estimate the B-factor. For the B-factor calcu-lation, the RMSFs were calculated relative to the last 2 ns averagedbackbone structures, and all coordinate frames from the trajecto-ries were first superimposed on the initial conformation to removeany effect of overall translation and rotation. Atomic isotropic B-factors were calculated from trajectories using the followingequation:
B� factori ¼ ð8p2=3Þð< r2i > � < ri>
2Þ ð1Þ
where ð< r2i > � < ri>
2Þ is the mean-square positional fluctuationof atom i [40,41].
Molecular docking protocol
Rigid-body docking simulations (RDS) were performed usingZDOCK 2.3 [42], which is used for the prediction of the three-
dimensional structure of a protein–protein complex from the coor-dinates of its component structures; it is classified as bound dock-ing or unbound docking [43]. This method is important for thedevelopment of new drugs because RDS is based on three basictasks, which are: (1) characterization of the binding site; (2) posi-tioning of the ligand into the binding site; and (3) evaluating thestrength of interaction for a specific ligand–receptor complex [44].
The RDS was performed with 13 different compounds for HsPNP,and these ligands were built using a molecular mechanics force fieldand minimized with conjugated gradient algorithm method for1000 steps with RMS Gradient 0.1 kcal �1 mol�1. These dockedstructures, together with 2 crystallographic structures (PNP in com-plex with either acyclovir (1PWY) or inosine (1RCT)) compose ourtest set to be used to validate a specific empirical scoring functionto estimate ligand-binding affinities. For docking of the presentcrystallographic structure before the RDS the ligand was rotated180� along z-axis and translated 1 (fractional coordinates) alongthe three axis, using the program LSQKAB [22]. This docking simu-lation was carried out in order to test the ability of our new empir-ical scoring function to evaluate docking results. A total of 99 dockedstructures were generated, and RMSDs were calculated against thecrystallographic structure (HsPNP:MQU).
Evaluation of binding affinity
The analysis of the interaction between a ligand and a proteintarget is still an important scientific tool to predict new potentialdrugs. The affinity and specificity between a ligand and its proteintarget depends on several structural features such as directionalhydrogen bonds (HB) and ionic interactions, as well as on shapecomplementarity of the contact surfaces of both partners [45]. At-tempts to use the empirical scoring functions available in the pro-gram XSCORE (HPScore, HMScore and HSScore) [46] and programDrugscore [47] to evaluate the binding affinity of the ligandsagainst HsPNP generated unsatisfactory results, with low correla-tion coefficient between experimental and predicted affinities.
Therefore, in order to improve the results for computationaldetermined binding affinities, we developed a novel empirical scor-ing function [48]. In spite of many problems in the understanding ofthe structural features important for binding affinity, most of theexperimentally available data indicates that additive functions forprotein–ligand interactions might be a good approach to the devel-opment of empirical scoring functions. With atomic coordinates(x,y,z) available for protein–ligand complexes, the analysis of thebinding can be estimated as a sum of interactions multiplied byweighting coefficients (cj), as indicated by the following equation:
pKd ¼ c0 þXN
j�1
cjfjðx; y; zÞ ð2Þ
pKd is the�logKd where Kd could be either an estimate of overalldissociation constant (KM or Kd) or dissociation constant for an en-zyme activity inhibitor (Ki), c0 is a regression constant, fjs are func-tions that account for van der Waals interactions, intermolecularHBs, deformation, hydrophobic effect and others that may beincluded.
Most of the empirical functions use the size of the contact sur-face at the protein-ligand interface to estimate the hydrophobicinteraction. A reasonable correlation between experimental affini-ties can be obtained with contact areas (A1) alone. We have re-cently proposed the use of a novel set of scoring functions whichare based on the observation that the major determinants to ligandspecificity are intermolecular HBs and hydrophobic contacts [49–51]. The present set of scoring functions contains 25 polynomialfunctions described in Table 1, comprising terms up to degree 2,which may involve cross-terms (HB and A). Determination of the
30 Luis Fernando Saraiva Macedo Timmers et al. / Archives of Biochemistry and Biophysics 479 (2008) 28–38

Author's personal copy
intermolecular HBs and A1 of 100 binary complexes available atPDBBIND [52] were used to propose this set of functions (Supple-mentary material). No HsPNP structures were included in thisdataset. This novel function is based exclusively on the HBs, A1
and accessible surface area for the ligand (A2). The additive natureof the empirical scoring functions generally leads to large ligandsobtaining high scores. This effect is undesirable. Owing to the over-estimation of the A1 contribution to the empirical scoring functionwe devised a simple scheme to reduce this contribution. We intro-duced a penalty term that diminishes the dependence of the scoreon molecular size. We divided the A1 by the term A2–A1, which pre-sents the highest values for complexes with A1 much smaller thanA2. This scheme reduces the contribution of the A1 term in theempirical function for those ligands with relatively small A1. Theempirical function 17 presents the highest correlation coefficientbetween empirical and predicted binding affinities. This functionis composed of a polynomial involving the number of intermolec-ular HBs and the modified contact area (A), as follows:
pKd ¼ c0 þ c1HBþ c2HB2 þ c3HBAþ c4Aþ c5A2 ð3Þ
where c0 is the regression constant, and cjs are the weights for theother terms present in the above equation. The term A is deter-mined by the following equation:
A ¼ A1=ðA2 � A1Þ ð4Þ
The terms A1 and A2 were calculated using a modified version of Leeand Richards’ algorithm [53] implemented in the AREAIMOL [22].The intermolecular HBs were determined using a method previ-ously described [48]. Standard multivariate regression was carriedout on the whole training set. This approach has been previouslyused in the study of PNP from Streptococcus agalactiae [48].
Enzymatic assay for HsPNP
All chemicals used here were of analytical or reagent grade andrequired no further purification. MQU was solubilized in dimethylsulfoxide (DMSO). All enzyme activity assays were performed at25 �C and 50 mM Tris at pH 7.6. The phosphorolysis of 2-amino-6-mercapto-7-methylpurine ribonucleoside (MESG) to 2-amino-6-mercapto-7-methylpurine (e = 11000 M�1 cm�1 at 360 nm) was
monitored spectrophotometrically by the change in absorbancein the presence of Pi and HsPNP. Both substrates (MESG and Pi)were used at fixed non-saturating concentrations in the absenceor presence of MQU in the reaction mixture in order to evaluateits inhibitory effect.
Fluorescence spectroscopy
Fluorescence titration of HsPNP by MQU was carried out at25 �C by making microliter additions of 2.0 mM MQU (final con-centration ranging from 1.0 to 9.96 lM) to 2 mL of 3 lM HsPNPin 50 mM Tris at pH 7.6, keeping the dilution to a maximum of0.50%. Measurements of intrinsic protein fluorescence of HsPNPemployed excitation wavelength at 296 nm and emission wave-length ranging from 305 to 420 nm (maximum kEM = 330 nm).The slits for excitation and emission wavelengths were, respec-tively, 3.0 and 10 nm. To account for the inner filter effect due toMQU absorption of excitation light, two cuvettes were placed inseries so that the contents of the first cuvette (either buffer orMQU) acted as a filter of the excitation light and the light fromthe second cuvette detected.
Experimental data analysis
Data from equilibrium fluorescence spectroscopy were fitted toEq. (5), the Hill equation [54], in which F is the observed fluores-cence signal, Fmax is the maximal fluorescence, F/Fmax ratio is thedegree of saturation, n represents the total number of binding sites,and K0 is the mean dissociation constant for HsPNP:MQU binarycomplex formation, which is comprised of interaction factors andthe intrinsic dissociation constant.
F=Fmax ¼ An=ðK 0 þ AnÞ ð5Þ
Results and discussion
Molecular replacement and crystallographic refinement
The standard procedure of molecular replacement using AMoRe[24] was used to solve the structure. Function computation corre-
Table 1Polynomial empirical scoring functions
pKdT Functions
1 1.21082 + 0.290938*HB + 3.01849*A2 2.55586 + 0.284172*HB + 1.52129*A*A3 1.62730692439939 + 0.134428282118786*HB + 0.011564243645413*HB*HB + 2.95047720180332*A*A4 2.96661 + 0.118486*HB + 0.0122541*HB*HB + 1.48312*A*A5 0.354505 + 0.141384*HB + 0.0115682*HB*HB + 6.09996*A-1.74406*A*A6 -0.061829 + 0.297946*HB + 6.16727*A-1.74366*A*A7 0.805447 + 0.0211133*HB*HB + 5.96296*A-1.70141*A*A8 2.02696 + 0.0206507*HB*HB + 2.89337*A9 3.29656 + 0.0202696*HB*HB + 1.45802*A*A
10 3.88331 + 0.0048745*HB + 0.318024*HB*A11 3.11326 + 1.20067*A + 0.274646*HB*A12 4.30244-0.170762*HB + 0.0136116*HB*HB + 0.308455*HB*A13 0.704576 + 0.367881*HB + 3.58451*A-0.0862137*HB*A14 1.1138 + 0.211753*HB + 0.0116538*HB*HB-0.0879995*HB*A + 3.52769*A15 2.0286 + 0.02062*HB*HB + 2.89022*A + 0.000509408*HB*A16 3.89706 + 0.00330052*HB*HB + 0.288261*HB*A17 -0.376415 + 0.23806*HB + 0.0116799*HB*HB-0.109449*HB*A + 7.04613*A-1.87046*A*A18 -0.784559 + 0.394502*HB-0.10763*HB*A + 7.09836*A-1.86796*A*A19 2.23253 + 3.43884*A + 0.277792*HB*A-1.25123*A20 3.33866 + 0.0161386*HB*HB + 0.0693682*HB*A + 1.23337*A*A21 0.770528 + 0.0216618*HB*HB-0.00904417*HB*A + 6.0334*A-1.70945*A*A22 3.63791 + 0.281169*HB*A + 0.55785*A*A23 3.89467 + 0.321571*HB*A24 2.67982 + 0.248414*HB + 0.0407366*HB*A + 1.38177*A*A25 3.07883 + 0.0864079*HB + 0.012179*HB*HB + 0.0377019*HB*A + 1.35423*A*A
Luis Fernando Saraiva Macedo Timmers et al. / Archives of Biochemistry and Biophysics 479 (2008) 28–38 31
Author's personal copy
lation was of 76.1% and the Rfactor of 35.4% after rotation and trans-lation of the model. The highest magnitude of the correlation coef-ficient function obtained for the Euler angles were a = 113.57�,b = 58.49�, and c = 157.90�. The fractional coordinates areTx = 0.496, Ty = 0.2909, and Tz = 0.1989. At this stage 2Fobs � Fcalc
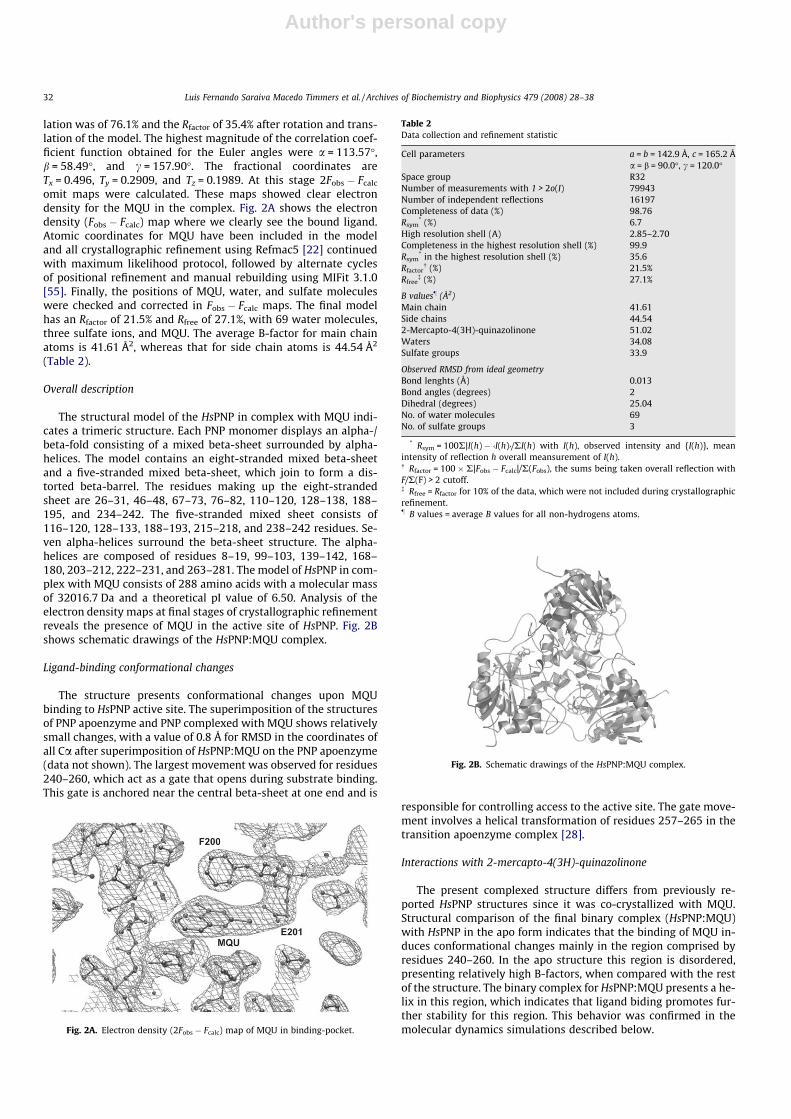
omit maps were calculated. These maps showed clear electrondensity for the MQU in the complex. Fig. 2A shows the electrondensity (Fobs � Fcalc) map where we clearly see the bound ligand.Atomic coordinates for MQU have been included in the modeland all crystallographic refinement using Refmac5 [22] continuedwith maximum likelihood protocol, followed by alternate cyclesof positional refinement and manual rebuilding using MIFit 3.1.0[55]. Finally, the positions of MQU, water, and sulfate moleculeswere checked and corrected in Fobs � Fcalc maps. The final modelhas an Rfactor of 21.5% and Rfree of 27.1%, with 69 water molecules,three sulfate ions, and MQU. The average B-factor for main chainatoms is 41.61 Å2, whereas that for side chain atoms is 44.54 Å2
(Table 2).
Overall description
The structural model of the HsPNP in complex with MQU indi-cates a trimeric structure. Each PNP monomer displays an alpha-/beta-fold consisting of a mixed beta-sheet surrounded by alpha-helices. The model contains an eight-stranded mixed beta-sheetand a five-stranded mixed beta-sheet, which join to form a dis-torted beta-barrel. The residues making up the eight-strandedsheet are 26–31, 46–48, 67–73, 76–82, 110–120, 128–138, 188–195, and 234–242. The five-stranded mixed sheet consists of116–120, 128–133, 188–193, 215–218, and 238–242 residues. Se-ven alpha-helices surround the beta-sheet structure. The alpha-helices are composed of residues 8–19, 99–103, 139–142, 168–180, 203–212, 222–231, and 263–281. The model of HsPNP in com-plex with MQU consists of 288 amino acids with a molecular massof 32016.7 Da and a theoretical pI value of 6.50. Analysis of theelectron density maps at final stages of crystallographic refinementreveals the presence of MQU in the active site of HsPNP. Fig. 2Bshows schematic drawings of the HsPNP:MQU complex.
Ligand-binding conformational changes
The structure presents conformational changes upon MQUbinding to HsPNP active site. The superimposition of the structuresof PNP apoenzyme and PNP complexed with MQU shows relativelysmall changes, with a value of 0.8 Å for RMSD in the coordinates ofall Ca after superimposition of HsPNP:MQU on the PNP apoenzyme(data not shown). The largest movement was observed for residues240–260, which act as a gate that opens during substrate binding.This gate is anchored near the central beta-sheet at one end and is
responsible for controlling access to the active site. The gate move-ment involves a helical transformation of residues 257–265 in thetransition apoenzyme complex [28].
Interactions with 2-mercapto-4(3H)-quinazolinone
The present complexed structure differs from previously re-ported HsPNP structures since it was co-crystallized with MQU.Structural comparison of the final binary complex (HsPNP:MQU)with HsPNP in the apo form indicates that the binding of MQU in-duces conformational changes mainly in the region comprised byresidues 240–260. In the apo structure this region is disordered,presenting relatively high B-factors, when compared with the restof the structure. The binary complex for HsPNP:MQU presents a he-lix in this region, which indicates that ligand biding promotes fur-ther stability for this region. This behavior was confirmed in themolecular dynamics simulations described below.Fig. 2A. Electron density (2Fobs � Fcalc) map of MQU in binding-pocket.
Table 2Data collection and refinement statistic
Cell parameters a = b = 142.9 Å, c = 165.2 Åa = b = 90.0�, c = 120.0�
Space group R32Number of measurements with 1 > 2o(I) 79943Number of independent reflections 16197Completeness of data (%) 98.76Rsym
* (%) 6.7High resolution shell (A) 2.85–2.70Completeness in the highest resolution shell (%) 99.9Rsym
* in the highest resolution shell (%) 35.6Rfactor
� (%) 21.5%Rfree
� (%) 27.1%
B values– (Å2)Main chain 41.61Side chains 44.542-Mercapto-4(3H)-quinazolinone 51.02Waters 34.08Sulfate groups 33.9
Observed RMSD from ideal geometryBond lenghts (Å) 0.013Bond angles (degrees) 2Dihedral (degrees) 25.04No. of water molecules 69No. of sulfate groups 3
* Rsym = 100R|I(h) � ‹I(h)›/RI(h) with I(h), observed intensity and {I(h)}, meanintensity of reflection h overall meansurement of I(h).� Rfactor = 100 � R|Fobs � Fcalc|/R(Fobs), the sums being taken overall reflection withF/R(F) > 2 cutoff.� Rfree = Rfactor for 10% of the data, which were not included during crystallographicrefinement.– B values = average B values for all non-hydrogens atoms.
Fig. 2B. Schematic drawings of the HsPNP:MQU complex.
32 Luis Fernando Saraiva Macedo Timmers et al. / Archives of Biochemistry and Biophysics 479 (2008) 28–38
Author's personal copy
The specificity and affinity between enzyme and a ligand de-pend on directional HBs and ionic interactions, as well as on shapecomplementarity of the contact surfaces of both partners [56].Analysis of the HBs between MQU and HsPNP reveals a 3.1 Å inter-molecular HB involving the residue Asn243.
Molecular dynamics simulations
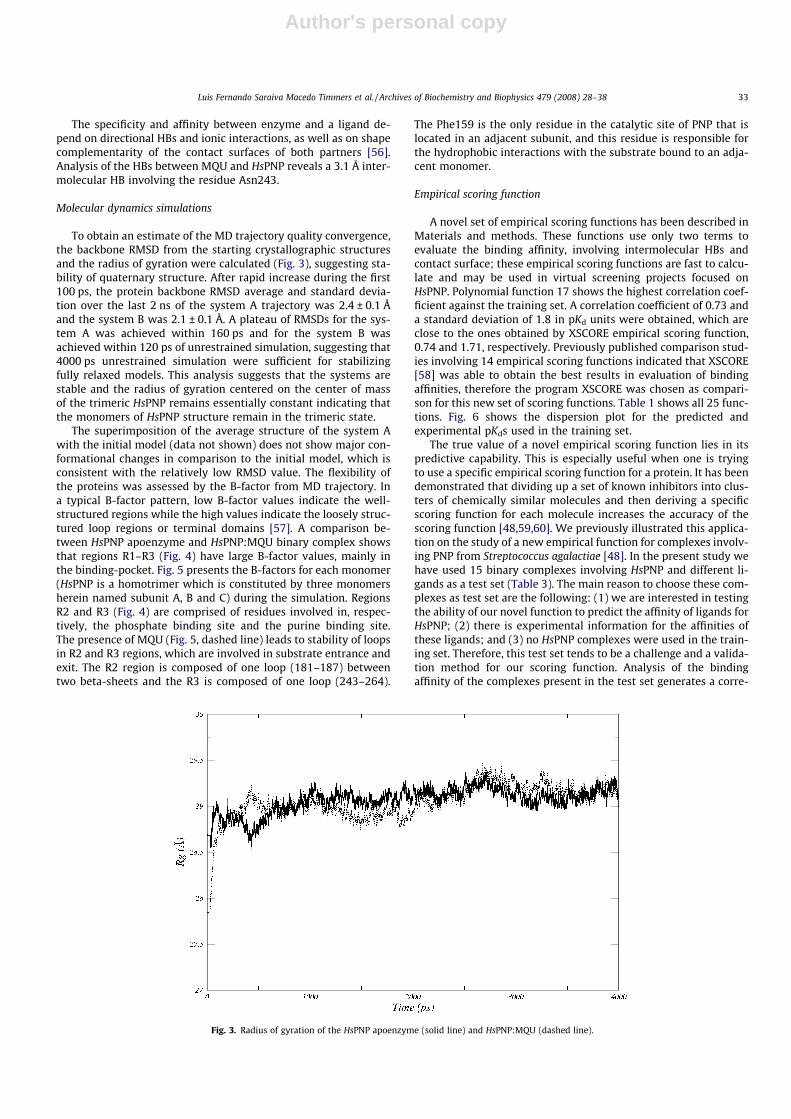
To obtain an estimate of the MD trajectory quality convergence,the backbone RMSD from the starting crystallographic structuresand the radius of gyration were calculated (Fig. 3), suggesting sta-bility of quaternary structure. After rapid increase during the first100 ps, the protein backbone RMSD average and standard devia-tion over the last 2 ns of the system A trajectory was 2.4 ± 0.1 Åand the system B was 2.1 ± 0.1 Å. A plateau of RMSDs for the sys-tem A was achieved within 160 ps and for the system B wasachieved within 120 ps of unrestrained simulation, suggesting that4000 ps unrestrained simulation were sufficient for stabilizingfully relaxed models. This analysis suggests that the systems arestable and the radius of gyration centered on the center of massof the trimeric HsPNP remains essentially constant indicating thatthe monomers of HsPNP structure remain in the trimeric state.
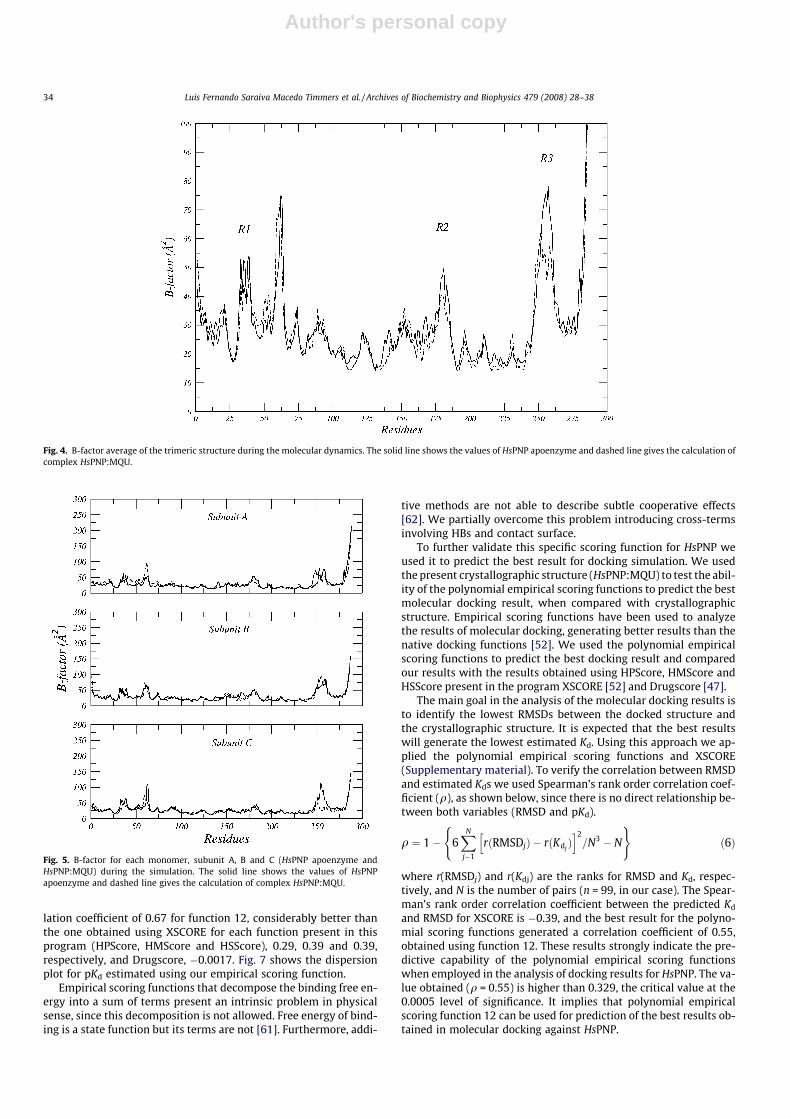
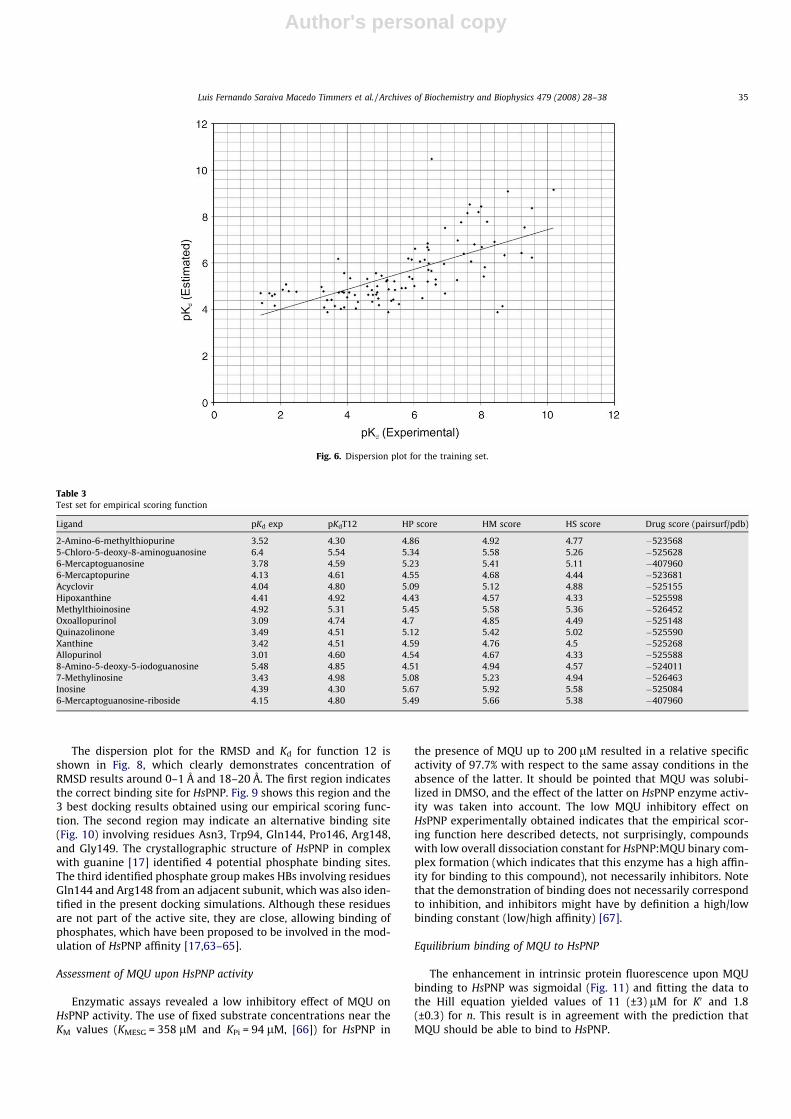
The superimposition of the average structure of the system Awith the initial model (data not shown) does not show major con-formational changes in comparison to the initial model, which isconsistent with the relatively low RMSD value. The flexibility ofthe proteins was assessed by the B-factor from MD trajectory. Ina typical B-factor pattern, low B-factor values indicate the well-structured regions while the high values indicate the loosely struc-tured loop regions or terminal domains [57]. A comparison be-tween HsPNP apoenzyme and HsPNP:MQU binary complex showsthat regions R1–R3 (Fig. 4) have large B-factor values, mainly inthe binding-pocket. Fig. 5 presents the B-factors for each monomer(HsPNP is a homotrimer which is constituted by three monomersherein named subunit A, B and C) during the simulation. RegionsR2 and R3 (Fig. 4) are comprised of residues involved in, respec-tively, the phosphate binding site and the purine binding site.The presence of MQU (Fig. 5, dashed line) leads to stability of loopsin R2 and R3 regions, which are involved in substrate entrance andexit. The R2 region is composed of one loop (181–187) betweentwo beta-sheets and the R3 is composed of one loop (243–264).
The Phe159 is the only residue in the catalytic site of PNP that islocated in an adjacent subunit, and this residue is responsible forthe hydrophobic interactions with the substrate bound to an adja-cent monomer.
Empirical scoring function
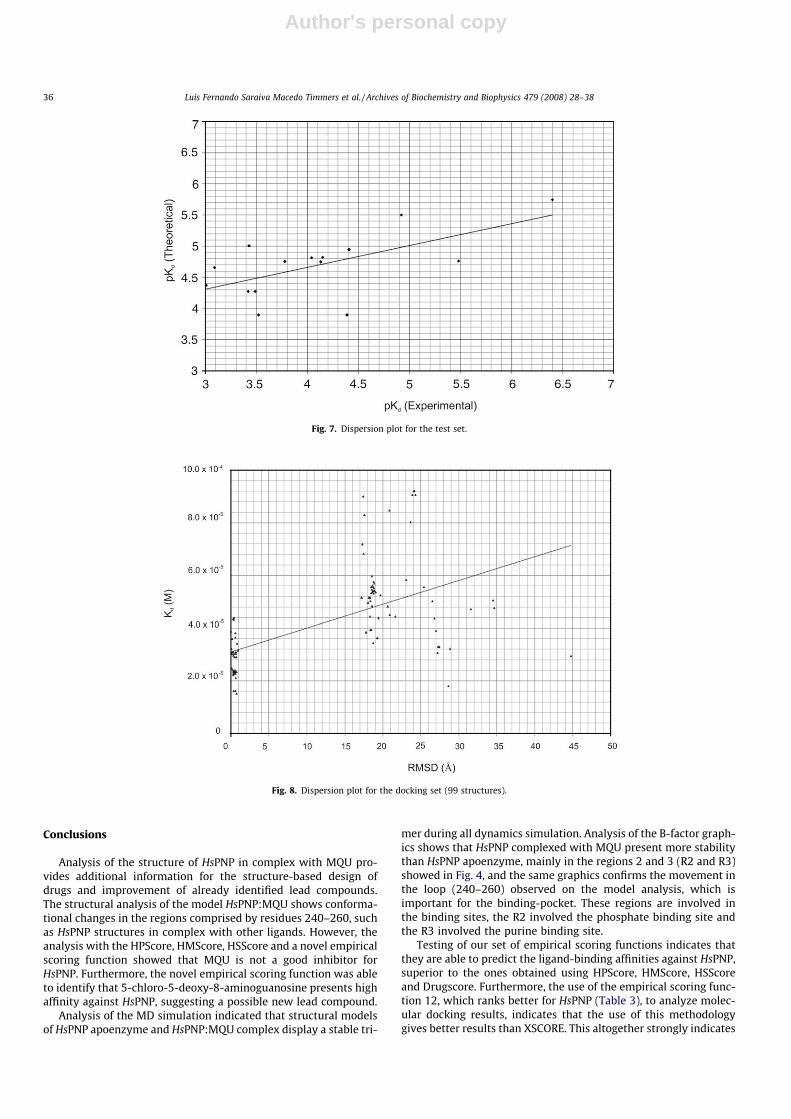
A novel set of empirical scoring functions has been described inMaterials and methods. These functions use only two terms toevaluate the binding affinity, involving intermolecular HBs andcontact surface; these empirical scoring functions are fast to calcu-late and may be used in virtual screening projects focused onHsPNP. Polynomial function 17 shows the highest correlation coef-ficient against the training set. A correlation coefficient of 0.73 anda standard deviation of 1.8 in pKd units were obtained, which areclose to the ones obtained by XSCORE empirical scoring function,0.74 and 1.71, respectively. Previously published comparison stud-ies involving 14 empirical scoring functions indicated that XSCORE[58] was able to obtain the best results in evaluation of bindingaffinities, therefore the program XSCORE was chosen as compari-son for this new set of scoring functions. Table 1 shows all 25 func-tions. Fig. 6 shows the dispersion plot for the predicted andexperimental pKds used in the training set.
The true value of a novel empirical scoring function lies in itspredictive capability. This is especially useful when one is tryingto use a specific empirical scoring function for a protein. It has beendemonstrated that dividing up a set of known inhibitors into clus-ters of chemically similar molecules and then deriving a specificscoring function for each molecule increases the accuracy of thescoring function [48,59,60]. We previously illustrated this applica-tion on the study of a new empirical function for complexes involv-ing PNP from Streptococcus agalactiae [48]. In the present study wehave used 15 binary complexes involving HsPNP and different li-gands as a test set (Table 3). The main reason to choose these com-plexes as test set are the following: (1) we are interested in testingthe ability of our novel function to predict the affinity of ligands forHsPNP; (2) there is experimental information for the affinities ofthese ligands; and (3) no HsPNP complexes were used in the train-ing set. Therefore, this test set tends to be a challenge and a valida-tion method for our scoring function. Analysis of the bindingaffinity of the complexes present in the test set generates a corre-
Fig. 3. Radius of gyration of the HsPNP apoenzyme (solid line) and HsPNP:MQU (dashed line).
Luis Fernando Saraiva Macedo Timmers et al. / Archives of Biochemistry and Biophysics 479 (2008) 28–38 33
Author's personal copy
lation coefficient of 0.67 for function 12, considerably better thanthe one obtained using XSCORE for each function present in thisprogram (HPScore, HMScore and HSScore), 0.29, 0.39 and 0.39,respectively, and Drugscore, �0.0017. Fig. 7 shows the dispersionplot for pKd estimated using our empirical scoring function.
Empirical scoring functions that decompose the binding free en-ergy into a sum of terms present an intrinsic problem in physicalsense, since this decomposition is not allowed. Free energy of bind-ing is a state function but its terms are not [61]. Furthermore, addi-
tive methods are not able to describe subtle cooperative effects[62]. We partially overcome this problem introducing cross-termsinvolving HBs and contact surface.
To further validate this specific scoring function for HsPNP weused it to predict the best result for docking simulation. We usedthe present crystallographic structure (HsPNP:MQU) to test the abil-ity of the polynomial empirical scoring functions to predict the bestmolecular docking result, when compared with crystallographicstructure. Empirical scoring functions have been used to analyzethe results of molecular docking, generating better results than thenative docking functions [52]. We used the polynomial empiricalscoring functions to predict the best docking result and comparedour results with the results obtained using HPScore, HMScore andHSScore present in the program XSCORE [52] and Drugscore [47].
The main goal in the analysis of the molecular docking results isto identify the lowest RMSDs between the docked structure andthe crystallographic structure. It is expected that the best resultswill generate the lowest estimated Kd. Using this approach we ap-plied the polynomial empirical scoring functions and XSCORE(Supplementary material). To verify the correlation between RMSDand estimated Kds we used Spearman’s rank order correlation coef-ficient (q), as shown below, since there is no direct relationship be-tween both variables (RMSD and pKd).
q ¼ 1� 6XN
j�1
rðRMSDjÞ � rðKdjÞ
h i2=N3 � N
( )ð6Þ
where r(RMSDj) and r(Kdj) are the ranks for RMSD and Kd, respec-tively, and N is the number of pairs (n = 99, in our case). The Spear-man’s rank order correlation coefficient between the predicted Kd
and RMSD for XSCORE is �0.39, and the best result for the polyno-mial scoring functions generated a correlation coefficient of 0.55,obtained using function 12. These results strongly indicate the pre-dictive capability of the polynomial empirical scoring functionswhen employed in the analysis of docking results for HsPNP. The va-lue obtained (q = 0.55) is higher than 0.329, the critical value at the0.0005 level of significance. It implies that polynomial empiricalscoring function 12 can be used for prediction of the best results ob-tained in molecular docking against HsPNP.
Fig. 4. B-factor average of the trimeric structure during the molecular dynamics. The solid line shows the values of HsPNP apoenzyme and dashed line gives the calculation ofcomplex HsPNP:MQU.
Fig. 5. B-factor for each monomer, subunit A, B and C (HsPNP apoenzyme andHsPNP:MQU) during the simulation. The solid line shows the values of HsPNPapoenzyme and dashed line gives the calculation of complex HsPNP:MQU.
34 Luis Fernando Saraiva Macedo Timmers et al. / Archives of Biochemistry and Biophysics 479 (2008) 28–38
Author's personal copy
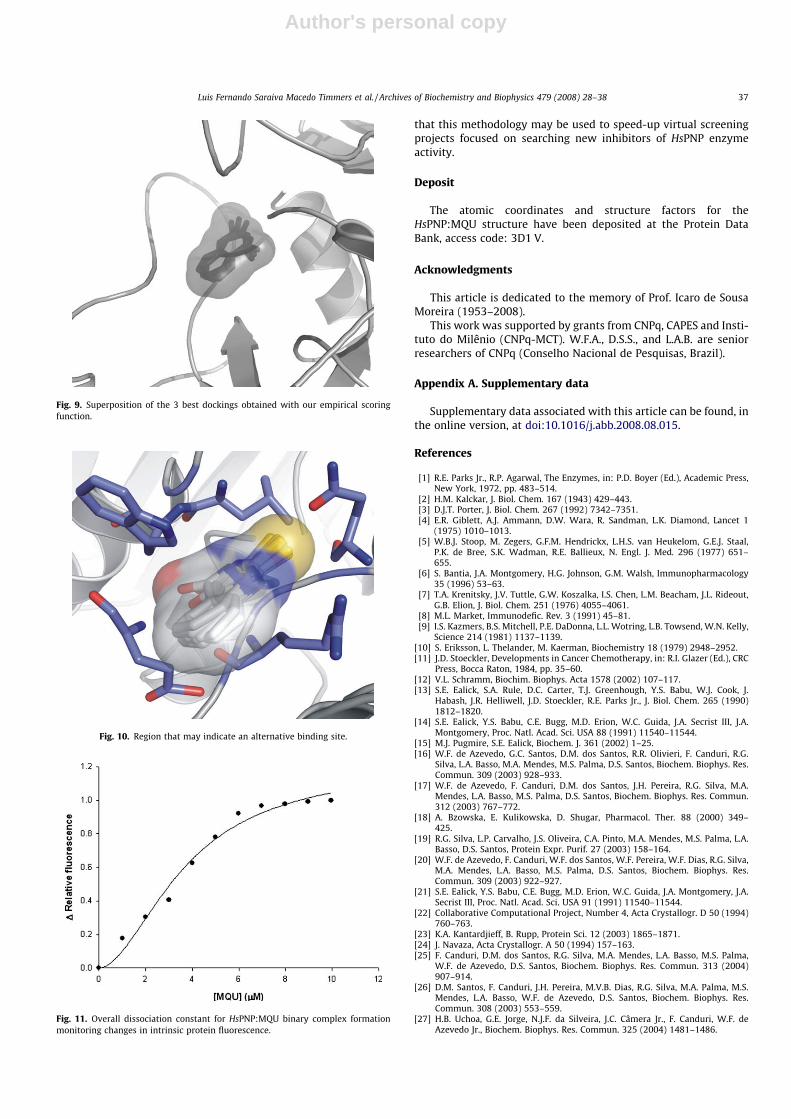
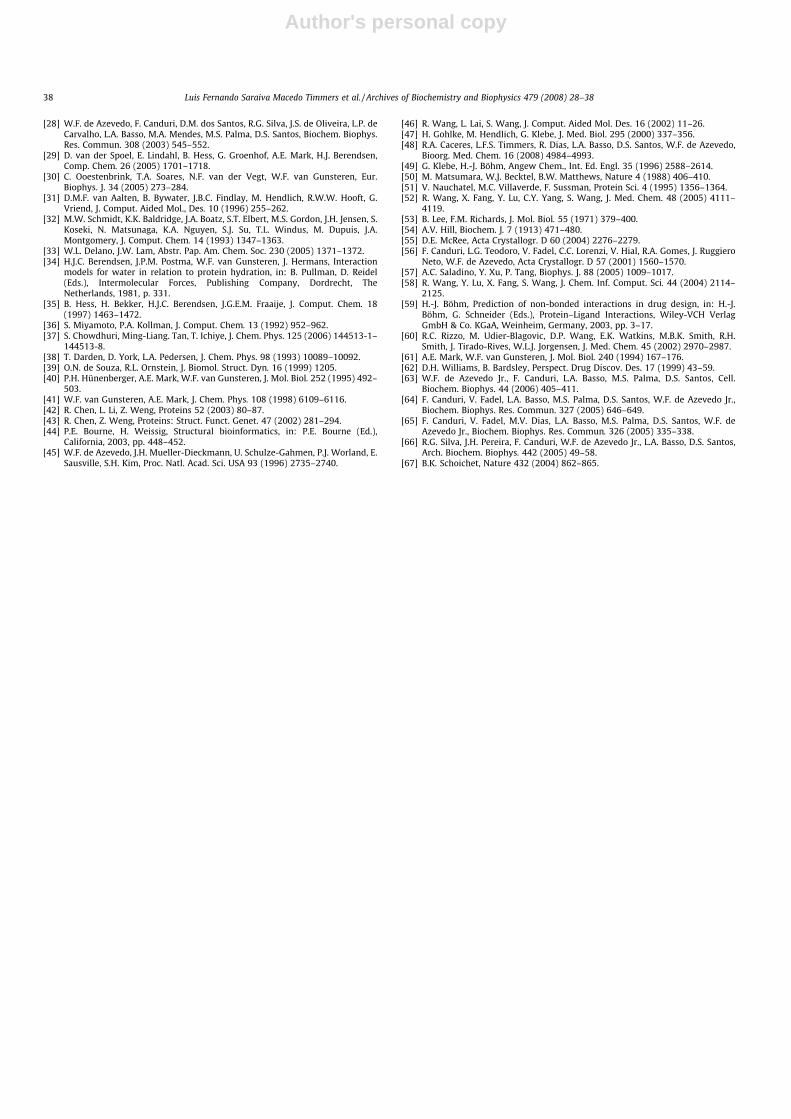
The dispersion plot for the RMSD and Kd for function 12 isshown in Fig. 8, which clearly demonstrates concentration ofRMSD results around 0–1 Å and 18–20 Å. The first region indicatesthe correct binding site for HsPNP. Fig. 9 shows this region and the3 best docking results obtained using our empirical scoring func-tion. The second region may indicate an alternative binding site(Fig. 10) involving residues Asn3, Trp94, Gln144, Pro146, Arg148,and Gly149. The crystallographic structure of HsPNP in complexwith guanine [17] identified 4 potential phosphate binding sites.The third identified phosphate group makes HBs involving residuesGln144 and Arg148 from an adjacent subunit, which was also iden-tified in the present docking simulations. Although these residuesare not part of the active site, they are close, allowing binding ofphosphates, which have been proposed to be involved in the mod-ulation of HsPNP affinity [17,63–65].
Assessment of MQU upon HsPNP activity
Enzymatic assays revealed a low inhibitory effect of MQU onHsPNP activity. The use of fixed substrate concentrations near theKM values (KMESG = 358 lM and KPi = 94 lM, [66]) for HsPNP in
the presence of MQU up to 200 lM resulted in a relative specificactivity of 97.7% with respect to the same assay conditions in theabsence of the latter. It should be pointed that MQU was solubi-lized in DMSO, and the effect of the latter on HsPNP enzyme activ-ity was taken into account. The low MQU inhibitory effect onHsPNP experimentally obtained indicates that the empirical scor-ing function here described detects, not surprisingly, compoundswith low overall dissociation constant for HsPNP:MQU binary com-plex formation (which indicates that this enzyme has a high affin-ity for binding to this compound), not necessarily inhibitors. Notethat the demonstration of binding does not necessarily correspondto inhibition, and inhibitors might have by definition a high/lowbinding constant (low/high affinity) [67].
Equilibrium binding of MQU to HsPNP
The enhancement in intrinsic protein fluorescence upon MQUbinding to HsPNP was sigmoidal (Fig. 11) and fitting the data tothe Hill equation yielded values of 11 (±3) lM for K0 and 1.8(±0.3) for n. This result is in agreement with the prediction thatMQU should be able to bind to HsPNP.
Fig. 6. Dispersion plot for the training set.
Table 3Test set for empirical scoring function
Ligand pKd exp pKdT12 HP score HM score HS score Drug score (pairsurf/pdb)
2-Amino-6-methylthiopurine 3.52 4.30 4.86 4.92 4.77 �5235685-Chloro-5-deoxy-8-aminoguanosine 6.4 5.54 5.34 5.58 5.26 �5256286-Mercaptoguanosine 3.78 4.59 5.23 5.41 5.11 �4079606-Mercaptopurine 4.13 4.61 4.55 4.68 4.44 �523681Acyclovir 4.04 4.80 5.09 5.12 4.88 �525155Hipoxanthine 4.41 4.92 4.43 4.57 4.33 �525598Methylthioinosine 4.92 5.31 5.45 5.58 5.36 �526452Oxoallopurinol 3.09 4.74 4.7 4.85 4.49 �525148Quinazolinone 3.49 4.51 5.12 5.42 5.02 �525590Xanthine 3.42 4.51 4.59 4.76 4.5 �525268Allopurinol 3.01 4.60 4.54 4.67 4.33 �5255888-Amino-5-deoxy-5-iodoguanosine 5.48 4.85 4.51 4.94 4.57 �5240117-Methylinosine 3.43 4.98 5.08 5.23 4.94 �526463Inosine 4.39 4.30 5.67 5.92 5.58 �5250846-Mercaptoguanosine-riboside 4.15 4.80 5.49 5.66 5.38 �407960
Luis Fernando Saraiva Macedo Timmers et al. / Archives of Biochemistry and Biophysics 479 (2008) 28–38 35
Author's personal copy
Conclusions
Analysis of the structure of HsPNP in complex with MQU pro-vides additional information for the structure-based design ofdrugs and improvement of already identified lead compounds.The structural analysis of the model HsPNP:MQU shows conforma-tional changes in the regions comprised by residues 240–260, suchas HsPNP structures in complex with other ligands. However, theanalysis with the HPScore, HMScore, HSScore and a novel empiricalscoring function showed that MQU is not a good inhibitor forHsPNP. Furthermore, the novel empirical scoring function was ableto identify that 5-chloro-5-deoxy-8-aminoguanosine presents highaffinity against HsPNP, suggesting a possible new lead compound.
Analysis of the MD simulation indicated that structural modelsof HsPNP apoenzyme and HsPNP:MQU complex display a stable tri-
mer during all dynamics simulation. Analysis of the B-factor graph-ics shows that HsPNP complexed with MQU present more stabilitythan HsPNP apoenzyme, mainly in the regions 2 and 3 (R2 and R3)showed in Fig. 4, and the same graphics confirms the movement inthe loop (240–260) observed on the model analysis, which isimportant for the binding-pocket. These regions are involved inthe binding sites, the R2 involved the phosphate binding site andthe R3 involved the purine binding site.
Testing of our set of empirical scoring functions indicates thatthey are able to predict the ligand-binding affinities against HsPNP,superior to the ones obtained using HPScore, HMScore, HSScoreand Drugscore. Furthermore, the use of the empirical scoring func-tion 12, which ranks better for HsPNP (Table 3), to analyze molec-ular docking results, indicates that the use of this methodologygives better results than XSCORE. This altogether strongly indicates
Fig. 7. Dispersion plot for the test set.
Fig. 8. Dispersion plot for the docking set (99 structures).
36 Luis Fernando Saraiva Macedo Timmers et al. / Archives of Biochemistry and Biophysics 479 (2008) 28–38
Author's personal copy
that this methodology may be used to speed-up virtual screeningprojects focused on searching new inhibitors of HsPNP enzymeactivity.
Deposit
The atomic coordinates and structure factors for theHsPNP:MQU structure have been deposited at the Protein DataBank, access code: 3D1 V.
Acknowledgments
This article is dedicated to the memory of Prof. Icaro de SousaMoreira (1953–2008).
This work was supported by grants from CNPq, CAPES and Insti-tuto do Milênio (CNPq-MCT). W.F.A., D.S.S., and L.A.B. are seniorresearchers of CNPq (Conselho Nacional de Pesquisas, Brazil).
Appendix A. Supplementary data
Supplementary data associated with this article can be found, inthe online version, at doi:10.1016/j.abb.2008.08.015.
References
[1] R.E. Parks Jr., R.P. Agarwal, The Enzymes, in: P.D. Boyer (Ed.), Academic Press,New York, 1972, pp. 483–514.
[2] H.M. Kalckar, J. Biol. Chem. 167 (1943) 429–443.[3] D.J.T. Porter, J. Biol. Chem. 267 (1992) 7342–7351.[4] E.R. Giblett, A.J. Ammann, D.W. Wara, R. Sandman, L.K. Diamond, Lancet 1
(1975) 1010–1013.[5] W.B.J. Stoop, M. Zegers, G.F.M. Hendrickx, L.H.S. van Heukelom, G.E.J. Staal,
P.K. de Bree, S.K. Wadman, R.E. Ballieux, N. Engl. J. Med. 296 (1977) 651–655.
[6] S. Bantia, J.A. Montgomery, H.G. Johnson, G.M. Walsh, Immunopharmacology35 (1996) 53–63.
[7] T.A. Krenitsky, J.V. Tuttle, G.W. Koszalka, I.S. Chen, L.M. Beacham, J.L. Rideout,G.B. Elion, J. Biol. Chem. 251 (1976) 4055–4061.
[8] M.L. Market, Immunodefic. Rev. 3 (1991) 45–81.[9] I.S. Kazmers, B.S. Mitchell, P.E. DaDonna, L.L. Wotring, L.B. Towsend, W.N. Kelly,
Science 214 (1981) 1137–1139.[10] S. Eriksson, L. Thelander, M. Kaerman, Biochemistry 18 (1979) 2948–2952.[11] J.D. Stoeckler, Developments in Cancer Chemotherapy, in: R.I. Glazer (Ed.), CRC
Press, Bocca Raton, 1984, pp. 35–60.[12] V.L. Schramm, Biochim. Biophys. Acta 1578 (2002) 107–117.[13] S.E. Ealick, S.A. Rule, D.C. Carter, T.J. Greenhough, Y.S. Babu, W.J. Cook, J.
Habash, J.R. Helliwell, J.D. Stoeckler, R.E. Parks Jr., J. Biol. Chem. 265 (1990)1812–1820.
[14] S.E. Ealick, Y.S. Babu, C.E. Bugg, M.D. Erion, W.C. Guida, J.A. Secrist III, J.A.Montgomery, Proc. Natl. Acad. Sci. USA 88 (1991) 11540–11544.
[15] M.J. Pugmire, S.E. Ealick, Biochem. J. 361 (2002) 1–25.[16] W.F. de Azevedo, G.C. Santos, D.M. dos Santos, R.R. Olivieri, F. Canduri, R.G.
Silva, L.A. Basso, M.A. Mendes, M.S. Palma, D.S. Santos, Biochem. Biophys. Res.Commun. 309 (2003) 928–933.
[17] W.F. de Azevedo, F. Canduri, D.M. dos Santos, J.H. Pereira, R.G. Silva, M.A.Mendes, L.A. Basso, M.S. Palma, D.S. Santos, Biochem. Biophys. Res. Commun.312 (2003) 767–772.
[18] A. Bzowska, E. Kulikowska, D. Shugar, Pharmacol. Ther. 88 (2000) 349–425.
[19] R.G. Silva, L.P. Carvalho, J.S. Oliveira, C.A. Pinto, M.A. Mendes, M.S. Palma, L.A.Basso, D.S. Santos, Protein Expr. Purif. 27 (2003) 158–164.
[20] W.F. de Azevedo, F. Canduri, W.F. dos Santos, W.F. Pereira, W.F. Dias, R.G. Silva,M.A. Mendes, L.A. Basso, M.S. Palma, D.S. Santos, Biochem. Biophys. Res.Commun. 309 (2003) 922–927.
[21] S.E. Ealick, Y.S. Babu, C.E. Bugg, M.D. Erion, W.C. Guida, J.A. Montgomery, J.A.Secrist III, Proc. Natl. Acad. Sci. USA 91 (1991) 11540–11544.
[22] Collaborative Computational Project, Number 4, Acta Crystallogr. D 50 (1994)760–763.
[23] K.A. Kantardjieff, B. Rupp, Protein Sci. 12 (2003) 1865–1871.[24] J. Navaza, Acta Crystallogr. A 50 (1994) 157–163.[25] F. Canduri, D.M. dos Santos, R.G. Silva, M.A. Mendes, L.A. Basso, M.S. Palma,
W.F. de Azevedo, D.S. Santos, Biochem. Biophys. Res. Commun. 313 (2004)907–914.
[26] D.M. Santos, F. Canduri, J.H. Pereira, M.V.B. Dias, R.G. Silva, M.A. Palma, M.S.Mendes, L.A. Basso, W.F. de Azevedo, D.S. Santos, Biochem. Biophys. Res.Commun. 308 (2003) 553–559.
[27] H.B. Uchoa, G.E. Jorge, N.J.F. da Silveira, J.C. Câmera Jr., F. Canduri, W.F. deAzevedo Jr., Biochem. Biophys. Res. Commun. 325 (2004) 1481–1486.
Fig. 9. Superposition of the 3 best dockings obtained with our empirical scoringfunction.
Fig. 10. Region that may indicate an alternative binding site.
Fig. 11. Overall dissociation constant for HsPNP:MQU binary complex formationmonitoring changes in intrinsic protein fluorescence.
Luis Fernando Saraiva Macedo Timmers et al. / Archives of Biochemistry and Biophysics 479 (2008) 28–38 37
Author's personal copy
[28] W.F. de Azevedo, F. Canduri, D.M. dos Santos, R.G. Silva, J.S. de Oliveira, L.P. deCarvalho, L.A. Basso, M.A. Mendes, M.S. Palma, D.S. Santos, Biochem. Biophys.Res. Commun. 308 (2003) 545–552.
[29] D. van der Spoel, E. Lindahl, B. Hess, G. Groenhof, A.E. Mark, H.J. Berendsen,Comp. Chem. 26 (2005) 1701–1718.
[30] C. Ooestenbrink, T.A. Soares, N.F. van der Vegt, W.F. van Gunsteren, Eur.Biophys. J. 34 (2005) 273–284.
[31] D.M.F. van Aalten, B. Bywater, J.B.C. Findlay, M. Hendlich, R.W.W. Hooft, G.Vriend, J. Comput. Aided Mol., Des. 10 (1996) 255–262.
[32] M.W. Schmidt, K.K. Baldridge, J.A. Boatz, S.T. Elbert, M.S. Gordon, J.H. Jensen, S.Koseki, N. Matsunaga, K.A. Nguyen, S.J. Su, T.L. Windus, M. Dupuis, J.A.Montgomery, J. Comput. Chem. 14 (1993) 1347–1363.
[33] W.L. Delano, J.W. Lam, Abstr. Pap. Am. Chem. Soc. 230 (2005) 1371–1372.[34] H.J.C. Berendsen, J.P.M. Postma, W.F. van Gunsteren, J. Hermans, Interaction
models for water in relation to protein hydration, in: B. Pullman, D. Reidel(Eds.), Intermolecular Forces, Publishing Company, Dordrecht, TheNetherlands, 1981, p. 331.
[35] B. Hess, H. Bekker, H.J.C. Berendsen, J.G.E.M. Fraaije, J. Comput. Chem. 18(1997) 1463–1472.
[36] S. Miyamoto, P.A. Kollman, J. Comput. Chem. 13 (1992) 952–962.[37] S. Chowdhuri, Ming-Liang. Tan, T. Ichiye, J. Chem. Phys. 125 (2006) 144513-1–
144513-8.[38] T. Darden, D. York, L.A. Pedersen, J. Chem. Phys. 98 (1993) 10089–10092.[39] O.N. de Souza, R.L. Ornstein, J. Biomol. Struct. Dyn. 16 (1999) 1205.[40] P.H. Hünenberger, A.E. Mark, W.F. van Gunsteren, J. Mol. Biol. 252 (1995) 492–
503.[41] W.F. van Gunsteren, A.E. Mark, J. Chem. Phys. 108 (1998) 6109–6116.[42] R. Chen, L. Li, Z. Weng, Proteins 52 (2003) 80–87.[43] R. Chen, Z. Weng, Proteins: Struct. Funct. Genet. 47 (2002) 281–294.[44] P.E. Bourne, H. Weissig, Structural bioinformatics, in: P.E. Bourne (Ed.),
California, 2003, pp. 448–452.[45] W.F. de Azevedo, J.H. Mueller-Dieckmann, U. Schulze-Gahmen, P.J. Worland, E.
Sausville, S.H. Kim, Proc. Natl. Acad. Sci. USA 93 (1996) 2735–2740.
[46] R. Wang, L. Lai, S. Wang, J. Comput. Aided Mol. Des. 16 (2002) 11–26.[47] H. Gohlke, M. Hendlich, G. Klebe, J. Med. Biol. 295 (2000) 337–356.[48] R.A. Caceres, L.F.S. Timmers, R. Dias, L.A. Basso, D.S. Santos, W.F. de Azevedo,
Bioorg. Med. Chem. 16 (2008) 4984–4993.[49] G. Klebe, H.-J. Böhm, Angew Chem., Int. Ed. Engl. 35 (1996) 2588–2614.[50] M. Matsumara, W.J. Becktel, B.W. Matthews, Nature 4 (1988) 406–410.[51] V. Nauchatel, M.C. Villaverde, F. Sussman, Protein Sci. 4 (1995) 1356–1364.[52] R. Wang, X. Fang, Y. Lu, C.Y. Yang, S. Wang, J. Med. Chem. 48 (2005) 4111–
4119.[53] B. Lee, F.M. Richards, J. Mol. Biol. 55 (1971) 379–400.[54] A.V. Hill, Biochem. J. 7 (1913) 471–480.[55] D.E. McRee, Acta Crystallogr. D 60 (2004) 2276–2279.[56] F. Canduri, L.G. Teodoro, V. Fadel, C.C. Lorenzi, V. Hial, R.A. Gomes, J. Ruggiero
Neto, W.F. de Azevedo, Acta Crystallogr. D 57 (2001) 1560–1570.[57] A.C. Saladino, Y. Xu, P. Tang, Biophys. J. 88 (2005) 1009–1017.[58] R. Wang, Y. Lu, X. Fang, S. Wang, J. Chem. Inf. Comput. Sci. 44 (2004) 2114–
2125.[59] H.-J. Böhm, Prediction of non-bonded interactions in drug design, in: H.-J.
Böhm, G. Schneider (Eds.), Protein–Ligand Interactions, Wiley-VCH VerlagGmbH & Co. KGaA, Weinheim, Germany, 2003, pp. 3–17.
[60] R.C. Rizzo, M. Udier-Blagovic, D.P. Wang, E.K. Watkins, M.B.K. Smith, R.H.Smith, J. Tirado-Rives, W.L.J. Jorgensen, J. Med. Chem. 45 (2002) 2970–2987.
[61] A.E. Mark, W.F. van Gunsteren, J. Mol. Biol. 240 (1994) 167–176.[62] D.H. Williams, B. Bardsley, Perspect. Drug Discov. Des. 17 (1999) 43–59.[63] W.F. de Azevedo Jr., F. Canduri, L.A. Basso, M.S. Palma, D.S. Santos, Cell.
Biochem. Biophys. 44 (2006) 405–411.[64] F. Canduri, V. Fadel, L.A. Basso, M.S. Palma, D.S. Santos, W.F. de Azevedo Jr.,
Biochem. Biophys. Res. Commun. 327 (2005) 646–649.[65] F. Canduri, V. Fadel, M.V. Dias, L.A. Basso, M.S. Palma, D.S. Santos, W.F. de
Azevedo Jr., Biochem. Biophys. Res. Commun. 326 (2005) 335–338.[66] R.G. Silva, J.H. Pereira, F. Canduri, W.F. de Azevedo Jr., L.A. Basso, D.S. Santos,
Arch. Biochem. Biophys. 442 (2005) 49–58.[67] B.K. Schoichet, Nature 432 (2004) 862–865.
38 Luis Fernando Saraiva Macedo Timmers et al. / Archives of Biochemistry and Biophysics 479 (2008) 28–38
Copyright © 2022 FDOKUMEN