Electrochemical behavior of atenolol, carvedilol and propranolol on copper-oxide nanoparticles
12
Electrochimica Acta 58 (2011) 336–347 Contents lists available at SciVerse ScienceDirect Electrochimica Acta j ourna l ho me pag e: www.elsevier.com/locate/electacta Electrochemical behavior of atenolol, carvedilol and propranolol on copper-oxide nanoparticles Nasrin Shadjou a , Mohammad Hasanzadeh b , Lotfali Saghatforoush c , Robab Mehdizadeh c , Abolghasem Jouyban b,∗ a Department of Chemistry, K.N. Toosi University of Technology, Tehran, Iran b Drug Applied Research Center and Faculty of Pharmacy, Tabriz University of Medical Sciences, Tabriz, Iran c Chemistry Department, Payam Noor University, Khoy, Iran a r t i c l e i n f o Article history: Received 7 August 2011 Received in revised form 13 September 2011 Accepted 20 September 2011 Available online 29 September 2011 Keywords: -Blocker Electrocatalysis Copper-oxide nanoparticle Kinetics a b s t r a c t The electrochemical behavior of atenolol, carvedilol and propranolol was investigated on copper-oxide nanoparticle modified carbon paste electrodes. The process of oxidation and its kinetics were established by using cyclic voltammetry, chronoamperometry techniques and also steady state polarization measure- ments. The results revealed that copper-oxide nanoparticle promotes the rate of oxidation by increasing the peak current, so these drugs are oxidized at lower potentials. The apparent electron transfer rate con- stant (K s ) and transfer coefficient (a) were determined by cyclic voltammetry and were approximately 7.1 s −1 and 0.49, respectively. The modified electrodes showed excellent catalytic activity towards the oxidation of -blockers at an unusually positive potential in buffer solution. The linear concentration range of the proposed sensor for the atenolol, carvedilol and propranolol detection were 12–96, 5–37, and 10–104 M, respectively. © 2011 Elsevier Ltd. All rights reserved. 1. Introduction In recent years multi-electron oxidation processes, C–C bond cleavage and the generation of lower molecular weight products from organic substances on copper-based electrodes in alkaline solutions have received considerable attention due to their analyt- ical applications [1,2]. These include usage of copper metal [3,4] and copper containing modified electrodes (CMEs), e.g. copper oxide/copper [5] and copper oxide [6] modified electrodes. Even though some reports have demonstrated that the anodic oxida- tion of alcohols [7,8] are facilitated on these surfaces, no specific study on the use of copper oxide modified electrodes for the electro- oxidation of -blockers has appeared in the literature. The catalytic action of copper oxide nanoparticle has been reported to be the result of Cu(II)/Cu(I) redox systems [9]. Atenolol, carvedilol and propranolol (Scheme 1) are antihy- pertensive drugs that form -blocker group, which widely used in the treatment of hypertension and some other disorders. As a consequence of widespread use of -blockers, several analyti- cal techniques have been developed for their determinations in recent years, including spectrophotometry [10,11], gas chromatog- raphy [12], capillary electrophoresis [13], high performance liquid chromatography [14,15] and electrochemistry [16–18] methods. ∗ Corresponding author. Tel.: +98 411 3379323; fax: +98 411 3363231. E-mail address: [email protected] (A. Jouyban). Electrochemistry is the most suitable technique for investigating the redox properties of drugs. Data obtained from electrochemi- cal techniques are often correlated with molecular structures and pharmacological activities of drugs. In addition, electrochemistry has a well-defined role in drug analysis, and various electroana- lytical methods have attracted more attentions because of quick response, high sensitivity, abilities to miniaturization, and analysis of drugs even in samples containing complex matrix. Most favor- able property for modern electroanalytical methods is that they are not affected by interferences. Hence, sample can be prepared simply by dissolution of pharmaceutical ingredient in a suitable solvent. Whereas, the sensitivity of previously described methods was limited therefore, it is essential to develop a simple and rapid method for determination of these drugs for routine analysis. In the present study, CuO nanoparticles were applied for selective deter- mination of atenolol, carvedilol and propranolol. The current study was an attempt to develop and apply the modified electrodes by CuO nanoparticles that was also aimed at inspecting the kinetics of electrochemical processes. 2. Experimental 2.1. Chemicals and reagents All chemicals used were analytical grade, purchased from Merck (Darmstadt, Germany) and were used without further purification. 0013-4686/$ – see front matter © 2011 Elsevier Ltd. All rights reserved. doi:10.1016/j.electacta.2011.09.055
-
Upload
independent -
Category
Documents
-
view
4 -
download
0
Transcript of Electrochemical behavior of atenolol, carvedilol and propranolol on copper-oxide nanoparticles

Ec
NAa
b
c
a
ARR1AA
K�ECK
1
cfsiaottsoar
piacrrc
0d
Electrochimica Acta 58 (2011) 336– 347
Contents lists available at SciVerse ScienceDirect
Electrochimica Acta
j ourna l ho me pag e: www.elsev ier .com/ locate /e lec tac ta
lectrochemical behavior of atenolol, carvedilol and propranolol onopper-oxide nanoparticles
asrin Shadjoua, Mohammad Hasanzadehb, Lotfali Saghatforoushc, Robab Mehdizadehc,bolghasem Jouybanb,∗
Department of Chemistry, K.N. Toosi University of Technology, Tehran, IranDrug Applied Research Center and Faculty of Pharmacy, Tabriz University of Medical Sciences, Tabriz, IranChemistry Department, Payam Noor University, Khoy, Iran
r t i c l e i n f o
rticle history:eceived 7 August 2011eceived in revised form3 September 2011ccepted 20 September 2011
a b s t r a c t
The electrochemical behavior of atenolol, carvedilol and propranolol was investigated on copper-oxidenanoparticle modified carbon paste electrodes. The process of oxidation and its kinetics were establishedby using cyclic voltammetry, chronoamperometry techniques and also steady state polarization measure-ments. The results revealed that copper-oxide nanoparticle promotes the rate of oxidation by increasingthe peak current, so these drugs are oxidized at lower potentials. The apparent electron transfer rate con-
vailable online 29 September 2011eywords:-Blockerlectrocatalysis
stant (Ks) and transfer coefficient (a) were determined by cyclic voltammetry and were approximately7.1 s−1 and 0.49, respectively. The modified electrodes showed excellent catalytic activity towards theoxidation of �-blockers at an unusually positive potential in buffer solution. The linear concentrationrange of the proposed sensor for the atenolol, carvedilol and propranolol detection were 12–96, 5–37,
vely.
opper-oxide nanoparticleineticsand 10–104 �M, respecti
. Introduction
In recent years multi-electron oxidation processes, C–C bondleavage and the generation of lower molecular weight productsrom organic substances on copper-based electrodes in alkalineolutions have received considerable attention due to their analyt-cal applications [1,2]. These include usage of copper metal [3,4]nd copper containing modified electrodes (CMEs), e.g. copperxide/copper [5] and copper oxide [6] modified electrodes. Evenhough some reports have demonstrated that the anodic oxida-ion of alcohols [7,8] are facilitated on these surfaces, no specifictudy on the use of copper oxide modified electrodes for the electro-xidation of �-blockers has appeared in the literature. The catalyticction of copper oxide nanoparticle has been reported to be theesult of Cu(II)/Cu(I) redox systems [9].
Atenolol, carvedilol and propranolol (Scheme 1) are antihy-ertensive drugs that form �-blocker group, which widely used
n the treatment of hypertension and some other disorders. As consequence of widespread use of �-blockers, several analyti-al techniques have been developed for their determinations in
ecent years, including spectrophotometry [10,11], gas chromatog-aphy [12], capillary electrophoresis [13], high performance liquidhromatography [14,15] and electrochemistry [16–18] methods.∗ Corresponding author. Tel.: +98 411 3379323; fax: +98 411 3363231.E-mail address: [email protected] (A. Jouyban).
013-4686/$ – see front matter © 2011 Elsevier Ltd. All rights reserved.oi:10.1016/j.electacta.2011.09.055
© 2011 Elsevier Ltd. All rights reserved.
Electrochemistry is the most suitable technique for investigatingthe redox properties of drugs. Data obtained from electrochemi-cal techniques are often correlated with molecular structures andpharmacological activities of drugs. In addition, electrochemistryhas a well-defined role in drug analysis, and various electroana-lytical methods have attracted more attentions because of quickresponse, high sensitivity, abilities to miniaturization, and analysisof drugs even in samples containing complex matrix. Most favor-able property for modern electroanalytical methods is that theyare not affected by interferences. Hence, sample can be preparedsimply by dissolution of pharmaceutical ingredient in a suitablesolvent. Whereas, the sensitivity of previously described methodswas limited therefore, it is essential to develop a simple and rapidmethod for determination of these drugs for routine analysis. In thepresent study, CuO nanoparticles were applied for selective deter-mination of atenolol, carvedilol and propranolol. The current studywas an attempt to develop and apply the modified electrodes byCuO nanoparticles that was also aimed at inspecting the kinetics ofelectrochemical processes.
2. Experimental
2.1. Chemicals and reagents
All chemicals used were analytical grade, purchased from Merck(Darmstadt, Germany) and were used without further purification.
N. Shadjou et al. / Electrochimica Acta 58 (2011) 336– 347 337
Scheme 1. Chemical structure of (A) atenolol, (B) carvedilol and (C) propranolol.
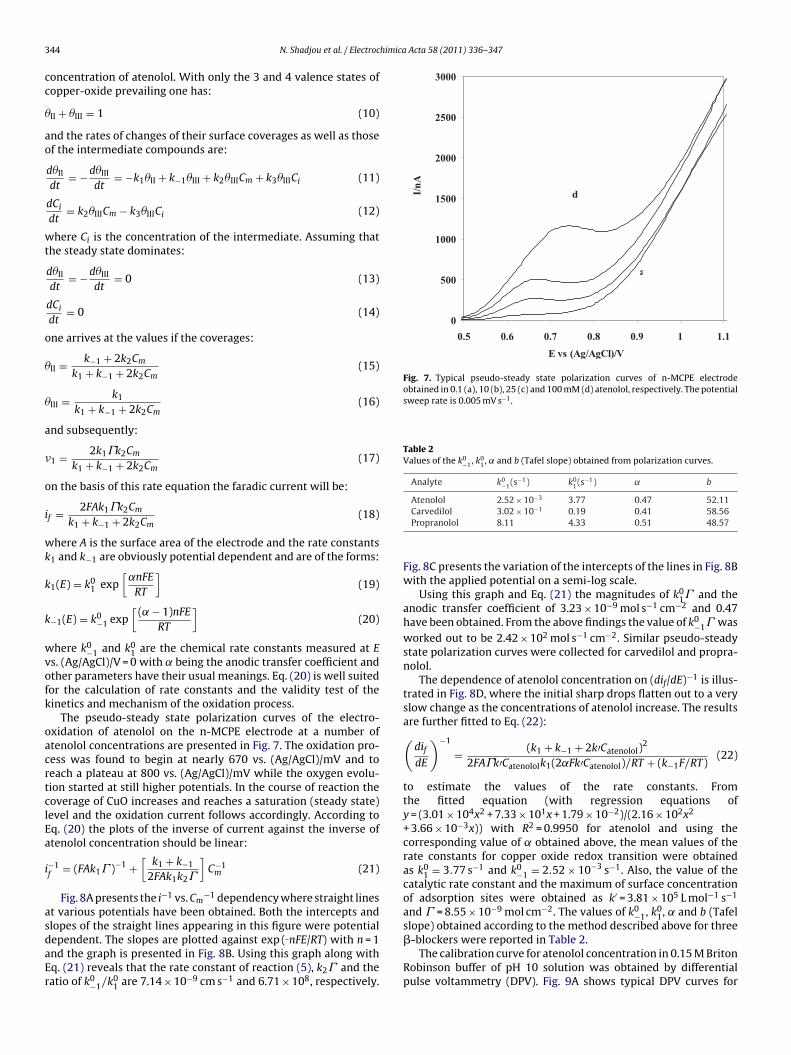
Fig. 2. XRD pattern Cu
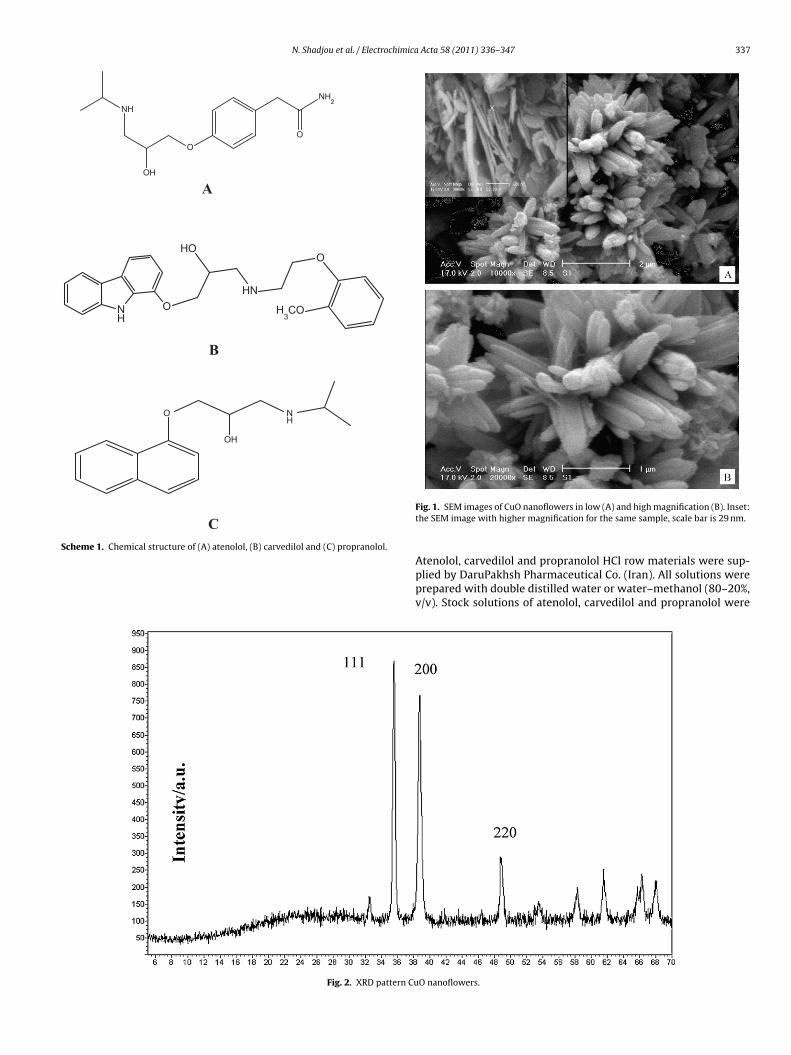
Fig. 1. SEM images of CuO nanoflowers in low (A) and high magnification (B). Inset:the SEM image with higher magnification for the same sample, scale bar is 29 nm.
Atenolol, carvedilol and propranolol HCl row materials were sup-
plied by DaruPakhsh Pharmaceutical Co. (Iran). All solutions wereprepared with double distilled water or water–methanol (80–20%,v/v). Stock solutions of atenolol, carvedilol and propranolol wereO nanoflowers.

338 N. Shadjou et al. / Electrochimica Acta 58 (2011) 336– 347
Fig. 3. Cyclic voltammograms recorded in the absence (a) and presence of 0.1 mM atenolol (b) in 0.15 M Briton Robinson buffer of pH 10 solution using UCPE (A) and n-MCPE( mogr
pwpm
ofwbb8tpdao
2
o
B). The potential sweep rate was 100 mV s−1. The insets show the derivative voltam
repared in methanol and kept in the refrigerator. �-Blockersorking solutions under voltammetric investigations were pre-ared by dilution of the stock solution and contained (20%)ethanol.Fresh human serum samples were obtained from Razi Institute
f Vaccine and Serum Company (Marand, Iran). Before being usedor spiking with atenolol, carvedilol and propranolol this serumas filtered, and diluted 10 times with a 0.15 M Briton Robinson
uffer solution of pH 10. Briton Robinson buffers were preparedy initially dissolving 10.1 mL concentrated orthophosphoric acid,.7 mL glacial acetic acid and 9.27 g boric acid in water and dilutingo 1.0 L in a volumetric flask. This solution was subsequently used torepare appropriate buffers by addition of 7.5 M NaOH to reach theesired pH value. Voltammetric experiments on atenolol, carvedilolnd propranolol were carried out in 0.15 M Briton Robinson bufferf pH 10.
.2. Synthesis of copper-oxide nanoparticle
In a typical experiment, 3 mmol of CuCl2·3H2O and 6 mmolf 1,10-phenanthroline was dissolved into the mixed distilled
ams (C) Variation of peak currents with the square root of the potential sweep rate.
water and ethanol then 2 mol L−1 NaOH aqueous solution wasadded under magnetic stirring. This alkaline solution was trans-ferred into a Teflon-lined autoclave with about (80%) capacity.The autoclave was then sealed and maintained at 160 ◦C for24 h. After cooling to room temperature, the black precipi-tates were filtered, washed with distilled water and absoluteethanol for several times. Finally, the resulting product was driedat 50 ◦C.
2.3. Characterization of copper-oxide nanoparticle
The general morphologies of synthesized CuO nanoflowers wereobserved by SEM and shown in Fig. 1. A large number of CuOnanoflowers agglomerates with a uniform size of about 1–2 �mare shown in Fig. 1A. An individual flower-like nanostructurewith a diameter approaching 1 �m is shown in Fig. 1B, whichdemonstrates that the CuO nanostructures with flower-like shapes
are composed of many interconnected sheet-like crystallites withthicknesses in the range of 30 nm.X-ray diffraction (XRD) pattern of copper oxide films is shownin Fig. 2. The XRD peaks are matching well with those previously

N. Shadjou et al. / Electrochimica Acta 58 (2011) 336– 347 339
n of �
rtfi
D
wmCC
2n
hTmpc0ehrdeeta(tmoTw
cpm
Scheme 2. Graphic illustratio
eported in the literature [19]. The sharp peaks reveal the materialo be polycrystalline in nature. The grain size of copper oxide thinlms is calculated by using the Scherer’s relation:
= 0.9�
cos �(1)
here is the broadening of diffraction line measured at half maxi-um intensity (radians) and � = 15.4056 nm, the wavelength of the
uO K� X-ray. The grain size was found to be averaged 28 nm foruO nanoflowers.
.4. Preparation of unmodified CPE and copper-oxideanoparticle electrodes
Unmodified carbon paste electrode (UCPE) was prepared byand-mixing carbon powder and mineral oil (80/20%, w/w) ratio.he paste was carefully mixed and homogenized in an agateortar for 20 min. The resulting paste was kept at room tem-
erature in a desiccator. The paste was packed firmly into aavity (3.6 mm diameter, geometric surface area of 0.1017 cm2 and.5 mm depth) at the end of a Teflon tube. Electrical contact wasstablished via a copper wire connected to the paste in the innerole of the tube. The electrode surface was gently smoothed byubbing on a piece of weighing paper just prior to use. This proce-ure was also used to regenerate the surface of the carbon pastelectrodes. The copper oxide nanoparticle-modified carbon pastelectrodes (n-MCPEs) were prepared by mixing carbon powderogether with copper oxide or nanoparticles at different ratios in angate mortar until a uniform paste was obtained. The percentagew/w) of copper oxide informed throughout the text correspondso the final percentage relative to the total paste composition. Then
ineral oil was added (20%, w/w) and mixed thoroughly. The pastebtained was packed into a 3 mm diameter cavity at the end of aeflon tube, and the electrical contact was provided with a copperire.
The effect of the modifier percentage on the intensity of atenolol,arvedilol and propranolol oxidation peak current on the carbonaste electrode was examined. The highest peak current for theodified carbon paste electrode was obtained when the content of
-blocker–n-MCPE interaction.
the modifier was 15% in the paste. Of course, in concentrations morethan 15%, a slight decrease in the current was observed which couldbe attributed to reduction of the electrode surface conductivity.With all these results taken into account, carbon paste having 15%CuO nanoparticles, 55% graphite and 30% mineral oil was used forlater studies.
2.5. Apparatus
Electrochemical measurements were carried out using aconventional three-electrode cell powered by a �-Autolab poten-tiostat/galvanostat, type III (The Netherlands). An Ag/AgCl/3 M KCl,platinum disk (both from Azar electrode Co., Iran), and a car-bon paste electrode (CPE) were used as the reference, counter,and working electrodes, respectively. The system was run by a PCusing GPES 4.9 software. The surface morphology of the modifiedelectrodes was evaluated with a Vega-Tescan electron microscope(SEM). X-ray powder diffraction (XRD) measurements were per-formed using a Philips diffractometer manufactured by X’pert withmonochromatized Cu K� radiation.
3. Results and discussion
Fig. 3 shows cyclic voltammograms of 0.15 M Briton Robin-son buffer (pH 10) solution recorded using unmodified electrode(UCPE) (A) and CuO nanoparticles modified electrode (n-MCPE)(B) in the absence (curves a) and presence (curves b) of 0.5 mMatenolol in the potential range of 0.2–1.2 vs. (Ag/AgCl)/V. Atenololrepresents very weak oxidation signal on UCPE. This indicatesthe electroinactivity of atenolol on the carbon surface. However,atenolol was oxidized on n-MCPE surface via a single anodic peaklocated at around 0.73 vs. (Ag/AgCl)/V. This was followed by adecrease in the cathodic peak current in the reverse sweep. In addi-tion, the anodic current densities related to the electrooxidationof the drug on the n-MCPE surface. The electrochemical behavior
of copper in alkaline solutions has been extensively investigated[20–23]. In the entire range of potential window of aqueous elec-trolytes, different copper species are created, and the Cu(II)/Cu(III)redox transition performs at the anodic edge of the voltammograms
340 N. Shadjou et al. / Electrochimica Acta 58 (2011) 336– 347
Scheme 3. Oxidation mechanism of atenolol (A) atenolol, (B) carvedilol and (C) propranolol.
iebobemlb
n alkaline solutions [19–22]. Regarding the nature of Cu(III)ntity, species ranging from CuOOH to Cu(III) radical haveeen proposed [23,24]. On the other hand, Cu(III) species canxidize organic and biological compounds by chemical reaction(s)etween these materials and Cu(III) species via a redox mediation
lectron transfer process (mediated electrocatalytic reaction, EC′echanism) at the anodic edge of the voltammograms in alka-ine solutions [20,24–27]. Based on this literature review, it cane deduced that atenolol was oxidized on n-MCPE surfaces via the
active Cu(III) species. Copper species are immobilized on the elec-trode surfaces, and the one with a higher valence oxidizes atenololvia chemical reactions. It is followed by generation of lower valencespecies. Therefore, the electrode reactions may proceed via a mech-anism involving a rate-limiting step, in which product species are
formed upon chemical reactions of atenolol with Cu(III) species, andregeneration of the surface occurs through chemical redox reac-tions. The participation of Cu(III) species as the catalyst of theelectrooxidation reaction and the dominated EC′ mechanism is
N. Shadjou et al. / Electrochimica Acta 58 (2011) 336– 347 341
Figure 4. (A) Cyclic voltammograms recorded in the absence (a) and presence of 0.1 mM carvedilol (b) in 0.15 M Briton Robinson buffer of pH 10 solution using n-MCPE. (B)C olol (bt
frrfgiutrcn
C
it
C
C
te(t
yclic voltammograms recorded in the absence (a) and presence of 0.1 mM propranhe variation of peak currents with the square root of the potential sweep rate.
urther supported by the variation of current function (peak cur-ent divided by the square root of the potential sweep rate) withespect to the square root of the potential sweep rate. The dataor these variations which were obtained from cyclic voltammo-rams recorded at different potential sweep rates are representedn Fig. 3C. In this figure, current function is smoothly decreasedpon increasing the potential sweep rate confirming the elec-rocatalytic nature of the electrooxidation process. Based on theepresented explanation and the results, the following mechanisman be proposed for the mediated oxidation of the drugs on the-MCPE surface. The redox transition of the copper species:
uIIk1�
k−1CuIII + e (2)
s followed by the oxidation of atenolol on the n-MCPE surface inwo steps via the following reactions:
uIII + Atenololk2(E)−→intermediate + CuII (3)
uIII + intermediatek3(E)−→product + CuII (4)
On the other hand, generally, metal catalysts have been used
o increase the sensitivity of the films. The first step in every het-rogeneous catalytic reaction is the adsorption of reacting species�-blocker drugs) on the active phase of the catalyst (CuO nanopar-icles). These intra molecular bonds are broken or weakened.) in 0.15 M Briton Robinson buffer of pH 10 solution using n-MCPE. The insets show
Subsequently the adsorbed species react with the surface of films.This generally occurs in consecutive steps until the desired productis reached which desorbs afterwards (Scheme 2).
The oxidation process of the CuO exhibited high electrocat-alytic responses for atenolol, carvedilol and propranolol, therefore,demonstrating its exhibiting capability for selective oxidation of(�-blocker drugs). All mechanisms for the studied �-blocker drugsare presented in Scheme 3.
The proposition of a one-step reaction for the electrocatalyticoxidation of atenolol on the n-MCPE surface (reactions (2) and(3)) is based on the appearance of one anodic peak in the cor-responding voltammogram (Fig. 3B, curve b). Higher catalyticrate of the electrooxidation reaction can be related to nanome-ter dimension of copper oxide nanoparticles. The nanoparticlesare stably distributed on the electrode surface which is a fullyand easily accessible atenolol and, consequently, can be readilyand completely used as electrochemical reaction units. Moreover,nanoparticles are often irregularly shaped objects, and hence, thereare some defect sites, such as steps that separate planar atomicterraces or kinks where a step advances or recedes, exposing cor-ner or edge atoms on a plane. The enhancement of the reactivity
of these defective sites can be so large that their presence deter-mines to a very large extent the catalytic activity of nanoparticles.Similar cyclic voltammograms were recorded for carvedilol andpropranolol (Fig. 4A and B).
342 N. Shadjou et al. / Electrochimica Acta 58 (2011) 336– 347
Fig. 5. (A) Cyclic voltammograms of the n-MCPE electrode in 0.15 M Briton Robinson buffer of pH 10 solution in the presence of 0.1 mM atenolol various potential sweepr nodic
( E ele
asp1tfil1seowpatcpt1ato
ates of 20, 50, 75, 100, 200, 125, 150, 200, 225 and 250 mV s−1. (B) Dependence of aC) Dependence of the peak potential on log � for the oxidation of atenolol at n-MCP
Fig. 5A displays typical cyclic voltammograms for n-MCPEs in buffer solution (pH 10) at different scan rates. Fig. 5A and Bhow that the anodic and cathodic peak currents are directly pro-ortional to the scan rate of the potential at a sweep rate from0 to 100 mV s−1. The plot of peak current vs. the scan rate upo 100 mV s−1 had good linearity as expected for surface con-ned redox processes. The small peak-to-peak separation and good
inearity between the peak currents and scan rates at sweep rates of0–100 mV s−1 suggested facile charge transfer kinetics. At highercan rates, the peak currents vs. scan rate plots deviated from lin-arity and the peak currents became proportional to the square rootf the potential scan rate. The data indicated that the peak currentas diffusion controlled. In addition, with increasing scan rates, theeak separations began to increase, indicating that the limitationrose from charge transfer kinetics. Based on Laviron theory [27],he electron transfer rate constant (Ks) and charge transfer coeffi-ient (˛) could be determined by measuring the variation of peakotential with scan rate. The peak potential values were propor-ional to the logarithm of the scan rate for the rates higher than
00 mV s−1 (Fig. 5C). The calculated values for (Ks) and (˛) werepproximately 7.1 s−1 and 0.49, respectively. The surface concen-ration of electroactive species (� ) can be calculated from the slopef the plot of Ipa vs. scan rate and is about 1.44 × 10⁻⁹ mole cm2.peak current during the forward sweep on the square roots of potential sweep rate.ctrode obtained from the data of panel (A).
In order to evaluate the reaction kinetics, the oxidation of these�-blocker drugs on n-MCPE was investigated by chronoamperom-etry. Chronoamperometry, as well as cyclic voltammetry has beenemployed for the investigation of the processes occurring via an ErCimechanism [28]. Double steps chronoamperograms were recordedby setting the working electrode potentials to desired values andwere used to measure the catalytic rate constant on the modi-fied surface. Fig. 6A shows double steps chronoamperograms forthe modified electrode in the absence (a) and presence (b: 0.01, c:0.03, d: 0.05, e: 0.08, f: 0.1 g: 0.25 and 0.5 mM) of atenolol over aconcentration range of 0.01–0.5 mM. The applied potential stepswere 0.51 and 0.73 vs. (Ag/AgCl)/V, respectively. The plot of netcurrent vs. t−1/2 which has been obtained by removing the back-ground current by the point-by-point subtraction method givesa straight line, Fig. 6B. This indicates that the transient currentmust be controlled by a diffusion process. The transient currentis due to catalytic oxidation of atenolol, which increases as theatenolol concentration is raised. No significant cathodic current wasobserved when the electrolysis potential was stepped to 0.51 vs.
(Ag/AgCl)/V indicating the irreversible nature of the oxidation ofdrugs by using the slopes of these lines; we can obtain the diffu-sion coefficients of the drugs according to the Cottrell equation [28,p. 163]:
N. Shadjou et al. / Electrochimica Acta 58 (2011) 336– 347 343
Fig. 6. (A) Double step chronoamperograms of the n-MCPE electrode in the absence (a) and the presence of (b: 0.01, c: 0.03, d: 0.05, e: 0.08, f: 0.1, g: 0.25 and 0.5 mM)atenolol in 0.15 M Briton Robinson buffer of pH 10 solution. Potential steps were 0.51 and 0.73 vs. (Ag/AgCl)/V, respectively. (B) Dependency of transient current on t−1/2. (C)D nd (g) in main panel.
I
wTt
id5
wlttF
ci
Table 1Values of the electrocatalytic reaction rate constants (k) and the diffusion coeffi-cients (D) obtained from chronoamperometry curves.
Analyte D (cm2 s−1) k (cm3 mol−1 s−1)
Atenolol 1.06 ± 0.02 × (10−6) 4.13 ± 0.03 × (105)−5 6
ependence of Icatal/Id on t1/2 derived from the data of chronoamperograms of (a) a
= nFAD1/2C∗�−1/2t−1/2 (5)
here D is the diffusion coefficient, and C* is the bulk concentration.he mean value of the diffusion coefficients of atenolol was foundo be (1.06 ± 0.02) × 10−6 cm2 s−1.
The rate constants of the reactions of atenolol and the ensuingntermediates with the redox sites of the n-MCPE electrode can beerived from the chronoamperograms according to Eq. (6) [28, p.03]:
Icatal
Id= �1/2
[�1/2 erf (�1/2) + exp(−�)
�1/2
](6)
here Icatal is the catalytic current in the presence of atenolol, Id theimiting current in the absence of atenolol and � = kCmt (k, Cm and
are the catalytic rate constant, bulk concentration of atenolol andhe elapsed time, respectively) is the argument of the error function.or � > 1.5, erf (�1/2) almost equals unity and Eq. (6) reduces to:
Icatal = �1/2�1/2 = �1/2(kCmt)1/2 (7)
IdFrom the slope of the Icatal/Id plot the value of k at a given con-entration of atenolol can be derived (Fig. 6C). The mean value of kn the concentration range of 0.01–0.5 mM atenolol was found to be
Carvedilol 3.13 ± 0.02 × (10 ) 4.20 ± 0.02 × (10 )Propranolol 9.10 ± 0.02 × (10−5) 1.26 ± 0.02 × (105)
(4.13 ± 0.03) × 105 cm3 mol−1 s−1. It should be pointed out that k iseither k2 or k3 whichever is smaller. Similar chronoamperogramswere collected for carvedilol and propranolol. The values of D and kobtained according to the method described above for these drugswere reported in Table 1.
The rate laws for the reactions (3) and (4) have the forms of:
�1 = k1��II − k−1��III (8)
�2 = k2��IIICm (9)
where � is the total number of adsorption sites per unit area ofthe electrode surface, � represents the fractional surface cover-ages of different copper-oxide valence states and Cm is the bulk
3 himica Acta 58 (2011) 336– 347
cc
�
ao
wt
o
�
�
a
�
o
i
wk
k
k
wvofk
oacrtclEa
i
asdaEr
0
500
1000
1500
2000
2500
3000
0.5 0.6 0. 7 0.8 0.9 1 1.1E v s (Ag/AgCl)/V
I/nA
a
d
Fig. 7. Typical pseudo-steady state polarization curves of n-MCPE electrodeobtained in 0.1 (a), 10 (b), 25 (c) and 100 mM (d) atenolol, respectively. The potentialsweep rate is 0.005 mV s−1.
Table 2Values of the k0
−1, k01, and b (Tafel slope) obtained from polarization curves.
Analyte k0−1(s−1) k0
1(s−1) b
Atenolol 2.52 × 10⁻³ 3.77 0.47 52.11
44 N. Shadjou et al. / Electroc
oncentration of atenolol. With only the 3 and 4 valence states ofopper-oxide prevailing one has:
II + �III = 1 (10)
nd the rates of changes of their surface coverages as well as thosef the intermediate compounds are:
d�II
dt= −d�III
dt= −k1�II + k−1�III + k2�IIICm + k3�IIICi (11)
dCi
dt= k2�IIICm − k3�IIICi (12)
here Ci is the concentration of the intermediate. Assuming thathe steady state dominates:
d�II
dt= −d�III
dt= 0 (13)
dCi
dt= 0 (14)
ne arrives at the values if the coverages:
II = k−1 + 2k2Cm
k1 + k−1 + 2k2Cm(15)
III = k1
k1 + k−1 + 2k2Cm(16)
nd subsequently:
1 = 2k1�k2Cm
k1 + k−1 + 2k2Cm(17)
n the basis of this rate equation the faradic current will be:
f = 2FAk1�k2Cm
k1 + k−1 + 2k2Cm(18)
here A is the surface area of the electrode and the rate constants1 and k−1 are obviously potential dependent and are of the forms:
1(E) = k01 exp
[˛nFE
RT
](19)
−1(E) = k0−1 exp
[( − 1)nFE
RT
](20)
here k0−1 and k0
1 are the chemical rate constants measured at Es. (Ag/AgCl)/V = 0 with being the anodic transfer coefficient andther parameters have their usual meanings. Eq. (20) is well suitedor the calculation of rate constants and the validity test of theinetics and mechanism of the oxidation process.
The pseudo-steady state polarization curves of the electro-xidation of atenolol on the n-MCPE electrode at a number oftenolol concentrations are presented in Fig. 7. The oxidation pro-ess was found to begin at nearly 670 vs. (Ag/AgCl)/mV and toeach a plateau at 800 vs. (Ag/AgCl)/mV while the oxygen evolu-ion started at still higher potentials. In the course of reaction theoverage of CuO increases and reaches a saturation (steady state)evel and the oxidation current follows accordingly. According toq. (20) the plots of the inverse of current against the inverse oftenolol concentration should be linear:
−1f
= (FAk1� )−1 +[
k1 + k−1
2FAk1k2�
]C−1
m (21)
Fig. 8A presents the i−1 vs. Cm−1 dependency where straight lines
t various potentials have been obtained. Both the intercepts andlopes of the straight lines appearing in this figure were potential
ependent. The slopes are plotted against exp ( nFE/RT) with n = 1nd the graph is presented in Fig. 8B. Using this graph along withq. (21) reveals that the rate constant of reaction (5), k2� and theatio of k0−1/k01 are 7.14 × 10⁻⁹ cm s−1 and 6.71 × 10⁸, respectively.
Carvedilol 3.02 × 10⁻¹ 0.19 0.41 58.56Propranolol 8.11 4.33 0.51 48.57
Fig. 8C presents the variation of the intercepts of the lines in Fig. 8Bwith the applied potential on a semi-log scale.
Using this graph and Eq. (21) the magnitudes of k01� and the
anodic transfer coefficient of 3.23 × 10⁻⁹ mol s−1 cm−2 and 0.47have been obtained. From the above findings the value of k0
−1� wasworked out to be 2.42 × 10² mol s−1 cm−2. Similar pseudo-steadystate polarization curves were collected for carvedilol and propra-nolol.
The dependence of atenolol concentration on (dif/dE)−1 is illus-trated in Fig. 8D, where the initial sharp drops flatten out to a veryslow change as the concentrations of atenolol increase. The resultsare further fitted to Eq. (22):(
difdE
)−1
= (k1 + k−1 + 2k′Catenolol)2
2FA�k′Catenololk1(2˛Fk′Catenolol)/RT + (k−1F/RT)(22)
to estimate the values of the rate constants. Fromthe fitted equation (with regression equations ofy = (3.01 × 104x2 + 7.33 × 101x + 1.79 × 10⁻²)/(2.16 × 102x2
+ 3.66 × 10⁻³x)) with R2 = 0.9950 for atenolol and using thecorresponding value of obtained above, the mean values of therate constants for copper oxide redox transition were obtainedas k0
1 = 3.77 s−1 and k0−1 = 2.52 × 10⁻³ s−1. Also, the value of the
catalytic rate constant and the maximum of surface concentrationof adsorption sites were obtained as k′ = 3.81 × 10⁵ L mol−1 s−1
and � = 8.55 × 10⁻⁹ mol cm−2. The values of k0−1, k0
1, and b (Tafelslope) obtained according to the method described above for three
�-blockers were reported in Table 2.The calibration curve for atenolol concentration in 0.15 M BritonRobinson buffer of pH 10 solution was obtained by differentialpulse voltammetry (DPV). Fig. 9A shows typical DPV curves for

N. Shadjou et al. / Electrochimica Acta 58 (2011) 336– 347 345
F −1 −1 ntialst es in (
ddrtdcdc7cwccRcgar�
i
ig. 8. (A) Plot of i (from polarization curves in Fig. 6) against C at various potehe slopes (of curves in (A)) vs. Exp (-nFE/RT). (C) Plot of the Ln (intercepts) (of curv
ifferent concentrations of atenolol in buffer solution. The depen-ency between peak current and atenolol concentration wasectilinear within the range of 1–200 �M (with a regression equa-ion of y = 47.46x + 74.71, R2 = 0.9993, n = 5), Fig. 9B. The limits ofetection (LOD) and quantification (LOQ) of the procedure werealculated according to the 3 S.D./m criteria, where S.D. is the stan-ard deviation of the blank and m is the slope of the calibrationurves [29]. The LOD and LOQ were found to be 1.12 �M and.11 �M. Precision and accuracy were assessed by performing repli-ate analyses of atenolol samples. The precision of the methodas calculated as the relative standard deviation (RSD). The pro-
edure was repeated on the same day on the same solutions atoncentrations in the range of the standard series. The intra-assaySDs of the proposed method determined on the basis of peakurrent for 10 replicates, was (2.33%) for peaks a1, and showedood repeatability. Similar DPV curves were collected for carvedilolnd propranolol. The values of LOD (�M), LOQ (�M) and linear
ange (�M) obtained according to the method described for three-blockers were reported in Table 3.The influences of common interfering species were investigatedn the presence of 15 �M atenolol, carvedilol and propranolol. The
: 574, 595, 607, 616, 638, 654 and 660 vs. (Ag/AgCl)/mV as curves (a–f). (B) Plot ofA)) vs. applied potential. (D) Atenolol concentration dependencies of (dif/dE)−1.
results showed that concentrations of Na+ (100), Mg2+ (240), Ca2+
(200), tryptophan (15), phenyl alanine (60), l-dopa (10), cysteine(40), d-glucose (160), glutamic acid (160), acetic acid (80), tartaricacid (400), glycine (200), citric acid (40), ascorbic acid (20) and uricacid (15) did not significantly influence the height of the peak cur-rents. The tolerance limit was defined as the concentrations, whichgive an error of ≤10% in the determination of atenolol, carvediloland propranolol. The data in the brackets are concentrations of theinterfering species in �M.
The high sensitivity of the method allows the determination ofatenolol, carvedilol and propranolol in spiked human serum sam-ples. The recovery of the analytes was measured by spiked drugsinto highly diluted serum samples. The differential pulse voltam-mograms were recorded after the serum was spiked with variousamounts of the �-blockers within the working concentration rang.Recoveries were found to lie in range of 96–103%. The results arelisted in Table 4.
Electrochemical behavior of the modified electrode againstabsorption of human serum proteins in an aqueous solution isrelated to the following: chemical and mechanical stability of theCuO film, the strong interaction of aromatic groups of atenolol,

346 N. Shadjou et al. / Electrochimica Acta 58 (2011) 336– 347
y = 47.46 3x + 74. 715R2 = 0.9 993
0
200 0
400 0
600 0
800 0
1000 0
1200 0
0 50 100 15 0 20 0 25 0
Concentration/µM
I/nA
B
0
200
400
600
800
1000
1200
1400
1600
1800
2000
0.6 0.7 0. 8 0.9
E vs (Ag/AgCl )/V
I/nA
A
F l 0.15 M Briton Robinson buffer of pH 10 solution. Atenolol concentrations from inner too related calibration graph for concentration 1–200 �M.
ctfined4htt
TRp
Table 4Recoveries of atenolol, carvedilol and propranolol from spiked serum samples withn-MCPE.
Analyte Added (�M) Founda (�M) Recovery (%)
Atenolol 0 Not detected –20 19.5 97.540 31.5 98.2
ig. 9. (A) Differential pulse voltammograms obtained for determination of atenolouter are: 0.001, 0.003, 0.005, 0.01, 0.05, 0.1, 0.2, 0.3, 0.5, 0.7, 0.9 and 1 mM. (B) The
arvedilol and propranolol with CuO nanoflowers. Upon examina-ion of the reproducibility of the electrode preparation procedure,ve independent carbon paste electrodes were modified with CuOanoflowers (Fig. 10). Cyclic voltammograms of prepared modifiedlectrodes in the buffer solution were recorded. The relative stan-ard deviation values of the measured cathodic peak currents were%. Due to the chemical stability, electrochemical reversibility, and
igh electron transfer rate constant of CuO nanoflowers used inhis study, they can be widely used in electrocatalysis as electronransfer mediators.able 3esults obtained from �-blocker drugs analysis in 0.15 M Briton Robinson buffer ofH 10 solution.
Analyte Linear range (�M) LOD (�M) LOQ (�M) RSD (%)
Atenolol 12–96 1.12 7.11 2.33Carvedilol 5–37 3.01 9.43 3.61Propranolol 10–104 2.91 8.33 1.06
60 61.0 101.5
Carvedilol 0 Not detected –10 10.3 10330 29.0 96.750 51.0 102
Propranolol 0 Not detected –2 2.77 964 4.94 102.7
10 16.3 102
aAverage of five determinations at optimum conditions.

N. Shadjou et al. / Electrochimica
-50 .00
50.00
150.00
250.00
350.00
450.00
550.00
650.00I/n
A
a
d
0-1.5 v s (Ag/AgCl)/V
Fig. 10. (a) 1st, (b) 10th, (c) 20th and (d) 60th cyclic voltammograms of CuOn1
4
ieamtrcpTmc
[[
[[[
[[[[
[[[[[
[[
[
anoparticles in 0.15 M Briton Robinson buffer of pH 10 solution. Scan rate was00 mV s−1.
. Conclusion
Copper oxide nanoparticles have been employed to mod-fication of carbon paste electrode and used as an efficientlectrocatalytic transducer for the electrocatalytic oxidation oftenolol, carvedilol and propranolol in Briton Robinson buffer. Theodified electrodes showed excellent electrocatalytic potential for
he oxidation of various atenolol, carvedilol and propranolol at aemarkably positive potential in alkaline solutions. The micromolaroncentrations of these analytes were determined by a differential
ulse voltammetry method at the surface of the modified electrode.he prepared modified electrode can be used as a chronoampero-etric detector for �-blockers determination in flow systems or inhromatographic instruments.
[[
[
Acta 58 (2011) 336– 347 347
Acknowledgements
We gratefully acknowledge the partial support of this work byPayame Noor University. Thanks to Dr. A. James McQuillan fromOtago University in New Zealand for his valuable comments.
References
[1] L.A. Colon, R. Dadoo, R.N. Zare, Anal. Chem. 65 (1993) 476.[2] S. Mannino, M. Rossi, S. Ratti, Electroanalysis 3 (1991) 711.[3] T.R.L.C. Paixao, D. Corbo, M. Bertotti, Anal. Chim. Acta 472 (2002) 123.[4] M.Z. Luo, R.P. Baldwin, J. Electroanal. Chem. 387 (1995) 87.[5] K. Kano, M. Torimura, Y. Esaka, M. Goto, J. Electroanal. Chem. 372 (1994) 137.[6] Y. Xie, C.O. Huber, Anal. Chem. 63 (1991) 1714.[7] M. Fleischmann, K. Korinek, D. Pletcher, J. Chem. Soc. Perkin Trans. 2 (1972)
1396.[8] Q. Yi, J. Zhang, W. Huang, X. Liu, Catal. Commun. 8 (2007) 1017.[9] X. Huang, J.J. Pot, W.Th. Kok, Anal. Chim. Acta 300 (1995) 5.10] M.I.R.M. Santoro, H.S. Cho, E.R.M. Kedor-Hachman, Anal. Lett. 29 (1996) 775.11] C.V.N. Prassad, C. Pariher, K. Sunil, P. Parimoo, J. Pharm. Biomed. Anal. 17 (1998)
877.12] H. Siren, M. Saarinen, S. Hainari, M.L. Riekkola, J. Chromatogr. A 632 (1993) 215.13] L. Clohs, K.M. McErlane, J. Pharm. Biomed. Anal. 31 (2003) 407.14] O. Galanopoula, S. Rozou, E. Antoniadou-Vyza, J. Pharm. Biomed. Anal. 48 (2008)
70.15] E. Yang, S. Wang, J. Kratz, M.J. Cyronok, J. Pharm. Biomed. Anal. 36 (2004) 609.16] S.M. Al-Ghanan, J. Pharm. Biomed. Anal. 40 (2006) 151.17] R.N. Goyal, V.K. Gupta, M. Oyama, Electrochem. Commun. 8 (2006) 65.18] M. Behpour, E. Honarmand, S.M. Ghoreishi, Bull. Korean Chem. Soc. 31 (2010)
845.19] A. Gu, G. Wang, X. Zhang, B. Fang, Bull. Mater. Sci. 33 (2010) 17.20] J.M. Marioli, T. Kuwana, Electrochim. Acta 37 (1992) 1187.21] L.D. Burke, M.J.G. Ahern, T.G. Ryan, J. Electrochem. Soc. 137 (1990) 553.22] A.M. Shams El Din, F.M. Abd El Wahab, Electrochim. Acta 9 (1964) 113.23] G.M. Brisard, J.D. Rudnicki, F. McLarnon, E.J. Cairns, Electrochim. Acta 40 (1995)
859.24] D. Meyerstein, F.M. Hawkridge, T. Kuwana, J. Electroanal. Chem. 40 (1972) 377.25] M. Fleischmann, K. Korinek, D. Pletcher, J. Chem. Soc. Perkin Trans. 10 (1972)
1396.26] N.A. Hampson, J.B. Lee, K.I. Macdonald, J. Electroanal. Chem. 34 (1972) 91.
27] E. Laviron, J. Electroanal. Chem. 101 (1979) 19.28] A.J. Bard, L.R. Faulkner, Electrochemical Methods, Wiley, New York, 2001, chap-ter 12.29] J.C. Miller, J.N. Miller, Statistics for Analytical Chemistry, 4th ed., Ellis Howood,
New York, 1994, p. 115.