Photoinduced Disaggregation of TiO2 Nanoparticles Enables Transdermal Penetration

Chourasiya et al Journal of Drug Delivery & Therapeutics; 2014, 4(2), 173-181 173
© 2011, JDDT. All Rights Reserved ISSN: 2250-1177 CODEN (USA): JDDTA
Available online at http://jddtonline.info
RESEARCH ARTICLE
FABRICATION, DEVELOPMENT AND CHARACTERIZATION OF CARVEDILOL
TRANSDERMAL PATCHES: AN EMPIRICAL STUDY
Sanjay K. Chourasiya*1
, Minakshi Verma3, T. Maity
2, Ashish K. Gupta
4, Renu Singh
2, Vani Sharma
2
A. Mittal2, A K Gupta
2, B C Nandy
2
1 Shri Ramnath Singh Mahavidyalaya (Pharmacy) Gormi, Bhind, MP, India
2 Jayoti Vidyapeeth Women’s University, Jaipur, Rajasthan, India
3Department of Pharmacy, G.S.V.M., Medical College Kanpur, Uttar Pradesh, India.
4Department of Pharmacy , V.B.S., Purvanchal University, Jaunpur, Uttar Pradesh, India.
*Corresponding author: Shri Ramnath Singh, Mahavidyalaya (Pharmacy) Gormi, Bhind, MP, India
Tel: +919993273571; E-mail: [email protected]; Fax: +91 752786291
INTRODUCTION
The budding interest and challenges in the delivery of
active ingredients through skin has generated number of
advancement throughout recent years with a focus on
emerging novel application that offers many advantage
such as reduced side effects, less frequent administration
to produce the desired constant plasma concentration
associated with patient compliance, elimination of the
first pass effect, sustained drug delivery and interruption
of treatment when necessary 1-3.
Carvedilol is widely used for the therapeutic
management of hypertension and congestive heart failure. It is drug of choice for hypertension but it has
several drawbacks such as short biological half life (2-8
hours), readily metabolized in liver primarily by
cytochrome P450 isoenzyme (CYP 206 and CYP 209)
and has an oral bioavailability of 25-30 %. These factors
in addition to its low molecular weight (406.05), low
melting point (117°C), high lipid solubility and effective
in low plasma concentration necessitates the formulation
of sustained release transdermal drug delivery system for
carvedilol 2-4.
Polymers such as Ethyl cellulose, PVP K-30, HPMC
K15M and Carbopol 934 were selected on the basis of their adhering property and non toxicity to prepare
Carvedilol transdermal patches. Transdermal drug
delivery system is a most suitable system for a long-term
treatment. Transdermal patches are prepared for a long
period of time in a suitable dose to provide the treatment
from a day to even up to seven days. In this study
Carvedilol transdermal patches were prepared with
combination of different polymers such as EC: PVP K-
30, EC: HPMC K-15M, EC: Carbopol-934. Formulations
were further evaluated on the basis of their
physicochemical properties, in-vitro drug permeation
study and surface pH of the film. Physicochemical
evaluation like thickness, weight variation, moisture
content, drug content, folding endurance and flatness of
the prepared transdermal patches were checked. A best
patch among all the formulations was chosen on the basis of some evaluating parameters like maximum
permeation, steady state flux and permeability
coefficient. The main objective of this current study was
to develop a potentially competitive product by
optimizing and screening of various formulations
variables to deliver the drug at a controlled rate across
the skin.
MATERIAL & METHODS
Carvedilol, HPMC K4 M, PVP K30, Carbopol-934 were
obtained as gift sample from Zydus Cadila, Ahmedabad,
India. Ethyl cellulose, PEG 200, PVP and n-Octanol
were procured from Cental Drug House (P) Ltd., Mumbai, India. Methanol, potassium dihydrogen
phosphate, sodium chloride, chloroform were procured
from Ranbaxy fine chemicals, Delhi, India.
Determination of Partition Coefficient
ABSTRACT
Carvedilol is a nonselective beta-adrenergic blocking agent and is employed for the treatment of hypertension. Carvedilol is subjected to considerable first-pass metabolism when it is administered orally. Transdermal preparation of carvedilol was prepared to achieve a sustained effect and to reduce the dose size & dosing frequency as compared to multiple oral dosing and also developed to minimize first pass metabolism. Various polymers such as Ethyl cellulose, PVP K-30, HPMC K15M and Carbopol 934 were selected on the basis of their adhering property and nature of non toxicity, to develop transdermal film of carvedilol. The patches fabricated by EC and Carbopol (F-5 and F-6) were showed very good folding endurance compared to patches containing PVP K-30 and HPMC K15M. Based on physicochemical and in-vitro permeation studies, F-
3 and F-5 were chosen as the best formulations. Among these two patches, F-5 film was found to have maximum in vitro permeation, maximum steady state flux and maximum permeability coefficient of drug. Key words: Transdermal patch, Carvedilol, ethylcellulose, PVP K-30, HPMC K15M and Carbopol 934

Chourasiya et al Journal of Drug Delivery & Therapeutics; 2014, 4(2), 173-181 174
© 2011, JDDT. All Rights Reserved ISSN: 2250-1177 CODEN (USA): JDDTA
The partition coefficient study of pure drug was
performed using 50 ml n-octanol as the oil phase and 50
ml phosphate buffers (PH 6.8) as the aqueous phase 5.
The two phases were mixed in a separating funnel and
were shaken continuously for 2 hrs by adding 50 mg of
drug to achieve a complete partitioning of drug. The two phases were separated by centrifugation at 1500 rpm for
5 min and the amounts of drug in both the phases were
then analyzed spectrophotometrically at 242 nm.
Preparation of Transdermal Film
Drug free films were prepared by using the solvent
evaporation method 2, 7, 8. In our earlier published paper 2
the preparation of carvidilol transdermel films were
optimized. The lower part of the Petri dish was wrapped
with aluminum foil on which the backing membrane was
casted by pouring 5ml of 4 % (w/v) polyvinyl alcohol
(PVA) solution followed by drying at 60°C for 6 hr in
hot air oven. After drying the backing membrane,
different polymers were mixed in chloroform containing
PEG-200 (30 % (w/w) of total polymer composition) and
5ml of the polymer solution was poured in the Petridis
and an inverted funnel was placed on the Petri dish to facilitate the evaporation of solvent at controlled manner.
It was kept in an oven over a drying period of 6hr at
40°C.The film was retrieved by cutting with surgical
knife and kept in the desiccators for further evaluation.
Drug loaded polymeric film was prepared in similar
manner except that 16 mg (2.5 % w/w of total amount of
polymers) of carvedilol dissolved in 5ml chloroform and
it was added in the polymer solution containing
plasticizer. Different formulations were prepared by
using each polymer ratio of 6:4 and 8:2 of EC: PVP K-
30; EC: HPMC K15 and EC: Carbopol-934.
Table 1: Composition of Different Optimized drug loaded polymeric patches
Evaluations of transdermal patches
Thickness:
The thickness 9 of the each patch was measured using
screw gauge at different positions of the patch and the
average was calculated.
Weight variation:
Weight variation 10 was studied by individually weighing
10 randomly selected patches (46.57 cm2). Such
determination was performed for each formulation.
Folding endurance:
Folding endurance 11, 12 was determined by repeatedly
folding one film at the same place till it broke. The
number of times the film could be folded at the same
place without breaking/ cracking gave the value of
folding endurance.
Moisture content:
The patches were weighed 10-12 individually and kept in a
desiccators containing activated silica at room temperature for 24 h. Then, the final weight was noted
when there was no further change in the weight of the
individual patch. The percentage of moisture content was
calculated as a difference between initial and final
weight with respect to final weight.
Drug content uniformity:
Three longitudinal strips were collected by cutting off
three zones from each film: one from the centre, one
from the left side and one from the right side 11
. Patches of 0.64 cm2 areas from each zone were dissolved in 200
ml of methanol and the volume was made up to 100 ml
with same solvent and placed on electronic shaker for 1h
to dissolve completely patches in methanol. The
solutions were filtered through a 0.45 µm membrane,
diluted suitably and absorbance were noted at 242 nm in
a double beam UV-Visible spectrophotometer (Model-
1700, Shimadzu, Japan) against a blank that was
prepared using a drug-free patch treated similarly after
that drug content was calculated.
Flatness study:
Three longitudinal strips were collected by cutting off three zones from each film: one from the centre, one
from the left side and one from the right side. The length
of each strip was measured and the variation in length
because of non-uniformity in flatness 11, 12 was measured
S.
No.
Ingredients Formulations Code No.
F1 F2 F3 F4 F5 F6
1. Ethyl cellulose (EC)
374.4 mg 499.2 mg 374.4 mg 499.2 mg 374.4 mg 499.2 mg
2. Polyvinyl pyrrolidone K-30 (PVP K-30)
249.6 mg 124.8 mg ― ― ― ―
3. Hydroxypropyl methylcellulose K15M
(HPMCK15M)
― ― 249.6 mg 124.8 mg ― ―
4. Carbopol- 934 ― ― ― ― 249.6 mg 124.8 mg
5. Carvedilol (2.5% w/w of total polymer composition)
16 mg 16 mg 16 mg 16 mg 16 mg 16 mg
6. PVA (4% w/v of total polymer composition)
5 ml 5 ml 5 ml 5 ml 5 ml 5 ml
7. PEG-200 (30% w/v of total polymer composition)
0.2 ml 0.2 ml 0.2 ml 0.2 ml 0.2 ml 0.2 ml
8. Chloroform 15 ml 15 ml 15 ml 15 ml 15 ml 15 ml
Chourasiya et al Journal of Drug Delivery & Therapeutics; 2014, 4(2), 173-181 175
© 2011, JDDT. All Rights Reserved ISSN: 2250-1177 CODEN (USA): JDDTA
by determining percent constriction, with 0%
constriction equivalent to 100% flatness.
% Constriction = [(l1-l2) / l2] × 100
Where, l1= initial length of each strip
l2= final length of each strip
Drug and Polymers compatibility studies
Differential Scanning Calorimetry:
The physicochemical compatibility between Carvedilol
and polymers used in the patches was further studied by
using differential scanning calorimetry (DSC Q10 V9.4
Build 287, TA Instruments, USA). In DSC analysis, the
samples were weighed (2 mg), hermetically sealed in
flat-bottom aluminum pans, and heated over a
temperature range of 50 to 150°C and 50 to 250°C in an
atmosphere of nitrogen (50 mL/min) at a constant
increasing rate of 10°C/min. The Thermograms obtained for Carvedilol, polymers and formulations of Carvedilol
with polymers were compared 13
.
Fourier Transformed Infrared Spectroscopy:
The drug loaded transdermal film was analyzed by FT-
IR 13 to confirm the chemical interaction between the
drug and polymer using the thin film. IR spectrums were
scanned on a model, RX-I FT-IR system, Perkin Elmer,
USA in the range of 450- 4000cm-1.
X-ray diffraction studies:
X-ray diffraction studies were carried on physical
mixture and drug containing transdermal film using the
XRD technique 14-16 with model X’Pert-Pro diffractometer system PANalytical, The Netherlands.
XRD studies were performed on the samples by expose
them to Cu K-α-1 radiation (45kV, 40mA) and scanned
from 2 to 50° 2θ, at a step size of 0.0170 2θ and a step
time of 20.0271 s.
Surface pH of the Film
Transdermal patches were allowed to swell for 2 h at
37˚C on the surface of an agar plate, prepared by
dissolving 2% (w/v) agar in worm isotonic phosphate
buffer of pH 5.5 under stirring and then pouring the
solution into a Petri dish till gelling at room temperature. The surface pH was measured by means of a pH paper
placed on the surface of the swollen patch. The mean of
six reading was recorded.
In-vitro Permeation Studies
In vitro skin permeation studies 16-18 were performed by
using a Franz diffusion cell with a receptor compartment
capacity of 50 ml. The excised rat abdominal skin was
mounted between the donor and receptor compartment of
the diffusion cell. The formulated patches were placed
over the skin and covered with paraffin film. The
receptor compartment of diffusion cell was filled with
phosphate buffer pH 7.4. The whole assembly was fixed on a magnetic stirrer and the solution in the receptor
compartment was constantly and continuously stirred
using magnetic beads at 50 rpm; the temperature was
maintained at 37±0.5°C. The 2 ml aliquots were
withdrawal at different time intervals (0, 30, 60, 90, 120,
150 and 24 h) and analyzed for drug content
spetrophotometrically by UV-Visible spectrophotometer
(Model-1700, Shimadzu, Japan) at 242 nm. The receptor
phase was replenished with an equal volume of
phosphate buffer (37°C) at each sample withdrawal, the
cumulative amount of drug permeated per square centimeter of patches were plotted against time.
Scanning Electron Microscopy (SEM)
Sample, for the SEM 18 was prepared by sprinkling the
film on one side of a double adhesive stub. The stub was
then coated with gold under vacuum (Fine Coat, in
sputter, EC-1100). The transdermal patches were then
observed under the scanning electron microscope (JEOL,
JSM-6360 Scanning Electron Microscope, Japan) at
15Kv. The samples include blank film (without drug),
film before and after carrying out the permeation studies.
Stability Studies
Accelerated stability testing was conducted for 30 days at different temperatures: 4, 45, and 60°C. At specific
intervals of time (Day 5, 10, 15, 20, 25, and 30), patches
were taken out to assay their drug content, appearance,
and texture.
RESULTS AND DISCUSSION
The partition coefficient of pure drug was proved its
lipophilic characteristic and carvidilol is suitable to
design a transdermal drug delivery system. The
thicknesses for various formulations ranged between
0.09±0.012 mm to 0.21±0.020 mm and which are
tabulated in table 2. The deviation in the thickness was within the limits, as it gets confirmed by lower values of
standard deviation. F-3 and F-4 formulations were
prepared by EC and HPMC K15M and it has been seen
with increases of HPMC content thickness was increased
consistently but which was not observed in case of
formulations fabricated by EC: Carbopol 934. It may be
due to the gel forming properties of Carbopol, where as
PVP do not contribute significantly towards thickness
building as compared to HPMC and Carbopol.

Chourasiya et al Journal of Drug Delivery & Therapeutics; 2014, 4(2), 173-181 176
© 2011, JDDT. All Rights Reserved ISSN: 2250-1177 CODEN (USA): JDDTA
Table 2: Physicochemical Characteristics of Transdermal Patches
Formulation
Code No.
Polymers
Used
Ratio
of
Polymer
Thickness
(mm)
Mean ±
S.D.
Weight
(mg)
(46.57
cm2)
Mean ±
S.D.
Folding
Endurance
Moisture
Content
(%)
Drug
Content
(mg)
(0.64cm2)
Mean ±
S.D.
Flatness
( %)
Surface
pH
F-1 EC:PVP K-30
6:4
0.09 ± 0.012
840 ± 0.75
>16 4.21 ± 3.4 0.232 ± 0.021
100 ≈ 6-7
F-2 EC:PVP K-30
8:2
0.10 ± 0.013
839 ± 0.92
>14 3.17 ± 2.1 0.219 ± 0.018
100 ≈ 6-7
F-3 EC:HPMC
K15M
6:4
0.21±
0.014
840.7
±1.62
>10 5.06 ± 2.4 0.212 ±
0.011
100 ≈ 6-7
F-4 EC:HPMC K15M
8:2
0.21± 0.020
840.9 ± 1.52
>8 4.12 ± 2.9 0.210 ± 0.031
100 ≈ 6-7
F-5 EC:CP-934
6:4
0.11 ± 0.016
840.5 ± 2.43
>50 5.68 ± 3.4 0.227 ± 0.043
100 ≈ 5-6
F-6 EC: CP-
934
8:2
0.11 ±
0.014
840.4 ±
1.46
>50 4.79 ± 2.2 0.223 ±
0.025
100 ≈ 5-6
The total weight for various formulations ranged
between 839±0.92 to 840.9±1.52 mg (table 2). The deviation in the weight was within the limits as it gets
confirmed by lower values of standard deviation (table
2). It was observed that the weight of the patches was
increasing gradually with increase of HPMC content.
The weight of the patches increased with increase in
thickness of the respective patches the thickness of the
patches were increased. The total weight of patches in
mg/46.57 cm2 was shown in table 2.
The values of the folding endurance for all the
formulations are tabulated in table 2. The F-1 and F-2
patches fabricated by EC and PVP K-30 showed a folding endurance of more than 16 and 14 respectively.
The F-3 and F-4 patches prepared by EC and HPMC
K15M showed folding endurance more than 10 and 8
respectively. In comparison with patches made by EC:
PVP K-30 and EC: HPMC K15M, the patches (F-5 and
F-6) made of EC and Carbopol showed folding
endurance more than 50. It can be concluded that the
patches made of Carbopol were shown better folding
endurance compared to patches containing PVP K-30
and HPMC K15M.
Moisture content studies indicated that the increase in the
concentration of hydrophilic polymer was directly proportional to the increase in moisture content of the
patches. Moisture content of F-1 and F-2 patches were
found in the range of 3.17±2.1 to 4.21±3.4% (table 2),
which showed least moisture content compared to other
patches. Moisture content of F-3 and F-4 patches were
found in the range of 4.12±2.9 to 5.06±2.4%, which
having higher level of moisture content compared to F-1
and F-2 patches; that may be due to presence of
hydrophilic nature of HPMC K15M polymer. The
moisture content of F-5 and F-6 patches was found in the
range of 4.79±2.2 to 5.68±3.4%; which having greater moisture content in comparison to other patches, due to
presence of more hydrophilic nature of Carbopol 934.
The moisture content of the prepared formulations was
low, which could help the formulations remain stable and
reduce brittleness during long term storage and this could
protect the formulations from microbial contamination
and reduce bulkiness.
For all the formulations, the drug content in area of 0.64
cm2 was determined and it was shown in between the range of 0.210±0.031 to 0.232±0.021mg and which was
tabulated in table 2. The drug content of all the prepared
formulations shown that the process employed to prepare
transdermal patches was capable of giving a uniform
distribution of drug throughout the whole patches and
showed minimum batch variability.
The flatness study showed that all the formulations had
the same strip length before and after their cuts,
indicating 100% flatness (table 2). Thus all patches had a
smooth, flat surface; no constriction and that smooth
surface could be maintained when the patch was applied to the skin.
Surface pH of the Film:
The surface pH of the polymeric patches ranged between
5 to 7 (table 2) which falls within the pH range of skin
i.e. 4.0-6.5. Further, the surface pH data revealed that
upon increase in Carbopol concentration the surface pH
of the formulation decreased gradually. Some researchers 16-18 suggested that excess concentration of Carbopol in
the formulation may cause irritation to the skin due to its
acidic nature. That is why formulation containing
Carbopol, its concentration should be optimized and it
was further confirmed by conducting the skin irritation studies.
In-Vitro Skin Permeation Study:
Release of the drug from transdermal patches is
dependent on the physico-chemical properties of the drug
and physiological & physicochemical properties of the
biological membrane. In vitro skin permeation
experiments are known for their value for studying the
rate and mechanism of percutaneous absorption of drugs.
In this experiment, variable permeation profiles of
Carvedilol from the different experimental transdermal
patches (0.64 cm2) compared with various blends of different polymers like EC, PVP K-30, HPMC K-15M
and Carbopol-934. The percent of drug permeated after
24 h of the experiments was found between the ranges of
69.54% to 95.44% (table 3). The percent of drug
permeated after 24 h was found to be maximum 95.44%

Chourasiya et al Journal of Drug Delivery & Therapeutics; 2014, 4(2), 173-181 177
© 2011, JDDT. All Rights Reserved ISSN: 2250-1177 CODEN (USA): JDDTA
and 90.12% from formulation F-5 and F-3 respectively
(table 3). The process of drug release in most of the
controlled release device is governed by diffusion and
the polymer matrix has a strong influence of the
diffusivity as the motion of small molecules is restricted
by the three-dimensional network of polymer chains. The alteration of the cross linking and the modification of
structural arrangements of polymers by using different
blends of polymers already reported. So, different drug
permeation profiles from various formulations could be
attributable to the varied cross linking networks of
polymeric chains of the different blends of polymeric
transdermal experimental formulations as tortuosity and
diffusion pathway varied, and they thereby have been reported to vary the release of drug and duration of
diffusion.
Table 3: Percentage (w/w) drug permeated through the rat skin from various transdermal Patches (F-1 to F-6)
Table 4: Log percentage (w/w) of drug remaining to permeate through the rat skin from various Transdermal
Patches (F-1 to F-6)
In in-vitro skin permeation experiments also shown as
the concentration of hydrophilic was increased, the
amount of drug permeated was concurrently increased.
This may be a result of the initial rapid dissolution of the hydrophilic polymers when the patch is in contact with
the hydrated skin, which results in accumulation of high
amount of drugs on the skin surface and thus leads to the
saturation of the skin with drug molecules at all time.
The rapid dissolution of the aqueous soluble fraction of
the film also leads to the formation of pores, and hence
higher release rate.
Kinetic Release studies:
To examine the drug permeation kinetics and
mechanism, the data were fitted to models representing
zero-order; first-order, Higuchi and Koresmeyer-Peppas.
Release of the drug from a transdermal drug delivery system mainly involves the factor of diffusion. Diffusion
is related to the transport of the drugs from a dosage
matrix into the in vitro study fluid, depending on the
concentration. As the gradient varies, the drug is released
and the distance for diffusion becomes increasingly
greater. This could be an explanation as to why the drug
diffuses at a slower rate as the distance for diffusion
increases. The kinetic parameters of drug permeation for different formulations were presented in table 5. In this
experiments the in vitro permeation profiles of all
formulations did not fit into zero-order (R2 = 0.8754 to
0.9355) rather they could be best expressed by the first-
order (0.9593 to 0.9977) and Higuchi model (R2 = 0.979
to 0.9919). The permeation of drug from a homogenous-
polymer matrix type delivery system was mostly
depended on diffusion characteristics. The percent of
drug permeated in 24 h was found to be maximum
95.44% and 90.12% from formulations F-5 and F-3
respectively. It has been confirm from the table 5, that
permeation of drug from patches followed both first order (R2 =0.9975 and 0.9977) and Higuchi model (R2 =
0.9909 and 0.9869). The data was further treated as per
the following equation for confirming the Koresmeyer-
Peppas model:
Time
(min)
SQRT
(min)
% Drug Permeated (mg)
(Mean ± S.D.)
F-1 F-2 F-3 F-4 F-5 F-6
0 0 0.000±0.00 0.000±0.00 0.000±0.00 0.000±0.00 0.000±0.00 0.000±0.00
30 5.47 9.191±1.19 8.042±0.64 13.096±0.82 10.821±0.72 14.035±2.34 11.095±0.31
60 7.74 16.197±2.18 14.157±1.22 20.038±0.61 17.075±1.14 20.043±1.98 18.482±0.78
90 9.48 21.067±0.12 19.777±0.65 26.090±0.32 21.856±0.57 27.011±1.06 23.634±0.70
120 10.95 26.217±0.31 26.802±0.26 32.001±0.52 26.901±0.43 33.056±0.54 28.634±0.56
150 12.24 29.189±0.75 30.017±0.82 34.014±0.61 30.955±0.72 35.1±0.87 32.099±0.45
360 18.97 45±0.23 40.877±0.25 50.080±0.85 45.736±0.34 52.00±0.92 47.296±0.99
1440 37.94 80.916±1.81 69.546±0.57 90.127±0.87 76.835±0.84 95.441±1.00 81.957±0.88
Time
(min)
SQRT
(min)
Log (%DRP) (mg)
(Mean ± S.D.)
F-1 F-2 F-3 F-4 F-5 F-6
0 0 0.000±0.00 0.000±0.00 0.000±0.00 0.000±0.00 0.000±0.00 0.000±0.00
30 5.47 1.958±0.07 1.963±0.02 1.939±0.07 1.950±0.08 1.939±0.01 1.948±0.02
60 7.74 1.923±0.06 1.933±0.02 1.902±0.06 1.918±0.07 1.902±0.02 1.911±0.09
90 9.48 1.897±0.06 1.904±0.03 1.868±0.07 1.892±0.09 1.868±0.07 1.884±0.07
120 10.95 1.867±0.02 1.864±0.04 1.832±0.04 1.863±0.08 1.832±0.09 1.853±0.01
150 12.24 1.850±0.02 1.844±0.05 1.819±0.03 1.839±0.02 1.819±0.05 1.831±0.02
360 18.97 1.740±0.04 1.771±0.02 1.698±0.04 1.734±0.06 1.698±0.06 1.721±0.02
1440 37.94 1.280±0.02 1.483±0.01 0.994±0.05 1.364±0.06 0.994±0.01 1.256±0.01
Chourasiya et al Journal of Drug Delivery & Therapeutics; 2014, 4(2), 173-181 178
© 2011, JDDT. All Rights Reserved ISSN: 2250-1177 CODEN (USA): JDDTA
Mt / Mα = K.tn
Where, Mt / Mα, is the fractional release of drug, Mt is the
amount released at time t, Mα is the total amount of drug
contained in the transdermal film, t is the release time, K
is a kinetic constant and n is the diffusional release
exponent indicative of the release mechanism. For Film F-3 (n=0.489) and F-5 (n=0.492) has n value near to 0.5,
it means drug permeation followed Fickian diffusion
mechanism. n=0.5 stands for Fickian diffusion; and all
the other patches were also followed Fickian diffusion
mechanism. When the permeability coefficients (table 6)
of the different formulations were compared, only F-5
formulation showed maximum permeability coefficient
compared to other formulations and the highest level of
drug permeation through the rat skin. Based on
physicochemical and in vitro permeation experiments, F-3 and F-5 chosen for best film, but only F-5 formulation
was found to have maximum rate of permeation (tables 4
& 5), maximum steady state flux and maximum
permeability coefficient (table 6) compared to the
formulation F-3.
Table 5: Kinetics Models of In Vitro Carvedilol Permeation across Rat Skin from Transdermal Patches
Table 6: Steady State flux (Jss) and Permeability Coefficient (Kp) data of various formulations (F-1 to F-6)
Formulation
Code
Steady State Flux (Jss)
(mcg.cm-2
.hr-1
)
Mean ± S.D.
Permeability Coefficient (Kp)
(cm.hr-1
)×10-3
Mean ± S.D. F-1 0.101±0.007 0.431±0.02
F-2 0.101±0.006 0.457±0.004
F-3 0.120±0.002 0.476±0.002
F-4 0.102±0.006 0.472±0.007
F-5 0.210±0.001 0.881±0.003
F-6 0.102±0.004 0.44±0.009
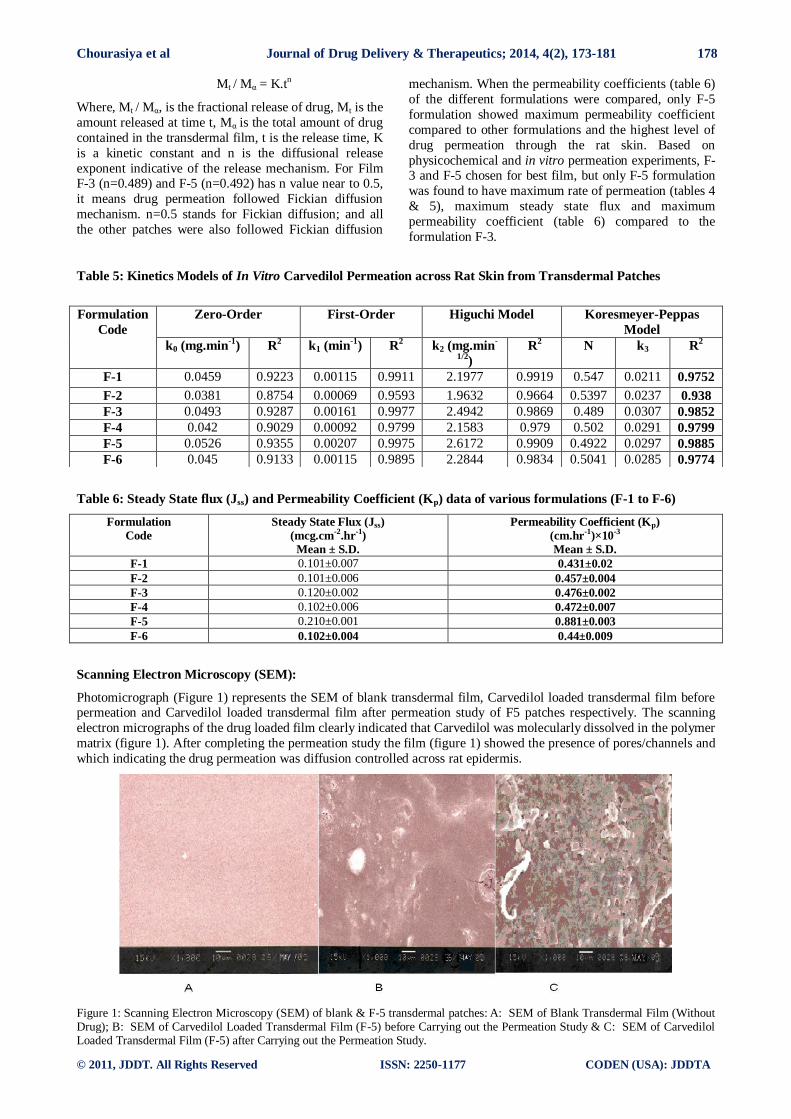
Scanning Electron Microscopy (SEM):
Photomicrograph (Figure 1) represents the SEM of blank transdermal film, Carvedilol loaded transdermal film before permeation and Carvedilol loaded transdermal film after permeation study of F5 patches respectively. The scanning
electron micrographs of the drug loaded film clearly indicated that Carvedilol was molecularly dissolved in the polymer
matrix (figure 1). After completing the permeation study the film (figure 1) showed the presence of pores/channels and
which indicating the drug permeation was diffusion controlled across rat epidermis.
Figure 1: Scanning Electron Microscopy (SEM) of blank & F-5 transdermal patches: A: SEM of Blank Transdermal Film (Without Drug); B: SEM of Carvedilol Loaded Transdermal Film (F-5) before Carrying out the Permeation Study & C: SEM of Carvedilol Loaded Transdermal Film (F-5) after Carrying out the Permeation Study.
Formulation
Code
Zero-Order First-Order Higuchi Model Koresmeyer-Peppas
Model
k0 (mg.min-1
)
R2 k1 (min
-1) R
2 k2 (mg.min
-
1/2)
R2 N k3 R
2
F-1 0.0459 0.9223 0.00115 0.9911 2.1977 0.9919 0.547 0.0211 0.9752
F-2 0.0381 0.8754 0.00069 0.9593 1.9632 0.9664 0.5397 0.0237 0.938
F-3 0.0493 0.9287 0.00161 0.9977 2.4942 0.9869 0.489 0.0307 0.9852
F-4 0.042 0.9029 0.00092 0.9799 2.1583 0.979 0.502 0.0291 0.9799
F-5 0.0526 0.9355 0.00207 0.9975 2.6172 0.9909 0.4922 0.0297 0.9885
F-6 0.045 0.9133 0.00115 0.9895 2.2844 0.9834 0.5041 0.0285 0.9774

Chourasiya et al Journal of Drug Delivery & Therapeutics; 2014, 4(2), 173-181 179
© 2011, JDDT. All Rights Reserved ISSN: 2250-1177 CODEN (USA): JDDTA
Primary Skin Irritancy Study:
The skin irritation test of the formulated patches were
carried out in comparison with standard and irritant;
formalin (0.8%). It was carried out by visual observation
with the help of visual scoring scale. Transdermal
patches F-3 and F-5 were subjected to skin irritation studies. The results showed that F-3 and F-5
formulations produced negligible signs of erythema,
edema or ulceration on the skin of albino rabbits after 7
days. According to some researchers 15-19, compounds
producing scores of 2 or less are considered negative (no
skin irritation). Hence, the developed transdermal
formulations were free of skin irritation. On the other
hand, standard irritant, formalin produced severe
erythema and edema. These results indicate that drug
does not produce any cutaneous reaction and transdermal
patches are well tolerated by the subjects.
Drug-Excipient Interaction Studies:
The possible drug-excipient interaction study was
studied by FTIR spectroscopy and DSC of different
formulations (F-3 and F-5).
Fourier Transform Infrared Spectroscopy:
In the IR spectra of formulations of F-3 and F-5 the
major peaks responsible for functional groups like –OH,
N-H, C-N and C-O-C of Carvedilol slightly altered that
may be due to formation of weak hydrogen bonding with
polymers and other excipients and that was further confirmed by DSC studies.
Differential Scanning Calorimetry:
The DSC analysis (figure 2)of pure Carvedilol showed a
sharp exothermic peak at 120.99°C corresponding to its
melting point of 110°C but in case of final formulations (
F-3 and F-5) it was changed slightly as shown in figure 3
and 4, may be due to weak hydrogen bonding with
polymers and other excipients. Although in vitro
permeation data concluded that it did not seem to
interfere with the drug permeation from the transdermal
patches and drug was also in a stable form within the patches.
Figure 2: DSC Thermogram of physical mixtures of Carvedilol (CDL), EC and HPMC K15 M.
Figure 3: DSC Thermograms of F-3 Formulation composed by CDL, EC and HPMC K15M.

Chourasiya et al Journal of Drug Delivery & Therapeutics; 2014, 4(2), 173-181 180
© 2011, JDDT. All Rights Reserved ISSN: 2250-1177 CODEN (USA): JDDTA
Figure 4: DSC Thermograms of F-5 Formulation Composed of CDL, EC and Carbopol-934.
X-Ray Diffraction study:
X-ray diffraction study was carried out to reveal the
crystalline modifications after the preparation of patches.
Results of x-ray diffractograms for F-3 and F-5
formulations were studied and compared in respect of crystalline modifications with physical mixtures of EC-
HPMC K15M-CDL (PM-1) and EC-CP 934-CDL (PM-
2) respectively. It was shown in figure 5. According to
diffractograms it was concluded that pure CDL which
having crystalline form due to more no of peaks, but in
case of physical mixtures (PM-1 and PM-2) prepared in a
same ratio of polymers and drugs , shown 2θ values
32.8854, 41.8848, 43.4429, 48.9334 and 32.9052, 41.8953, 43.4426, 48.9359 receptively. These prominent
peaks were not observed in transdermal patches of (F-3
and F-5), and it may be suppressed due to change of the
amorphous form.
Figure 5: XRD of pure drug CDL, two Best formulations (F-3, F-5) and Corresponding Physical Mixtures (PM-
1, PM-2), F-3; CDL: EC: HPMC K15 M, F-5; CDL: EC: Carbopol 934, PM-1; CDL: EC: HPMC K15 M, PM-2;
CDL: EC: Carbopol- 934.

Chourasiya et al Journal of Drug Delivery & Therapeutics; 2014, 4(2), 173-181 181
© 2011, JDDT. All Rights Reserved ISSN: 2250-1177 CODEN (USA): JDDTA
Stability Study of the Best Formulation:
An accelerated stability study contains results regarding
remaining drug content and physical appearance of best
formulation i.e. F-5 which concluded that R.D.C. of F-5
formulation was ranged between 0.227±0.022 to
0.219±0.045 and physical appearance was also good at 4°C and 45 °C up to 30 days except in case of 60 °C. At
60°C the physical appearance was good up to 15 days
after that film was found hard, rigid and brittle. From
stability data it was calculated that the shelf life of the F-
5 formulation was 328.50 days at 25°C. It is therefore
preferable to store the patches in the refrigerator.
CONCLUSION
Transdermal drug delivery system is a most suitable
system for a long-term treatment or for a multi dose
treatment, because different transdermal patches are
prepared for a long period of time in a suitable dose proving treatment from a day to even up to seven days.
In this study Carvedilol transdermal patches were
prepared with combination of different polymers such as
EC: PVP K-30, EC: HPMC K-15M, EC: Carbopol-934.
Total six formulations were selected (F-1 to F-6) for
further evaluation such as physicochemical properties,
in-vitro drug permeation study and surface pH of the
film. From Physicochemical evaluation it is found that
thickness, weight variation, moisture content, drug
content, folding endurance and flatness were suitable for
maximum stability of the prepared transdermal patches.
In-vitro drug permeation study, the percent of drug permeated was found to maximum 95.44 and 90.12%
from from F-3 and F-5 film respectively. Based on
physicochemical and in-vitro permeation studies; F-3
and F-5 were chosen as the best patches among all the
formulations. F-5 was found to have maximum rate of
drug permeation, maximum steady state flux and
maximum permeability coefficient. Through the SEM
analysis the F-5 film showed the presence of
pores/channels and it was indicating the diffusion
controlled permeation of drug across the rat epidermis. From the FTIR studies it was concluded that Carvedilol
slightly altered into the formulated patches and that may
be due to formation of weak hydrogen bonding with
polymers and other excipients. It was further confirmed
by DSC studies. But from in vitro permeation data it can
be concluded that it did not seem to interfere with the
drug permeation from the transdermal patches and drug
was also in a stable form within the patches. According
to XRD diffractograms it was concluded that pure CDL
was in crystalline form due to more no of peaks. In case
of physical mixtures (PM-1 and PM-2) prepared in a same ratio of polymers and drugs , showed 2θ values
32.8854, 41.8848, 43.4429, 48.9334 and 32.9052,
41.8953, 43.4426, 48.9359 receptively. The major peaks
were disappeared in transdermal patches of F-3 and F-5
and it may be suppressed due to changes of the
polymorphic amorphous form. According to primary
skin irritancy study, results indicated that drug did not
produce any cutaneous reaction and transdermal patches
are well tolerated by the subjects. The stability study
concluded that the shelf life of the F-5 formulation was
328.50 days at 25°C. It is therefore preferable to store the
film in the refrigerator. In view of the encouraging results obtained, further clinical studies can be carried
out using the best obtained formulation on healthy
human volunteers.
REFERENCES:
1. Cho C.W., Shin, S.C., 2004. Enhanced transdermal delivery
of atenolol from the ethylene- vinyl acetate matrix. Int. J.
Pharm. Sci. 287, 67-71.
2. Nandy B.C., Chourasiya, S.K, Roy S, 2011. Effect of Various
Polymers on Carvedilol Transdermal Films: Invitro
Permeation Studies. Der Pharmacia Sinica, 2 (4): 203-217.
3. Kydonieous A. F., Brener, B. 1987. “Transdermal Delivery of
Drugs”. CRC Press, Baca Raton, p. 3.
4. Monkhouse D.C., Huq, A.S., 1988. Transdermal drug
delivery- problems and promises. Drug. Dev. Ind. Pharm. 14,
183.
5. The Merck Index, 1997. An Encyclopedia of Chemical,
Drugs, and Biologicals. Merck & Co. Inc., New Jersey, p.
1923.
6. Vishnu Y.V., Chandrasekhar, K., Ramesh, G., Rao, Y. M.
Development of mucoadhesive patches for buccal
administration of carvedilol. Curr. Drug Del. 4, 27-39.
7. Goodman & Gilman’s, The Pharmaceutical Basis of
Therapeutics, Hardmen J G. 10 th ed., Mc Graw Hill Medical
Publishing Division, 1996, 708.
8. Jain P.S., Talele, G.S., Talele, S.G., Surana, S.J., 2005.
Spectrophotometric determination of carvedilol from bulk and
formulations. Ind. J. Pharm. Sci. 67, 358-359.
9. Thimasetty J., Pandey, G.S., Babu, P.R.S., 2008. Design and
in vivo evaluation of Carvedilol buccal mucoadhesive
patches. Pak. J. Pharm. Sci. 21, 241-248.
10. Ubaidulla U., Reddy M.V.S., Ruckmani, K., Ahmad, F.J.,
Khar, R.K., 2007. Transdermal therapeutic system of
carvedilol: effect of hydrophilic and hydrophobic matrix on in
vitro and in vivo characteristics. AAPS Pharm. Sci. Tech. 8, 1-
8.
11. Tanwar Y. S., Chauhan, C.S., Sharma, A. Development and
evaluation of carvedilol transdermal patches. Acta Pharm.
57,151–159.
12. Arora P., Mukharjee, B., 2002. Design, development
physicochemical, and in vitro and in vivo evaluation of
transdermal patches containing diclofenac diethylammonium
salt. J. Pharm. Sci. 91, 2076-2089.
13. Mundargi R.C. and Patil, S.A., 2007. Evaluation and
controlled release characteristics of modified Xanthan films
for transdermal delivery of Atenolol. Drug Dev. Ind. Pharm.
33, 79-90.
14. Kanikkannan N., Andega, S., Burton, S., Babu, J., Singh, M.,
2004. Formulation and in vitro evaluation of transdermal
patches of melatonin. Drug Dev. Ind. Pharm. 30, 205-212.
15. Moffat A.C., 1986. “Clarke’s Isolation and Identification of
Drugs in Phamaceuticals, Body Fluids and Post- Portem
Material”. Pharmaceutical Press, London,
16. Vickers C.H.F., 1963. Existence of reservoir in the stratum
corneum. Arch. Deramatol. 88, 20-23.
17. Mutalik S., Udupa, N., 2004. Glibenclamide transdermal
patches: physicochemical, pharmacodynamic, and
pharmacokinetic evaluation. J. Pharm. Sci. 93, 1577-1592.
18. Devi V. K., Saisivam, S., Maria, G. R., Deepti, P. U., 2003.
Design and Evaluation of Matrix Diffusion Controlled
Transdermal Patches of Verapamil Hydrochloride. Drug Dev.
Ind. Pharm. 29, 495–503.
19. Murthy S.N., Rani, S., Hiremath, R., 2001. Formulation and
evaluation of controlled-release transdermal patches of
theophylline-salbutamol sulfate. Drug Dev. Ind. Pharm. 27,
1057-1062.

Chourasiya et al Journal of Drug Delivery & Therapeutics; 2014, 4(2), 173-181 182
© 2011, JDDT. All Rights Reserved ISSN: 2250-1177 CODEN (USA): JDDTA
This page is intentionally left blanked
Copyright © 2022 FDOKUMEN